Article

A Comparative Study of Hardfacing Deposits Using a Modified Tribological Testing Strategy

1
Institute of Technology and Material Engineering, Faculty of Mechanical Engineering, Technical University of Košice, Mäsiarska 74, 040 01 Košice, Slovakia
2
Department of Manufacturing and Production Engineering, Rzeszow University of Technology, al. Powst. Warszawy 8, 35-959 Rzeszów, Poland
*
Author to whom correspondence should be addressed.
Lubricants 2022, 10(8), 187; https://doi.org/10.3390/lubricants10080187
Submission received: 19 July 2022 / Revised: 12 August 2022 / Accepted: 16 August 2022 / Published: 18 August 2022
(This article belongs to the Special Issue Assessment of Abrasive Wear)

Abstract

:
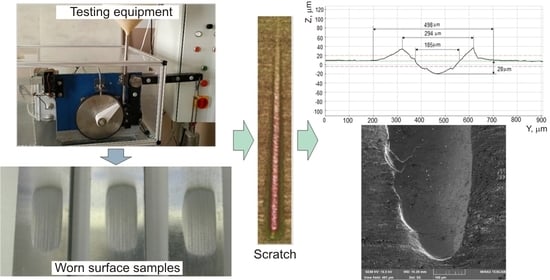
In this study, hardfacing deposits using materials of different surface hardness are investigated using an innovative strategy for tribological testing. The abrasive wear behaviour of AISI 316L stainless steel is compared to the Cr–Ni–Mn alloy (OK Autrod 16.95) and the Cr-Mo alloy (Fluxofil 58), deposited on a substrate of S355JR steel. A modified three-body abrasion test and a modified scratch test were used to evaluate the tribological behaviour and wear mechanisms of these materials. The modified double-pass scratch test on the abraded surfaces is analysed using the geometrical parameters of grooves to aid in predicting the lifetime of machinery parts in abrasive working conditions. This leads to a shortening of the resistance to abrasion wear time of the evaluation of the abrasion wear resistance of materials. The validation of the results obtained in the double-pass scratch tests was carried out using three-body abrasion tests, according to the ASTM G65 standard. Wear mechanism investigations were carried out by scanning electron microscopy and three-dimensional surface topography and was analysed using an optical microscope. The results obtained from experimental research show that double-pass scratch tests demonstrated that it is possible to shorten the time needed to predict the abrasive behaviour of materials using this method.

Graphical Abstract

1. Introduction

Wear is responsible for the degradation of machinery and its components, limiting their lifetime while their repair entails service and maintenance costs. Wear is influenced by a series of internal and external factors. The five main types of wear are adhesive, abrasive, fatigue wear, fretting, and erosion, which are commonly observed in practical situations. Hardfacing is a form of resistance to wear; it is an application of the build-up of deposits of special alloys on surfaces. Therefore, it is helpful in experimentally estimating wear resistance, as well as the factors that guide the selection of materials for abrasion conditions, experimentally.
Abrasive wear is the most important of all wear mechanisms and contributes up to 63% of the total wear cost. This wear mechanism is caused by hard abrasives or rough and hard protuberances that are forced against and move between the various contact surfaces of the materials and lead to degradation of the materials [1,2,3]. Abrasive wear mechanisms are complex surface processes in the context of factors whose intensity of the reaction depends on the interaction between the abrasive and contact surfaces. These processes can lead to a different degradation of surfaces that are touched, and will induce material deformation, crack initiation, and propagation [4].
The abrasive wear process is commonly classified into two groups: two-body and three-body abrasive wear. In a two-body abrasion test, a hard surface rubs against a softer one, while three-body abrasive wear is caused by hard particles trapped between two sliding surfaces. A variety of test methods can simulate two-body abrasive wear. Usually, standardised procedures are used. Two-body abrasion methods are the most frequently used because they are simple and reliable. Laboratory tests for two-body abrasive wear commonly use some form of a pin or prismatic specimen sliding against an array of abrasive particles or asperities. Conventional experimental arrangements commonly employed for two-body abrasive wear are the pin-on-disc, pin-on-cylinder, and abrasive belt. In the pin-on-disc test, the disc (wearing specimen) rotates about a vertical axis, and the pin is given a specific load force. The pin is stationary on the disc about the vertical axis, and the specimen repeatedly passes over the same track on an abrasive counterface [5,6,7,8].
In real conditions, abrasive wear mainly occurs when hard particles continuously move on abraded materials. This process can be modelled by a three-body abrasion test. Three-body abrasive wear tests are usually conducted in an arrangement in which the specimen under load has the form of a plate or block pressed under constant load against the rim of a rotating wheel with abrasive particles entrained into the contact zone [9,10,11].
Another situation occurs when one analyses abrasion-resistant and corrosion-resistant materials, such as austenitic steels. Stainless steels are not generally regarded as abrasion-resistant materials, although many such alloys can be heat treated to hardness levels comparable with those of commercial abrasion-resistant materials. Therefore, many studies were carried out that examine austenitic stainless steel. The utilisation of austenitic stainless steels is connected with their high corrosion resistance, but they have a relatively low resistance to surface damage [12,13]. Furthermore, the corrosion resistance of such alloys would appear to make them potential candidates for many situations involving mixed corrosive–abrasive wear.
The high potential for hard deposits to be applied to the surfaces of austenitic stainless steel is one of the alternatives that allow us to solve the problems of the abrasive wear resistance of these steels [14,15,16]. Studies on the abrasive wear issues show that the use of a wide variety of hardfacing techniques can improve the performance of machinery and machinery components in an industry in an economical manner. Hardfacing is emerging as the most versatile method for depositing wear-resistant layers on a wide variety of materials [17,18]. Hardfacing is becoming increasingly important in improving the wear properties of carbon and low-alloy steels with carbon contents of less than 1%.
The scratch test can be used as a tribological method to determine abrasion resistance and can be used in a variety of ways. This specific abrasive wear test is usually used with various tips of the indenter, change of materials and geometries of tips, sliding speeds, and multi-pass dual-indenter scratch tests. Furthermore, three-dimensional finite element modelling was employed to improve the understanding of wear phenomena in the scratch test [7,19,20,21,22]. Numerous tested methods of abrasive wear were used to imitate real abrasive working conditions [7,10,19,20]. Franek et al. [10] presented an overview of a selection of relevant test equipment and procedures for advanced studies of wear behaviour under severe conditions. Annappa and Basavarajappa [19] investigated the three-body abrasive wear of normal plough tools and hardfaced plough tool materials using the Taguchi design of experiments. It was found that applied load is the wear factor that has the highest physical and statistical influence on the wear of hardfacing tools. Venkatesh et al. [23] presented state-of-the-art wear characteristics of hardfacing alloys. An analysis of the literature shows that wear resistance depends on factors such as hardfacing alloys, erodent and abrasion particles, matrix hardening agents, temperature and matrix materials. Venkatesh et al. [24] studied the wear characteristics of multi-layer Fe-C-Cr hardfacing alloys on a pin-on-disc tribometer. It was revealed that an increase in carbon content increases the hardness, but also increases the brittleness of the hardfacing alloys. Dziedzic et al. [25] tested regenerative hardfacing coatings applied with the tungsten inert gas. The multi-criteria analysis of the results of a ball-on-disk tribometer showed that the wear rate was the smallest for the samples with the highest hardness. Paz-Triviño et al. [26] evaluated the wear resistance of a single-layer nanostructured hardfacing coating manually deposited by shielded metal-arc welding. Compared to the base metal (ASTM A36), the wear resistance of the alloy was improved 14 times when tested in the dry-wheel rubber sand. Vargova et al. [27] stated that the hardness of the material strongly correlates to the resistance to abrasive wear. They tested the newly designed UTP 690 and OK 84.58 hardfacing materials usingthe abrasion resistance test. It was concluded that the UTP 690 hardfacing material achieved more than four and a half times better results than the 37MnSi5 material of the raking blade. Prysyazhnyuk et al. [28] investigated the wear resistance of mining machines’ equipment tools by flux-cored wires (FCW) with Fe-Mo-Mn-B-C hardfacing alloys. They concluded that FCW process allows to obtain coatings with high microhardness due to the formation of (Fe,Mn)(Mo,B)2 borides acting as reinforcements in hypereutectic austenite–boride alloys. Ferdinandov and Gospodinov [29] studied the hardfacing of metal-cutting tools made of HS6-5-2 steel by arc welding in vacuum. The proposed technological method of triple tempering after hardfacing allows to increase wear resistance and, as a consequence, the tools durability. Winczek et al. [30] investigated the wear mechanism of high-carbon hardfacing layers. It was found that the wear resistance of hardfacing depends on the microstructure obtained after hardfacing and the parameters of the depositing process. Öztürk [31] studied the wear behaviour and microstructure of Fe-C-Si-Cr-B-Ni hardfacing alloys, with the addition of ferronickel (FeNi) and ferroboron (FeB). It was found that, at room temperature, wear occurs through a combination of local delamination of surface layer and abrasive grooving. Nagentrau et al. [32] analysed the microstructure of tungsten carbide hardfacing deposited on the carbon steel blade. Energy-dispersive X-ray spectroscopy analysis confirmed a high percentage of tungsten in the carbide region, meanwhile non-carbide region contains both iron and tungsten, indicative of carbide and binder in close proximity.
Abrasive wear testing is a time-consuming process, as the tests have to be repeated with different sliding distances until steady-state wear conditions are achieved. Moreover, the correct judging of a steady-state wear behaviour in long-term testing may be difficult. To reduce the testing time of abrasive wear, a new concept is proposed for testing the wear behaviour of hardfacing alloys. To complete the research objectives, a modified scratch test and a modified double-pass scratch test applied on worn surfaces were proposed to investigate the abrasive wear behaviour of the Cr–Ni–Mn alloy (OK Autrod 16.95) and the Cr–Mo alloy (Fluxofil 58) deposited corrosion-resistant stainless steel AISI 316L. The morphology of abraded surfaces was studied by optical surface profilometry and scanning electron microscopy (SEM). The results obtained by the two testing methods, and analyses of wear mechanisms, confirm the high wear resistance and choice of the weld deposit Fluxofil 58. The double-pass scratch test is a relatively simple, inexpensive testing method for preliminary estimations of abrasion wear resistance of materials, compared to the standard abrasion test according to the ASTM G65 standard. The novelty of this paper is a new concept for testing the wear behaviour of hardfacing alloys using the double-pass scratch test, which can provide an alternative to the ASTM G65 standard test.

2. Materials and Methods

2.1. Material

In our experiments, a low carbon AISI 316L/EN 1.4404 steel type was used. We aimed to compare the abrasive wear resistance of AISI 316L steel with hardfacing deposits. The weld deposit was that of an OK Autrod 16.95.: Cr–Ni–Mn wire (diameter d = 1.6 mm). This weld deposit was used to replace corrosion and abrasion-resistant stainless steel. This type of deposit can be used for abrasion wear conditions, mainly for tribochemical wear (corrosive environments).
The weld deposit was prepared using the gas metal arc welding (GMAW) method. Another used hardfacing material was Fluxofil 58 (cored wire EN 14700 T Fe8 from Oerlikon). This Cr–Mo alloyed wire has high abrasion resistance suitable for the hardfacing of wear parts.
A commercially available S355JR/EN 10025-2 plate with the dimensions of 350 mm × 50 mm × 10 mm was used as the substrate material. The chemical composition of 316L stainless steel, OK Autrod 16.95 wire and Fluxofil 58 is provided in Table 1.
The tested materials will be referred to in the text as follows: AISI 316L “A”, weld deposit OK Autrod 16.95 “B”, and weld deposit Fluxofil 58 “C”. The surfaces of the samples were ground and polished.
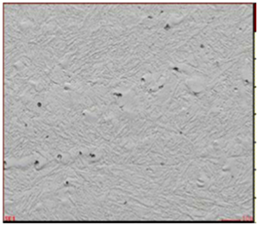
The microstructure of austenitic steel AISI 316L is shown in Figure 1.
Automatic welding was used, which means that the OK Autrod 16.95 wire (B) was continuously fed into the weld deposit plate plane. The welding parameters were as follows: the mean current = 248 A, voltage = 28.2 V, and wire feed speed = 16.8 m/min. For the hardfacing deposit Fluxofil 58 (C), the welding parameters were chosen: mean arc current = 282 A, circuit voltage = 28 V, and wire feed speed = 18 m/min. For the MIG welding process, argon was used. Metallographic analyses were performed to characterise the microstructure of the samples using SEM. In order to check the composition, the microanalyses were conducted using an energy dispersive spectrometer (JEM-2100F with EDS (energy dispersive X-ray spectrometer), JEOL Ltd., Tokyo, Japan).
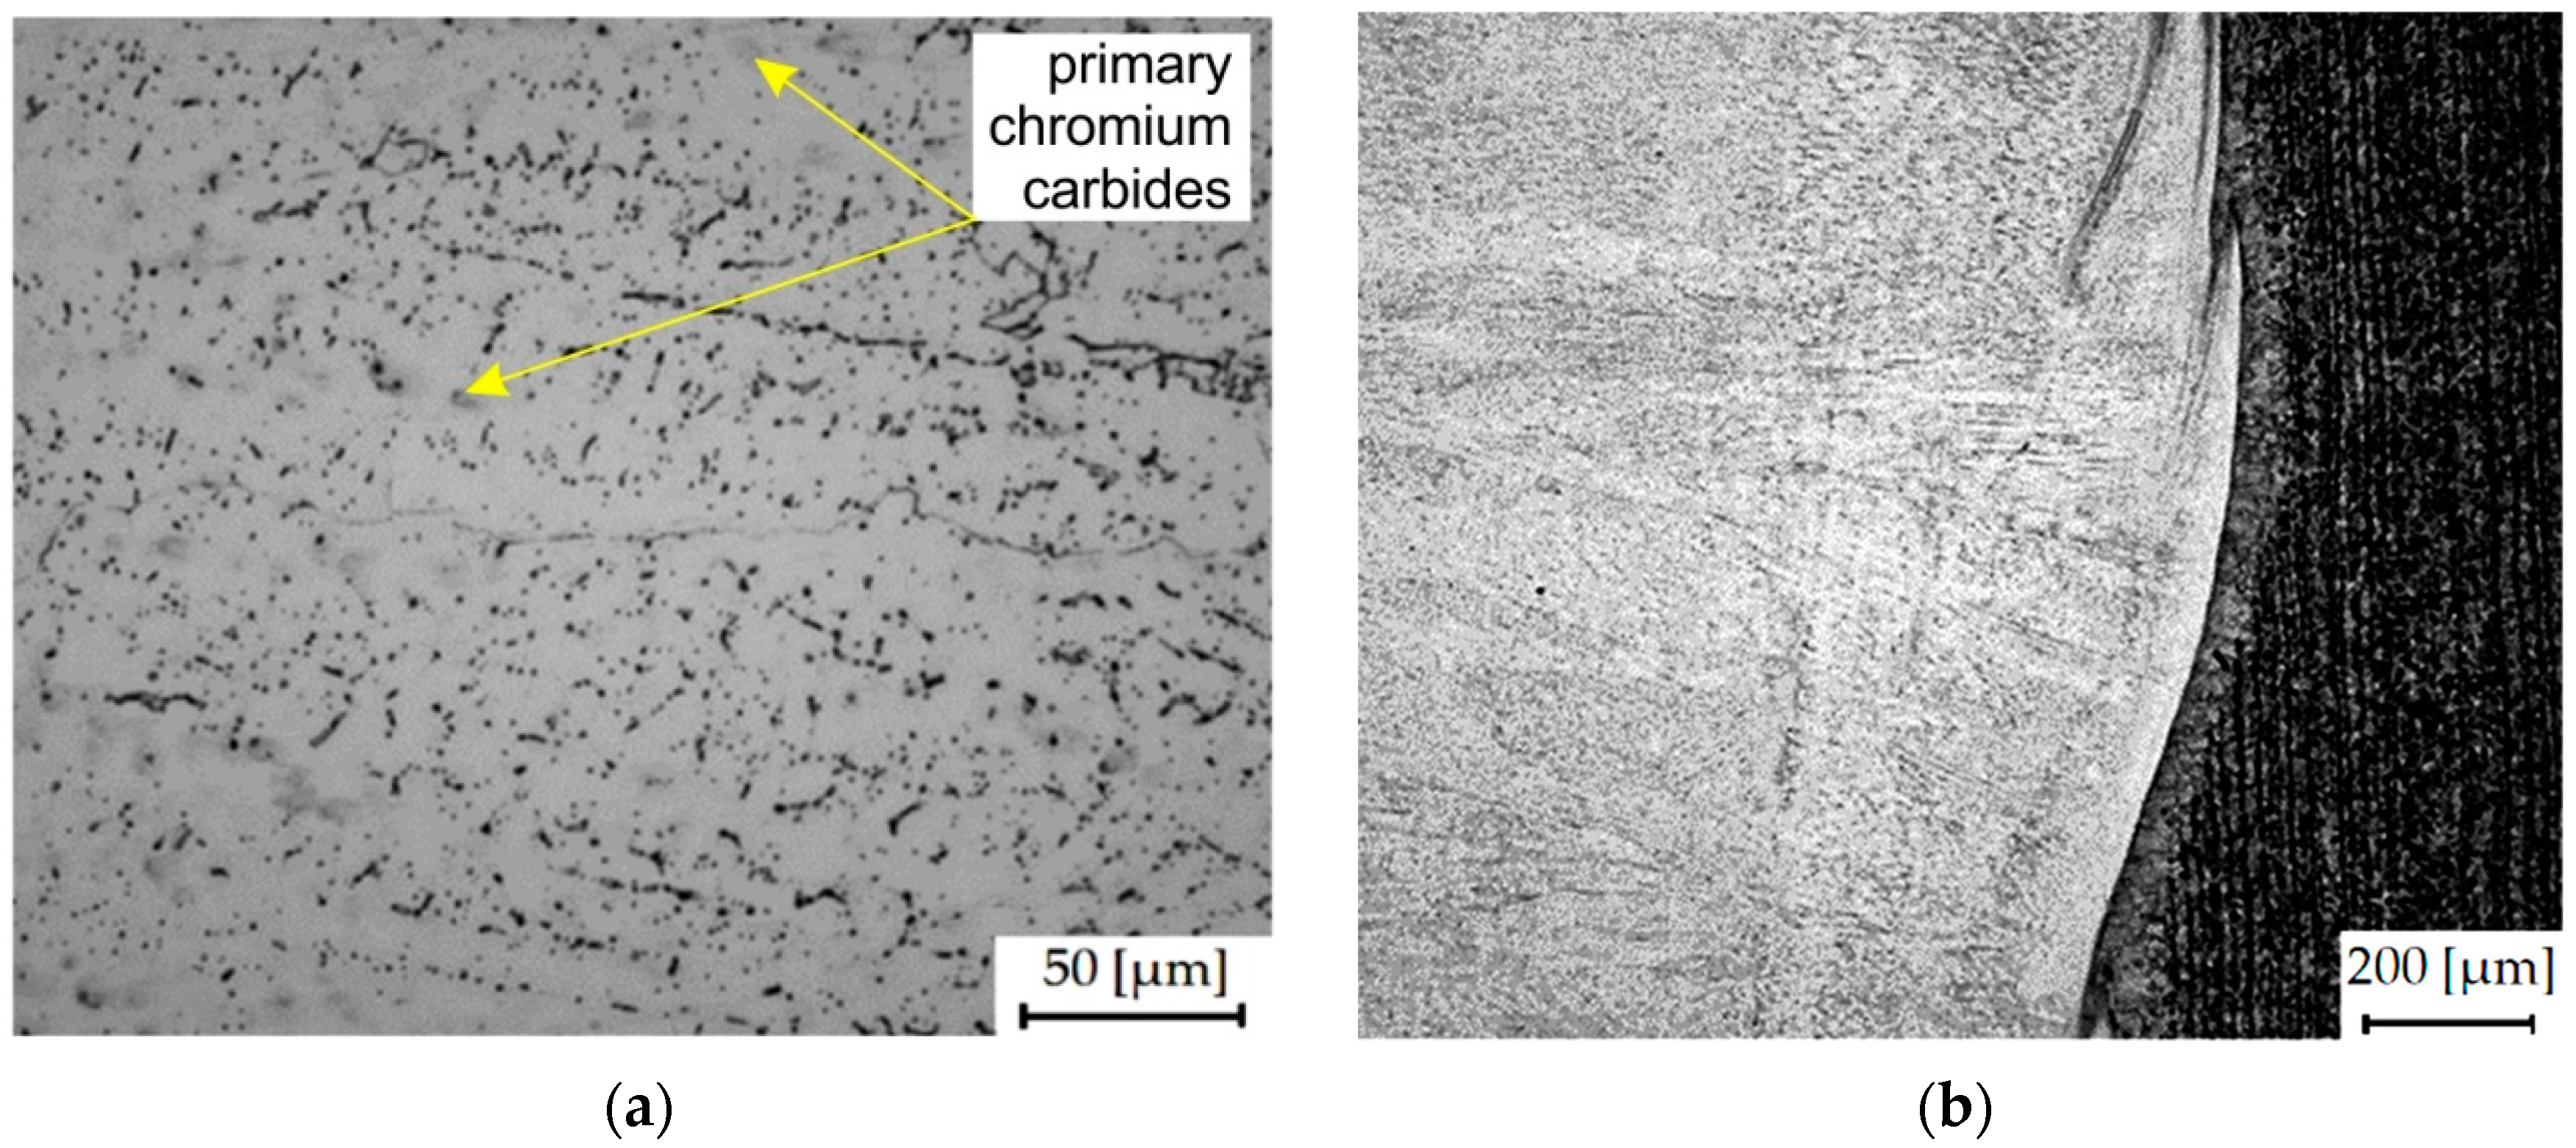
The microstructure of the weld deposit is shown in Figure 2a. The primary carbides are on the boundaries of the dendritic grains of austenite. Figure 2b shows the interface between the substrate material and the weld deposit.
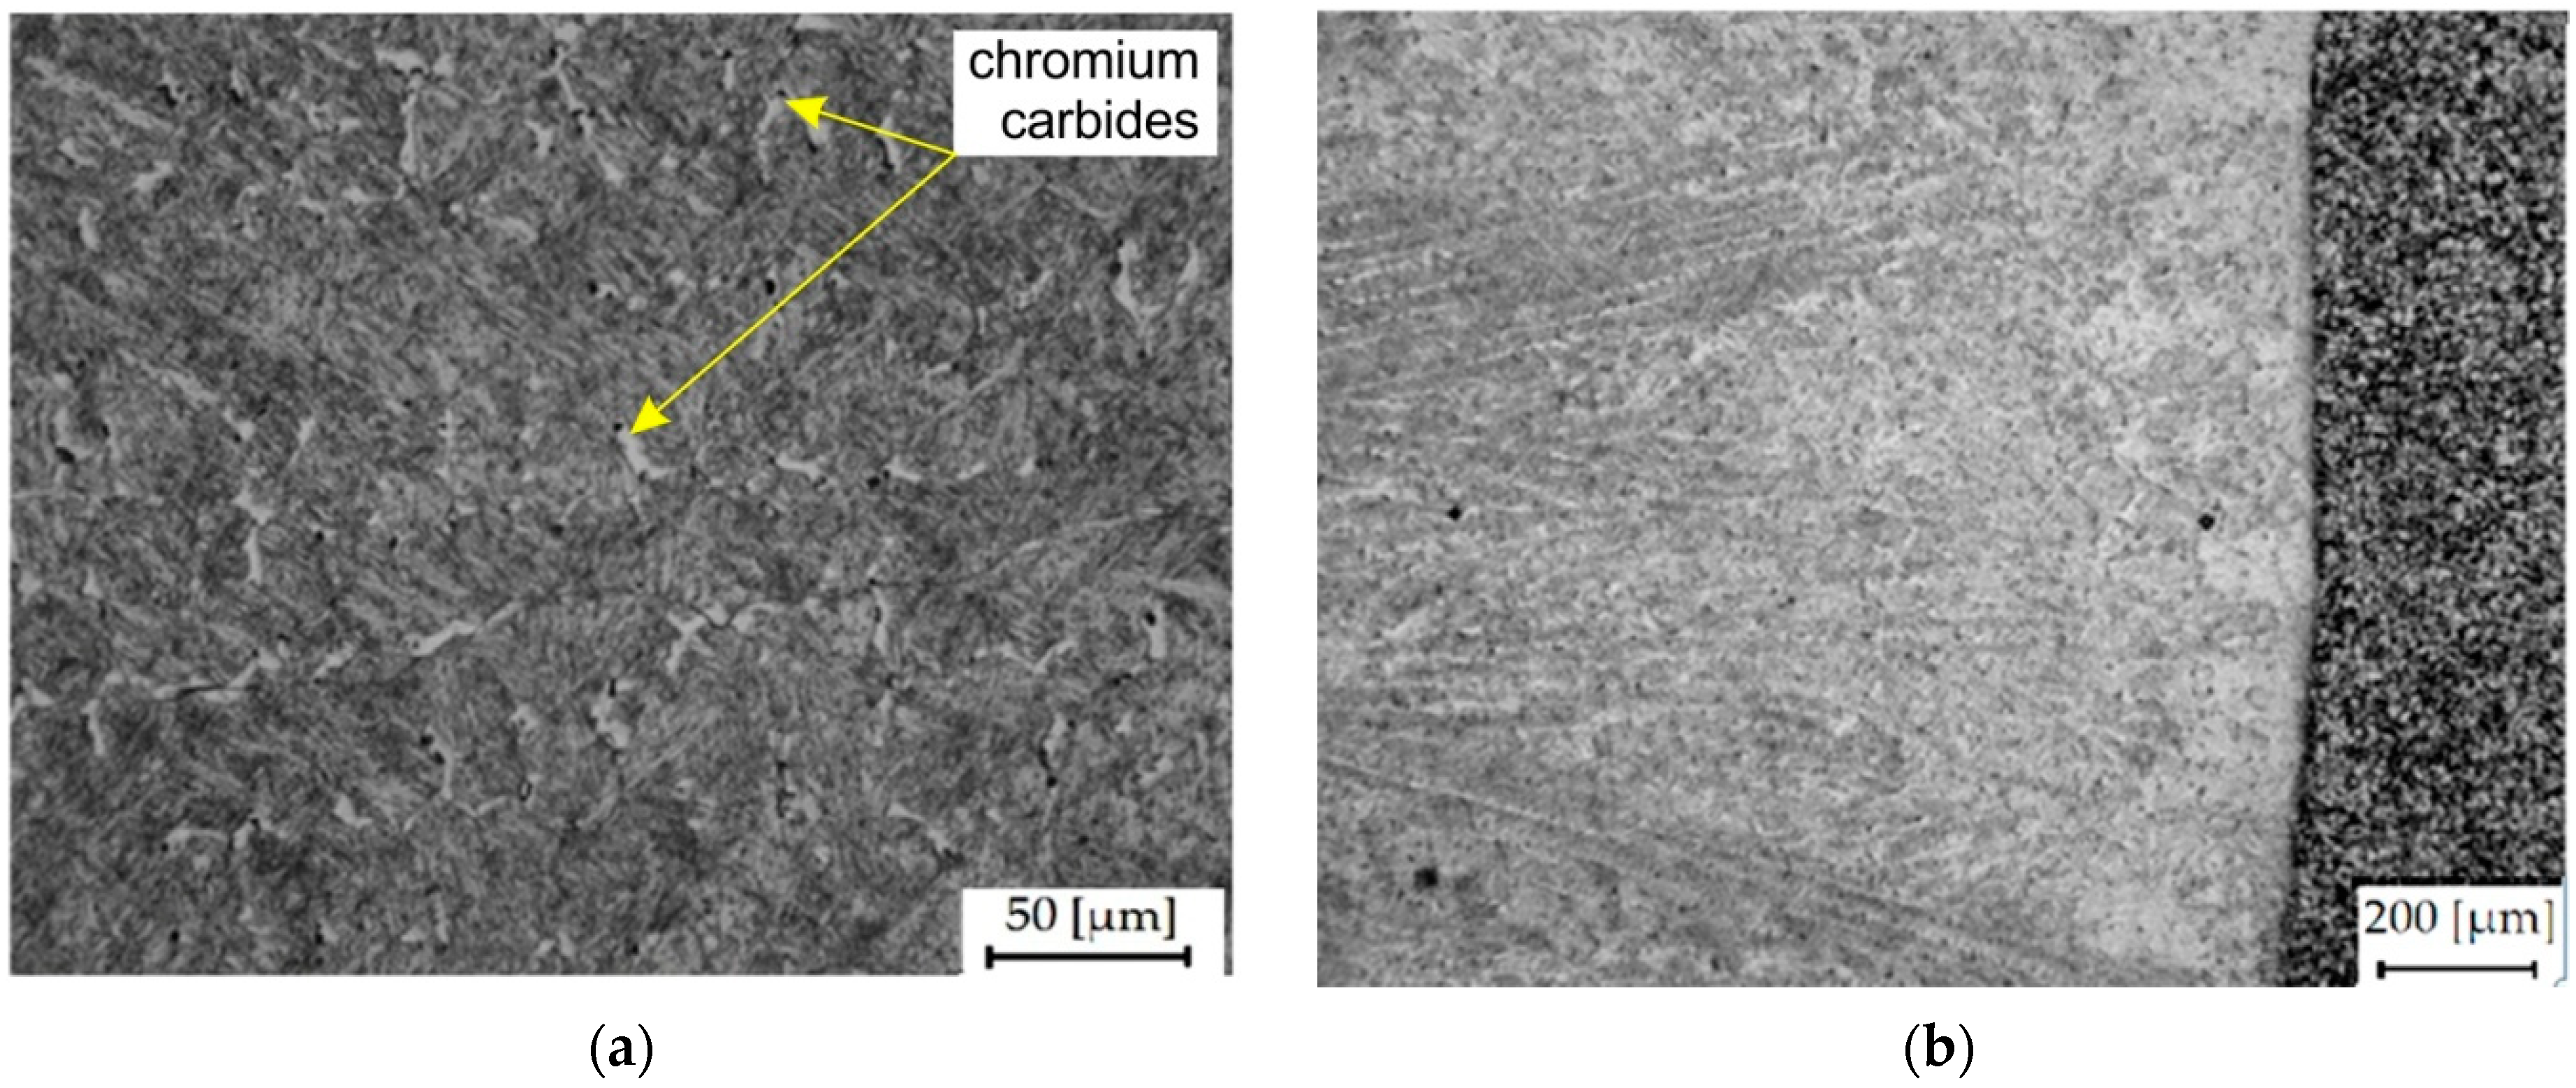
The microstructure of the weld deposit C contained a fine needle-like martensite in combination with the chromium carbides (Figure 3a). Figure 3b shows the interface between the substrate material and the weld deposit.
From the results of the energy-dispersive X-ray spectroscopy (EDX) analysis (Figure 4a,b; Table 2 and Table 3), the weight and atomic concentrations of Cr and Ni of weld deposits B and C are comparable to the chemical composition of the additive material (B) and (C) reported in Table 1.

2.2. Microhardness

The microhardness of the weld deposits was measured on the surface of the samples and in the cross-section with a Vickers diamond indenter (SHIMADZU–DUH 202, Kyoto, Japan), using a load of 100 gf. The average value of 10 measurements was calculated.

2.3. Abrasive Wear Test

The method of testing materials according to the ASTM G65 standard tends to dominate when evaluating the wear resistance of different materials exposed to abrasion [8,10,12].
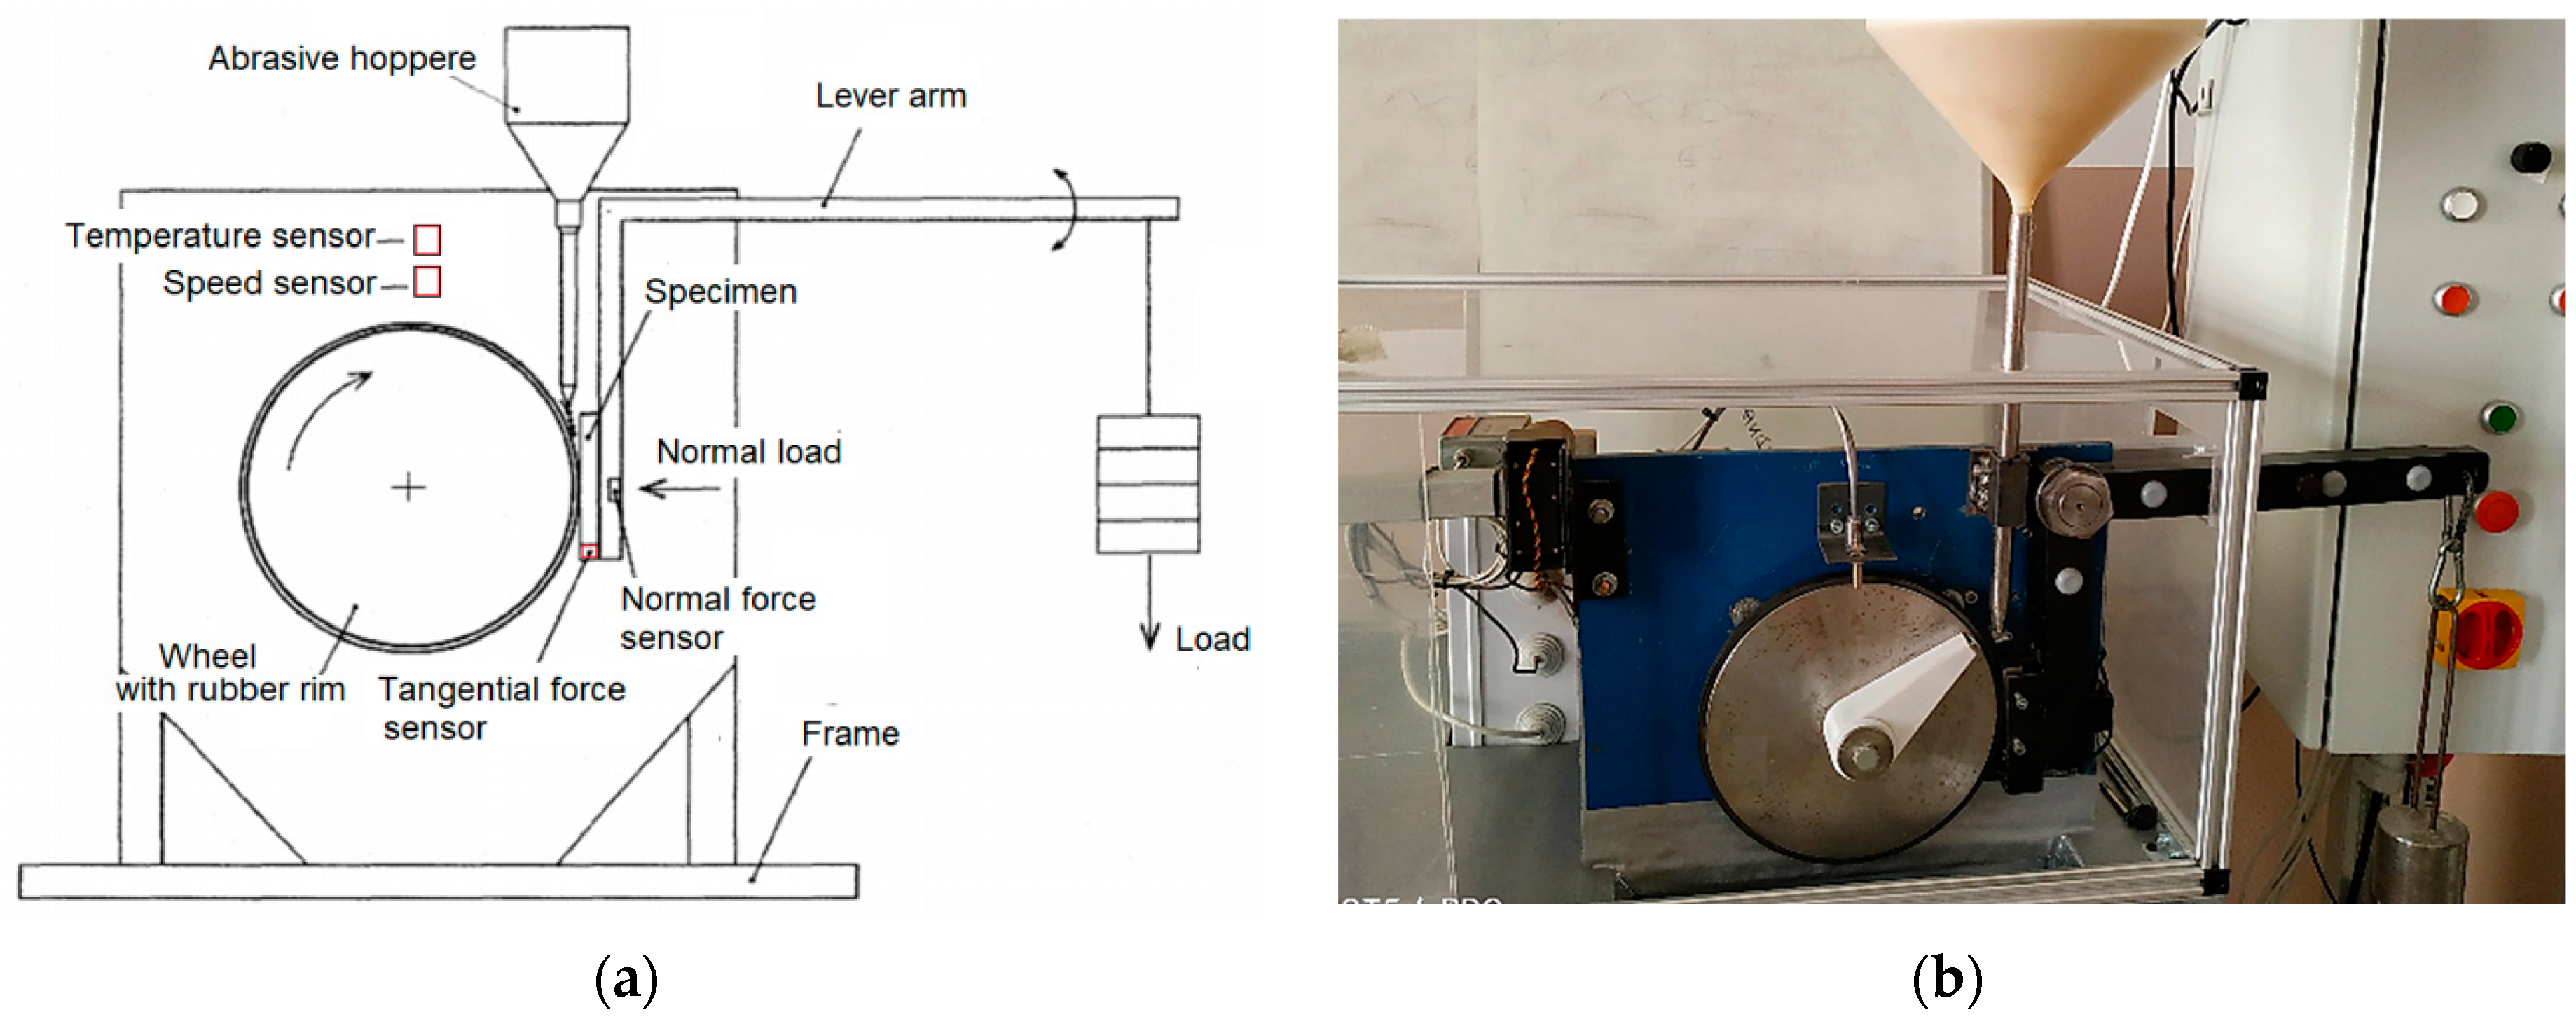
First, the tribological properties and abrasive mechanisms of the tested materials were determined. The designed tribometer was used following the ASTM G65 standard. The scheme of the testing equipment is shown in Figure 5a, and a detailed view of the testing equipment is shown in Figure 5b. The dimensions of the samples were 25 mm × 70 mm × 18 mm. The tests were performed under the conditions shown in Table 4. The weight losses of each testing sample were measured with an accuracy of 1 mg. The test was repeated three times for each material, and the average weight losses were calculated.

2.4. Scratch Test and Mechanism of Wear

Abrasion wear can be simulated using different laboratory tests [4]. In principle, wear testing conditions are similar and comparable to abrasion processes in industrial conditions. The scratch test can be presented as a simplified approach to the abrasive test, where a sliding tip of the indenter represents the isolated abrasive particle tip was sliding over surfaces. [33]. For the prediction of the abrasive wear behaviour of materials for various abrasion conditions in the real work environment, various modified scratch tests were developed. For example, according to [34], the abrasion behaviour of materials can be investigated by multi-pass sliding with the indenter at various loading levels.
It is also important to accept the changing microstructure of the surface. Below the worn surface, there is plastic deformation and local work hardening. To investigate the wear mechanism of the contact between the abrasive particle and the material, the model [34,35] which is defined as “the ratio of the volume removed by micro-cutting to the groove volume of the formed groove in wear”, and is marked as a factor Fab, is used. The values of this factor can range from zero (pure micro-plowing) to 1.0 (pure micro-cutting).
To determine the abrasive resistance and mechanisms of wear, various approaches can be used. The amount of material removed depends on many factors, such as material hardness, Poisson’s ratio, microstructure, as well as the hardness of the abrasive, its microgeometry, and indenter geometry in the case of using scratch test methods [36,37].
In our tests, we used a modified scratch test, i.e., double grooving on the worn surface of the samples. For the evaluation of the scratches, we used selected geometric parameters marked in Figure 6. The chosen geometry parameters of the grooves after scratch tests, such as the width between peaks lp, the width of the groove at the baseline lr, the depth of the groove p, zone interaction ZOI, the edge area A2, and the area of groove A1, were analysed and compared to the results obtained from the three-body abrasion tests.
Scratch tests (model UMT 2, Bruker, Billerica, MA, USA) were performed with a Rockwell C tip with a 200 µm curvature on the worn surface. The first groove (5 mm long) was performed at a gradually increasing load of 100 N. The second groove (4 mm long) at a load of 0.5–10 N was created in the first groove with the Rockwell C indenter, with a diameter of 200μm. The formed double grooves were analysed using confocal microscopy. The deformation mechanisms were studied using SEM (ZEISS Supra 35, Jena, Germany). The three-dimensional (3D) topography of the scratches was evaluated using an optical microscope (SENSOFAN PLu neox 3D, Barcelona, Spain).

3. Results

3.1. Microhardness

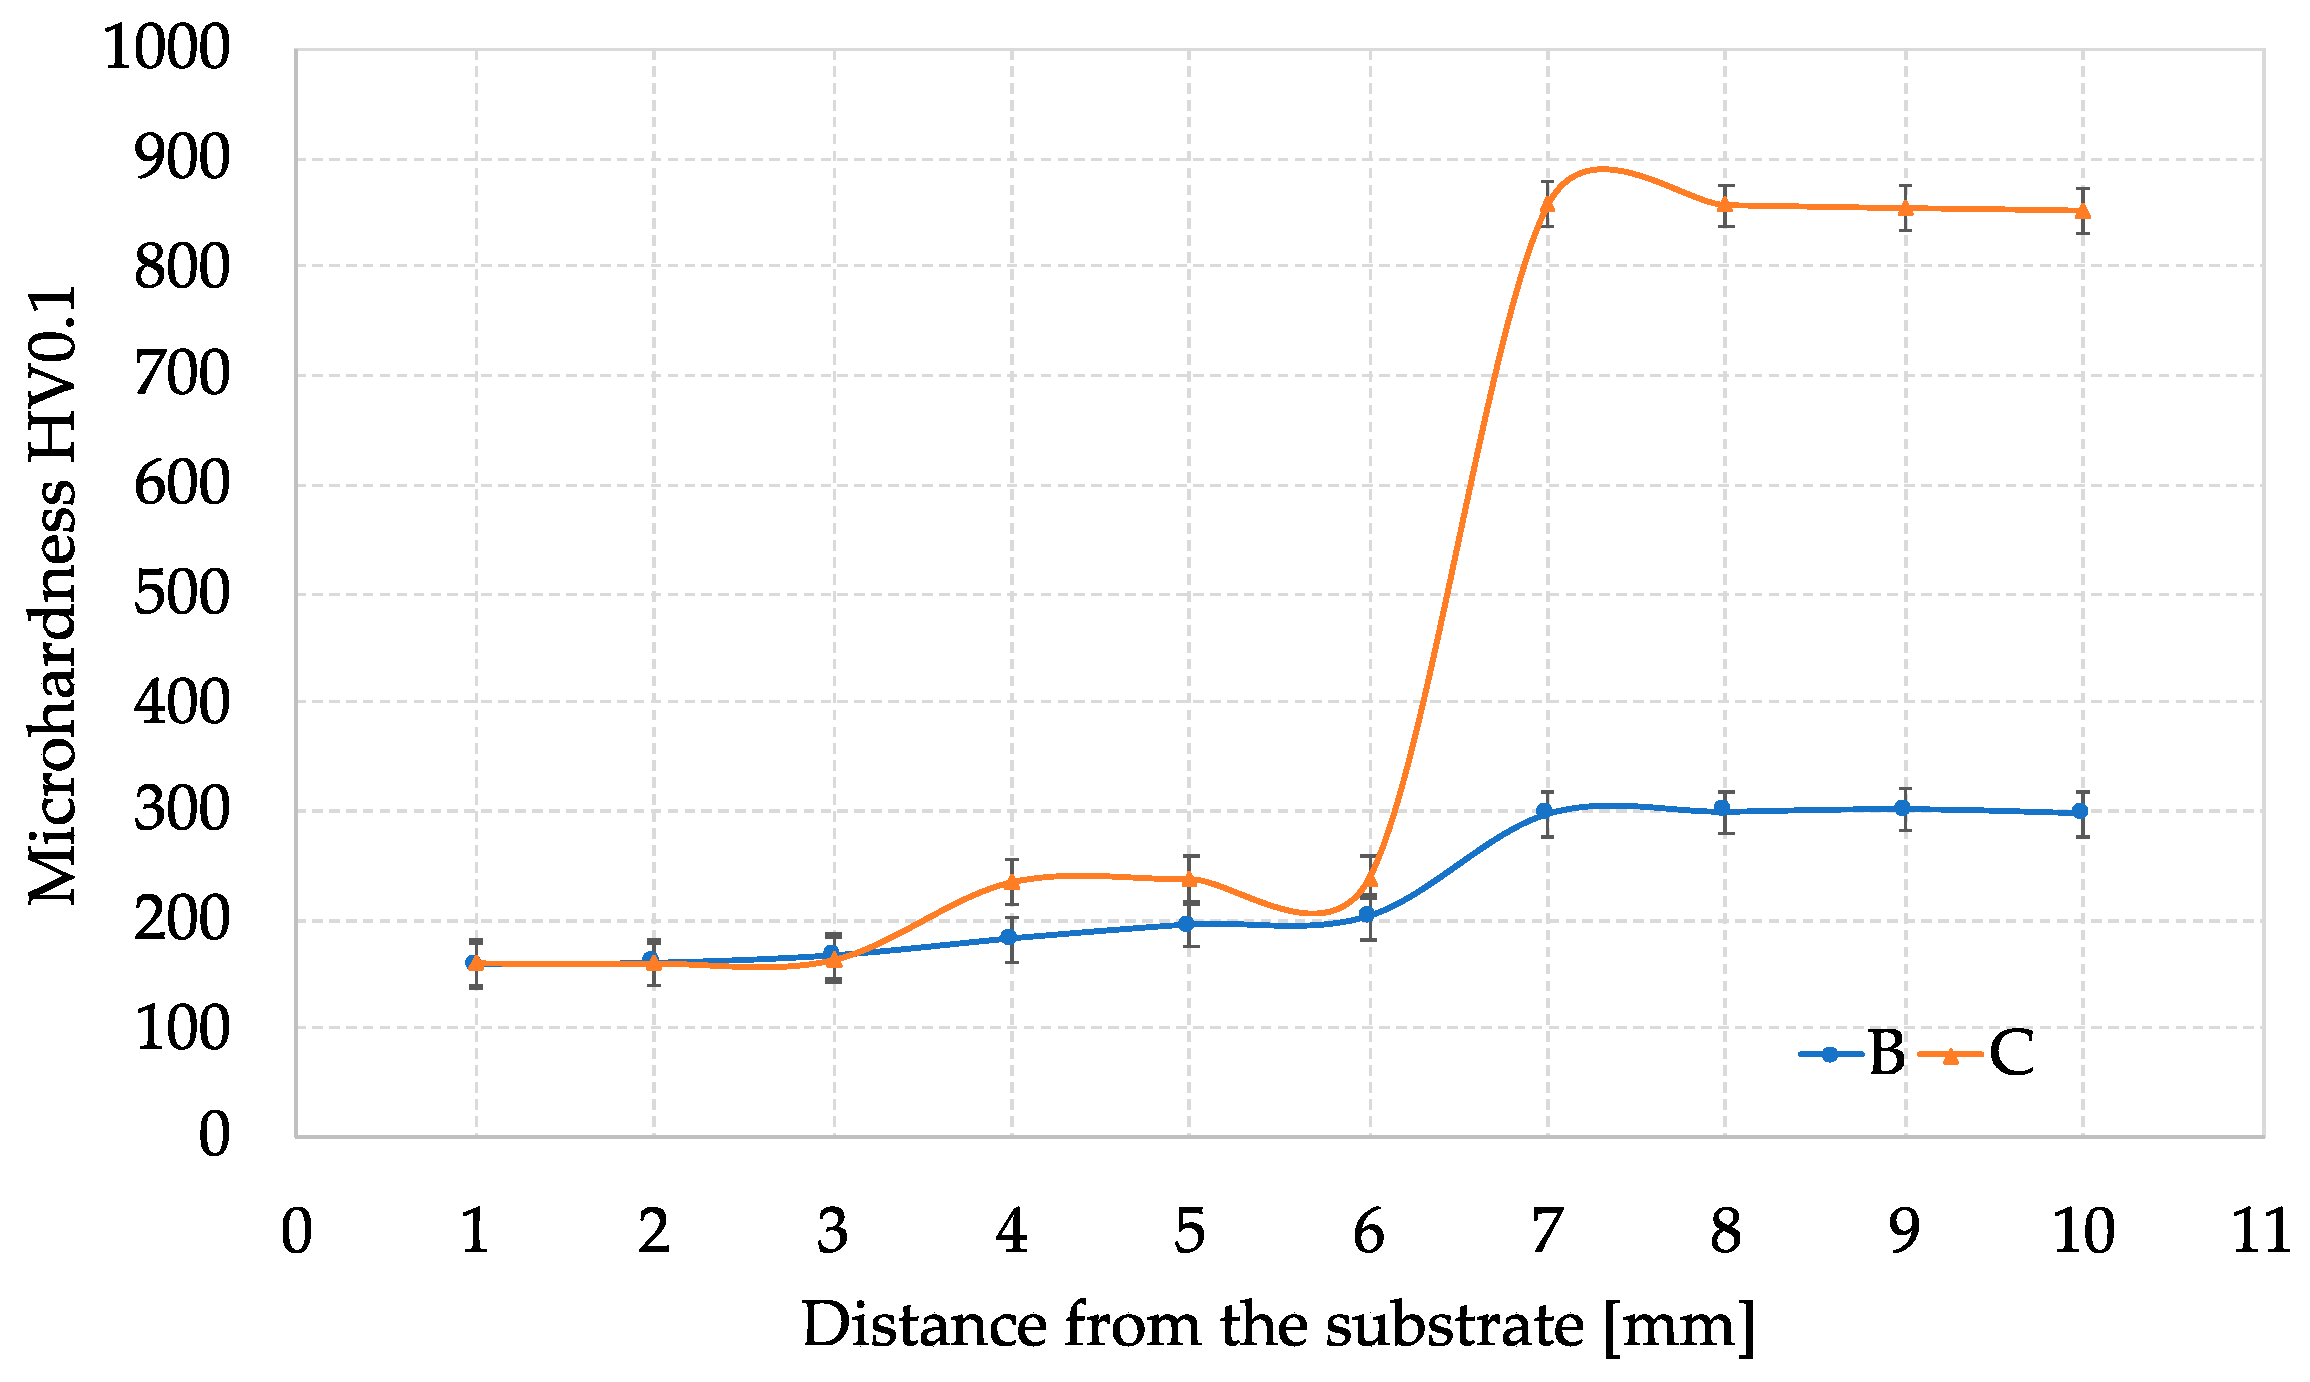
The microhardness was measured ten times, and the arithmetic average was taken as the test result. The average microhardness values of the weld deposits B and C versus the distance from substrates are shown in Figure 7.
The average microhardness value of material A was 168 ± 10 HV0.1. The microstructure of the hardfacing B contents’ austenite structure with secondary chrome carbides obtained a microhardness value of 301 HV0.1. The martensite structure, as well as chromium carbides, cause an increase in values of the microhardness in sample C (Figure 7).

3.2. Results of the Abrasive Wear Test and Mechanism of Wear

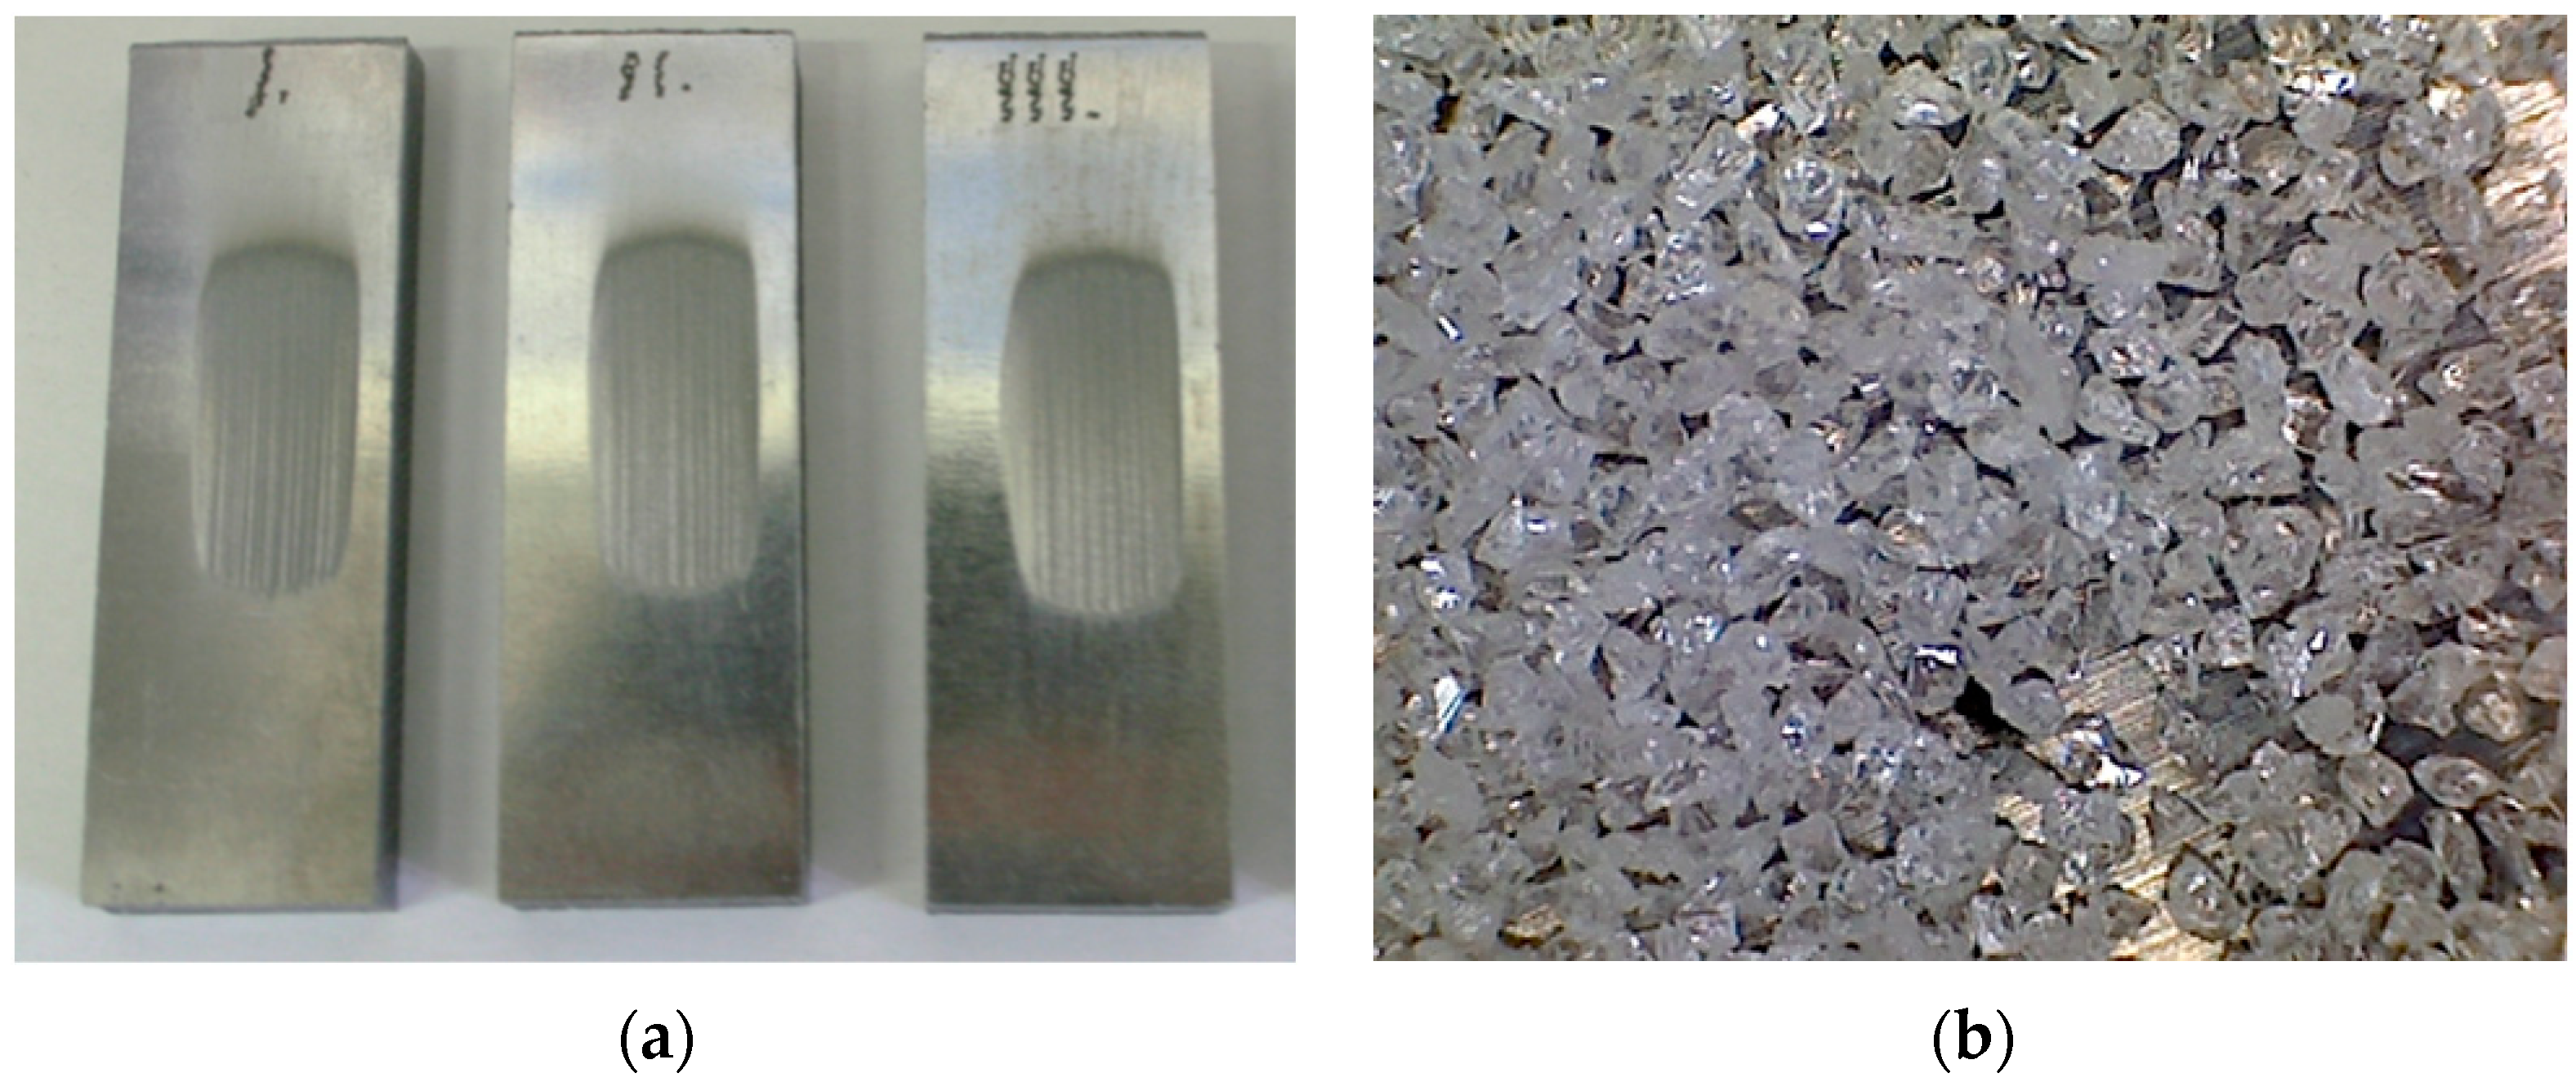
Three tests were performed for each material. Mass losses were determined, and the average values were calculated. In Figure 8a, documented abraded surfaces of samples are documented, and the morphology of abrasives is shown in Figure 8b.
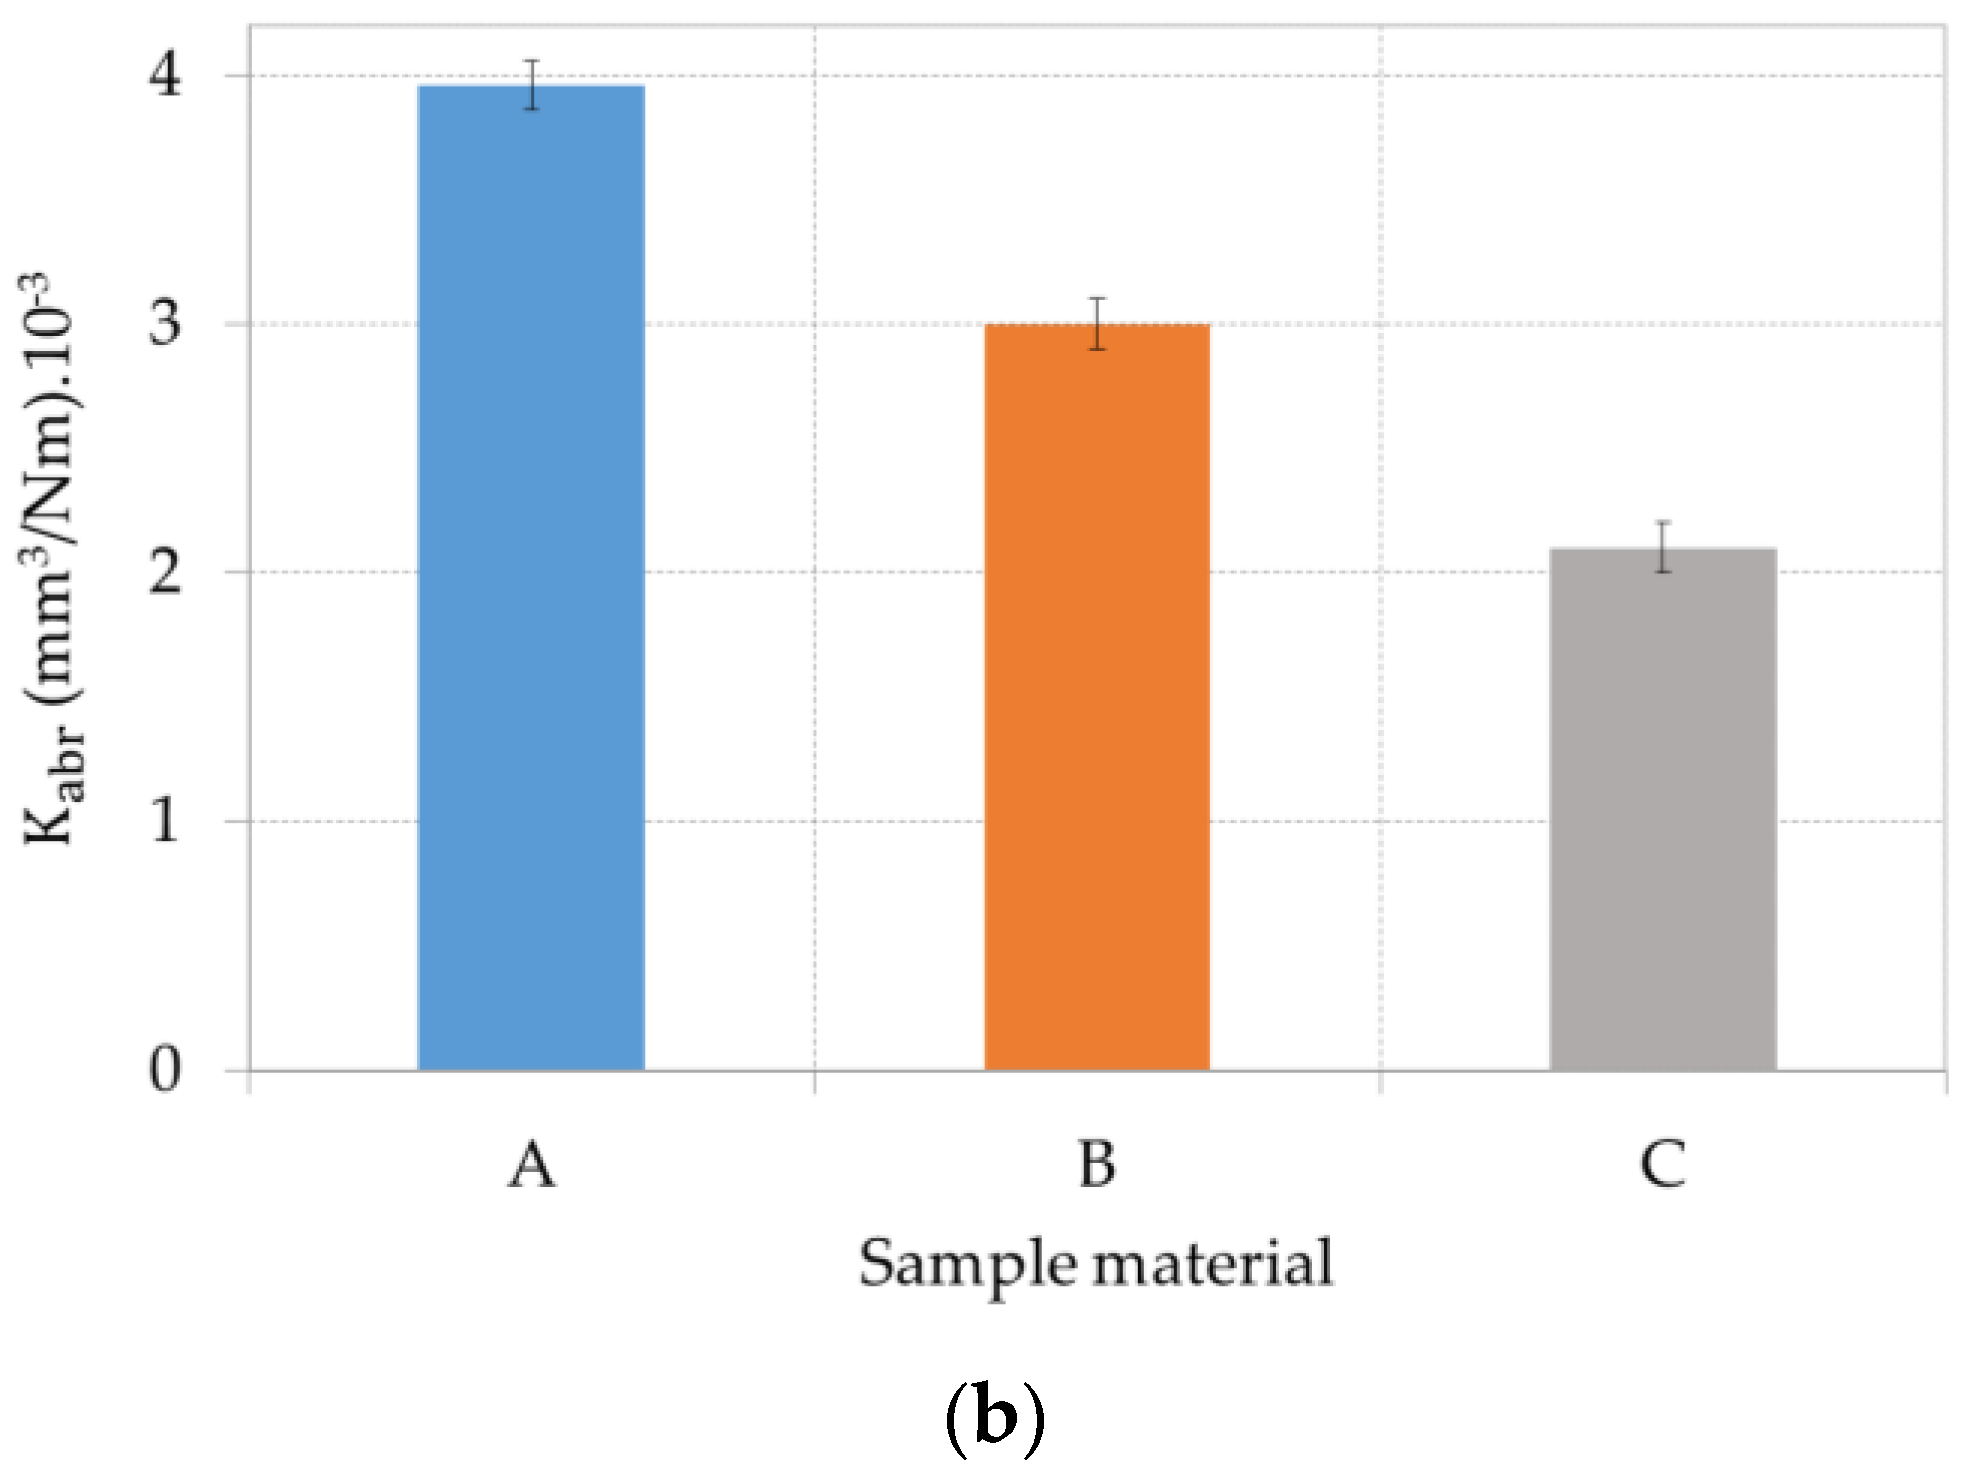
The obtained mass loss in weight was converted into wear volume using the density of the investigated materials. The results in Figure 9a show the linear volume loss as a function of sliding distance using the three-body abrasion wear test. The difference between the soft AISI 316 material and the hardfacing deposits behaviour is evident. The coefficient of abrasive wear resistance Kabr was calculated for each test using a ratio of wear volume loss (m3), load (N), and sliding distance (m) using the following Equation (1):
K abr = V L · l
where V is the wear volume loss (mm3), L is the load (N), and l is the sliding distance (m).
Figure 9b shows the variation of the specific wear rate for the tested materials, which correlates with the hardness of the tested materials.
The weld deposit C recorded the lowest values of mass loss and showed very good abrasive wear resistance, as well as the lowest wear rate. Deposit C had a fine grain martensitic structure with Cr carbides and the hardness was 811 HV0.1, which caused the lowest resistance to volume loss. The microstructure of deposit B with lower hardness and primary chromium carbides in the austenite matrix showed higher wear loss. Consequently, it had the lowest resistance to abrasive wear. Material A (AISI 316L) showed the lowest abrasion resistance.
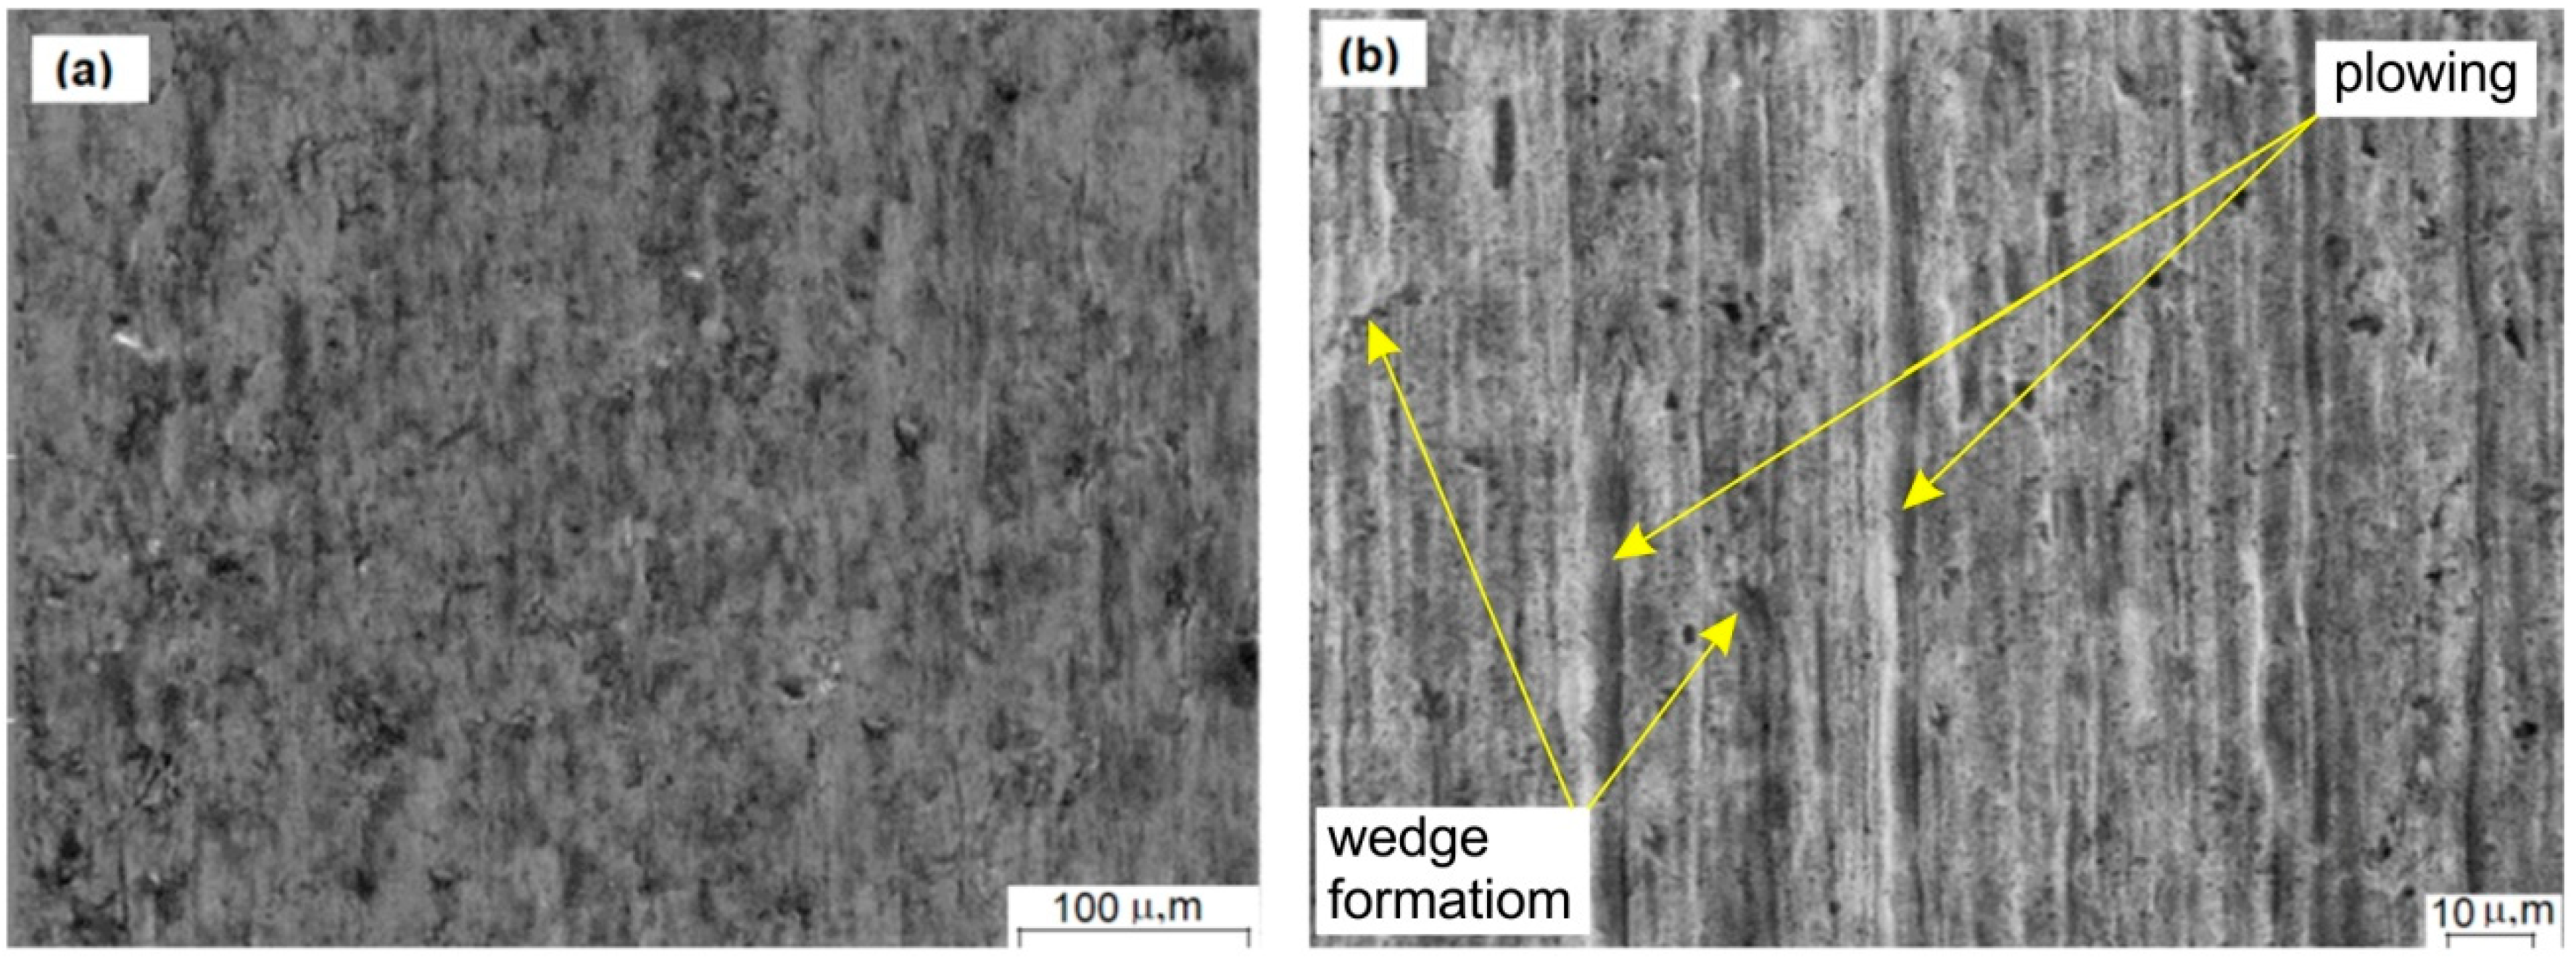
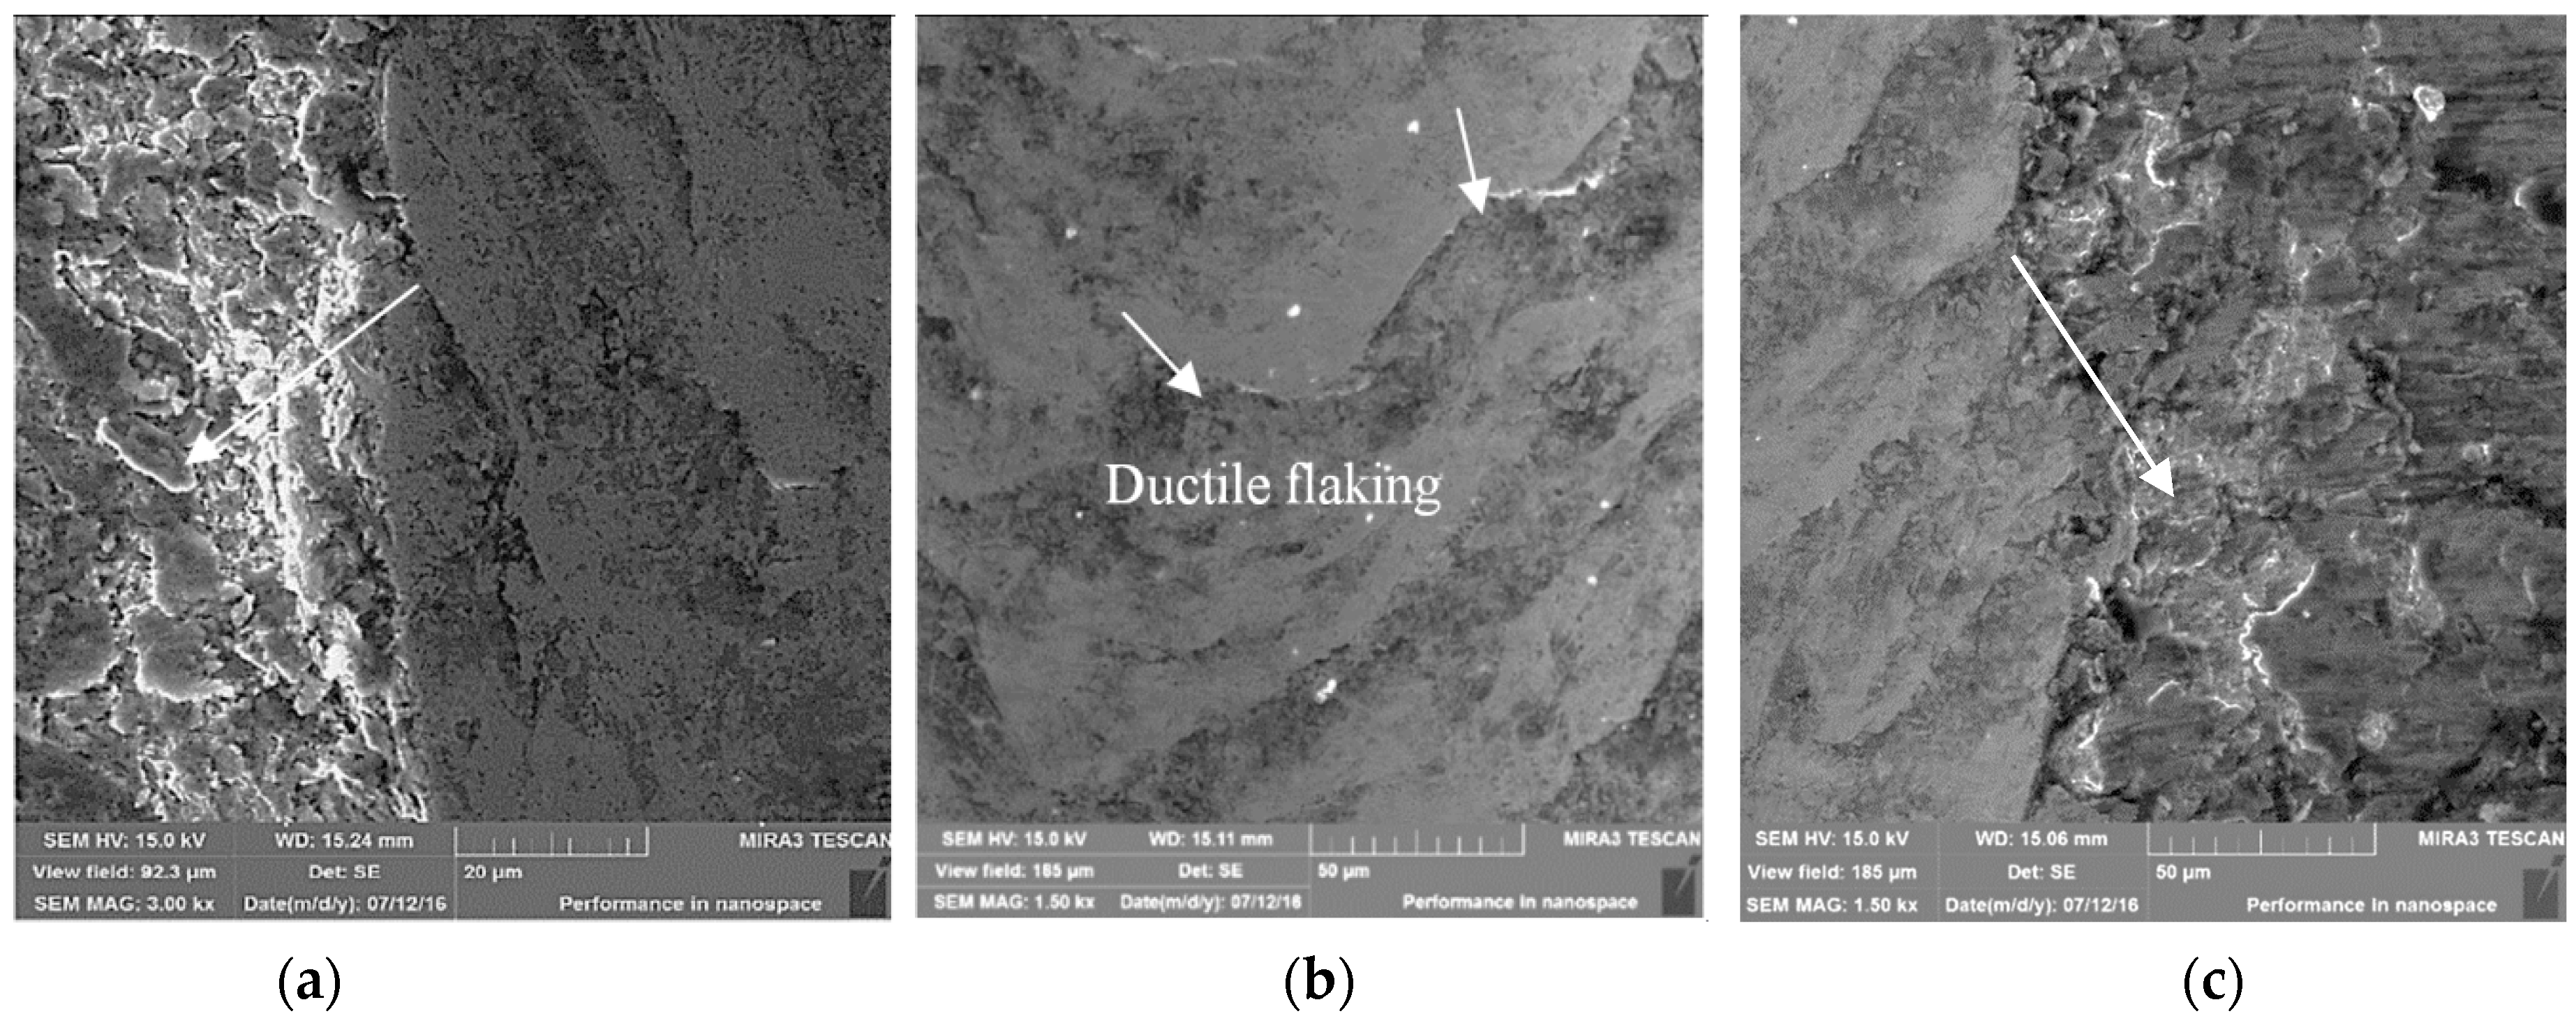
The surface morphology of the materials tested is presented in Figure 10, Figure 11 and Figure 12. SEM figures show the worn surfaces of the samples tested under the three-body abrasion test. The morphology presented in Figure 10a,b shows that the wear surfaces of AISI 316L are greater in the proportion of scratches with plastic deformation (micro-plowing mechanism). The detailed view of the wear surface (Figure 10b) documents the plastic deformation at the edges. The presence of ductile plowing was observed. The material was plastically deformed and folded to the sides of the grooves.
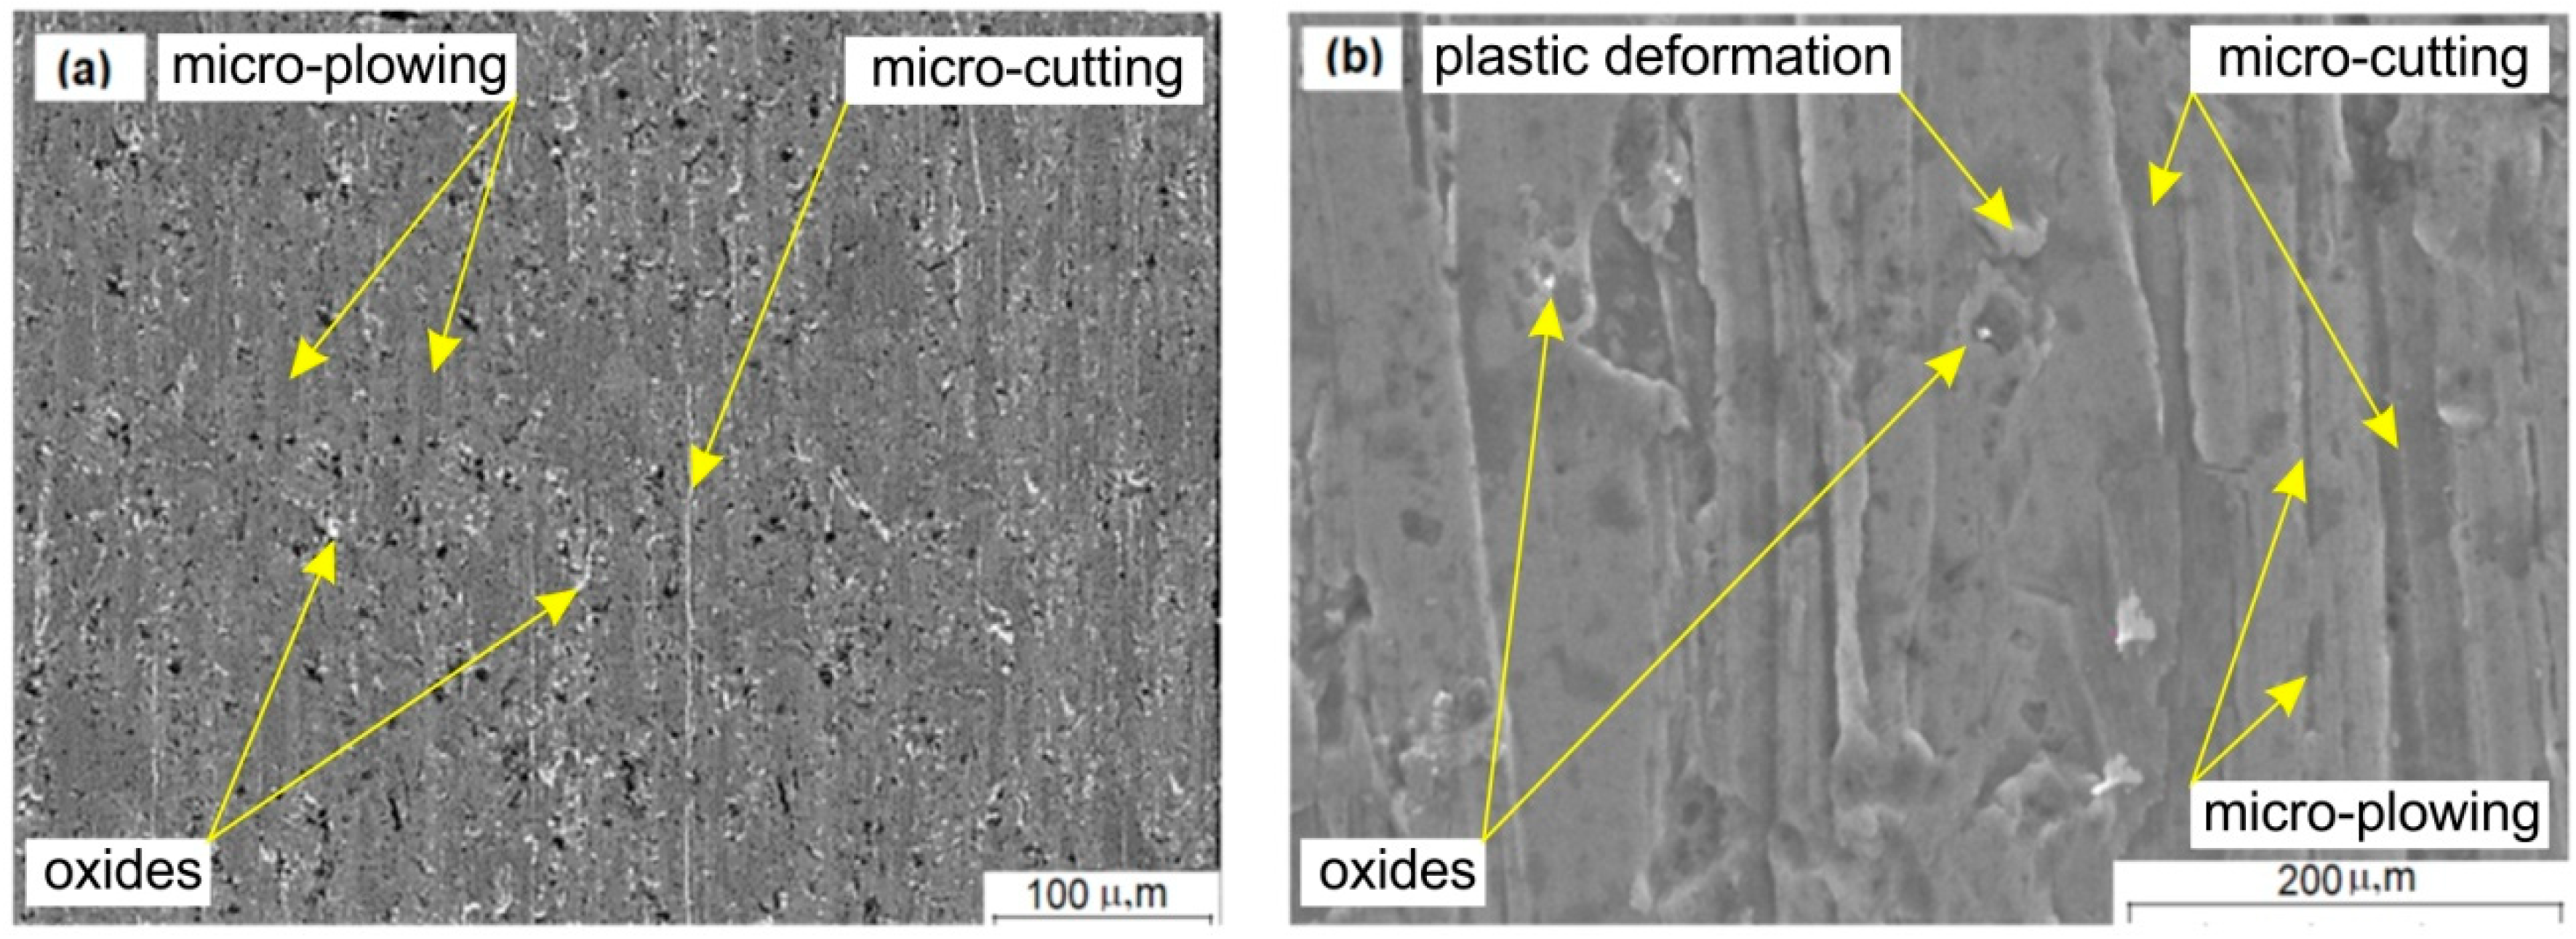
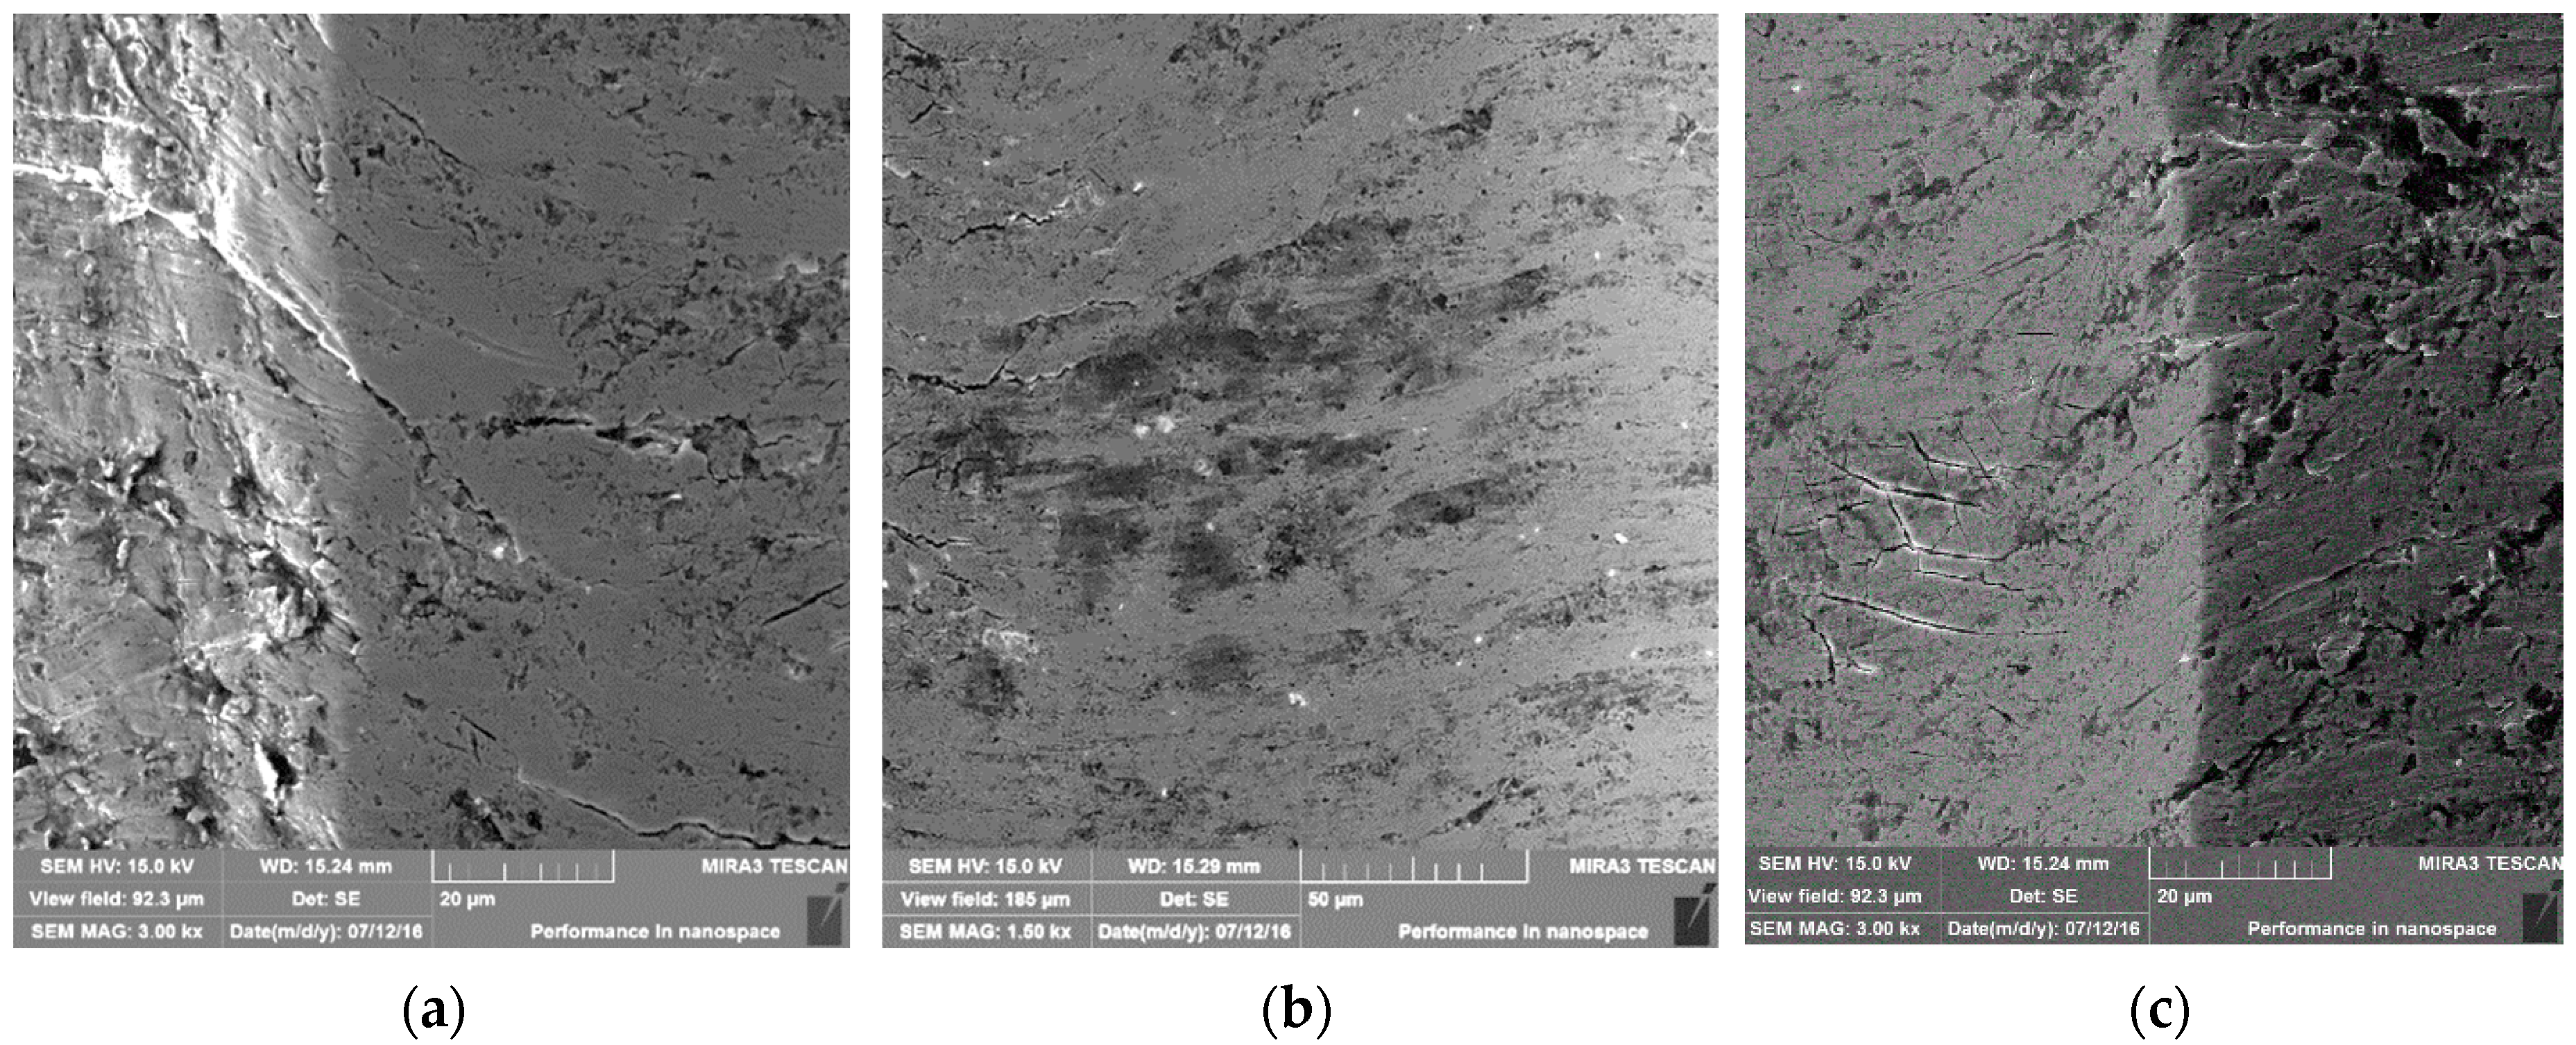
Figure 11a,b show scratch surface morphology with a small plastic deformation (the presence of the hard phase), which reduced the formation of round edge particles. Material removal for the weld deposit occurred via the micro-plowing with a change in the micro-cutting mechanism. The mechanism of wear via micro-cutting that occurs in the presence of oxides in a martensitic structure is shown in Figure 12a. There are many mechanisms through which abrasive wear can occur, such as cutting, wedge formation, and plowing (Figure 12b). Wear does not occur through a single mechanism, and the dominant wear mechanism may change during the wear process.

3.3. Scratch Tests Results and Mechanisms of Wear

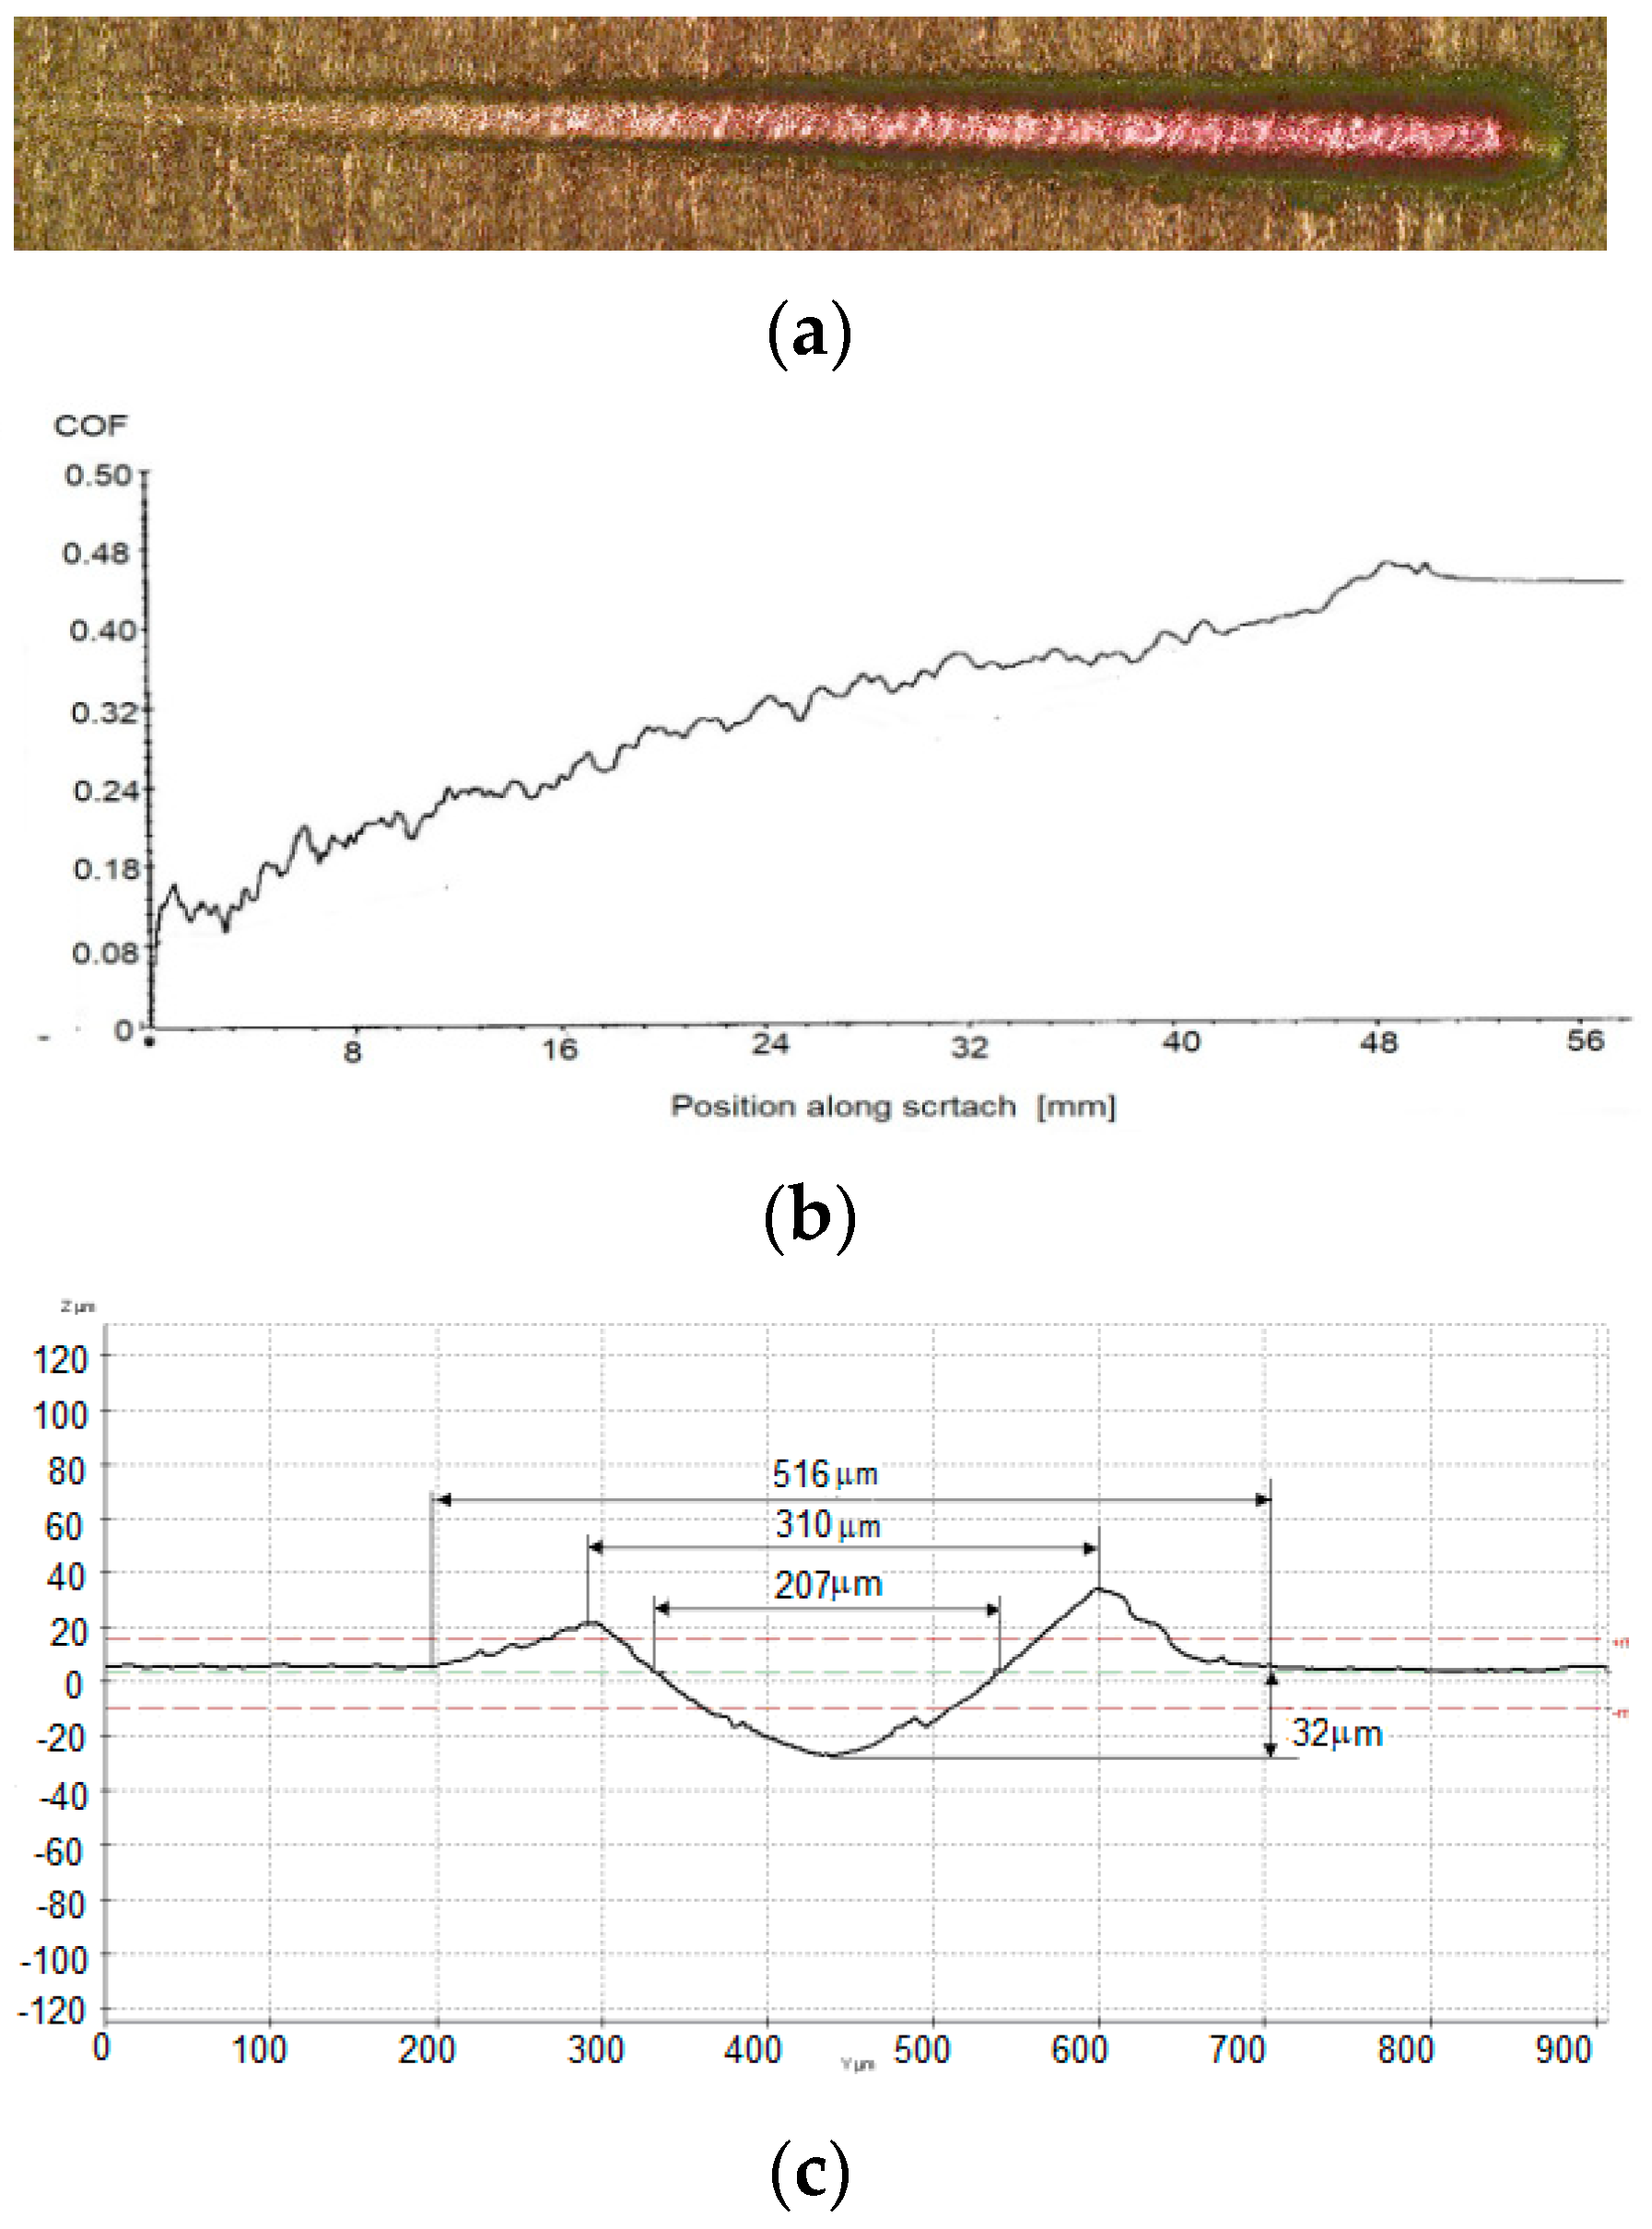
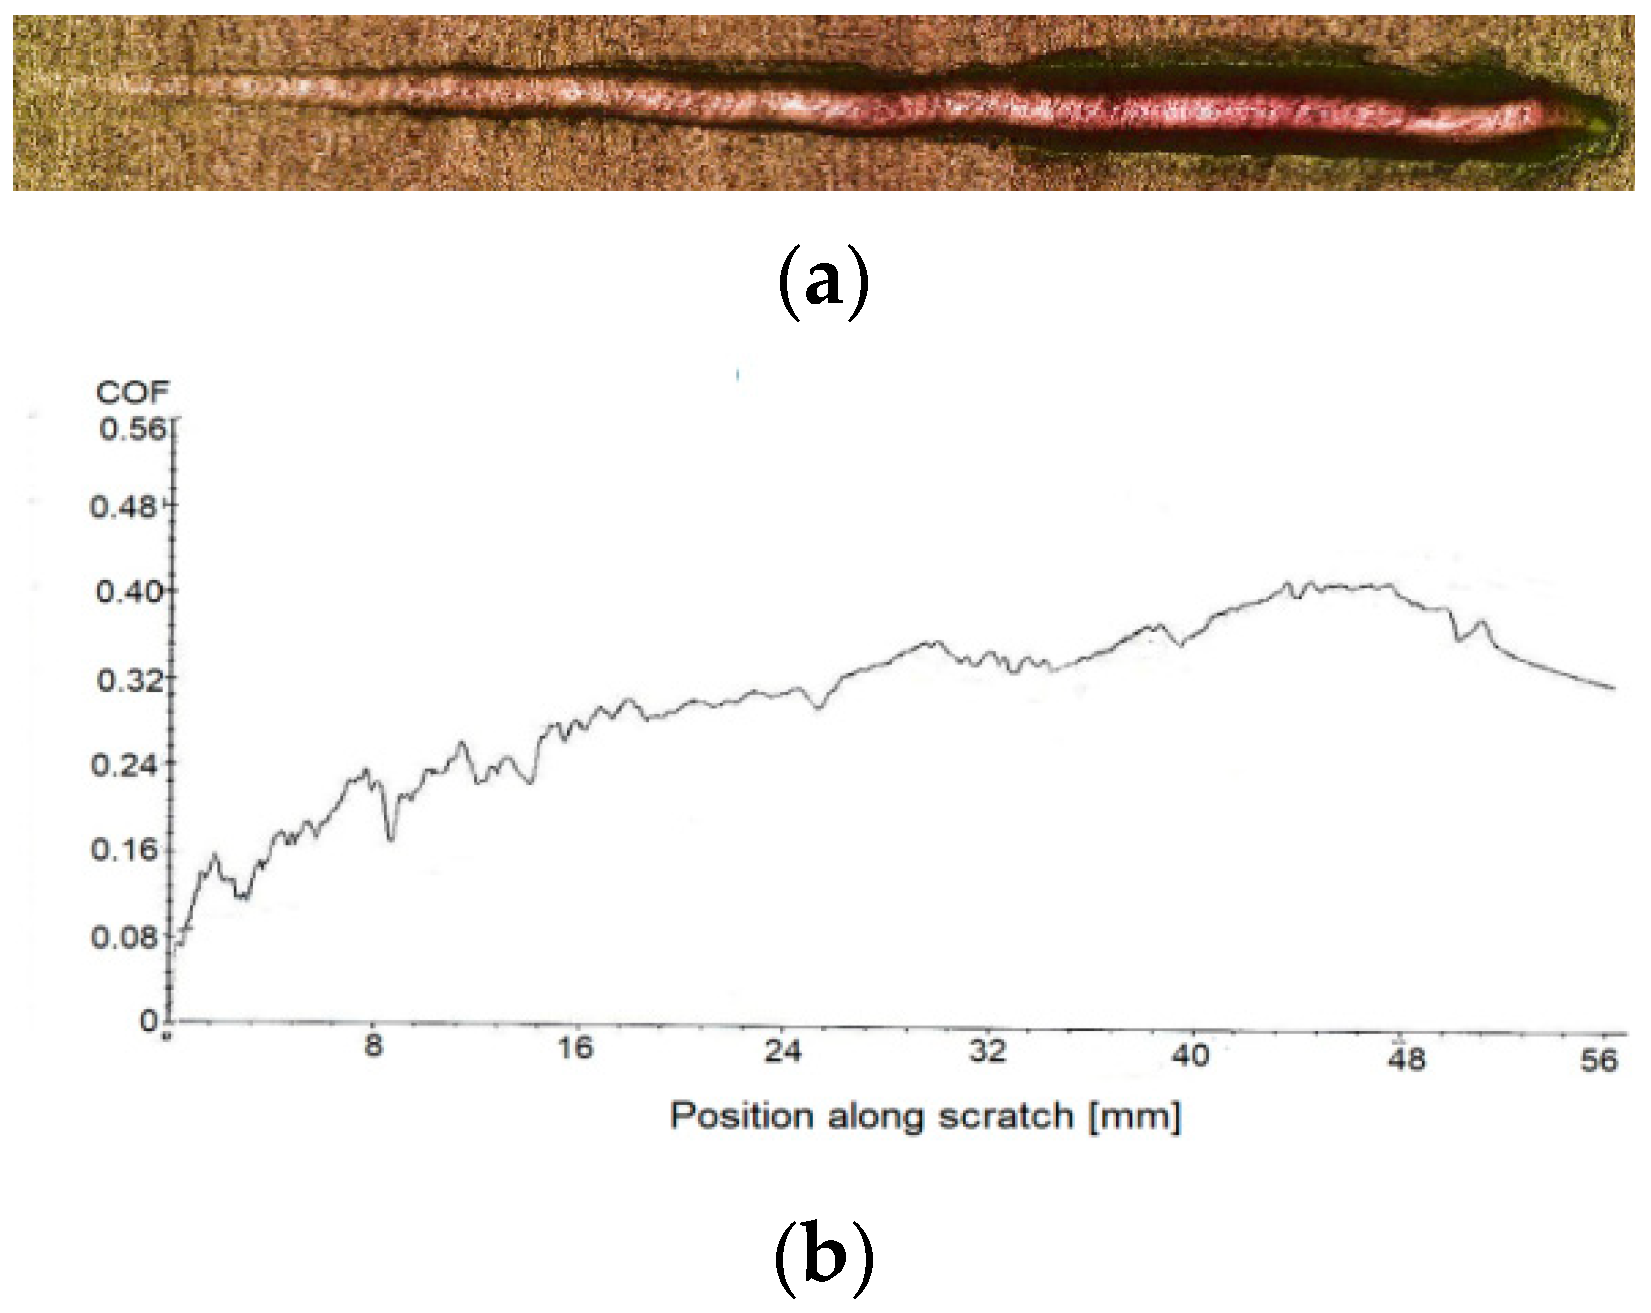
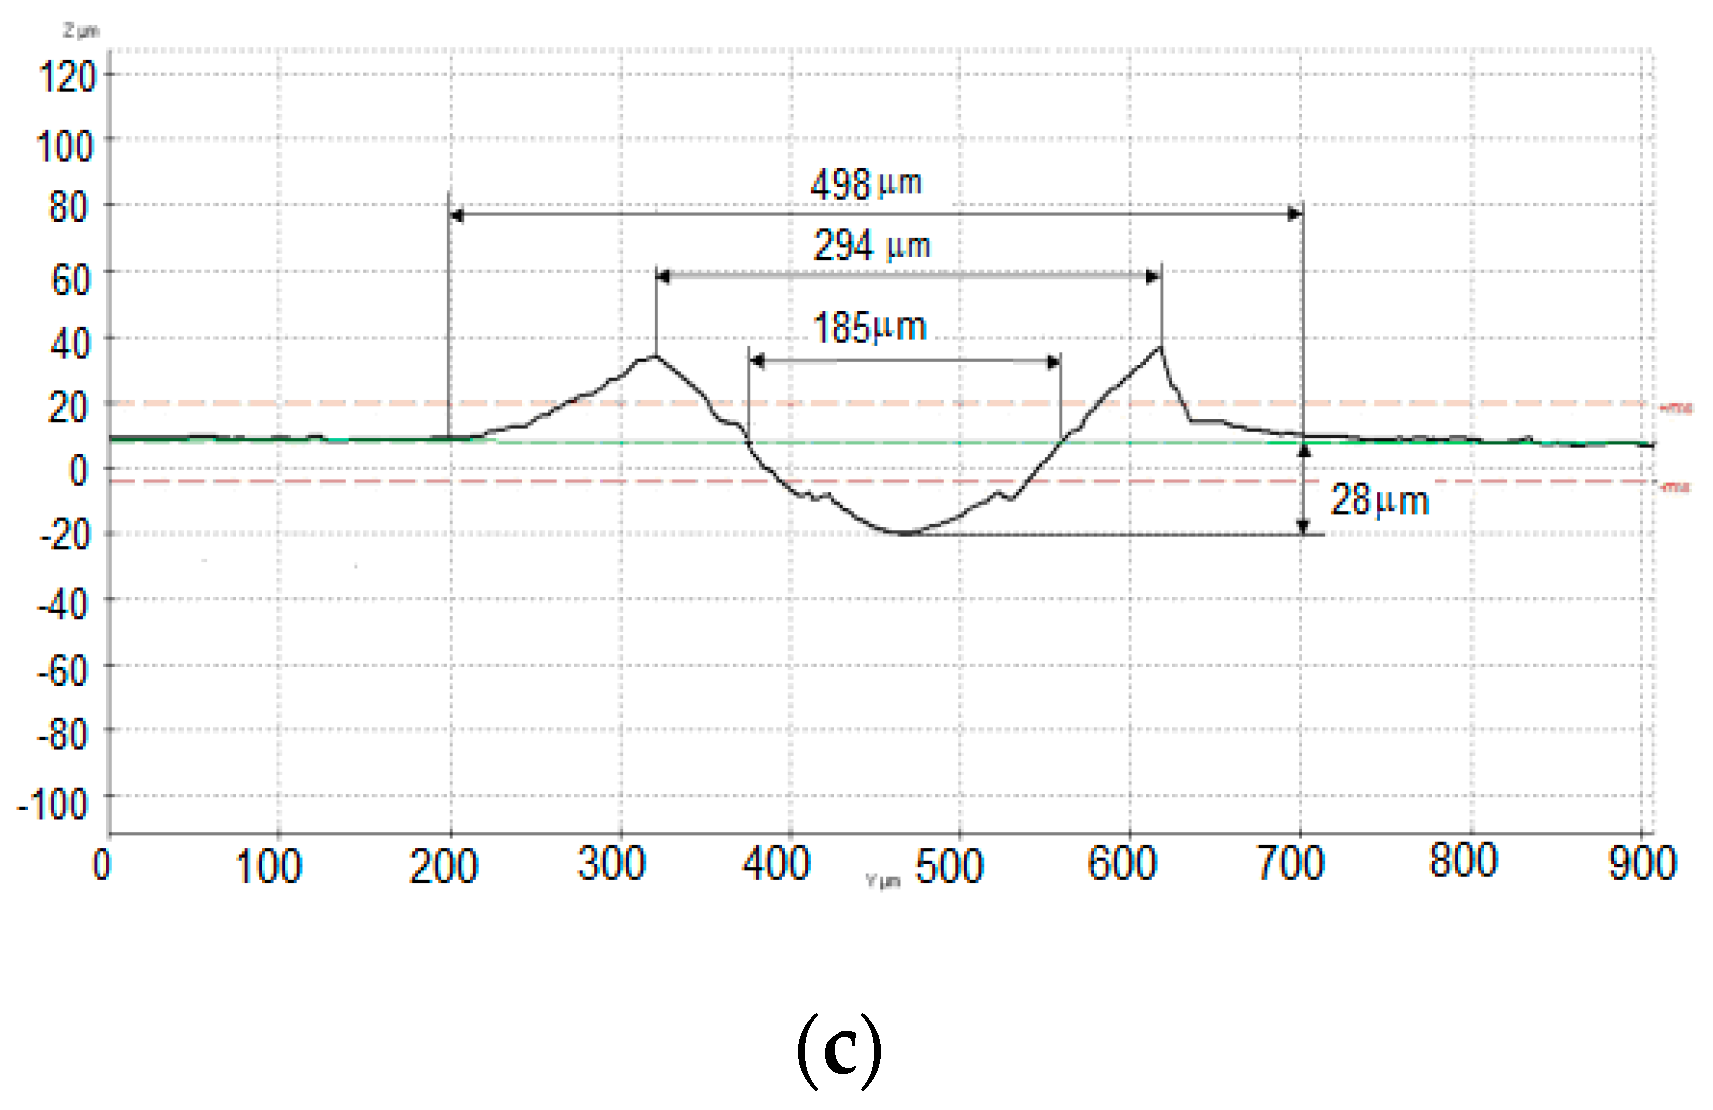
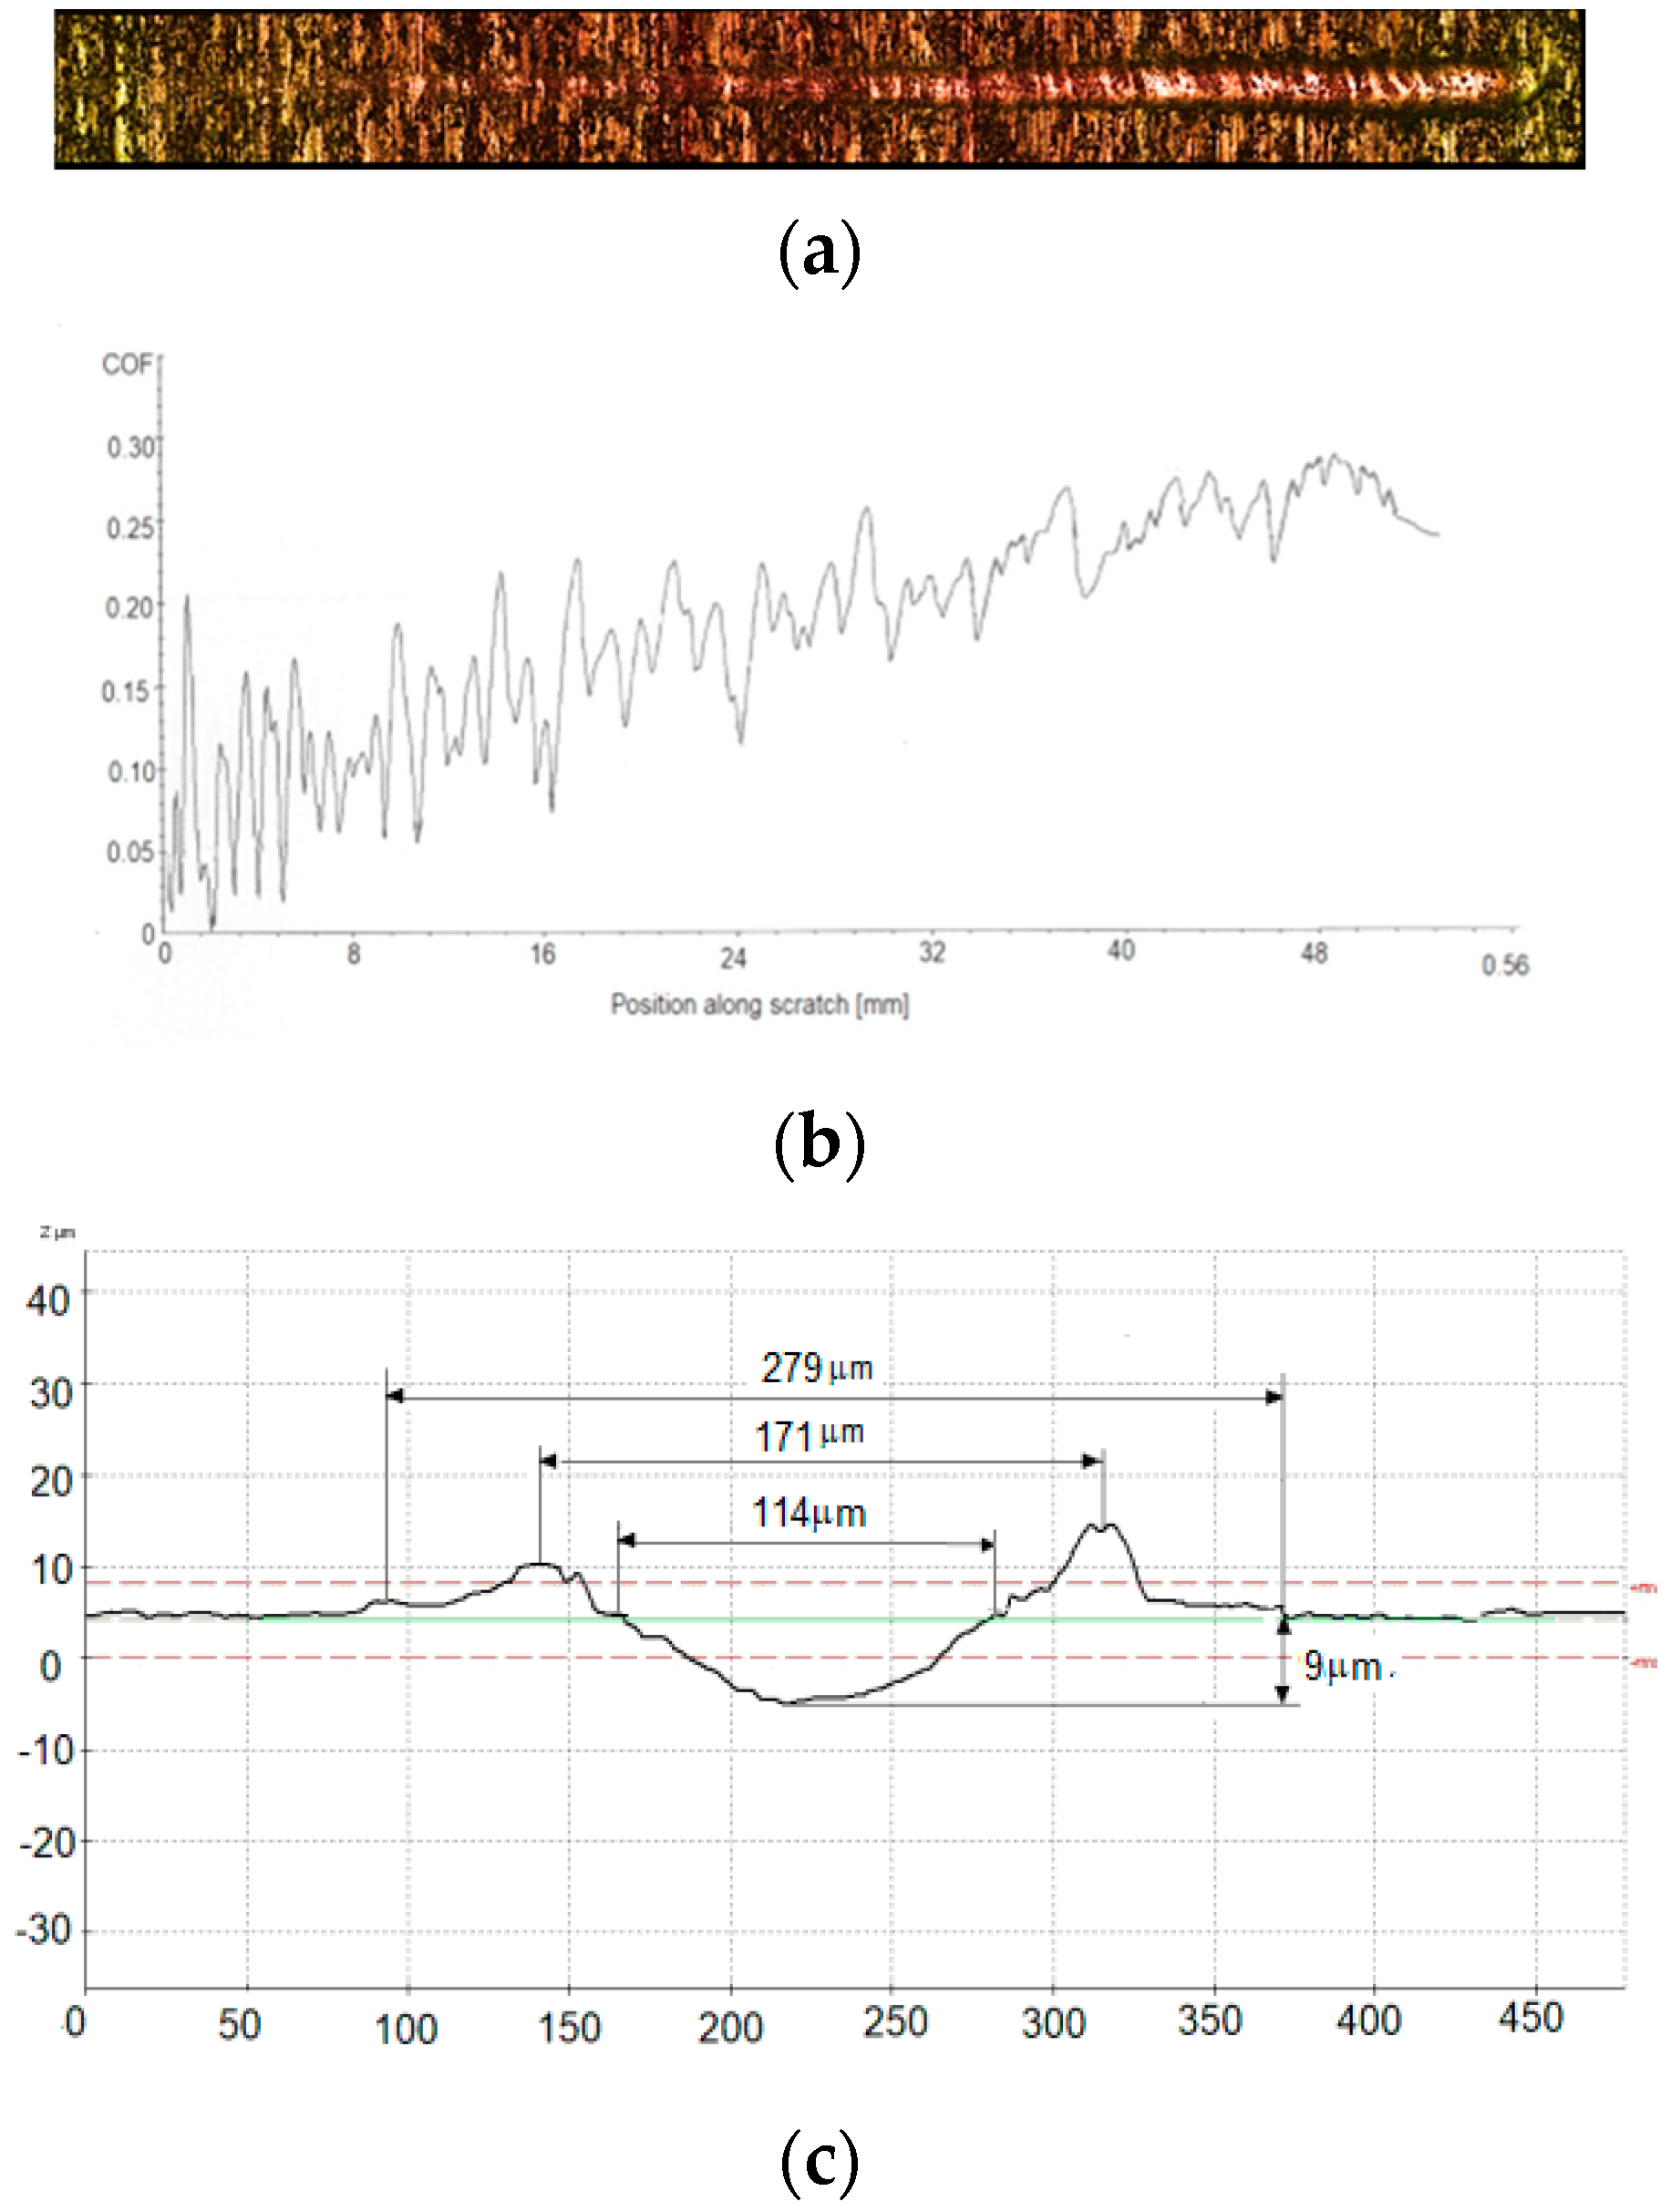
Table 5 summarises the average values of the scratch shapes for all specimens, and the relationships between the depths of the scratches and the position of the tip are shown in Figure 13. The scratch depth was determined with a 3D optical microscope. For material A, the highest depth scratch value of 31.62 µm was recorded. Material C, with a high hardness of 811 HV 0.1 (martensitic structure and carbides Cr), had a significantly lower scratch depth of 9.31 µm. The selected parameters of the scratches’ profile are shown in Table 5. The results obtained by modified three-body abrasion tests expressed by volume wear loss (Figure 9b) correspond to the geometric parameters of the scratches reported (Table 5). The hardfacing C with the lowest volume loss recorded the lowest depth of the scratch.
Figure 13a and Figure 14a show the surface after the scratch test (Bruker UNT Tribolab). A 3D optical microscope using confocal scanning and the interferometric laser measurement method was used to evaluate the surface after the scratch test. On three samples of each material (A, B, and C), three independent scratches were performed. The scratches were then profiled three times using a 3D optical microscope. The scratches’ profiles are shown in Figure 13c, Figure 14c and Figure 15c. The groove profiles were evaluated 1000 µm from the end of the scratch (according to the scratch test record; see Figure 16b, Figure 17b and Figure 18b.
Figure 14c shows that the scratch width of weld deposit B was 294 µm, sample C was 171 µm (Figure 15c), and sample A had a scratch width value of 310 µm (Figure 13c). A similar dependence for the zone interaction (ZOI) observed for sample A was 516 µm, sample B was 498 µm, and sample C was 279 µm. The formation of wedges by microplow produced a higher ZOI value than AISI 316L (A). These results are similar to the scratch widths measured by the SEM micrograph (Figure 18 and Figure 19).
The geometric parameters of the scratch obtained by the 3D optical microscope were compared with an SEM, which provided a means to study the mechanisms of abrasion wear. Images of the morphology of the worn surface are presented in Figure 16, Figure 17 and Figure 18.
On the surface A (a central region in the groove), plowing and plastic deformation of the material (Figure 16b) was observed. The material was plastically deformed and folded to the sides of the groove. The chips were near the scratch groove, together with the pile-up material (Figure 16a,c). Due to the ductility of the A material, the chips did not break off and, consequently, were not removed from the surface, but remained next to the track. The prevailing wear mechanisms of A [38] are determining factors of the wear rates of metallic alloys, and the plastic characteristics of metallic materials were recorded.
The slight traces of plowing on the surface of deposit B (Figure 17) indicate that increasing the carbide volume fraction in the austenite matrix reduces wear loss. The microcracks propagated and consequently segregated, forming the microscopic fracture wear. Therefore, a relatively smooth area of the scratch was observed in the central area of the ridge, as shown in Figure 17b.
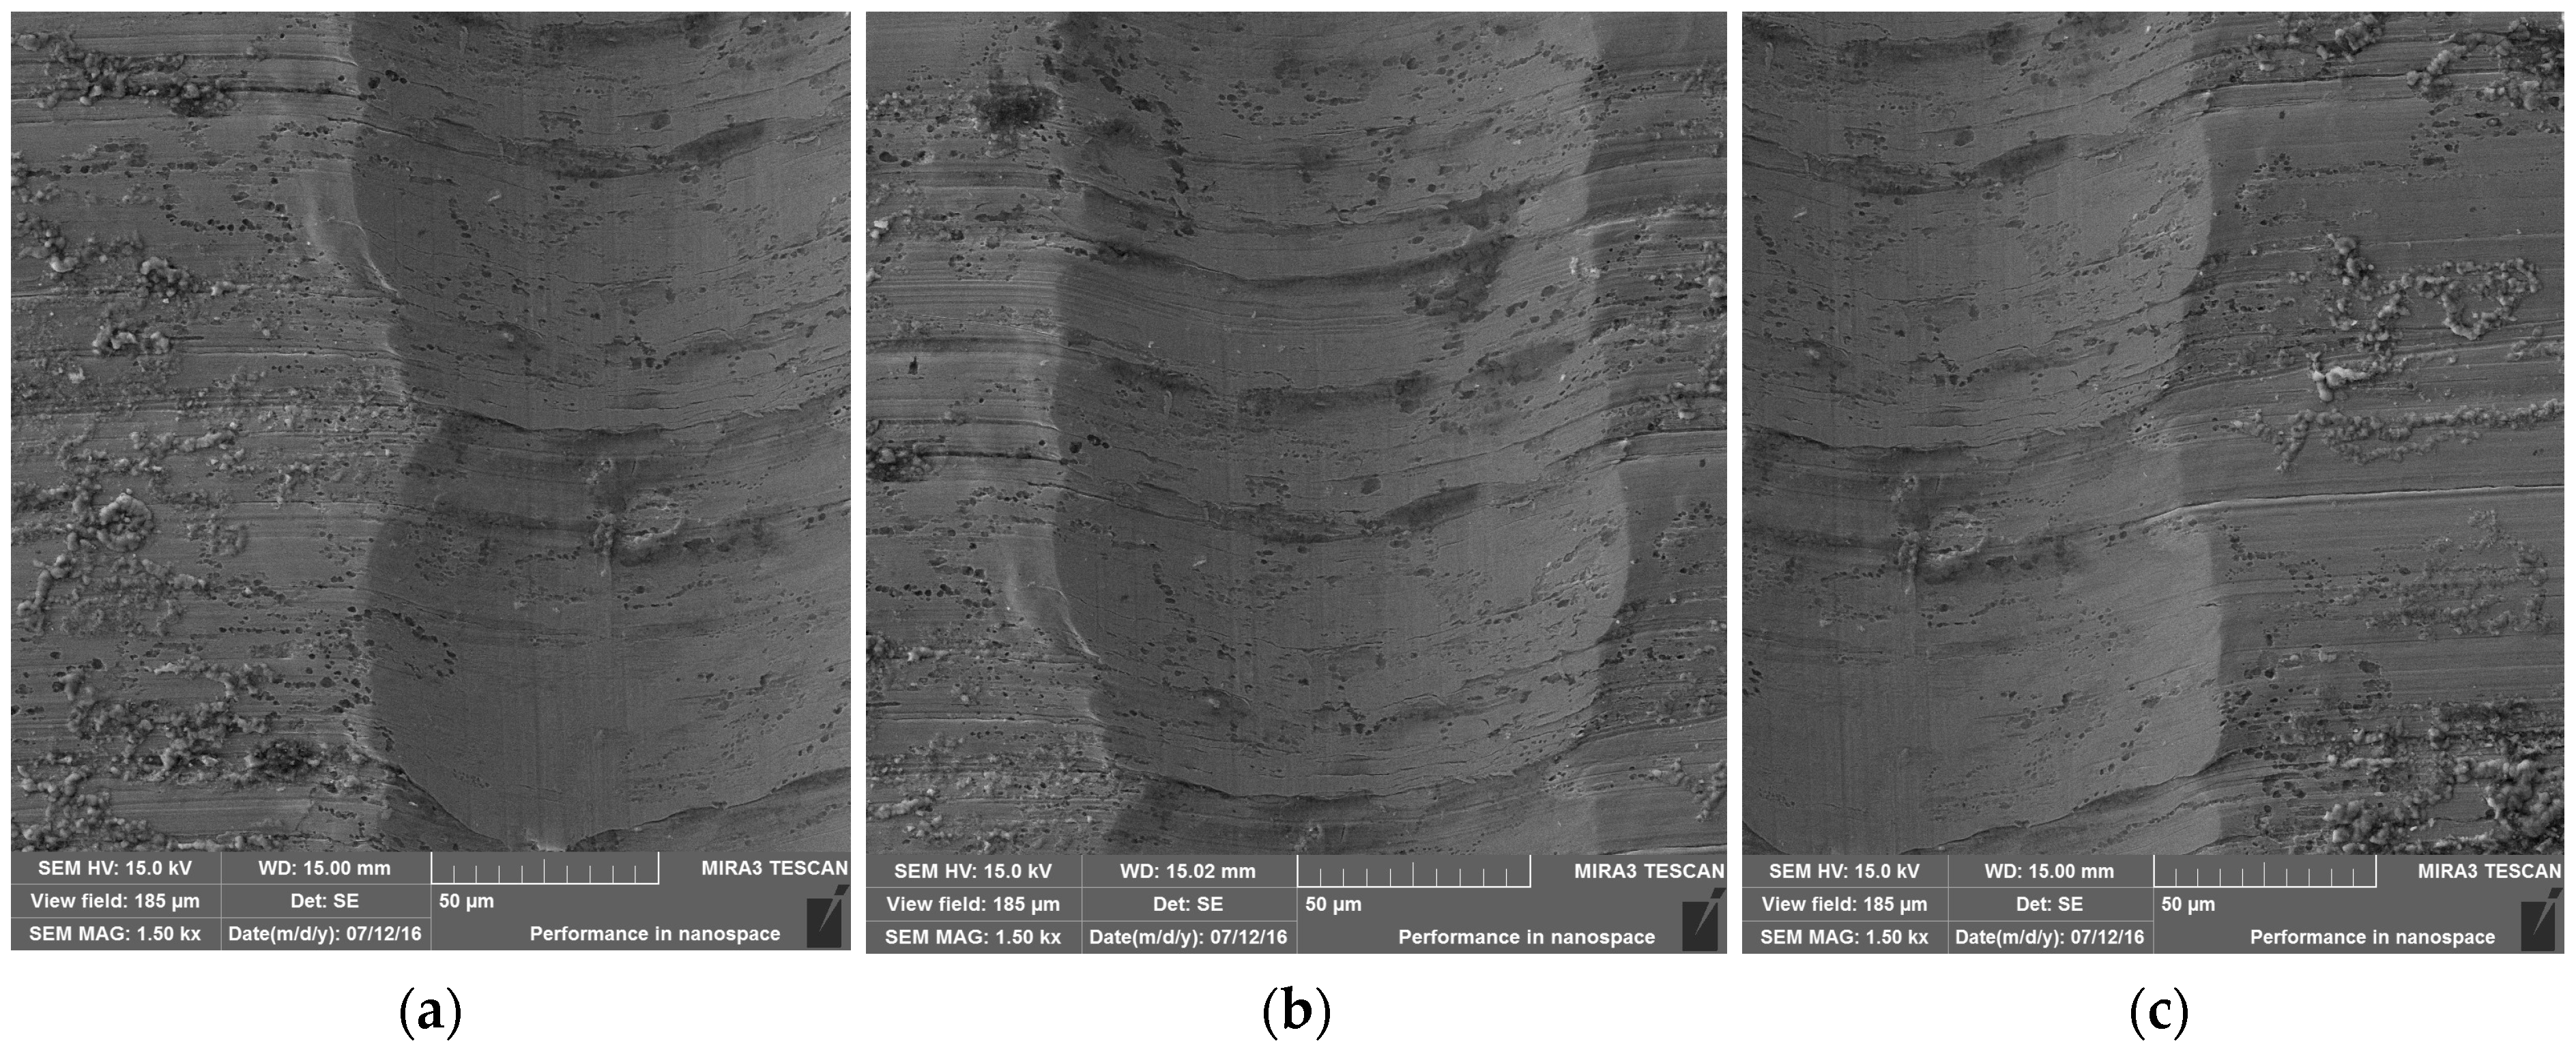
The wear mechanism of the deposit C-type sample surface indicated micro-cutting (Figure 18). The microstructure of the C deposit obtained the best results in terms of the high hardness and high wear resistance of the martensitic structure with the content of Cr carbides. The presence of Cr carbides and their uniform distribution in the martensitic matrix formed an effective barrier against the entry of abrasives. According to the results of the two test methods, the C deposit obtained the highest resistance to abrasive wear.
The morphology of the end of the scratches showed visible differences between the mechanisms of ductile wear and hard surfaces. Images of scratches of the samples after scratch testes (Figure 19) correlate with the coefficient of resistance to abrasive wear. The scratch test can be used as an alternative tribological method, where an indenter sliding tip represents if “an isolated abrasive particle tip” is sliding on the abraded surface [39,40,41,42,43].

3.4. Impact of Different Testing Methods on Selected Tribological Characteristics

For a clear view of the tribological behaviour of materials under abrasion, it is necessary, in addition to tribological testing, to evaluate their microstructure and mechanical properties. Although the hardness of materials is commonly used in the selection of materials for wear protection solutions, the use of the wear tests is an important key to the problems in the areas of contact tribology [44,45]. Several models for assessing abrasion wear were described to improve the correct understanding of material wear in the literature [39,40,41,42,43,46].
A summary of the results obtained for the materials by various tribological tests, such as the standard ASTM G 65 method and the double-pass scratch test, is given in Figure 20 and Figure 21. Figure 20 shows the changes in wear rate coefficient Kabr vs. hardness data for tested materials. The highest wear resistance was recorded for material C due to the carbide content in the martensitic structure, HV800. Sample B (austenitic structure with carbides, 300 HV) and sample A (austenitic structure, HV160), respectively, show a lower wear resistance compared to sample C. The hardness of the materials usually tends to increase the resistance to wear.
It is important to consider that the existence of martensitic structure influences not only hardness, but also brittleness, which may affect the wear resistance of materials negatively.
The proposed double-pass scratch test on abraded surfaces offers the possibility of a quick, inexpensive, and localised abrasion test. The double-pass scratch test is a relatively simple method, but the applicability of the test is connected with the use of a tested abraded material surface before application of the test. The utilization of the abraded surface is also following Allsopp, Trezona, and Hutching [47]. They stated that the balls were roughened before testing to improve the reproducibility of the test results [47]. Surface and subsurface characteristics in abrasion play a critical role in the wear mode and repeatability of test results. As reported in [48,49], if a single scratch test is used to assess the tribological behaviour of different surfaces, it does not correctly reflect the wear behaviour. Similarly, in real wear processes, the tips of the abrasive particles (such as the tip of the indenter during the scratch test) move continuously along the hardened and abrasive surface under local contact conditions [50,51,52].
Some works also describe that it is necessary to provide an equivalent state of the material before the application of the final scratch test [53]. In our tests, we used abraded material surfaces for the double-pass scratch test. The results of the abrasion resistance of the double passes were verified by a three-point wear test. The results of the summary analysis of the double scratch test are shown in Figure 21.
In the presented results, the wear behaviour of the material was assessed by the dimensions of the groove profiles at a defined position (Figure 21). Increasing the dimensions of the geometric parameters of the grooves for materials A and B shows similar trends that follow the volume losses of materials A and B obtained from the three-body wear tests. The content of austenite in samples A and B leads to an increase in the dimension of the groove.
The results showed that material C with the highest hardness exhibits all geometric parameters of grooves with the lowest values, which refers to the best wear behaviour (Figure 21). The microstructure of fine martensite with the carbides in the C sample has a significant influence on decreasing groove dimensions. High abrasive wear resistance correlates with the lowest dimensions of groove, which is in good agreement with the relatively high hardness and low Kabr (see Figure 20).
It was recorded that increasing dimensions of all grooves reflects the actual hardness of tested materials. The results obtained showed a good correlation between the wear rate coefficient Kabr observed under the three-body wear test versus the double-pass scratch test. Based on the tests mentioned above, the best wear behaviour was confirmed for sample C.
As shown in Figure 21, the martensite content plays an important role in determining abrasion resistance in a double-pass scratch test [53]. However, it is important to note that the microstructure properties of martensitic resistant materials also show that the size of bales and martensite blocks [38,54], and their boundaries, influence the strengthening and tribological behaviour of the martensitic structure.
Additionally, more valuable and detailed information to explain the relationship between the abrasion behaviour under the double-pass test method and the three-body wear test can be gathered by analysis of the surface morphology of materials after the test. Abrasive wear has three different forms: micro-cutting, wedge-forming, and plowing. During the operation of a system, a transition from one mode to another may occur, and the modes can act simultaneously [53,55,56]. The worn surfaces of samples and the mechanisms of surface damage examined under two different tests are presented in Figure 22 and Figure 23.
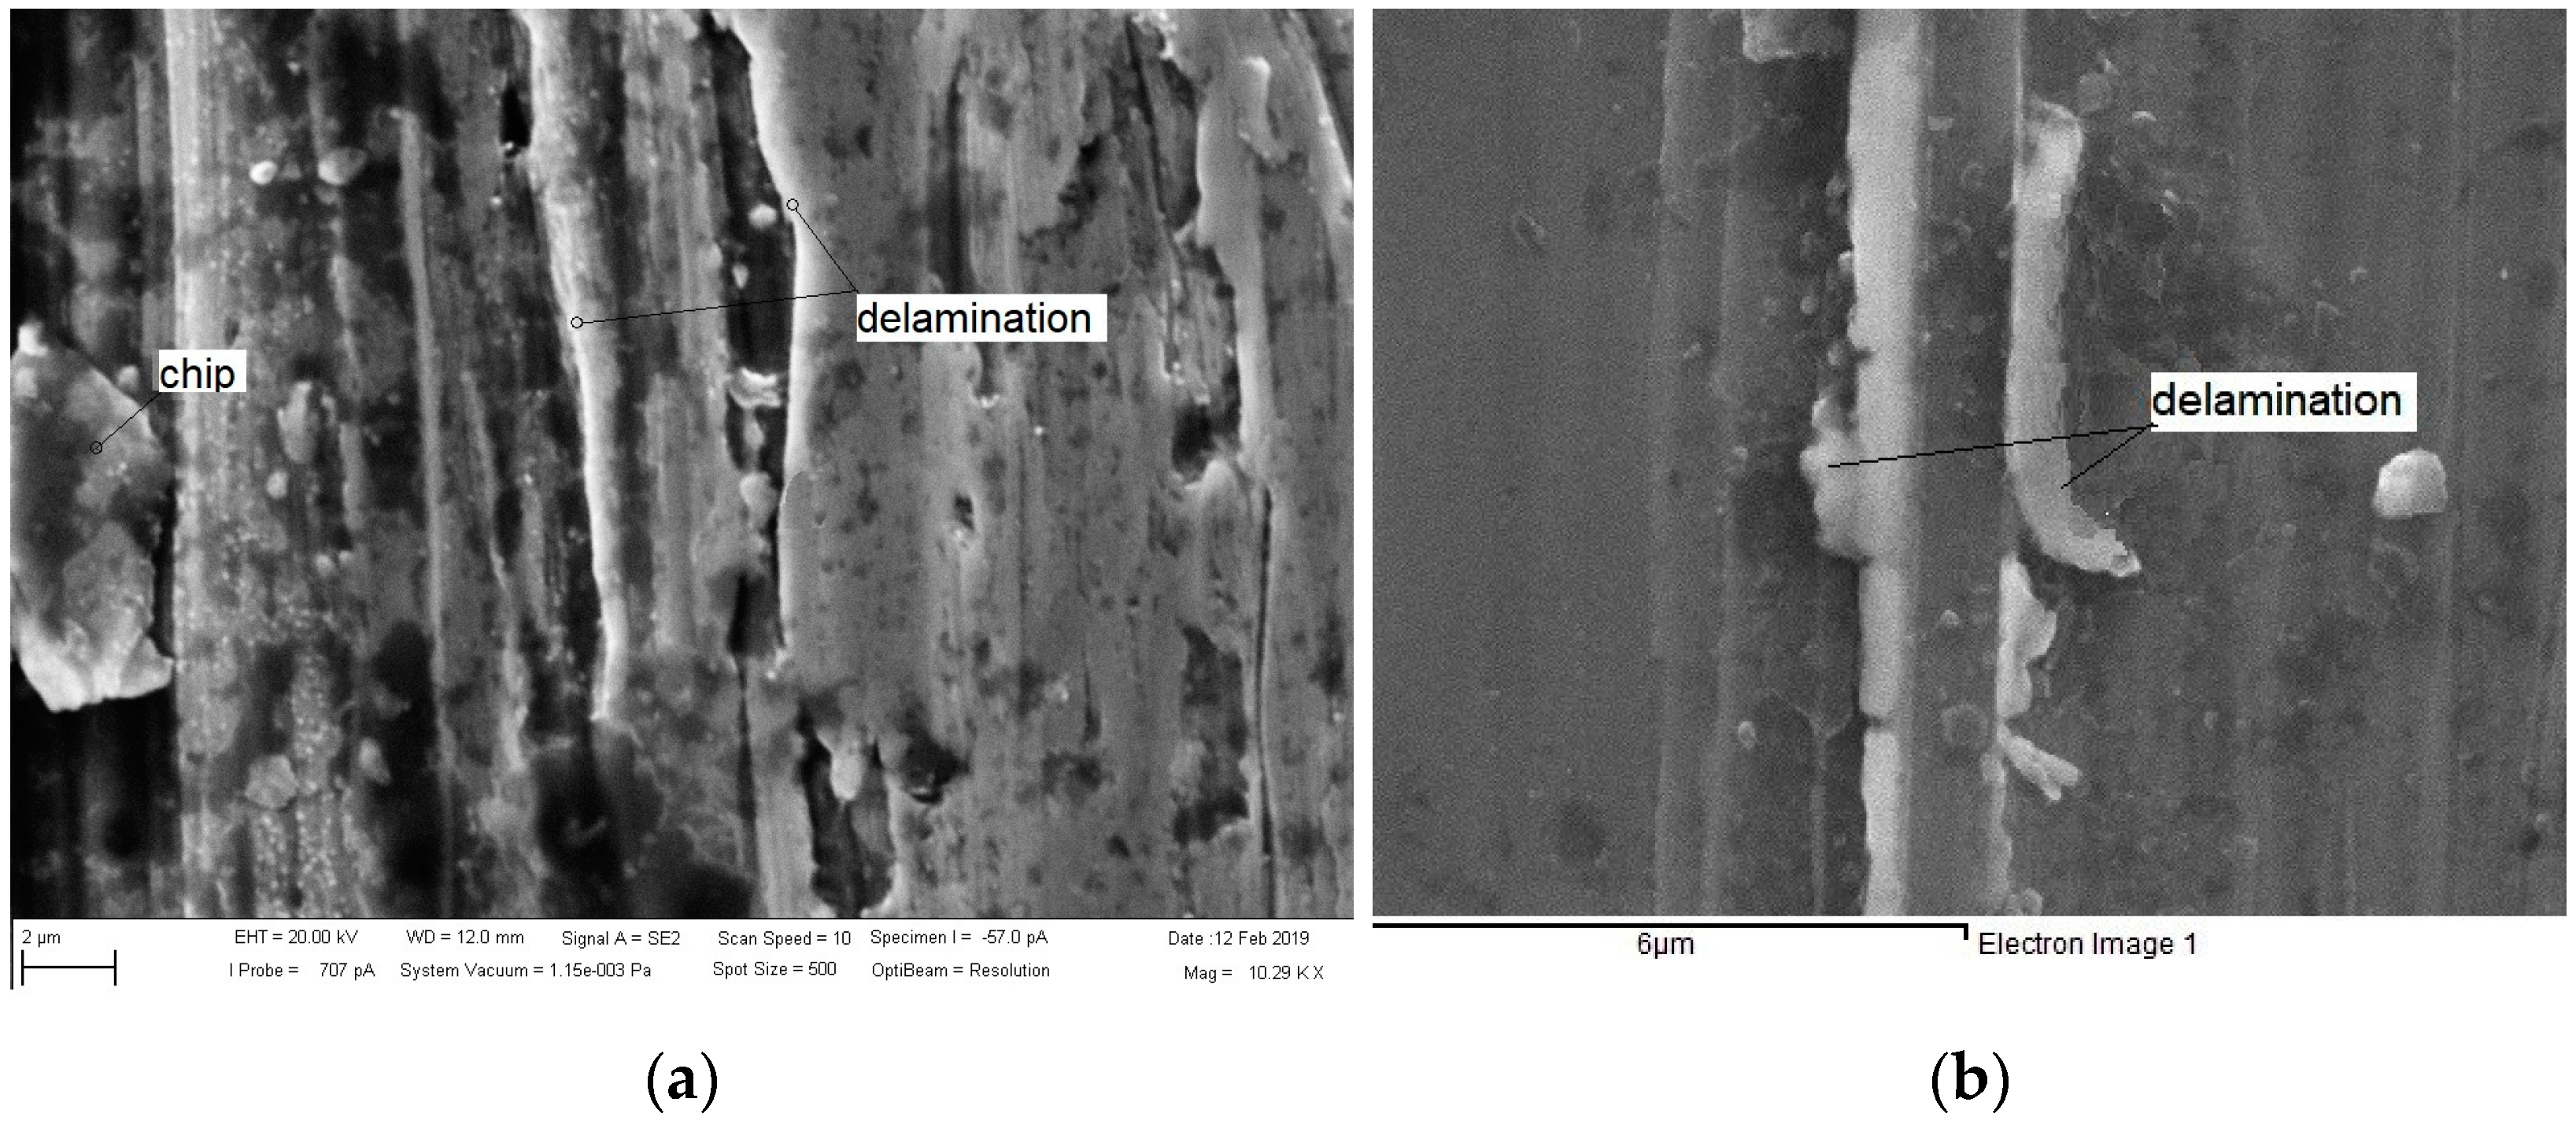
The plastic deformation associated with plowing and cutting the worn surface for sample B is observed in Figure 22a. The main wear mechanisms cutting and delamination for the worn surface of material C are recorded in Figure 22b. These mechanisms can arise on the hard surfaces of materials.
Three different abrasion wear modes, i.e., cutting, plowing, and wedge formation, as described by Hokkirigawa and Kato, were observed on worn surfaces—Figure 22a,b [49]. SEM images of the beginning of the double-pass scratch tests (Figure 23a,b) show obvious differences in morphology of the grooves for materials B and C; regardless that the original surface before the tests was rough. As was observed at the start of the test for material C (Figure 23b), the indenter was sliding on the surface, and the wear of surface damage was very slight. This effect is related to the high hardness of material C (800 HV) with martensite structure and carbides that play an important role in determining the resistance to abrasion, as reported in [52,53,54,55,56,57].
The results presented on the abrasive behaviour of the tested materials obtained by double-pass scratch tests are in reasonable conformity with the results of the standard abrasion test. They are also supported by an analysis of the wear mechanisms of surfaces exposed to abrasion. It is crucial to consider the fact that double-pass scratch tests were performed on abraded surfaces. Obtained results show that the use of the presented double-pass scratch test allows for investigating the abrasive wear processes.
The experimental study based on two different abrasion testing methods—the double-pass scratch test and the standard abrasion test ASTM G65—showed identical abrasion wear resistance of tested materials. The highest abrasion resistance was obtained for material C. It can be stated that the double-pass scratch test is a relatively simple, not expensive testing method for the preliminary estimation of abrasion wear resistance of materials, compared to the standard abrasion test according to ASTM G65.

4. Conclusions

Two experimental methods, the modified ASTM G65 dry rubber wheel abrasion test and the double-pass scratch test, were used to characterise the abrasion resistance of materials with different microstructures. The knowledge obtained from this study can be summarized in the following points:
  • The abrasive wear loss of tested materials is proportional to their hardness. Weld deposit Fluxofil 58 (C) shows the most significant wear resistance amongst the three materials tested.
  • Weld deposit Fluxofil 58 (C), which shows the most significant wear resistance, formed by homogeneously distributed carbides with the martensitic matrix, is an effective barrier against the entry of abrasives.
  • It was demonstrated that the results of selected geometric parameters in the double-pass scratch test are correlated with the measurement of three-body wear tests. Sample hardfacing with Fluxofil 58 (C), with the best abrasion resistance, shows the lowest groove depth after the scratch test.
  • The double-pass scratch test method can be used as the preliminary abrasion selection of materials for conditions of the real abrasive wear processes.
  • The proposed new concept of the double-pass scratch test indicates the possibility to estimate the abrasion wear resistance of materials relatively quickly and easily.
In future, this study can be extended by developing analytical model based on the response surface methodology for analysis of the effect of hardfacing parameters on the wear behaviour of materials tested. In addition, it is worth checking the temperature distribution during the test and its influence on the wear rate of the hardfacing layer. The analysed surfacing alloys will also be tested in collaboration with various countersample materials.

Author Contributions

Conceptualization, J.S.; Investigation, J.S., I.G.; Formal analysis, J.S., Ľ.K.; Validation, J.S., A.K., T.T.; Writing—original draft, J.S., A.K., T.T.; Writing—review & editing, J.S., T.T.; Project administration, J.S., A.K.; Funding acquisition, J.S., A.K. All authors have read and agreed to the published version of the manuscript.

Funding

This work was supported by Slovak Research and Development Agency and Polish National Agency for Academic Exchange, project title: Research into innovative forming and joining methods of thin-walled components”, project numbers: SK-PL-21-0033 and BPN/BSK/2021/1/00067/U/00001. The authors are also grateful for the support in the experimental work to the Grant Agency of the Ministry of Education, Science, Research, and Sport of the Slovak Republic (grant number VEGA 1/0259/19).

Data Availability Statement

The data presented in this study are available on request from the corresponding author.

Acknowledgments

The authors would like to thank in memoriam Eva Zdravecká, who was at the beginning of this research and thanks to her the tribology laboratory was established.

Conflicts of Interest

The authors declare no conflict of interest.

References

  1. Rabinowicz, E. Friction and Wear of Materials; J. Wiley and Sons: New York, NY, USA, 1965. [Google Scholar]
  2. Sundstrom, A.; Rendnón, J.; Olsson, M. Wear behaviour of some low alloyed steels under combined impact/abrasion contact conditions. Wear 2001, 250, 744–754. [Google Scholar] [CrossRef]
  3. Bhushan, B. Principles and Applications of Tribology; J. Wiley and Sons: New York, NY, USA, 1999. [Google Scholar]
  4. Misra, A.; Finnie, I. A Review of the abrasive wear of metals. J. Eng. Mater. Technol. 1982, 104, 94–101. [Google Scholar] [CrossRef]
  5. Gahr, K.H.Z. Microstructure and Wear of Materials; Tribology Series 10; Elsevier: Amsterdam, Holland, 1987. [Google Scholar]
  6. Buchanan, V.E.; Shipway, P.H.; McCartney, D.G. Microstructure and abrasive wear behaviour of shielded metal arc welding hardfacings used in the sugarcane industry. Wear 2007, 263, 99–110. [Google Scholar] [CrossRef]
  7. Hutchings, I.M. Tribology: Friction and Wear of Engineering Materials. In Tribology; Arnold, E., Ed.; Butterworth-Heinemann: Cambridge, UK, 1992; pp. 133–171. [Google Scholar]
  8. Rendón, J.; Olsson, M. Abrasive wear resistance of some commercial abrasion resistant steels evaluated by laboratory test methods. Wear 2009, 267, 2055–2061. [Google Scholar] [CrossRef]
  9. Budinski, K.G.; Budinski, S.T. On replacing three-body abrasion testing with three-body abrasion testing. Wear 2017, 376–377, 1859–1865. [Google Scholar] [CrossRef]
  10. Franek, F.; Badisch, E.; Kirchgaßner, M. Advanced Methods for Characterisation of Abrasion/Erosion Resistance of Wear Protection Materials. FME Trans. 2009, 37, 61–70. [Google Scholar]
  11. Wirojanupatump, S.; Shipway, P.H. Abrasion of mild steel in wet and dry conditions with the rubber and steel wheel abrasion apparatus. Wear 2000, 239, 91–101. [Google Scholar] [CrossRef]
  12. Feugeas, J.; Rico, L.; Nosei, L.; Gómez, B.; Bemporad, E.; Lesage, J. Ferrón. Austenite modification of AISI 316L SS by pulsed nitrogen ion beams generated in dense plasma focus discharges. Surf. Coat. Technol. 2010, 204, 1193–1199. [Google Scholar] [CrossRef]
  13. Wang, X.; Liu, Z.; Chen, Y.; Sun, J.; He, Q.; Liu, Q.; Liu, G.; Xie, K. Abrasive resistance and corrosion properties of AISI 316 sieve via low temperature gaseous nitriding. Surf. Coat. Technol. 2019, 361, 349–356. [Google Scholar] [CrossRef]
  14. Linghui, S.W.; Linghui, S.; Qiao, S.Y.; Min, M. Effect of Carbide Orientation on Impact-Abrasive Wear Resistance of High-Cr Iron Used in Shot Blast Machine. Tribol. Lett. 2013, 50, 439–448. [Google Scholar]
  15. Ordoñez, M.F.C.; Amorim, C.L.G.; Krindges, I.; Aguzzoli, C.; Baumvol, I.J.; Figueroa, C.A.; Sinatora, A.; Souza, R.M.; Farias, M.C.M. Microstructure and micro-abrasive wear of sintered yttria-containing 316L stainless steel treated by plasma nitriding. Surf. Coat. Technol. 2019, 374, 700–712. [Google Scholar] [CrossRef]
  16. Chotěborský, R. Effect of heat treatment on the microstructure, hardness and abrasive wear resistance of high chromium hardfacing. Res. Agric. Eng. 2013, 59, 23–28. [Google Scholar] [CrossRef]
  17. Badisch, E.; Roy, M. Hardfacing for Wear, Erosion and Abrasion. In Surface Engineering for Enhanced Performance against Wear; Roy, M., Ed.; Springer: Vienna, Austria, 2013; pp. 149–191. [Google Scholar]
  18. Kenchireddy, K.M.; Jayadeva, C.T.; Sreenivasan, A. Influence of material characteristics on the abrasive wear response of some hardfacing alloys. Glob. J. Eng. Sci. Res. 2014, 1, 12–21. [Google Scholar]
  19. Annappa, A.R.; Basavarajappa, S. Some studies on three-body abrasive wear behaviour of hardfaced and normal plough tool material using Taguchi method. Int. J. Surf. Sci. Eng. 2013, 7, 14–26. [Google Scholar] [CrossRef]
  20. Pöhl, F.; Hardes, C.; Theisen, W. Deformation behavior and dominant abrasion micro mechanisms of tempering steel with varying carbon content under controlled scratch testing. Wear 2019, 422–423, 212–222. [Google Scholar] [CrossRef]
  21. Pirso, J.; Viljus, M.; Letunovitš, S.; Juhani, K.; Joost, R. Three-body abrasive wear of cermets. Wear 2011, 271, 2868–2878. [Google Scholar] [CrossRef]
  22. Stachowiak, G.W.; Batchelor, A.W. Engineering Tribology, 4th ed.; Butterworth-Heinemann: Oxford, UK, 2013. [Google Scholar]
  23. Venkatesh, B.; Sriker, K.; Prabhakar, V.S.V. Wear characteristics of hardfacing alloys: State-of-the-art. Procedia Mater. Sci. 2015, 10, 527–532. [Google Scholar] [CrossRef]
  24. Venkatesh, B.; Sriker, K.; Kumar, M.A. Wear characteristics of multi layer hardfacing alloys. AIP Conf. Proc. 2020, 2259, 020020. [Google Scholar]
  25. Dziedzic, K.; Jóźwik, J.; Barszcz, M.; Gauda, K. Wear characteristics of hardfacing coatings obtained by tungsten inert gas method. Adv. Sci. Technol. Res. J. 2019, 13, 8–14. [Google Scholar] [CrossRef]
  26. Paz-Triviño, F.; Buitrago-Sierra, R.; Santa-Marín, J.F. Wear resistance and hardness of nanostructured hardfacing coatings. Dyna 2020, 87, 146–154. [Google Scholar] [CrossRef]
  27. Vargova, M.; Tavodova, M.; Monkova, K.; Dzupon, M. Research of Resistance of Selected Materials to Abrasive Wear to Increase the Ploughshare Lifetime. Metals 2022, 12, 940. [Google Scholar] [CrossRef]
  28. Prysyazhnyuk, P.; Krauze, K.; Romanyshyn, L.; Mosora, Y. Increasing the wear resistance of mining machines equipment tools by FCAW with Fe-Mo-Mn-B-C hardfacing alloys. Min. Mach. 2020, 40, 64–70. [Google Scholar]
  29. Ferdinandov, N.V.; Gospodinov, D.D. Hardfacing of metal-cutting tools by arc welding in vacuum. J. Achiev. Mater. Manuf. Eng. 2020, 99, 49–56. [Google Scholar] [CrossRef]
  30. Winczek, J.; Gucwa, M.; Mičian, M.; Koňár, R.; Parzych, S. The evaluation of the wear mechanism of high-carbon hardfacing layers. Arch. Metall. Matals 2019, 64, 1111–1115. [Google Scholar]
  31. Öztürk, Z.T. Wear behavior and microstructure of Fe-C-Si-Cr-B-Ni hardfacing alloys. Mater. Test. 2021, 63, 231–234. [Google Scholar] [CrossRef]
  32. Nagentrau, M.; Mohd Tobi, A.L.; Kamdi, Z.; Ismail, M.I.; Sambu, M. Microstructure Analysis of Tungsten Carbide Hardfacing on Carbon Steel Blade. IOP Conference Series: Mater. Sci. Eng. 2017, 203, 012014. [Google Scholar] [CrossRef]
  33. da Silva, W.M.; Costa, H.L.; de Mello, J.D.B. Transitions in abrasive wear mechanisms: Effect of the superimposition of interactions. Wear 2011, 271, 977–986. [Google Scholar] [CrossRef]
  34. Kobrick, R.L.; Klaus, D.M.; Street, K.W. Standardization of a volumetric dis. placement measurement for two-body abrasion scratch test data analysis. Wear 2011, 270, 650–657. [Google Scholar] [CrossRef]
  35. Xu, X.; van der Zwaag, S.; Xu, W. Prediction of the abrasion resistance of construction steels on the basis of the subsurface deformation layer in a multi-pass dual-indenter scratch test. Wear 2015, 338, 47–53. [Google Scholar] [CrossRef]
  36. Buttery, T.C.; Archard, J.F. Grinding and abrasive wear. Proc. Inst. Mech. Eng. 1970, 185, 537–552. [Google Scholar] [CrossRef]
  37. da Silva, W.M.; Mello, J.D.B. Using parallel scratches to simulate abrasive wear. Wear 2009, 267, 1987–1997. [Google Scholar] [CrossRef]
  38. Wang, C.; Wang, M.; Shi, J.; Hui, W.; Dong, H. Effect of microstructural refinement on the toughness of low carbon martensitic steel. Scr. Mater. 2008, 58, 492–495. [Google Scholar] [CrossRef]
  39. Masen, M.A.; de Rooij, M.B.; Schipper, D.J. Micro-contact based modelling of abrasive wear. Wear 2005, 258, 339–348. [Google Scholar] [CrossRef]
  40. Zum Gahr, K.H. Modelling of two-body abrasive wear. Wear 1988, 124, 87–103. [Google Scholar] [CrossRef]
  41. Torrance, A.A. Modelling abrasive wear. Wear 2005, 258, 281–293. [Google Scholar] [CrossRef]
  42. Xie, Y.; Williams, J.A. The prediction of friction and wear when a soft surface slides against a harder rough surface. Wear 1996, 196, 21–34. [Google Scholar] [CrossRef]
  43. Fang, L.; Liu, W.; Du, D.; Zhang, X.; Xue, Q. Predicting three-body abrasive wear using Monte Carlo methods. Wear 2004, 256, 685–694. [Google Scholar] [CrossRef]
  44. Jardret, V.; Zahouani, H.; Loubet, J.L.; Mathia, T.G. Understanding and quantification of elastic and plastic deformation during a scratch test. Wear 1998, 218, 8–14. [Google Scholar] [CrossRef]
  45. Badisch, E.; Kirchgaßner, M.; Polak, R.; Franek, F. The comparison of wear properties of different Fe-based hardfacing alloys in four kinds of testing methods. Lubr. Sci. 2008, 14, 225–233. [Google Scholar] [CrossRef]
  46. Xie, Y.; Bhushan, B. Effects of particle size, polishing pad and contact pressure in free abrasive polishing. Wear 1996, 200, 281–295. [Google Scholar] [CrossRef]
  47. Allsopp, D.N.; Trezona, R.I.; Hutchings, I.M. The effects of ball surface condition in the micro-scale abrasive wear test. Tribol. Lett. 1998, 5, 259–264. [Google Scholar] [CrossRef]
  48. Podgornik, B.; Hogmark, S.; Sandberg, O.; Leskovsek, V. Wear resistance and anti-sticking properties of duplex treated forming tool steel. Wear 2003, 254, 1113–1121. [Google Scholar] [CrossRef]
  49. Hokkirigawa, K.; Kato, K. An experimental and theoretical investigation of ploughing, cutting and wedge formation during abrasive wear. Tribol. Int. 1988, 21, 51–57. [Google Scholar] [CrossRef]
  50. Gates, J.D. Two-body and three-body abrasion: A critical discussion. Wear 1998, 214, 139–146. [Google Scholar] [CrossRef]
  51. Rigney, D.A. Fundamentals of Friction and Wear of Materials; American Society for Metals: Metals Park, OH, USA, 1981. [Google Scholar]
  52. Larsen-Basse, J. Effect of relative hardness on transition in abrasive wear mechanisms. In Wear of Materials; Ludema, K.C., Ed.; ASME: New York, NY, USA, 1983; pp. 161–166. [Google Scholar]
  53. Xu, X.; van der Zwaag, S.; Xu, W. A novel multi-pass dual-indenter scratch test to unravel abrasion damage formation in construction steels. Wear 2015, 322–323, 51–60. [Google Scholar] [CrossRef]
  54. Krauss, G. Martensite in steel: Strength and structure. Mater. Sci. Eng. A 1999, 273–275, 40–57. [Google Scholar] [CrossRef]
  55. Trezona, R.I.; Allsopp, D.N.; Hutchings, I.M. Transition between two-body and three-body abrasive wear: Influence of test conditions in the microscale abrasive wear test. Wear 1999, 225–229, 205–214. [Google Scholar] [CrossRef]
  56. Adachi, K.; Hutchings, I.M. Wear-mode mapping for the micro-scale abrasion test. Wear 2003, 255, 23–29. [Google Scholar] [CrossRef]
  57. Mediratta, S.R.; Ramaswamy, V.; Singh, V.; Ramarao, P. Dependence of strain hardening exponent on the volume fraction and carbon content of martensite in dual-phase steels during multistage work hardening. J. Mater. Sci. Lett. 1990, 9, 205–206. [Google Scholar] [CrossRef]
Figure 1. The microstructure of AISI 316L.
Lubricants 10 00187 g001
Figure 2. (a) Microstructure of weld deposit B. (b) Interface between the substrate and the weld deposit B.
Lubricants 10 00187 g002
Figure 3. (a) Microstructure of weld deposit C. (b) The interface between the substrate material and weld deposit C.
Lubricants 10 00187 g003
Figure 4. EDX analysis of weld deposits: (a) B and (b) C.
Lubricants 10 00187 g004
Figure 5. (a) Scheme of testing equipment. (b) Detailed view of the testing equipment.
Lubricants 10 00187 g005
Figure 6. Selected geometry parameters of the groove.
Lubricants 10 00187 g006
Figure 7. Microhardness profiles of the weld deposits B and C.
Lubricants 10 00187 g007
Figure 8. (a) the worn surface samples and (b) The surface morphology of Ottawa sand.
Lubricants 10 00187 g008
Figure 9. (a) Dry abrasion wear results for sliding distance vs. volume loss and (b) the coefficient of abrasive wear resistance.
Lubricants 10 00187 g009aLubricants 10 00187 g009b
Figure 10. The worn surface of the steel: (a) surface wear and (b) detailed view of the wear surface.
Lubricants 10 00187 g010
Figure 11. Weld deposit B worn surface: (a) surface wear and (b) detailed view of the wear surface.
Lubricants 10 00187 g011
Figure 12. Weld deposit C worn surface: (a) surface wear and (b) detailed view of the wear surface.
Lubricants 10 00187 g012
Figure 13. AISI 316L steel. (a) Scratch, (b) position along with the scratch, and (c) scratch profile.
Lubricants 10 00187 g013
Figure 14. Weld deposit after scratch test B: (a) the scratch, (b) position along with the scratch, and (c) scratch profile.
Lubricants 10 00187 g014aLubricants 10 00187 g014b
Figure 15. Weld deposit C after the scratch test: (a) scratch, (b) position along with the scratch, and (c) scratch profile.
Lubricants 10 00187 g015
Figure 16. SEM images of the scratch of material A by SEM: (a) left ridge, (b) central area, and (c) right ridge of the scratch.
Lubricants 10 00187 g016
Figure 17. SEM images of the scratches of weld deposit B: (a) left ridge, (b) central area, and (c) right ridge of scratch.
Lubricants 10 00187 g017
Figure 18. Scratches images of the C weld deposit by SEM: (a) left ridge, (b) central area, and (c) right ridge of the scratch.
Lubricants 10 00187 g018
Figure 19. The images end of groove SEM: (a) A, (b) B, and (c) C.
Lubricants 10 00187 g019
Figure 20. Effect of hardness on wear rate coefficient Kabr.
Lubricants 10 00187 g020
Figure 21. Dimensions of grooves in the double-pass scratch test.
Lubricants 10 00187 g021
Figure 22. Worn surface of material (a) B and (b) C.
Lubricants 10 00187 g022
Figure 23. Start of the scratch test for materials (a) B and (b) C.
Lubricants 10 00187 g023
Table 1. Chemical composition (in weight percentage) of the materials used.
MaterialCMnPSSiCrNiMoCu
A0.032.000.450.0301.0016.00–18.0010.00–14.00--
B0.106.500.010.020-18.508.500.100.10
C0.451.60--0.605.50-0.60-
Table 2. EDX analysis of the mass concentration of weld deposit B.
Lubricants 10 00187 i001ElementWt [%]At [%]
Si0.761.48
Cr16.6717.61
Mn5.885.88
Fe69.3468.16
Ni7.356.88
MatrixCorrectionZAF
Table 3. EDX analysis of the mass concentration of weld deposit C.
Lubricants 10 00187 i002ElementWt [%]At [%]
C3.2813.5
Si0.831.47
Mo1.310.68
Cr6.085.79
Mn2.031.83
Fe86.476.71
MatrixCorrectionZAF
Table 4. Parameters of the abrasion wear resistance test.
Test ParameterValue
Rubber wheel speed (RPM)300
Well diameter (mm)229
Load (N)100
Sample dimensions (mm)25 × 75 × 18
Abrasive size of Ottawa sand (mm)0.2–0.315
Sliding distance (m)210, 420, 716
Abrasives flow (g/min)200
Table 5. Analysis of scratch shapes.
SampleWidth Grooves lr (μm)Width between Peaks lp (μm)Zone of Interaction ZOI (μm)Scratch Depth p (μm)
A207.31 ± 0.69310.11 ± 0.64516.13 ± 0.6531.62 ± 0.66
B185.22 ± 0.71294.41 ± 0.70498.21 ± 0.5627.77 ± 0.65
C141.45 ± 0.78171.22 ± 0.56279.33 ± 0.769.31 ± 0.66
Publisher’s Note: MDPI stays neutral with regard to jurisdictional claims in published maps and institutional affiliations.