Abstract
Background: Biomechanical analysis of human mandible is important not only to understand mechanical behavior and structural properties, but also to diagnose and develop treatment options for mandibular disorders. Therefore, the objective of this research was to generate analytical and experimental data on mandibles, construct custom 3D models, and compare the analytically derived maximum strains with strain gage data in five areas of interest for each mandible. Methods: We investigated the surface strains in the cadaveric human mandibles under different configurations of cyclic compressive loads in an experimental setting and compared these experimental strain data with results derived from computational finite element analysis (FEA), accurately replicating the experiments. Strains on the surface of each mandible were measured with strain gauges, and subsequently a subject-specific finite element (FE) volume mesh was generated from computed tomography (CT) scans of each mandible. Strain patterns of each mandible were derived from the FEA simulating the experimental setup and matched with the experimental data. Findings: Analysis of experimental data showed that strain as measured at the condylar locations was significantly different from those at other locations on the mandible, and that the sex and age of the subject did not have a significant correlation with the strain. Comparing the FE numerical predictions with the experimental data, we found a good statistical correlation and statistical agreement between in-vitro measurements and FE results. Interpretation: The study demonstrates that our methodology of generating subject-specific FE models is a valid and accurate, non-invasive method to evaluate the complex biomechanical behavior of human mandibles.
1. Introduction
Biomechanical behavior of the mandible is important in various clinical scenarios to develop treatment options as well as medical devices. Analysis of mandibular biomechanics helps in understanding the interaction between the form and function, as well as the mechanisms of associated disorders. It also aids in improving the design and performance of the prosthetic devices, thus increasing their treatment efficiency [1,2]. Several researchers have attempted to explore the biomechanical behavior of mandible and associated components of masticatory system. Frost [3] investigated Wolff’s concept [4] of the relationship between the biomechanics and morphology of bony tissue and demonstrated the relationship between the amount of strain in a bony microenvironment and the biological reactions [3,5]. Although it is nearly impossible to standardize the real functional and para-functional behavior of the masticatory system in living persons, the biomechanical properties of the human mandible can be determined experimentally using representative models to simulate normal physiological and non-physiological loads. Indirect methods, such as mechanical testing and finite element analysis (FEA), have been widely used for the in-vitro assessment of anatomical structures [6,7].
To be confident in the results of FE models of complex biological structures such as bones, experimental validation is required [1,6,8,9,10]. Knowledge of the biomechanical behavior of mandible gained from experimental studies can be used to validate the analytical/numerical models such as FEA. The validated FE models can be useful in further exploration of the biomechanical aspects of the mandible and masticatory system necessary to improve the treatment modalities, including enhancement of the designs of prosthetic devices by predicting their performance [1,11,12]. For experimental validation of FE bone models, several studies have used strain in the bone measured either with strain gauges [5,7,10,13,14,15,16] or interferometry [8]. The results of these studies confirm the reliability and practicality of using strain gauges for validation purpose. Most of the literature, though, deals with the measurement of surface strains on long bones, such as the femur and tibia, to respond to a clinical question. Fewer numerical and experimental studies are available for the mandible, especially concerning the correlation of experimental and FE results [1,10,17].
We investigated in-vitro biomechanical behavior of the mandible under two different configurations of cyclic compressive loading [18,19,20]. The strain profiles were examined at five different locations (L1, L2, L3, L4, L5) on the cortical surface of mandible (see Figure 1) under these loading conditions through experimental and analytical (FE) methods. Results of experimental and numerical methods were compared to evaluate statistical correlation and statistical agreement between experimental/measured strain data and FE-predicted strains. The following questions were examined:
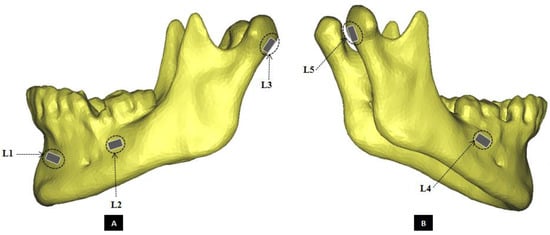
Figure 1.
Schematic of strain gauge attachment at five exactly defined locations on the cortical surface of the mandible. (Panel-A) shows the left lateral view, and (Panel-B) shows the right lateral view of a mandibular 3D model depicting positions of the strain gauges. The strain gauges were named according to their site of attachment as following—L1: fronto-laterally at left mental protuberance, below alveolar process; L2: buccally on left mandibular body, caudal to first and second molars, anterior to oblique line; L3: at the dorsal region of the left condylar process; L4: buccally on right mandibular body, caudal to first and second molars, anterior to oblique line; L5: at the dorsal region of the right condylar process.
- Can a difference be stated in strain magnitudes measured at condylar surface locations (L3, L5) with respect to other locations (L1, L2, L4) of strain acquisition for the experimental strain data of four loading groups?
- Does ‘Age of Patient’ have a significant effect on the magnitude of experimental strain?
- Does ‘Sex of Patient’ have a significant effect on the magnitude of experimental strain?
- What degree of statistical correlation and statistical agreement do experimental/measured strain data have with analytical (FE) strain for mandibles in all loading groups?
2. Materials and Methods
Twelve fresh-frozen human cadaveric mandibles with no visible structural defects or fixation devices were collected from adult human cadavers (seven females, five males, age ranged from 61 to 98 years; see Table 1). All of the cadavers were obtained through the Wright State University Anatomical Gift Program with the necessary consent, protocol, and Wright State University IRB approval. On arrival of the cadavers, the bones were harvested, cleaned of soft tissue, and wrapped in cloth soaked with saline prior to sealing them in a plastic bag and freezing them at −20 °C. Then, 24 h prior to the experiment date, the mandibles were moved from the −20 °C freezer to a 4 °C refrigerator and thawed at room temperature for at least 3 h [16,21]. Once the mandibles were thawed, any remaining soft tissue attached to the bone surface was removed using a scalpel. Prior to testing, computed tomography (CT) scans of all specimens were performed and strain gauges were attached at select locations for future 3D anatomical reconstruction and strain analyses, respectively.

Table 1.
Mandible demography, loading types and groups, and observations made during the cyclic compression testing.
2.1. Image Acquisition
The cleaned mandibles were immersed, one at a time, into a cylindrical water tank, and trans-axial CT scans of entire specimen were obtained using a 16-slice GE Light speed scanner (General Electric Health Care, Milwaukee, WI, USA). The scanning parameters are as follows: 80 kVp, 200 mAs, 512 × 512 matrix and an isotropic voxel size of 0.625 × 0.625 × 0.625 mm3.
2.2. Strain-Gauge Attachment
Uniaxial strain gauges (KFG-1-120-C1-11 L3M3R, Kyowa Electronics, Tokoyo, Japan) were used to measure surface strain. Five strain gauges were attached at five exactly defined locations on the cortical surface of the mandibular bone after the attachment sites were cleaned and degreased using standard protocol (see Figure 1) [13,15,16,22]. The positions of the strain gauges were selected based on the literature [14,17] and the results of our prior FE simulation of a mandible specimen. The attachment sites for strain gauges were defined as following: one strain gauge (L1) placed fronto-laterally at left mental protuberance, below the alveolar process; one buccally on left mandibular body, caudal to first and second molars, anterior to oblique line (L2); another at the dorsal region of the left condylar process (L3); one buccally on right mandibular body, caudal to first and second molars, anterior to oblique line (L4); and another at the dorsal region of the right condylar process (L5), as shown by the schematic in Figure 1. Strain gauges are simple to use, although care must be taken in selection and implementation to minimize error [17,23]. The deformation of the bone surface leads to a corresponding change in the length of the strain gauge wire which is proportional to its electrical resistance [14,22,23]. The parameter used to describe this deformation process is μstrain (μm/m).
Each of the five strain gauges attached the mandible under test was connected through a quarter-bridge wiring configuration of Wheatstone bridge circuit to the instruNet Data Acquisition System (Omega, Stamford, CT, USA), which was linked to a computer to record the data using instruNet World PLUS (iW+) software 2010 (Omega, Stamford, CT, USA). During cyclic loading of each specimen, strain at the gauge attachment sites was continuously measured and recorded throughout the experiment at a sampling rate of 2 Hz. To identify the site of attachment for each strain gauge, images of the specimens were taken with a digital camera from approximately 400 mm before, during, and after mechanical testing. This helped in accurately defining the strain acquisition sites and boundary conditions during the FE simulations.
2.3. Mechanical Testing and Experimental Strain Measurement
Tests were conducted in axial compression mode. The cyclic load was applied at 2 Hz using an EnduraTEC materials testing machine (ElectroForce Systems Group, Bose Corporation, Eden Prairie, MN, USA) that allowed a controlled application of force simulating bite forces. Similar to previous studies by [8,24], custom-designed fixtures were used to set-up the mandible upside down in the machine so that it rested on the two condyles and either molars or incisors as required for a given loading configuration. The mandibles were placed in a reverse position for practical reasons (see Figure 2). Cyclic, axial, compressive loads were then applied to the mandibular angles on both sides of the mandible.
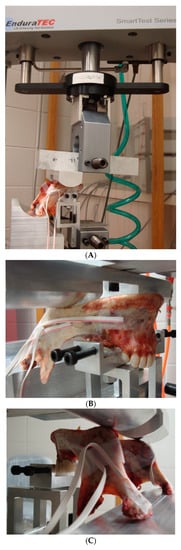
Figure 2.
Loading set-up of EnduraTEC materials testing machine and custom-designed fixture for mandibles (A). Fixture arrangement for molar loading in Group-1 (B) and incisor loading in Group-2 (C) are shown.
Based on their dental status, the mandibles were categorized as edentulous (i.e., without any teeth) and mixed denture (see Table 1). The cadaveric mandibles were divided in two groups to undergo cyclic fatigue loading of four different configurations. Groups 1 and 2 consisted of six mandibles each. The mandibles in Group-1 were loaded bilaterally with support at the molar region (see Figure 2B). During the bilateral-molar-normal (BMN) loading phase, the load varied between 140 N and 200 N for 30,000 cycles. The BMN phase was immediately followed by bilateral molar overloading (BMO) phase during which the load varied between 280 N and 400 N for another 30,000 cycles.
Group-2 specimens underwent bilateral loading through support at the incisor region (see Figure 2C). During the bilateral-incisor-normal (BIN) loading phase, the mandibles underwent load varying between 105 N and 150 N for 30,000 cycles. The BIN phase was immediately followed by a bilateral-incisor-overload (BIO) phase of cyclic compressive load varying between 210 N and 300 N for another 30,000 cycles. The chosen magnitudes of load are reflective of bite forces under functional and parafunctional loading of the mandible, comparable to those previously reported in the literature [25,26,27,28,29,30]. In both loading groups, any specimen without failure during the cyclic testing was subjected to a load-to-failure (LTF) test at the displacement rate of 2 mm/min. A visible fracture of the mandible was regarded as its failure during the mechanical testing. Axial position and load data were collected every 10 s using an axial displacement transducer and an EnduraTEC 2.2 kN axial/torsion bi-axial load cell (Model No. 1215CEW-250), respectively.
During cyclic loading of each specimen, strain at the gauge attachment sites was measured and recorded throughout the experiment at a sampling rate of 2 Hz. Deformation of the bone surface leads to a corresponding change in length of the attached strain gauge wire which is roportional to its electrical resistance [14,22,23]. Change in electrical resistance of the strain gauge, which acts as one arm of Wheatstone bridge, results in the unbalancing of the bridge circuit. The resultant output voltage of Wheatsone bridge circuit is proportional to the magnitude of deformation of the bone surface to which strain gauge is attached, and the voltage is measured by the instruNet data acquisition system. The parameter used to describe this deformation process is μstrain (μm/m). Strain data from all strain gauges attached to one specimen (EH) from loading Group-1 could not be recorded due to an unforeseen problem with the computer system recording strain data. Due to a loss of this experimental data, we did not include FE strain data of this specimen in this study as it could not have been validated against measured strains.
2.4. Subject-Specific FE Model Creation
Subject-specific 3D anatomical reconstruction of each mandible specimen was performed using commercial software Mimics 14.12, 2010 (Materialise, Plymouth, MI, USA) from CT scans. Independent masks were created for the cortical bone, cancellous bone, and teeth using inbuilt threshold values, followed by manual editing and morphological and Boolean operations on the masks (see Figure 3). Surface models of cortical bone, cancellous bone, and teeth were constructed, and the volume bound within each surface was meshed. The volume mesh was generated with ten-node quadratic tetrahedral elements of type C3D10 (see Figure 4 and Figure 5).
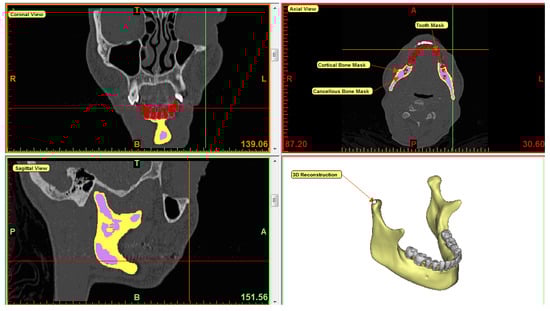
Figure 3.
3D reconstruction of mandible in Mimics software. Mimics enables users to perform segmentation of medical images in three different views—axial, coronal, and sagittal. From CT scan of the mandible, individual masks were created for cortical bone, cancellous bone, and teeth as indicated by yellow, purple, and red color respectively. 3D equivalent of the mandible was reconstructed by combining all masks. After forming 3D volume mesh, material properties were assigned to each component of the mesh based on the masks.
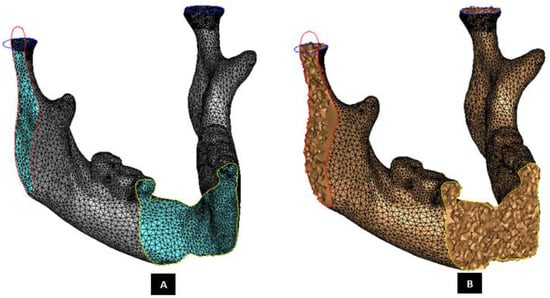
Figure 4.
Subject-specific anatomical reconstruction of the mandible. Figure shows the right-lateral, axial and coronal intersections of the surface model with triangular elements (Panel-A) of a 3D recVisonstructed mandible. The surface mesh was later converted into a 3D finite element volume mesh (Panel-B) with ten-node quadratic tetrahedral elements of type C3D10.
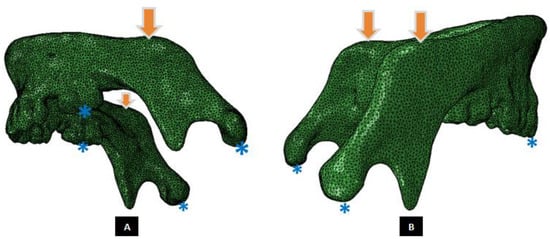
Figure 5.
A Mandibular FE model, and illustration of loading and boundary conditions. (Panel-A) shows schematic of molar loading simulation (Groups 1 and 3), and (Panel-B) depicts incisor loading configuration (Groups 2 and 4). The arrows point at nodes of the region where vertical compressive forces were applied. The asterisks indicate the regions of constrained nodes at the condylar heads during all loading configurations, molars for Group-1 simulations (Panel-A), and incisors for Group-2 simulations (Panel-B).
A convergence study was performed comparing maximum principal strain in three mandibular FE models with different element sizes (maximum element lengths: 1.0 mm, 1.5 mm, 2.0 mm and 2.5 mm). Based on the outcomes of this study, a maximum element size of 2 mm was considered optimal also discussed in [31]. The computational time for the 2 mm element size on a 2.53 GHz processor was 8–10 h, which was about 3 times faster compared to that for the 1 mm element size, and the results were within 3–6% of those from the 1 mm elements.
Homogeneous, elastic, isotropic material properties were assigned to the for cortical component, cancellous component, and teeth of each specimen-specific mandibular FE model using the corresponding masks in Mimics software [6,7,8,32]. This ‘mask method’ allows assigning materials to mesh elements. For each used mask, one material is created. For each element, one of the materials is assigned based on the volume of intersection of that element with each mask. If an element has the same intersection volume with several masks, the first mask in the list is used for assigning a material to that element. The following material properties, which are values that lie within the range of published values for human mandibles, were used in this study: Young’s modulus: 14.7 GPa for cortical bone, 0.49 GPa for cancellous bone, 17.6 GPa for teeth; Poisson’s ratio: 0.3 for cortical and cancellous bone, 0.25 for teeth [8,31,33,34,35]. The mandibular 3D volume mesh was then exported to a commercially available FEA software program, ABAQUS 6.10 2010, (SIMULIA, Providence, RI, USA), to perform FE simulations paralleling our experimental setup and testing.
2.5. Finite Element Analysis
Boundary and loading conditions were carefully applied to the FE models using ABAQUS software to accurately reproduce the conditions used in mechanical tests of the cadaveric mandibles [18]. To simulate the experimental loading conditions, the nodes at tips of condyles of FE model that coincided with the position of the supports in mechanical test were constrained in all of their translational degrees of freedom and free in all their rotational degrees of freedom. Additionally, similar constraints were applied to nodes at the tips of molar region on both sides for models in the molar loading Group-1, and to nodes at tips of the central incisor region for the models in the incisor loading Groups-2 (see Figure 5). Vertical compressive forces were applied to nodes in the region of the mandibular angle on each ramus, which coincided with the position of loading bar in the experimental setup.
The material properties associated to FE model were assumed to be homogeneous, isotropic, and with linear elastic behavior, in accordance with other studies [6,7,8,17,32,33,34,35,36,37,38,39,40,41]. Load data similar to that of mechanical testing were used to perform FE simulations. Linear static FE analysis was performed. The maximum principal strain at the nodes of FE models that matched the position of strain gauges on the surface of the mandible was recorded. Three runs/repetitions of FE simulation of each specimen were performed. These repetitions were carried out to account for any user-induced error due to variations such as deviations in accurately selecting the exact nodes for applying load and boundary conditions on the FE model. The FE-predicted strain data reported in Table 1 represents the average of three simulations performed for each FE model. Figure 6 shows the visualization of FE strain profile for one of the specimens.
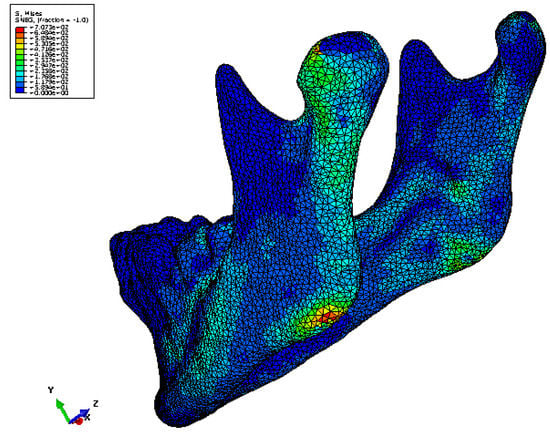
Figure 6.
Maximum principal strain distribution in one of the mandible FE models. Strains of higher magnitude are seen in the condylar region and the region of load application compared to rest of the model [18].
3. Result
3.1. Data Analysis
The measured strain data and the FE-predicted maximum principal strain data were reduced to acquire a reading every tenth second for each of the five selected locations on the mandible. The mean and standard deviation were calculated for experimental and FE strain values for each location, and this information was used for statistical analyses. Figure 7 and Figure 8 show the measured/experimental strains and FE-predicted maximum principal strains for the mandibles in loading Groups 1 and 2, respectively, plotted against the measurement locations on the surface of the specimen. As seen from these plots, the strains at the condylar locations (L3 and L5) are higher than those measured at other locations on the same mandible. Moreover, the plots illustrate that the FE-predicted strains closely follow the profiles of experimental strains measured at the corresponding locations on the same mandible surface.
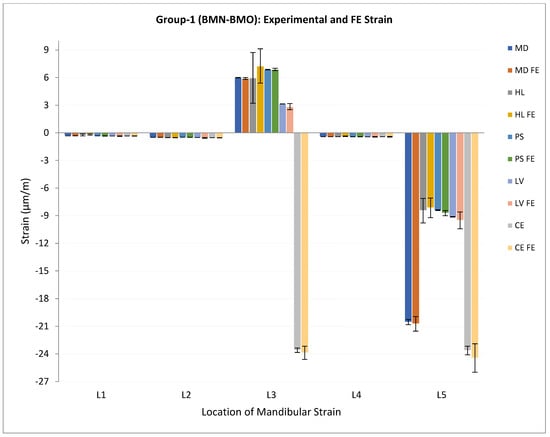
Figure 7.
Plot of experimental/measured strain and FE predicted maximum principal strain (μm/m) (average ± standard deviation) for mandibles in loading Group-1. Note 1—Read legend as: XX = experimental strain for the specimen XX, XX FE = FE predicted strain for the specimen XX. E.g., MD = experimental strain for the specimen MD, MD FE = FE predicted strain for the specimen MD. Note 2—Data for one specimen (EH) from this group are not included due to loss of information during experimental strain acquisition.
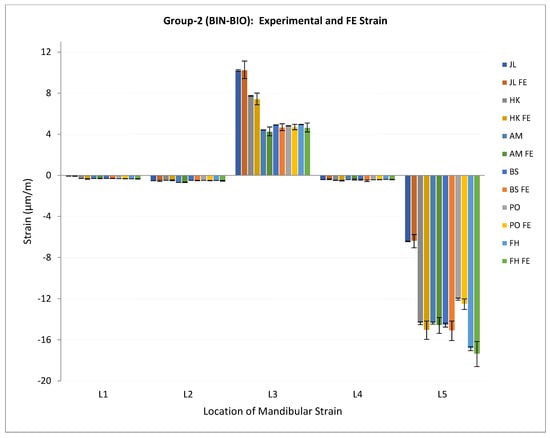
Figure 8.
Plot of experimental/measured strain and FE predicted maximum principal strain (μm/m) (average ± standard deviation) for mandibles in loading Group-2. Note—Read legend as: XX = experimental strain for the specimen XX, XX FE = FE predicted strain for the specimen XX. E.g., JL = experimental strain for the specimen JL, JL FE = FE predicted strain for the specimen JL.
Groups 3 and 4 consisted of spectrum load blocks. In Group-3, the mandibles were loaded bilaterally at the molar region. This bilateral molar-spectrum (BMS) loading configuration consisted of a cyclic, axial, compressive load varying between 50 N and the upper limit for a given load block for 3000 cycles in each block. The BMS configuration included 20 load blocks with the upper limit of 100 N for the first block and 1050 N for the last block. The upper load limit for each block exceeded that of the previous block by 50 N. Mandibles in Group-4 were loaded bilaterally at the incisor region. This bilateral incisor-spectrum (BIS) loading configuration consisted of a cyclic, axial, compressive load varying between 50 N and the upper limit for a given load block for 3000 cycles in each block. Similar to the Group-3 loading configuration, the BIS configuration of Group-4 included 20 load blocks with 42 the upper limit of 100 N for the first block and 1050 N for the last block. The upper load limit for each block exceeded that of the previous block by 50 N.
According to Markert [36], when comparing measurements of the same parameter (e.g., strain) by two different methods (e.g., mechanical testing and FEA), to analyze the correspondence between the data from two methods more reliably, it is necessary to evaluate the statistical correlation as well as the statistical agreement between the two data sets. During statistical analysis, we used Wilcoxon signed ranks test (to check distribution of strain at condylar locations and other sites), Spearman’s correlation test (for effect of age on experimental strain), t-Test (for effect of sex), Pearson’s correlation test (for correlation between experimental and FE strain), and intra-class correlation test (for statistical ‘agreement’ between experimental and FE strain).
3.2. Statistical Findings
Table 1 summarizes the demographics and observations for mandibles in both loading groups. The experimental strains measured at the condylar locations (L3, L5) were compared with those measured by the strain gauges attached to the mandible surface at other locations (L1, L2, L4). Due to the small sample size, the Wilcoxon signed rank [41] test (1945) was used (JMP Inc., Cary, NC, USA) to evaluate the distribution of experimental strains measured at different locations. The distribution of strains measured at each of the condylar locations (L3, L5) was found to be significantly different from the strains measured at each of the other three locations (L1, L2, L4) on the mandible bone surface (p ≥ 0.001 at α = 0.001) (see Table 2). Per Spearman’s correlation test, no significant correlation was found between the age of patient and experimental strain measured at five locations (p > 0.05 for α = 0.05), with the exception of location L3 (p = 0.042 for α = 0.05). The t-test statistics showed no significant correlation between sex of patient and experimental strain as measured at five locations (p > 0.05 for α = 0.05) (see Table 3).
Table 2.
Statistical analyses using Wilcoxon Signed Ranks Test For α = 0.001, strains measured at the condylar locations (L3, L5) were significantly different than (L1, L2, L4).
Table 3.
Statistical analyses using Spearman’s Correlation Test, t-test (to evaluate effect of sex on experimental strain), Pearson’s Correlation Test (to evaluate statistical correlation between experimental strain and FE strain, and Intra-class Correlation Test (to analyze ‘statistical agreement’ between experimental strain and FE strain).
Pearson’s correlation test was used to analyze the concordance between experimental and FEA strain. A strong correlation was found between the measured and FE strain data for locations L1, L2, L3, and L5 (0.964 < R2 < 0.999), with a narrow confidence interval (see Table 3). Location L4 showed a moderate correlation (R2 = 0.569) between the experimental and FEA results with a wider confidence interval (0.08 to 0.837). We used the ‘intraclass correlation test’ to analyze statistical agreement between experimental and FEA strain. Strong agreement was found between the experimental and FE strain data for locations L1, L2, L3, and L5 (0.936 < intraclass correlation coefficient < 0.999) with a narrow confidence interval (see Table 3). However, a moderate statistical agreement (intraclass correlation coefficient = 0.659) with wide confidence interval (CI = −0.17 to 0.885) was found between the experimental and FE strain values for location L4. Overall, FE and mean experimental strains showed close correspondence for all load configurations and measurement locations. Apart from some local deviations at location L4, FE and mean measured strain corresponded well for all load cases and for all strain gauges.
4. Discussion
It is important to note that the experimental strains recorded in our study are from in-vitro rather than in-vivo loading of cadaveric specimens. The key advantage of in-vitro loading is that, although it does not replicate behavioral loads, the experimental loading and constraints can be easily characterized, controlled, and further reproduced during FEA [7]. The patient-specific computerized anatomical and FE models can be used to estimate non-measurable loads, strains and stresses to understand the underlying mechanisms of the diseases [1,11,12]. However, experimental or clinical validation of theoretical predictions of FEA should be performed to be confident in the numerical results.
Strain distribution in the mandible is extremely complex in nature, and knowledge of it has an important impact in different clinical situations. From a biological view, strains determine the functional behavior of bone cells to a great extent [3,5]. Knowledge of a strain may permit assessment of the regenerative capacity of bone, and stress evaluation in different anatomical positions can be used to investigate potential fracture sites under artificial loading [5]. The combined assessment of strains and stresses can be helpful in improving the designs of fracture fixation and joint replacement devices for mandible and the temporomandibular joint (TMJ). Our study suggests that the validated FE models and analyses provide a reliable approach to evaluate the in-vitro biomechanical behavior of the mandible.
Most studies found in the literature concerning experimental validation of FE models of bone report comparisons of measured and analytical data in terms of statistical correlation [5,8,14,16,17]. However, as suggested by Markert [36], to be more statistically confident in the correspondence of experimental data and FE predictions, we evaluated statistical correlation and statistical agreement between strain data obtained from the two methods. In our study, FE results in terms of strain magnitude accorded well with experimental data. A moderate to strong statistical correlation and agreement between the experimental and FE predicted strain data was achieved in this study, establishing confidence in the validity of the computed results.
Our methodology in this study slightly differs from the comparable published studies. Gröning et al. [8] compared strain profiles in cadaveric mandible using digital speckle pattern interferometry and FEA. FE models of the mandible can correctly reproduce experimental strains under different loading configurations [17]. Experimental validation of FEA can provide precise insight into the complex mechanical behavior of mandibles affected by mechanical loading which is difficult to assess otherwise [5]. While [33] obtained the equivalent strains, [17] assessed maximal and minimal strains, and we evaluated the maximal principal strain through FEA. Even then, the behavior of the strains reported in these studies is qualitatively in conformance with that obtained in our study. The magnitudes of strain differ due to the use of muscle forces as opposed to forces applied at the mandibular angle in our loading cases. In our study, significantly different strain magnitudes were generated at the condylar locations (L3, L5) compared to other locations on the mandible. These findings coincide with the results of experimental and numerical investigations described in [37,38], [5], who reported significant changes in stress distribution and magnitude near condyles.
We used fresh-frozen cadaveric mandibles for our experiments whereas some other studies employed either dry cadaveric mandibles [8] or synthetic mandibles [17]. We performed relatively more accurate 3D anatomical reconstruction and more refined FE mesh compared to some models in [5,8]. These aspects of our study methodology provide closer approximation to the actual size, shape and biological behavior of the living human mandible. Overall, when the experimental and FEA strain results are compared, a very good statistical correlation and statistical agreement is found. This high degree of correspondence is notable, since homogeneous and isotropic elastic properties were assumed in FE models of the mandibles, although the elastic properties of fresh and dry human mandibles are reported to be heterogeneous and orthotropic [8,35]. Similar to other reports in literature [6,7,8,32] the results of our study indicate that homogeneous and isotropic elastic properties are sufficient, at least in our experimental setup, to accurately predict the strain magnitudes.
Different approaches have been used by researchers to assign the material properties to FE models of the bone reconstructed from patient’s medical images. Varghese et al. [17] adopted consistent bone-material properties based on a parameter optimization study. They held constant the Young’s modulus value of the cortex volume between periosteal and endocortical boundaries, and used an inhomogeneous isotropic material model for the trabecular volume of the FE models of long bones. An optimized Poisson’s ratio was adopted for both cortical and trabecular bone. A mask representing the endosteal region of the bone model was eroded twice to obtain material information without influence of partial-volume effect for the trabecular region near the endosteal boundary. The authors dilated the grayscale twice to re-grow the volume to original size, which replicated the grayscale values of the eroded periphery to the re-grown region as previously described in [39]. The resultant volume contained partial-volume corrected density values along the endosteal boundary. The density values were assigned using a method previously published by Hangartner [40]. Reconstructed mandibular anatomy from CT data of a human mandible and FE volume mesh were presented in [8]. They assigned the same set of material properties to the entire bone and teeth components of the FE mesh by defining the Young’s modulus and Poisson’s ratio. We performed anatomical reconstruction of the cadaveric mandibles from their CT scans. Though the present study used a different approach to [16] and [8] to assign material properties to the FE models, the close correspondence between FE results and experimental data in all these studies calls for a study exploring the comparative accuracy and efficiency of these approaches using same set of FE models.
A limitation of our study is the inability to experimentally measure strains at locations within the specimen because strain gauges can measure only the surface strain. Hence, our biomechanical assessment of the mandible has been limited to surface deformations, and neither stresses nor dislocations in the specimen can be measured. However, the accuracy of FEA describing the biomechanical behavior of bony specimens has been shown by different authors [2,5,7,15,16,38]. Given the high degree of congruence between the experimental and numerical results of this study, various data within the specimen can be visualized using the FE calculations [23].
The magnitudes of measured strain show that the locations of strain gauges selected in this study were not at the regions where fracture occurred. Although a better estimation of gauge locations can be obtained through FE simulations prior to the design of experiments, the topography of mandibular surfaces often presents hurdles in attaching a strain gauge at every/any location of choice. This leaves us with limited choices of locations for experimental measurement of strain. However, a validated FE method provides an alternate solution to this limitation.
5. Conclusions
In summary, this paper presented biomechanical evaluation of custom mandibles, 3D models from CT scans, FE models, as well as experimental results from four groups of testing. Mandibular mechanics, such as dynamic stiffness and local stress–strain behavior, were analytically validated with experimental testing, constituting a major contribution. Our combined numerical–experimental study demonstrated that mandibular FE models accurately replicate the geometry and material properties, and constraints can predict strain profiles in strong correspondence with the experimental results. Such validated FE models which adequately reproduce mechanical behavior of mandible can be used further to study the TMJ, and to design and pre-clinically evaluate implants for the mandible and TMJ.
Author Contributions
Conceptualization T.G.; Methodologies S.M.I.; Software S.M.I.; Validation T.G., S.M.I.; Formal analysis, S.M.I.; Investigation T.G., D.G.K.; Resources T.G.; Data Curation S.M.I.; Writing S.M.I.; Writing review and editing, Visualization T.G.; Supervision, T.G., D.G.K.; Project Administration T.G.; Funding Acquisition T.G. All authors have read and agreed to the published version of the manuscript.
Funding
No funding was used for this paper.
Institutional Review Board Statement
Not applicable.
Informed Consent Statement
Not applicable.
Data Availability Statement
Not applicable.
Acknowledgments
We thank Ronald Markert, School of Medicine, Wright State University, for consultation regarding statistical aspects of this study; and R. Michael Johnson, Department of Plastic Surgery, Wright State University, for his assistance in harvesting the cadaveric specimens.
Conflicts of Interest
The authors declare no conflict of interest.
References
- Ingawalé, S.; Goswami, T. Temporomandibular joint: Disorders, treatments, and biomechanics. Ann. Biomed. Eng. 2009, 37, 976–996. [Google Scholar] [CrossRef] [PubMed]
- Korioth, T.W.P.; Versluis, A. Modeling the mechanical behavior of the jaws and their related structures by finite element (FE) analysis. Crit. Rev. Oral Biol. Med. 1997, 8, 90–104. [Google Scholar] [CrossRef] [PubMed] [Green Version]
- Frost, H.M. Skeletal structural adaptations to mechanical usage (SATMU): 2. Redefining Wolff’s Law: The remodeling problem. Anat. Rec. 1990, 226, 414–422. [Google Scholar] [CrossRef] [PubMed]
- Wolff, J. The Law of Bone Remodeling; Springer: Berlin/Heidelberg, Germany, 1986; (Translation of the German 1892 edition). [Google Scholar]
- Vollmer, D.; Meyer, U.; Joos, U.; Vegh, A.; Piffko, J. Experimental and finite element study of a human mandible. J. Cranio-Maxillofac. Surg. 2000, 28, 91–96. [Google Scholar] [CrossRef]
- Kupczik, K.; Dobson, C.A.; Fagan, M.J.; Crompton, R.H.; Oxnard, C.E.; O’Higgins, P. Assessing mechanical function of the zygomatic region in macaques: Validation and sensitivity testing of finite element models. J. Anat. 2007, 210, 41–53. [Google Scholar] [CrossRef]
- Rayfield, E.J. Strain in the ostrich mandible during simulated pecking and validation of specimen-specific finite element models. J. Anat. 2011, 218, 47–58. [Google Scholar] [CrossRef]
- Groning, F.; Liu, J.; Fagan, M.J.; O’Higgins, P. Validating a voxel-based finite element model of a human mandible using digital speckle pattern interferometry. J. Biomech. 2009, 42, 1224–1229. [Google Scholar] [CrossRef]
- Ingawalé, S.M.; Goswami, T. Biomechanics of the Temporomandibular Joint; InTech Publication: Rijeka, Croatia, 2012; pp. 159–182. [Google Scholar]
- Santis, R.; Mollica, F.; Esposito, R.; Ambrosio, L.; Nicolais, L. An experimental and theoretical composite model of the human mandible. J. Mater.Sci. Mater. Med. 2005, 16, 1191–1197. [Google Scholar] [CrossRef]
- Detamore, M.S.; Athanasiou, K.A.; Mao, J. A call to action for bioengineers and dental professionals: Directives for the future of TMJ bioengineering. Ann. Biomed. Eng. 2007, 35, 1301–1311. [Google Scholar] [CrossRef] [Green Version]
- Singh, M.; Detamore, M.S. Biomechanical properties of the mandibular condylar cartilage and their relevance to the TMJ disc. J. Biomech. 2009, 42, 405–417. [Google Scholar] [CrossRef]
- Bessho, M.; Ohnishi, I.; Matsuyama, J.; Matsumoto, T.; Imai, K.; Nakamura, K. Prediction of strength and strain of the proximal femur by a CT-based finite element method. J. Biomech. 2007, 40, 1745–1753. [Google Scholar] [CrossRef] [PubMed]
- DuChesne, A.; Unnewehr, M.; Schmidt, P.F.; Sotonyi, P.; Brinkmann, B.; Piffko, J.; Fischer, G.; Bajanowski, T. Deformation characteristics of the human mandible in low impact experiments. Int. J. Leg. Med. 2003, 117, 257–262. [Google Scholar] [CrossRef] [PubMed]
- Taddei, F.; Cristofolini, L.; Martelli, S.; Gill, H.S.; Viceconti, M. Subject-specific finite element models of long bones: An in vitro evaluation of the overall accuracy. J. Biomech. 2006, 39, 2457–2467. [Google Scholar] [CrossRef]
- Varghese, B.; Short, D.; Penmetsa, R.; Goswami, T.; Hangartner, T. Computed-tomography-based finite-element models of long bones can accurately capture strain response to bending and torsion. J. Biomech. 2011, 44, 1374–1379. [Google Scholar] [CrossRef] [PubMed] [Green Version]
- Ramos, A.; Ballu, A.; Mesnard, M.; Talaia, P.; Simões, J.A. Numerical and Experimental Models of the Mandible. Exp. Mech. 2011, 51, 1053–1059. [Google Scholar] [CrossRef]
- Ingawalé, S.M. Mandibular Bone Mechanics and Evaluation of Temporomandibular Joint Devices. Ph.D. Dissertation, Wright State University, Dayton, OH, USA, 2012. [Google Scholar]
- Ingawalé, S.M.; Johnson, R.M.; Goswami, T. Biomechanical Evaluation of the Cadaver Mandible under Cyclic Compressive Loads. Ital. J. Maxillo-Facial Surg. 2014, 25, 55–63. [Google Scholar]
- Ingawale, S.M.; Goswami, T. Design and Finite Element Analysis of Patient-Specific Total Temporomandibular Joint Implants. Materials 2022, 15, 4342. [Google Scholar] [CrossRef]
- Evans, F.J. Mechanical Properties of Bone; Charles C Thomas Publisher: Springfield, IL, USA, 1973; p. 322. [Google Scholar]
- Cordey, J.; Gautier, E. Strain gauges used in the mechanical testing of bones Part I: Theoretical and technical aspects. Injury 1999, 30, S-A7–S-A13. [Google Scholar] [CrossRef]
- Cordey, J.; Gautier, E. Strain gauges used in the mechanical testing of bones Part II: “In vitro” and “in vivo”. Injury 1999, 30, S-A14–S-A20. [Google Scholar] [CrossRef]
- Schupp, W.; Arzdorf, M.; Linke, B.; Gutwald, R. Biomechanical testing of different osteosynthesis systems for segmental resection of the mandible. J. Oral Maxillofac. Surg. 2007, 65, 924–930. [Google Scholar] [CrossRef]
- Ahlberg, J.P.; Kovero, O.A.; Hurmerinta, K.A.; Zepa, I.; Nissinen, M.J.; Könönen, M.H. Maximal bite force and its association with signs and symptoms of TMD, occlusion, and body mass index in a cohort of young adults. CRANIO® 2003, 21, 248–252. [Google Scholar] [CrossRef] [PubMed]
- Bakke, M. Bite Force and Occlusion. In Seminars in Orthodontics; WB Saunders: Philadelphia, PA, USA, 2006; Volume 12, pp. 120–126. [Google Scholar]
- Bakke, M.; Zak, M.; Jensen, B.L.; Pedersen, F.K.; Kreiborg, S. Orofacial pain, jaw function, and temporomandibular disorders in women with a history of juvenile chronic arthritis or persistent juvenile chronic arthritis. Oral Surg. Oral Med. Oral Pathol. Oral Radiol. Endodontol. 2001, 92, 406–414. [Google Scholar] [CrossRef] [PubMed]
- Bonjardim, L.R.; Gaviao, M.B.D.; Pereira, L.J.; CAastelo, P.M. Bite force determination in adolescents with and without temporomandibular dysfunction. J. Oral Rehabil. 2005, 32, 577–583. [Google Scholar] [CrossRef]
- Pereira, L.J.; Pastore, M.G.; Bonjardim, L.R.; Castelo, P.M.; Gaviao, M.B.D. Molar bite force and its correlation with signs of temporomandibular dysfunction in mixed and permanent dentition. J. Oral Rehabil. 2007, 34, 759–766. [Google Scholar] [CrossRef] [PubMed]
- Sinn, D.P.; de Assis, E.A.; Throckmorton, G.S. Mandibular excursions and maximum bite forces in patients with temporomandibular joint disorders. J. Oral Maxillofac. Surg. 1996, 54, 671–679. [Google Scholar] [CrossRef]
- Mudunuru, M.K.; Nakshatrala, K.B. A framework for coupled deformation–diffusion analysis with application to degradation/healing. Int. J. Numer. Methods Eng. 2012, 89, 1144–1170. [Google Scholar] [CrossRef] [Green Version]
- Strait, D.S.; Wang, Q.; Dechow, P.C.; Ross, C.F.; Richmond, B.G.; Spencer, M.A.; Patel, B.A. Modeling elastic properties in finite-element analysis: How much precision is needed to produce an accurate model? Anat. Rec. Part A Discov. Mol. Cell. Evol. Biol. Off. Publ. Am. Assoc. Anatomist. 2005, 283A, 275–287. [Google Scholar] [CrossRef]
- Ichim, I.; Swain, M.; Kieser, J.A. Mandibular biomechanics and development of the human chin. J. Dent. Res. 2006, 85, 638–642. [Google Scholar] [CrossRef]
- Reina, J.M.; Garcia-Aznar, J.M.; Dominguez, J.; Doblare, M. Numerical estimation of bone density and elastic constants distribution in a human mandible. J. Biomech. 2007, 40, 828–836. [Google Scholar] [CrossRef]
- Schwartz-Dabney, C.L.; Dechow, P.C. Variations in cortical material properties throughout the human dentate mandible. Am. J. Phys. Anthropol. Am. J. Phys. Anthropol. Off. Publ. Am. Assoc. Phys. Anthropol. 2003, 120, 252–277. [Google Scholar] [CrossRef]
- Markert, R.J. Enhancing Medical Education by Improving Statistical Methodology in Journal Articles. Teach. Learn. Med. 2013, 25, 159–164. [Google Scholar] [CrossRef] [PubMed]
- Hylander, W.L. Stress and strain in the mandibular symphysis of primates: A test of competing hypotheses. Am. J. Phys. Anthropol. 1984, 64, 1–46. [Google Scholar] [CrossRef]
- Hart, R.T.; Hennebel, V.V.; Thongpreda, N.; Van Buskirk, W.C.; Anderson, R.C. Modeling the biomechanics of the mandible: A three-dimensional finite element study. J. Biomech. 1992, 25, 261–286. [Google Scholar] [CrossRef]
- Wu, Q.; Merchant, F.; Castleman, K.R. Microscope Image Processing; Elsevier Academic Press: Burlington, NJ, USA, 2008. [Google Scholar]
- Hangartner, T.N. The OsteoQuant: An isotope-based CT scanner for precise measurement of bone density. J. Comput. Assist. Tomogr. 1993, 17, 798–805. [Google Scholar] [CrossRef] [PubMed]
- Wilcoxon, F. Individual comparisons by ranking methods. In Breakthroughs in Statistics; Springer: New York, NY, USA, 1992; pp. 196–202. [Google Scholar]
Publisher’s Note: MDPI stays neutral with regard to jurisdictional claims in published maps and institutional affiliations. |
© 2022 by the authors. Licensee MDPI, Basel, Switzerland. This article is an open access article distributed under the terms and conditions of the Creative Commons Attribution (CC BY) license (https://creativecommons.org/licenses/by/4.0/).