Article

Unbalance Response Analysis of a Spindle Supported on Gas Bearings: A Comparison between Different Approaches

Department of Mechanical and Aerospace Engineering, Politecnico di Torino, 10129 Turin, Italy
*
Author to whom correspondence should be addressed.
Lubricants 2022, 10(6), 127; https://doi.org/10.3390/lubricants10060127
Submission received: 29 April 2022 / Revised: 10 June 2022 / Accepted: 13 June 2022 / Published: 17 June 2022
(This article belongs to the Special Issue Tribology in Manufacturing and Design)

Abstract

:
Gas journal bearings are widely employed in high-speed spindles for the micromachining industry. Compared to their oil and rolling counterparts, gas bearings have a longer life span, lower friction and a lower level of noise. In order to design accurate high-speed spindles supported by externally pressurized gas bearings, it is vital to analyze the characteristics of rotor bearing systems. In this paper, we present an analysis of the unbalance response of a high-speed spindle supported by gas journal bearings. A number of aspects to enhance the accuracy of the system are discussed. We performed the analysis by considering a nonlinear and a linearized numerical model validated through experimental measurements.

1. Introduction

The miniaturization of information technology devices such as digital cameras, personal computers and mobile phones has rapidly progressed. The production of these devices has increased the demand for machine tools that produce precision small parts using end mill cutters with diameters of less than 1 mm. This kind of manufacturing process requires spindles with high accuracy and fast rotational speed. Due to their low friction, low vibration transmissibility and long life, gas journal bearings represent the best type of bearings that can be used in such ultra-precision machining tools. In contrast with ball or roller bearings, gas bearings are characterized by a long life span and are free of the high super-synchronous vibrations that compromise precision and lead to high power consumption.
However, gas bearings are not readily available, and each one requires a dedicated design process depending on its particular application. In order to design an accurate high-speed spindle supported by externally pressurized gas bearings, it is vital to analyze the characteristics of rotor bearing systems. This involves the analysis of the static characteristics, making it possible to define a preliminary geometry of the bearing according to the required load capacity and flow rate. Assessment of the dynamic behavior, i.e., dynamic coefficients and stability, is also crucial to guarantee a successful application. An appropriate choice of bearing feeding system is an appropriate starting point. Chen C.-H. et al. [1] elucidated the coupled effects of pressure compensation that is caused by orifice and inherent restrictors in series on the static and dynamic characteristics of a rigid rotor that is supported by orifice-restricted aerostatic bearings. The results of their simulations revealed that the effects of orifice and inherent restrictors in series on bearing performance cannot be ignored in the design of aerostatic bearings. Yoshimoto et al. [2] used both CFD and FEM methods to arrive at the same conclusion and demonstrated the absence of a clear boundary between inherently compensated and orifice restrictors. Otsu et al. [3,4] experimented with the use of surface-restricted layers and compound restrictors. They found that surface-restricted layers generally had the effect of increasing the dynamic performance of porous journal bearings. Similarly, aerostatic journal bearings with compound restrictors showed higher stiffness and threshold speeds than those obtained with inherently compensated restrictors. Moreover, they showed that the threshold of instability is largely affected by inertia effects when the whirl ratio is greater than two. Park and Kim [5] and Belforte et al. [6,7] proposed new types of feeding systems that could increase the rotor bearing system performance. The integration of external dampers, e.g., O-rings [8,9], air rings [10,11] and bump foil [12,13], makes it possible to increase the dynamic stability of rotor bearing systems. In this regard, Liebich et al. [14] presented a comprehensive analysis on the use of elastomeric rings by proposing a new approach to optimize their material properties. The dynamic performance and stability of journal bearings can be evaluated through nonlinear rotor bearing models, i.e., the orbit method, or models that are obtained by the linearization of the stiffness and damping coefficients of the bearings [8]. The orbit method includes the complete nonlinear equations of the rotor and the bearings, which are numerically integrated to obtain the shaft center orbits corresponding to any set of geometrical, running and initial conditions. This method can be used to calculate the unbalance response, the onset speed and the nonlinear rotor bearing behavior in cases of relatively large displacements. Belforte et al. [15,16,17] and Liu et al. [18] successfully applied this method in the case of rotors supported by self-acting and floating bearings. Despite their accuracy, nonlinear models can still be time consuming. On the contrary, linearized models are obtained by solving the dynamic Reynolds equations based on the assumption of the small perturbation proposed by Lund [19]. Here, the eight linear stiffness and damping coefficients are obtained to study the stability of the rotor bearing system [20]. Waumans et al. [21] accurately described how to perform this kind of analysis applied to a micro-turbine rotor supported on air bearings by studying its imbalance response and stability.
In this paper, we present the analysis of the unbalance response of a high-speed spindle supported by journal gas bearings. Firstly, we used the nonlinear model of the rotor bearing system that was previously validated in [22] to evaluate the unbalance response. We used these results to quantify the discrepancies with respect to the results obtained through the linearized model. Finally, we employed the linearized model to investigate a number of solutions to improve the spindle accuracy, i.e., to reduce the dynamic runout. We then compared the numerical results with experimental results obtained through cost-down measurements.

2. Materials and Methods

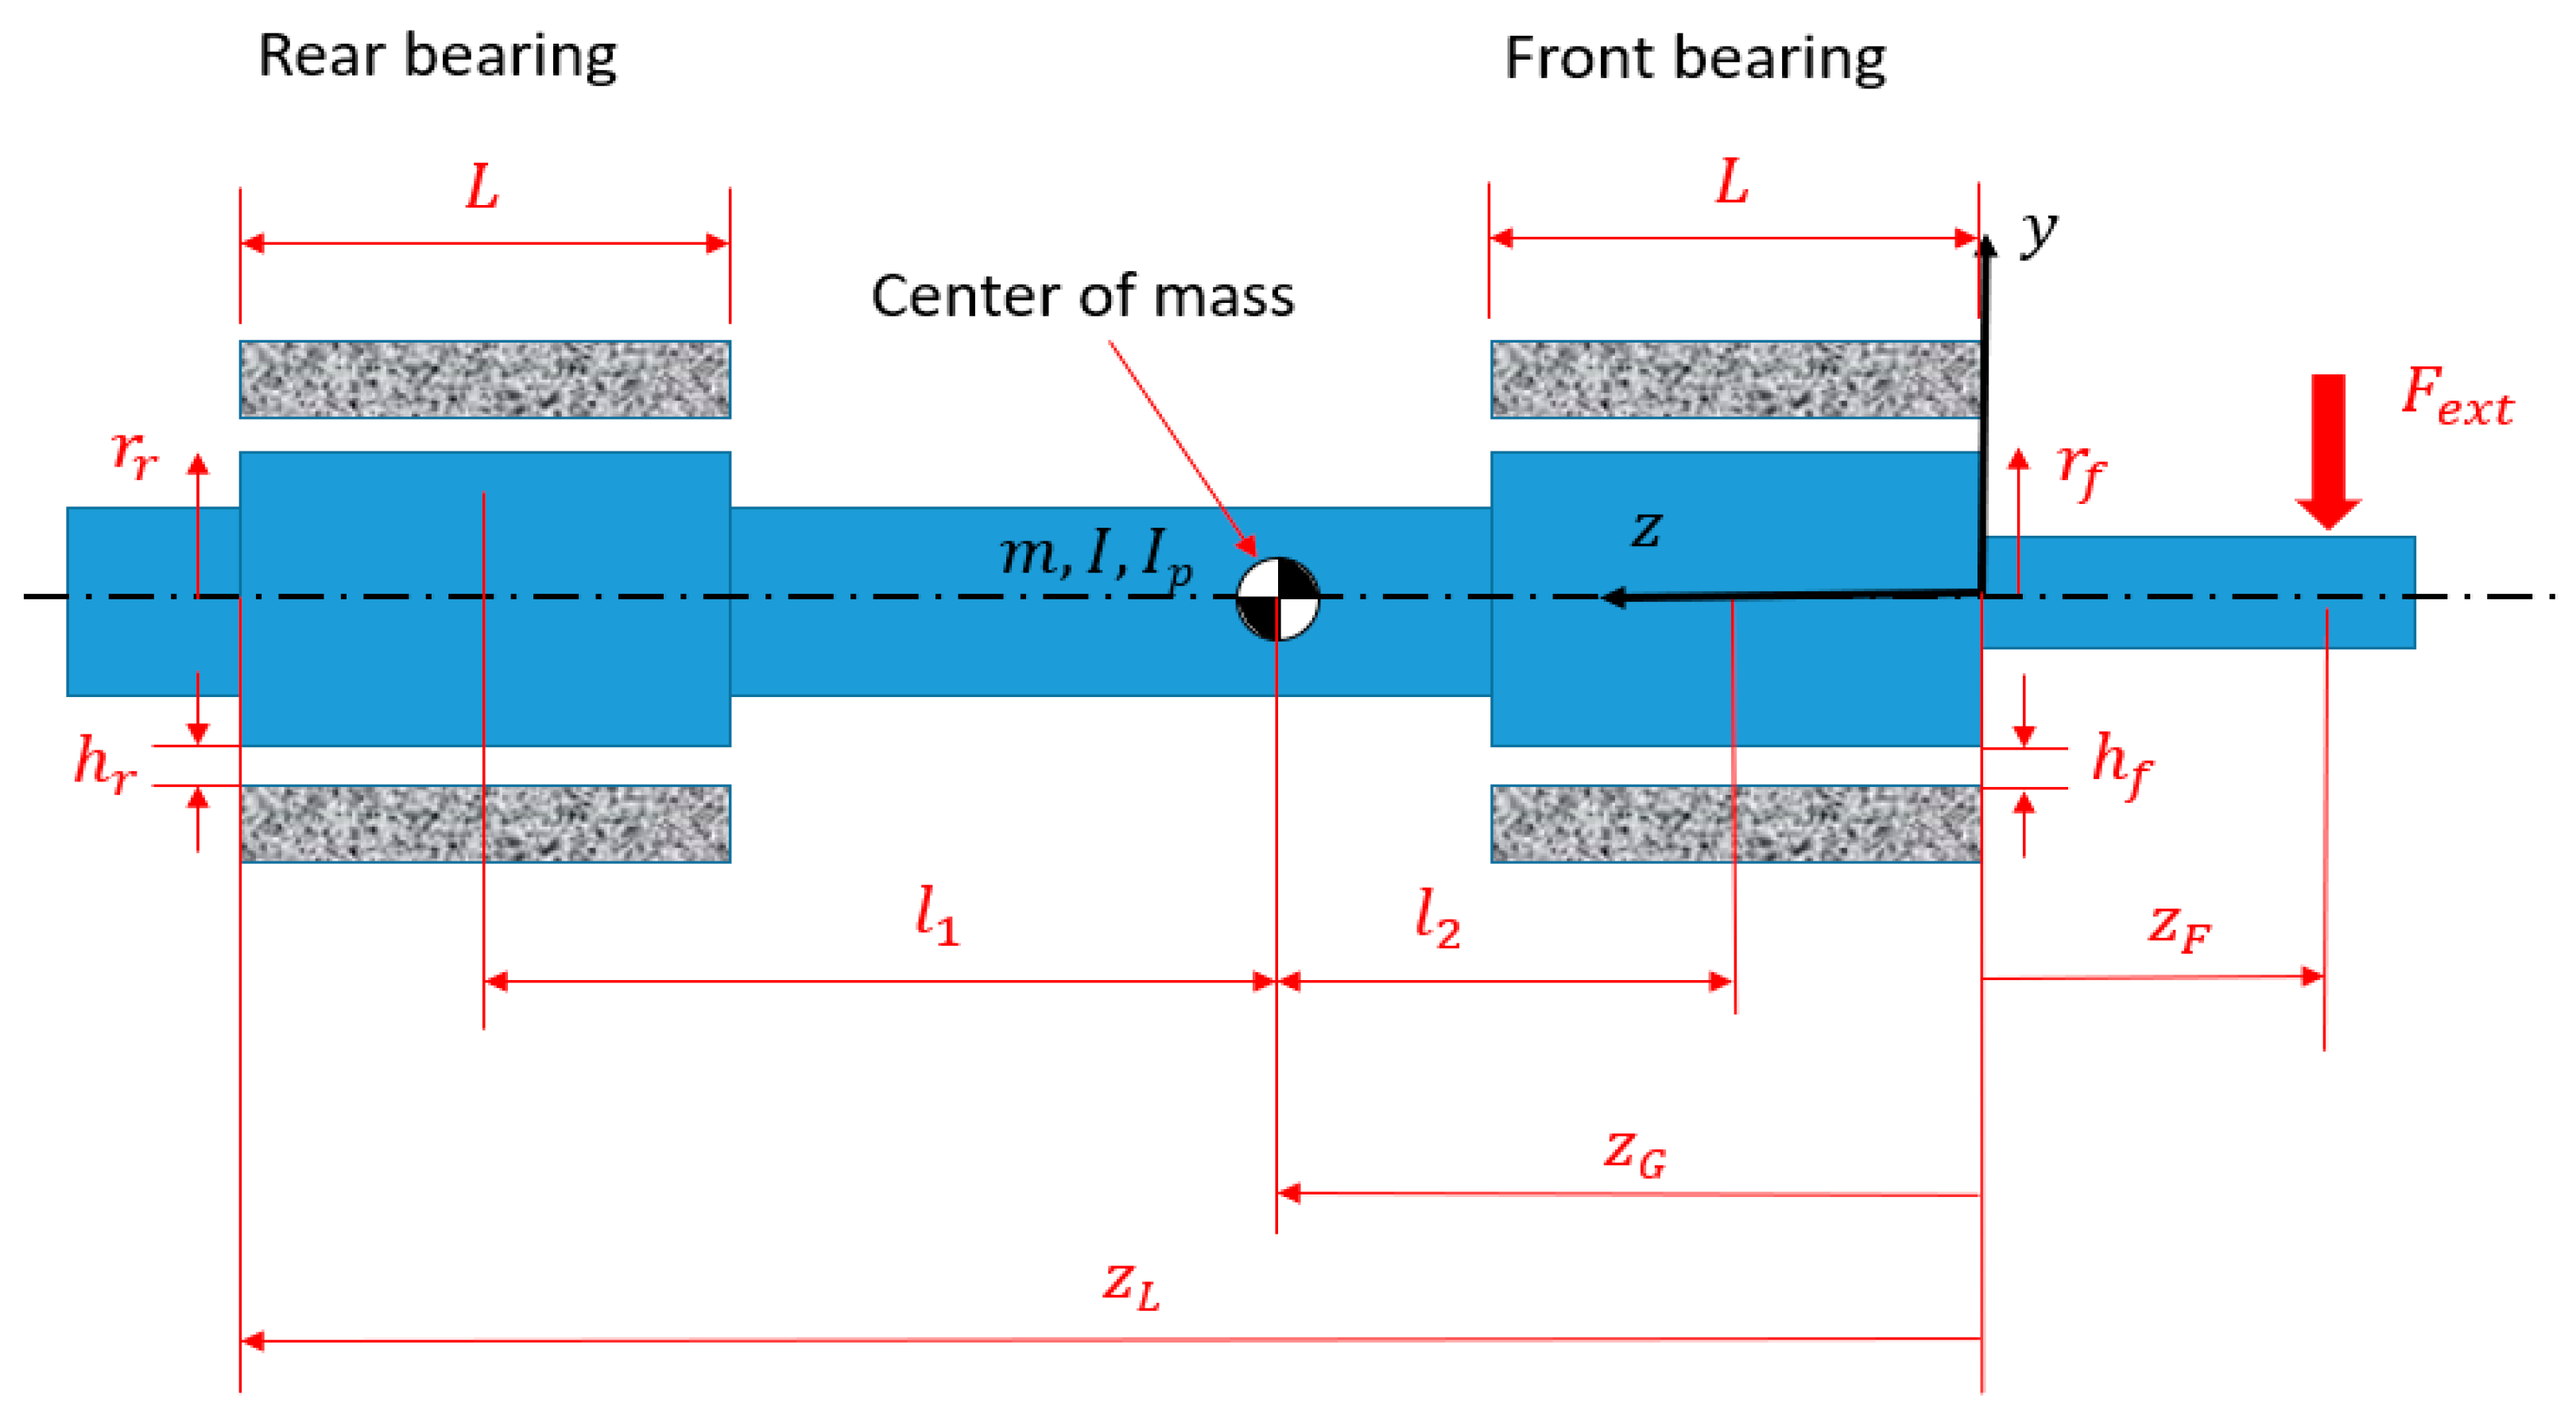
The prototype of an electro-spindle supported by hybrid gas journal bearings is illustrated here, see Figure 1. It is designed for drilling and micro-machining applications for rotational speeds up to 100 krpm. The rotor is accelerated by means of a permanent magnet synchronous motor of 3.5 kW output power integrated between the aerostatic journal bearings (JBs). The spindle is cooled by means of a water circuit which interests the stator motor, the JBs and the thrust bearing. The cooling circuit is sealed by means of O-rings positioned between the journal bearings and the external carter. The rotor bearing geometry is specified in Table 1, and Table 2 reports the inertial characteristics of the shaft. Each journal bearing is supplied by means of two series of 12 equally spaced orifices located 7 mm from the edges. The rotor bearing system is sketched in Figure 2, where l1 and l2 refer to the distances of the bearing centers with respect to the rotor center of mass. The right-handed fixed reference system xyz is defined. The rotor radial vibration is measured by means of capacitive sensors (capaNCDT CS05 by Microepsilon, Ortenburg, Germany) placed on two measuring planes located near the journal bearings, at coordinates z 2 = −21 mm (front plane) and z 1 = 91.5 mm (rear plane). The center of mass is located at zG = 41 mm. We set up numerical models of the rotor bearing system for a comparison with the experimental tests. We analyzed the unbalance response with a nonlinear model (orbit method) and with a linearized model, both of which make use of the stiffness and damping coefficients of the JBs. The next sub-section describes such models.

2.1. Nonlinear Model

Figure 2 illustrates the spindle with two journal bearings located at distance l1 and l2 with respect to the center of mass. The bearings can be considered fixed as the bushings were mounted in the external carter of the electrospindle with a small interference to prevent their radial vibration. In this way, no additional external damping is introduced in the system. The amplitude of the shaft orbits resulting from a static unbalance eccentricity e = 1 μm is calculated solving the time-dependent Reynolds equation coupled with the 4 degrees of freedom (DOF) rotor dynamic model [15].
The 4 DOF rotodynamic equations are:
m x ¨ C F c x F e x t x = m e ω 2 cos ω t I ϑ ¨ y I p ω ϑ ˙ x M c y + F e x t x ( z G z F ) = ( I I p ) ω 2 γ cos ( ω t + φ 1 ) m y ¨ C F c y F e x t y = m e ω 2 sin ω t I ϑ ¨ x + I p ω ϑ ˙ y M c x F e x t y ( z G z F ) = ( I p I ) γ ω 2 sin ( ω t + φ 1 )
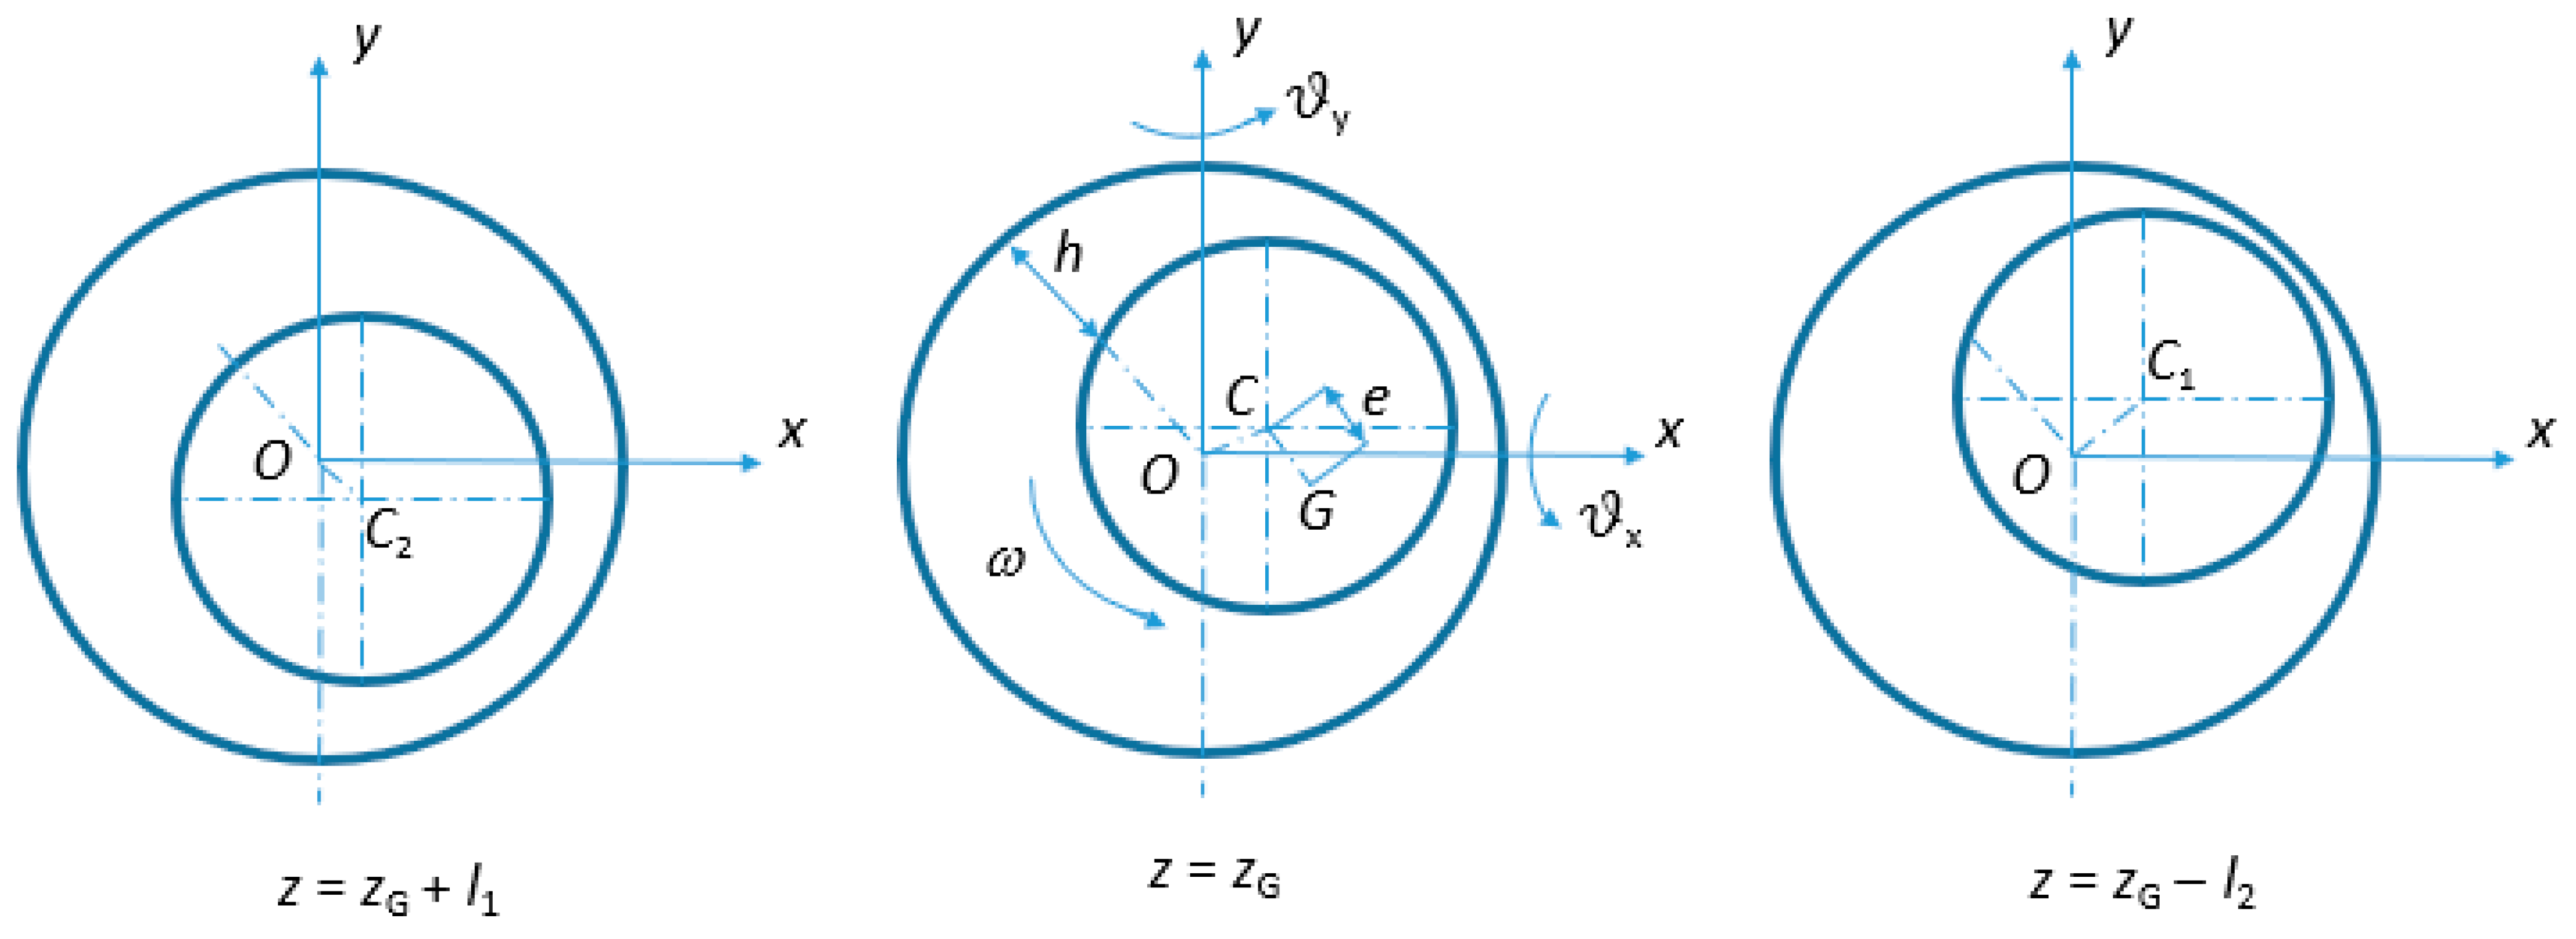
where x c and y c are the radial coordinates of the geometrical center of the rotor section with respect to its center of mass G, and ϑ x   and   ϑ y are the rotations around the x and y axes (see Figure 3). The external force applied on the rotor nose is Fext.
The reaction forces F c in bearings are given by,
[ F c x F c y ] = 0 L 0 2 π ( p [ cos ϑ sin ϑ ] + τ [ sin ϑ cos ϑ ] ) r d ϑ d z
while the moments M c calculated with respect to the center of mass G are,
[ M c x M c y ] = 0 L 0 2 π [ ( z z G ) ( p sin ϑ + τ cos ϑ ) ( z z G ) ( p cos ϑ + τ sin ϑ ) ] r d ϑ d z
The shear stress in the film is [23],
τ = h 2 p r ϑ + μ ω r h
where µ is the viscosity of the lubricant (air) and h is the radial film thickness. The pressure field results from the solution of the time-dependent Reynolds equation, performed by the Euler first-order method [16,17].
The algorithm performed to solve the time-dependent partial differential equation (PDE) problem coupled with the ordinary differential equation (ODE) problem is known as the orbit method. This method has the advantage of taking into account the nonlinearities of bearings that cannot be neglected for eccentricity ratios higher than 0.4. On the contrary, it requires great computation efforts compared with the linearized lumped parameters method described in the Section 2.2. For a comparison of the two methods, Table 3 indicates the computing time required to perform the calculation of the unbalance response curve in the range 40–120 krpm. For the linear model, the speed range was discretized considering 1000 points, while 16 points were considered for the nonlinear model. The table indicates the time needed to simulate the two curves (see Section 4). The nonlinear model is much more time consuming as it is necessary to extinguish the transient process before converging to the limit orbit for a single rotational speed. From the comparison, the advantage of the linearized model is clear, allowing us to individuate the critical speeds in less computing time, thanks to the finer discretization.

2.2. Linearized Model

The linearized model considers the coefficients of stiffness and damping of the air journal bearings and solves with lumped parameters the unbalance response problem. Such coefficients are computed using the nonlinear model in synchronous conditions, with ν = ω. Starting from the equations of motion (1), it is possible to express them as a function of the shaft translations x c 1 , y c 1 , x c 2 , y c 2 in the middle planes of bearings, according to the following transformation:
{ x c ϑ y y c ϑ x } = [ l 2 l 1 + l 2 0 l 1 l 1 + l 2 0 1 l 1 + l 2 0 1 l 1 + l 2 0 0 l 2 l 1 + l 2 0 l 1 l 1 + l 2 0 1 l 1 + l 2 0 1 l 1 + l 2 ] { x c 1 y c 1 x c 2 y c 2 }
The problem is then described in the following matrix form:
[ M ] { x ¨ c 1 y ¨ c 1 x ¨ c 2 y ¨ c 2 } + ( [ G ] + [ C ] ) { x ˙ c 1 y ˙ c 1 x ˙ c 2 y ˙ c 2 } + [ K ] { x c 1 y c 1 x c 2 y c 2 } = { F d y n }
where,
[ M ] = [ m l 2 l 1 + l 2 0 m l 1 l 1 + l 2 0 I l 1 + l 2 0 I l 1 + l 2 0 0 m l 2 l 1 + l 2 0 m l 1 l 1 + l 2 0 I l 1 + l 2 0 I l 1 + l 2 ] [ G ] = [ 0 0 0 0 0 I p ω l 1 + l 2 0 I p ω l 1 + l 2 0 0 0 0 I p ω l 1 + l 2 0 I p ω l 1 + l 2 0 ]
[ C ] = [ c x x , 1 c x y , 1 c x x , 2 c x y , 2 l 1 c x x , 1 l 1 c x y , 1 l 2 c x x , 2 l 2 c x y , 2 c y x , 1 c y y , 1 c y x , 2 c y y , 2 l 1 c y x , 1 l 1 c y y , 1 l 2 c y x , 2 l 2 c y y , 2 ]
[ K ] = [ k x x , 1 k x y , 1 k x x , 2 k x y , 2 l 1 k x x , 1 l 1 k x y , 1 l 2 k x x , 2 l 2 k x y , 2 k y x , 1 k y y , 1 k y x , 2 k y y , 2 l 1 k y x , 1 l 1 k y y , 1 l 2 k y x , 2 l 2 k y y , 2 ]
{ F d y n } = ω 2 { m e cos ω t ( I I p ) γ cos ( ω t + φ 1 ) m e sin ω t ( I p I ) γ sin ( ω t + φ 1 ) }
The unbalance response is given by considering the real part of the complex solution,
{ x c 1 y c 1 x c 2 y c 2 } = [ ( [ K ] + ( [ G ] + [ G ] ) j ω ω 2 [ M ] ) 1 ω 2 { m e ( I I p ) γ j m e j ( I p I ) γ } e j ω t ]
The phases of the signals are obtained from the ratio between the imaginary and the real part:
{ φ x c 1 φ y c 1 φ x c 2 φ y c 2 } = tan 1 ( { x c 1 y c 1 x c 2 y c 2 } / { x c 1 y c 1 x c 2 y c 2 } )

3. Results

In this section, the experimental waterfall tests are shown, together with the unbalance response results obtained with the nonlinear and the linearized models.

3.1. Experimental Tests

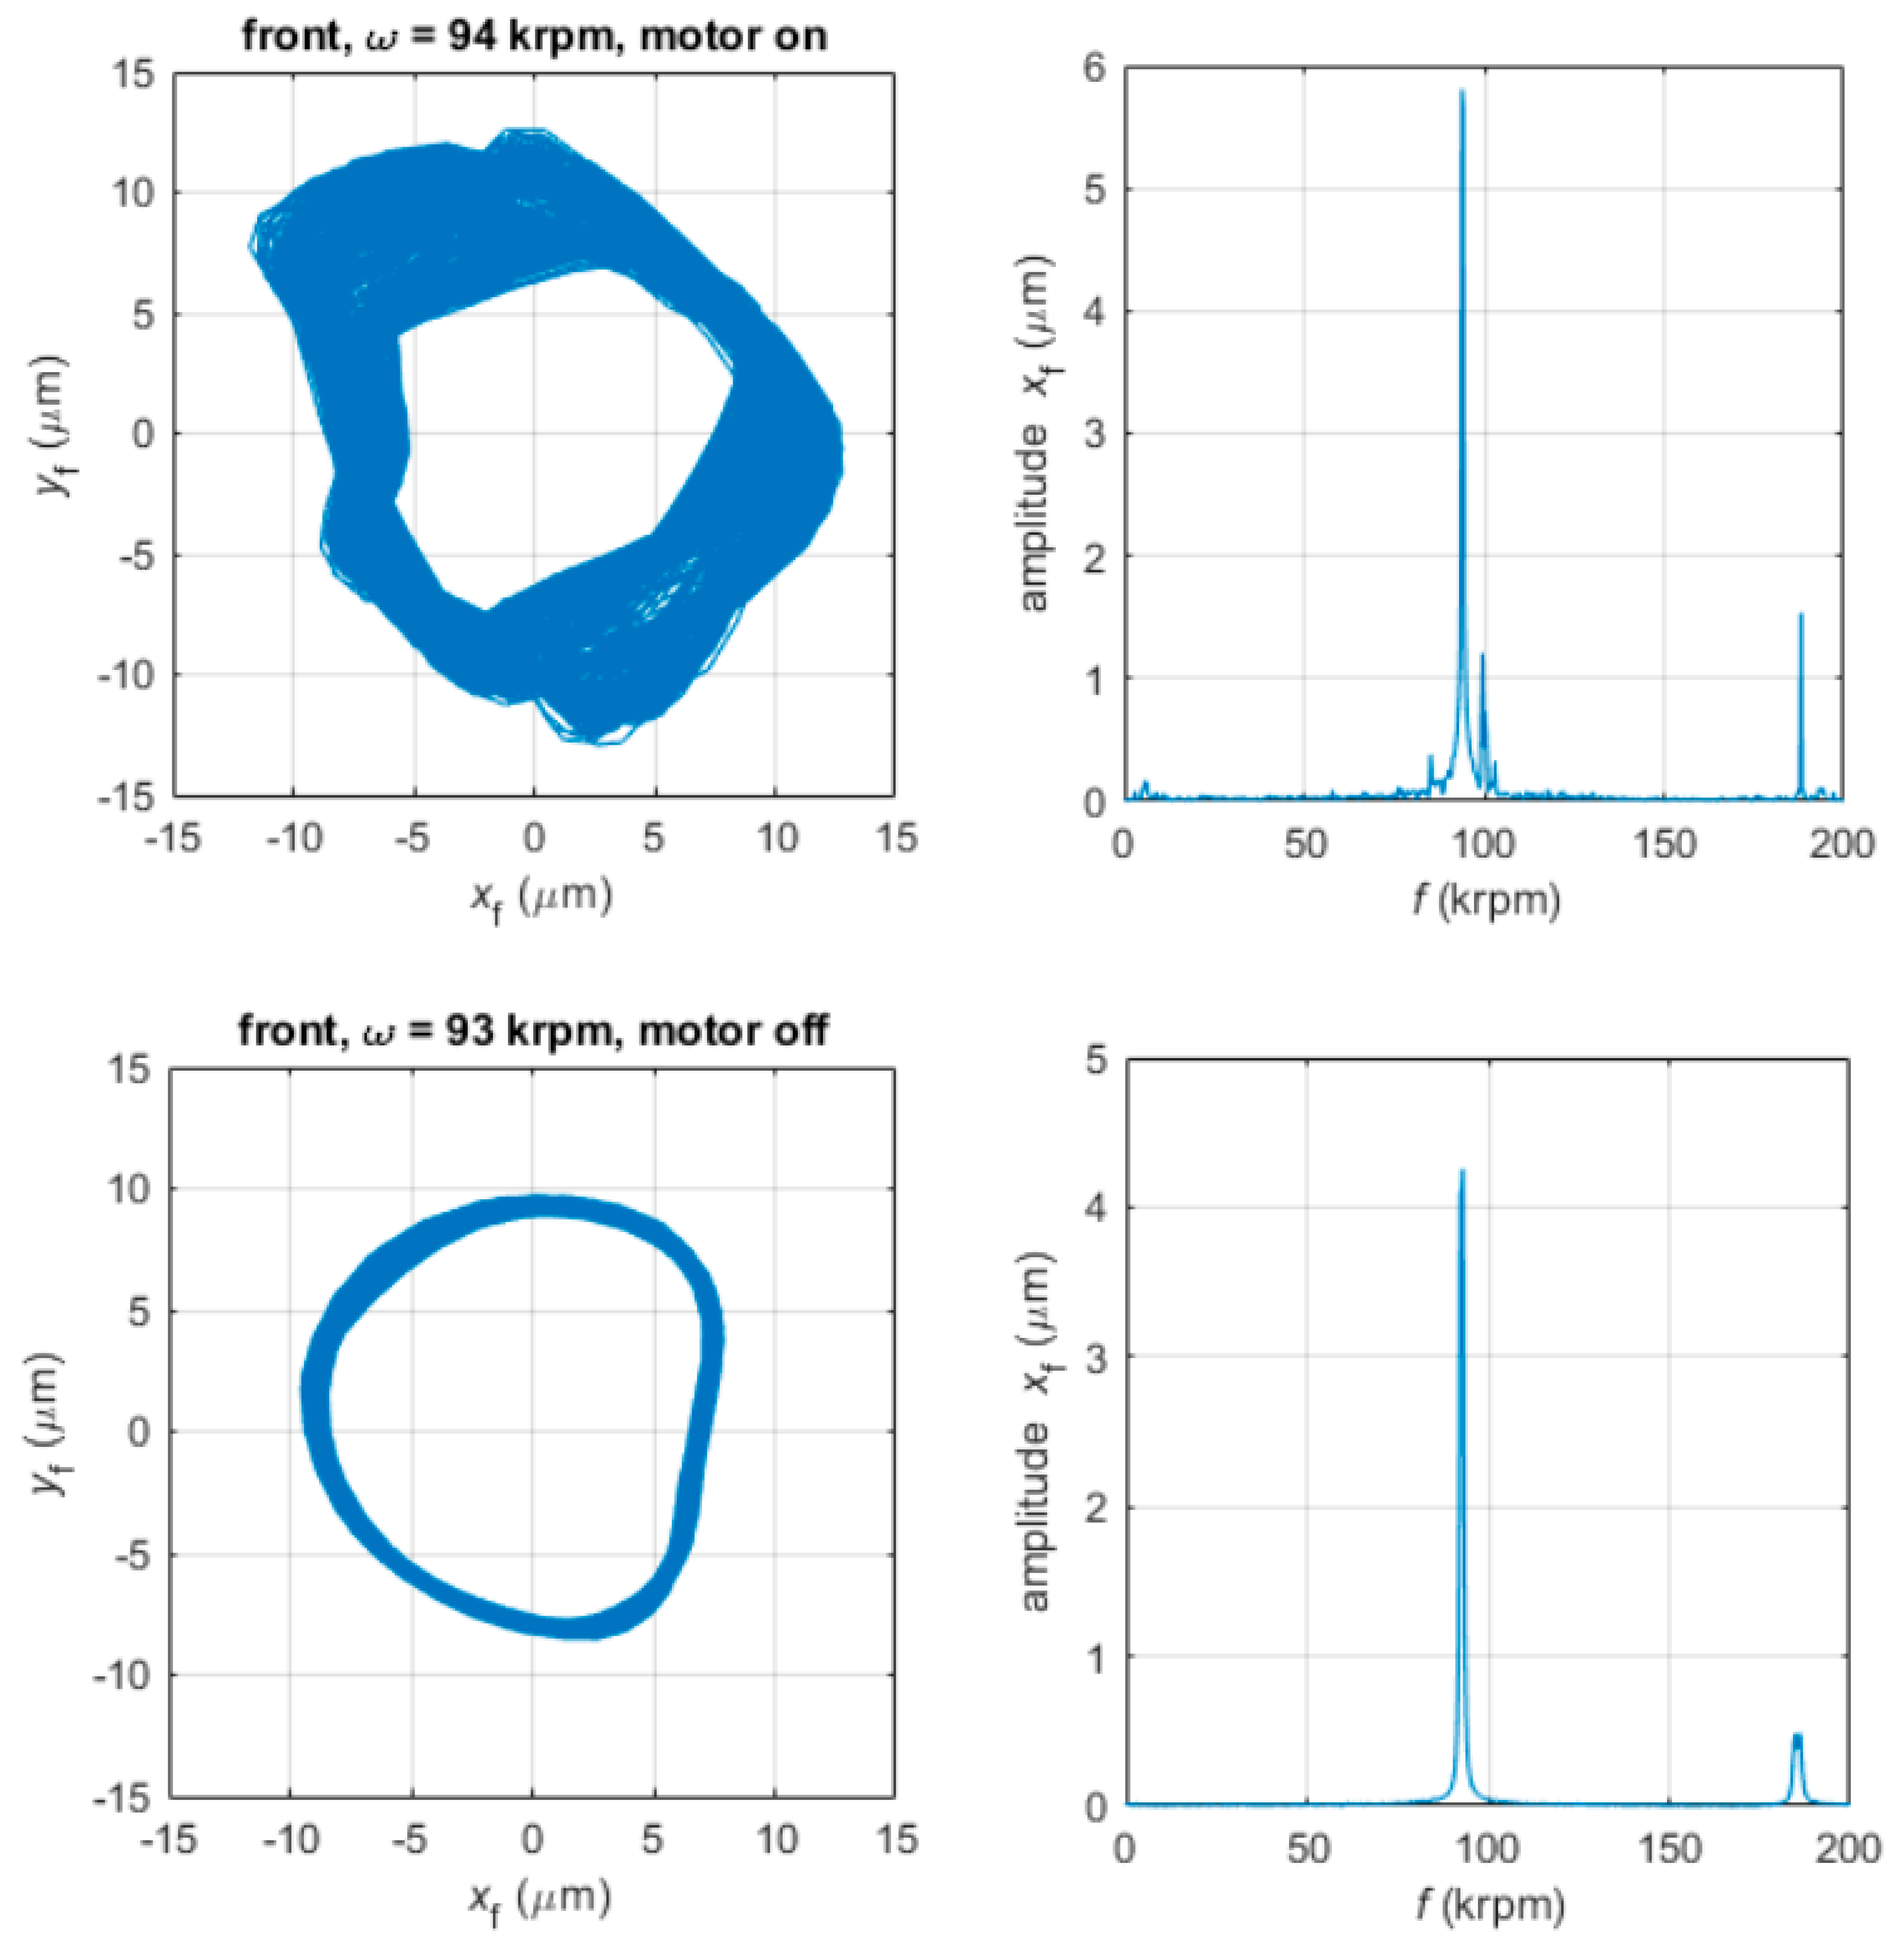
The experimental unbalance response was detected during a cost-down test starting from a maximum rotational speed and switching off the permanent magnet motor. This allows a rapid deceleration without induced noises on sensors. As is visible in the bottom portion of Figure 4, the signal is synchronous with the rotational speed and no extra frequencies induced by the motor are present as they are when the motor is switched on, as shown in the upper part of the figure. The amplitudes of the frequency spectra refer to the radial displacement of the rotor.
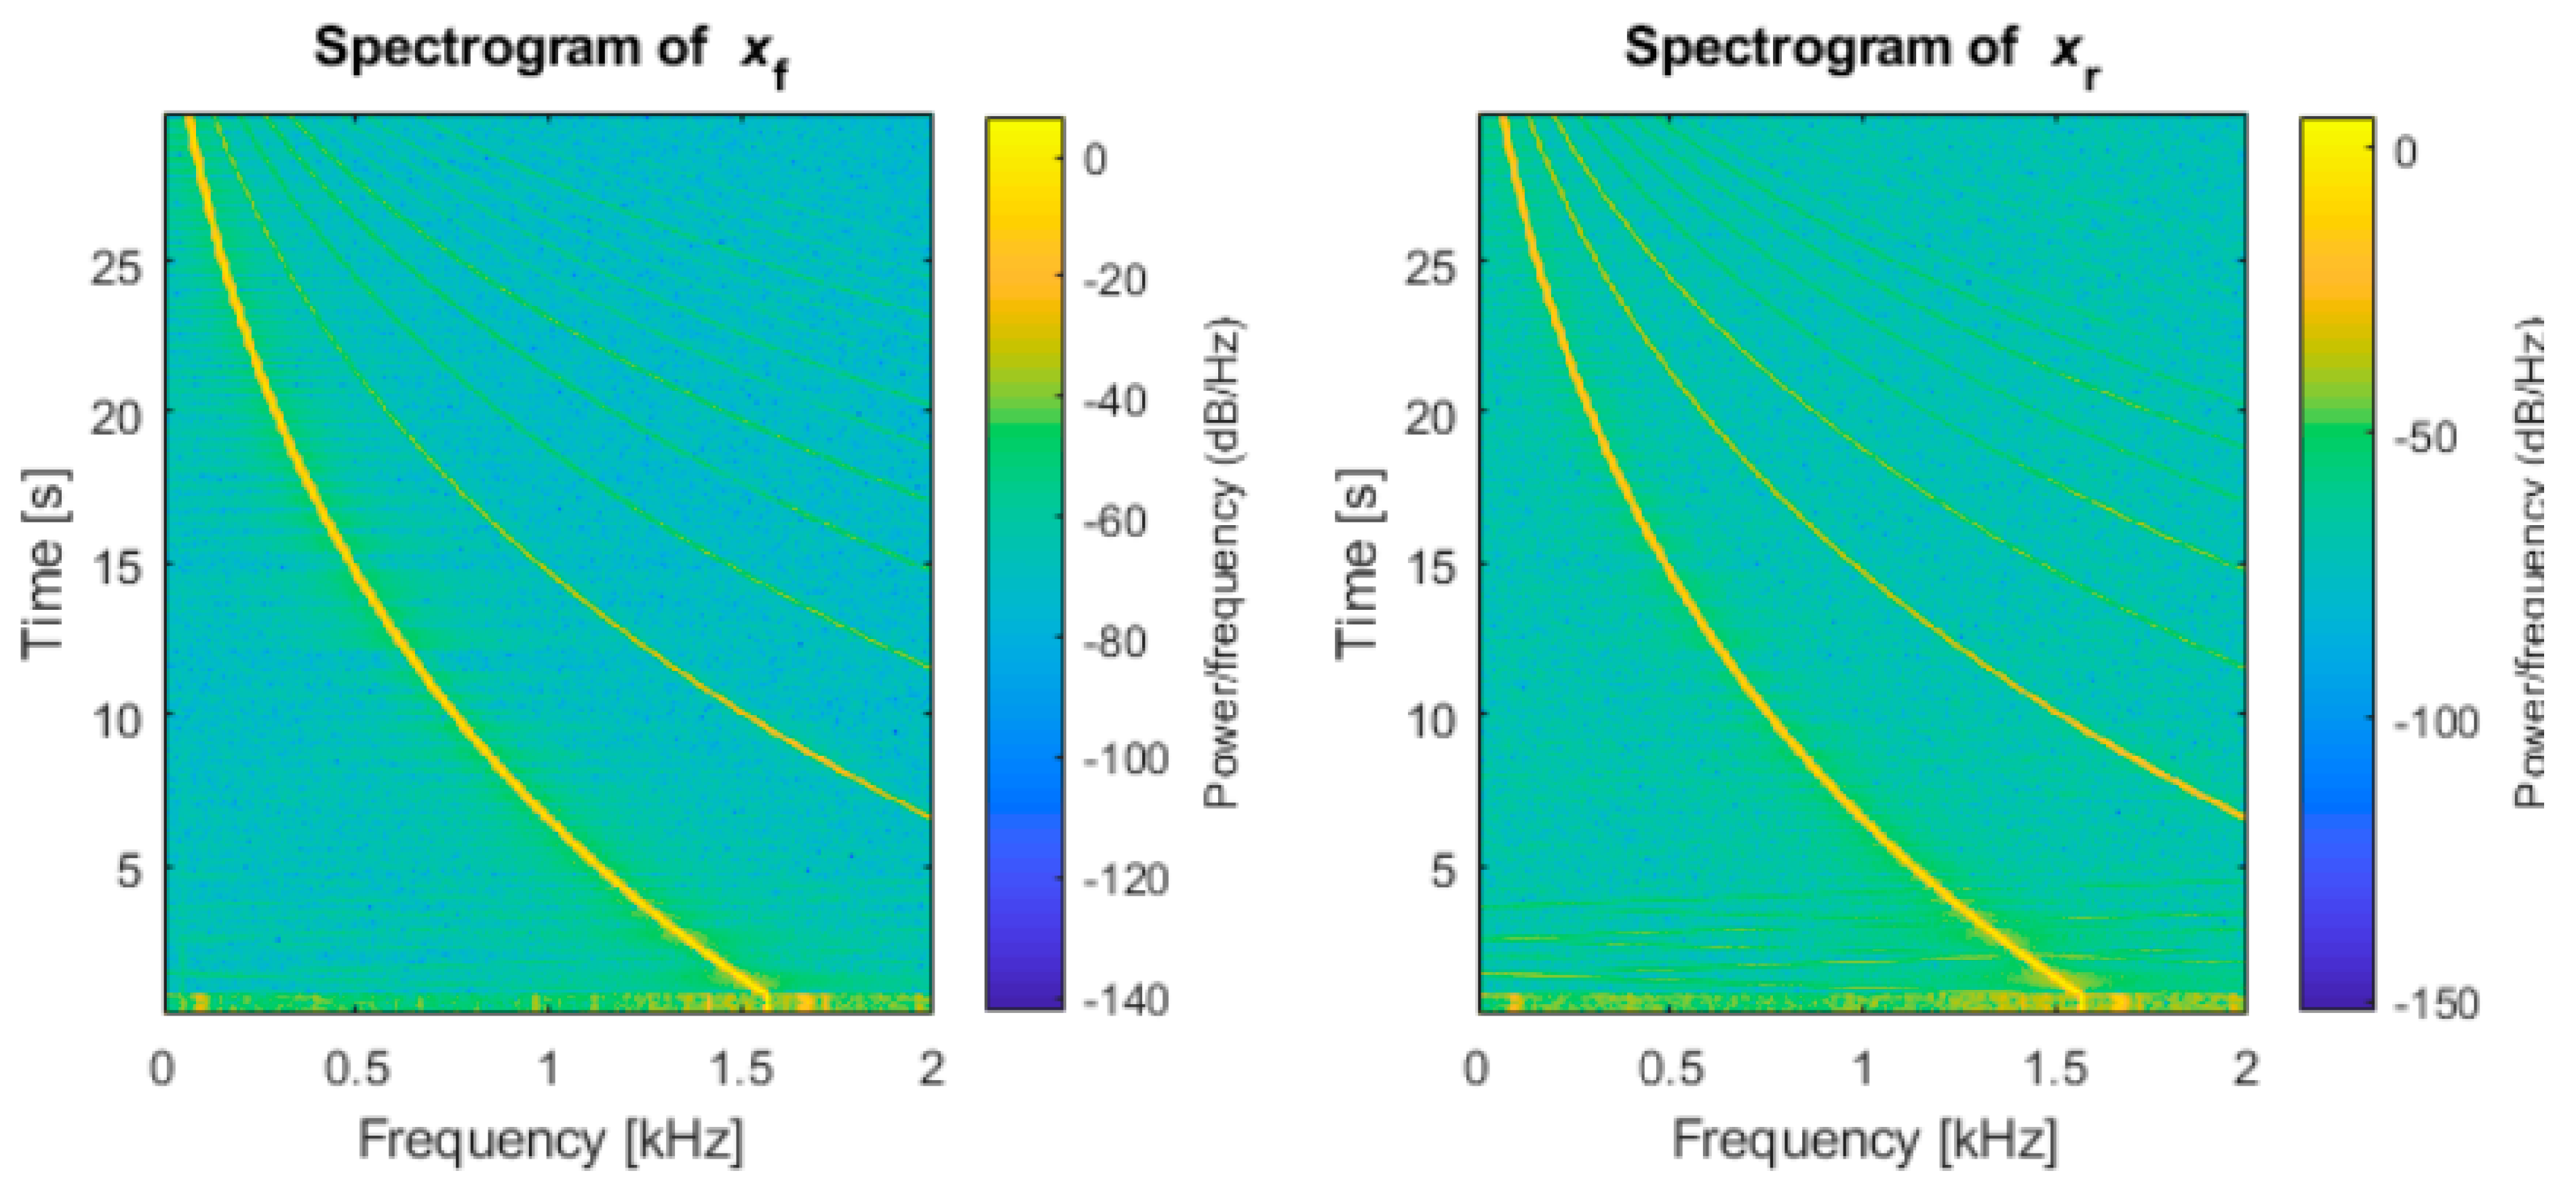
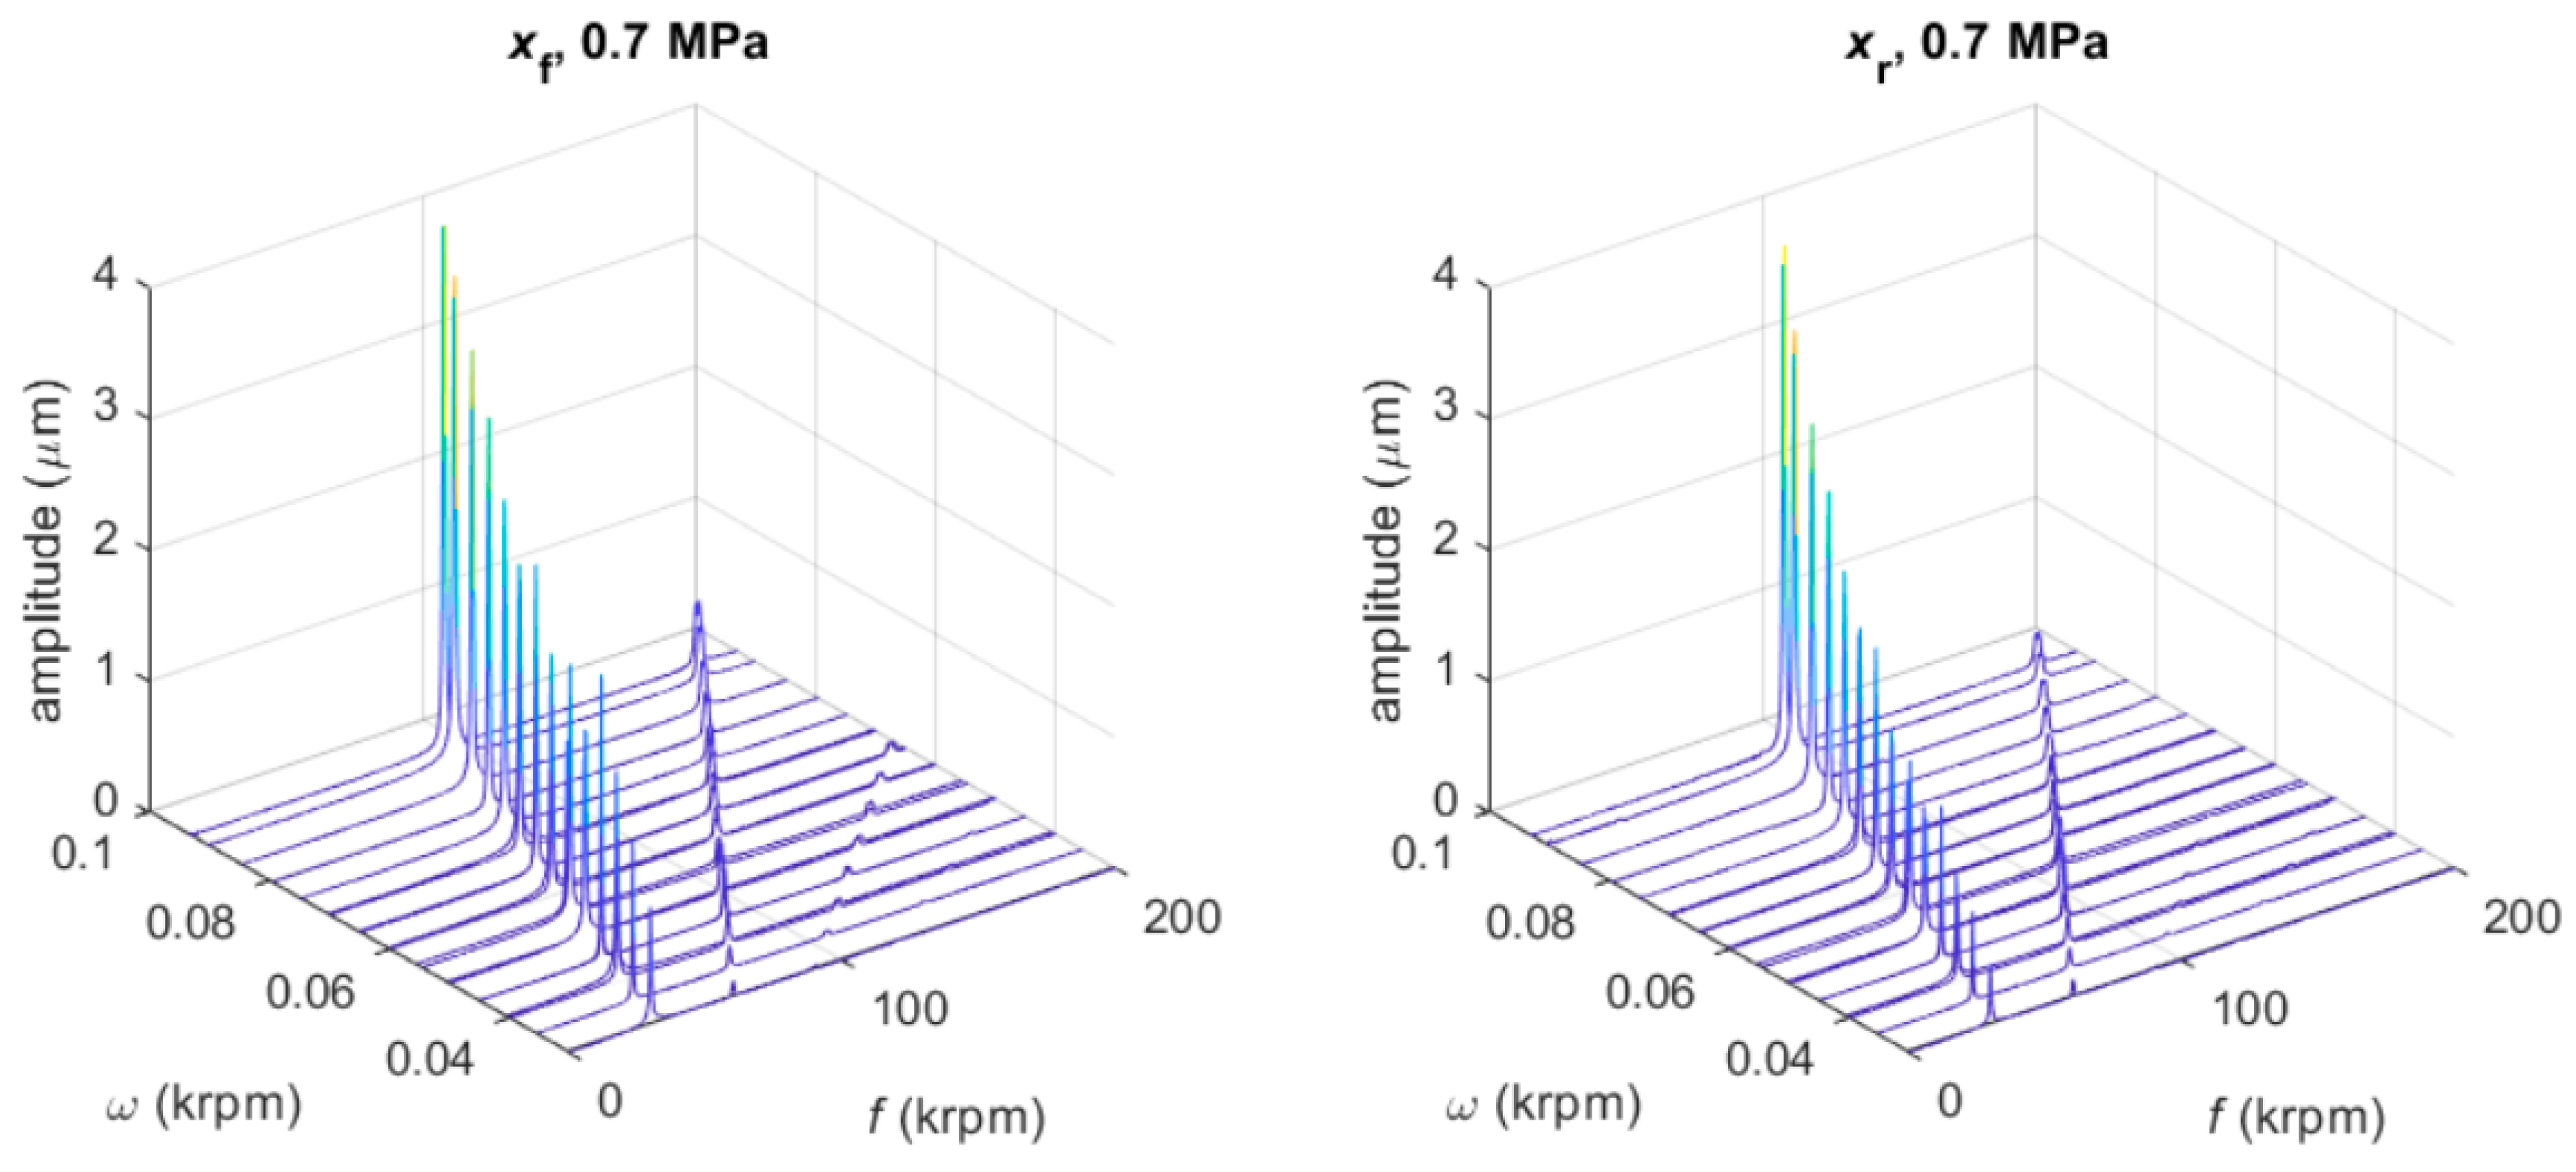
The tests were sampled at 50 kHz and data were recorded for 30 s for each test. The frequency content of signals was calculated with Fast Fourier Transform (FFT), taking a portion of data corresponding to discrete rotational speeds. Figure 5 shows the spectrograms of the signals xf and xr measured in accordance with the measuring planes near the front and rear bearings. The waterfall diagrams were thus obtained (see Figure 6). Only the synchronous component is visible, together with the 2× component. No subsynchronous whirl appears at a supply pressure of 0.7 MPa.
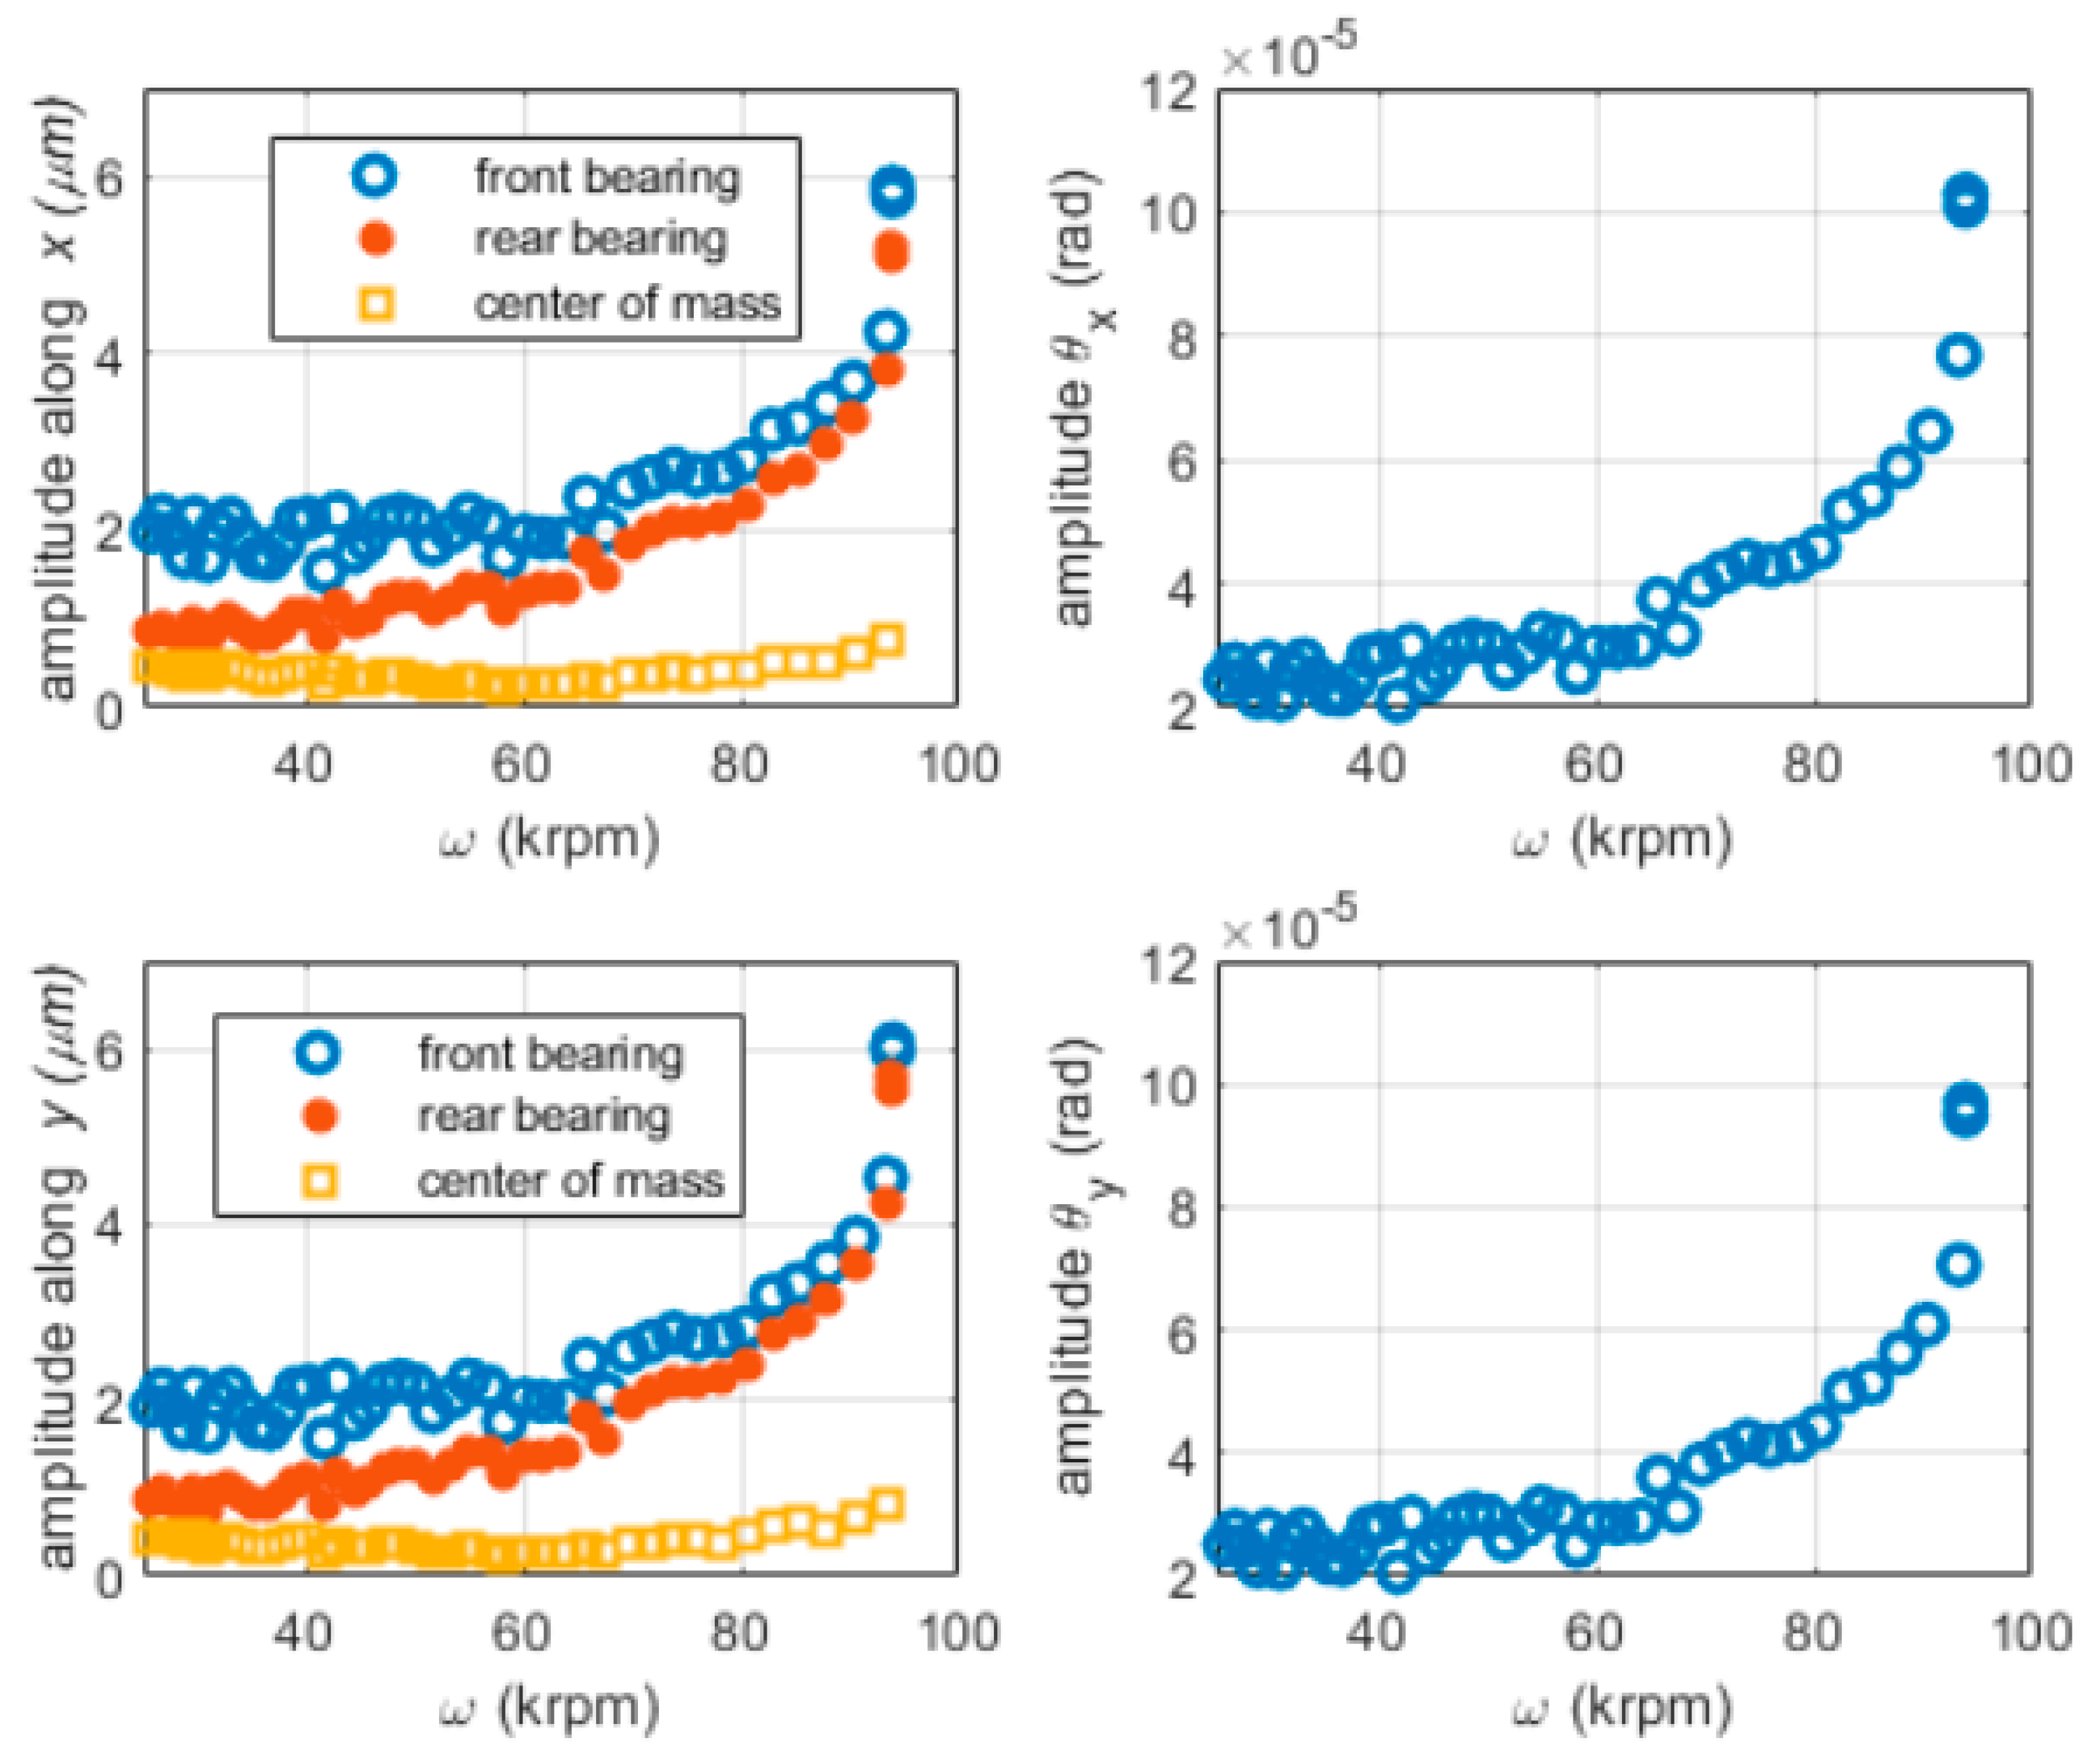
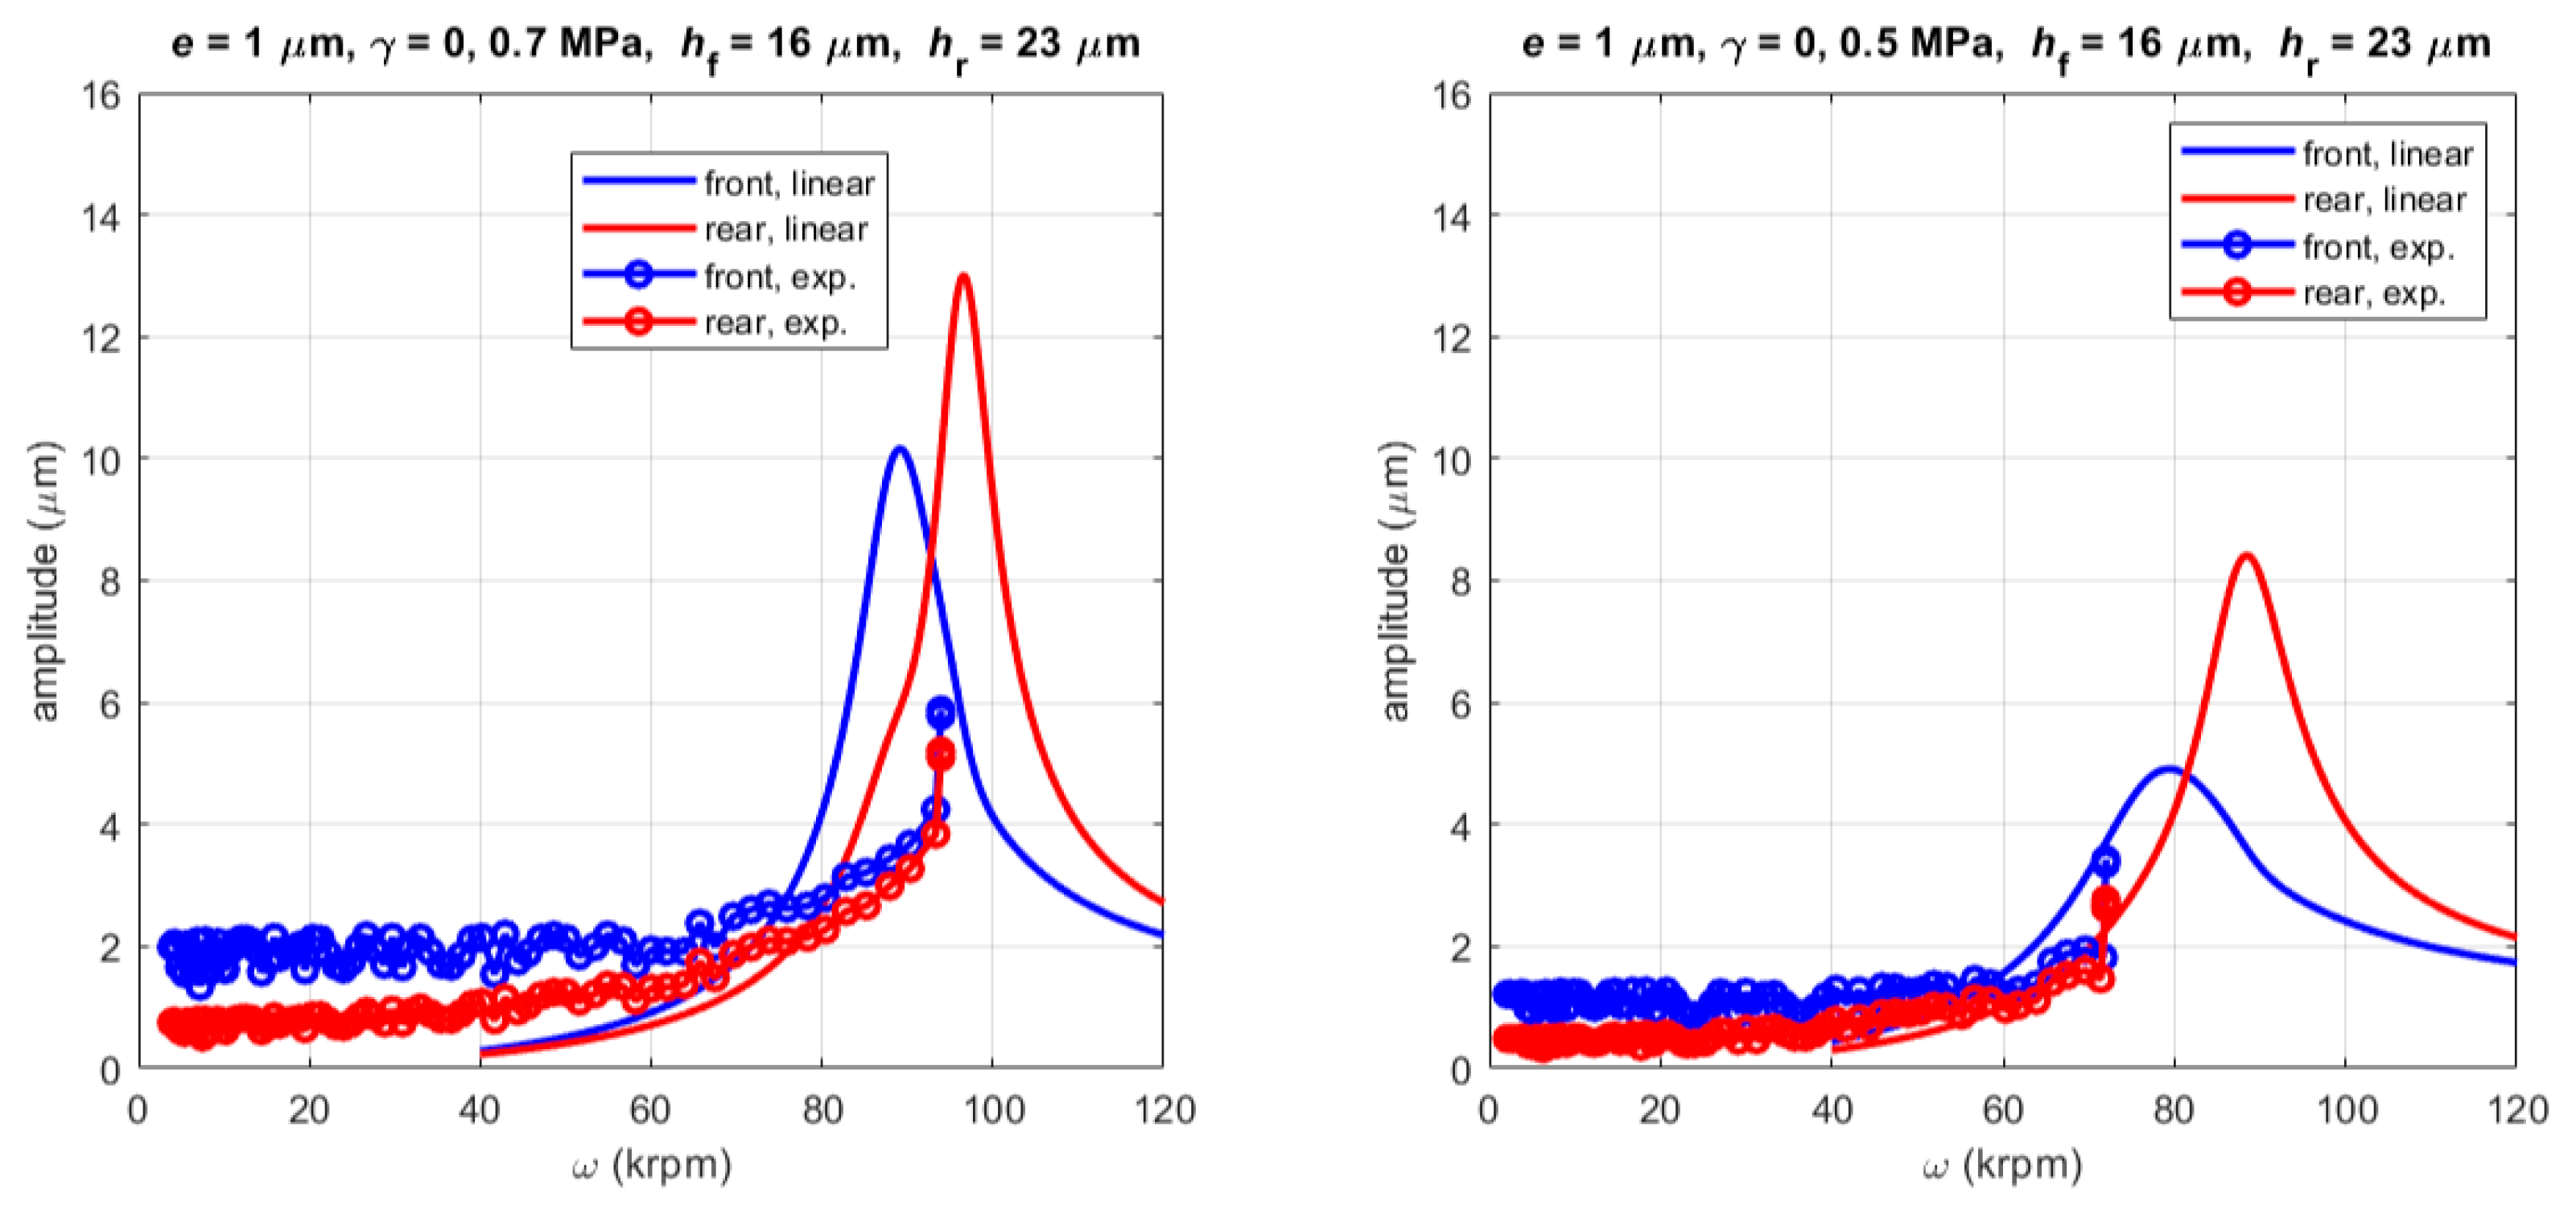
The rotor displacement in its center of mass plane and the tilting angles of rotation around axes x and y are calculated using Equation (5) based on the displacements measured in relation to the bearings. Figure 7 depicts the amplitude of the synchronous peak of such signals at different rotational speeds. A critical speed is evidenced at around 94 krpm. To preserve the integrity of the prototype, the critical speed was not overcome as the amplitude of the vibration increased rapidly around 94 krpm.
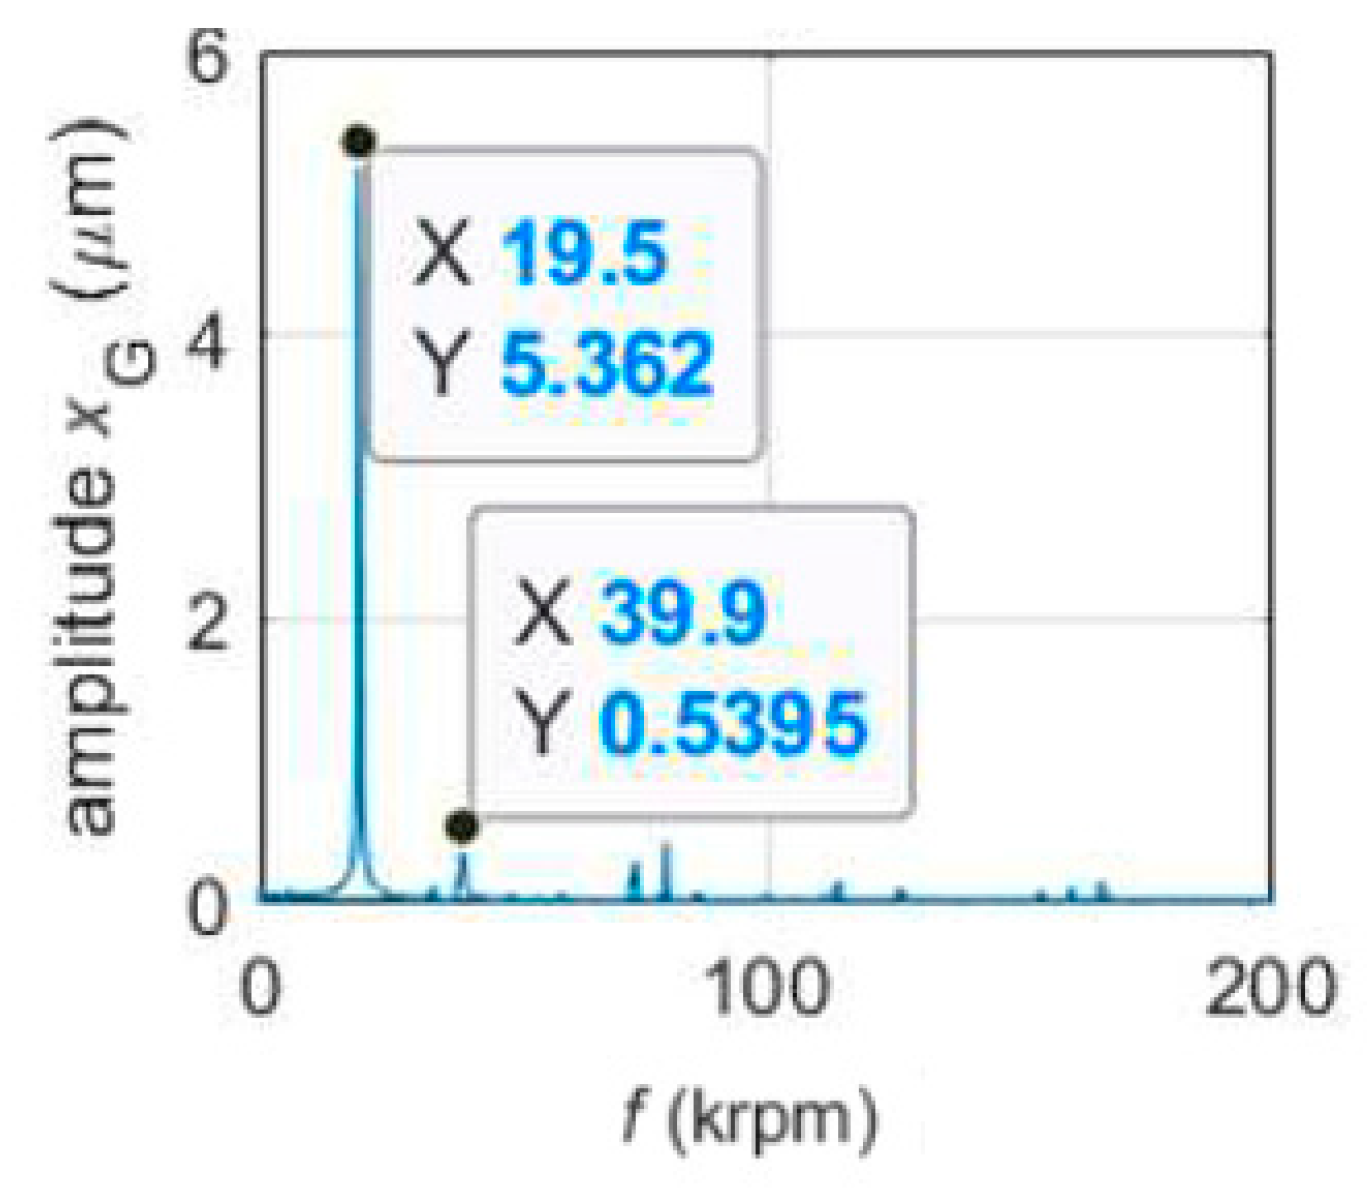
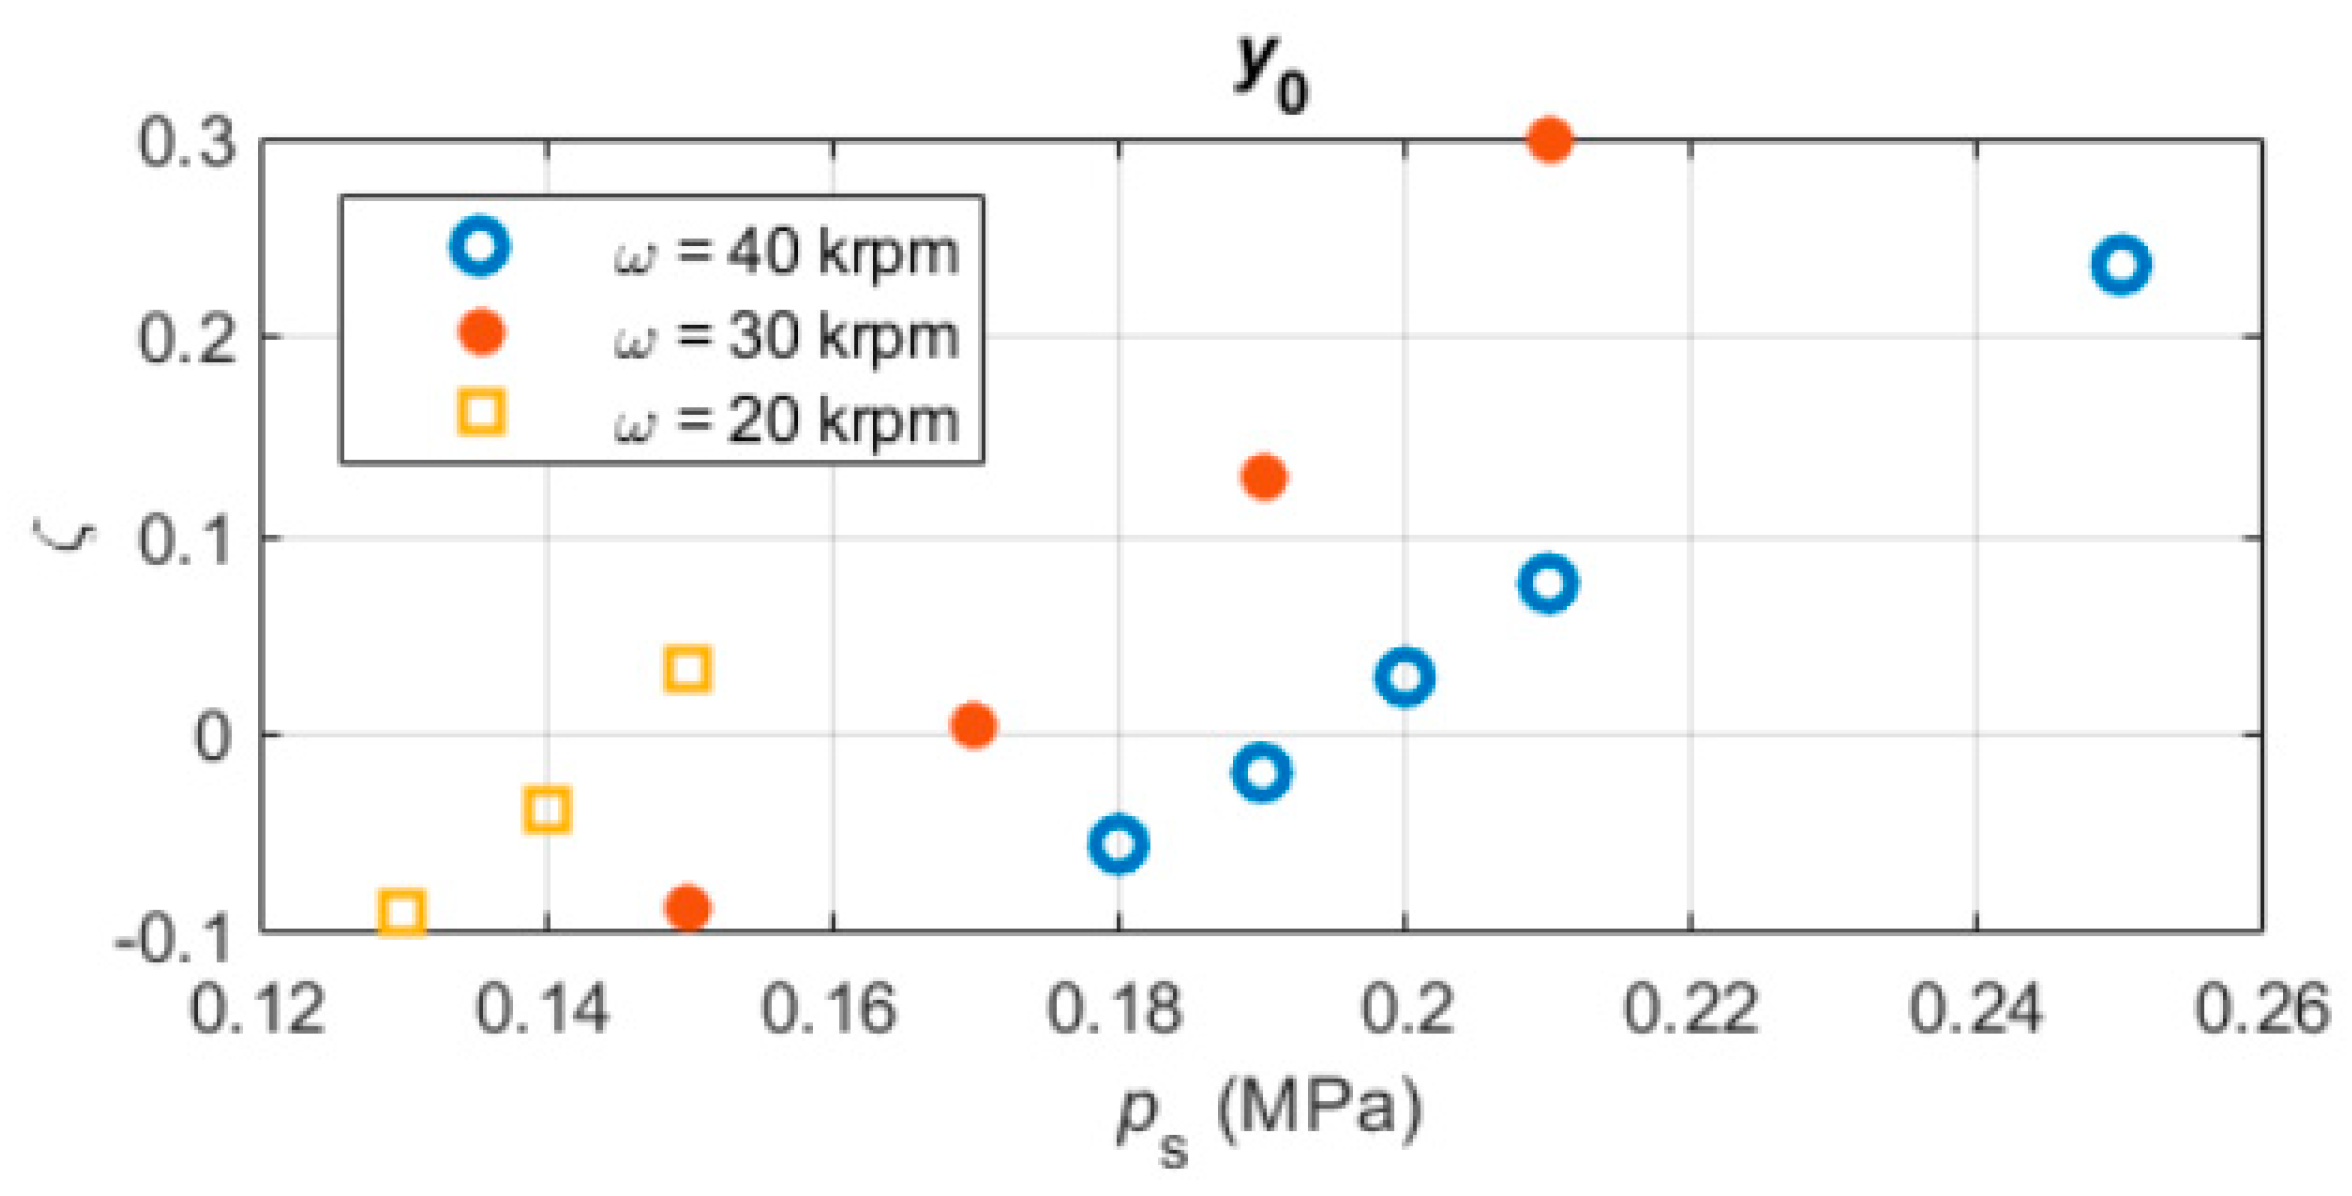
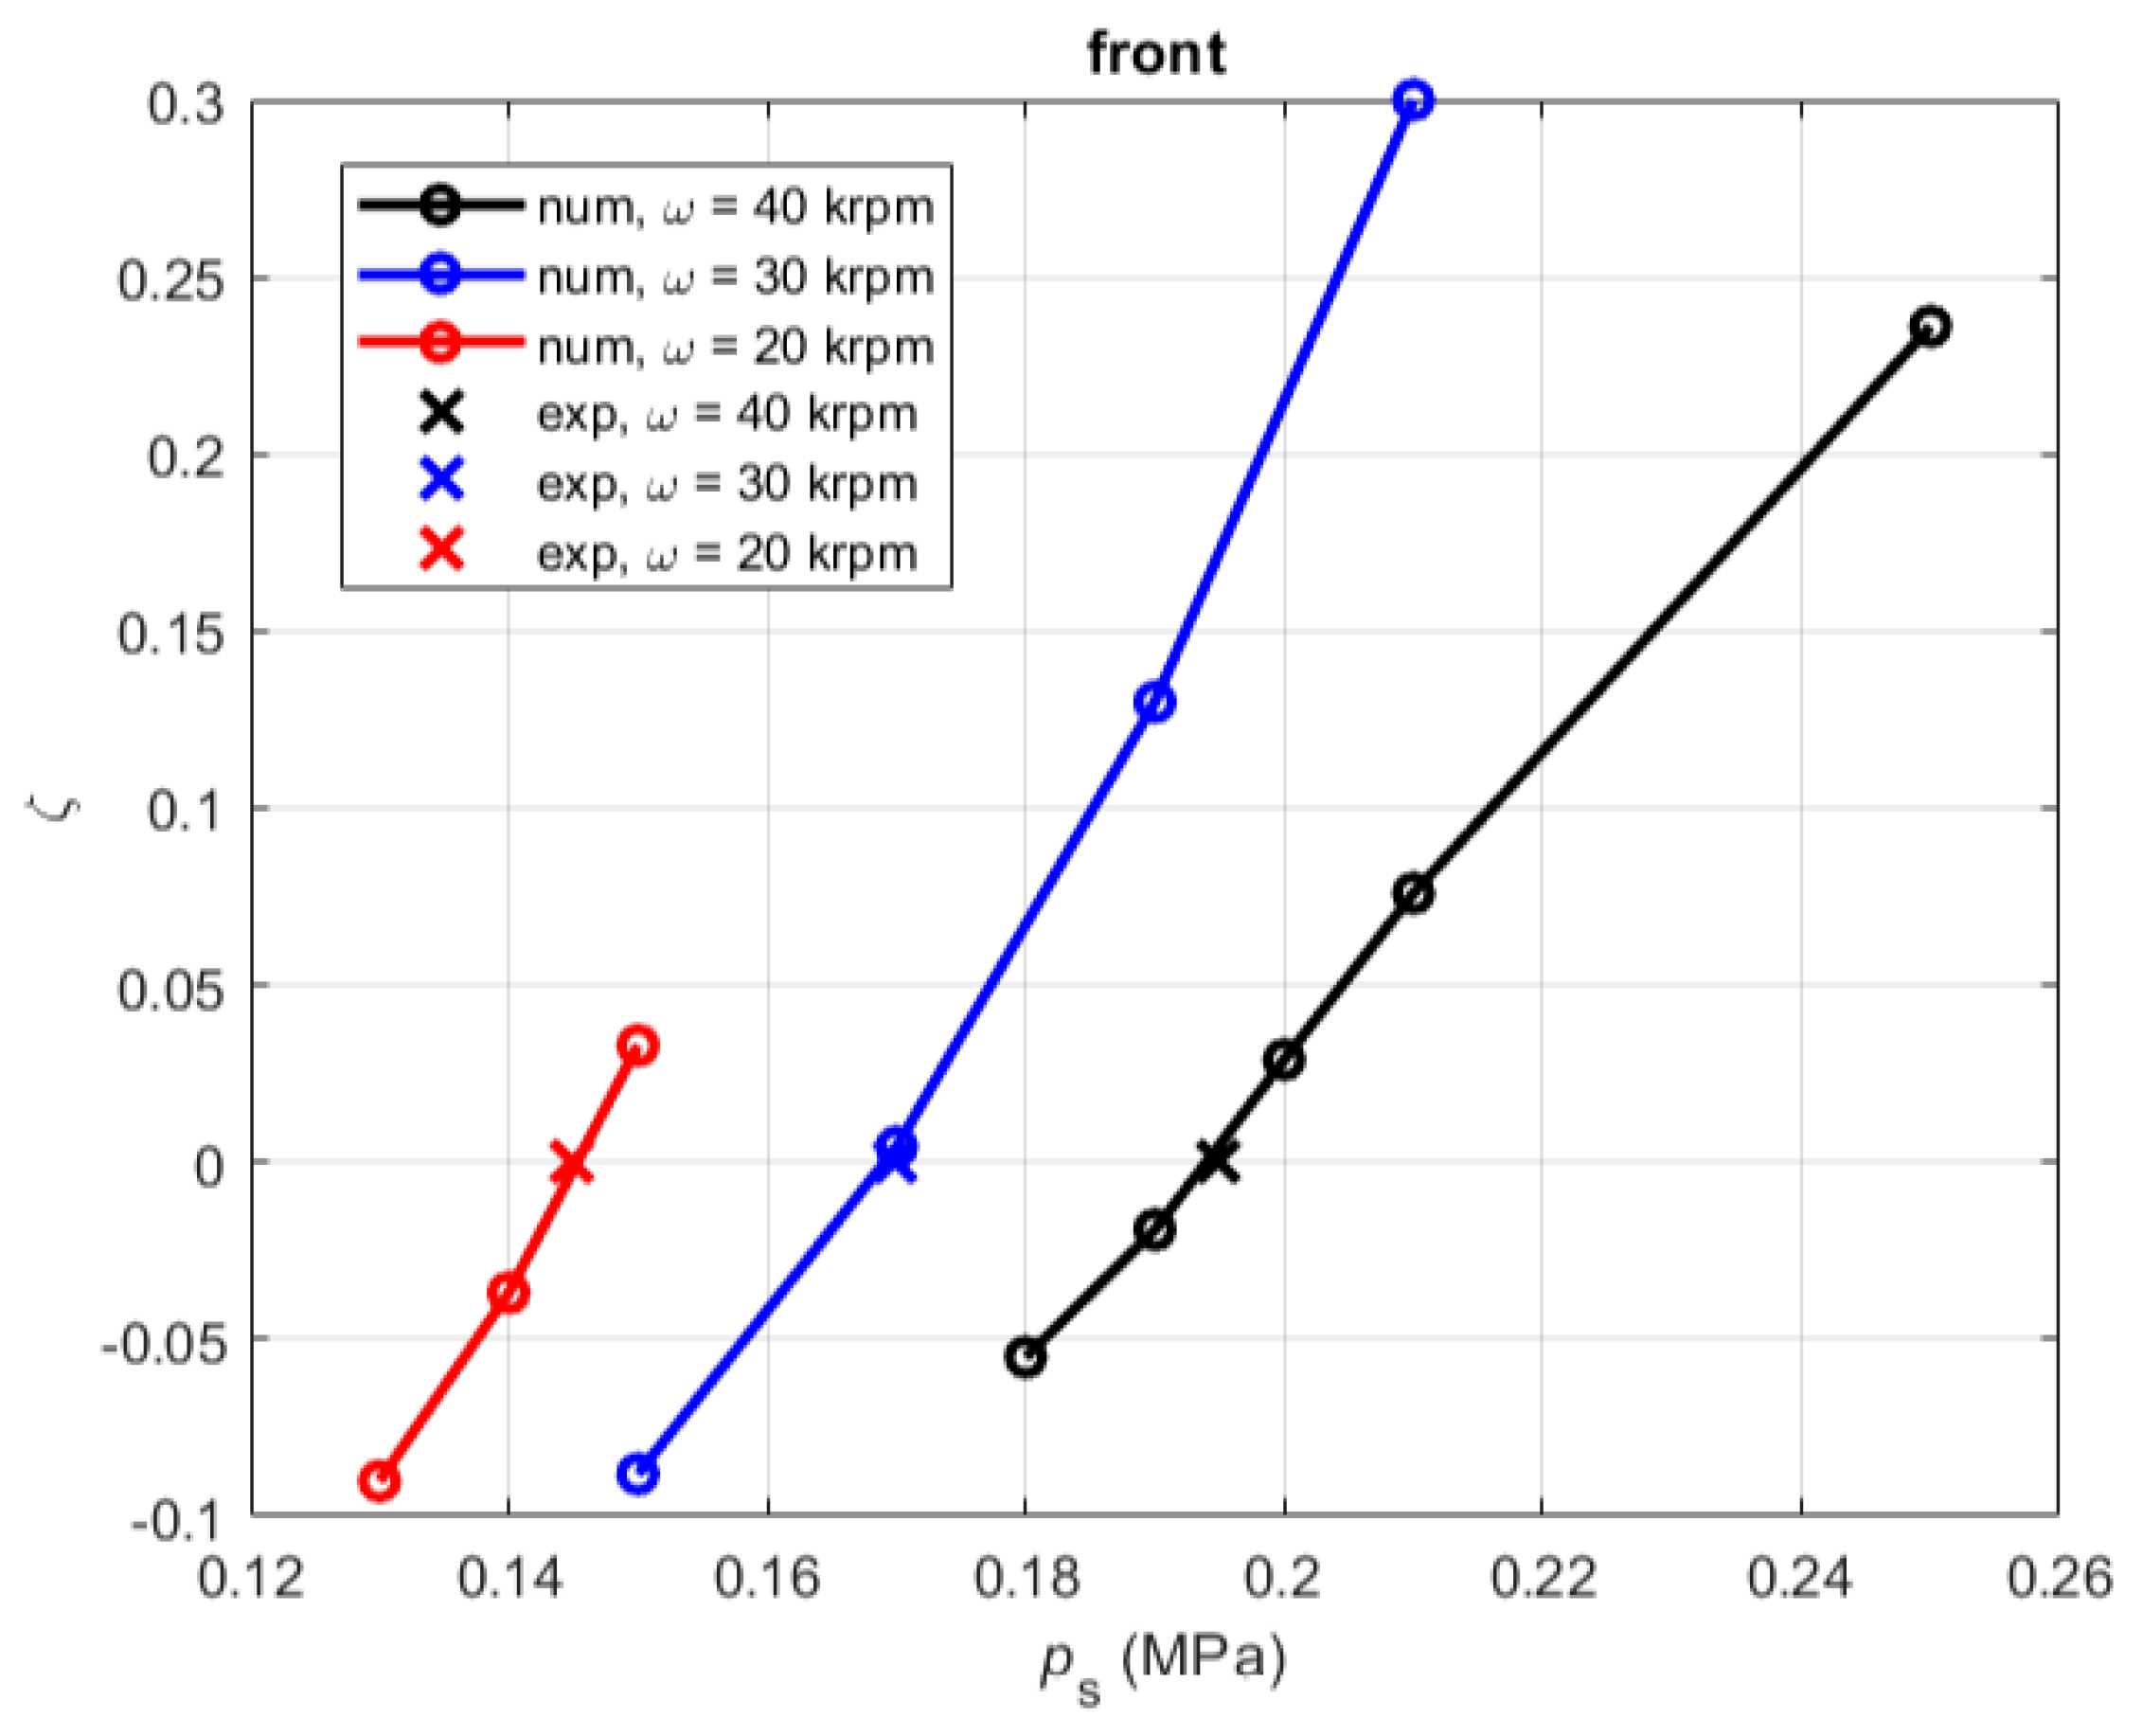
To further investigate the onset of instability, the supply pressure was decreased during rotation at 20, 30 and 40 krpm until a self-excited whirl was detected. An example of the frequency spectrum of the signal measured at 40 krpm is given in Figure 8. The pressure values (absolute) found for the stability threshold at 20, 30 and 40 krpm are 0.14, 0.17 and 0.19 MPa, respectively.

3.2. Nonlinear Model

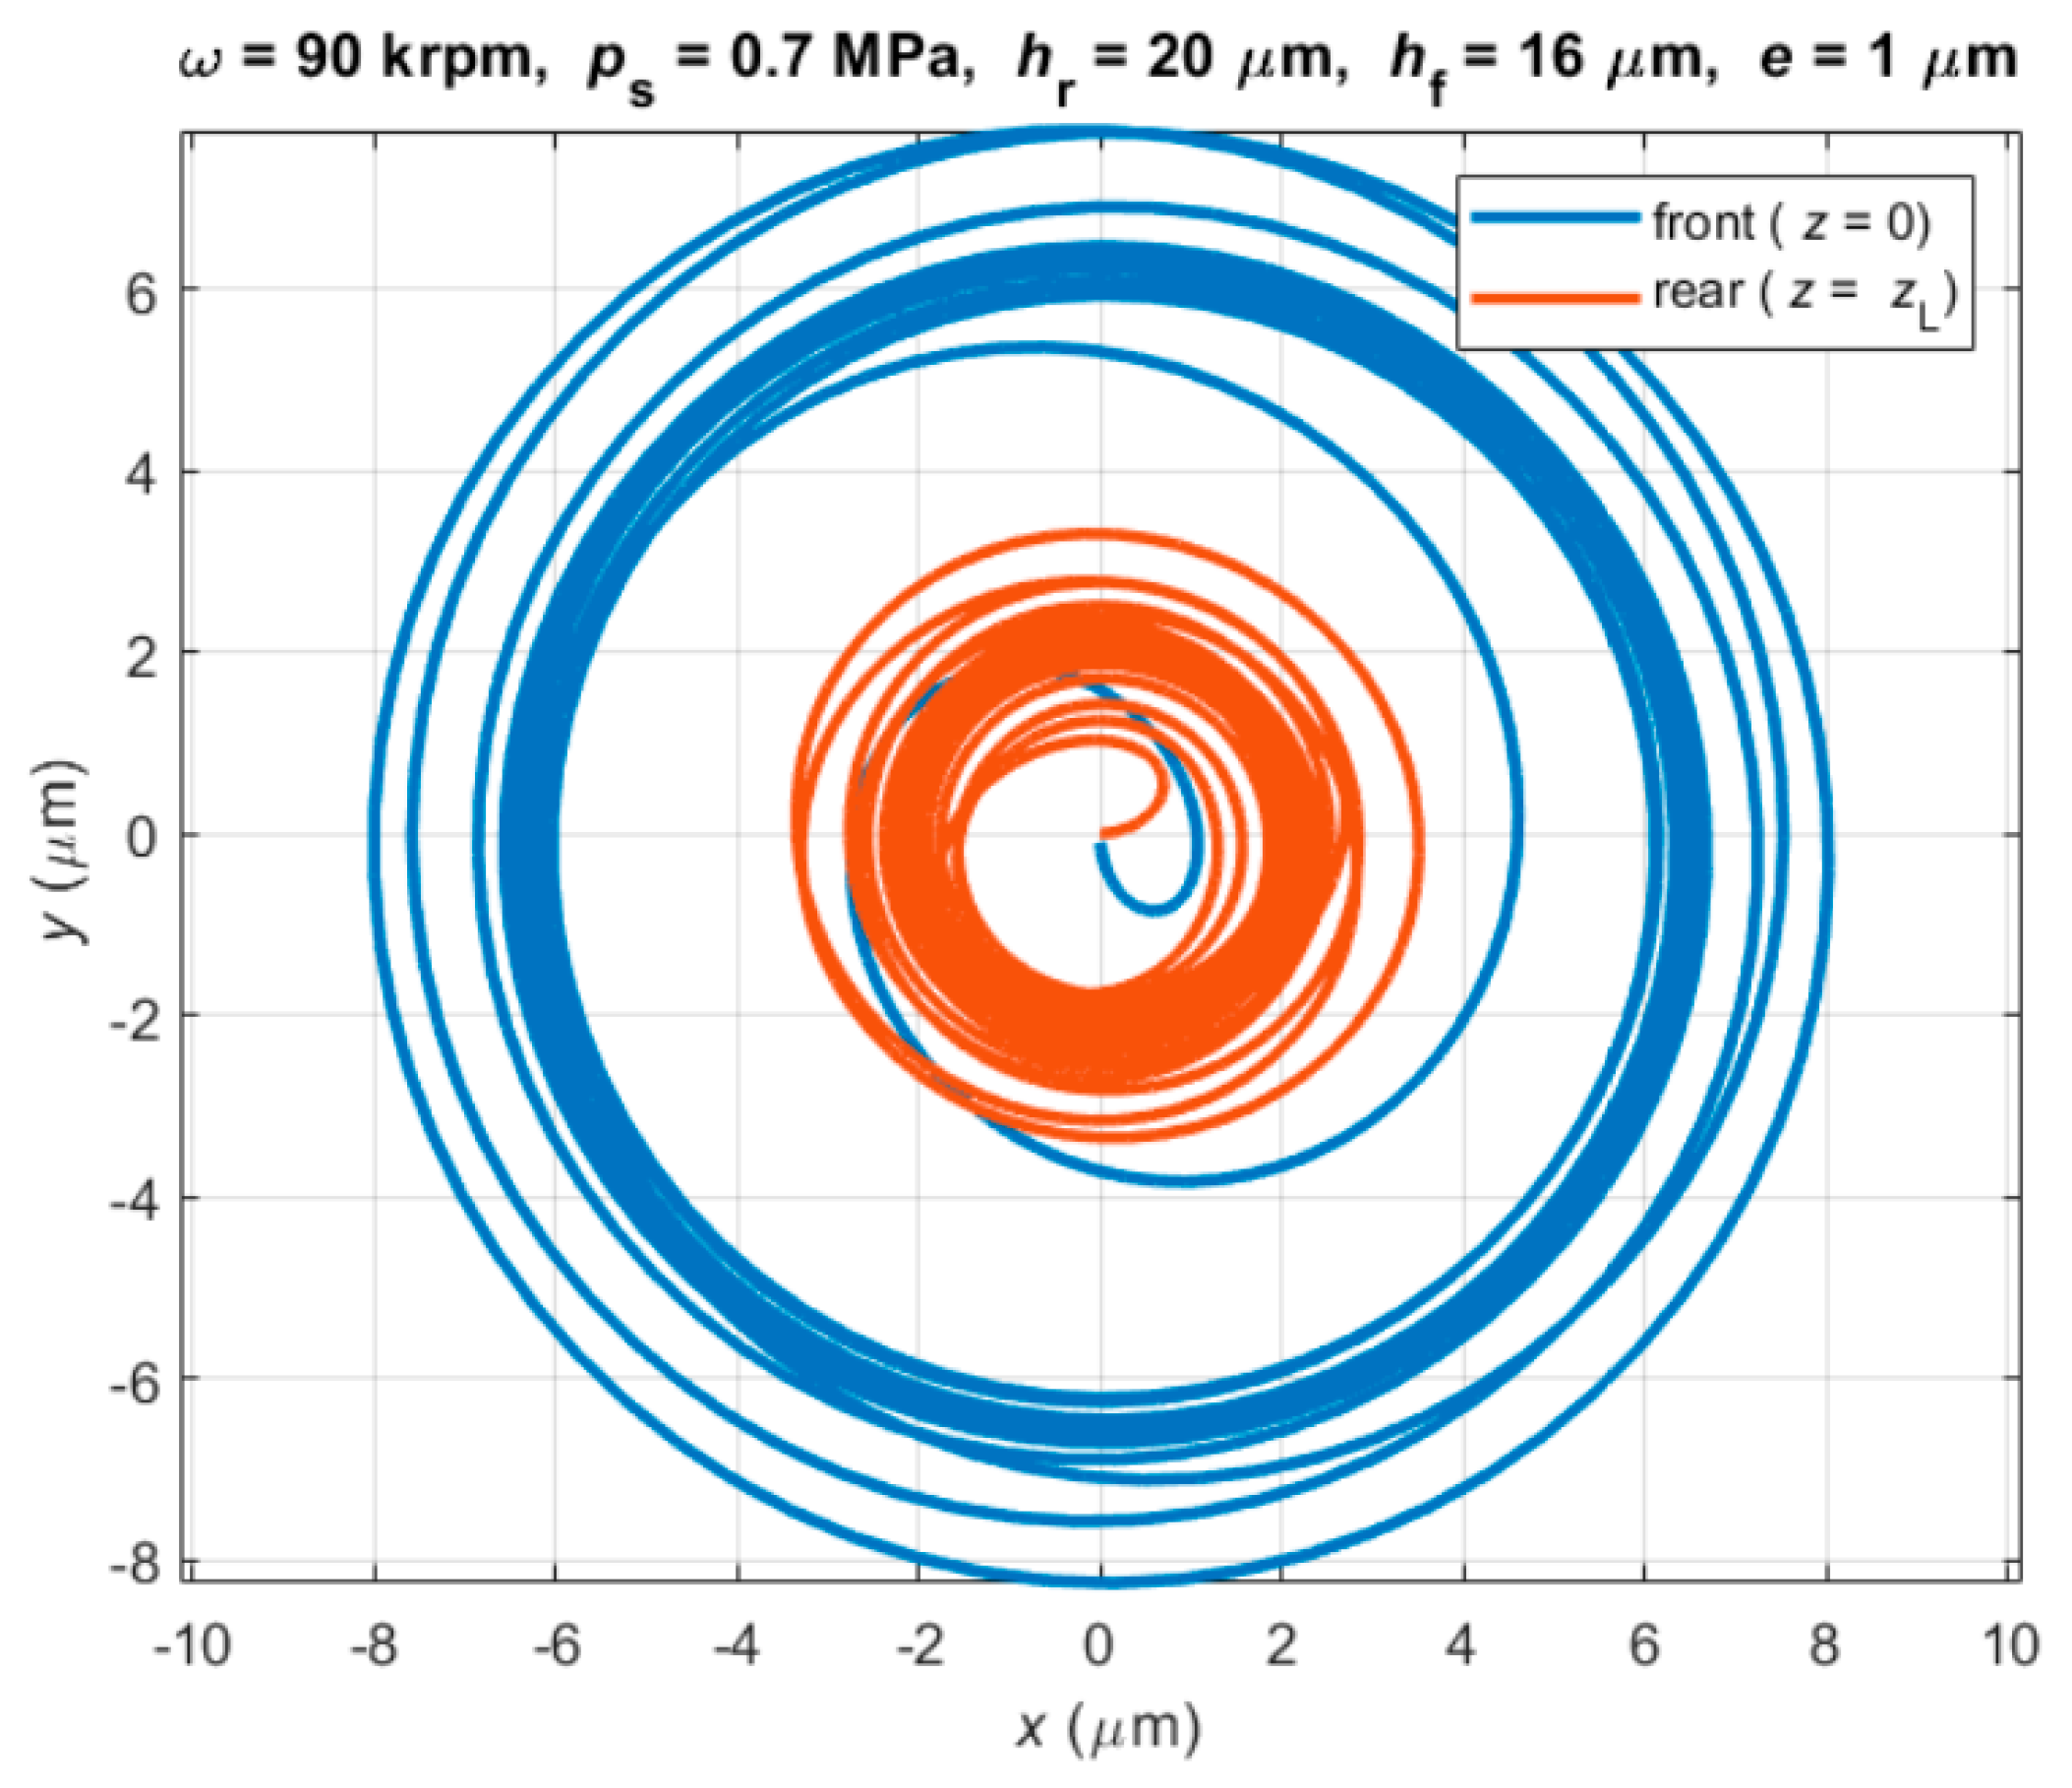
The nonlinear model was used to simulate the unbalance response at discrete rotational speeds, with supply pressures equal to 0.7 and 0.5 MPa (absolute). The dynamic unbalance in calculations was considered null (γ = 0), while the static unbalance eccentricity e was considered equal to 1 µm. Calculations were performed considering two values of air gaps for each journal bearing to take into account the manufacturing tolerances. In this way, the sensitivity of the film thickness in the unbalance response was numerically evaluated. A sufficiently small-time step was employed in order to assure the independency of the results on the time step dt. Value dt = 2 × 10⁻⁸ s was verified to be an adequate compromise between the stability of the numerical scheme and computational effort [17]. The orbits obtained at 90 krpm are shown in Figure 9 as an example. The initial condition in this case was expressed by:
x ( z = 0 , t = 0 ) = 0 ,   y ( z = 0 , t = 0 ) = 0
x ( z = z L , t = 0 ) = 0 ,   y ( z = z L , t = 0 ) = 0
x ˙ ( z = 0 , t = 0 ) = 0 ,   y ˙ ( z = 0 , t = 0 ) = 0.01   m / s
x ˙ ( z = z L , t = 0 ) = 0 ,   y ˙ ( z = z L , t = 0 ) = 0
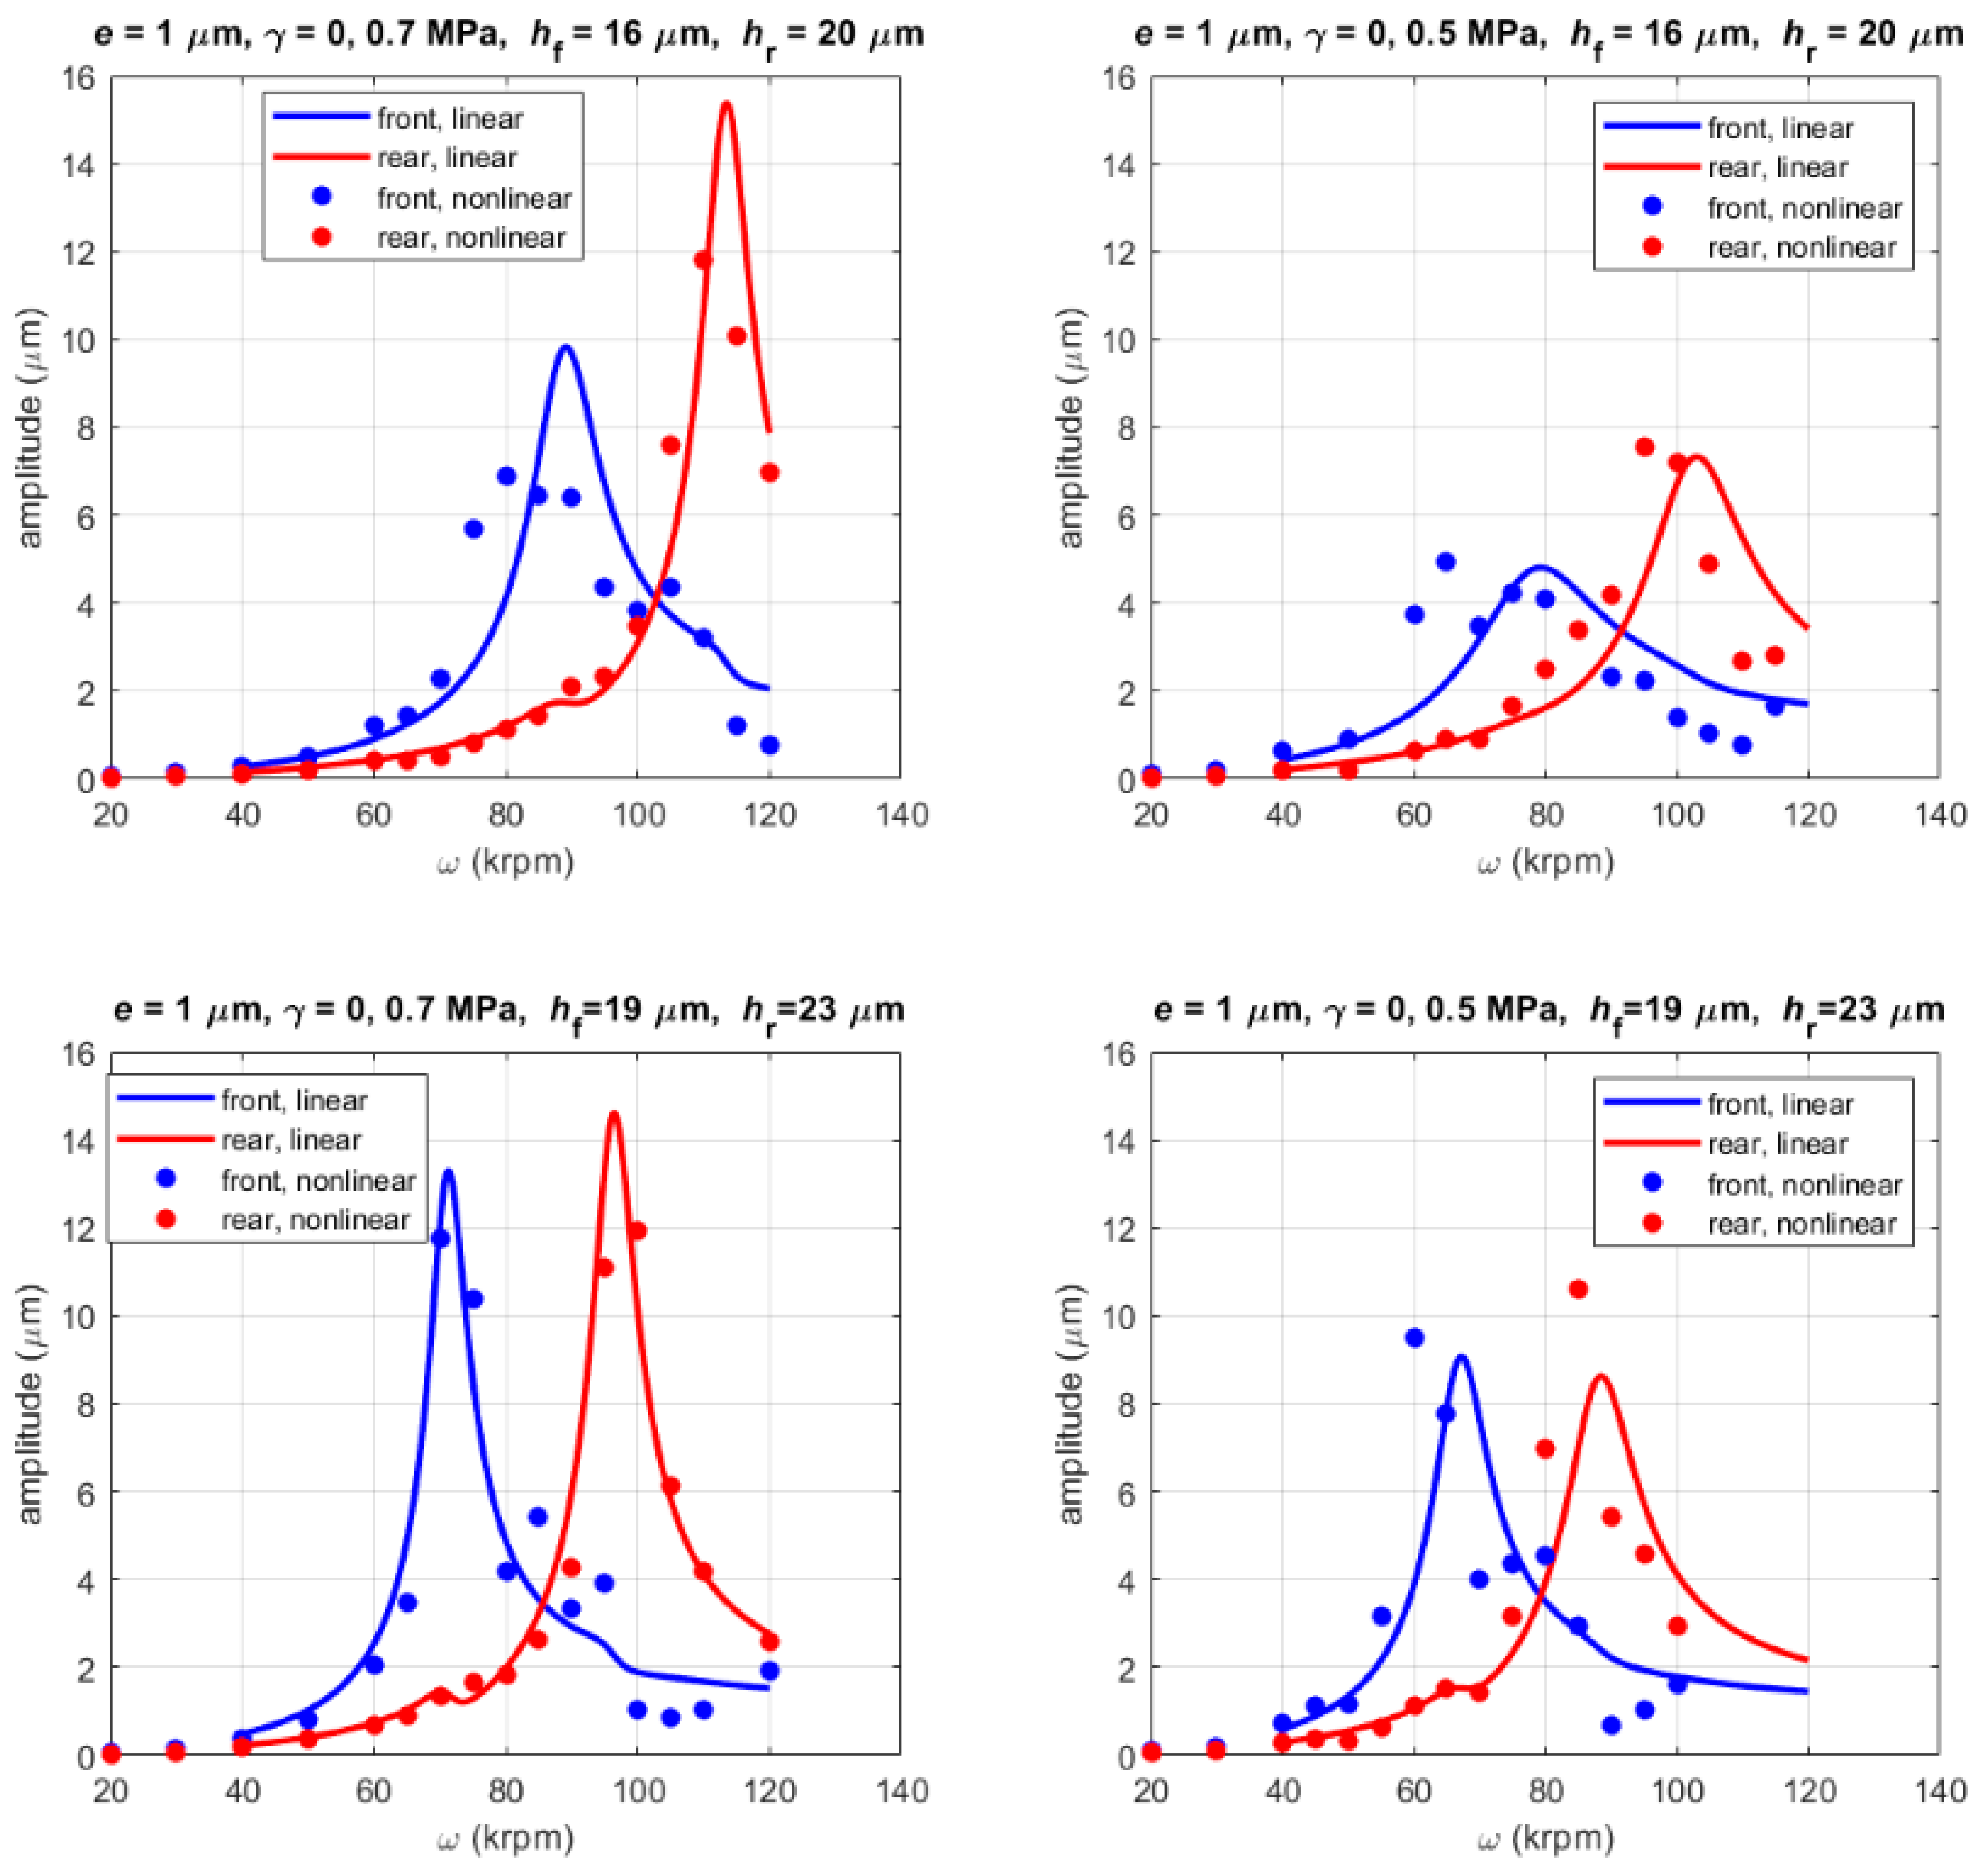
As is visible, the shaft trajectory converges to a limit cycle after an initial transient. The frequency content was evaluated calculating the FFT of the vibration signals, and the amplitude of the synchronous peak was recorded at different rotational speeds in order to reconstruct the unbalance response. The curves resulting from the nonlinear analysis are shown in Figure 10.
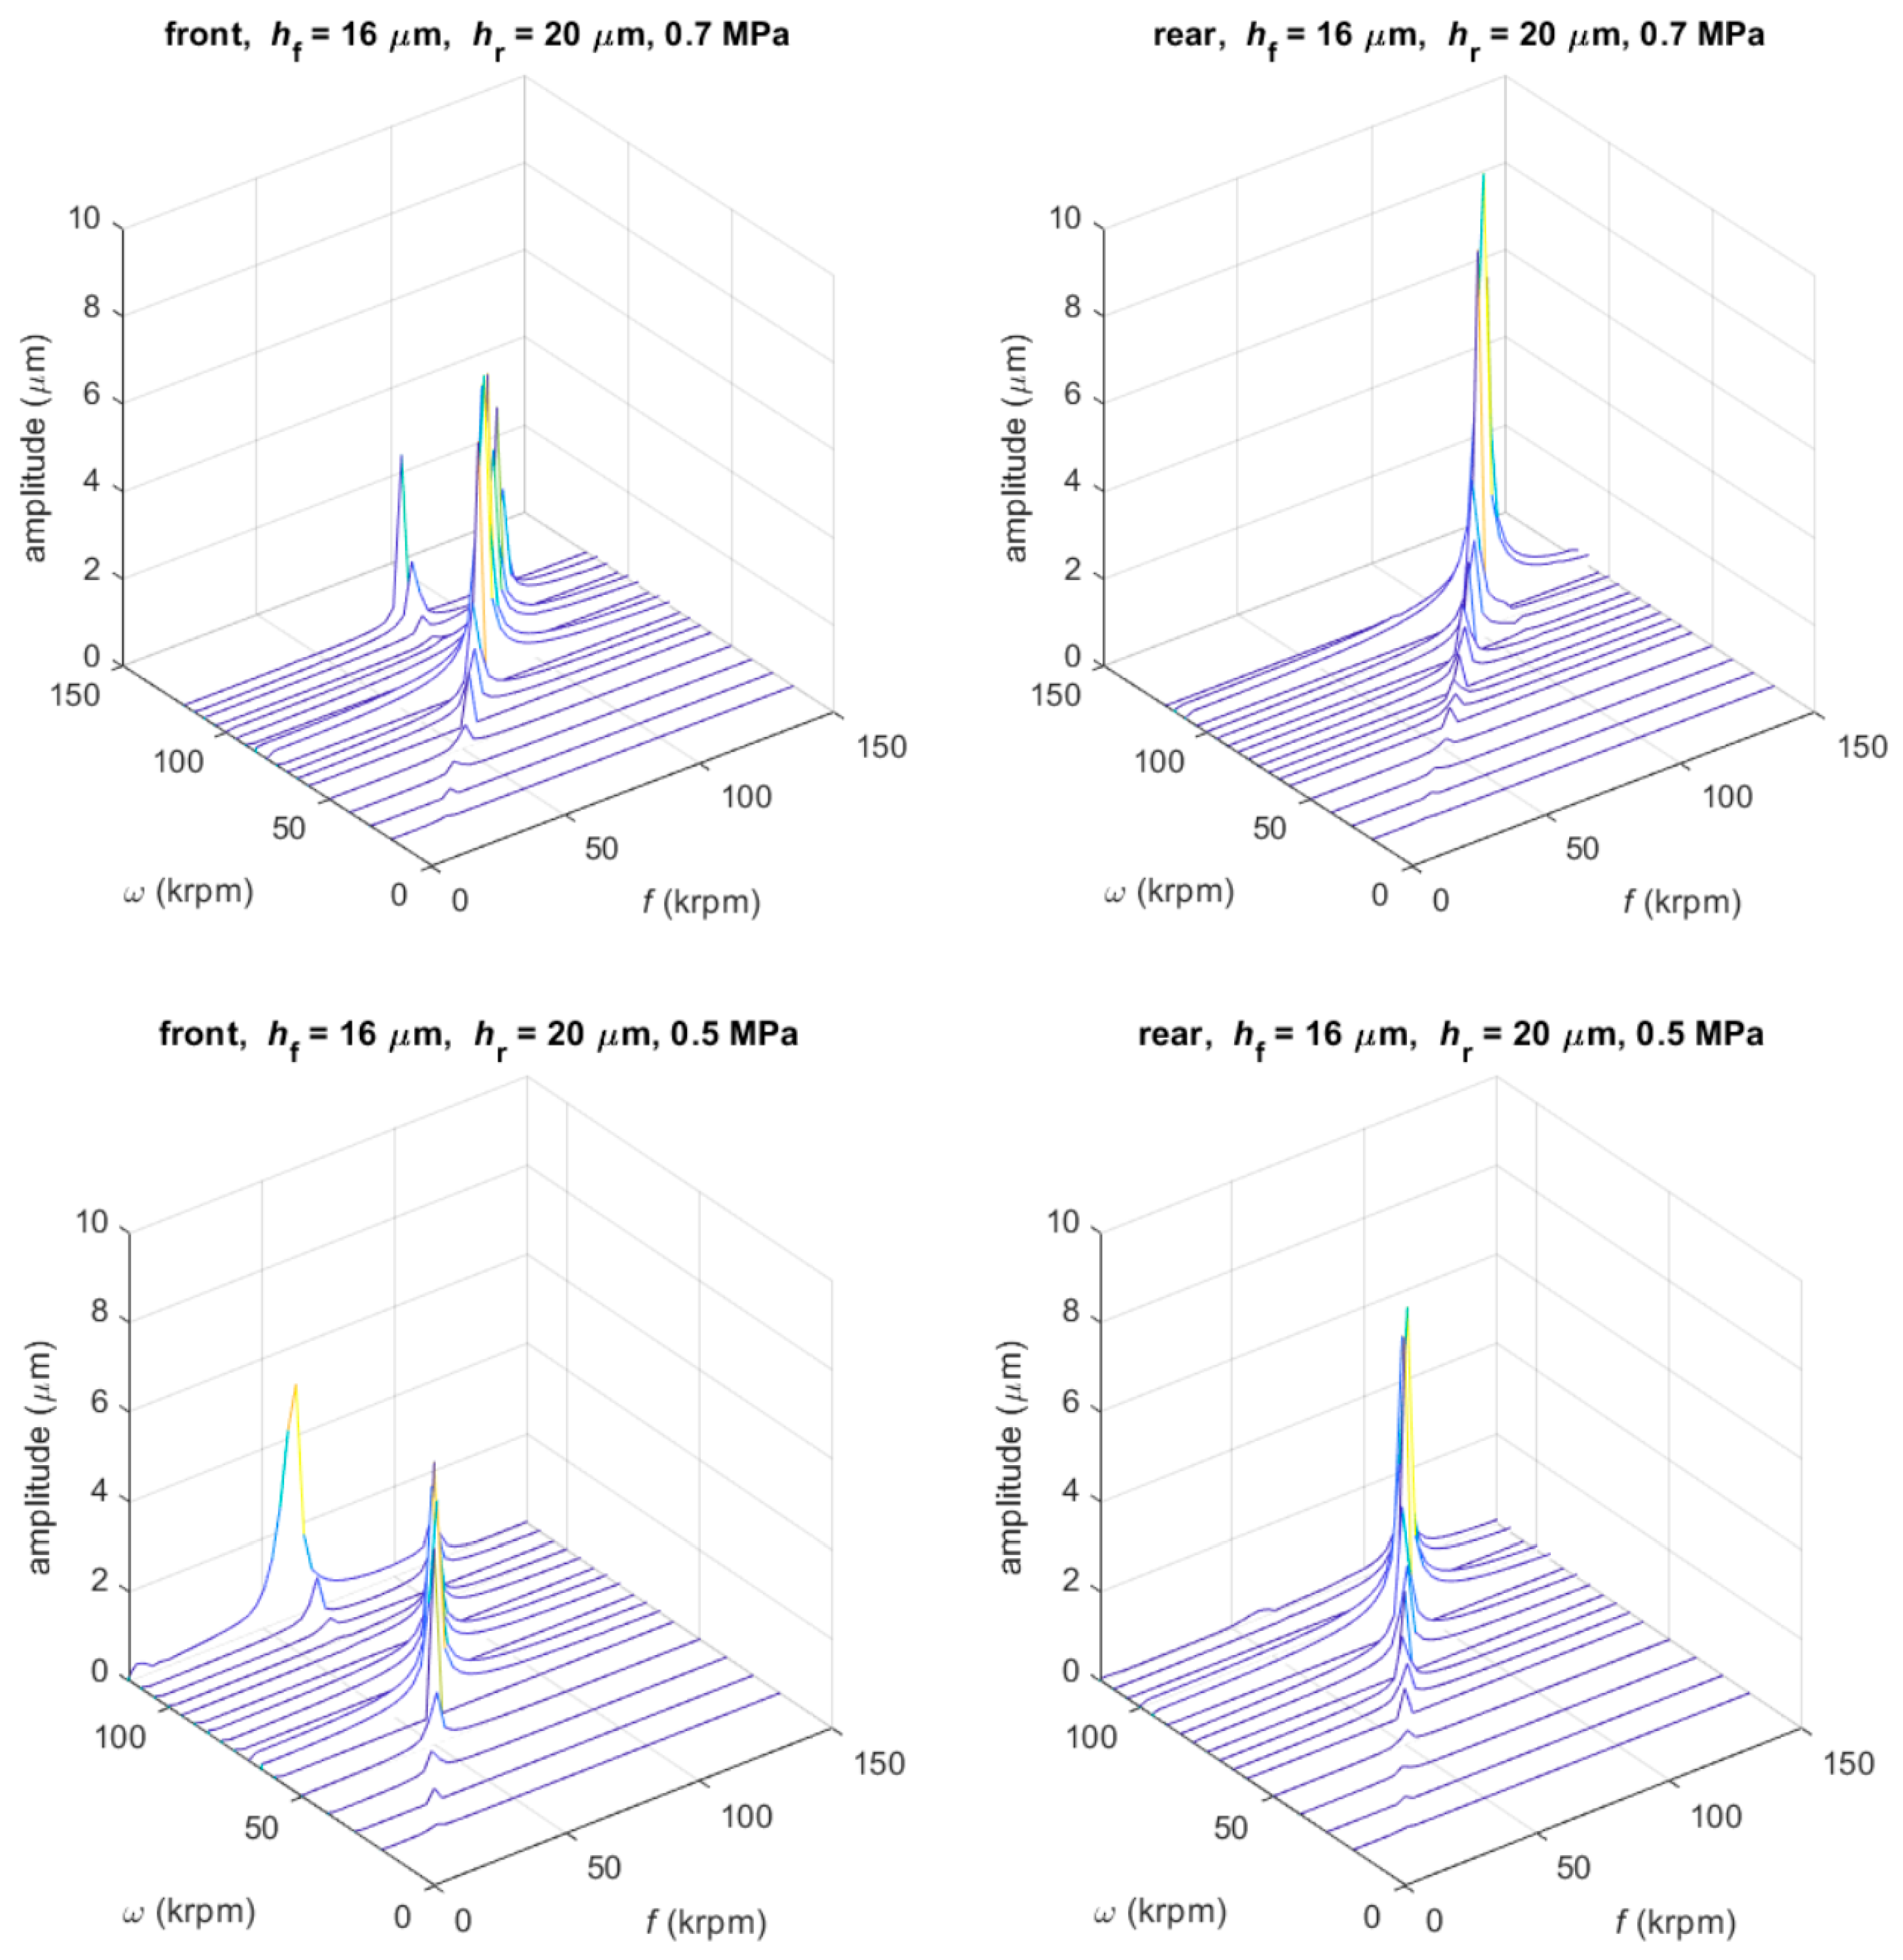
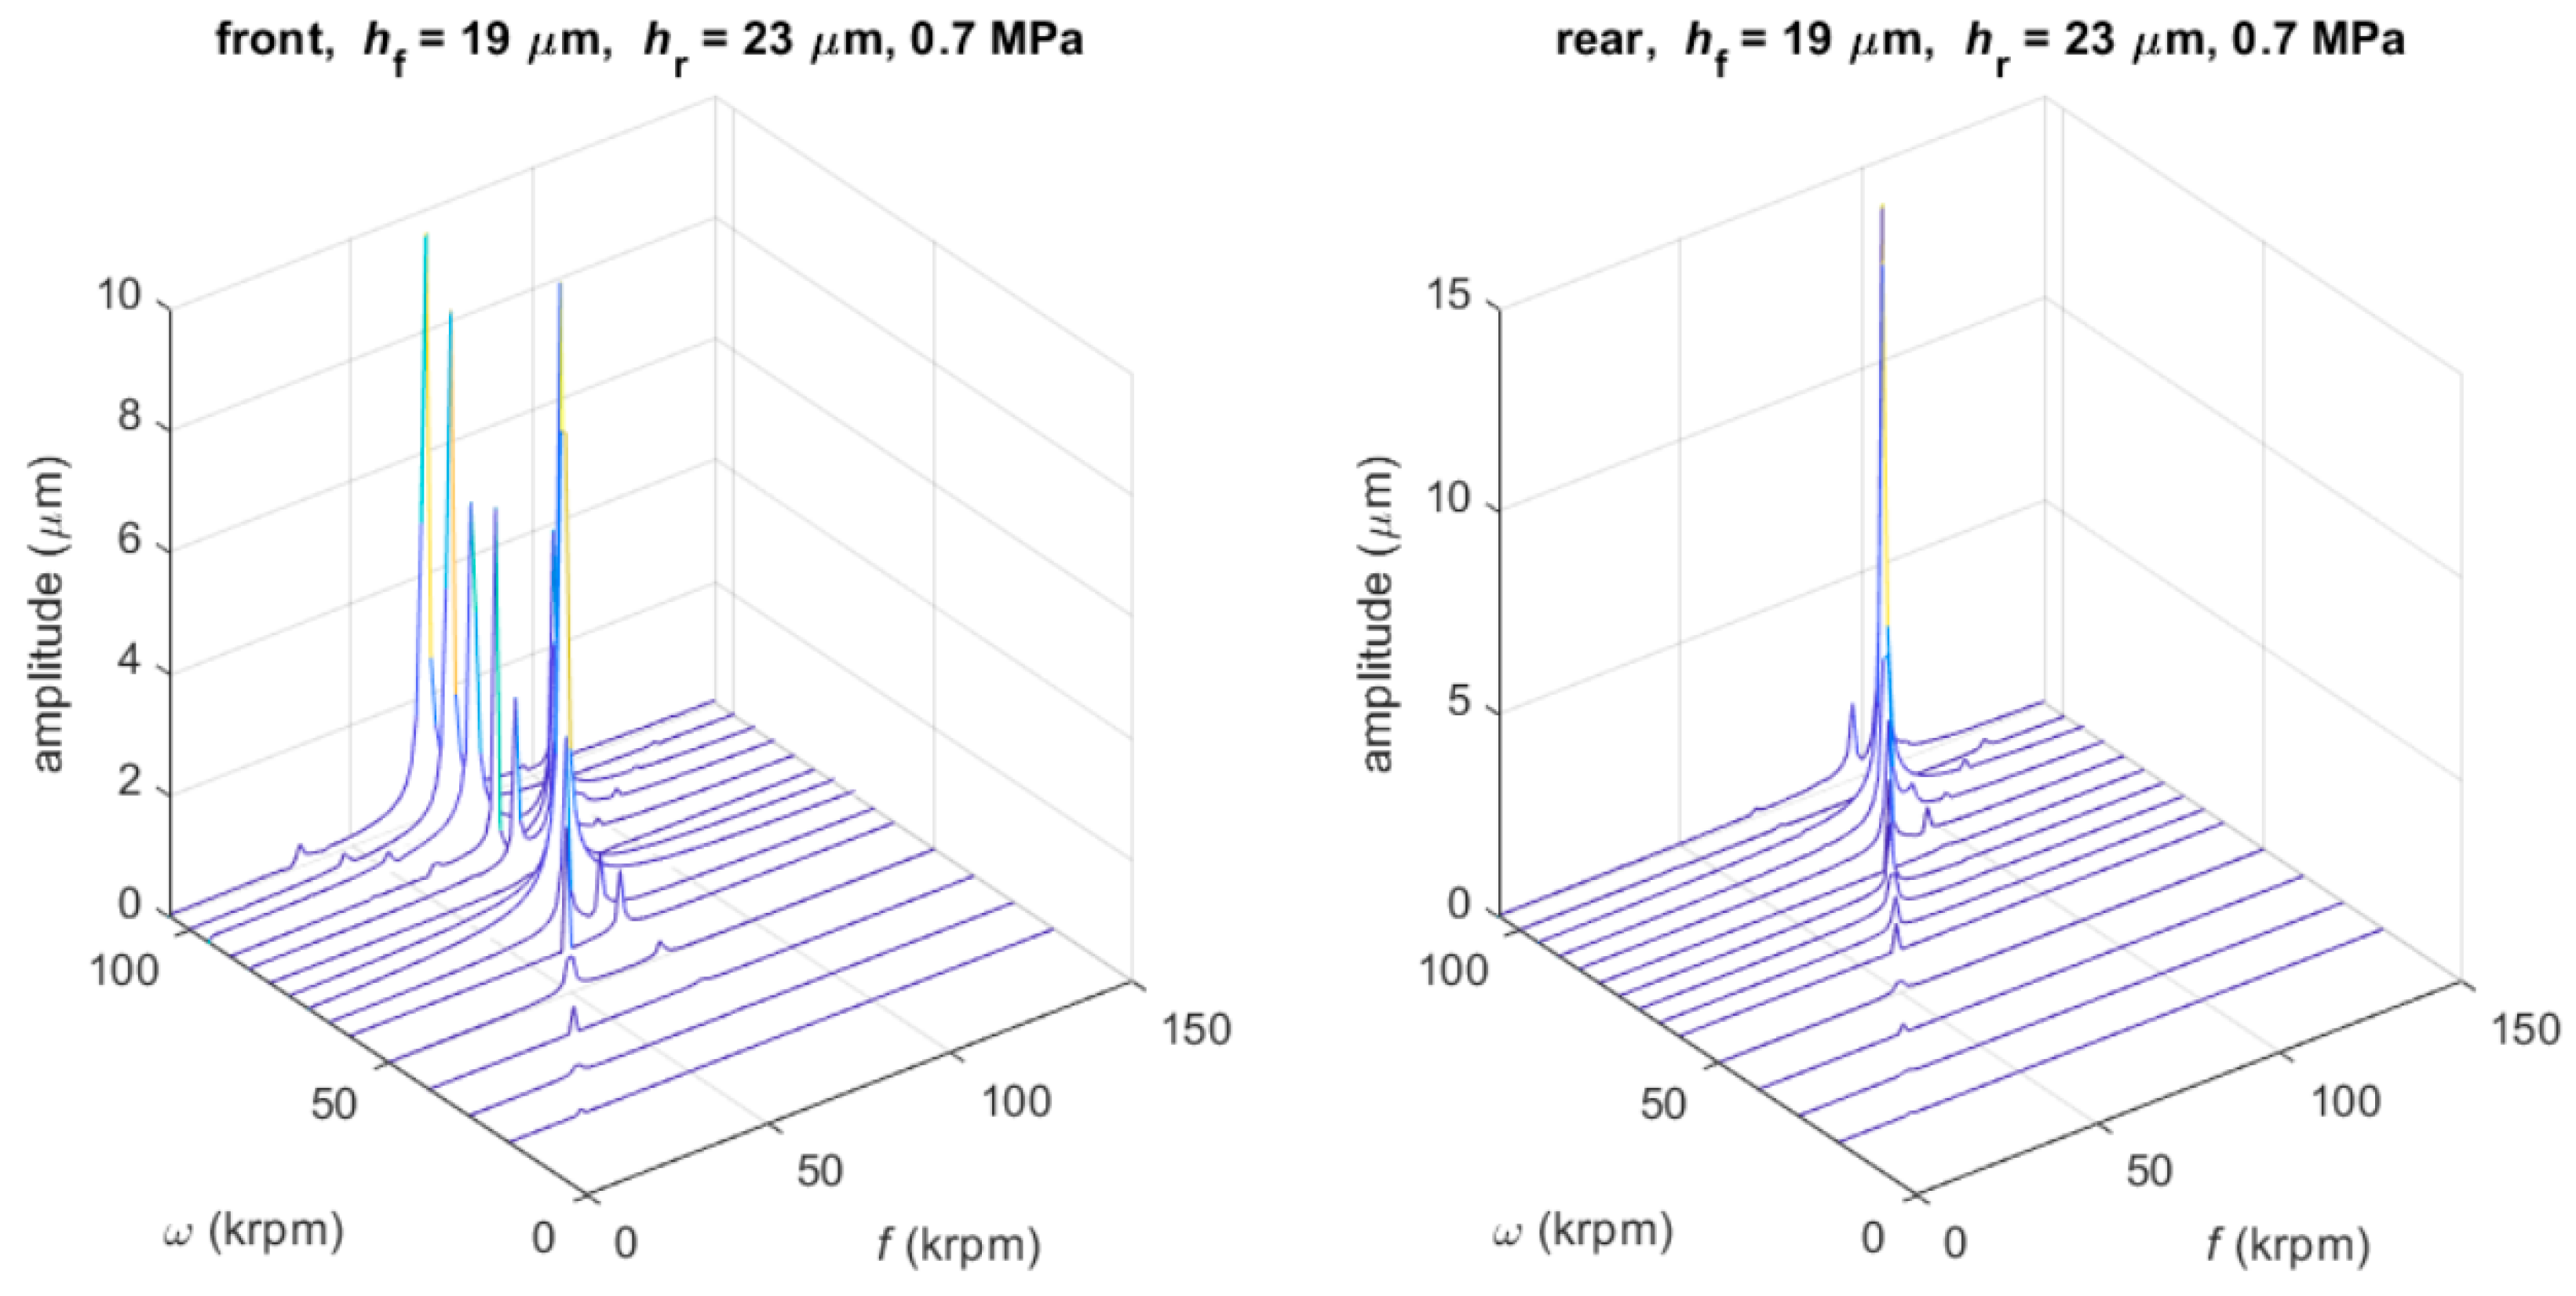
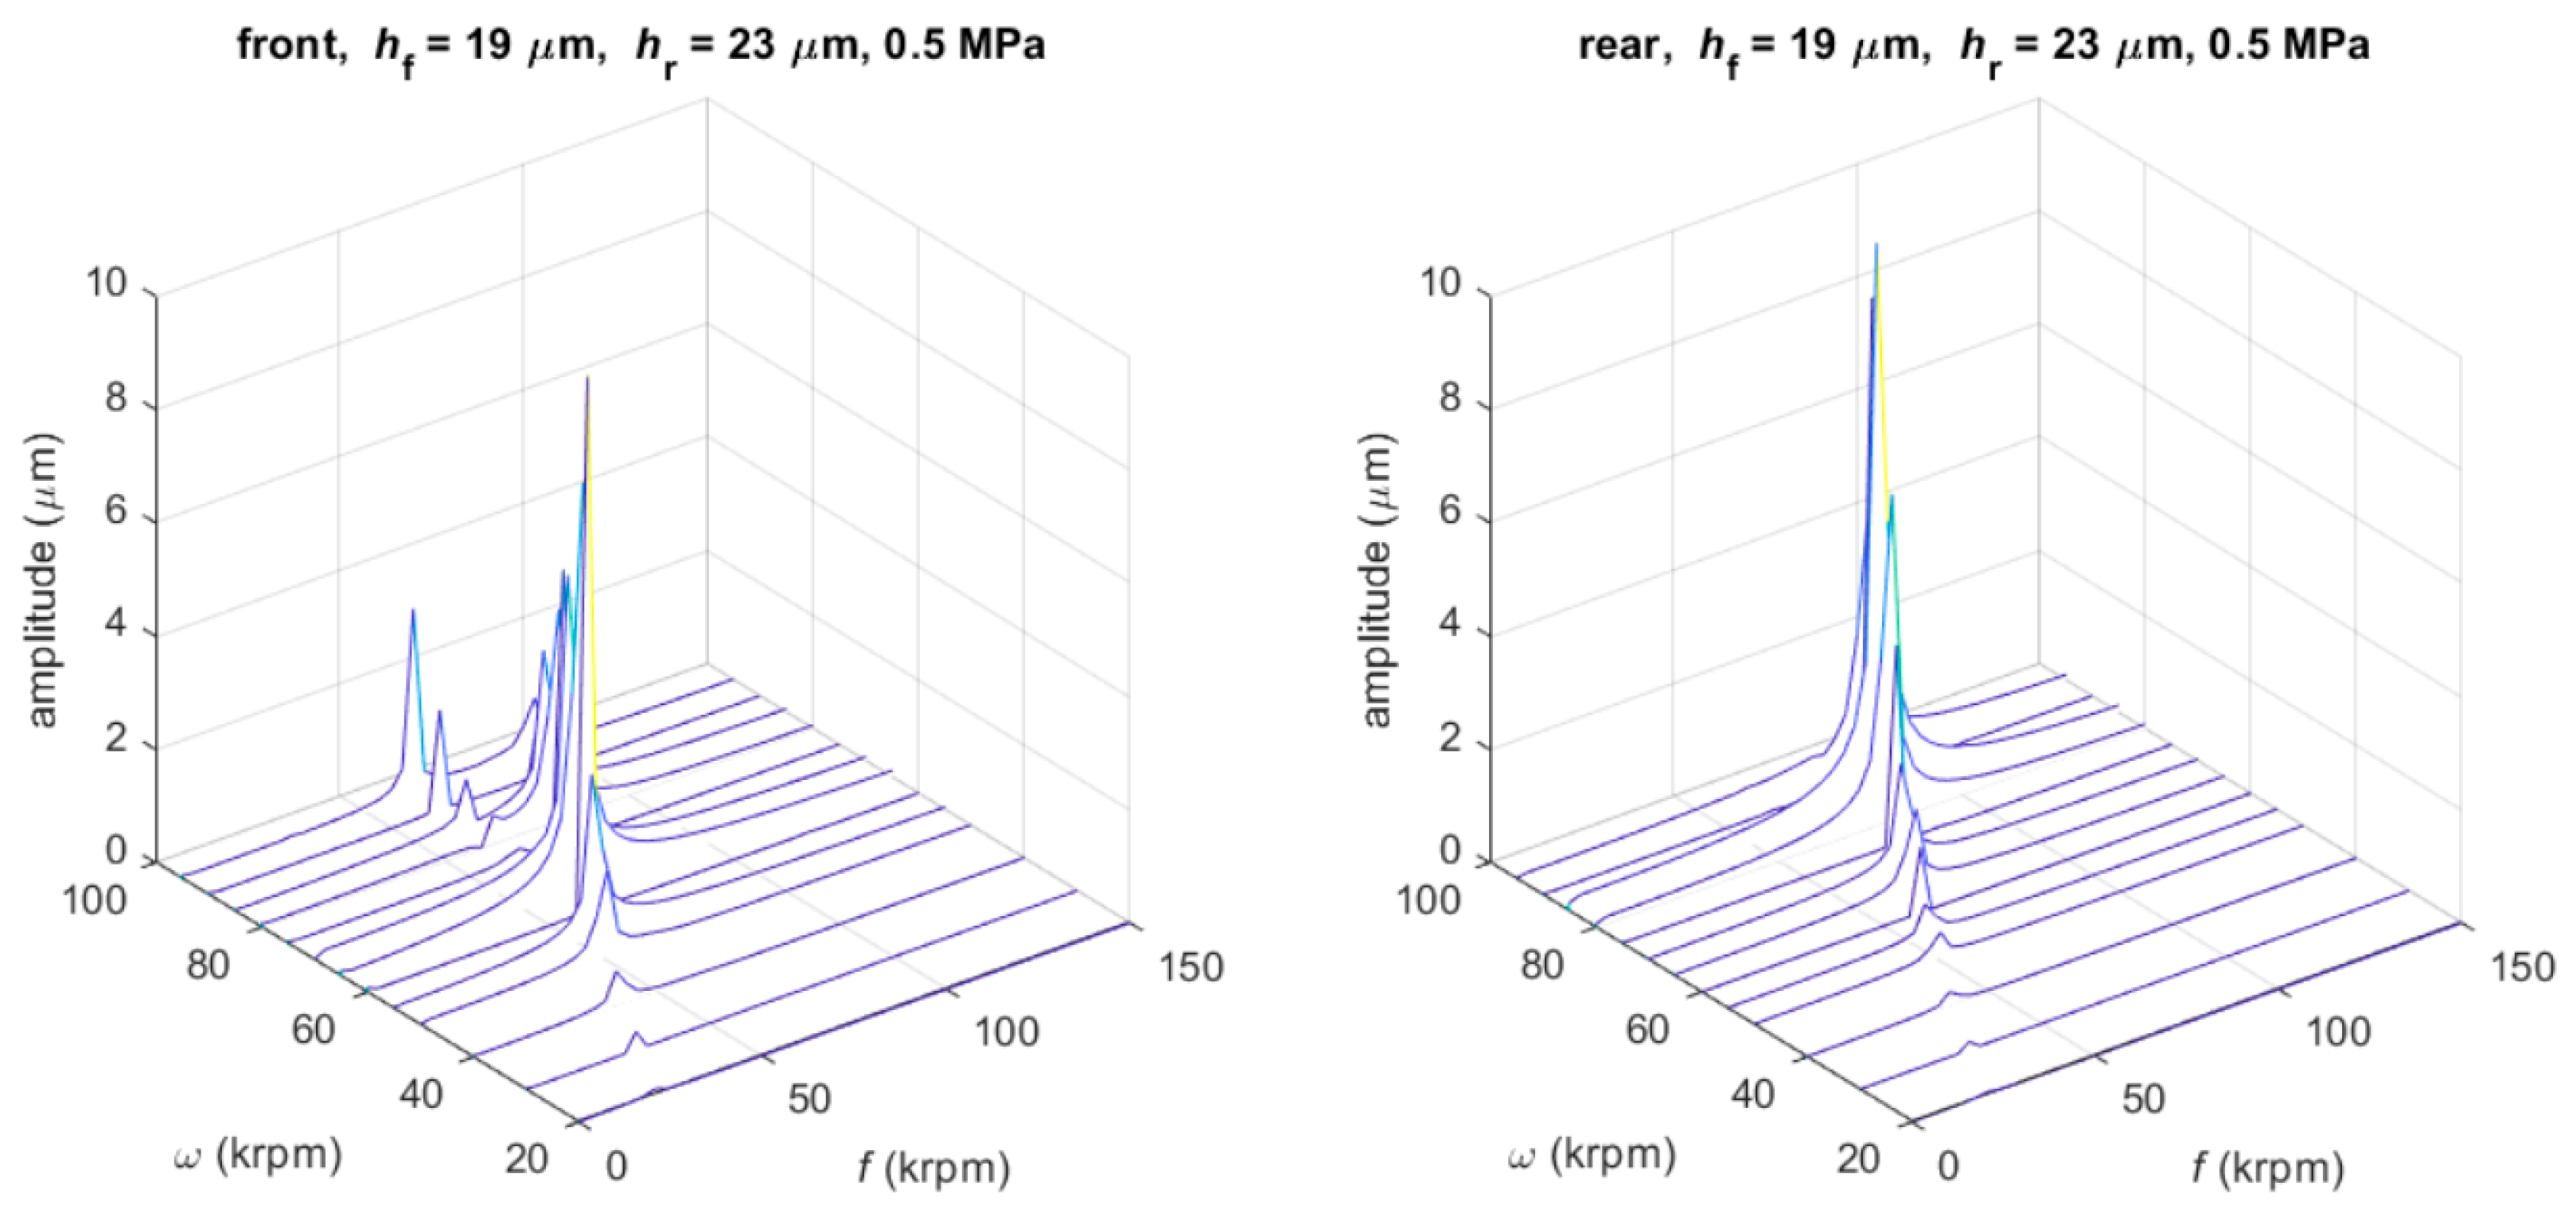
The onset of a subsynchronous whirl with minima air gaps and supply pressure ps = 0.7 and 0.5 MPa was detected on the front bearing for speeds above 100 krpm (see the waterfall diagrams in Figure 11). In the case of maxima air gaps with supply pressure ps = 0.7 and 0.5 MPa, a subsynchronous whirl was detected above 80 krpm (see Figure 12). The following considerations can be deduced from these numerical results:
  • The front bearing is the most critical one, due to the asymmetrical JB configuration with respect to the rotor center of mass.
  • Although the spindle is stable in the experimental tests at all the operating speeds, the presence of a subsynchronous whirl at high speeds in the numerical results indicates that the front bearing is near the unstable whirl onset speed when the spindle is rotated at its maximum speed (about 100 krpm).
The condition of whirl instability was also investigated with the nonlinear model. The free vibration of a perfectly balanced rotor was calculated after an initial perturbation, applied to the rotor positioned in the centered condition. The damping factor of the vibration was evaluated via the logarithmic decrement method (see Ref. [22]). Figure 13 shows the damping factor of the vibration on the front bearing calculated at 20, 30 and 40 krpm at different supply pressures.

3.3. Linearized Model

We established a linearized model for fast calculation of the unbalance response of the rotor bearing system. This model has the advantage of providing a faster solution than the nonlinear one, and thus it is more suitable to identify the critical speeds of the system.

3.3.1. Air Film Dynamic Coefficients Determination

The linear stiffness and damping coefficients of the air film were determined through the nonlinear model, as described below. A sinusoidal trajectory was imposed on the rotor and the forces transmitted to the rear and front JBs were computed.
The sinusoidal trajectory was applied along the x axis:
x = x 0 sin ν t
The force components can be expressed by:
F x ( t ) = k x x x ( t ) c x x x ˙ ( t ) ;     F y ( t ) = k y x x ( t ) c y x x ˙ ( t )
The stiffness coefficients were computed at the time instants t k when x ˙ = 0 from the calculated force components (only stiffness contribution). Similarly, the damping coefficients were computed at the time instants t c when x = 0 from the calculated force components (only damping contribution).
k x x = F x x | t = t k ; k y x = F y x | t = t k c x x = F x x 0 ν | t = t c ; c y x = F y x 0 ν | t = t c
If calculated in the rotor centered position, the direct coefficients along x and y direction coincide, while the cross coefficients have opposite sign: k y y = k x x , c y y = c x x , k x y = k y x , c x y = c y x . As these coefficients are a function of both the rotational speed ω and the perturbation frequency ν, these two parameters are, in general, independent. In case the synchronous unbalance response must be determined, it was considered ν = ω.
The linearized coefficients were calculated with the following conditions:
  • Synchronous excitation (ν = ω);
  • Small shaft eccentricity (x0 = 1 µm);
  • 0.5 and 0.7 MPa absolute supply pressure;
  • Minima and maxima air film thicknesses (to take into account the manufacturing tolerances and the centrifugal expansion of the shaft).
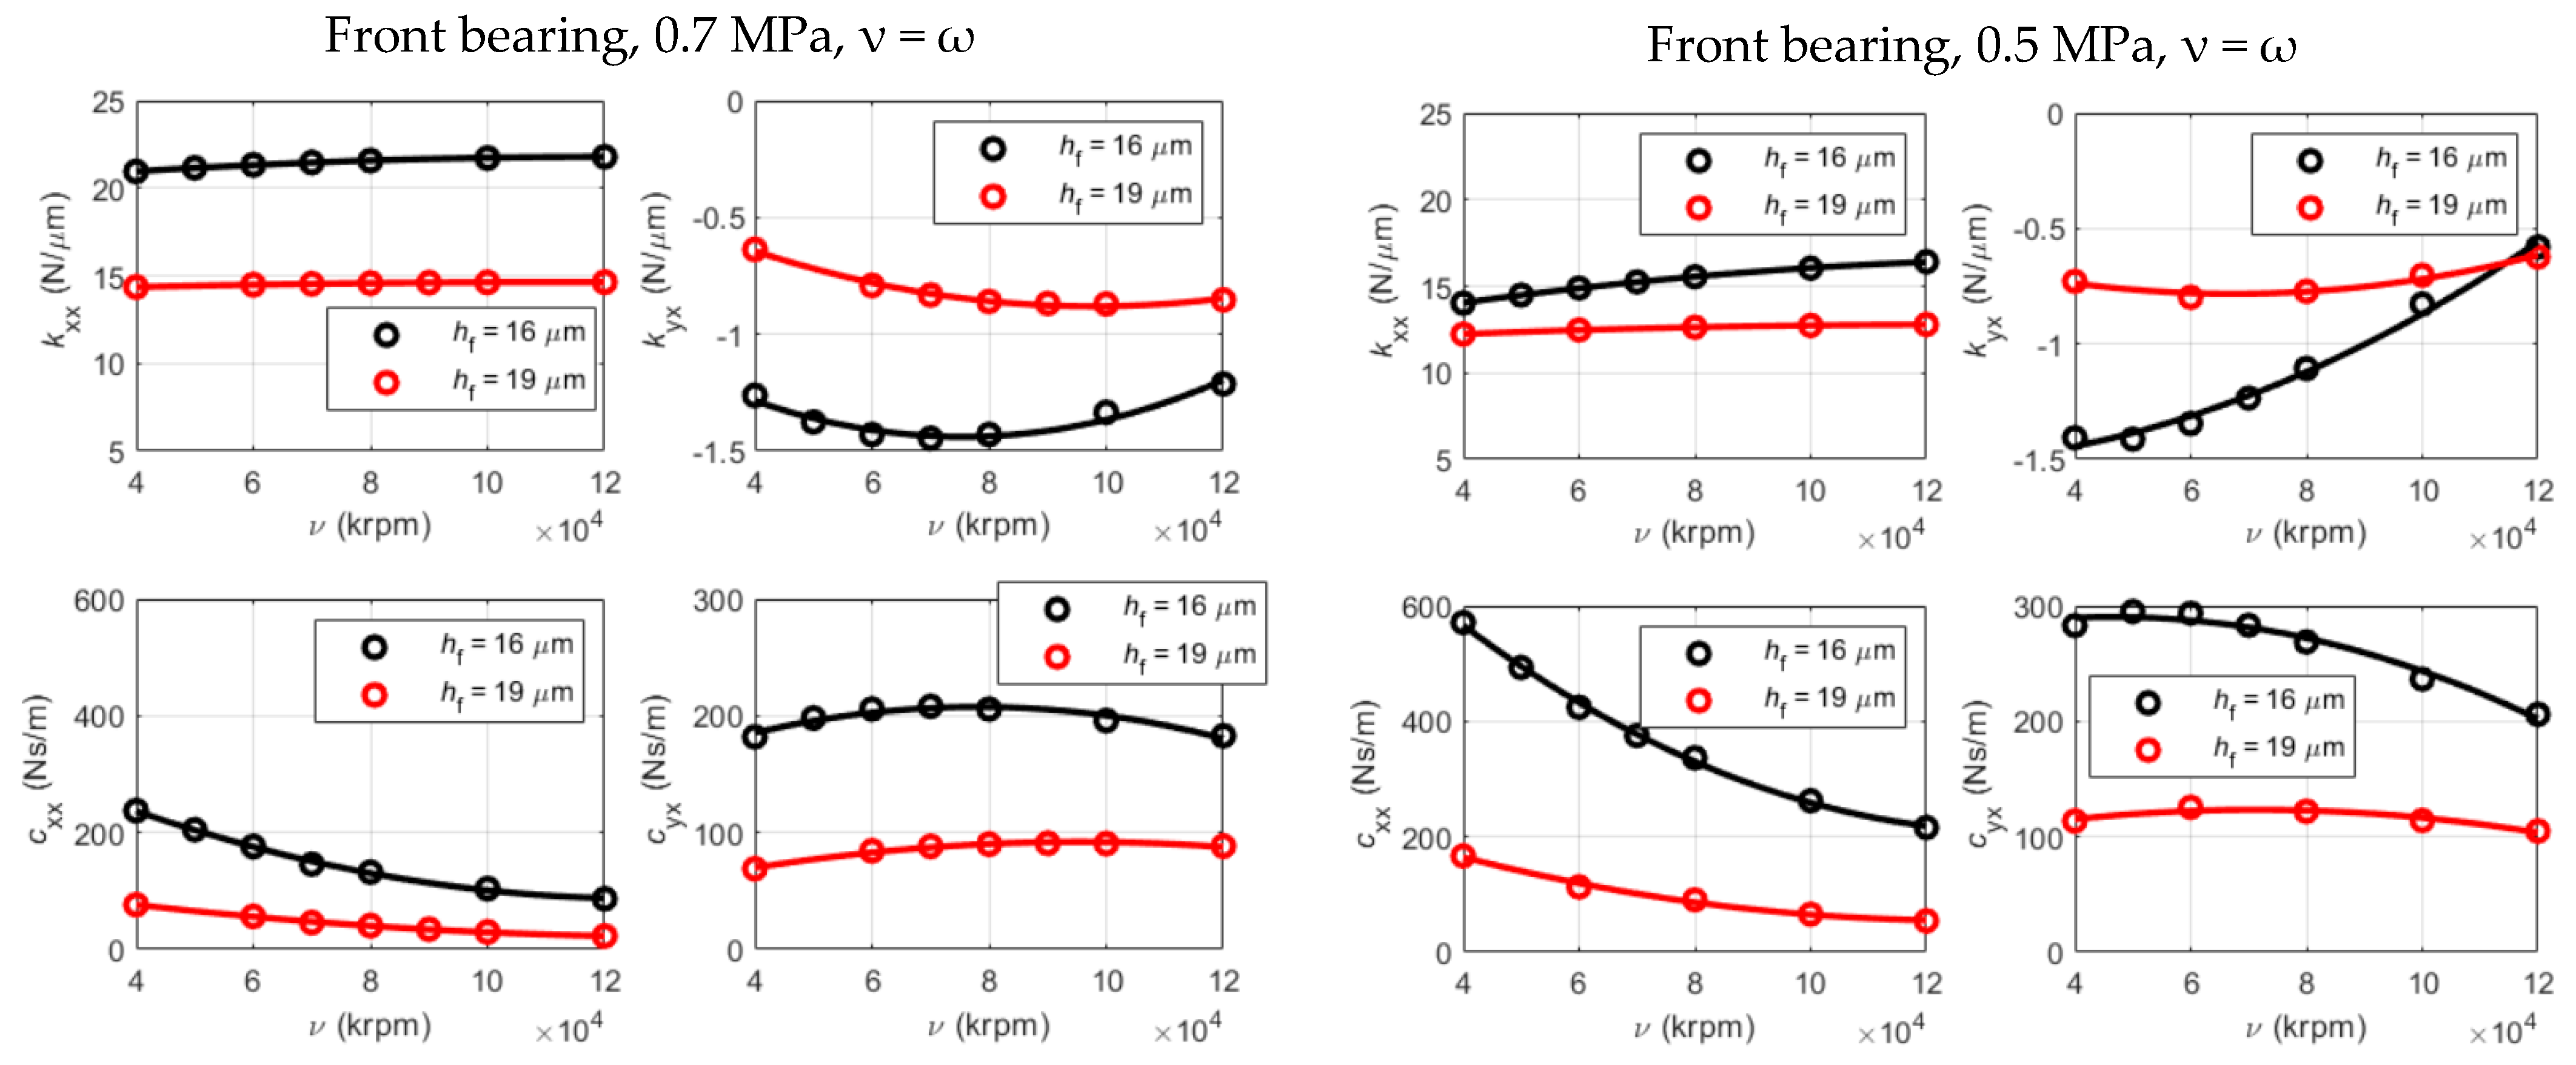
The minima radial thicknesses are hf = 16 µm and hr = 20 µm on the front and the rear JBs, respectively, while the maxima values are hf = 19 µm and hr = 23 µm. The values of the coefficients are obtained at discrete perturbation frequencies and are then interpolated with polynomial expressions of second degree. The calculated and interpolated values are shown in Figure 14. The sensitivity of the coefficients with respect to the film thickness is high: an increase of 3 µm in the film thickness (18% in the case of minima film thicknesses and 15% in the case of maxima film thicknesses) has the effect of doubling the cross-stiffness and tripling the damping coefficients. The supply pressure also influences the coefficients; in particular, a decrease in the supply pressure involves an increase in direct damping coefficients and a decrease in direct stiffness coefficients. Increasing the speed in synchronous conditions, the direct stiffness increases while the direct damping decreases.

3.3.2. Unbalance Response

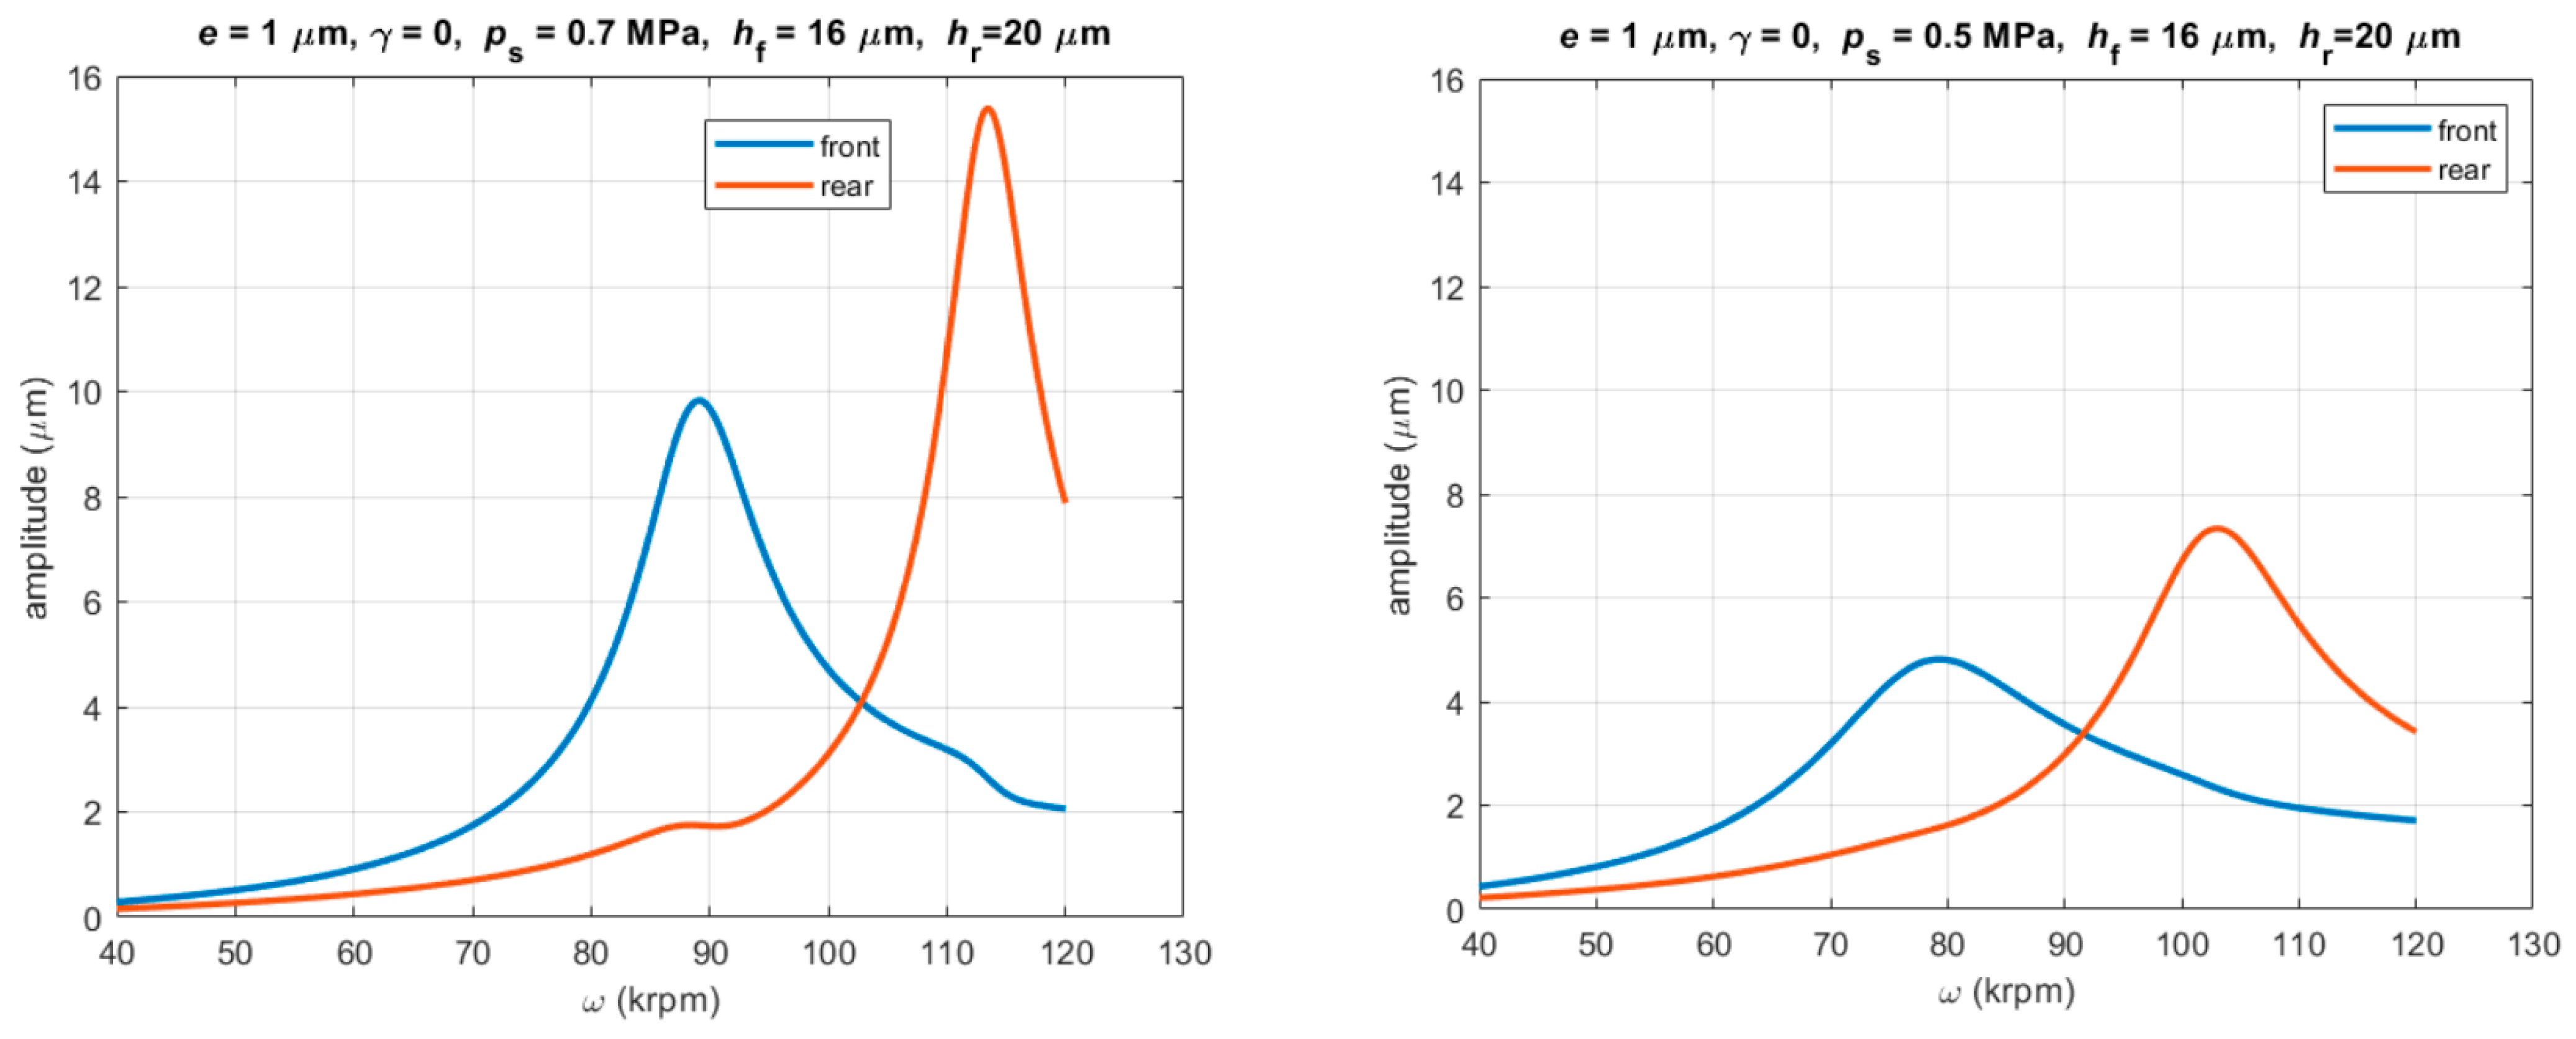
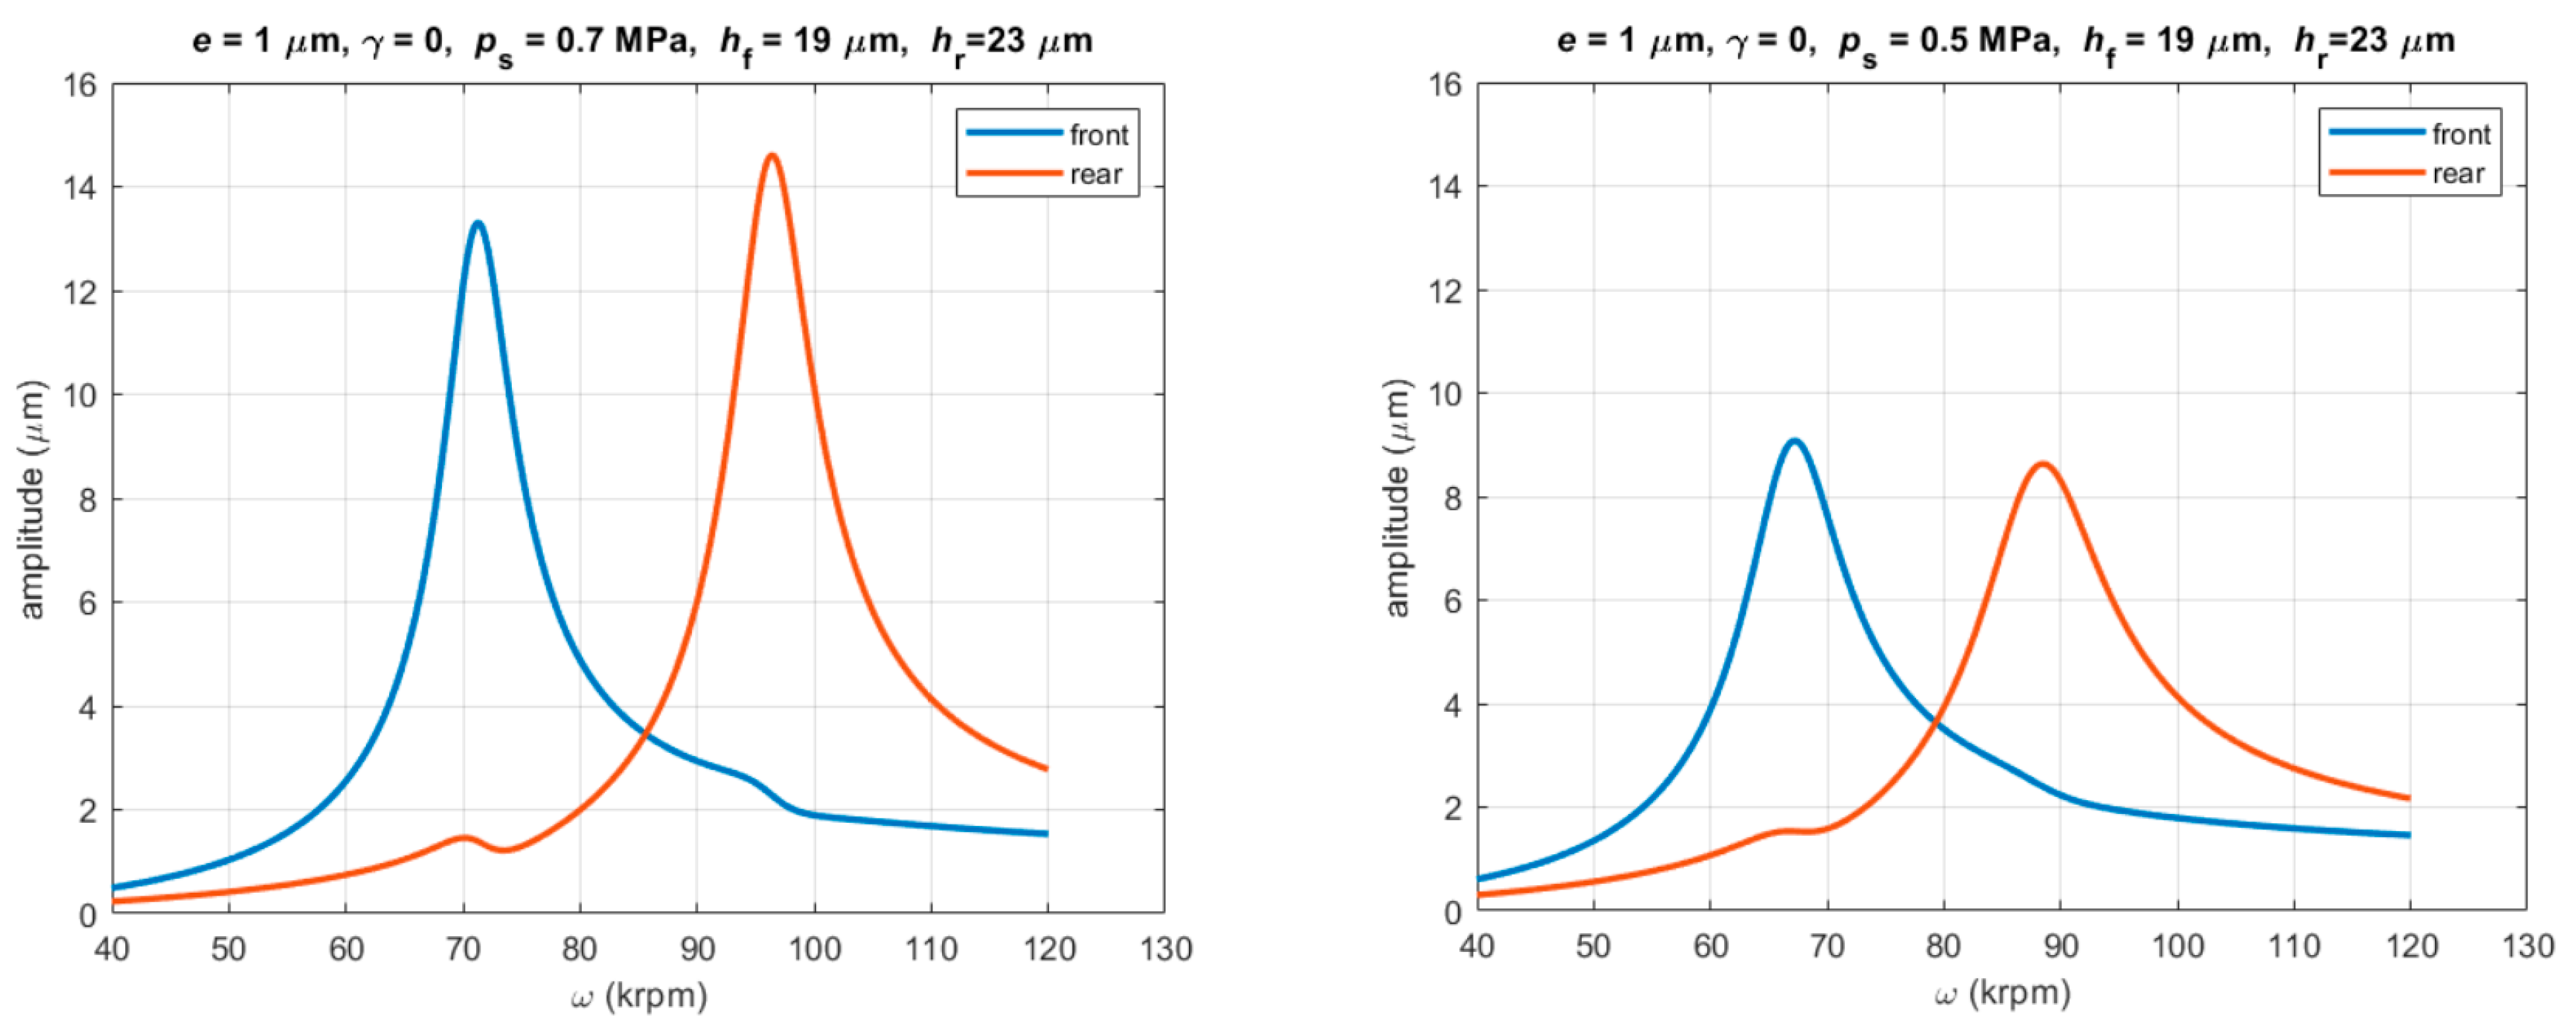
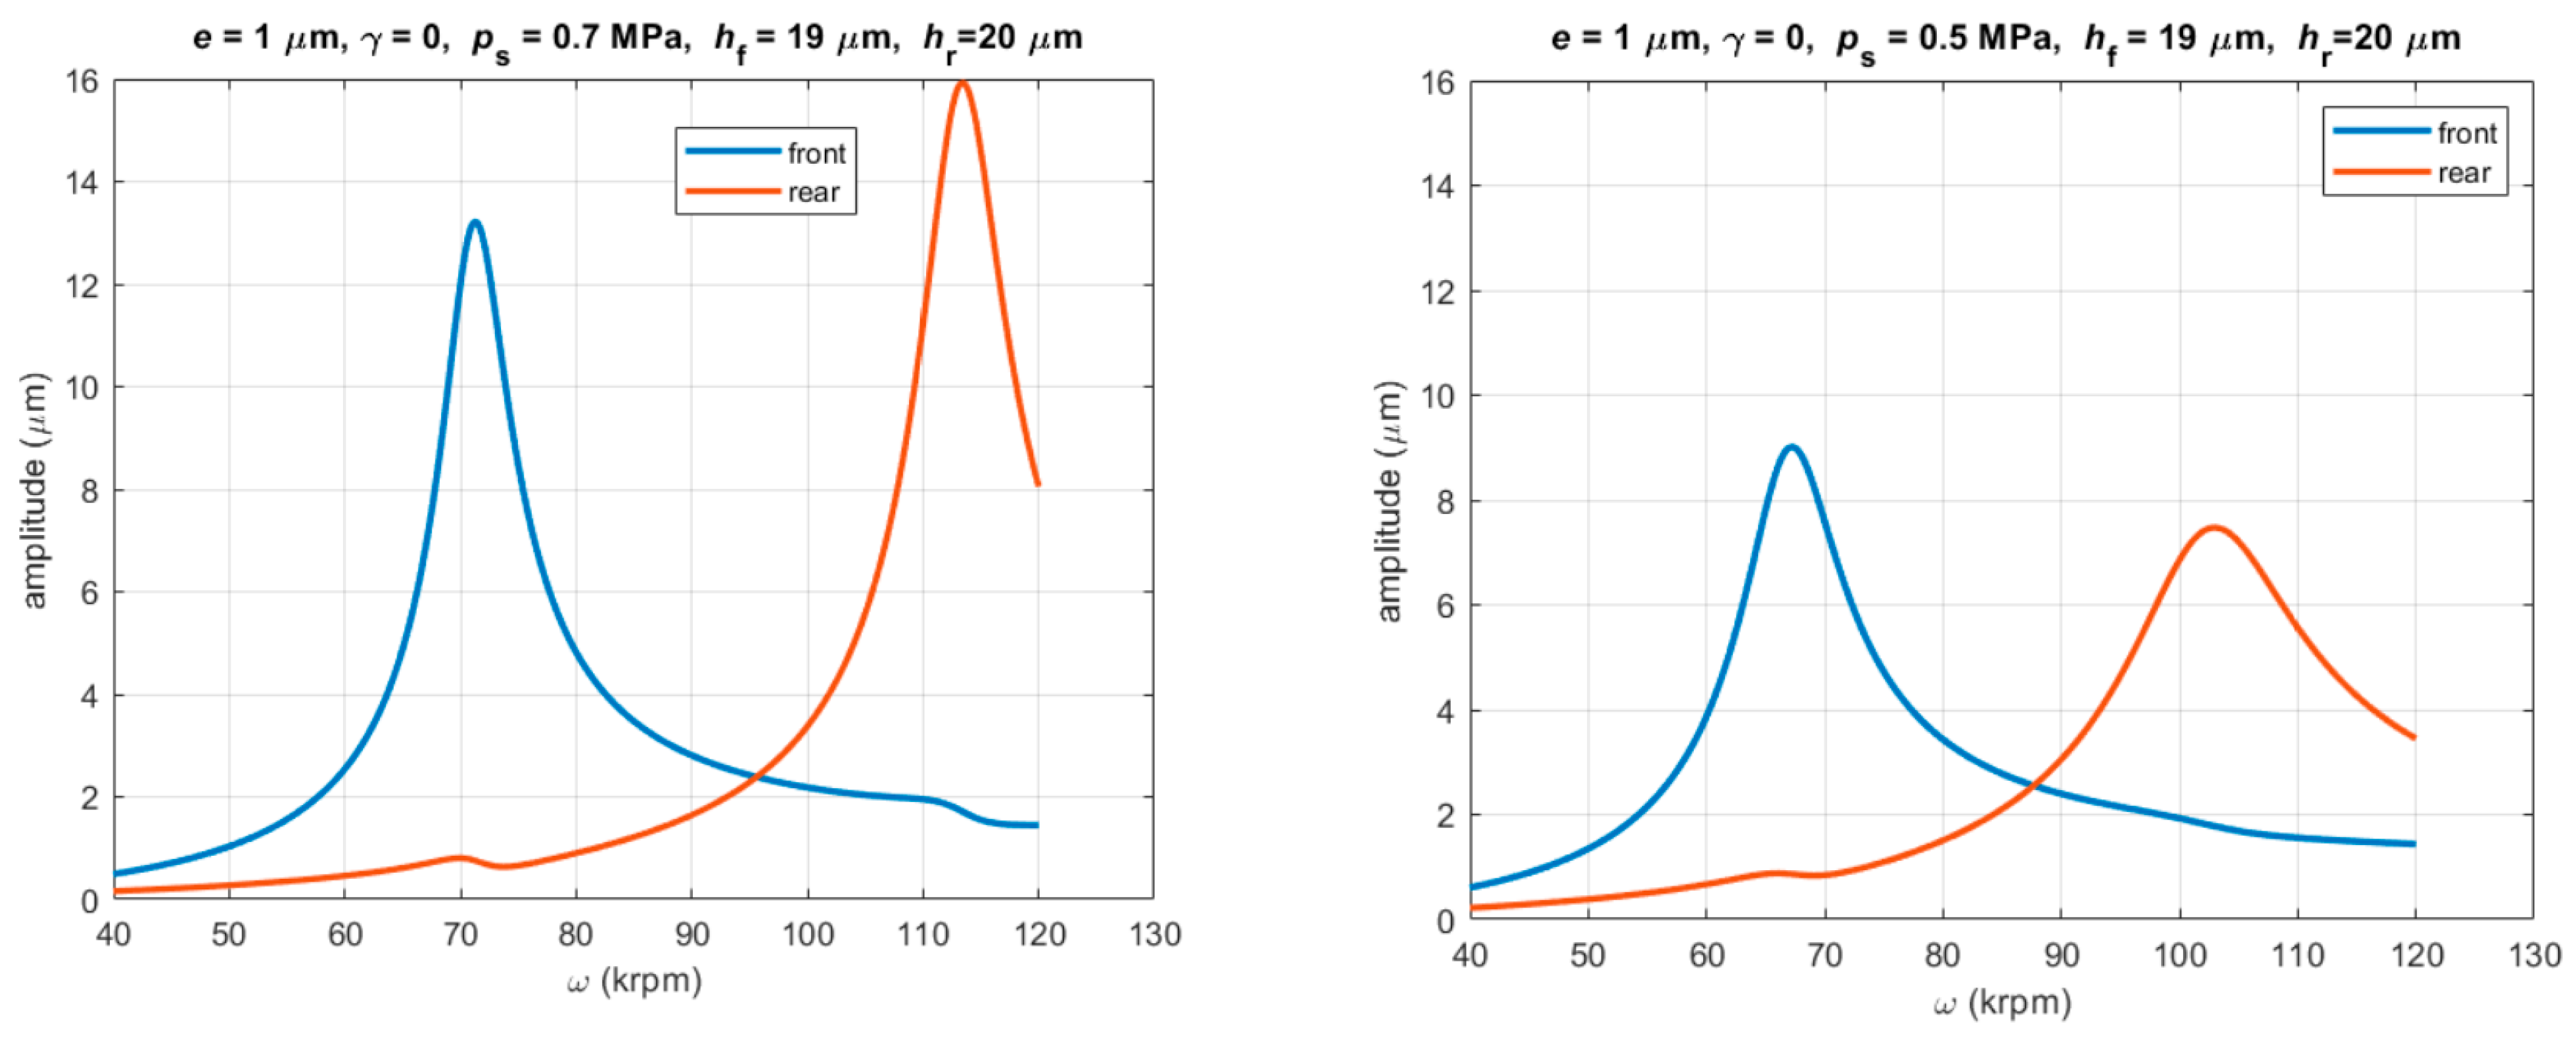
The synchronous stiffness and damping coefficients shown in Section 3.3.1 were inserted into Equation (7) to compute the linearized unbalance response. Figure 15, Figure 16, Figure 17 and Figure 18 show the amplitude of the vibration measured in the front and rear bearings at 0.7 and 0.5 MPa with minimum or maximum air gaps.
An increase in the film thickness of a bearing involves the decrease in the correspondent critical speed. For the geometry considered, the unbalance response curves seem to be quite independent, as the variation in the film thickness on one bearing (compare Figure 15 with Figure 17 or Figure 16 with Figure 18) has little effect on the response of the other bearing. A similar effect is visible when decreasing the supply pressure, which involves a decrease in the stiffness of all JBs. Due to the higher damping, at smaller supply pressure, the unbalance amplitude reduces.
The information about the phase between the signals measured on the rear bearing with respect to the front bearing is not relevant for this study. However, for the sake of completeness, both cylindrical and conical modes are involved in the two critical speeds. At the first critical speed, the phase in cases shown in Figure 15, Figure 16, Figure 17 and Figure 18 is between 60° and 75°, while at the second critical speed, the phase is in the range of 70° to 110°.

4. Discussion

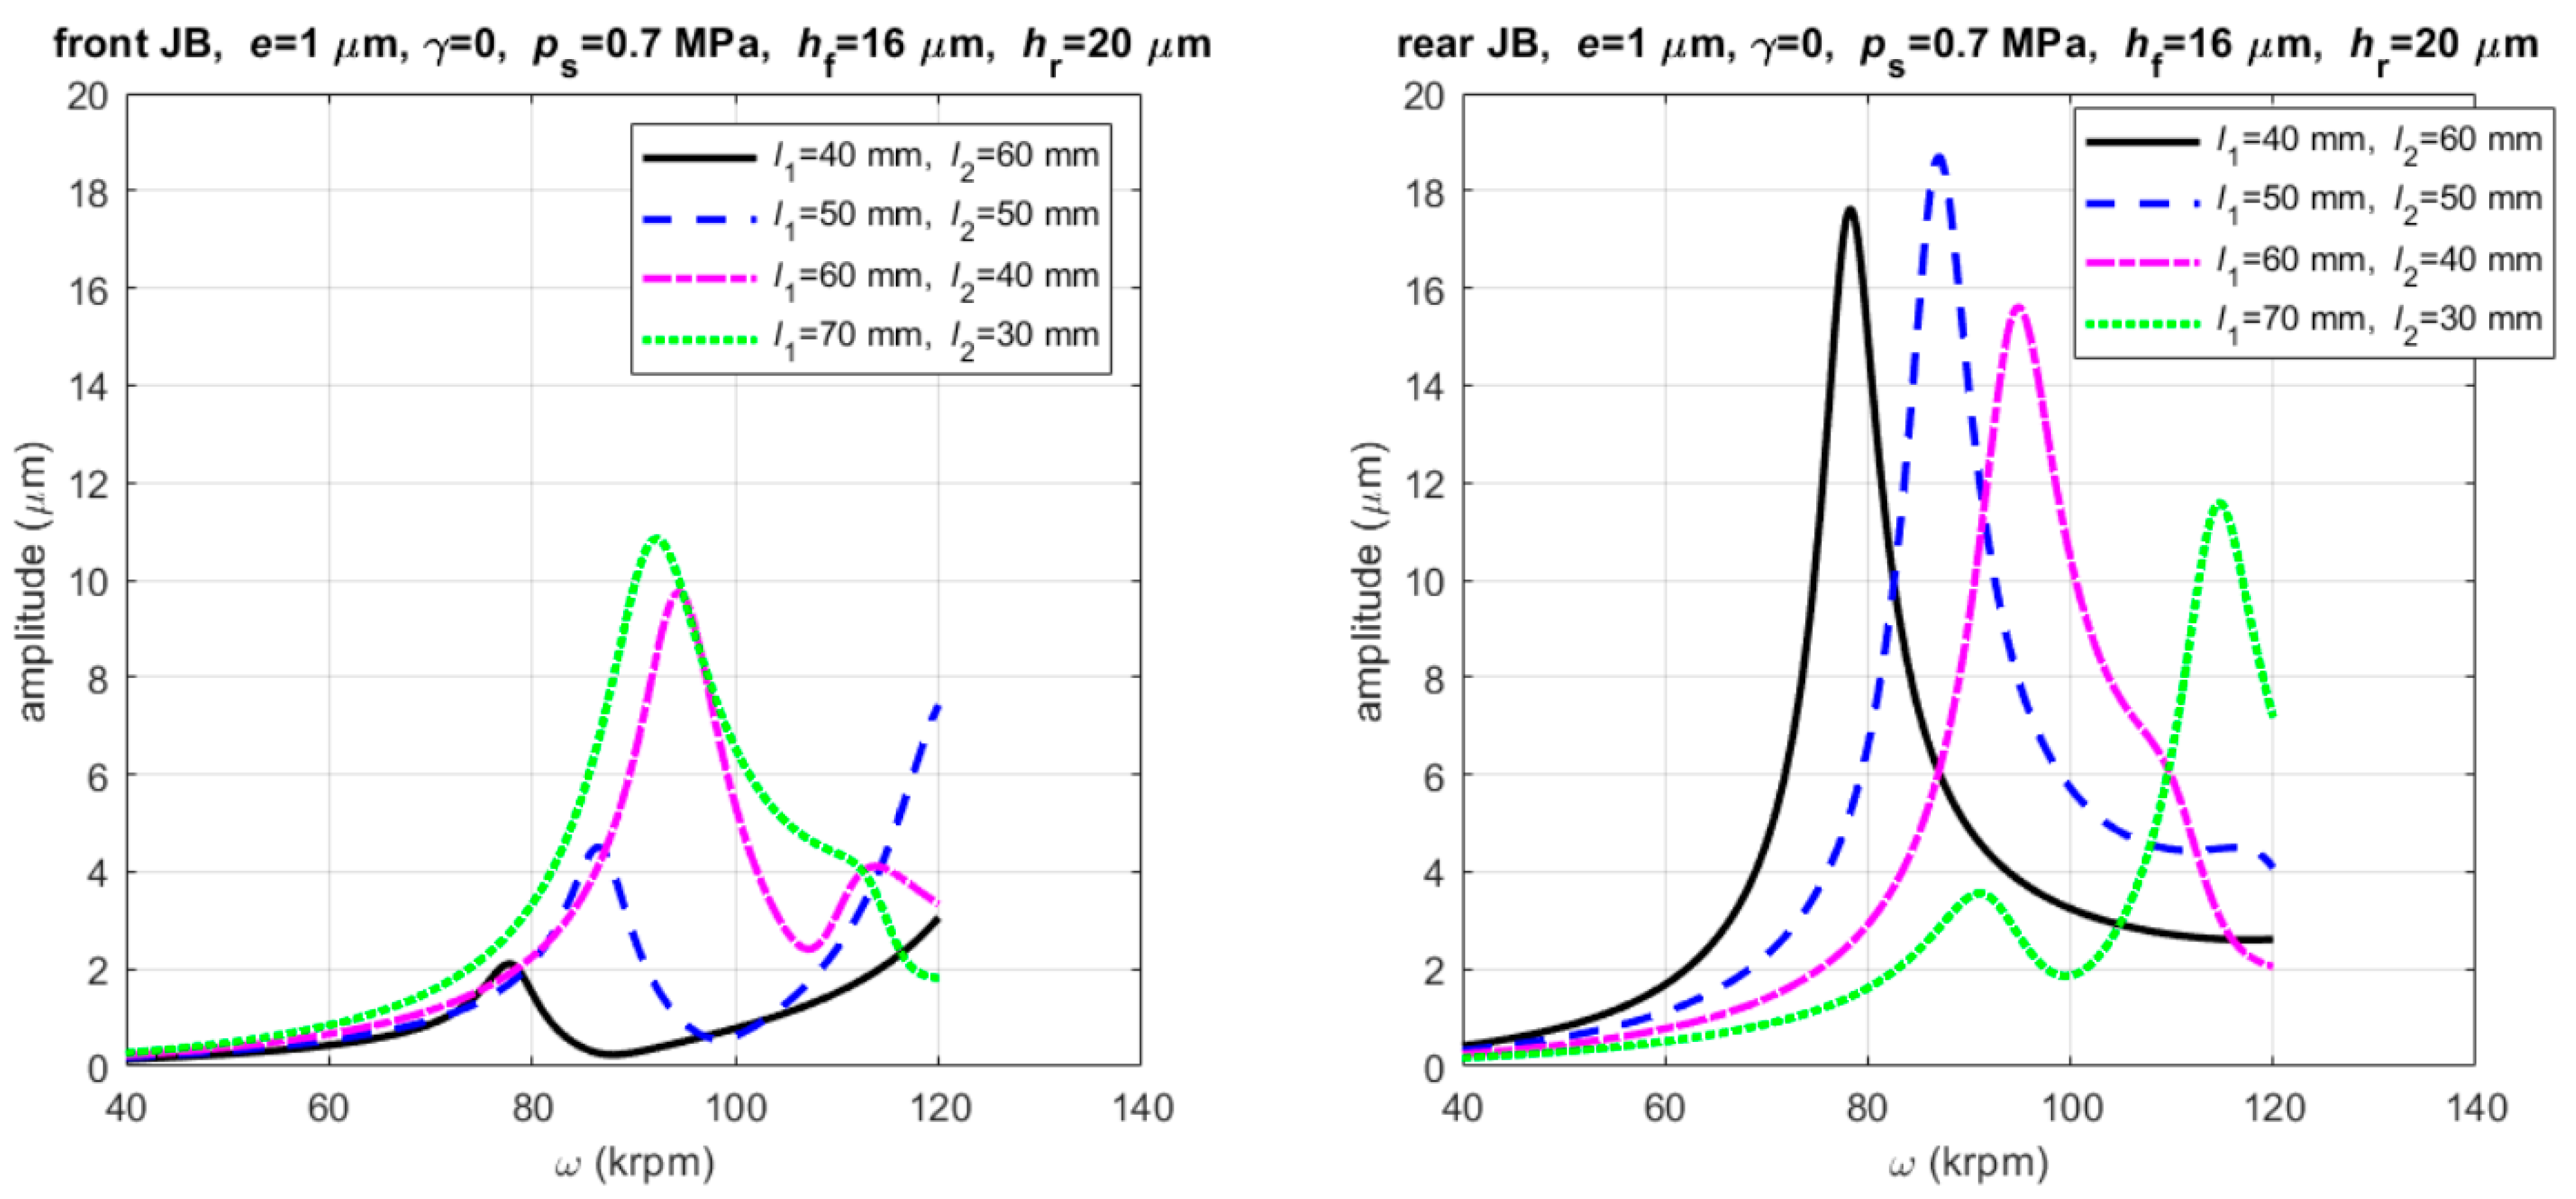
The effect of the JBs’ configuration was evaluated with the linearized method calculating the unbalance response corresponding to the bearings. Different configurations were analyzed by moving the rotor center of mass in different positions. As is visible in Figure 19, we found that the amplitude of vibration on a bearing increases (or decreases) when the rotor center of mass is approached (or departed from) by the bearing. These results are useful to modify the geometry of the rotor bearing system in order to decrease the dynamic runout.
Moreover, in the case of the symmetric configuration of JBs with respect to the center of mass (same geometry of JBs and same distance l1 = l2), we verified that the two curves coincide. It is worth noting that the JBs considered in Figure 19 are the real ones, and their diameter is slightly different, so the two curves do not overlap when l1 = l2.
The unbalance responses obtained with the linearized model and with the nonlinear model are compared in Figure 20. The comparison demonstrates similar critical speeds with similar amplitudes of response. The comparison of numerical and experimental results is given in Figure 21. The numerical case that better approaches the experimental results is with hf = 16 µm and hr = 23 µm, which is represented in this figure. The error between the experimental first critical speed and its numerical estimation is about 10%, which is not small. Anyway, it could be accepted considering that other parameters besides the film thickness may influence the first critical speed, such as the supply orifices diameter and their discharge coefficient. Moreover, the presence of O-rings used to seal the water cooling circuit is suspected to have an influence despite the radial vibration of the bearings has been prevented with care (mounting the bushing with small interference in the external carter). The comparison was carried out essentially on the critical speeds and not on the amplitude of the displacement, as the residual unbalance of the rotor is not known. A static unbalance eccentricity e = 1 µm was considered in numerical simulations, together with a null dynamic unbalance. Different unbalance configurations modify the amplitude of the responses, but not the critical speeds. In the experimental tests, it was not possible to overcome the critical speed, so the curves are not complete; therefore, it was not possible to tune the static unbalance eccentricity e used in the numerical models to match the dynamic runout at the critical speeds.
The values of the damping factor obtained with the nonlinear model are compared with the experimental points measured at the stability threshold. As is visible in Figure 22, the numerical model is very accurate in predicting the pressure at which the unstable whirl occurs.

5. Conclusions

Based on our analysis of the unbalance response of a high-speed spindle supported by journal gas bearings, we came to the following conclusions:
  • The results of the nonlinear and linearized models are in good agreement, especially regarding the critical speeds.
  • The critical speeds are very sensitive with respect to film thickness; an increase in film thickness of one bearing involves a decrease in the corresponding critical speed, but has little effect on the other bearing.
  • The position of the rotor center of mass strongly influences the unbalance response on bearings; in particular, the dynamic runout of the prototype measured on the front bearing can be reduced by moving the center of mass towards the rear bearing.
  • The direct stiffness coefficients of the bearings decrease as the supply pressure is decreased; conversely, the direct damping coefficients increase.
  • The direct stiffness coefficients of the bearings increase as the rotational speed is increased; conversely, the direct damping coefficients decrease.
  • At high speeds, the front bearing is near the instability threshold because a subsynchronous frequency appears in the nonlinear model results (see Section 3.2).
  • The difference between the experimental and numerical first critical speed is about 10% and it could be acceptable, considering that other parameters besides the film thickness may influence it, such as the orifices diameter and their discharge coefficient.
  • The difference in the amplitude of the dynamic runout may be due to the fact that in numerical simulations, only the static unbalance eccentricity has been considered, while the experimental results can also be affected by a residual dynamic unbalance of the rotor.
Future work will focus on the stability analysis of the rotor JBs system.

Author Contributions

Conceptualization, F.C., L.L., A.T., T.R. and V.V.; methodology, F.C.; software, F.C.; writing—review and editing, F.C. and L.L.; validation, F.C., L.L. and A.T.; supervision, T.R. and V.V.; project administration, T.R.; funding acquisition, T.R. All authors have read and agreed to the published version of the manuscript.

Funding

This research was funded by Carbomech Company, Contract2021.

Data Availability Statement

Not applicable.

Conflicts of Interest

The authors declare no conflict of interest.

References

  1. Chen, C.-H.; Tsai, T.-H.; Yang, D.-W.; Kang, Y.; Chen, J.-H. The comparison in stability of rotor-aerostatic bearing system compensated by orifices and inherences. Tribol. Int. 2010, 43, 1360–1373. [Google Scholar] [CrossRef]
  2. Miyatake, M.; Yoshimoto, S. Numerical investigation of static and dynamic characteristics of aerostatic thrust bearings with small feed holes. Tribol. Int. 2010, 43, 1353–1359. [Google Scholar] [CrossRef]
  3. Otsu, Y.; Miyatake, M.; Yoshimoto, S. Dynamic Characteristics of Aerostatic Porous Journal Bearings With a Surface-Restricted Layer. J. Tribol. Trans. Asme 2011, 133, 011701. [Google Scholar] [CrossRef]
  4. Otsu, Y.; Somaya, K.; Yoshimoto, S. High-speed stability of a rigid rotor supported by aerostatic journal bearings with compound restrictors. Tribol. Int. 2011, 44, 9–17. [Google Scholar] [CrossRef]
  5. Park, J.-K.; Kim, K.-W. Stability analyses and experiments of spindle system using new type of slot-restricted gas journal bearings. Tribol. Int. 2004, 37, 451–462. [Google Scholar] [CrossRef]
  6. Belforte, G.; Raparelli, T.; Viktorov, V.; Trivella, A. Metal woven wire cloth feeding system for gas bearings. Tribol. Int. 2009, 42, 600–608. [Google Scholar] [CrossRef]
  7. Belforte, G.; Colombo, F.; Raparelli, T.; Trivella, A.; Viktorov, V. Experimental analysis of air pads with micro holes. Tribol. Trans. 2013, 56, 169–177. [Google Scholar] [CrossRef]
  8. Bättig, P.; Schiffmann, J. Data-driven model for the dynamic characteristics of o-rings for gas bearing supported rotors. J. Appl. Mech. 2019, 86, 081003. [Google Scholar] [CrossRef]
  9. Al-Bender, F.; Colombo, F.; Reynaerts, D.; Villavicencio, R.; Waumans, T. Dynamic characterization of rubber o-rings: Squeeze and size effects. Adv. Tribol. 2017, 2017, 2509879. [Google Scholar] [CrossRef] [Green Version]
  10. Czolczynski, K. Rotordynamics of Gas-Lubricated Journal Bearing Systems; Springer Science & Business Media: Berlin/Heidelberg, Germany, 1999. [Google Scholar]
  11. Czolczynski, K.; Kapitaniak, T.; Marynowski, K. Stability of rotors supported in gas bearings with bushes mounted in air rings. Wear 1996, 199, 100–112. [Google Scholar] [CrossRef]
  12. Hoffmann, R.; Liebich, R. Characterisation and calculation of nonlinear vibrations in gas foil bearing systems–An experimental and numerical investigation. J. Sound Vib. 2018, 412, 389–409. [Google Scholar] [CrossRef]
  13. Hoffmann, R.; Liebich, R. Experimental and numerical analysis of the dynamic behaviour of a foil bearing structure affected by metal shims. Tribol. Int. 2017, 115, 378–388. [Google Scholar] [CrossRef]
  14. Liebich, R.; Scholz, A.; Wieschalla, M. Rotors supported by elastomer-ring-dampers: Experimental and numerical investigations. In Proceedings of the 10th International Conference on Vibrations in Rotating Machinery, London, UK, 11–13 September 2012; pp. 443–453. [Google Scholar]
  15. Belforte, G.; Raparelli, T.; Viktorov, V. Theoretical Investigation of Fluid Inertia Effects and Stability of Self-Acting Gas Journal Bearings. J. Tribol. 1999, 121, 836–843. [Google Scholar] [CrossRef]
  16. Belforte, G.; Colombo, F.; Raparelli, T.; Viktorov, V. High-speed rotor with air bearings mounted on flexible supports: Test bench and experimental results. J. Tribol. 2008, 130, 21103. [Google Scholar] [CrossRef]
  17. Belforte, G.; Colombo, F.; Raparelli, T.; Trivella, A.; Viktorov, V. High-speed electrospindle running on air bearings: Design and experimental verification. Meccanica 2008, 43, 591–600. [Google Scholar] [CrossRef]
  18. Liu, W.; Bättig, P.; Wagner, P.H.; Schiffmann, J. Nonlinear study on a rigid rotor supported by herringbone grooved gas bearings: Theory and validation. Mech. Syst. Signal Processing 2021, 146, 106983. [Google Scholar] [CrossRef]
  19. Lund, J.W. A Theoretical Analysis of Whirl Instability and Pneumatic Hammer for a Rigid Rotor in Pressurized Gas Journal Bearings. J. Lubr. Technol. 1967, 89, 154–165. [Google Scholar] [CrossRef]
  20. Lund, J.W. Calculation of Stiffness and Damping Properties of Gas Bearings. J. Lubr. Technol. 1968, 90, 793–803. [Google Scholar] [CrossRef]
  21. Waumans, T.; Vleugels, P.; Peirs, J.; Al-Bender, F.; Reynaerts, D. Rotordynamic behaviour of a micro-turbine rotor on air bearings: Modelling techniques and experimental verification. In Proceedings of the ISMA, Leuven, Belgium, 18–20 September 2006; pp. 181–198. [Google Scholar]
  22. Colombo, F.; Lentini, L.; Trivella, A.; Raparelli, T.; Viktorov, V. Experimental and Numerical Dynamic Identification of an Aerostatic Electro-Spindle. Appl. Sci. 2021, 11, 11462. [Google Scholar] [CrossRef]
  23. Al-Bender, F. Air Bearings: Theory, Design and Applications; John Wiley & Sons: Hoboken, NJ, USA, 2021. [Google Scholar]
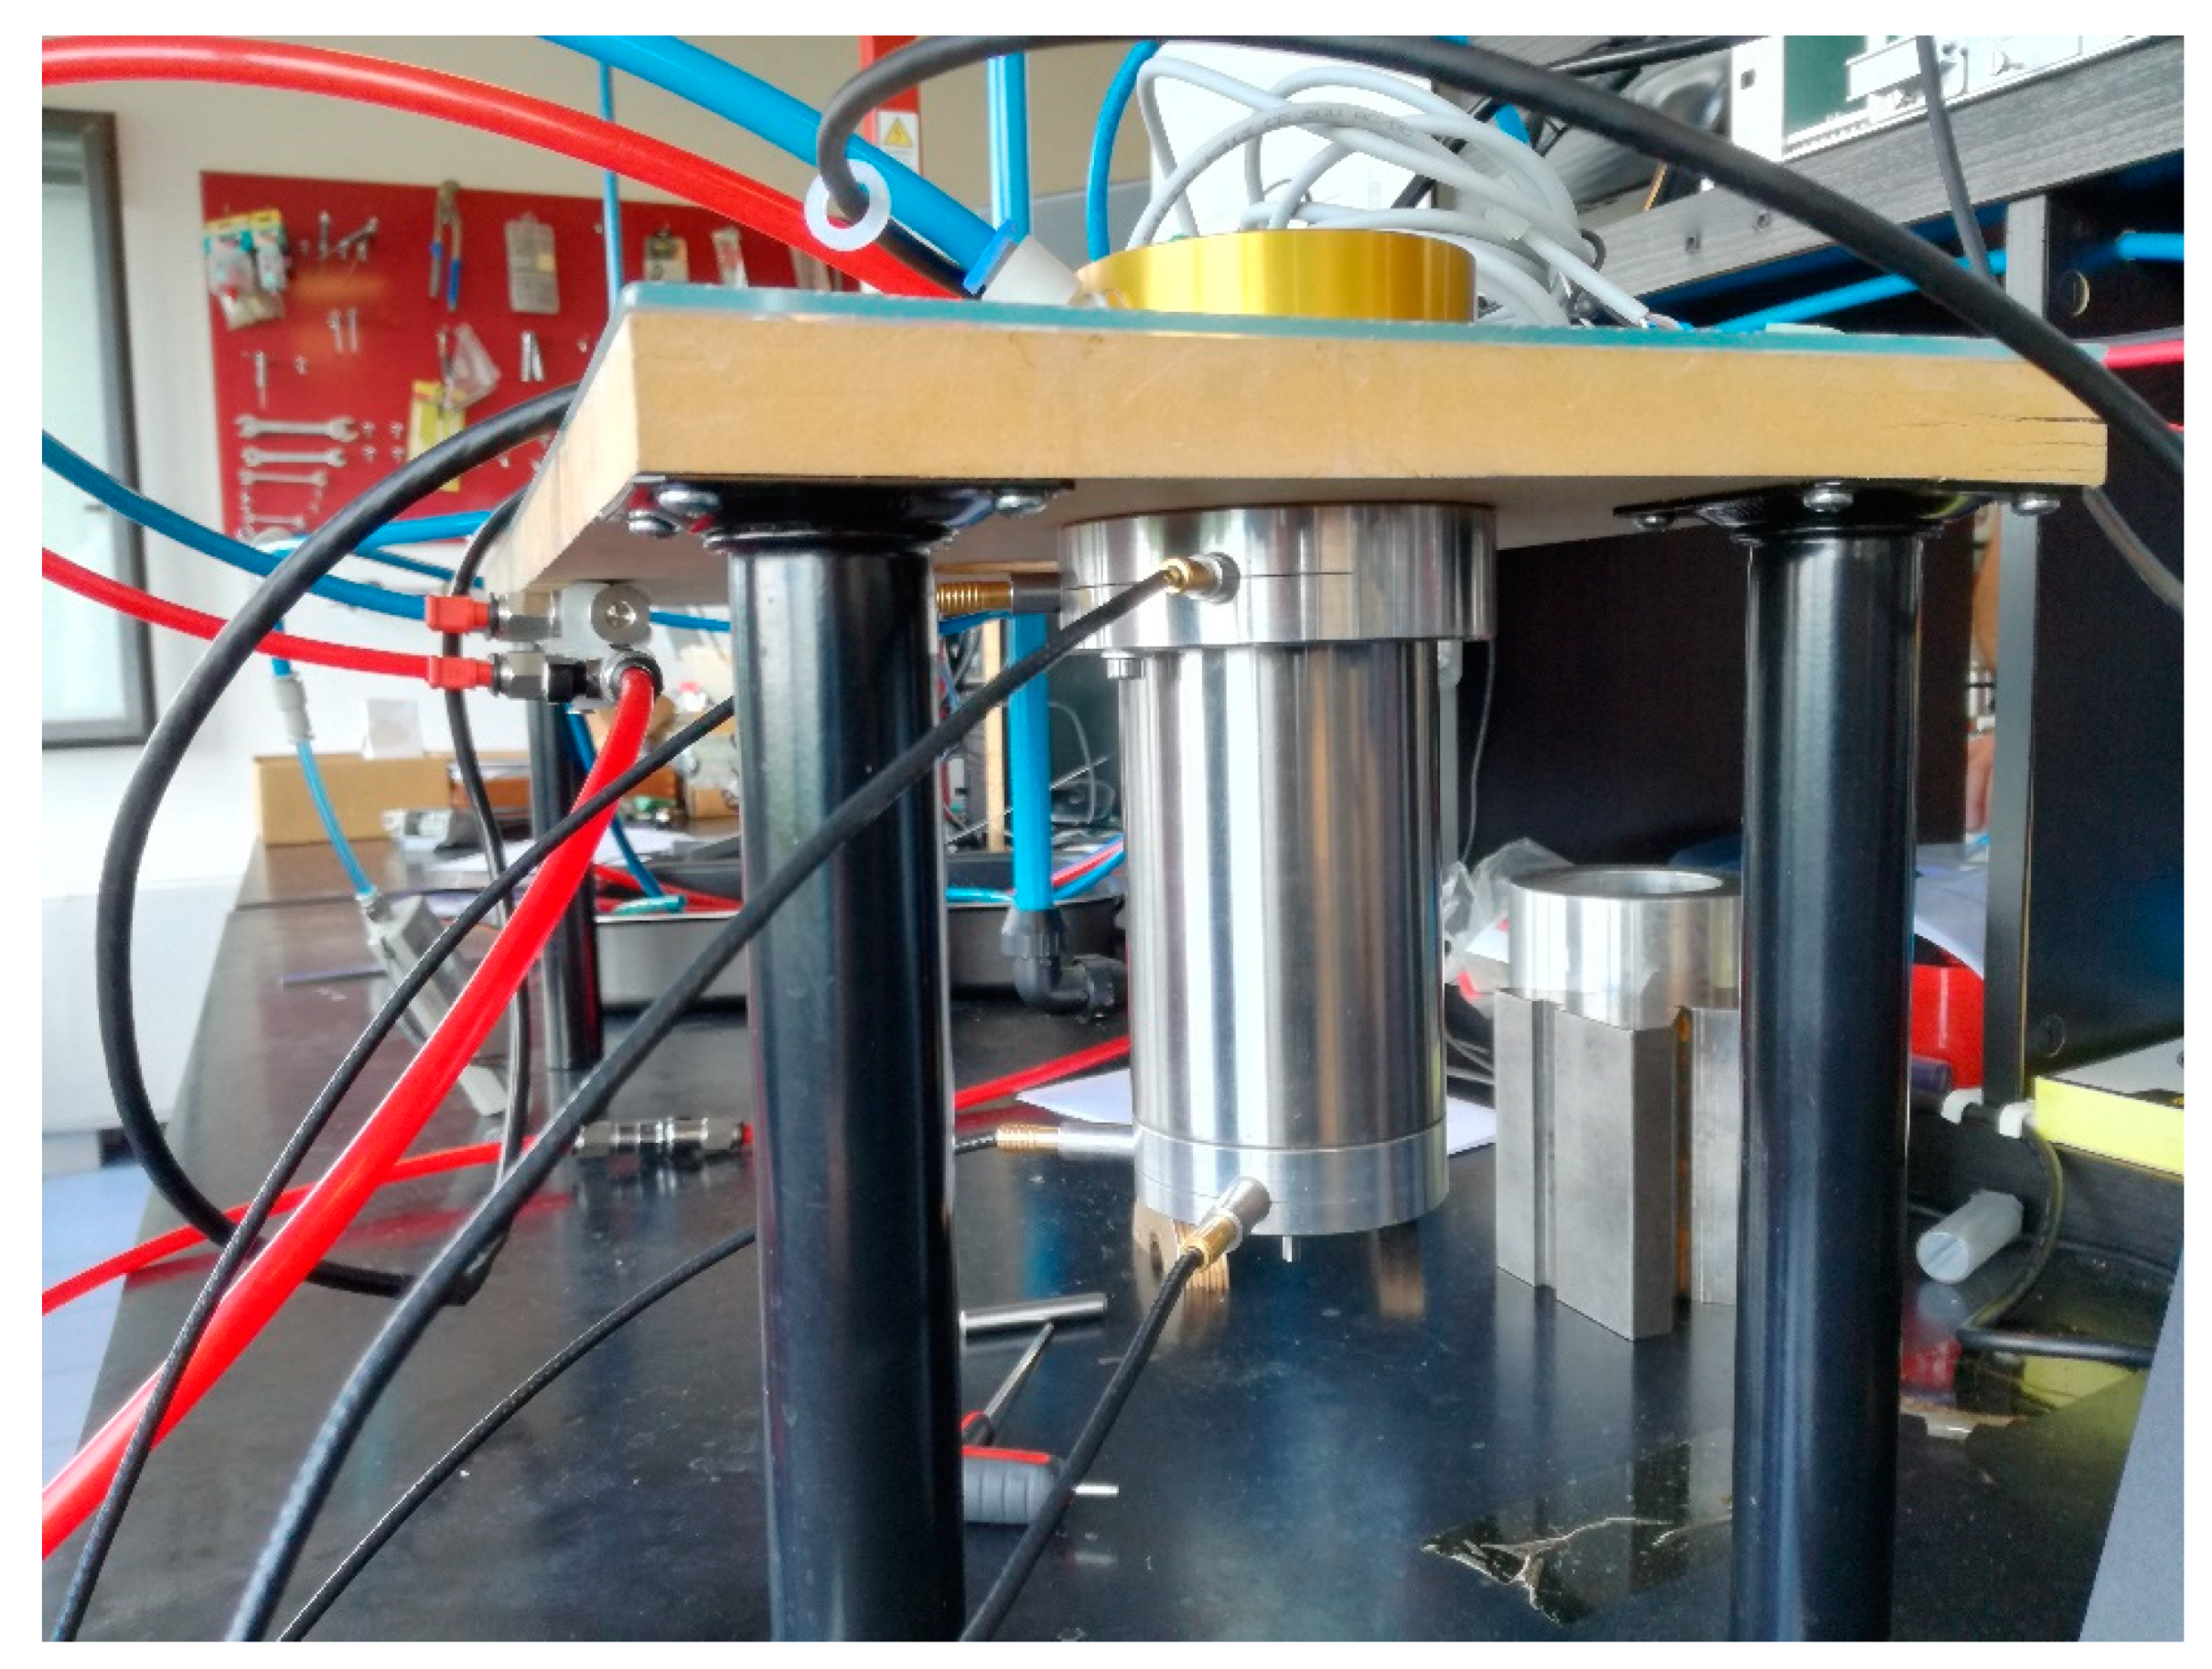
Figure 1. The electro-spindle under test.
Lubricants 10 00127 g001
Figure 2. Sketch of the rotor journal bearing system.
Lubricants 10 00127 g002
Figure 3. Sections of the rotor bearing system in the middle planes of journal bearings (left and right) and in the rotor center of mass (middle).
Lubricants 10 00127 g003
Figure 4. Rotor orbits and frequency spectra; comparison between active motor and disabled motor cases; ps = 0.7 MPa.
Lubricants 10 00127 g004
Figure 5. Spectrograms of signals on front and rear bearings during a deceleration test lasting 30 s and starting from 94 krpm.
Lubricants 10 00127 g005
Figure 6. Waterfall diagrams of signals on front and rear bearings during a deceleration test lasting 30 s and starting from 94 krpm; ps = 0.7 MPa (absolute).
Lubricants 10 00127 g006
Figure 7. Amplitude of the synchronous component of the signals measured on front and rear bearings and of the calculated signals (center of mass and tilting angles); ps = 0.7 MPa.
Lubricants 10 00127 g007
Figure 8. Frequency spectrum of the signal measured at 40 krpm at the stability threshold.
Lubricants 10 00127 g008
Figure 9. Rotor orbits, calculated with the nonlinear orbit method on front and rear bearings at ω = 90 krpm, ps = 0.7 MPa (absolute) and static unbalance eccentricity e = 1 µm.
Lubricants 10 00127 g009
Figure 10. Amplitude of the synchronous component of the signals calculated with the nonlinear orbit model on front and rear bearings with ps = 0.7 and 0.5 MPa (absolute) and static unbalance eccentricity e = 1 µm.
Lubricants 10 00127 g010
Figure 11. Waterfall diagram of the signals calculated with the nonlinear orbit method on front (z = 0) and rear (z = z L) bearings with maxima film thicknesses (hf = 16 µm and hr = 20 µm), ps = 0.7 and 0.5 MPa (absolute) and static unbalance eccentricity e = 1 µm.
Lubricants 10 00127 g011
Figure 12. Waterfall diagram of the signals calculated with the nonlinear orbit model on front (z = 0) and rear (z = z L) bearings with maxima film thicknesses (hf = 19 µm and hr = 23 µm), ps = 0.7 and 0.5 MPa (absolute) and static unbalance eccentricity e = 1 µm.
Lubricants 10 00127 g012aLubricants 10 00127 g012b
Figure 13. Damping factor of the signal calculated with the nonlinear orbit model on front bearing at z = 0 at 20, 30 and 40 krpm; hf = 16 µm and hr = 20 µm; static unbalance eccentricity e = 0 µm.
Lubricants 10 00127 g013
Figure 14. Stiffness and damping coefficients obtained in synchronous excitation conditions near the rotor’s centered position; the two curves refer to minima film thicknesses (hf = 16 µm, hr = 20 µm) and maxima film thicknesses (hf = 19 µm, hr = 23 µm).
Lubricants 10 00127 g014aLubricants 10 00127 g014b
Figure 15. Unbalance response obtained with the linearized model; hf = 16 µm, hr = 20 µm, e = 1 µm, γ = 0, ps = 0.7 and 0.5 MPa (absolute).
Lubricants 10 00127 g015
Figure 16. Unbalance response obtained with the linearized model; hf = 19 µm, hr = 23 µm, e = 1 µm, γ = 0, ps = 0.7 and 0.5 MPa (absolute).
Lubricants 10 00127 g016
Figure 17. Unbalance response obtained with the linearized model; hf = 19 µm, hr = 20 µm, e = 1 µm, γ = 0, ps = 0.7 and 0.5 MPa (absolute).
Lubricants 10 00127 g017
Figure 18. Unbalance response obtained with the linearized model; hf = 16 µm, hr = 23 µm, e = 1 µm, γ = 0, ps = 0.7 and 0.5 MPa (absolute).
Lubricants 10 00127 g018
Figure 19. Effect of the center of mass position with respect to the JBs.
Lubricants 10 00127 g019
Figure 20. Comparison of the unbalance response obtained with the linearized model (continuous lines) and with the nonlinear model (dots); e = 1 µm, γ = 0, ps = 0.7 and 0.5 MPa (absolute); hf = 16 µm, hr = 20 µm (top); hf = 19 µm, hr = 23 µm (bottom).
Lubricants 10 00127 g020
Figure 21. Comparison of the unbalance response obtained with the linearized model (continuous lines) and with the nonlinear model (dots); hf = 16 µm, hr = 23 µm, e = 1 µm, γ = 0, ps = 0.7 (left) and 0.5 MPa (right).
Lubricants 10 00127 g021
Figure 22. Comparison of damping factor calculated on the front bearing with the nonlinear model (continuous lines) and the experimental points at the stability threshold.
Lubricants 10 00127 g022
Table 1. Geometry of the rotor bearing system.
VariableDescriptionValue
d s Supply hole diameter0.15 mm
h f Radial clearance on front JB17.5 ± 1.5 μm
h r Radial clearance on rear JB21.5 ± 1.5 μm
l 1 Axial distance70 mm
l 2 Axial distance26 mm
L Journal bearing axial length30 mm
r f Radius of front JB12.5 mm
r r Radius of rear JB11 mm
Table 2. Inertia properties of the rotor.
VariableDescriptionValue
m Mass382 g
I Transverse moment of inertia667 kg∙mm2
I p Polar moment of inertia31 kg∙mm2
Table 3. Computing times.
MethodTime (s)
Linearized method (1000 points)0.5
Nonlinear method (16 points)38,000
Publisher’s Note: MDPI stays neutral with regard to jurisdictional claims in published maps and institutional affiliations.