Abstract
Nanoparticles as lubricant additives under a certain average diameter and concentration may reduce wear, friction and scuffing damage. However, atmospheric dust particles affect not only human health but also the efficiency of components, and even cause component failures. Therefore, the contact characteristics at interfaces with foreign particles require careful investigation. In this work, a 3-body microcontact mechanics concept is used to analyze the effects of wear debris and foreign particles on real contact area, contact mode, asperity deformation type and separation at interface. The results show that the relationship profile between dimensionless real contact area (At*) and dimensionless normal contact load (Ft*) is wedge-shaped in a 3-body contact interface. Using surface-to-surface 2-body contact area as upper bound and surface-to-particle 3-body contact as lower bound, the 3-body hybrid contact situation is in between upper and lower bounds. As the dimensionless normal contact load increases, At* increases gradually as well. The order of contact mode is p-s contact, hybrid contact and then s-s contact. If the 3-body contact interface is in hybrid contact mode, the decrease in the hardness and average third body diameter will cause the At* to increase significantly at the same Ft*. Conversely, the separation and real contact area ratio of plastic deformation decrease gradually. The turning point of contact area (TPCA) occurs when the contact mode is within hybrid contact mode and the ratio of average third body diameter to the composite equivalent surface RMS roughness is about 50–70% for foreign particles and wear debris. When the Ft* is slightly larger than Ftpca*, the third body and surface share the total interface load approximately equally which will help reduce the real contact pressure and plastic contact area to improve surface performance.
1. Introduction
In the recent development of lubricants, adding particles to lubricants is one of the important directions because they can enhance the lubricant’s interfacial tribological properties. Among factors affecting the tribological performance of nanolubricants, the size and concentration of nanoparticles have been widely studied [1,2,3,4,5,6,7,8]. However, in the literature reports on particle additives, the optimal particle size or optimal concentration for different interface conditions varies greatly. Ghaednia et al. [1] conducted wear experiments with 0.5–2.0 wt% CuO nanoparticles added to the base oil. The results showed that the wear increased when the nanoparticle concentration reached 1.0 wt%, and then reduced at 2.0 wt%. Horng et al. [2] used the three-body microcontact temperature model and application analysis on high-speed ball screws to prove that the optimal particle size is 170–250 nm when the equivalent surface roughness value of the interface is 0.30–0.40 μm. Awang et al. [3] proposed a novel Cellulose Nanocrystals (CNC) nanoparticle as a green lubricant, and conducted wear tests by adding 0.1–0.9 wt% to the engine oil. The results showed that the addition of 0.1% nanoparticles to the oil has excellent tribological properties. Cortes et al. [4] studied the effects of different concentrations (0.25–1.25 wt%) of SiO2 and TiO2 nanoparticles on the lubricity of sunflower oil. SiO2 and TiO2 nanoparticle were considered effective additives for sunflower oil as they can reduce friction coefficient and wear volume loss by 77.7% and 74.1%, and 93.7% and 70.1%, respectively. The optimal particle concentrations of SiO2 and TiO2 were obtained at 1.25 wt% and 1.0 wt%, respectively. Kumar et al. [5] studied the effect of various sizes of Polytetrafluoroethylene (PTFE) nanoparticles (50 nm, 6.0 μm, 9.0 μm and 12 μm) in lithium-based grease. Results of tibo-tests revealed that the 6μm particles showed slightly better performance. In 2021, Kanojia et al. [6] added different concentrations of SiO2 nanoparticles (0.3, 0.9 and 1.5 wt%) in Mahua oil and performed tribological analysis. The addition of 0.3 wt% nanoparticles resulted in a good improvement in reducing friction, wear and scar formation on the surface. Ta et al. [7] added different concentrations (0.2 and 0.5 wt%) of CuO and ZnO nanoparticles to the ionic liquid. This method could enhance the anti-wear ability and reduce friction of the ionic liquid. The results illustrated that the best tribological performance was observed at the concentration of 0.2 wt% ZnO among the two types of nanoparticles and two concentrations tested. Abdel-Rehim et al. [8] proposed that Oleic Acid can be used as a surfactant and added three concentrations of nanoparticles (0.2, 0.5 and 1.0 wt%) to a mineral base lubricant. The experimental results showed that the optimal concentration of CuO nanolubricant was 0.5 wt%. Conversely, when the concentration was increased to 1.0 wt%, aggregation was observed leading to the deterioration of friction and dispersion. From the above research, it is found that the optimal values of nanoparticle concentration and size are clearly related to the material types of particles and interface, and even have a great influence on the surface roughness of the specimen. As a result, the analysis of the microcontact characteristics of the three-body interface is a basic but important first step in solving this problem.
In the past, the relative motion interface research was based on a two-body (2-body) contact model for mechanics, thermal, material, electrical and mechanism analysis. However, 2-body contact is the ideal condition of the machine interface, occurring at the moment when the moving interface of the machine parts start to operate. Due to the environmental particles–particle additives or wear debris, named the third body–the actual interface of machine parts is a three-body (3-body) contact. Therefore, the 3-body mechanics analysis of the interface will be more realistic to the actual characteristics of the interface. As said by Valentin L. Popov in a paper published in 2018 [9], one of the great challenges of the tribology future in tribology research is to solve the problem of the third body. The conclusion reached in a review paper by James A. Greenwood in 2020 [10] stated that [Yes, study the behavior of trapped particles: but if all transfer and wear is attributed to third bodies, the term has become too wide to be useful. But at least stop studying the purely normal contact of rough surfaces]. This explains why the use of the 2-body contacts analysis method of rough surface to solve the rubbing problem should be halted, and the relative motion interface analysis should at least consider the three solid body model.
Lots of 2-body classic microcontact mechanics models have been proposed in the past to study the contact behavior of the interface. Those models allow for the study of the basic mechanics of contact properties and predict the damage and failure characteristic at the interface. In 1966, Greenwood and Williamson [11] first proposed a 2-body contact model with multiple rough asperities. However, it is only applicable for elastic contact deformation (GW model). The plastic contact area of the rough surface is the main area where the wear occurs. Chang, Etsion and Bogy [12] proposed the CEB model combining elastic and plastic deformation phenomena. Nevertheless, this model still has the problem of discontinuity in the conversion process between elastic and plastic deformation. Zhao, Maietta and Chang [13] proposed a complete model of contact behavior from elastic to elastoplastic and then to plastic deformation (ZMC model). Kogut and Etsion [14] used a finite element model to simulate the discontinuity problems of the elastic–plastic region (KE model). Since the roughness of the general machined surface is directional, Horng [15] proposed a generalized ellipse asperity contact model. This model not only had simplified the CEB model, but also considered directional rough asperity (H model). Chen and Etsion [16] incorporated a GW statistical multi-coated-asperity surface model with existing single-coated-asperity contact models. Then an elastic–plastic coated rough surface contact model was proposed. In 2020, Li et al. [17] proposed a new contact model considering asperity interaction and surface waviness. Comparing with other models, the results obtained from this proposed model are more consistent with the experimental results.
A 3-body contact system is formed when particles are found at the interfaces. Godet in 1984 first proposed the concept of “third body” and the importance of its influence [18,19]. Unfortunately, the subsequent relatively detailed analysis was somewhat paused. In the past, the fluid mechanics of the lubricant and the physical/chemical reactions of the surface were mainly discussed for the third body. By contrast, the contact mechanics of the solid particle at the interface, and the influence on tribological properties such as oil film thickness, viscosity, reaction film, and lubrication regime were rarely mentioned. For example, most studies ignored the force balance at the interface of the three bodies, or only discussed the dry abrasive wear of the three bodies [20,21,22,23]. Without considering the effect of the third body on the 2-body lubrication wear [24,25], resulting in assumptions about the load-sharing ratio of the liquid, surface and particle load are different from the actual load for the three bodies. The relationship between the real contact area and the separation between interfaces (considering different average third body diameter and equivalent surface RMS roughness) has not been analyzed.
In the study of 3-body contact simulations, Khonsari [26] focuses primarily on the application and analysis of elastohydrodynamic lubrication of fluid with particles, and gives examples to illustrate the modeling aspects of bearing lubrication at various particle concentrations. Zhang and Tanaka [27] studied the wear and friction mechanism in silicon induced by 2-body and 3-body sliding contact. They found that the friction force is a function of the real contact area. Amorphous phase transformation is the main deformation on the silicon surface. In the microscale abrasive wear test experiment by Trezona et al. [28], the maximum wear rate occurs at intermediate slurry concentrations. They also found that a transition from grooving to rolling wear could be identified by a critical ratio of load to slurry concentration. However, the contact mechanics of the above turning phenomena had not yet been thoroughly discussed. Stempfle et al. [29] used a scan thermal microscope to investigate the relationship between the contact temperature and thermal power dissipated in 3-body contact. Based on the GW microcontact model, the effect of applied force on the real contact area was also studied. Ghaednia and Jackson [30] studied the effect of nanoparticles on the real area of contact and friction based on fractal mathematics. The result found a linear relationship between dimensionless contact area and contact force. Particles reduce the real contact area at interface and, therefore, decrease the friction force. Ghaednia et al. [31] extended the 2-body GW model to 3-body contact simulation and application in electrical contact properties. They also found that particles could reduce the real contact area and contact thermal conduction. Eder [32] presented a molecular dynamics (MD) simulation to study nano-wear of rough surfaces under 2-body and 3-body contact conditions with abrasive particles. This method enables researchers to study the effect of multiple abrasives on changing nanoscale surface topography. The above numerical analysis studies are based on elastic contact mechanics. However, the contact area includes elastic, elastoplastic and plastic deformations at the actual interface. In 2015, Wu et al. [33] analyzed the peak contact temperature of rough surfaces under 3-body contact, but did not consider the transition mechanism of various 3-body contact modes and the change of micro-asperity deformation. Horng et al. [34] combined contact mechanics and lubrication theory to study the mixed lubrication properties at 3-body interfaces. They show that the conventional film parameter (λ) was not a sufficient indicator of various lubrication regimes in 3-body contact. Thus, the λ of the 3-body interface should consider the third particle effect to confirm the mixed lubrication regime. In conclusion, the third body in the 3-body contact has a great influence on the thermal, electrical and tribological properties of the interface [35]. Moreover, both the elastic deformation and plastic deformation of the contact zone make a large difference to the performance of the contact interface [36,37]. They definitely cause changes in surface stress, strain and failure, such as pitting [38] and scuffing [39] as surface damage. At the interface of mechanical components, not only the wear debris, but also the environmental particles often cause component damage. The foreign particles in this article include environmental particles and wear debris from the other machine components in a circulation system. This study mainly discusses: the influence of foreign particles on the different deformation areas of the total contact area; separation at interface; the difference between the foreign particles and wear debris under different average diameters of the third body; and equivalent surface RMS roughness and normal contact load. The influence of foreign particles on the contact modes and deformation characteristics of the 3-body contact interface is analyzed based on the force balance of the 3-body interface.
2. Theoretical Analysis
When two rough surfaces are in contact with each other, this can be simplified into an equivalent rough surface and a flat surface (s-s 2-body contact) [40,41], as shown in Figure 1a. However, if third bodies exist at the contact interfaces, there will be three kinds of contact mode according to the relative values of the diameter of the third body to the separation of the two surfaces. In the first contact mode, namely 3-body particle-to-surface contact (3-body p-s contact), the diameter of the third body is much larger than the separation of the two surfaces. The particles completely separate the two surfaces. The normal contact load is borne by the contact points between the third bodies and the surface, as shown in Figure 1b. In the second contact mode, that is 3-body hybrid contact, the difference between the diameter of the third body and the separation between the two surfaces is small. The third bodies with surface and the two surface contact points share the normal contact load, as shown in Figure 1c. In the third contact mode, 3-body surface-to-surface contact (3-body s-s contact), the diameter of the third body is much smaller than the separation between the two surfaces and all the third bodies sink into the trough. The normal contact load is borne by the contact points of the two surfaces, as shown in Figure 1d.
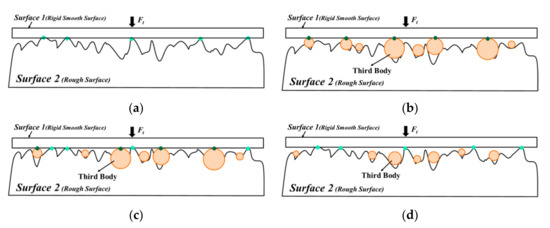
Figure 1.
The contact mode at the contact interfaces “Reprinted/adapted with permission from Ref. [42]. 2017, Wu, H.W.; Chen, Y.Y.; Horng, J.H.” (a) for 2-body contact (b) for 3-body particle-to-surface contact (c) for 3-body hybrid contact and (d) for 3-body surface-to-surface contact.
In the contact model, the following assumptions were made [42]:
- The peak of the surface roughness is hemispherical with constant radius of curvature (R) and the Gaussian distribution ϕ(z) shows the change of the peak height.
- All surface asperities are separated by a far distance and there is no interaction between them.
- There is no bulk deformation, but the surface asperities may deform during contact.
- The shape of the third body is spherical [43,44,45,46], and the average diameter of the third body is xa.
- The slopes of surface asperities are negligibly small.
A schematic diagram of the interface of surface 1, surface 2, and third bodies in a 3-body contact system is shown in Figure 2, where xa is average diameter of the third body, ϕa(x) is probability density function of the third body diameter and Xmax is the maximum diameter of the third body. The 2-body microcontact model used in this study is the ZMC model. According to the 3-body microcontact model [26], the normal contact load Ft and total real contact area At are as follows:
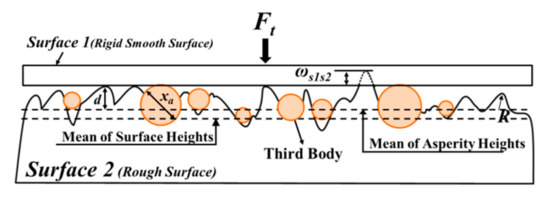
Figure 2.
Schematic of a 3-body contact system.
According to the theory proposed by Tabor [47], the relationship between the average contact pressure Pa at the initial yield point and the hardness H can be written as:
where k is the mean contact pressure factor and its value is 0.4, and H is hardness of the softer material. Then, substituting Equation (4) into Equation (3), the critical interference ω1 at the point of initial yield can be obtained as follows:
According to the research result proposed by Johnson [48], the critical interference at the point of fully plastic flow can be expressed as:
From the above equations, when ω < ω1, the surface only experiences elastic deformation; when ω1 < ω < ω2, the surface experiences both elastoplastic and plastic deformation; and when ω > ω2, the surface experiences only plastic deformation.
To simplify the analysis, this study assumes that both ϕa(x) and ϕ(z) are Gaussian distributions, as shown in Equation (7) and Equation (8) [42]:
The relationship between σ and σs is shown in Equation (9) [49]:
where σa is the standard deviation of the diameter of the third body, σs is the standard deviation of the asperity heights, and the value of αs is usually around 5.0 and tends to be a constant for a given type of surface finishing [50]. However, due to the different heights of the rough asperities at the interface, this contact deformation includes three types of deformation—elastic, elastoplastic and plastic—under the same contact load. Therefore, the total real contact area is the summation of the elastic, elastoplastic and plastic deformation areas, as shown in Equations (10)–(13).
Equations (1) and (2) will become the dimensionless normal contact load and dimensionless real contact area by dividing by AnEss and An, respectively.
Ass, Asa, Ae, Aep and Ap can be divided by An or At to obtain the dimensionless contact area ratio. In addition, the parameters of related length are divided by σ to obtain the dimensionless value. The dimensionless parameters are defined in the Nomenclature section.
3. Results and Discussion
In this study, the material of the two relatively moving surfaces is S45C. In order to compare the difference between foreign particles and wear debris, the third bodies in this paper contain SiO2 (foreign particles) and S45C (wear debris). SiO2 particles are used as the third bodies because dust contains about 80% of SiO2 and 10% of Al2O3 in the environment [51]. It is also one of the materials used for particle additives in lubricants [6]. The wear debris does not consider the work hardening of the material rolling process, so the hardness is the same as that of surface 1 and surface 2. The material properties for surface 1, surface 2 and the third body are listed in Table 1. The operating conditions are as shown in Table 2.

Table 1.
Properties of material for surface 1, surface 2 and the third body.

Table 2.
Operating conditions for this study.
Figure 3 shows the dimensionless real contact area versus dimensionless normal contact load for the third bodies at various average diameters of the third body when σ = 100 nm. The dimensionless real contact area At* versus dimensionless normal contact load is shown in Figure 3a. The real contact area ratio between surface 1 and surface 2 (Ass,t*) and real contact area ratio between third body and surface 1 (Asa,t*) versus dimensionless normal contact load is shown in Figure 3b. The curve for xa = 0 nm is obtained from the ZMC 2-body contact model. The At* for xa = 0 nm overlaps the curve for xa = 25 nm. The At* increases with increase in dimensionless normal contact load and is larger than various average third body diameters and third body materials at any dimensionless normal contact load. Under the same dimensionless normal contact load, adding the average diameters of third bodies larger than 25 nm, the dimensionless real contact area will decrease. This result has the same trend as the experimental inference of Ghaednia et al. [1]. The reason for the overlap between xa = 25 nm and xa = 0 nm can be found in Figure 3b, since Ass,t* = 100% for xa = 25 nm belongs to 3-body s-s contact. Therefore, the third bodies have almost no effect on the change of real contact area. This means that third bodies sink into surface roughness valleys. In addition, when xa = 1000nm, the dimensionless real contact area between S45C and SiO2 is almost the same. However, the SiO2 curve with xa = 1000 nm is almost parallel to xa = 0 nm except for the high dimensionless normal contact load value of 2.4 × 10⁻⁴. This means that for all the loads in this study, the contact is in 3-body p-s contact mode. The dimensionless real contact area is only about 15–22% for xa = 0 nm. The above results show that larger average diameter of third bodies makes a smaller dimensionless real contact area than in pure 2-body contact mode (xa = 0 nm). This means that the true contact pressure will increase at least 4.5 times or even greater, which will cause the interface contact temperature and wear to rise dramatically. Therefore, the presence of excessively large average diameter of third bodies at the interfaces is one of the important factors for excess wear failure of mechanical components.
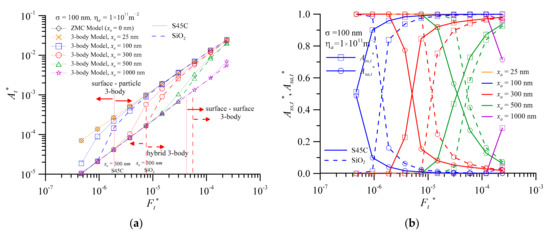
Figure 3.
Real contact area versus dimensionless contact load, with σ = 100 nm, two kinds of third body materials and different average third body diameters (a) dimensionless real contact area ratio, At* (b) real contact area ratio of surface 1 and surface 2, Ass,t*, and real contact area ratio of third body and surface 1, Asa,t*.
This is shown by the circle symbol dotted line with xa = 300 nm of SiO2 in Figure 3a. As the dimensionless normal contact load increases, the dimensionless real contact area can be roughly divided into three stages. The first stage overlaps the curve of xa = 1000 nm. Then, the second stage is the rapid increase in Ft* from 7.5 × 10⁻⁶ to 5.1 × 10⁻⁵. Finally, the third stage is moving to the curve of xa = 0 nm. This phenomenon can be found by the real contact area ratio between the third body and surface 1 (Asa,t*) and the real contact area ratio between surface 1 and surface 2 (Ass,t*) to the dimensionless real contact area in Figure 3b with xa = 300 nm of SiO2 (circle symbol dotted line). When the Ft* is less than 7.5 × 10⁻⁶ and Asa,t* = 100%, the contact is in 3-body p-s contact mode. Asa,t* rapidly decreases and Ass,t* rapidly increases at the same time when the Ft* is greater than 7.5 × 10⁻⁶. The second contact stage is in 3-body hybrid contact mode. When the Ft* is greater than 5.1 × 10⁻⁵ and Ass,t* > 95%, the third contact stage is in 3-body s-s contact mode. For xa = 0 nm of SiO2, the slope of At* to Ft* curve is about 0.69. The real contact pressure slightly increases with the increase in Ft*. When xa = 1000 nm, the value of slope increases to 1.03. However, the real contact pressure slightly decreases with the increase in Ft*. For xa = 300 nm of SiO2 and Ft* = 7.5 × 10⁻⁶–5.1 × 10⁻⁵, the contact is within a 3-body hybrid contact mode. The value of slope is significantly larger than that of xa = 1000 nm. Therefore, the real contact pressure decreases rapidly as the dimensionless normal contact load increases when the contact mode of interface is the 3-body hybrid contact.
From the previous discussions, the phenomena of 3-body contact can be summarized for various average diameters of the third body. First, the relationship between the dimensionless real contact area and the dimensionless normal contact load is wedge-shaped, approximately rectangular in shape. Second, the upper limit is the traditional 2-body s-s contact mode and the lower limit is the 3-body p-s contact mode. Third, as the dimensionless normal contact load increases, the 3-body p-s contact mode will shift into hybrid contact mode and then enter s-s contact mode.
Two types of critical load were defined by the initial dimensionless normal contact load, as shown in Figure 3. The first critical load (Fcr1*) is defined by the initial dimensionless normal contact load of 3-body p-s contact shift into 3-body hybrid contact mode. The second critical load (Fcr2*) is defined by the initial dimensionless normal contact load of 3-body hybrid contact shift into 3-body s-s contact mode. For the same Ft*, the At* of SiO2 and S45C decreases with the increase in average third body diameter, as shown in Figure 3a. The At* of SiO2 is smaller than that of S45C for all dimensionless normal contact loads. These results indicate that the foreign particles (SiO2) cause the wear and contact temperature of the interface are higher than those for wear debris (S45C). The values of Fcr1* (2.0 × 10−6) and Fcr2* (4.0 × 10−5) for S45C with xa = 300 nm are smaller than those of foreign particles (SiO2), as shown in Figure 3b. Both values of Fcr1* and Fcr2* increase with the increase in the average diameter of the third body for the two materials. Furthermore, the value of Fcr1* of SiO2 is significantly larger than that of S45C. By contrast, the difference between the values of Fcr2* is not obvious for the same average third body diameter.
When σ = 100 nm and ηa = 1011 m−2, the components of dimensionless real contact area versus dimensionless normal contact load is shown in Figure 4 for two types of third body materials and various average third body diameters. The dimensionless real contact area of surface 1 and surface 2, Ass,n*, as shown in Figure 4a, has a linear relationship with Ft* for xa = 0 nm. When xa = 25 nm, the results of Ass,n* for SiO2 and S45C almost overlap with the results of xa = 0 nm. From the results of dimensionless real contact area of third body and surface1, Asa,n*, as shown in Figure 4b, particle contact phenomenon can only be found when the Ft* is greater than 5.1 × 10⁻⁵. This value of Asa,n* only accounts for less than 0.01% of the dimensionless real contact area. Since the average diameter of the third bodies is very small, they may sink into the valleys. Therefore, both SiO2 and S45C are in the 3-body s-s contact mode for all dimensionless normal contact loads when xa = 25 nm. Conversely, Ass,n* starts to have value after Ft* > 1.5 × 10⁻⁴ for xa = 1000 nm. The value of Asa,n* has a linear relationship with Ft* for SiO2, as shown in Figure 4. This means that it is in 3-body p-s contact mode for Ft* < 1.5 × 10⁻⁴, and shifts into 3-body hybrid contact mode for Ft* > 1.5 × 10⁻⁴.
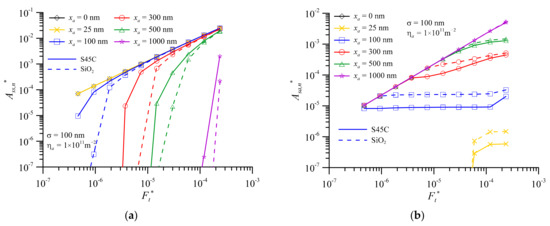
Figure 4.
Components of dimensionless real contact area versus dimensionless normal contact load, with σ = 100 nm, ηa = 1011 m−2, two kinds of third body materials and different average third body diameters (a) dimensionless real contact area of surface 1 and surface 2, Ass,n* (b) dimensionless real contact area of third body and surface 1, Asa,n*.
Figure 5 shows the dimensionless real contact area versus dimensionless normal contact load at various equivalent surface RMS roughness of xa = 25 nm and xa = 1000 nm, respectively. For the SiO2 with xa = 25 nm, the At* increases linearly with increase in Ft* for all equivalent surface RMS roughnesses. By contrast, the At* decreases with increase in equivalent surface RMS roughness for the same Ft*. For the same equivalent surface RMS roughness, the At* of S45C almost overlaps with that of SiO2. At this moment, the contact is within 3-body s-s contact mode. When the SiO2 with xa = 1000 nm and Ft* < 6.0 × 10⁻⁵, the At* increases linearly with the increase in Ft* for all equivalent surface RMS roughnesses. The At* almost overlaps for all different equivalent surface RMS roughnesses. For equivalent surface RMS roughness below 0.5 μm and average third body diameter of 1 μm, the contact is in 3-body p-s contact mode. At this time, the equivalent surface RMS roughness and third bodies have little effect on the dimensionless real contact area. When Ft* > 3.0 × 10⁻⁵, the rising rate of At* increases slightly, and the greater the equivalent surface RMS roughness, the greater the rise in At*. Moreover, the At* of S45C is greater than that of SiO2 by about 6.8–26.6%. In addition, the At* of xa = 25 nm and 1000 nm are almost parallel at the same equivalent surface RMS roughness as the dimensionless normal contact load increases when Ft* < 3.0 × 10⁻⁵, as shown in Figure 5. The gap of At* between xa = 25 nm and 1000 nm decreases with increase in equivalent surface RMS roughness. The gap of σ = 50 nm is about 9.8 times that of σ = 500 nm. This shows that when the equivalent surface RMS roughness gets smaller or the average third body diameter gets larger, the third body not only has a greater impact on the dimensionless real contact area, but is also more likely to cause unstable operation of the parts and surface damage. Therefore, the equivalent surface RMS roughness should not be as small as possible while conducting surface engineering design.
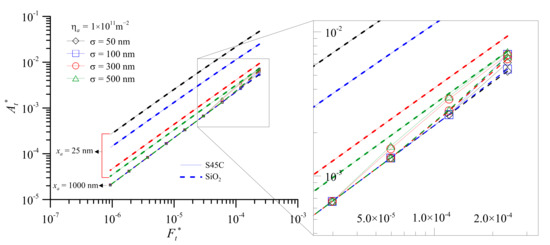
Figure 5.
Dimensionless real contact area versus dimensionless normal contact load at various equivalent surface RMS roughnesses for xa = 25 nm and xa = 1000 nm of wear debris and foreign particles.
Figure 6 shows the components of real contact area ratio versus dimensionless normal contact load for foreign particles at (a) σ = 100 nm, (b) σ = 300 nm, and (c) At* for σ = 300 nm. From the results of SiO2 with xa = 300 nm in Figure 4b, the increase in Asa,n* is smaller than that of the load at the 3-body hybrid contact mode. Moreover, the contact pressure of particles increases gradually. Therefore, as shown in Figure 6a, the rapid drop in Asa,t* with xa = 300 nm causes the contact pressure of the third bodies to increase rapidly. This is prone to 3-body abrasive wear and increases the interface wear. It is well known that the dimensionless normal contact load of the interface is all borne by the third bodies or all the surface asperities will cause the real contact pressure to become too high. However, when the equivalent surface RMS roughness increases to 300 nm, xa = 200 nm and dimensionless normal contact load is between 4.5 × 10⁻⁷ and 4.5 × 10⁻⁶. It is interesting to note that surface and third body have load-sharing conditions as shown in Figure 6b. This means that if the average diameter and concentration of nanoparticles are added at σ = 300 nm, the interface contact pressure can be balanced to improve the tribology efficiency. This situation can be clearly understood from Figure 6c. Similarly, both Figure 6b,c have a turning point at Ft* = 1.9 × 10⁻⁶. When Ft *< 1.9 × 10⁻⁶, the curve of At* seems to coincide with xa = 500 nm. Due to the special ratio of average third body diameter to equivalent surface RMS roughness, the slope of dimensionless real contact area to dimensionless normal contact load turns a corner. The dimensionless normal contact load is shared by Ass,t* and Asa,t*, as shown in Figure 6c. This phenomenon is defined as turning point of contact area of the 3-body contact (TPCA). From the tribology engineering design point of view, the third bodies and the surface asperity crests can bear the load equally in the contact region nearby the turning point. In addition, the contact pressure in this area only increases slightly. Therefore, this will become a better design region. This phenomenon also occurs when the equivalent surface RMS roughness increases to 500 nm, as shown in Figure 7.
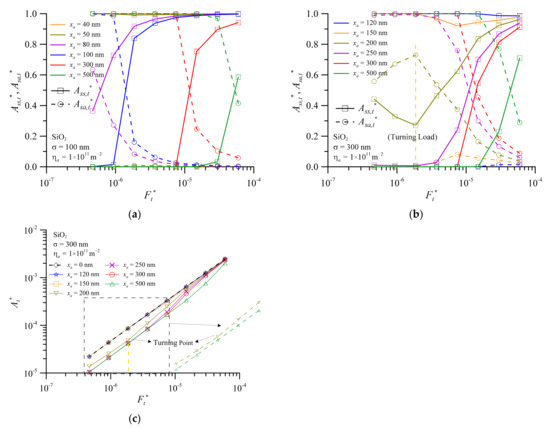
Figure 6.
The components of real contact area ratio versus dimensionless normal contact load for foreign particles, SiO2 at (a) σ = 100 nm (b) σ = 300 nm (c) At* for σ = 300 nm.
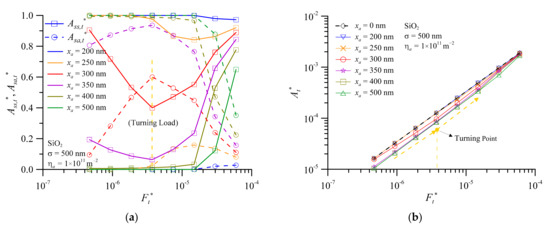
Figure 7.
The real contact area ratio and dimensionless real contact area versus dimensionless normal contact load for foreign particles of SiO2 at σ = 500 nm (a) Ass,t* and Asa,t* (b) At*.
When the dimensionless normal contact load of turning point of contact area (Ftpca*) rises to 3.0 × 10⁻⁶, the curve of At* turns back to 3-body s-s contact mode (xa = 0 nm) from 3-body hybrid contact mode as the dimensionless normal contact load reduces, as shown in Figure 7b of xa = 300 nm. Similarly, the curve of xa = 150 nm in Figure 6b and the curve of xa = 250 nm in Figure 7a also return to the 3-body s-s contact mode only in the small recurve phenomenon. As shown in Figure 6 and Figure 7, this TPCA phenomenon is found for the SiO2 particle concentration of 1.0 × 10¹¹ m−2 and xa/σ ≈ 0.5–0.7. This result is similar to the experimental results obtained by Peña-Parás et al. [52] when the effect of reducing friction and wear was observed at xa/σ less than 0.7. Note that this ratio value is related to the material properties and operation conditions of the three bodies. This also shows that when nanoparticles are added to the lubricant under various operating conditions, the optimum wear and friction properties are obtained at the appropriate concentration and average third body diameter, rather than a higher average diameter being necessarily better [1,2,3,6]. Comparing Figure 3a, Figure 6c and Figure 7b, one can find that larger values of equivalent surface RMS roughness will result in a narrower area of relationship between the dimensionless real contact area and the dimensionless normal contact load under 3-body contact mode.
Figure 8 takes Ass,t* as an example to illustrate the difference between the two kinds of third body materials under the same conditions as shown in Figure 6b. At the same dimensionless normal contact load, because the hardness of SiO2 is relatively larger than that of S45C, the greater hardness will decrease the value of Ass,t*. When the third body is SiO2, the value of Ftpca* is larger than that of S45C. However, when xa/σ ≈ 0.5–0.7 and the dimensionless normal contact load is smaller, the value of Ass,t* of SiO2 is greater than that of S45C. This is because the hardness of SiO2 is greater, and the sinking amplitude of the third bodies is also greater. Therefore, when the third body is a foreign particle, the critical load of its interface from 3-body p-s contact mode to 3-body hybrid contact mode is greater than that of metal wear debris.
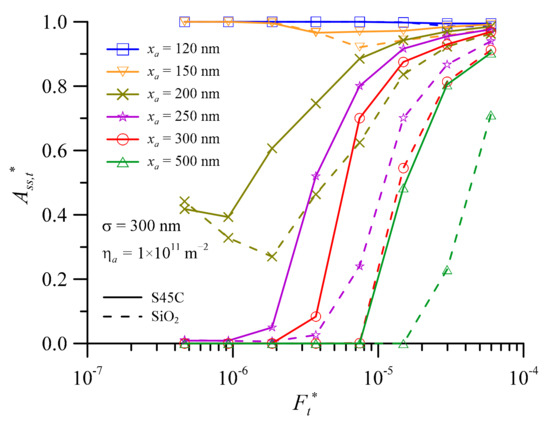
Figure 8.
The contact area ratio of surface 1 and surface 2 versus dimensionless normal contact load at various average third body diameters for wear debris and foreign particles for σ = 300 nm.
Figure 9 shows the critical load versus equivalent surface RMS roughness at various average third body diameters and third body material for first critical load (Fcr1*) and second critical load (Fcr2*). For SiO2 under the same equivalent surface RMS roughness, as shown in Figure 9a, the Fcr1* increases with increase in the average third body diameter. However, the value of Fcr1* decreases with increase in the equivalent surface RMS roughness at the same average third body diameter. The Fcr1* value of S45C is less than that of SiO2 at the same equivalent surface RMS roughness and average third body diameter. As shown in Figure 9a, SiO2 needs a larger dimensionless normal load to make the contact interface enter the 3-body hybrid contact mode. This indicates that SiO2 has a larger dimensionless normal load range in 3-body p-s contact mode than in the two other modes. For 3-body p-s contact mode, maintaining the contact pressure at the interface for a long period of time will easily exceed the pressure limit and cause surface damage. For SiO2 under the same equivalent surface RMS roughness, as shown in Figure 9b, the value of Fcr2* increases with increase in the average third body diameter. Conversely, the value of Fcr2* decreases with increase in the equivalent surface RMS roughness at the same average third body diameter. The Fcr2* value of SiO2 is larger than that of S45C under the same equivalent surface RMS roughness and average third body diameter. In addition, when xa = 100 nm, σ = 50 nm and σ = 100 nm, the Fcr2* value of SiO2 is about 2.9–3.4-fold larger than that of S45C. By contrast, for other average third body diameters under the same equivalent surface RMS roughness, the Fcr2* value of SiO2 is only about 1.1–1.3-fold larger than that of S45C. Therefore, the difference in Fcr2* between the metal wear debris and foreign particles is relatively insignificant. From Figure 3, Figure 4, Figure 5, Figure 6, Figure 7, Figure 8 and Figure 9, it can be found that the 2-body contact is an ideal contact mode at the contact interface. This is because its dimensionless real contact area is almost linear with the dimensionless normal contact load and it is easy to predict its changes under different operating conditions as shown in Figure 5. In fact, the actual contact interface is a 3-body contact system. It is not possible to maintain the ideal 2-body contact state. Although the dimensionless real contact area of the 3-body p-s contact mode is almost linear with the dimensionless normal contact load, as shown in Figure 5, the third bodies have completely separated the two surfaces. Consequently, this will cause the instability of the contact interface. The foreign particles are more likely to cause 3-body p-s contact mode at the contact interface than the wear debris. This indicates that environmental dust is more likely to cause excess wear or failure of the contact interface. Therefore, it is recommended to change the lubricating oil regularly and appropriately maintain the oil circulation system, so as to ensure the stability of the contact interface and increase the service life of the components. From the present analysis, it is necessary to constrain the ratio of average third body diameter to equivalent surface RMS roughness (xa/σ) to not exceed 0.7.
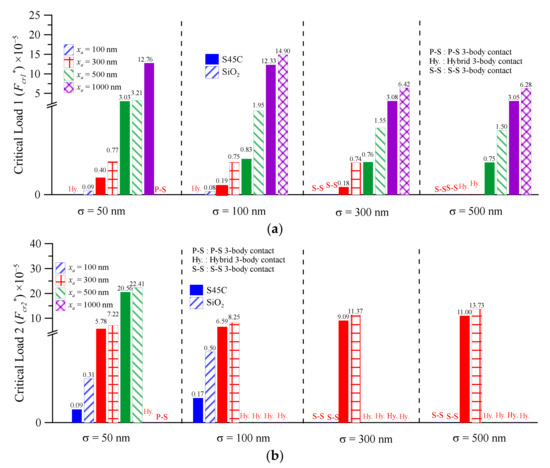
Figure 9.
The critical load versus equivalent surface RMS roughness at various average third body diameters and third body materials for (a) first critical load (b) second critical load.
Figure 10 shows the deformation types of total contact area ratio versus dimensionless normal contact load at various average third body diameters for elastic, elastoplastic, and plastic material behaviors. For the real contact area ratio of elastic deformation, as shown in Figure 10a, the Ae,t* value of 2-body contact model (diamond symbol curve) decreases with increase in dimensionless normal contact load. Moreover, this Ae,t* value is larger than the Ae,t* value of all 3-body contact models. For xa = 300nm, the Ae,t* value of SiO2 rises rapidly when Ft* > Fcr1* (contact mode shift into 3-body hybrid contact). Then the Ae,t* value decreases with the increase in the dimensionless normal contact load when approaching the 2-body contact curve. Finally, the Ae,t* curve overlaps with the 2-body contact curve, indicating that the contact mode shifts into 3-body s-s contact mode at this moment. For all average third body diameters and dimensionless normal contact loads, the Ae,t* is less than 20%, indicating that it has less effect on the total real contact area.
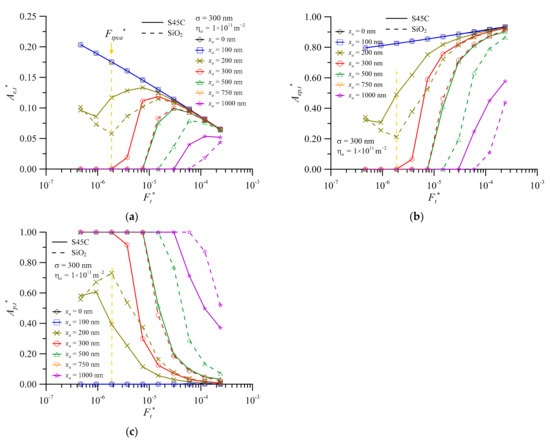
Figure 10.
The deformation components of total real contact area ratio versus dimensionless normal contact load at various average third body diameters for (a) elastic (b) elastoplastic (c) plastic.
As shown in Figure 10b, more than 80% of the total real contact area is elastoplastic deformation for xa < 100 nm. The real contact area ratio of elastoplastic deformation increases with increase in the dimensionless normal contact load. The Aep,t* value of all cases of 3-body contact is smaller than for 2-body contact. For xa = 300 nm, the Aep,t* value of SiO2 rises rapidly when Ft* > Fcr1* (7.4 × 10−6). Then the Aep,t* value approaches the 2-body contact curve. Finally, the Aep,t* curve overlaps with the 2-body contact curve, indicating that the contact enters 3-body s-s contact mode. Due to the hardness of SiO2 (environment particles) being greater than that of S45C (wear debris), the Ae,t* and Aep,t* values of SiO2 are smaller than the values of S45C under the same dimensionless normal contact load. For xa = 300 nm, as shown in Figure 10c, the Ap,t* value of SiO2 decreases rapidly with the increase in dimensionless normal contact load. Finally, the Ap,t* value approaches to 0% when Ft *> Fcr1*. Due to the greater hardness of SiO2, the Ap,t* value of SiO2 is larger than that of S45C and results in more plastic deformation at the contact interface for the same average third body diameter. When the dimensionless normal contact load is slightly larger than Ftpca* (1.86 × 10⁻⁶), the TPCA phenomenon can be found in Figure 10 for SiO2 of xa = 200 nm. By selecting the average third body diameter that will cause the TPCA phenomenon, it is possible to increase the values of Ae,t* and Aep,t* and decrease the values of Ap,t*. This is because the real contact area ratio of plastic deformation is the main factor of wear, as shown in Figure 8 and Figure 6b. When Ftpca* < Ft* < 6.0 × 10⁻⁶, as shown in Figure 10, it will be a relatively good surface design, because both the third body and surface can share the contact load. In addition, the real contact area ratio of elastic and elastoplastic deformation area will increase as well.
For the same dimensionless normal contact load, the values of Ae,t* and Aep,t* decrease with the increase in the average third body diameter, as shown in Figure 10. By contrast, the value of Ap,t* increases with the increase in the average third body diameter. Therefore, the larger the average third body diameter, the easier the plastic deformation of the contact surface. In addition, for SiO2 of xa = 300 nm as an example, almost 100% plastic deformation will occur at the contact interface when the contact mode is 3-body p-s contact. This indicates that this contact mode is prone to cause surface damage. Under the same dimensionless normal contact load, the values of Ae,t* and Aep,t* of SiO2 are smaller than that of S45C. The value of Ap,t* of SiO2 is greater than that of S45C. The excessive plastic deformation of the contact surface will readily increase friction and cause a lot of surface wear. Therefore, this is also one of the reasons why strict conditions for the control of environmental dust are required during precision processing and manufacturing.
Under the same dimensionless normal contact load, Figure 11a,b show the separation between the surface 1 and mean height of asperities (d) and dimensionless separation (d* = d/σ) versus average third body diameters for various equivalent surface RMS roughnesses and third body materials, respectively. Figure 11a shows that the separation increases with increase in the equivalent surface RMS roughness and average third body diameters. For the same equivalent surface RMS roughness, the separation value of SiO2 is greater than that of S45C. Moreover, the disparity between SiO2 and S45C increases as the average third body diameter increases. Figure 11b, which shows dimensionless separation, illustrates the amplitude of change at various equivalent surface RMS roughnesses and average third body diameters. When the ratio value of average third body diameter to equivalent surface RMS roughness increases, the contact readily enters into 3-body p-s contact mode, as shown in Figure 9. Moreover, the change amplitude of dimensionless separation increases as well. For xa = 1000 nm, the dimensionless separation value of SiO2 is about 2.5 times larger than that of S45C. This confirms the importance of preventing foreign particles from entering the lubricated interface.
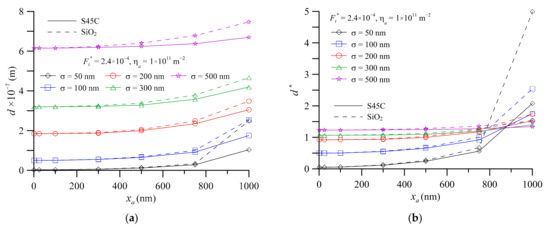
Figure 11.
The separation between the surface 1 and mean height of asperities versus average third body diameters at various equivalent surface RMS roughnesses for wear debris and foreign particles (a) separation (b) dimensionless separation.
The curve of xa = 0 nm in Figure 12a is the traditional dimensionless separation curve of the 2-body contact, where dimensionless separation decreases with increase in dimensionless normal contact load. When the third body is present in the contact interface, the dimensionless separation will be greater than for the 2-body contact. For the same dimensionless normal contact load, it will increase as the average third body diameter increases. When the value of Ft* < 2 × 10⁻⁵, xa = 1000 nm and xa = 500 nm, the dimensionless separation of maximum value is about 5.8 and twice that of 2-body contact, respectively. Taking xa = 500 nm of SiO2 as an example, when the value of Ft* is 5 × 10⁻⁷–7 × 10⁻⁶, the contact is in 3-body p-s contact mode. The dimensionless normal contact load increases about 10 times from 5 × 10⁻⁷ to 7 × 10⁻⁶. In the meantime, the value of d* is reduced by only 6.89%. At this moment, the interface remains in 3-body p-s contact mode. The dimensionless separation of the contact interface is relatively larger than the ideal 2-body contact mode. When the contact shifts into 3-body hybrid contact mode after the value of Ft* > 7 × 10⁻⁶, the dimensionless normal contact load is also increased 10 -fold from 7 × 10⁻⁶ to 3 × 10⁻⁵. The value of d* decreases rapidly by 69.24% from 8.52 to 2.62. Upholding the 3-body hybrid contact mode of the interface can quickly reduce the interface separation and avoid the instability of components caused by excessive separation. Therefore, both the wear debris and foreign particles have a great influence on the mechanical or electronic properties of the contact interface for the contact element. The curve of xa = 0 nm in Figure 12b shows that the value of At* increases rapidly with decreasing value of d*, demonstrating that a slight change in the 2-body contact interface will cause extreme variation in the contact area. However, it also shows that the separation between the contact surfaces is relatively stable when within the 2-body contact mode. As the contact area changes, the interface separation will not fluctuate too much during the operation of components. Taking SiO2 with xa = 500 nm as an example, the value of At* decreases as the value of d* increases. The first overlaps with the 2-body curve indicating that it is in 3-body s-s contact mode. When the contact mode shifts to 3-body hybrid contact mode, the value of At* decreases relatively slowly with the increasing value of d*. The value of d* increases about 30% and the value of At* decreases by only about 9%. This indicates that the contact interface is within 3-body hybrid contact mode which can reduce the variation of the contact area. As shown by the results in Figure 12, larger separation variation at the contact interfaces will not only cause the machine to become unstable, but also cause excessive pressure on the local contact points due to the smaller contact area, which will eventually lead to surface damage. In general, 3-body hybrid contact mode has larger d* variation and smaller At* variation, whereas 3-body s-s and p-s contact mode has smaller d* variation and larger At* variation. The dimensionless separation variation increases with increase in average third body diameter.
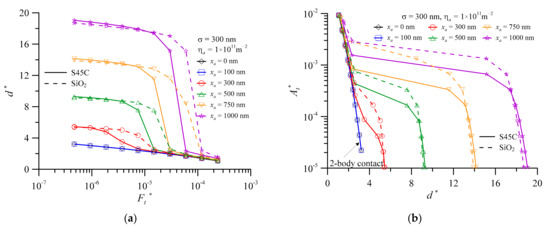
Figure 12.
(a) Dimensionless separation versus dimensionless normal contact load and (b) dimensionless real contact area versus dimensionless separation, at various average third body diameters for wear debris and foreign particles.
4. Conclusions
The 3-body contact model reflects the real contact interface of general relative moving components. This work discusses particle effects and the difference in contact area, contact mode and separation between foreign particles and wear debris when the contact interface is in metal contact pair at various average third body diameters, equivalent surface RMS roughnesses and contact loads under dry contact conditions. The results of the analyses can be summarized as follows:
- The value of At* gradually increases with the increase in the load for 3-body contact interface where the third body exists. As the dimensionless normal contact load increases, the 3-body contact mode shifts from p-s mode into hybrid mode and then to s-s mode. When the interface becomes a 3-body s-s contact mode, the value of At* is equal to that of 2-body contact mode.
- The results show that the relationship profile between dimensionless real contact area ratio (At*) and dimensionless normal contact load (Ft*) is wedge-shaped in 3-body contact interface. Using surface-to-surface 2-body contact area as upper bound and surface-to-particle 3-body contact as lower bound, the 3-body hybrid contact situation is in between upper and lower bounds. Larger values of equivalent surface RMS roughness will result in a narrower wedge-shaped area.
- Under 3-body contact interface conditions, the first critical load (Frc1*), the second critical load (Frc2*), and the real contact area ratio of plastic deformation increase with the increase in the average diameter and hardness of the third body. The interface real contact area ratio of plastic deformation of the SiO2 particle is larger than that of general metal wear debris.
- Under 3-body p-s contact interfaces, the dimensionless real contact area increases as the dimensionless normal contact load increases. Therefore, the real contact pressure decreases as the dimensionless normal contact load increases. Equivalent surface RMS roughness has little effect on dimensionless real contact area. Moreover, dimensionless normal contact load has little effect on interface dimensionless separation.
- Under 3-body hybrid contact interfaces, the real contact pressure increases and dimensionless separation significantly decreases as the dimensionless normal contact load increases. However, the variation of dimensionless separation has little effect on the dimensionless real contact area. This phenomenon can prevent the rising contact temperature caused by the excessive separation and rapid increase in the contact pressure during operation.
- Under the 3-body hybrid contact interface, there are many TPCA mechanisms that occur at xa/σ ≈ 0.5–0.7 for wear debris and foreign particles (SiO2). When the dimensionless normal contact load is slightly larger than the value of Ftpca*, the average third body diameter and equivalent surface RMS roughness value of TPCA can be selected for interface design. In this case, the third body and the surface share the interface normal contact load approximately equally. The real contact area ratio of elastic to elastic–plastic deformation increases in the total real contact area, which is a relatively good choice of interface design.
Author Contributions
Conceptualization, J.-H.H., Y.-Y.C. and S.-Y.C.; methodology, S.-Y.C., J.-H.H. and Y.-Y.C.; software, W.-L.L. and Y.-Y.C.; validation, J.-H.H., S.-Y.C. and Y.-Y.C.; formal analysis, Y.-Y.C. and W.-L.L.; investigation, J.-H.H. and S.-Y.C.; resources, J.-H.H.; data curation, W.-L.L. and Y.-Y.C.; writing—original draft preparation, W.-L.L. and Y.-Y.C.; writing—review and editing, S.-Y.C. and J.-H.H.; visualization, Y.-Y.C.; supervision, S.-Y.C. and J.-H.H.; project administration, Y.-Y.C. All authors have read and agreed to the published version of the manuscript.
Funding
This research was supported by the National Ministry of Science and Technology, Taiwan (R.O.C.), under grants MOST 110-2622-E-150-013 and 110-2221-E-150-015-MY3, as well as National Formosa University, Taiwan, R.O.C.
Institutional Review Board Statement
Not applicable.
Informed Consent Statement
Not applicable.
Data Availability Statement
Not applicable.
Conflicts of Interest
The authors declare no conflict of interest.
Nomenclature
| An | apparent contact area at the interface, m2 |
| Ae | real contact area of elastic deformation, m2 |
| Ae,t* | real contact area ratio of elastic deformation, Ae/At |
| Aep | real contact area of elastoplastic deformation, m2 |
| Aep,t* | real contact area ratio of elastoplastic deformation, Aep/At |
| Ap | real contact area of plastic deformation, m2 |
| Ap,t* | real contact area ratio of plastic deformation, Ap/At |
| At | total real contact area, m2 |
| At* | dimensionless real contact area, At/An |
| Asa | real contact area of third body and surface 1, m2 |
| Asa,n* | dimensionless real contact area of third body and surface 1, Asa/An |
| Asa,t* | real contact area ratio between third body and surface 1, Asa/At |
| Ass | real contact area of surface 1 and surface 2, m2 |
| Ass,n* | dimensionless real contact area of surface 1 and surface 2, Ass/An |
| Ass,t* | real contact area ratio between surface 1 and surface 2, Ass/At |
| d | separation between the surface1 and mean height of asperities, m |
| d* | dimensionless separation, d/σ |
| Esa | equivalent elastic modulus of the third body and surface, GPa |
| Ess | equivalent elastic modulus of the two surfaces, GPa |
| Fcr1* | initial dimensionless normal contact load of 3-body p-s contact shift into 3-body hybrid contact mode |
| Fcr2* | initial dimensionless normal contact load of 3-body hybrid contact shift into 3-body s-s contact mode |
| he | maximum separation of two surfaces with third bodies, m |
| Ftpca* | dimensionless normal contact load of turning point of contact area |
| Ft | normal contact load, N |
| Ft* | dimensionless normal contact load, Ft/AnEss |
| Fsa | contact load of third body and surface 1, N |
| Fss | contact load of surface 1 and surface 2, N |
| H | hardness of softer material for surface 1and surface 2, GPa |
| Hs1 | hardness of surface 1, GPa |
| Hs2 | hardness of surface 2, GPa |
| k | mean contact pressure factor |
| R | radius curvature of surface peak, m |
| xa | average third body diameter, m |
| ϕ(z) | probability density function of the peak height |
| ϕa(x) | probability density function of the third body diameter |
| η | asperity density, m−2 |
| ηa | number of third bodies per unit area, m−2 |
| σ | equivalent surface RMS roughness, m |
| σa | standard deviation of the diameter of third body |
| σs | standard deviation of the asperity heights |
| ω | interference, m |
| ω1 | critical interference at the point of initial yield, m |
| ω2 | critical interference at the point of fully plastic flow, m |
References
- Ghaednia, H.; Jackson, R.L.; Khodadadi, J.M. Experimental analysis of stable CuO nanoparticle enhanced lubricants. J. Exp. Nanosci. 2015, 10, 1–18. [Google Scholar] [CrossRef]
- Horng, J.H.; Chern, S.Y.; Li, C.L.; Chen, Y.Y. Surface temperature and wear particle analysis of vertical motion double-nut ball screws. Ind. Lubr. Tribol. 2017, 69, 952–962. [Google Scholar] [CrossRef]
- Awang, N.W.; Ramasamy, D.; Kadirgama, K.; Najafi, G.; Sidik, N.A.C. Study on friction and wear of cellulose nanocrystal (CNC) nanoparticle as lubricating additive in engine oil. Int. J. Heat Mass Transf. 2019, 131, 1196–1204. [Google Scholar] [CrossRef]
- Cortes, V.; Sanchez, K.; Gonzalez, R.; Alcoutlabi, M.; Ortega, J.A. The performance of SiO2 and TiO2 nanoparticles as lubricant additives in sunflower oil. Lubricants 2020, 8, 10. [Google Scholar] [CrossRef] [Green Version]
- Kumar, N.; Saini, V.; Bijwe, J. Performance properties of lithium greases with PTFE particles as additive: Controlling parameter- size or shape? Tribol. Int. 2020, 148, 106302. [Google Scholar] [CrossRef]
- Kanojia, R.; Singh, Y.; Mishra, P.; Negi, P. SiO2 nanoparticles effect to the Mahua oil for friction and wear characterization. Mater. Today Proc. 2021, 46, 10492–10495. [Google Scholar] [CrossRef]
- Ta, T.N.; Chern, S.Y.; Horng, J.H. Tribological Behavior of Ionic Liquid with Nanoparticles. Materials 2021, 14, 6318. [Google Scholar] [CrossRef]
- Abdel-Rehim, A.A.; Akl, S.; Elsoudy, S. Investigation of the tribological behavior of mineral lubricant using copper oxide nano additives. Lubricants 2021, 9, 16. [Google Scholar] [CrossRef]
- Popov, V.L. Is tribology approaching its golden age? Grand challenges in engineering education and tribological research. Front. Mech. Eng. 2018, 4, 16. [Google Scholar] [CrossRef]
- Greenwood, J.A. Metal transfer and wear. Front. Mech. Eng. 2020, 6, 62. [Google Scholar] [CrossRef]
- Greenwood, J.A.; Williamson, J.B.P. Contact of nominal flat surface. Proc. R. Soc. Lond. A 1966, 295, 300–319. [Google Scholar] [CrossRef]
- Chang, W.R.; Etsion, I.; Bogy, D.B. An elastic-plastic model for the contact of rough surface. ASME J. Tribol. 1987, 109, 257–263. [Google Scholar] [CrossRef]
- Zhao, Y.; Maietta, D.M.; Chang, L. An asperity micro-contact model incorporating the transition from elastic deformation to fully plastic flow. ASME J. Tribol. 2000, 122, 86–89. [Google Scholar] [CrossRef]
- Kogut, L.; Etsion, I. Elastic-plastic contact analysis of s sphere and a rigid flat. ASME J. Appl. Mech. 2002, 69, 657–662. [Google Scholar] [CrossRef] [Green Version]
- Horng, J.H. An elliptic elastic-plastic asperity micro-contact model for rough surface. ASME J. Tribol. 1988, 120, 82–88. [Google Scholar] [CrossRef]
- Chen, Z.; Etsion, I. The elastic-plastic contact behavior of rough surfaces with hard coatings. Tribol. Int. 2019, 134, 435–442. [Google Scholar] [CrossRef]
- Li, L.; Pei, X.; Chu, W.; Cai, A. The microcontact model of joint surfaces with waviness and asperity interaction. Adv. Mech. Eng. 2020, 12, 1–12. [Google Scholar] [CrossRef]
- Godet, M. The third body approach: A mechanical view of wear. Wear 1984, 100, 437–452. [Google Scholar] [CrossRef]
- Godet, M, Third bodies in tribology. Wear 1990, 136, 29–45. [CrossRef]
- Meng, H.; Ludema, K. Wear models and predictive equations: Their form and content. Wear 1995, 181, 443–457. [Google Scholar] [CrossRef]
- Petre, I. Determining the functional and material properties needed for abrasive wear prediction. Mater. Sci. Eng. 2016, 147, 012018. Available online: https://iopscience.iop.org/article/10.1088/1757-899X/147/1/012018 (accessed on 19 April 2021). [CrossRef] [Green Version]
- Zambrano, O.A.; Muñoz, E.C.; Rodríguez, S.A.; Coronado, J.J. Running-in period for the abrasive wear of austenitic steels. Wear 2020, 452–453, 203298. [Google Scholar] [CrossRef]
- Torrance, A.A. Modelling abrasive wear. Wear 2005, 258, 281–293. [Google Scholar] [CrossRef]
- Ghanbarzadeh, A.; Wilson, M.; Morina, A.; Dowson, D.; Neville, A. Development of a new mechano-chemical model in boundary lubrication. Tribol. Int. 2016, 93, 573–582. [Google Scholar] [CrossRef]
- Terwey, J.T.; Fourati, M.A.; Pape, F.; Poll, G. Energy-based modelling of adhesive wear in the mixed lubrication regime. Lubricants 2020, 8, 16. [Google Scholar] [CrossRef] [Green Version]
- Khonsari, M.M. On the modeling of multi-body interaction problems in tribology. Wear 1997, 207, 55–62. [Google Scholar] [CrossRef]
- Zhang, L.; Tanaka, H. Atomic scale deformation in silicon mono-crystals induced by two-body and three-body contact sliding. Tribol. Int. 1998, 31, 425–433. [Google Scholar] [CrossRef]
- Trezona, R.I.; Allsopp, D.N.; Hutchings, I.M. Transitions between two-body and three-body abrasive wear: Influence of test conditions in the microscale abrasive wear test. Wear 1999, 225–229, 205–214. [Google Scholar] [CrossRef]
- Stempfle, P.; Pantale, O.; Djilali, T.; Njiwa, R.K.; Bourrat, X.; Takadoum, J. Evaluation of the real contact area in three-body dry friction by micro-thermal analysis. Tribol. Int. 2010, 43, 1794–1805. [Google Scholar] [CrossRef] [Green Version]
- Ghaednia, H.; Jackson, R.L. The effect of nanoparticles on the real area of contact, friction, and wear. ASME J. Tribol. 2013, 135, 041603. [Google Scholar] [CrossRef]
- Ghaednia, H.; Jackson, R.L.; Gao, J. A Third Body Contact Model for Particle Contaminated Electrical Contacts. In Proceedings of the 2014 IEEE 60th Holm Conference on Electrical Contacts (Holm), New Orleans, LA, USA, 12–15 October 2014; pp. 1–5. [Google Scholar] [CrossRef]
- Eder, S.J.; Bianchi, D.; Cihak-Bayr, U.; Vernes, A.; Betz, G. An analysis method for atomistic abrasion simulations featuring rough surfaces and multiple abrasive particles. Comput. Phys. Commun. 2014, 185, 2456–2466. [Google Scholar] [CrossRef]
- Wu, H.W.; Chen, Y.Y.; Horng, J.H. Contact temperature under three-body dry friction conditions. Wear 2015, 330–331, 85–92. [Google Scholar] [CrossRef]
- Horng, J.H.; Yu, C.C.; Chen, Y.Y. Tribological characteristics and load-sharing of point-contact interface in three-body mixed lubrication. ASME J. Tribol. 2022, 144, 052201. [Google Scholar] [CrossRef]
- Zhang, L.; Ru, C.Q. A refined JKR model for adhesion of a rigid sphere on a soft elastic substrate. ASME J. Appl. Mech. 2019, 86, 051004. [Google Scholar] [CrossRef]
- Kennedy, F.E.; Tian, X. Modeling sliding contact temperatures, including effects of surface roughness and convection. ASME J. Tribol. 2016, 138, 042101. [Google Scholar] [CrossRef]
- McMeeking, R.M.; Ciavarella, M.; Cricrì, G.; Kim, K.S. The interaction of frictional slip and adhesion for a stiff sphere on a compliant substrate. ASME J. Appl. Mech. 2020, 87, 031016. [Google Scholar] [CrossRef] [Green Version]
- Kattelus, J.; Miettinen, J.; Lehtovaara, A. Detection of gear pitting failure progression with on-line particle monitoring. Tribol. Int. 2018, 118, 458–464. [Google Scholar] [CrossRef]
- Li, H.; Kazuyuki, Y.; Joichi, S.; Seiji, K.; Takatoshi, S. Role of wear particles in scuffing initiation. Tribol. Online 2013, 8, 285–294. [Google Scholar] [CrossRef] [Green Version]
- Greenwood, J.A.; Tripp, J.H. The contact of twonominally flat rough surfaces. Proc. Inst. Mech. Eng. 1970, 185, 625–633. [Google Scholar] [CrossRef]
- Shi, W.; Zhang, Z. Contact characteristic parameters modeling for the assembled structure with bolted joints. Tribol. Int. 2022, 165, 107272. [Google Scholar] [CrossRef]
- Wu, H.W.; Chen, Y.Y.; Horng, J.H. The analysis of three-body contact temperature under the different third particle size, density, and value of friction. Micromachines 2017, 8, 302. [Google Scholar] [CrossRef] [Green Version]
- Xie, H.; Jiang, B.; He, J.; Xia, X.; Pan, F. Lubrication performance of MoS2 and SiO2 nanoparticles as lubricant additives in magnesium alloy-steel contacts. Tribol. Int. 2016, 93, 63–70. [Google Scholar] [CrossRef]
- Rigney, D.A. The role of characterization in understanding debris generation. In Wear Particles, 1st ed.; Dowson, D., Taylor, C.M., Childs, T.H.C., Godet, M., Dalmaz, G., Eds.; Elsevier Science: Amsterdam, The Netherlands, 1992; pp. 405–412. [Google Scholar]
- Samuels, L.E.; Doyle, E.D.; Turley, D.M. Sliding Wear Mechanisms. In Fundamentals of Friction and Wear of Materials; Rigney, D.A., Ed.; American Society for Metals: Metals Park, OH, USA, 1981; pp. 13–41. [Google Scholar]
- Smith, R.A. 1980 Interfaces of Wear and Fatigue. In Fundamentals of Tribology; Suh, N.P., Saka, N., Eds.; MIT Press: Cambridge, MA, USA, 1980; pp. 605–616. [Google Scholar]
- Tabor, D. The Hardness of Metals; Oxford University Press: Oxford, UK, 1951; Available online: https://global.oup.com/academic/product/the-hardness-of-metals-9780198507765?q=The%20Hardness%20of%20Metals&lang=en&cc=tw# (accessed on 19 November 2021).
- Johnson, K.L. Contact Mechanics; Cambridge University Press: London, UK, 1985. [Google Scholar] [CrossRef]
- Xu, Y.; Jackson, R.L.; Marghitu, D.B. Statistical model of nearly complete elastic rough surface contact. Int. J. Solids Struct. 2014, 51, 1075–1088. [Google Scholar] [CrossRef] [Green Version]
- McCool, J.I. Comparison of models for the contact of rough surfaces. Wear 1986, 107, 37–60. [Google Scholar] [CrossRef]
- Mir, A.H. Improved concrete properties using quarry dust as replacement for natural sand. Int. J. Eng. Res. Dev. 2015, 11, 46–52. Available online: http://www.ijerd.com/paper/vol11-issue3/Version_1/E1134652.pdf (accessed on 17 November 2020).
- Peña-Parás, L.; Gao, H.; Maldonado-Cortés, D.; Vellore, A.; García-Pineda, P.; Montemayor, O.E.; Nava, K.L.; Martini, M. Effects of substrate surface roughness and nano/micro particle additive size on friction and wear in lubricated sliding. Tribol. Int. 2018, 119, 88–98. [Google Scholar] [CrossRef]
Publisher’s Note: MDPI stays neutral with regard to jurisdictional claims in published maps and institutional affiliations. |
© 2022 by the authors. Licensee MDPI, Basel, Switzerland. This article is an open access article distributed under the terms and conditions of the Creative Commons Attribution (CC BY) license (https://creativecommons.org/licenses/by/4.0/).