Review

Star Formation in the Ultraviolet

Armagh Observatory and Planetarium, College Hill, Armagh BT61 9DG, UK
Galaxies 2020, 8(2), 43; https://doi.org/10.3390/galaxies8020043
Submission received: 15 April 2020 / Revised: 3 May 2020 / Accepted: 7 May 2020 / Published: 17 May 2020
(This article belongs to the Special Issue Star Formation in the Ultraviolet)

Abstract

:
With the launch of JWST and the upcoming installation of extremely large telescopes, the first galaxies in our Universe will finally be revealed. Their light will be dominated by massive stars, which peak in in the ultra-violet (UV) part of the electromagnetic spectrum. Star formation is the key driver of the evolution of our Universe. At young ages, within 10 Million years, both high and low mass stars generate complex UV emission processes which are poorly understood yet are vital for interpreting high red-shift line emission. For these reasons, the Hubble Space Telescope (HST) will devote 1000 orbits to obtaining a UV Legacy Library of Young Stars as Essential Standards (ULLYSES). The purpose of this Overview is to outline the basic physical principles driving UV emission processes from local (within 100 parsecs of) star formation, ranging from huge star-forming complexes containing hundreds of massive and very-massive stars (VMS), such as 30 Doradus (the Tarantula Nebula) in the neighboring Magellanic Clouds (only 50 kpc away), to galaxies near and far, out to the epoch of Cosmic Reionization.

1. Introduction

Star formation in the Universe has taken place over the vast majority of its existence. The First Stars, some couple of hundred million years after the Big Bang are thought to be massive due to their pristine chemistry, implying less efficient cooling during their formation (e.g., [1,2]). Stars in today’s Universe mostly have masses like our Sun, which are thought to go through a so-called T Tauri pre-main sequence (PMS) phase (see Figure 1).
In this Editorial overview, and the Special Volume in front of you, we show how the ultraviolet (UV) part of the electromagnetic spectrum is arguably the most important wavelength range to obtain key physical observables for both current PMSs, as well as earlier generations of more massive stars at high redshift. In terms of Cosmic chronology it would make sense to start our discussion with the First Stars at zero metallicity, before discussing current-day T Tauri and Herbig Ae/Be stars at solar metallicities. However, from an observational perspective it is more pragmatic to start the discussion with PMSs in our local neighborhood. We then gradually increase distances to parts of our Milky Way that also contain intermediate mass Herbig Ae/Be stars (within a few hundred parsecs), before we ultimately discuss the population of the most massive stars in the Local Universe at kilo-parsec scales.
Based on these considerations, this editorial overview has the following structure:
  • Overview: Star Formation in the Ultraviolet—Jorick S. Vink
  • The UV Perspective of Low-Mass Star Formation—Schneider, Günther & France
  • On the mass accretion rates of Herbig Ae/Be stars—Ignacio Mendigutia
  • UV Spectroscopy of massive stars—John Hillier
  • Massive Star Formation in the Ultraviolet observed with HST—Claus Leitherer
  • Applications of Stellar Population Synthesis in the Distant Universe—Elizabeth Stanway
In chapter 2, Schneider et al. discuss the formation of solar-mass stars. Although the mass- accretion rates of T Tauri stars are oftentimes determined from optical line emission, such as H α , all these diagnostics ultimately find their roots in the accretion shocks revealed by the UV part of the spectrum. In Chapter 3, Ignacio Mendigutia discusses a possible extension of the successful magneto-spheric accretion model applied to T Tauri stars to the higher mass regime of the 2–18 M Herbig Ae/Be stars. His conclusion is that the model may indeed be applicable to Herbig Ae stars up to a few solar masses, but that alternatives like the boundary-layer (BL) model may need to be considered for the more massive Herbig Be stars.
Yet more massive stars remain above the birthline (see Figure 1) during their PMS phase, and the most massive stars over 18 M only become optically visible after hydrogen (H) burning has started. The objects eventually appear either as either O-type stars (above 18 M ), or very massive, H-rich Wolf-Rayet (WR) stars (over approx. 100 M ). Optically visible O and WR stars however have their key diagnostics at UV wavelengths, and their spectra are extensively discussed in Chapter 4 by John Hillier.
The further we look into the Universe, the more we look back in time. Therefore, the metallicity (Z)—on average—is dropping. This has major consequences, not only on the driving of the winds of O and WR stars, but potentially also on their evolution and diagnostics. Moreover, it has become clear that roughly half the massive stars are part of a close binary system (e.g., [3]), further complicating the interpretation of integrated light in clusters and galaxies (discussed by Claus Leitherer in Chapter 5), and into the more distant Universe (Elisabeth Stanway; Chapter 6).
Reflecting the order of the Review chapters in this Special Volume, this Editorial overview will start with the role of the UV for mass-accretion studies of PMSs in the Local Universe. I then move on to discussing the physics of O and WR stars in low Z environments, before providing an outlook of how to detect the First Stars in the Universe.

2. T Tauri and Herbig Ae/Be Stars

For low-mass T Tauri stars there is a well established paradigm involving magneto-spheric accretion (see Figure 2 in Chapter 2 by Schneider et al. and similar versions by e.g., [4]). The key physics is that due to the presence of a strong kilo-Gauss (approximate) dipole field the inner accretion disk is disrupted, and gaseous material is funnelled along magnetic loops, shocking onto the stellar surface, producing UV radiation (see e.g., Figure 5 of Schneider et al. and [5]).
Half of the HST orbits of ULLYSES (Ultraviolet Legacy Library of Young Stars as Essential Standards) are dedicated to better understanding the physics of mass-accretion in the UV. Some HST orbits are dedicated to spectroscopic monitoring, as rotational modulation has a key effect on mass-accretion rate diagnostics, such as H α . The low-mass component of ULLYSES should thus help to unravel the rotationally modulated complex spectral diagnostics.
Time variability studies of line emission of PMS Herbig Ae stars have also shown rotational modulation to be a decisive factor. In Chapter 3, Ignacio Mendigutia highlights a range of additional evidence in favour of the T Tauri model of magnetospheric accretion to be applicable in the Herbig Ae range. Furthermore, it is argued that the more massive Herbig Be stars are subjected to a different mode of accretion, possibly involving a boundary layer.
Independent of the specific mode of accretion along the stellar mass sequence, it is clear that the UV will play a vital role in deciding the modes of accretion, and for deriving accurate mass-accretion rates as a function of stellar mass. A relatively unexplored physical dimension in the PMS range is that of Z. This is mostly due to the fact that PMS stars are faint and spectroscopy of PMSs in low-Z environments is only slowly starting to take off, sometimes in the form of “extremely low resolution spectroscopic” i.e., narrow-band photometric methods. At the moment it is still under debate whether the mass-accretion rates of PMS stars depend on Z, or not ([6] vs. [7]).

3. Massive and Very Massive Stars

Massive stars dominate the light of star-forming galaxies and are also thought to dominate the light from the First Galaxies. In certain circumstances it might even be the case that most of the stellar mass is locked up in massive stars, leading to a top-heavy initial mass function (IMF; [8]). whether the IMF of the First Stars was top-heavy is still under debate, but it is considered likely on theoretical grounds [1,2,9].
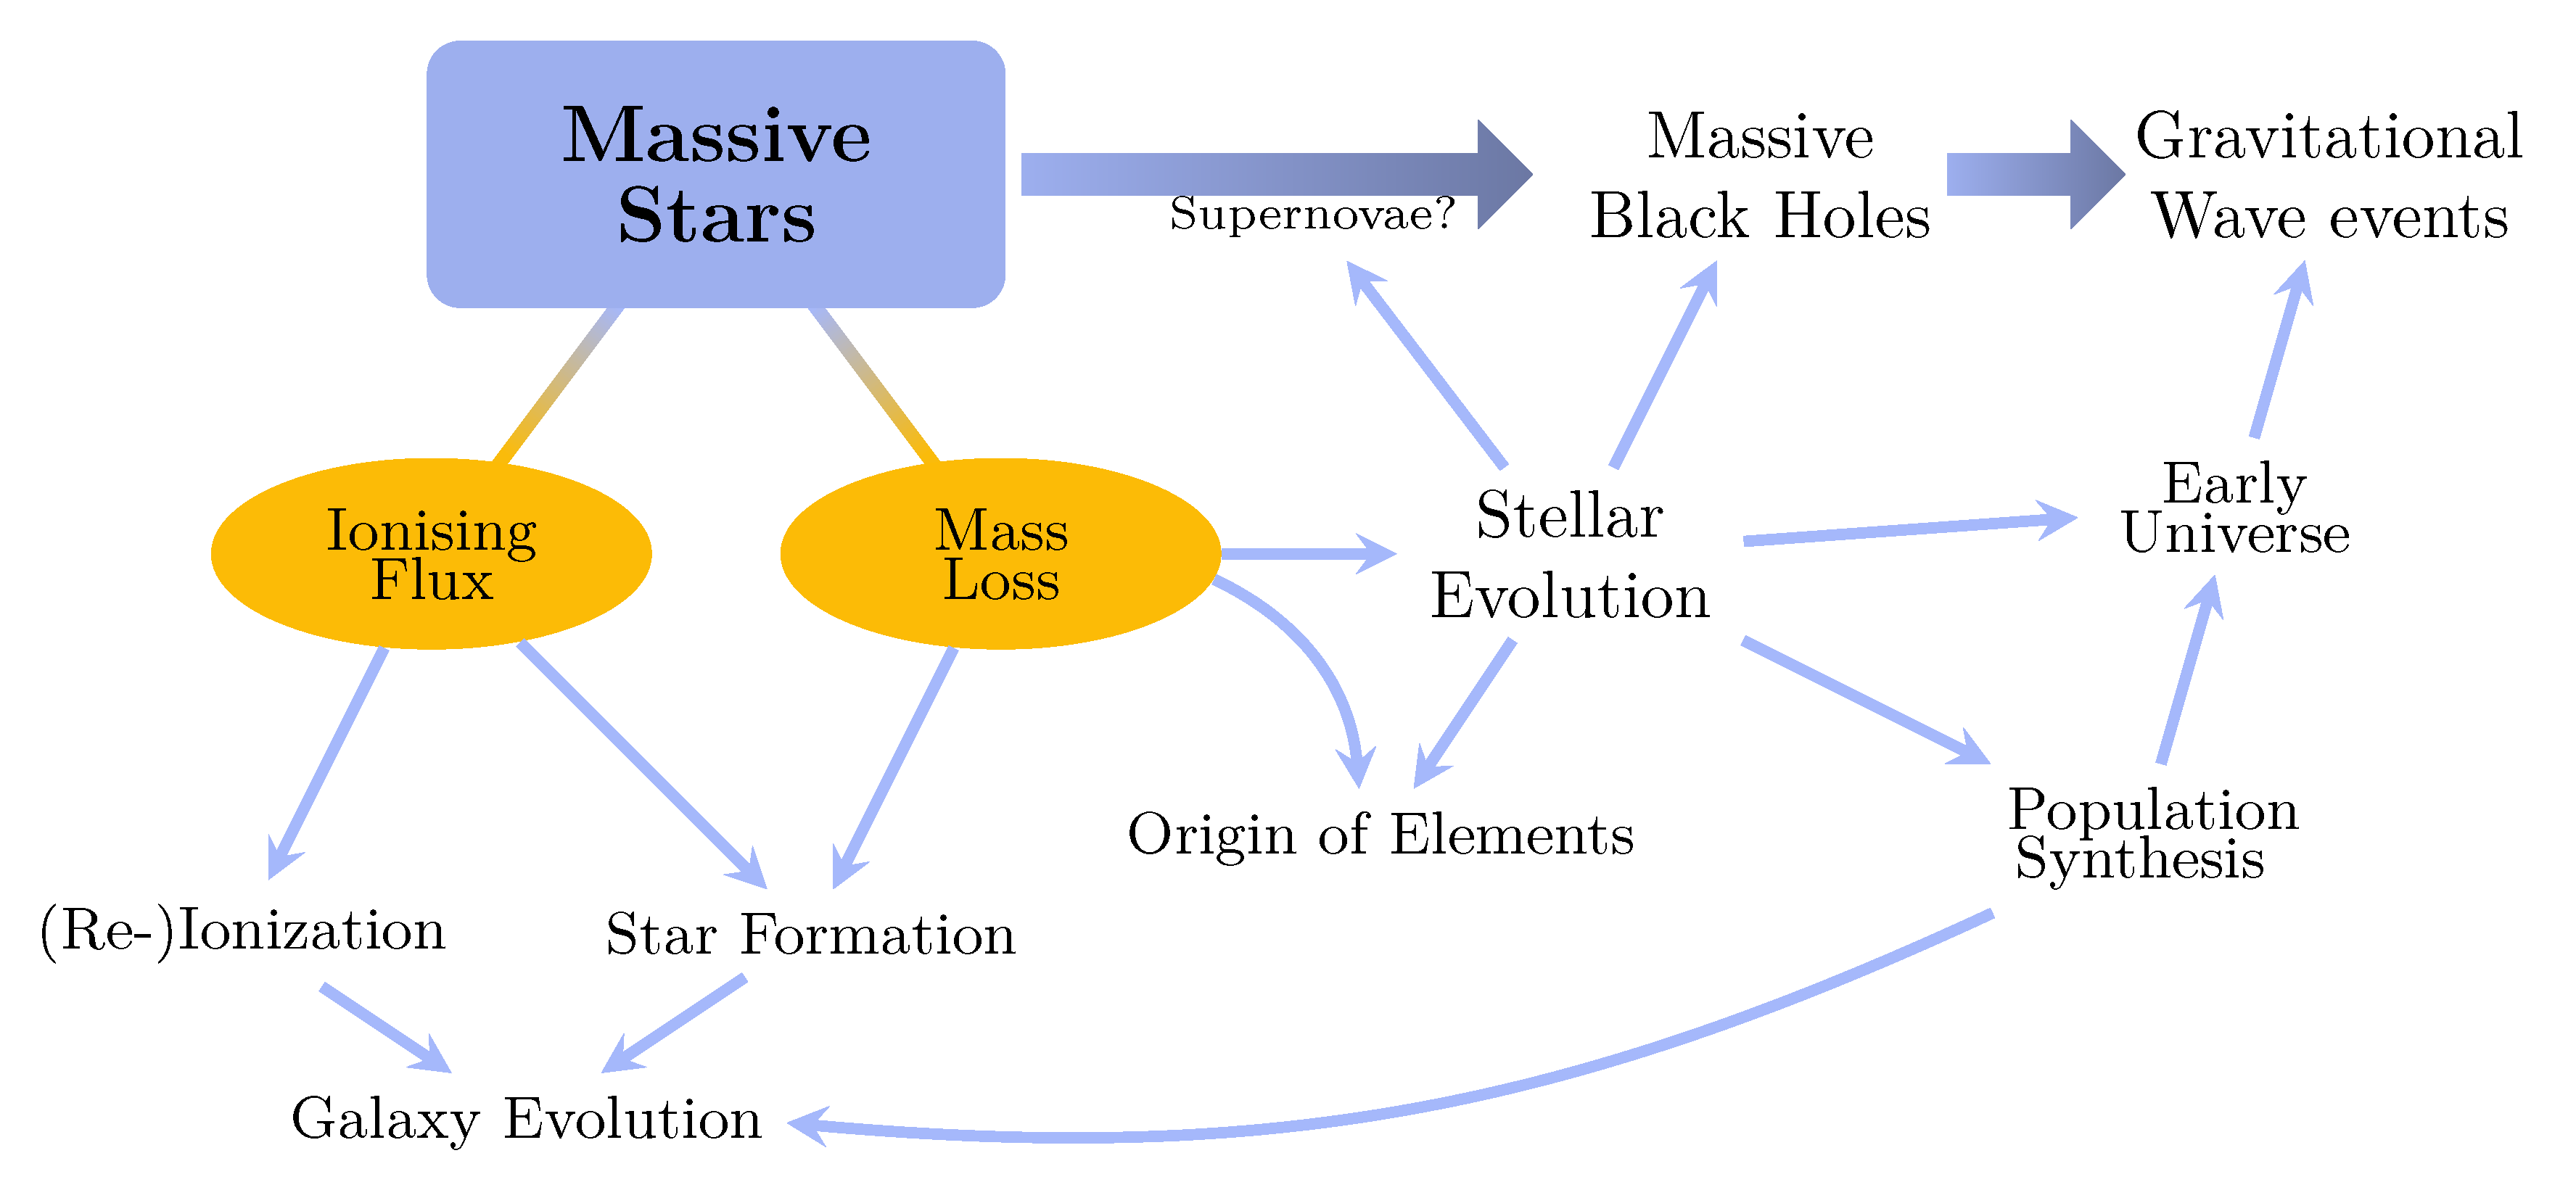
Even in Today’s Universe massive stars are key cornerstones to many aspects of Astrophysics (see Figure 2 for an overview). In order to understand gravitational wave (GW) events as a function of cosmic time and Z, we need to understand the evolution & winds of massive stars at low Z. For our understanding of stellar feedback and He ii emission at high redshift we need to be able to predict the ionising and UV radiation of massive stars which is determined by their effective temperatures and mass-loss rates. In order to properly predict the spectrum of a massive star it is pivotal to apply non-LTE (local thermodynamic equilibrium) radiative transfer models of spherical expanding atmospheres, as described in Chapter 4 by John Hillier, and compare these models to large samples of spectra at UV (ULLYSES contains 500 HST orbits on massive OB and WR stars) and optical wavelength ranges. This is needed given the extreme observational uncertainties associated with mass-loss rates of massive stars below LMC metallicity [10,11,12,13,14,15], and the discovery-space available to diagnose the wind—and in the case of O-stars also the photospheric—conditions of low-Z stars.
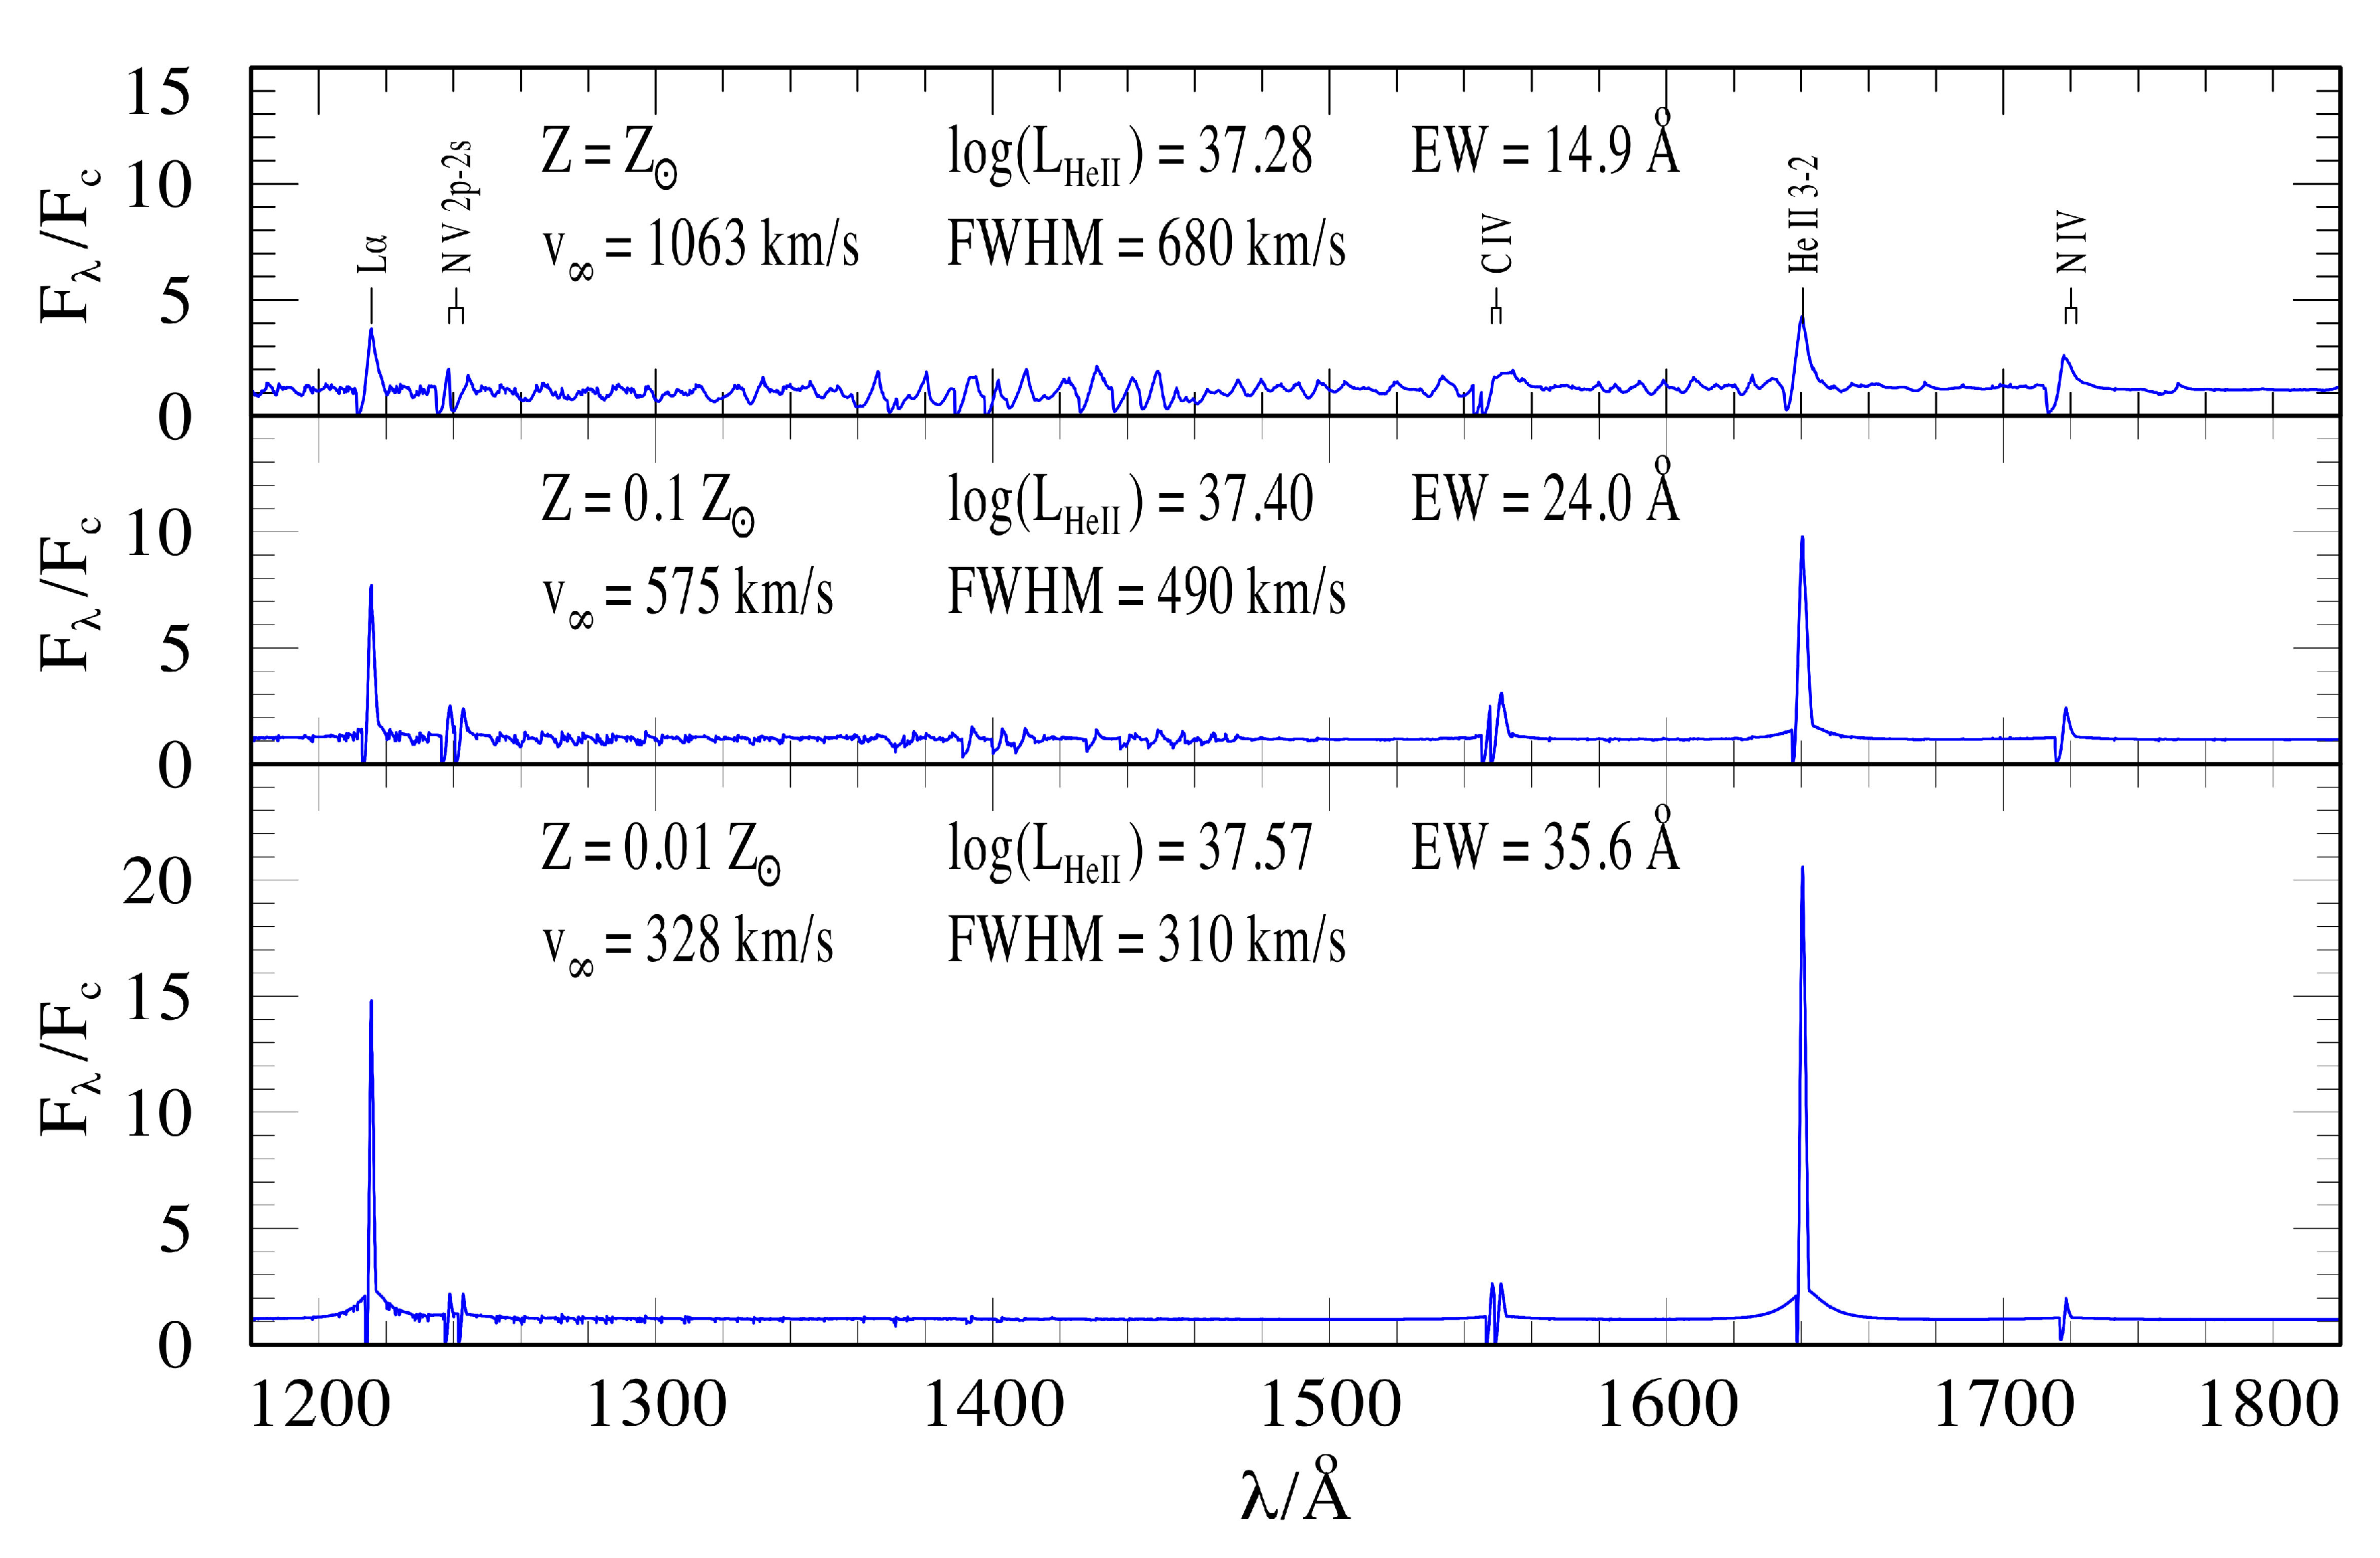
The expanding non-LTE wind models are generally able to successfully predict the observed UV and optical spectra of the Galactic massive O and WR stars. However, radiation is not only a probe for the conditions in the atmospheres, but also a key constituent itself! It is the radiation pressure gradient that provides an outward acceleration kick-starting an intense radiation-driven wind. Such winds leave very specific line diagnostics in the electromagnetic (EM) spectrum, including P Cygni scattering lines in the UV as well as (usually broad, but see Section 5 and Figure 4) recombination emission lines in the UV (e.g.; He ii 1640Å), optical and infrared regime.

4. WR Stars

In the range of massive stars there are basically 2 types of WR stars: (i) H-rich VMS, which are VMS that still burn H in their cores, and (ii) classical WR stars (cWRs) that are evolved helium (He) burning stars (see Figure 1). The latter group normally dominates the population, but note that the WR phenomenon is a spectroscopic classification and in principle independent of evolutionary phase (cf. [16,17] for a more recent discussion). The reason for the occurrence of emission lines is that the winds have become optically thick ( τ > 1 ) and this means also means that multiple scattering (wind efficiently η > 1 ) is a dominant physical process in their winds [18]. While, the fundamental difference between optically thin O star and optically thick cWR star winds has been recognized more than two decades ago, the detailed understanding of cWR winds is still in its early stages with the differences between the cWR and O star regimes just starting to become more clear. In particular the traditional Castor et al. (CAK, [19]) radiation-driven wind parametrization in terms of force multipliers completely breaks-down in the regime of the cWRs [20].
For H-rich VMS, the transition between normal O stars and H-rich VMS (WNh stars) has already been better mapped in the last decade, both theoretically [21] and empirically [22]. Due to the proximity to the Eddington limit, these VMS have wind mass-loss rates that are significantly enhanced in comparison to normal O-star winds, an effect typically not yet accounted for in stellar evolution & population synthesis models. Yet, we know that it is these VMS that are dominant in terms of their ionising radiation and kinetic wind input over the canonical O-star population [23,24,25]. Even when the upper-mass limit was still considered to be in the range 120–150 M [26,27,28] the most massive stars dominated these quantities [29]. With an increase in the upper-mass limit to 200–300 M [30,31,32] this dominance is only expected to grow.
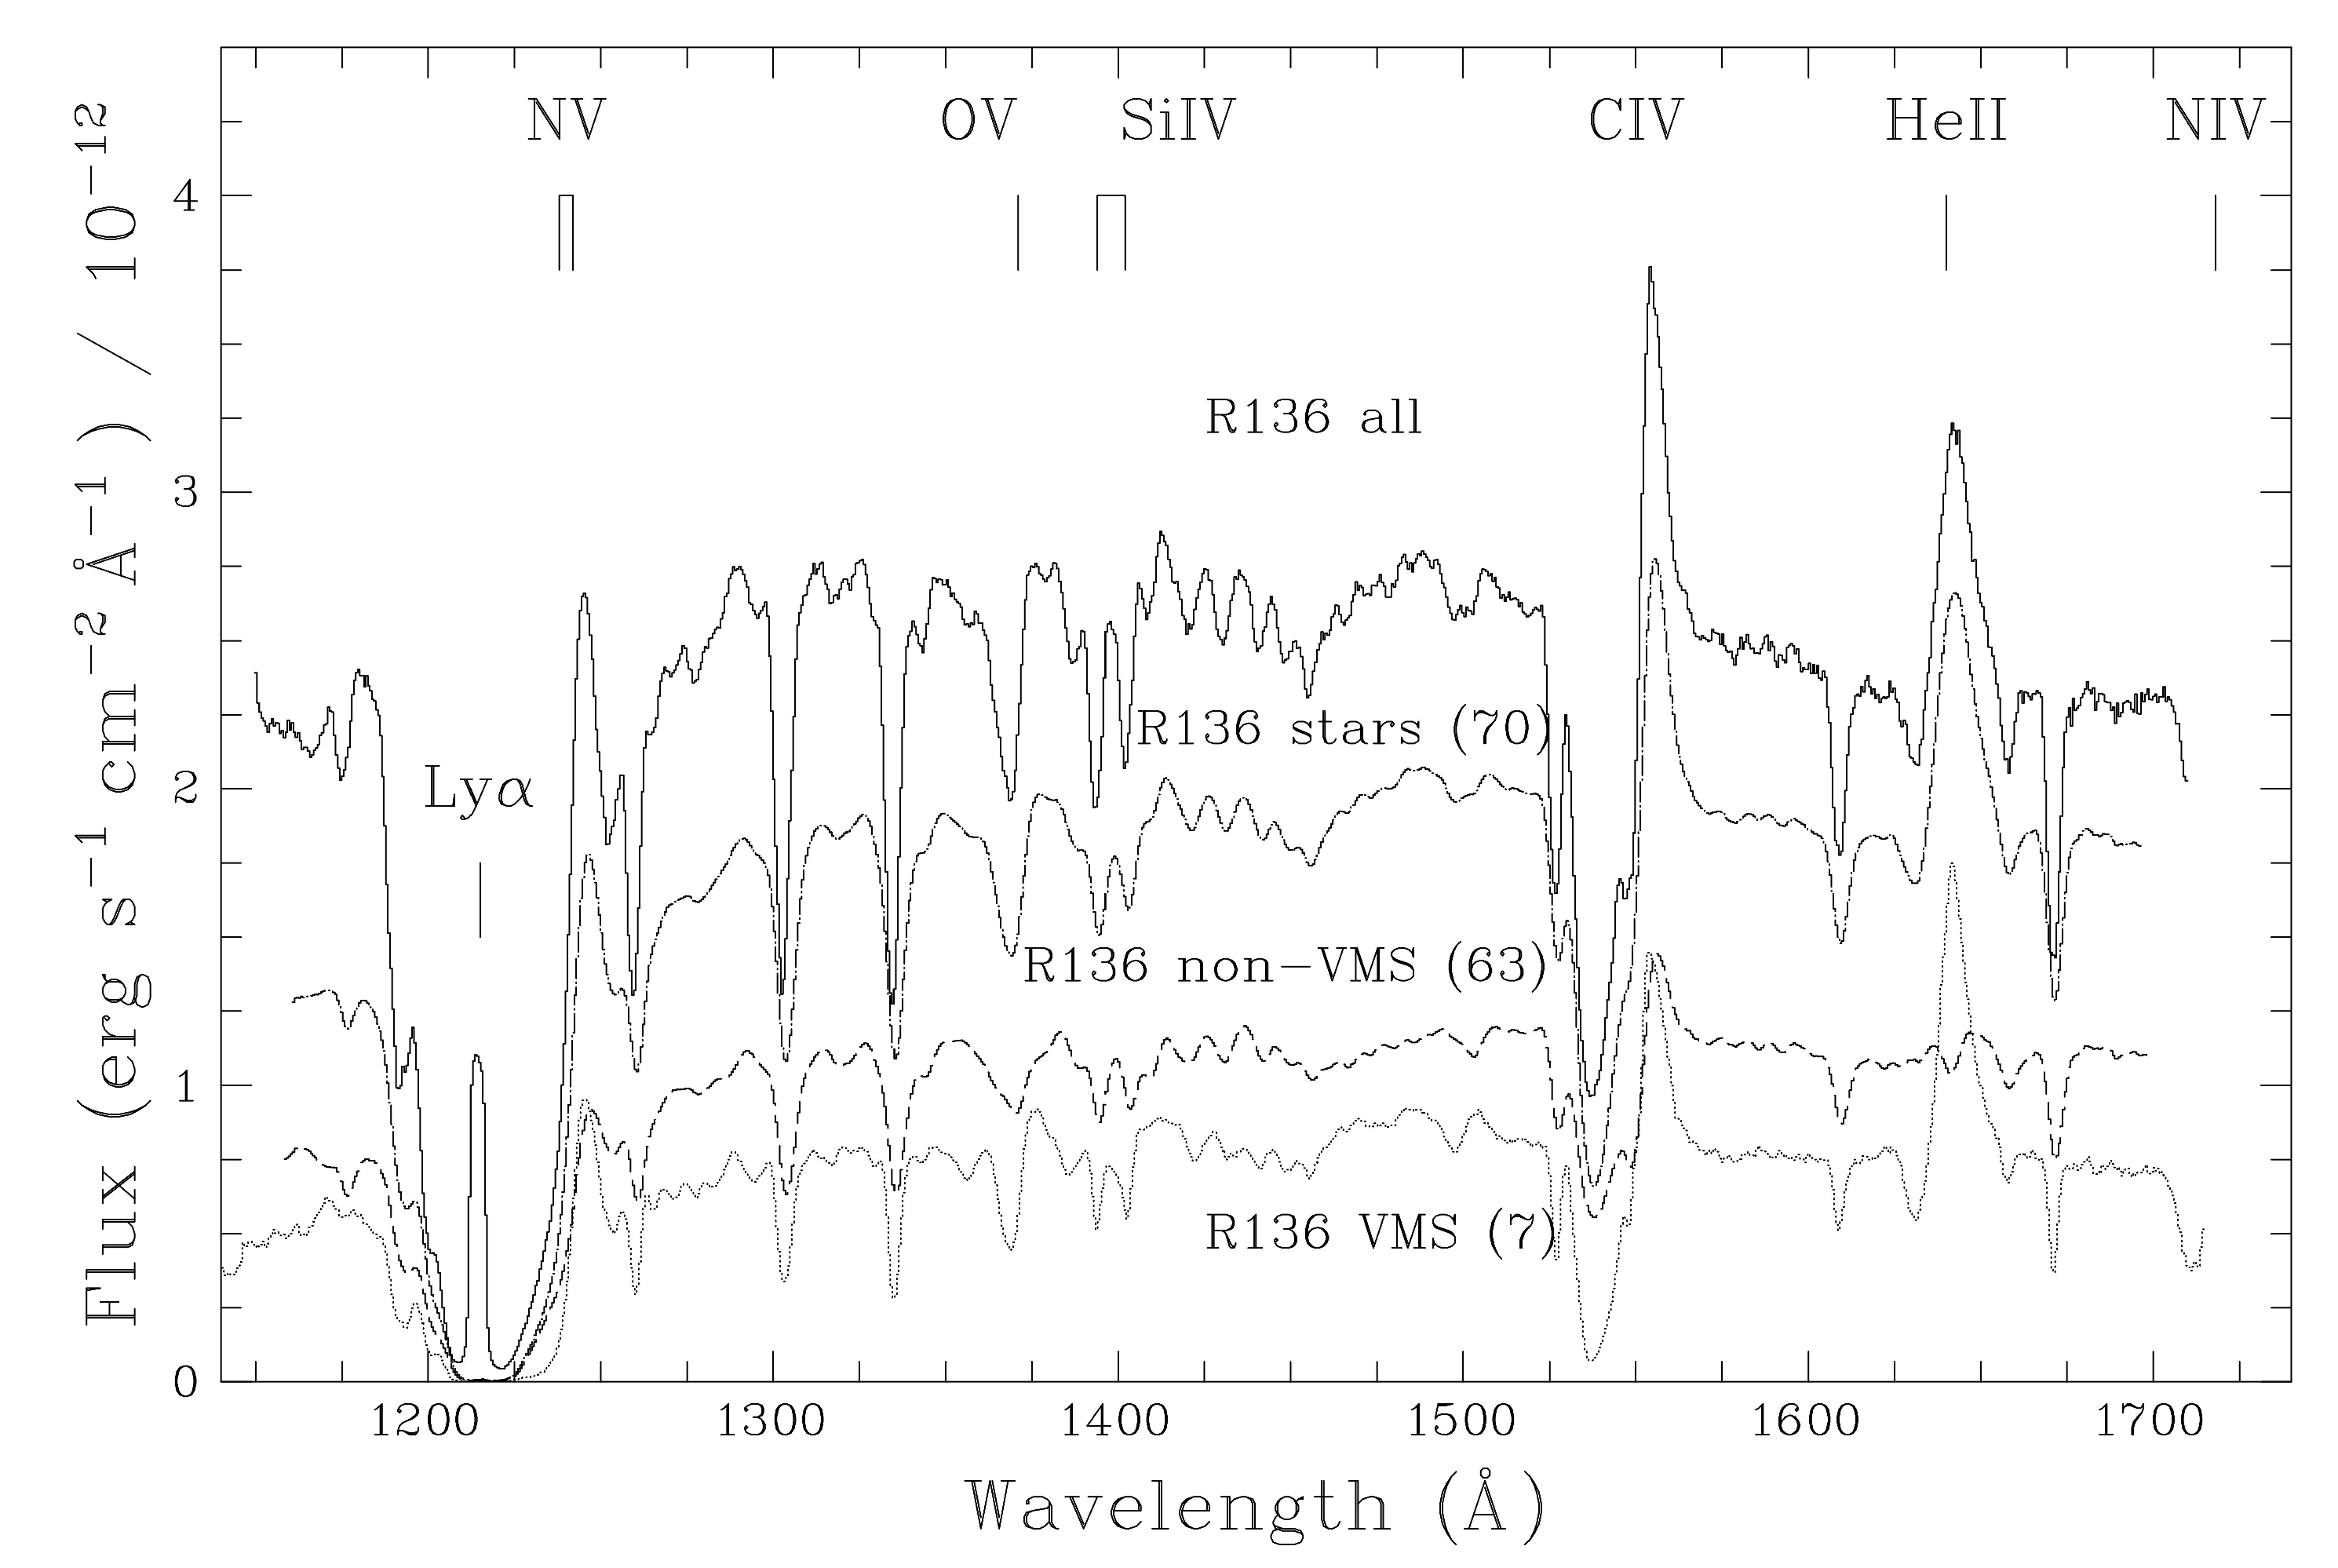
For the ionising radiation budget and in particular also the expected total He ii emission it is relevant to realize that locally, such as in the Tarantula Nebula, it is the very massive stars that are the dominant contributors (see Figure 3 and [24,25]). This therefore suggests that VMS also need to be appropriately accounted for in the predictions of the ionizing radiation and additional physical properties of the stellar populations of the Early Universe.

5. He II Emission at High Redshift

A fundamental question concerns the origin of the sources of the First Light ending the Cosmic Dark Ages and beginning the process of re-ionization. In particular the James Webb Space Telescope (JWST) and ground-based extremely large telescopes (ELTs) are expected to provide direct access to this critical period via observations of the first star-forming galaxies at high redshifts ( z 10 ).
Ly α λ 1216 and He ii λ 1640 emission are seen as the main indications for stars formed out of pristine gas (the so-called “Pop III stars”). The reason is that only at extremely low Z, massive stars are believed to be hot enough to excite He ii in their surrounding H ii regions [33]. The investigation of star-forming galaxies with redshifted He ii emission at moderate & high redshifts, which have become increasingly accessible with current ground-based instrumentation [34,35,36], is thus an important preparation for future studies of the first star-forming galaxies.
In relatively recent studies of moderate redshift (z = 2 − 5) star-forming galaxies He ii λ 1640 emission was found to occur in two modes distinguished by the width of their emission lines [37]. Broad emission has been attributed to stellar emission from cWR stars, but the origin of narrow He ii emission is less obvious. In extra-galactic studies it has generally been attributed to nebular emission excited by a population of hot Pop III stars formed in pockets of pristine gas at moderate redshifts (see also [38] for even higher redshift data).
There are however plausible alternatives to these Pop III postulations. One of them involves the suggestion of stellar emission from VMS at low Z due to a strong but slow wind (see Figure 4). Gräfener & Vink [39] estimated the expected He ii line flux and equivalent widths (EWs) based on their VMS wind models and Starburst99 [40,41] population synthesis models, and compared their results with observed star-forming galaxy spectra, finding that the measured He ii line strengths and EWs are in line with what is expected for a VMS population in one or more young clusters located in these galaxies.
Future high spectral resolution studies could help distinguish between nebular and stellar emission from VMS, taking into account that slower VMS winds yield narrower lines, possibly even below the slow-wind predictions from Gräfener & Vink [39]. Moreover, it is pertinent that new population models are tested on local He ii emitting galaxies as well. For instance, for the local very low metallicity analog IZw 18 (with Z below 1/20 Z ) Kehrig et al. [42] found the spatial extent of the He ii emission to be at odds from the location of the massive stellar population, challenging the contribution from stellar He ii emission from VMS. It seems clear that in order to explain the full observed range of complex He ii line morphologies, both in local He ii emitting galaxies [43,44,45,46] and further afield [36] will require a combined model of stellar and nebular contributions from a range of sources, involving stellar population and photoionisation modelling.

6. Stripped Stars Due to Potential Binary Interaction

Another potential source of ionising radiation at high redshift, and possibly contributing to cosmic re-ionisation, has recently been put forward: binary-stripped helium stars [47,48], which should be located at luminosities just below the classical WR stars (see Figure 1). Sander et al. [20] demonstrated that He star mass-loss rates drop significantly below a certain luminosity and luminosity-to-mass (L/M) ratio. This implies that extrapolations from empirical mass-loss recipes applicable to cWR stars (such as [49]) are inaccurate for stripped He stars, confirming the earlier pilot study results of Vink [50].
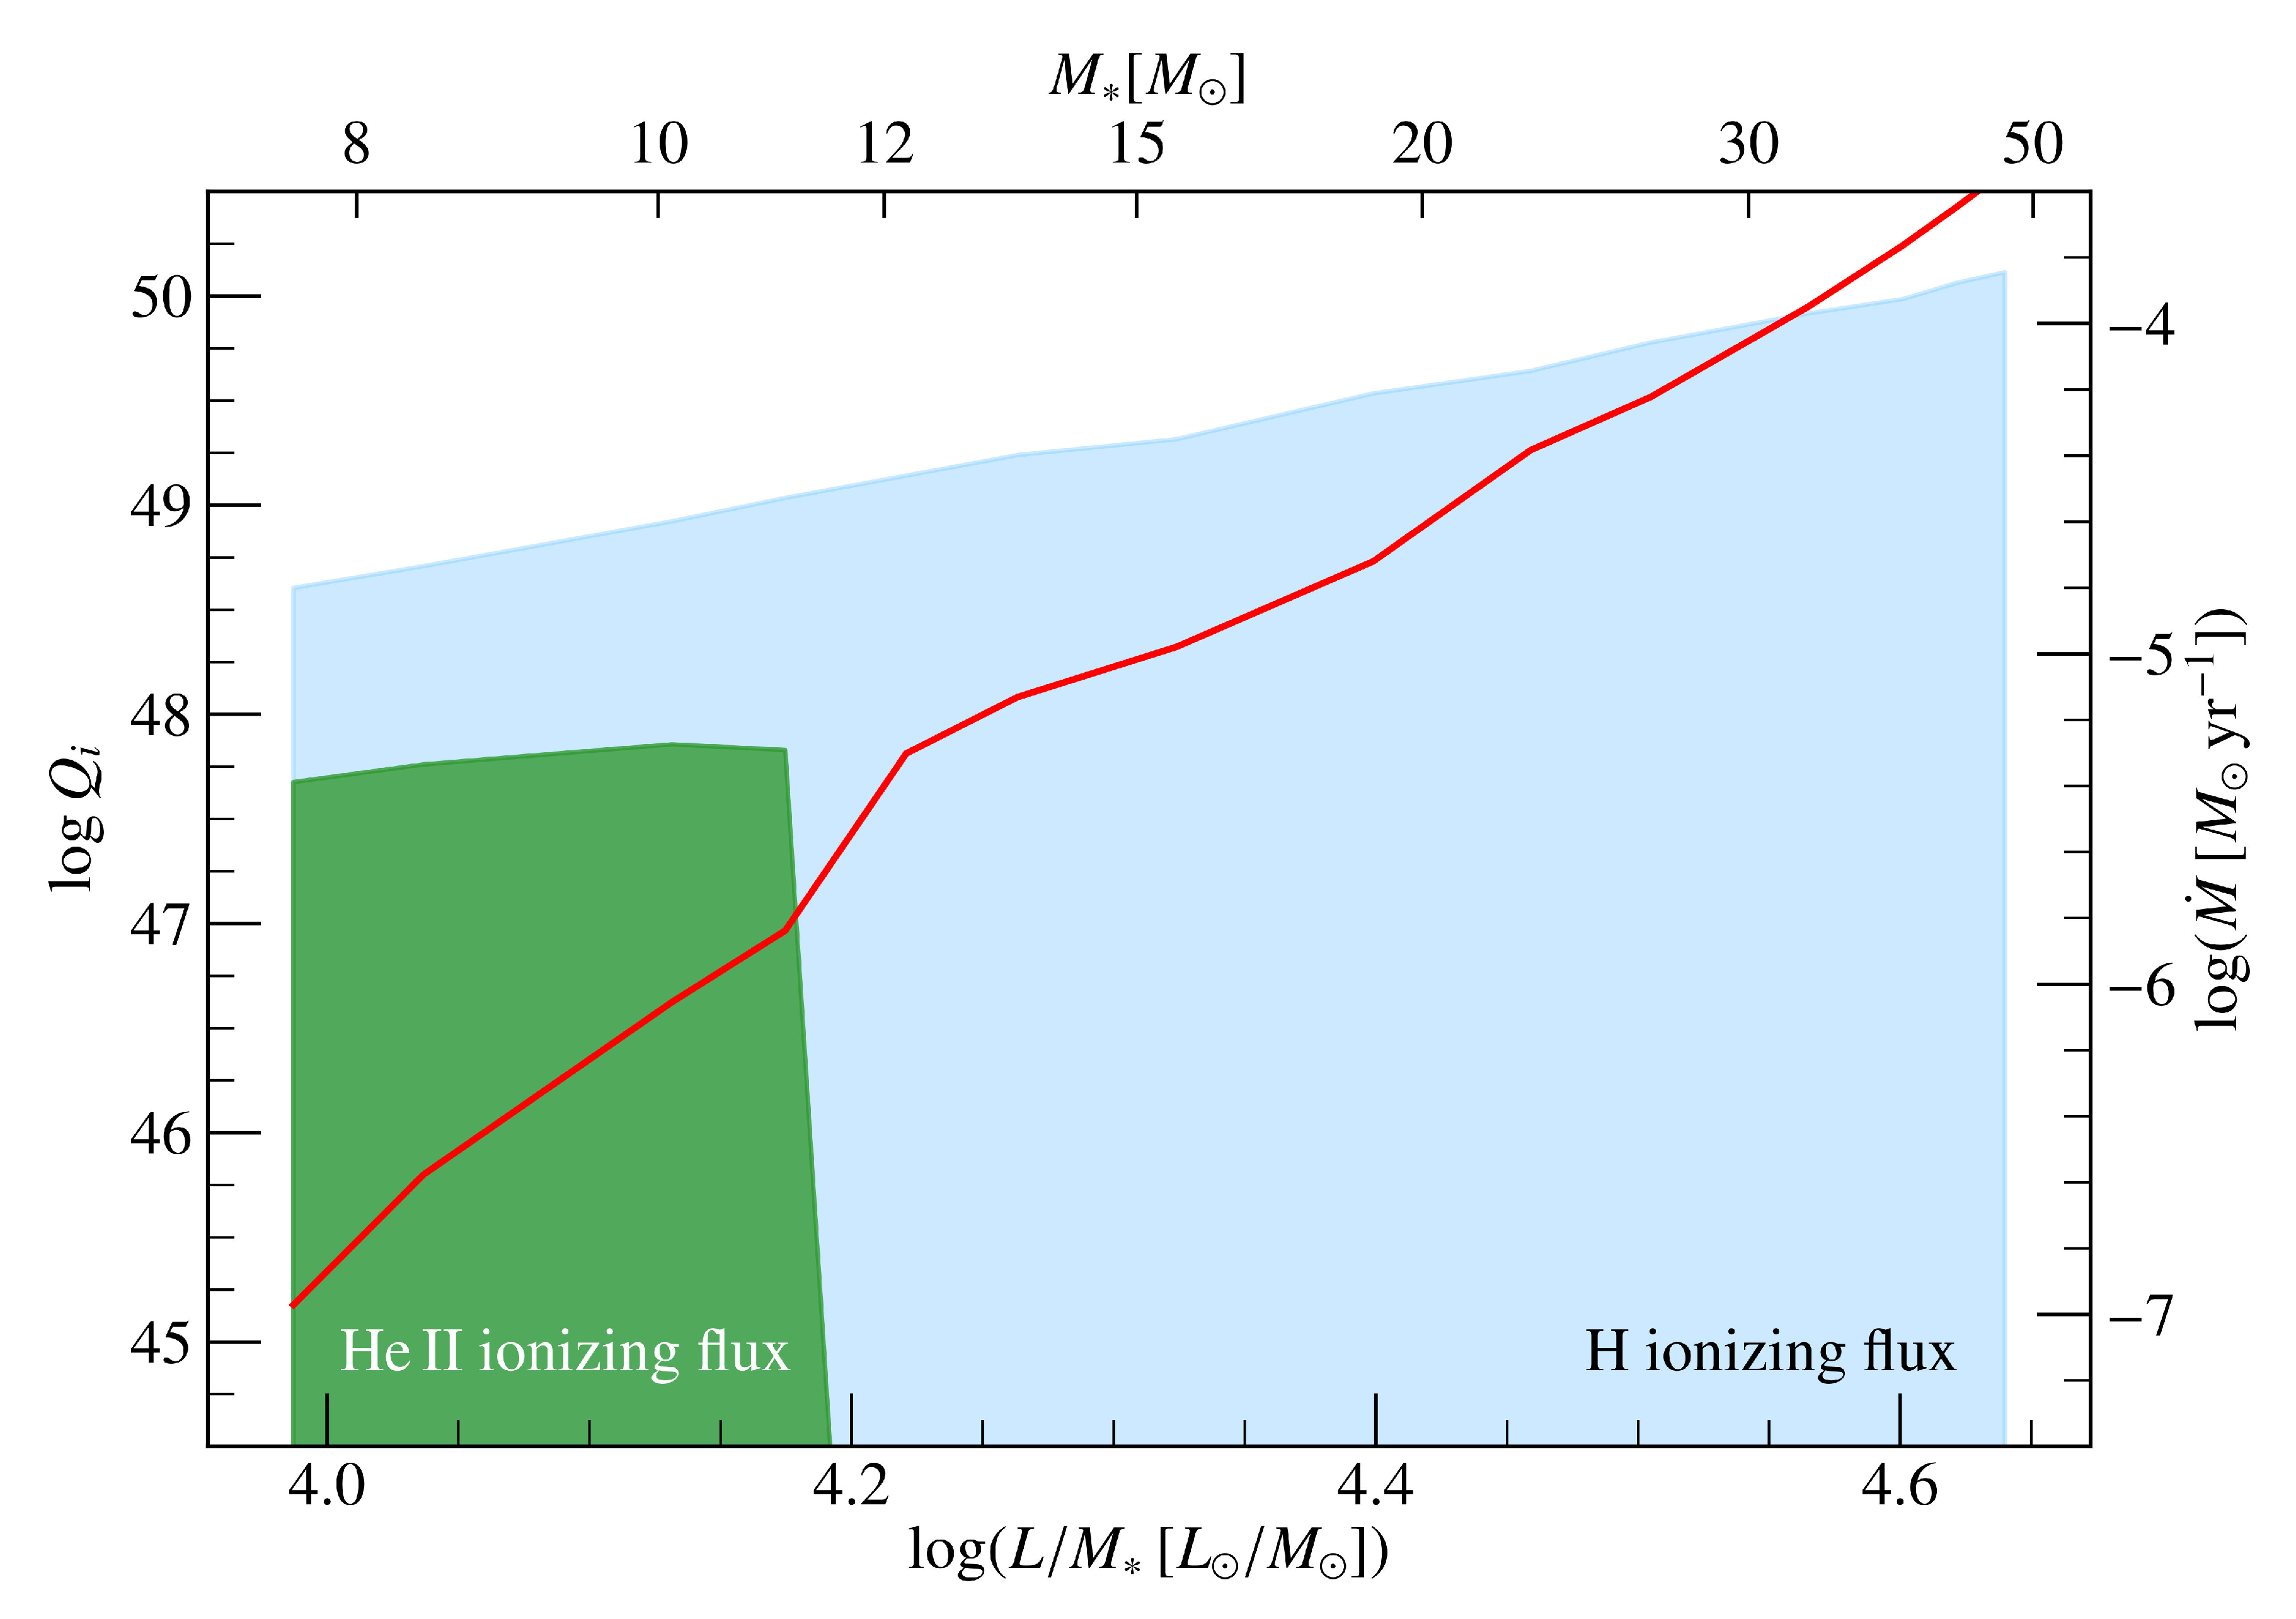
Figure 5 showcases state-of-the-art hydro-dynamical PoWR computations—for L/M ratios from stellar models—that straddle both the optically thick cWR part as well as the optically thin “stripped star” regime due to Vink [50]. The figure shows the ionising photon flux for H and He over a wide range of L / M ratios. The most notable aspect is probably that the He ii ionisation flux changes abruptly by a factor > 1000 at a critical L / M ratio.
A similar transition between optically thin and thick winds in the H-rich part of the HRD was studied in Vink et al. [21], but the transition in the He-rich part of the HRD is only recently being investigated. The results from Figure 5 show that any existing study of stripped stars contributing to the He ionisation of the Universe will necessarily suffer from enormous uncertainties, until we develop a proper understanding of stripped stars via hydro-dynamical stellar atmospheres.

7. Summary and Outlook

In order to predict the feedback from massive stars in star-forming galaxies at low Z, we need to better understand the mass-loss rates and associated ionising fluxes from (very) massive stars (VMS), as well as binary-stripped He stars.
In Section 5, the possibility for the existence of VMS with slow winds at extremely low Z was discussed. Stellar He ii emission from such very early VMS generations may become detectable in studies of star-forming galaxies at high redshifts with JWST and ELTs. The fact that both the stellar and the nebular He ii emission of VMS are still largely neglected in current population synthesis models of massive (single and binary) stars implies that massive progress is urgently required in order to properly interpret the integrated spectra of young stellar populations, both nearby & far-away [51].
Furthermore, we require an improved understanding of the more canonical massive O and WR stars, especially in low Z galaxies. For these reasons HST has dedicated hundreds of its orbits to build the spectroscopic Legacy survey ULLYSES. This Hubble Atlas will not only provide a fundamental reference data set for UV spectroscopy at low Z, but will also be a treasury chest for gaining a greater understanding of the winds, evolution, atmospheres, and ionising feedback parameters of massive stars that are urgently required to advance population synthesis modelling in the 21st century.

Funding

This research received no external.

Acknowledgments

I would like to thank Andreas Sander for constructive comments, and I would like to extend my gratitude to all my other colleagues from the last decade: little would have been achieved without you.

Conflicts of Interest

The authors declare no conflict of interest.

References

  1. Abel, T.; Bryan, G.L.; Norman, M.L. The Formation and Fragmentation of Primordial Molecular Clouds. Astrophys. J. 2000, 540, 39. [Google Scholar] [CrossRef] [Green Version]
  2. Bromm, V.; Coppi, P.S.; Larson, R.B. Forming the First Stars in the Universe: The Fragmentation of Primordial Gas. Astrophys. J. 1999, 527, L5. [Google Scholar] [CrossRef] [PubMed] [Green Version]
  3. Sana, H.; de Koter, A.; de Mink, S.E.; Dunstall, P.R.; Evans, C.J.; Hénault-Brunet, V.; Maíz Apellániz, J.; Ramírez-Agudelo, O.H.; Taylor, W.D.; Walborn, N.R.; et al. The VLT-FLAMES Tarantula Survey. VIII. Multiplicity properties of the O-type star population. Astronom. Astrophys. 2013, 550, A107. [Google Scholar] [CrossRef] [Green Version]
  4. Hartmann, L.; Herczeg, G.; Calvet, N. Accretion onto Pre-Main-Sequence Stars. Annu. Rev. Astronom. Astrophys. 2016, 54, 135. [Google Scholar] [CrossRef]
  5. Calvet, N.; Gullbring, E. The Structure and Emission of the Accretion Shock in T Tauri Stars. Astrophys. J. 1998, 509, 802. [Google Scholar] [CrossRef] [Green Version]
  6. De Marchi, G.; Panagia, N.; Romaniello, M.; Sabbi, E.; Sirianni, M.; Moroni, P.G.P.; Degl’Innocenti, S. Photometric Determination of the Mass Accretion Rates of Pre-main-sequence Stars. II. NGC 346 in the Small Magellanic Cloud. Astrophys. J. 2011, 740, 11. [Google Scholar] [CrossRef] [Green Version]
  7. Kalari, V.M.; Vink, J.S. Pre-main-sequence Accretion in the Low Metallicity Galactic Star-forming Region Sh 2-284. Astrophys. J. 2015, 800, 113. [Google Scholar] [CrossRef] [Green Version]
  8. Schneider, F.R.N.; Sana, H.; Evans, C.J.; Bestenlehner, J.M.; Castro, N.; Fossati, L.; Gräfener, G.; Langer, N.; Ramírez-Agudelo, O.H.; Sabín-Sanjulián, C.; et al. An excess of massive stars in the local 30 Doradus starburst. Science 2018, 359, 69–71. [Google Scholar] [CrossRef] [Green Version]
  9. Haemmerlé, L.; Mayer, L.; Klessen, R.S.; Hosokawa, T.; Madau, P.; Bromm, V. Formation of the first stars and black holes. arXiv 2020, arXiv:2003.10533. [Google Scholar]
  10. Mokiem, M.R.; de Koter, A.; Vink, J.S.; Puls, J.; Evans, C.J.; Smartt, S.J.; Crowther, P.A.; Herrero, A.; Langer, N.; Lennon, D.J.; et al. The empirical metallicity dependence of the mass-loss rate of O- and early B-type stars. Astronom. Astrophys. 2007, 473, 603–614. [Google Scholar] [CrossRef]
  11. Bouret, J.-C.; Lanz, T.; Hillier, D.J.; Martins, F.; Marcolino, W.L.F.; Depagne, E. No breakdown of the radiatively driven wind theory in low-metallicity environments. Mon. Notices R. Astronom. Soc. 2015, 449, 1545. [Google Scholar] [CrossRef] [Green Version]
  12. Tramper, F.; Straal, S.M.; Sanyal, D.; Sana, H.; de Koter, A.; Gräfener, G.; Langer, N.; Vink, J.S.; De Mink, S.E.; Kaper, L. Massive stars on the verge of exploding: The properties of oxygen sequenceWolf-Rayet stars. Astronom. Astrophys. 2015, 581, A110. [Google Scholar] [CrossRef] [Green Version]
  13. Evans, C.J.; Castro, N.; Gonzalez, O.A.; Garcia, M.; Bastian, N.; Cioni, M.-R.L.; Clark, J.S.; Davies, B.; Ferguson, A.M.N.; Kamann, S.; et al. First stellar spectroscopy in Leo P. Astronom. Astrophys. 2019, 622, A129. [Google Scholar]
  14. Garcia, M.; Herrero, A.; Najarro, F.; Camacho, I.; Lorenzo, M. Ongoing star formation at the outskirts of Sextans A: Spectroscopic detection of early O-type stars. Mon. Notices R. Astonom. Soc. 2019, 484, 422. [Google Scholar] [CrossRef] [Green Version]
  15. Ramachandran, V.; Hamann, W.R.; Oskinova, L.M.; Gallagher, J.S.; Hainich, R.; Shenar, T.; Sander, A.A.C.; Todt, H.; Fulmer, L. Testing massive star evolution, star formation history, and feedback at low metallicity. Spectroscopic analysis of OB stars in the SMC Wing. Astronom. Astrophys. 2019, 625, A104. [Google Scholar] [CrossRef]
  16. Beals, C.S. On the Physical Characteristics of the Wolf Rayet Stars and their Relation to Other Objects of Early Type (with Plates VIII, IX). J. R. Astronom. Soc. Can. 1940, 34, 169. [Google Scholar]
  17. Shenar, T.; Gilkis, A.; Vink, J.S.; Sana, H.; Sander, A.A.C. Why binary interaction does not necessarily dominate the formation of Wolf-Rayet stars at low metallicity. Astronom. Astrophys. 2020, 634, A79. [Google Scholar] [CrossRef] [Green Version]
  18. Vink, J.S.; Gräfener, G. The Transition Mass-loss Rate: Calibrating the Role of Line-driven Winds in Massive Star Evolution. Astrophys. J. 2012, 751, L34. [Google Scholar] [CrossRef]
  19. Castor, J.I.; Abbott, D.C.; Klein, R.I. Radiation-driven winds in Of stars. Astrophys. J. 1975, 195, 157. [Google Scholar] [CrossRef]
  20. Sander, A.A.C.; Vink, J.S.; Hamann, W.-R. Driving classical Wolf-Rayet winds: A Γ- and Z-dependent mass-loss. Mon. Notices R. Astonom. Soc. 2020, 491, 4406. [Google Scholar] [CrossRef] [Green Version]
  21. Vink, J.S.; Muijres, L.E.; Anthonisse, B.; de Koter, A.; Gräfener, G.; Langer, N. Wind modelling of very massive stars up to 300 solar masses. Astronom. Astrophys. 2011, 531, A132. [Google Scholar] [CrossRef] [Green Version]
  22. Bestenlehner, J.M.; Gräfener, G.; Vink, J.S.; Najarro, F.; de Koter, A.; Sana, H.; Evans, C.J.; Crowther, P.A.; Hénault-Brunet, V.; Herrero, A.; et al. The VLT-FLAMES Tarantula Survey. XVII. Physical and wind properties of massive stars at the top of the main sequence. Astronom. Astrophys. 2014, 570, A38. [Google Scholar] [CrossRef]
  23. Crowther, P.A.; Caballero-Nieves, S.M.; Bostroem, K.A.; Apellániz, J.M.; Schneider, F.R.N.; Walborn, N.R.; Angus, C.R.; Brott, I.; Bonanos, A.; de Koter, A.; et al. The R136 star cluster dissected with Hubble Space Telescope/STIS. I. Far-ultraviolet spectroscopic census and the origin of He II l1640 in young star clusters. Mon. Notices R. Astonom. Soc. 2016, 458, 624–659. [Google Scholar] [CrossRef] [Green Version]
  24. Bestenlehner, J.M. The R136 star cluster dissected with Hubble Space Telescope/STIS. II. Physical properties of the most massive stars in R136. Mon. Notices R. Astonom. Soc. 2020. in preparation. [Google Scholar]
  25. Doran, E.I.; Crowther, P.A.; de Koter, A.; Evans, C.J.; McEvoy, C.; Walborn, N.R.; Bastian, N.; Bestenlehner, J.M.; Gräfener, G.; Herrero, A.; et al. The VLT-FLAMES Tarantula Survey. XI. A census of the hot luminous stars and their feedback in 30 Doradus. Astronom. Astrophys. 2013, 558, A134. [Google Scholar] [CrossRef]
  26. Weidner, C.; Kroupa, P. Evidence for a fundamental stellar upper mass limit from clustered star formation. Mon. Notices R. Astonom. Soc. 2004, 348, 187. [Google Scholar] [CrossRef] [Green Version]
  27. Oey, M.S.; Clarke, C.J. Statistical Confirmation of a Stellar Upper Mass Limit. Astrophys. J. 2005, 620, L43. [Google Scholar] [CrossRef]
  28. Figer, D.F. An upper limit to the masses of stars. Nature 2005, 434, 192. [Google Scholar] [CrossRef] [Green Version]
  29. Voss, R.; Diehl, R.; Hartmann, D.H.; Cervino, M.; Vink, J.S.; Meynet, G.; Limongi, M.; Chieffi, A. Using population synthesis of massive stars to study the interstellar medium near OB associations. Astronom. Astrophys. 2009, 504, 531–542. [Google Scholar] [CrossRef]
  30. Crowther, P.A.; Schnurr, O.; Hirschi, R.; Yusof, N.; Parker, R.J.; Goodwin, S.P.; Kassim, H.A. The R136 star cluster hosts several stars whose individual masses greatly exceed the accepted 150Msolar stellar mass limit. Mon. Notices R. Astonom. Soc. 2010, 408, 731–751. [Google Scholar] [CrossRef] [Green Version]
  31. Martins, F. Empirical Properties of Very Massive Stars. In Very Massive Stars in the Local Universe; Springer: Cham, Switzerland, 2015. [Google Scholar]
  32. Vink, J.S. Very massive stars: A metallicity-dependent upper-mass limit, slow winds, and the self-enrichment of globular clusters. Astronom. Astrophys. 2018, 615, A119. [Google Scholar] [CrossRef]
  33. Schaerer, D. The transition from Population III to normal galaxies: Lyalpha and He II emission and the ionising properties of high redshift starburst galaxies. Astronom. Astrophys. 2003, 397, 527. [Google Scholar] [CrossRef] [Green Version]
  34. Shapley, A.E.; Steidel, C.C.; Pettini, M.; Adelberger, K.L. Rest-Frame Ultraviolet Spectra of z~3 Lyman Break Galaxies. Astrophys. J. 2003, 588, 65. [Google Scholar] [CrossRef]
  35. Eldridge, J.J.; Stanway, E.R. The effect of stellar evolution uncertainties on the rest-frame ultraviolet stellar lines of C IV and He II in high-redshift Lyman-break galaxies. Mon. Notices R. Astonom. Soc. 2012, 419, 479. [Google Scholar] [CrossRef] [Green Version]
  36. Steidel, C.C.; Strom, A.L.; Pettini, M.; Rudie, G.C.; Reddy, N.A.; Trainor, R.F. Reconciling the Stellar and Nebular Spectra of High-redshift Galaxies. Astrophys. J. 2016, 826, 159. [Google Scholar] [CrossRef]
  37. Cassata, P.; Le Fèvre1, O.; Charlot, S.; Contini, T.; Cucciati, O.; Garilli, B.; Zamorani, G.; Adami1, C.; Bardelli, S.; Le Brun, V.; et al. He II emitters in the VIMOS VLT Deep Survey: Population III star formation or peculiar stellar populations in galaxies at z = 2 − 4.6. Astronom. Astrophys. 2013, 556, A68. [Google Scholar] [CrossRef] [Green Version]
  38. Sobral, D.; Matthee, J.; Darvish, B.; Schaerer, D.; Mobasher, B.; Röttgering, H.J.A.; Santos, S.; Hemmati, S. Evidence for PopIII-like Stellar Populations in the Most Luminous Lyman-a Emitters at the Epoch of Reionization: Spectroscopic Confirmation. Astrophys. J. 2015, 808, 139. [Google Scholar] [CrossRef] [Green Version]
  39. Gräfener, G.; Vink, J.S. Narrow He II emission in star-forming galaxies at low metallicity. Stellar wind emission from a population of very massive stars. Astronom. Astrophys. 2015, 578, L2. [Google Scholar] [CrossRef]
  40. Leitherer, C.; Schaerer, D.; Goldader, J.D.; Delgado, R.M.G.; Robert, C.; Kune, D.F.; de Mello, D.F.; Devost, D.; Heckman, T.M. Starburst99: Synthesis Models for Galaxies with Active Star Formation. Astrophys. J. 1999, 123, 3. [Google Scholar] [CrossRef] [Green Version]
  41. Leitherer, C. Massive Star Formation in the Ultraviolet Observed with the Hubble Space Telescope. Galaxies 2020, 8, 13. [Google Scholar] [CrossRef] [Green Version]
  42. Kehrig, C.; Vílchez, J.M.; Pérez-Montero, E.; Iglesias-Páramo, J.; Brinchmann, J.; Kunth, D.; Durret, F.; Bayo, F.M. The Extended He II l4686-emitting Region in IZw 18 Unveiled: Clues for Peculiar Ionizing Sources. Astrophys. J. 2015, 801, L28. [Google Scholar] [CrossRef] [Green Version]
  43. Senchyna, P.; Stark, D.P.; Vidal-García, A.; Chevallard, J.; Charlot, S.; Mainali, R.; Jones, T.; Wofford, A.; Feltre, A.; Gutkin, J. Ultraviolet spectra of extreme nearby star-forming regions—Approaching a local reference sample for JWST. Mon. Notices R. Astonom. Soc. 2017, 472, 2608–2632. [Google Scholar] [CrossRef] [Green Version]
  44. Jaskot, A.E.; Oey, M.S.; Scarlata, C.; Dowd, T. Kinematics and Optical Depth in the Green Peas: Suppressed Superwinds in Candidate LyC Emitters. Astrophys. J. 2017, 851, L9. [Google Scholar] [CrossRef]
  45. Berg, D.A.; Erb, D.K.; Auger, M.W.; Pettini, M.; Brammer, G.B. A Widow on the Earliest Star Formation: Extreme Photoionization Conditions of a High-ionization, Low-metallicity Lensed Galaxy at z = 2. Astrophys. J. 2018, 859, 164. [Google Scholar] [CrossRef] [Green Version]
  46. Erb, D.K.; Berg, D.A.; Auger, M.W.; Kaplan, D.L.; Brammer, G.; Pettini, M. Subkiloparsec Imaging of Lyα Emission in a Low-mass, Highly Ionized, Gravitationally Lensed Galaxy at z = 1.84. Astrophys. J. 2019, 884, 7. [Google Scholar] [CrossRef] [Green Version]
  47. Götberg, Y.; de Mink, S.E.; McQuinn, M.; Zapartas, E.; Groh, J.H.; Norman, C. Contribution from stars stripped in binaries to cosmic reionization of hydrogen and helium. Astronom. Astrophys. 2020, 634, A134. [Google Scholar] [CrossRef] [Green Version]
  48. Stanway, E.R.; Eldridge, J.J.; Becker, G.D. Stellar population effects on the inferred photon density at reionization. Mon. Notices R. Astonom. Soc. 2016, 456, 485. [Google Scholar] [CrossRef] [Green Version]
  49. Nugis, T.; Lamers, H.J.G.L.M. Mass-loss rates of Wolf-Rayet stars as a function of stellar parameters. Astronom. Astrophys. 2000, 360, 227. [Google Scholar]
  50. Vink, J.S. Winds from stripped low-mass helium stars and Wolf-Rayet stars. Astronom. Astrophys. 2017, 607, L8. [Google Scholar] [CrossRef] [Green Version]
  51. Stanway, E.R. Applications of Stellar Population Synthesis in the Distant Universe. Galaxies 2020, 8, 6. [Google Scholar] [CrossRef] [Green Version]
Figure 1. Schematic HRD including groups of objects discussed in this overview. Indicative masses are shown to the left of the main sequence. The groups of PMS that we discuss are T Tauri and Herbig Ae/Be stars. The He-rich stars are the classical WR stars and the potential stripped He stars. Massive stars do not have a visible PMS phase, i.e., they are above the birthline. The boundary between canonical massive O stars and VMS is around 100 M .
Galaxies 08 00043 g001
Figure 2. Overview of how massive stars, and in particular the mass-loss rates and ionising fluxes, determined in the UV, impact many adjacent areas of Astrophysics. Image credit: Andreas Sander.
Galaxies 08 00043 g002
Figure 3. Integrated HST spectrum of all sources within 0.5 parsec of R136a1 (solid, all stars), the composite spectrum of all 70 bright stars with F 1500 5 × 10 15 erg s 1 cm 2 Å 1 (dot-dash), comprising 7 very massive stars (VMS, dotted), and the remaining 63 far-UV bright stars (dashed). He ii λ 1640 emission in R136 is totally dominated by VMS. The difference between the ‘stars’ and ‘all’ arises from the contribution from UV-faint, late-type O stars and unresolved early B stars. From [23].
Galaxies 08 00043 g003
Figure 4. Synthetic UV spectra for different metallicities Z from wind models for VMS from Gräfener& Vink (2015). The presented models are computed for luminosities of log ( L / L ) = 6.3 , a stellar temperature T = 45 kK, and have very similar mass-loss rates (∼ 1.8 × 10 5 M /year).
Galaxies 08 00043 g004
Figure 5. Ionising flux and mass-loss predictions from PoWR hydro-dynamical simulations. The red line indicates mass-loss rates (right-hand y-axis) vs. stellar M (top x-axis) and L / M ratio (bottom x-axis) for the He main sequence. Ionising fluxes (left-hand y-axis) are indicated with blue/green Boxes. Whilst the H ionising flux (blue box) varies gradually with M and mass-loss rate, the He ii ionisation flux (green box) changes abruptly by a factor >1000 at a critical L / M 4.2 (from Sander et al. 2020b).
Galaxies 08 00043 g005