
Article

Parallaxes and Proper Motions of Long Period Variable Stars Determined from VLBI and Gaia DR3

1
Graduate School of Science and Engineering, Kagoshima University, Kagoshima 890-0065, Japan
2
Faculty of Education & Human Sciences, Teikyo University of Science, 2-2-1 Senju-Sakuragi, Adachi-ku, Tokyo 120-0045, Japan
3
National Institute of Technology, Sendai College, 4-16-1 Ayashi-Chuo, Aoba-ku, Sendai-shi 989-3128, Miyagi, Japan
4
Joint Institute for VLBI ERIC (JIVE), Oude Hoogeveensedijk 4, 7991 PD Dwingeloo, The Netherlands
*
Author to whom correspondence should be addressed.
Galaxies 2026, 14(2), 26; https://doi.org/10.3390/galaxies14020026
Submission received: 29 January 2026 / Revised: 14 March 2026 / Accepted: 19 March 2026 / Published: 30 March 2026
(This article belongs to the Special Issue Recent Advances in Radio Astronomy)

Abstract

Annual parallaxes of Galactic long period variable stars (LPVs) are essential for determining their distances and intrinsic properties, but their measurement remains challenging because of their large stellar sizes, circumstellar matter, and time-variable surface brightness asymmetry. In this study, we compare astrometric measurements obtained from very long baseline interferometry (VLBI) and Gaia Data Release 3 (DR3) for 43 Galactic LPVs. The parallaxes from the two methods are generally consistent within uncertainties for about half of the sample, although Gaia DR3 parallaxes tend to be slightly smaller than the VLBI values. This is consistent with previously reported systematic offsets. The behavior of parallax uncertainties differs between the two techniques: VLBI parallax errors increase with increasing parallax, whereas Gaia DR3 errors remain nearly constant. Consequently, VLBI measurements are more effective for LPVs with parallaxes smaller than approximately 2 mas, corresponding to distances beyond 500 pc. Proper motions are also compared, showing general agreement with a 2-sigma dispersion of approximately 13 km s−1, consistent with typical AGB outflow velocities. These results demonstrate the complementarity between VLBI and Gaia astrometry. We also find that the dispersion of parallax residuals becomes slightly larger for sources with pulsation periods around one year, suggesting a coupling of timescales between the stellar pulsation and the annual parallax.

1. Introduction

Measuring an annual parallax is a method to obtain the distances of celestial objects using purely geometric calculations, without assumptions about the chemical and/or physical properties of the target sources. Other approaches, such as the infrared period–luminosity relation for Mira variables (e.g., Whitelock et al. [1]), rely on empirical calibrations that depend on the physical properties of the sources. In the last decade, measurements of hundreds of annual parallaxes for star-forming regions (SFRs) and asymptotic giant branch (AGB) stars, including long period variable stars (LPVs) and red supergiants (RSGs), have been achieved with astrometric VLBI observations using the VLBI Exploration of Radio Astrometry (VERA) and the Very Long Baseline Array (VLBA). In almost all measurements, the annual parallaxes are determined by tracing the position shifts of H2O maser spots, while in some cases SiO or OH masers are used. In the study by Reid & Honma [2], the technical details of VLBI astrometry are presented, and a face-on distribution of a large number of maser sources in the Milky Way, whose distances have been determined by astrometric VLBI, is shown. So far, astrometric measurements of a total of 224 sources have been conducted, mainly with VERA [3] and the BeSSeL Survey [4]. Among these 224 sources, parallaxes of 99 sources have been determined with VERA. In addition, the European VLBI Network (EVN) and the Australian Long Baseline Array (LBA) have also been used for some sources.
In 2023, the third Gaia Data Release (DR3)1 [5] provided celestial positions and the apparent brightness in G band for ∼ 1.81 × 10 9 sources. Among these, ∼ 5.85 × 10 8 sources contain the five parameters, and ∼ 8.82 × 10 8 sources include an additional pseudocolour parameter [5]. Lebzelter et al. [6] reported that Gaia DR3 contains ∼ 1.7 × 10 6 LPV candidates. Unlike SFRs, which are deeply embedded in the Galactic plane and difficult to identify in optical catalogs, LPVs are distributed at higher Galactic latitudes and remain sufficiently bright at optical wavelengths to be observed by Gaia. Although they are visible, they are surrounded by circumstellar matter, and they have a large stellar size. A comprehensive discussion of AGB stars is presented in Höfner & Olofsson [7]. Observations have revealed that AGB stars possess complex dynamical atmospheres, showing asymmetries and inhomogeneities in the photospheric and dust-forming layers on timescales of months, as well as longer-lived large-scale structures in the circumstellar envelopes (e.g., [7]). Significant progress has also been made in simulation studies of AGB stars. Chiavassa et al. [8] conducted simulation studies using three-dimensional radiative hydrodynamics of convection to investigate the time variability of the surface structures, demonstrating that the surface brightness asymmetry of LPVs varies with time. Chiavassa et al. [8] reported that the photocentric position at optical wavelengths has a temporal excursion between 0.077 and 0.198 au (5 to 11% of the stellar radius). Since the distances of LPVs in many VLBI studies are on the order of a few hundred pc to a few kpc, the linear size of the excursion expected in Chiavassa et al. [8] corresponds to an angular size of 0.1–1 mas, which is comparable in size to the parallaxes. Similar studies of red supergiants have also been carried out by Chiavassa et al. [9]. Such dynamic changes on the stellar surface may influence both the temporal and structural variability of circumstellar masers observed with VLBI astrometry. In VLBI observations, we also face difficulties due to the assumption of structural invariability of maser emission. Because of the time variability of masers, astrometric VLBI observations are preferably performed within a timescale comparable to the lifetime of maser emissions. Whether using VLBI observations or optical observations by Gaia, the measurement of annual parallaxes for LPVs is inevitably accompanied by many difficulties.
Recently, in 2025, Bobylev [10] compared the parallaxes of 102 stars between VLBI and Gaia DR3, and reported an offset of 38 ± 11 μ as in the Gaia DR3 parallaxes. In the study by Andriantsaralaza et al. [11], the astrometric results obtained with Gaia DR3 are discussed with a particular focus on AGB stars. However, the present study extends the work of Andriantsaralaza et al. [11] by including a detailed comparison of proper motions and by examining the influence of stellar pulsation periods on the astrometric parameters, based on the parallaxes measured by VLBI and Gaia DR3 for LPVs.

2. Collection of Astrometric Parameters from VLBI and Gaia DR3

2.1. Annual Parallaxes

We collected 43 Galactic LPVs with determined parallaxes from the astrometric VLBI observations. Table 1 represents the coordinates of the sources in the order of Right Ascension (RA). The coordinates were retrieved from the widely used online astronomical database SIMBAD2 [12]. In the SIMBAD database, most source coordinates are adopted from Gaia EDR3 [13]. However, for a few sources, coordinates from other catalogs were used: OH 138.0 + 7.2 from 2MASS [14], OH 231.8 + 4.2 from WISE All-sky Data Release [15], and W Hya from Gaia DR2 [16]. The Galactic coordinates ( l , b ) provided in the SIMBAD results are also included in Table 1. In Table 2, parallax values measured from astrometric VLBI and Gaia DR3 are presented in the third and fourth columns as Π VLBI and Π DR 3 , respectively. In the second column, source types are presented. Since the parallaxes and their formal errors in Gaia DR3 are given to many decimal places, we rounded the values to 0.01 mas. In the fifth column, we presented m G as G-band photometric results in Gaia DR3. Pulsation periods (P) in units of days and its logarithms ( Log P ) are presented in the following columns. Species of maser molecules observed in each VLBI observation are presented in the eighth column. In the last two columns, references for the pulsation periods and VLBI parallaxes are presented using abbreviations. See the table footnote for details of the references. For R Aqr, VLBI parallaxes are published in two independent studies by Kamohara et al. [17] and Min et al. [18]; therefore, they comprise two lines in Table 2. Since parallaxes of three sources, WX Psc, OH 138.0 + 7.2, and W Hya, are not available in the Gaia DR3 catalog, we entered dots (⋯) in the corresponding cells of the table. For OH 138.0 + 7.2, the G-band photometry ( m G ) was also unavailable. S Per has a negative parallax value in Gaia DR3.

2.2. Proper Motions

We compiled proper motions of the sources determined from VLBI and Gaia DR3, and present them in Table 3 as ( μ x VLBI , μ y VLBI ) and ( μ x DR 3 , μ y DR 3 ) in units of mas yr−1, where x and y denote directions along RA and DEC, respectively. As with the parallaxes, the proper motions and their formal errors in Gaia DR3 are listed with too many decimal places; therefore, we rounded the values to 0.01 mas yr−1. Reference papers for the VLBI proper motions are the same as those of the VLBI parallaxes in Table 2.
When we discuss the proper motions determined from the VLBI method, we have to pay attention to the process through which the VLBI proper motions were derived. In VLBI observations, we primarily measure the proper motions of individual maser spots, which consist of the systemic motion of the stellar system and the outward motions of the maser spots with respect to the central star. Therefore, it is necessary to apply certain procedures to estimate the systemic motion of the star. It should be noted that the VLBI proper motions cannot necessarily be regarded as the systemic proper motions of the stellar system.
In some studies, the systemic motions are derived using the proper motions of multiple maser spots; see, e.g., Kusuno et al. [43] for PZ Cas, Nakagawa et al. [22] for T Lep, and Xu et al. [37] for VX Sgr. In other studies, the systemic motions were determined by either adopting the direct proper motion of a single maser spot (see, e.g., Kurayama et al. [40] for UX Cyg) or by using averaged proper motions derived from multiple maser spots (see, e.g., Zhang et al. [39] for NML Cyg). In astrometric studies of the three following sources—WX Psc and OH 138.0 + 7.2 by Orosz et al. [20], and RW Lep by Kamezaki et al. [23]—the systemic proper motions of the sources were not clearly presented, so we listed the proper motions of individual maser spots as reported in these studies. For ten sources—VY CMa, W Hya, RX Boo, FV Boo, S CrB, U Her, RR Aql, UX Cyg, R Aqr, and R Cas—proper motions were derived through averaging, even though the papers do not explicitly refer to “systemic motion”.

3. Results: Astrometric Parameters from VLBI and Gaia DR3

3.1. Parallaxes from VLBI and Gaia DR3

In Figure 1, we present parallaxes of the sources listed in Table 2. The horizontal and vertical axes represent the parallaxes determined from VLBI ( Π VLBI ) and Gaia DR3 ( Π DR 3 ), respectively, at logarithmic scale. The solid line shows the one-to-one relation of Π VLBI = Π DR 3 . The symbols represent different source types in Table 2 as follows: black filled circles denote Mira variables, gray filled circles denote SRb, open circles denote SRc, and filled squares denote OH/IR stars. Figure 1 contains 40 data points corresponding to 39 sources. The figure also shows the source name for each symbol, placed next to the symbol or connected to it by a line.
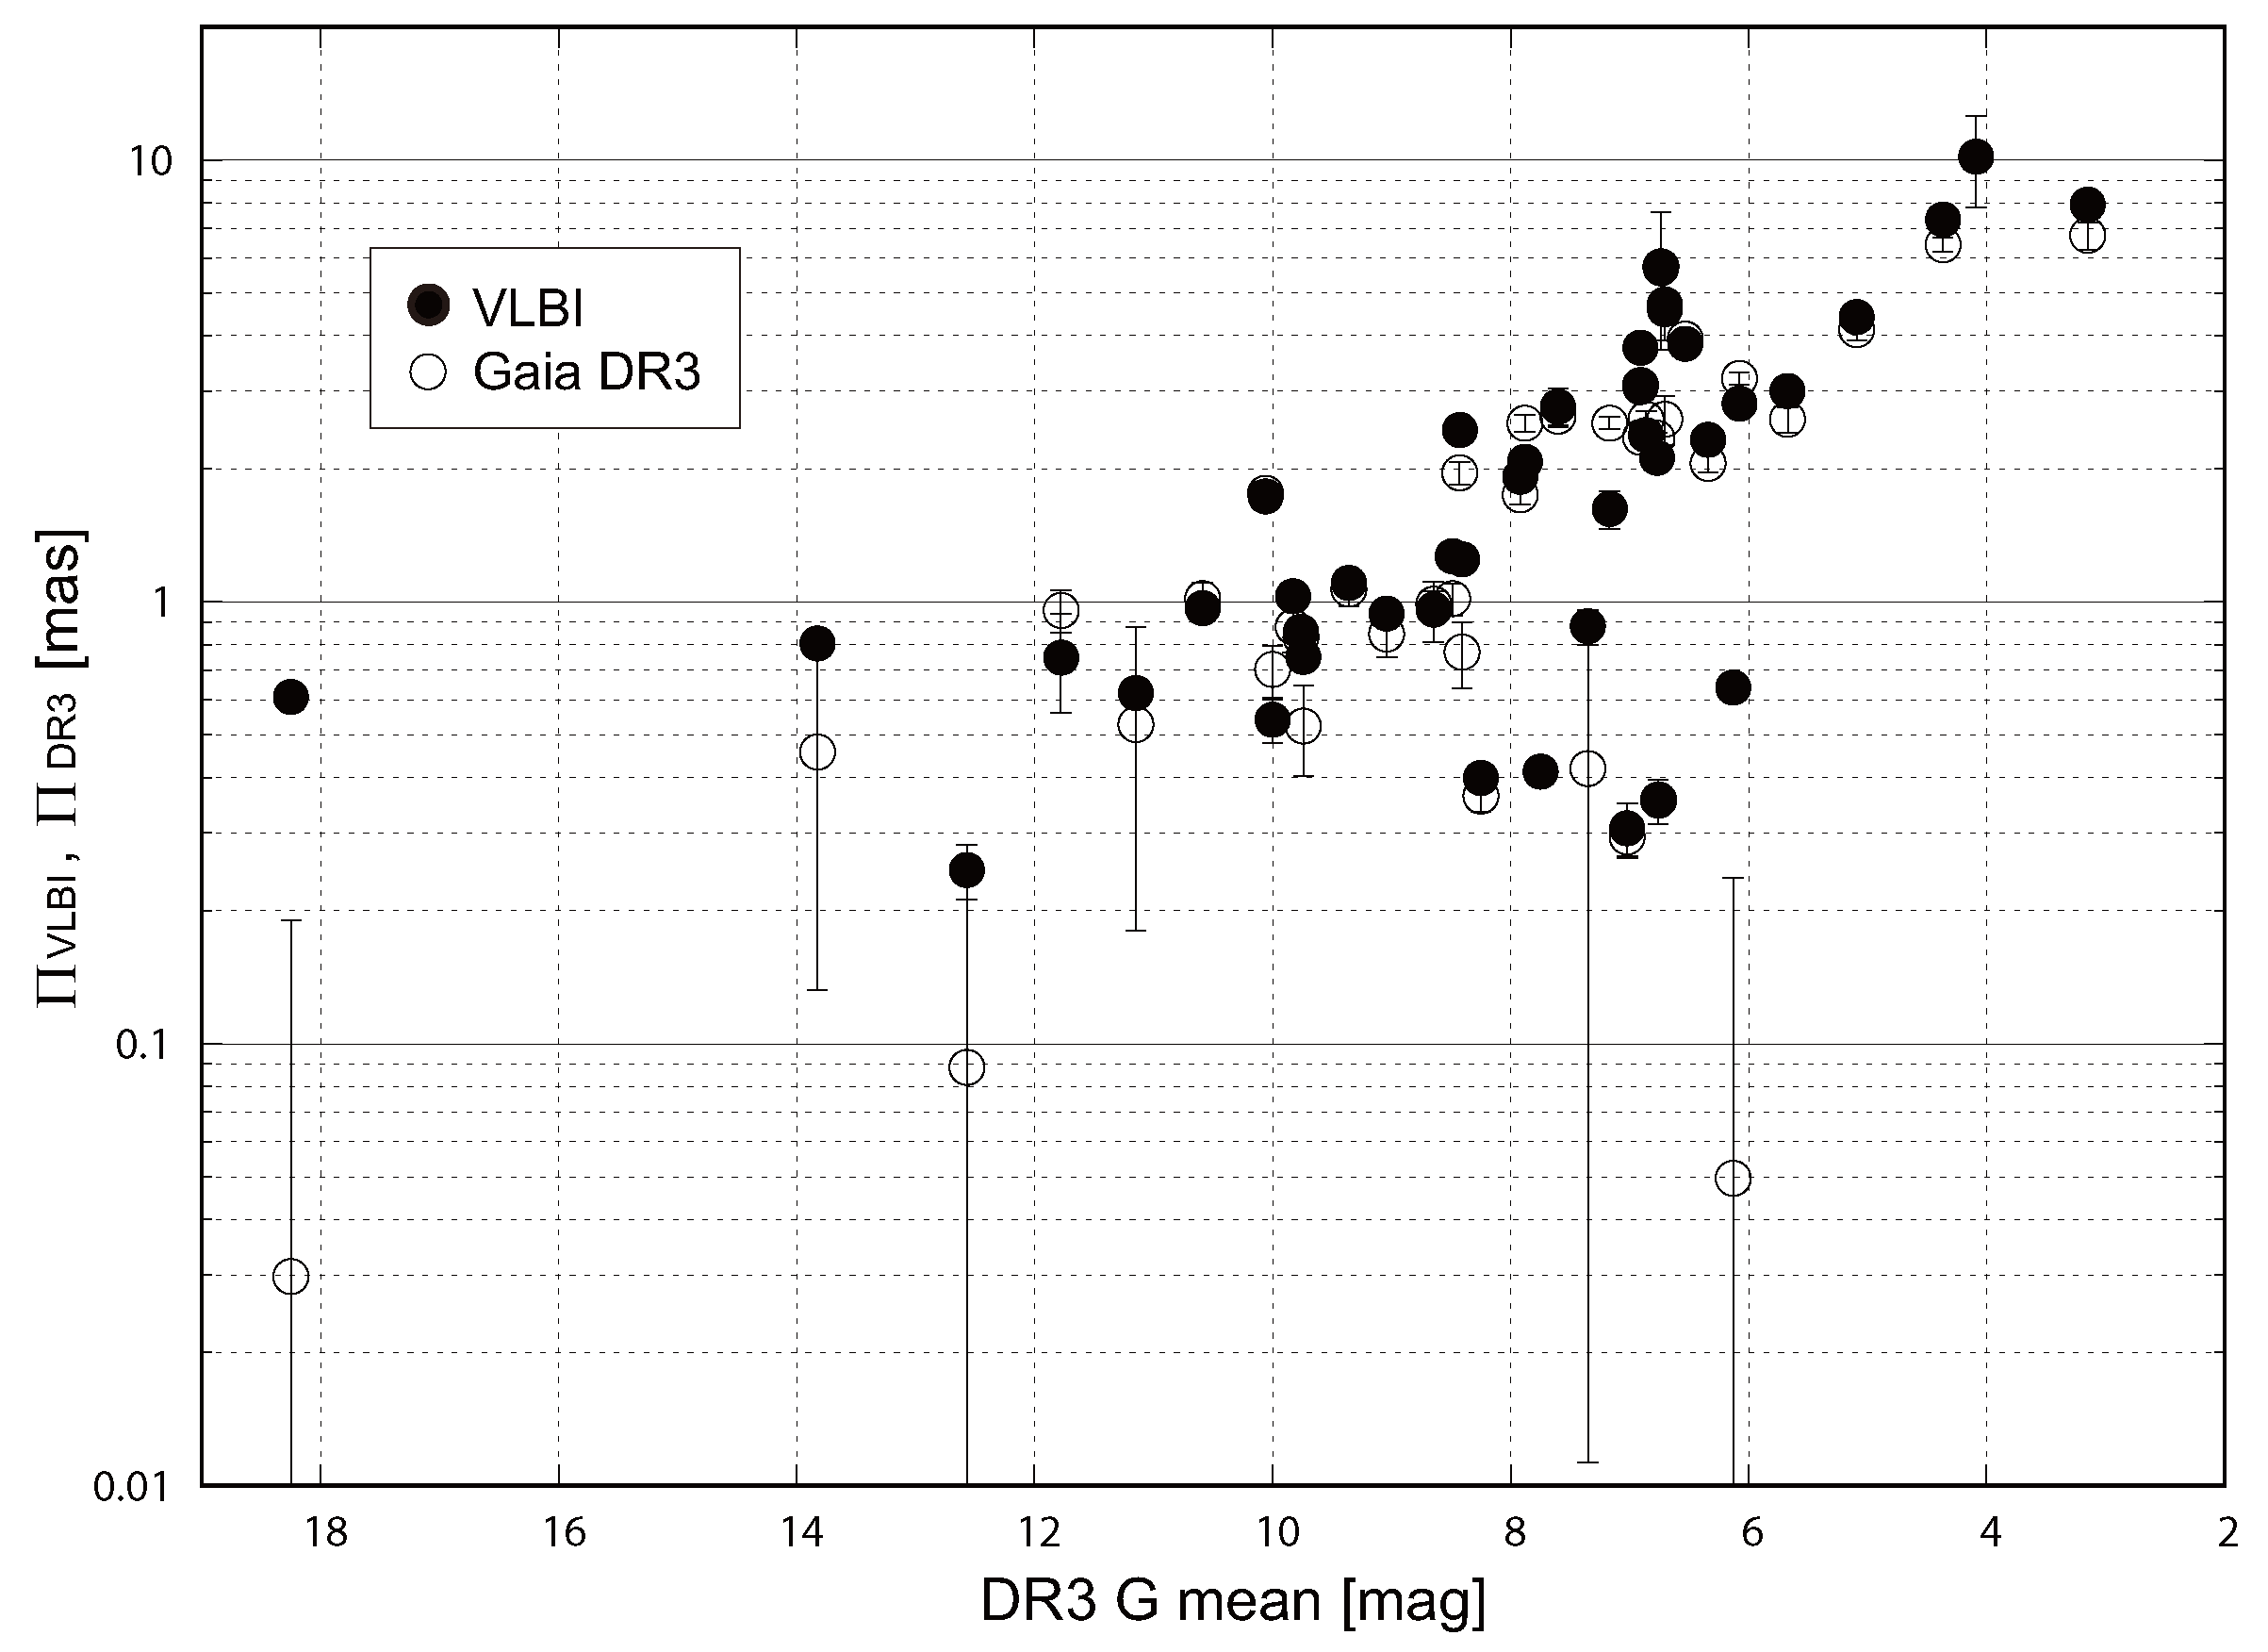
In Figure 2, we presented mean magnitude of Gaia G-band photometry ( m G ) and parallaxes. Filled and open circles indicate results from VLBI and Gaia DR3, respectively. Brighter sources tend to exhibit larger parallaxes, indicating smaller distances.

3.2. Proper Motions from VLBI and Gaia DR3

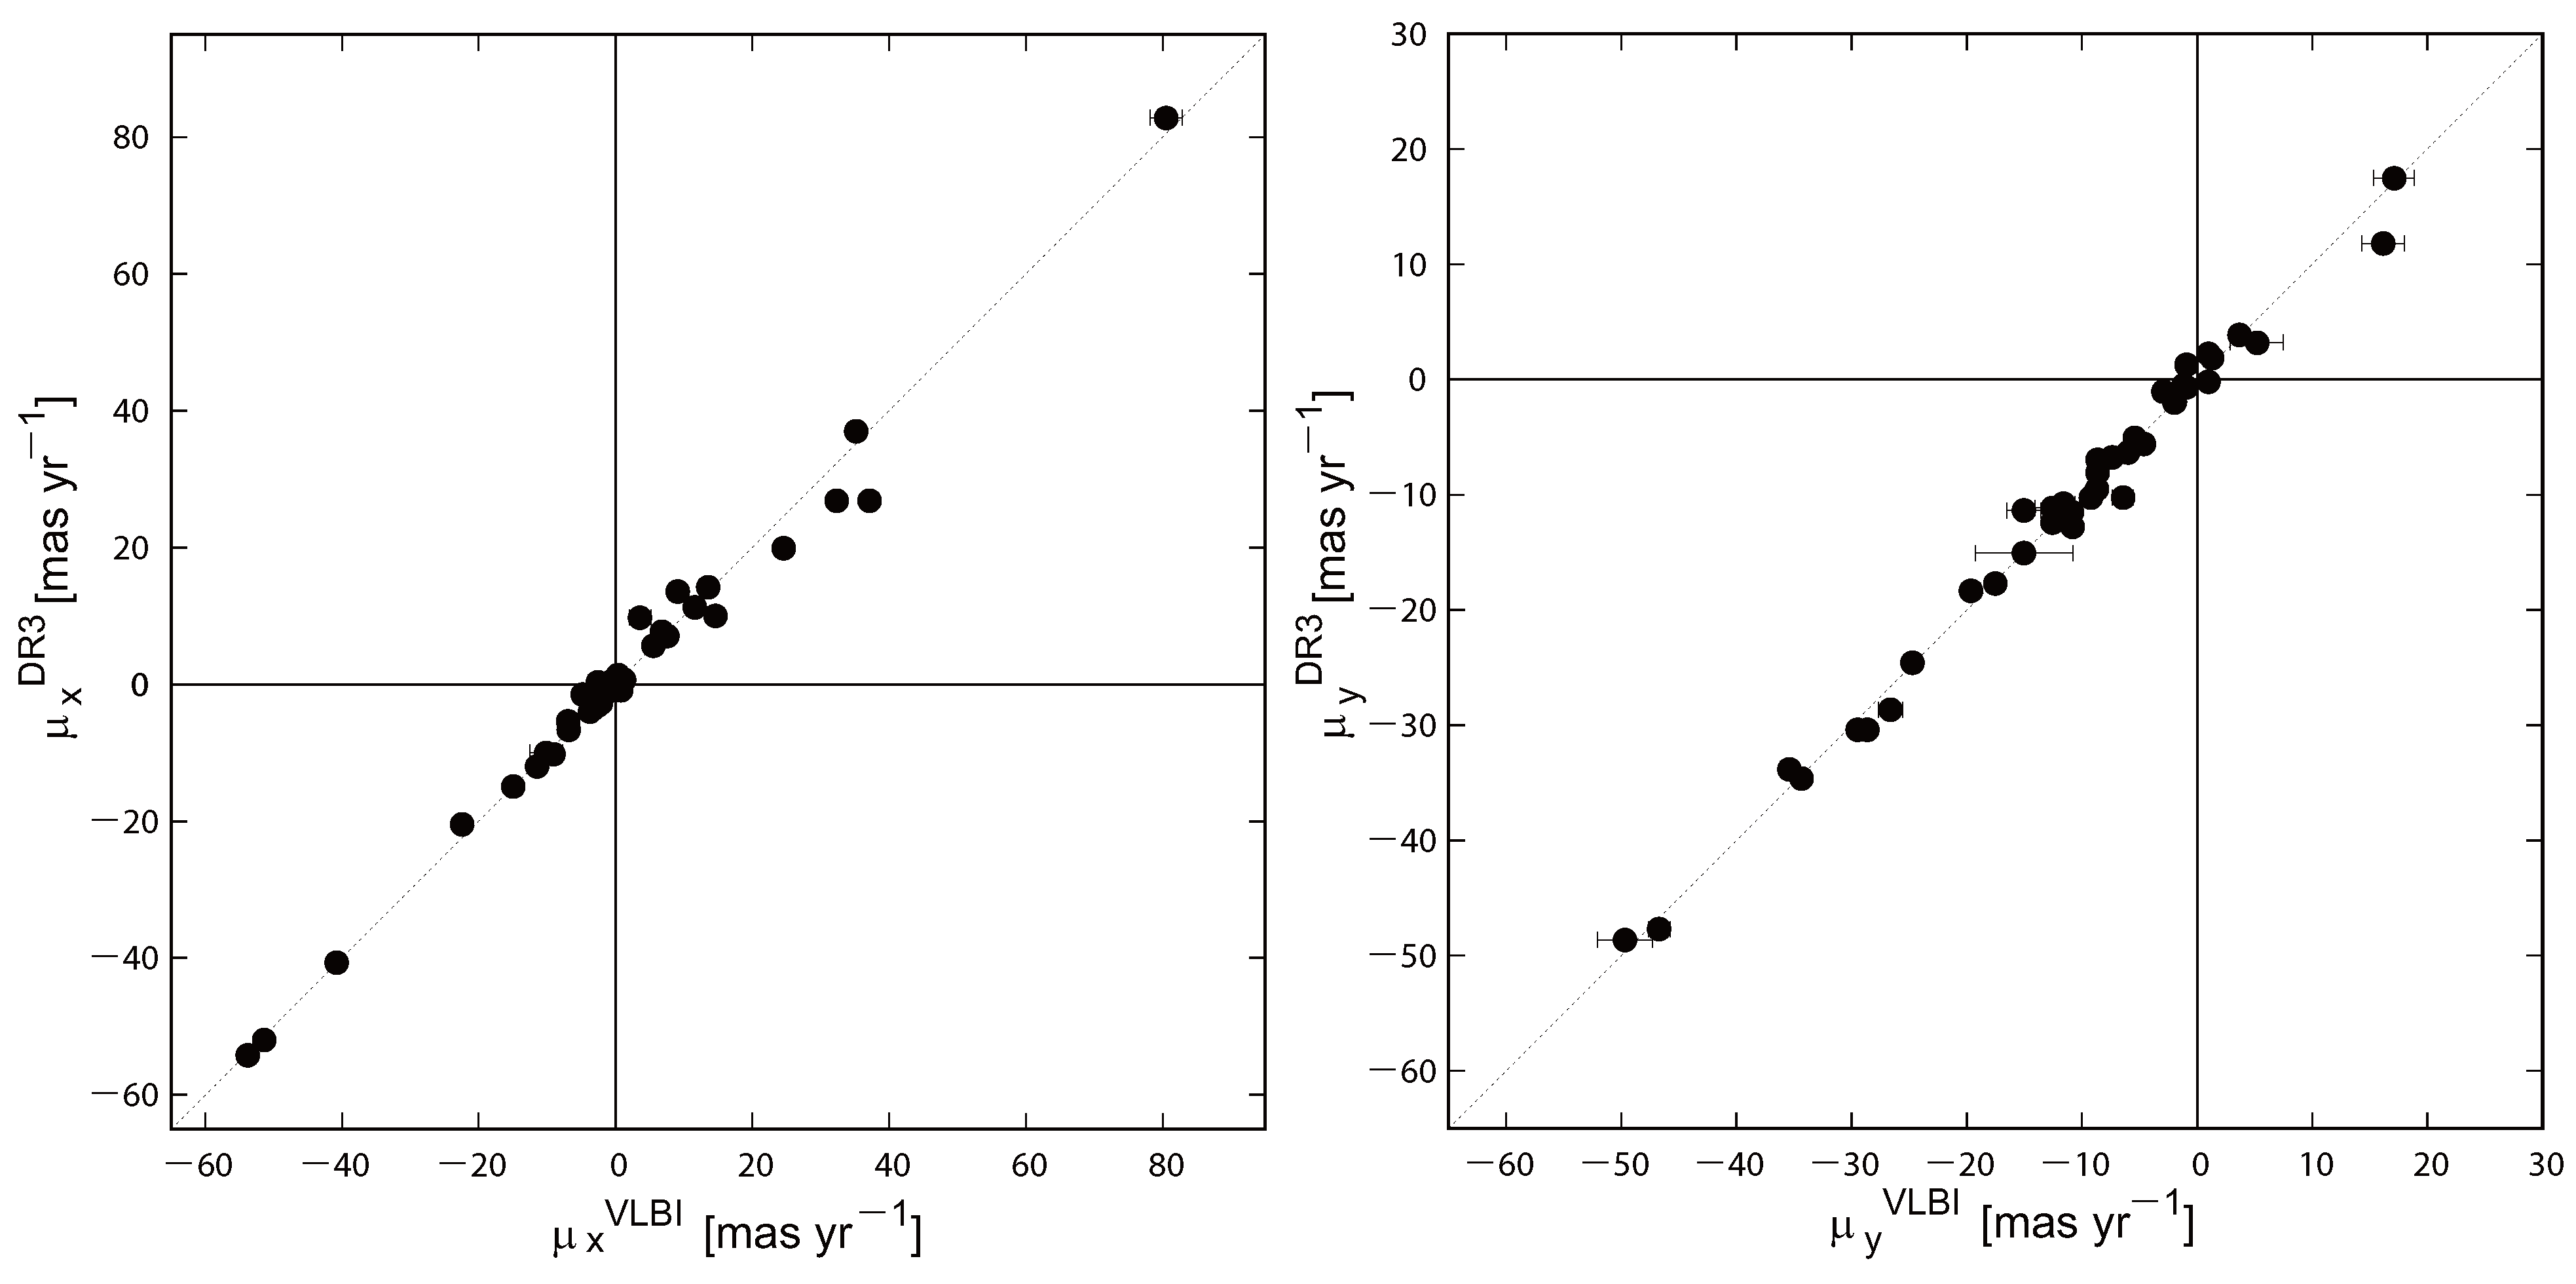
Figure 3 shows the angular proper motions of each source obtained from VLBI (horizontal axis) and Gaia DR3 (vertical axis) in units of mas yr−1. The left panel shows the proper motions along the RA axis, and the right panel shows those along the DEC axis. For many sources, the error bars are so small, on the order of 0.1 mas yr−1, that they lie behind the symbols. Dotted lines in each panel indicate one-to-one relations of μ x VLBI = μ x DR 3 and μ y VLBI = μ y DR 3 . The data from the two methods are distributed close to the one-to-one relation, demonstrating good overall agreement.

4. Discussion: Comparisons of Astrometric Parameters Between VLBI and Gaia DR3

4.1. Consistency of Parallaxes Between VLBI and Gaia DR3

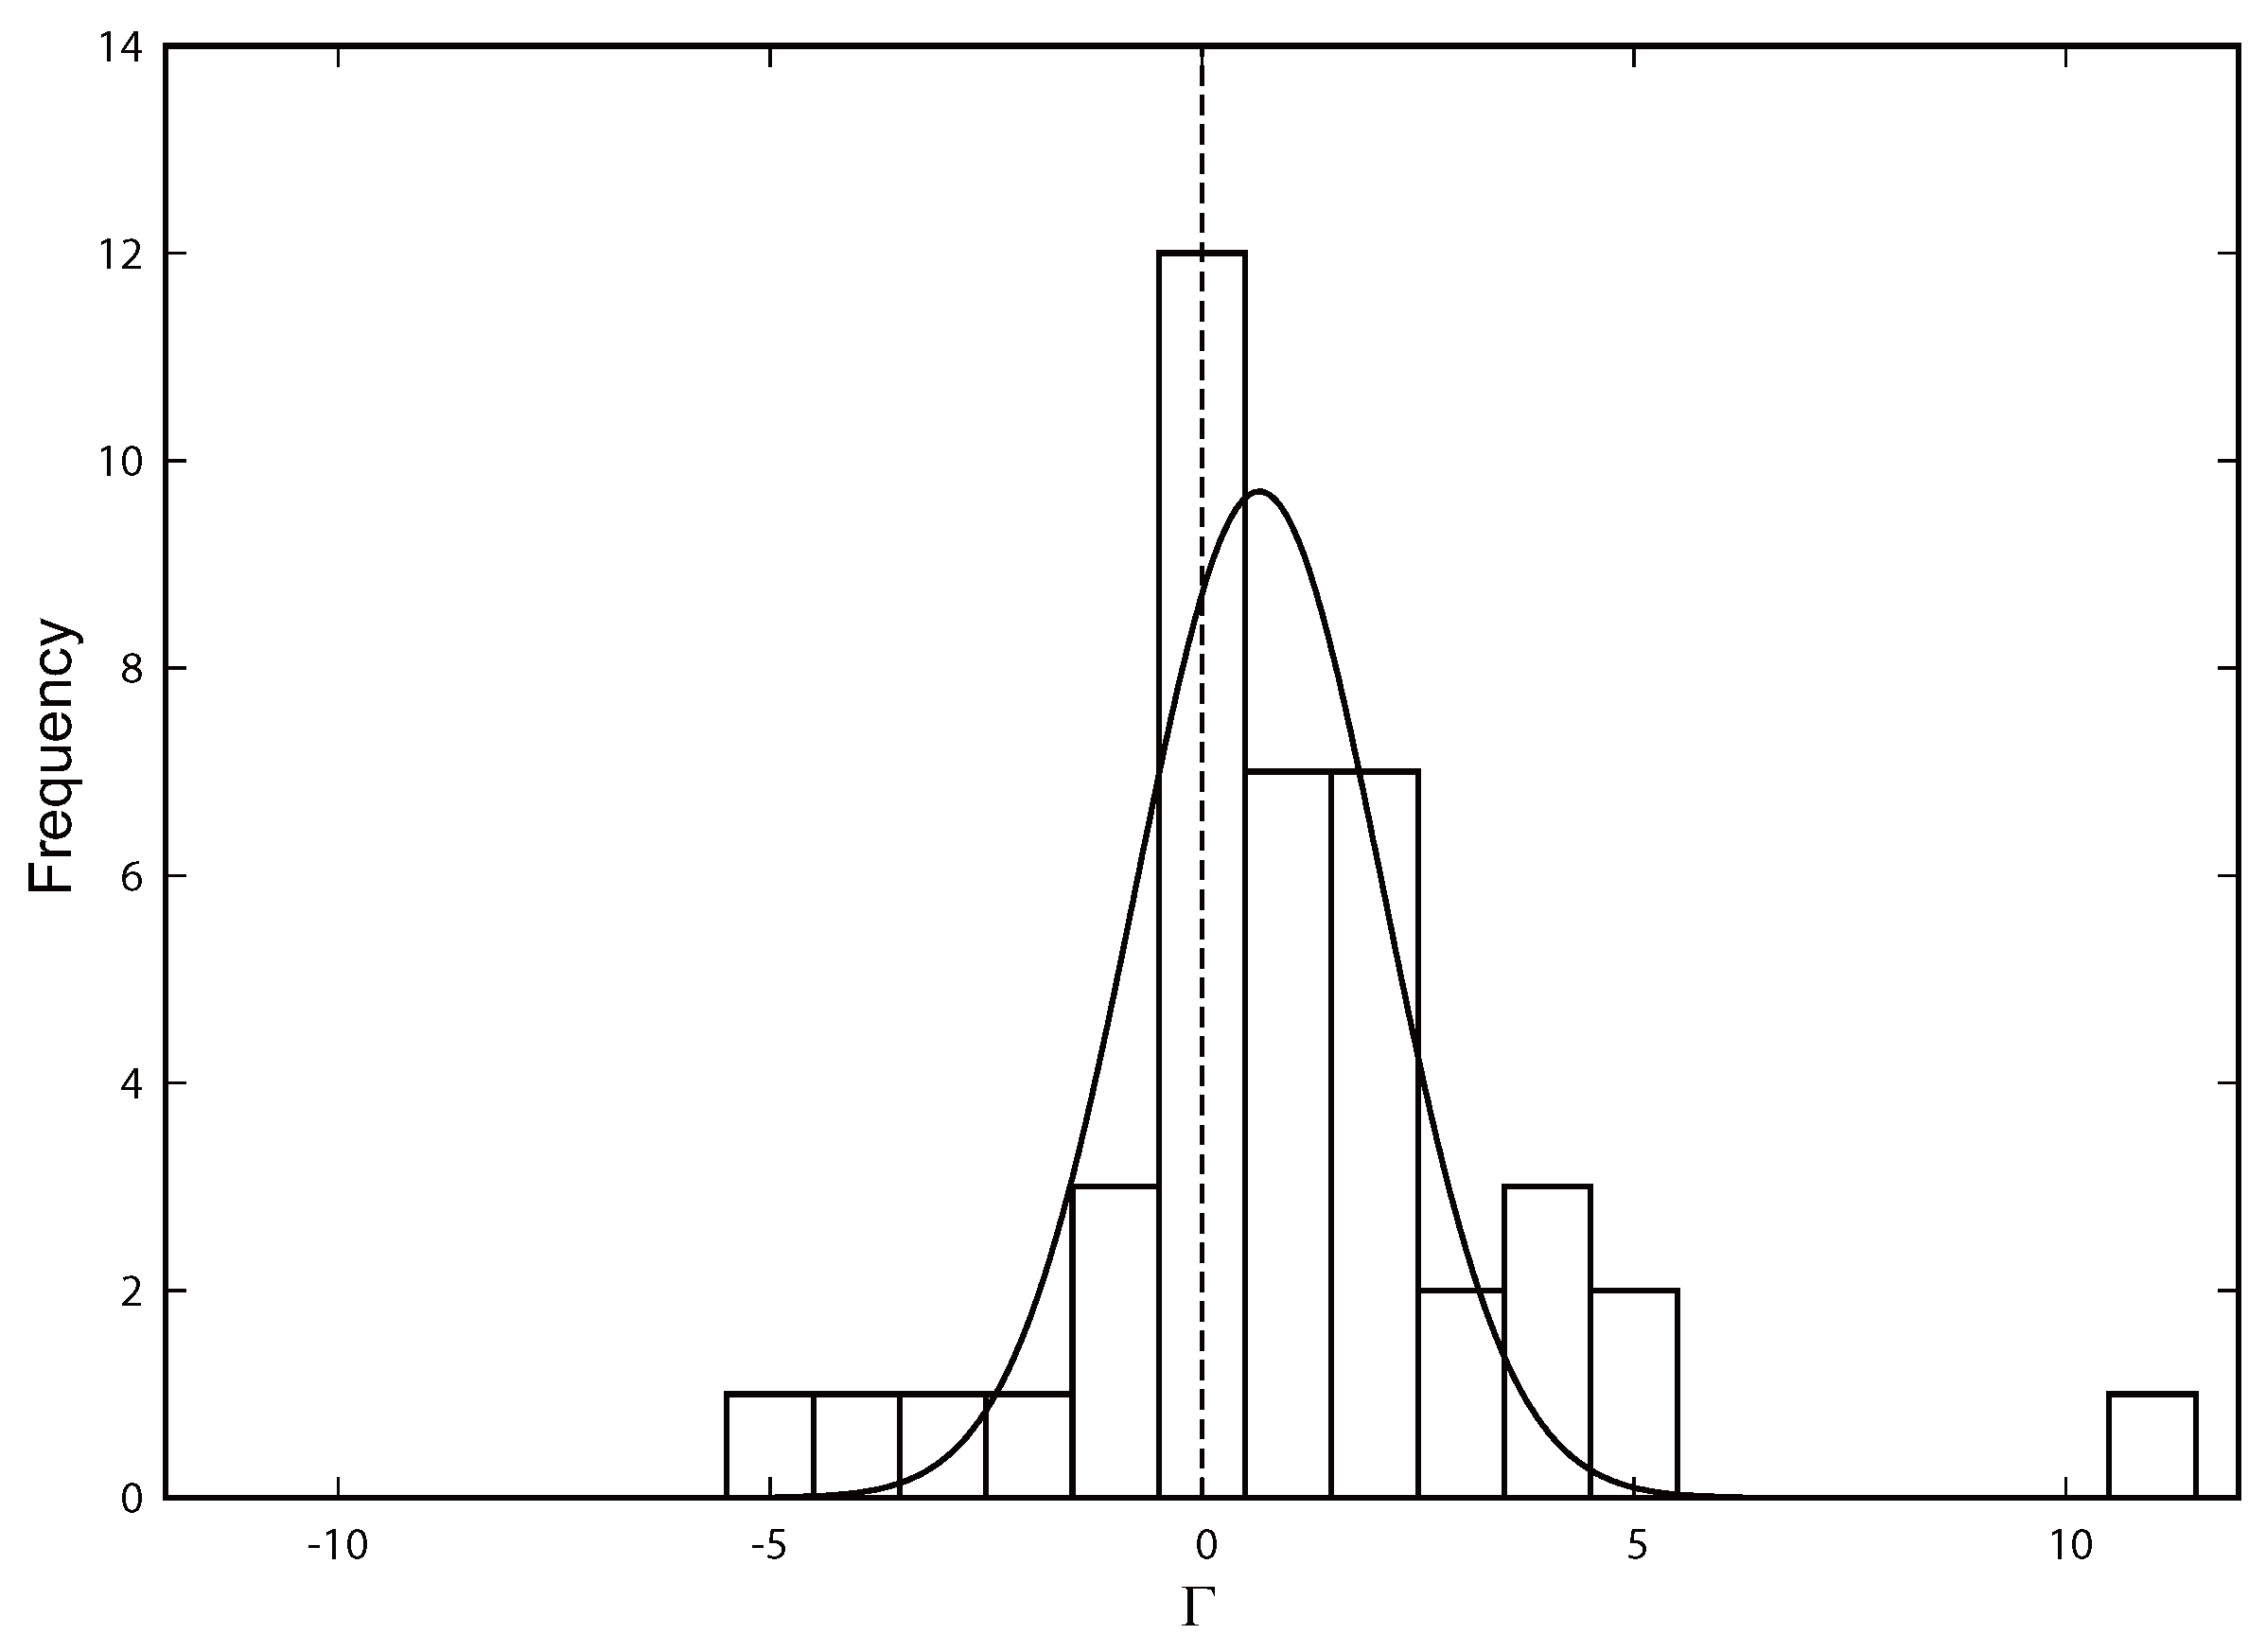
First, we directly compared the parallaxes from VLBI and Gaia DR3. Based on the VLBI and Gaia DR3 parallaxes and their uncertainties given in Table 2, 21 of the 43 sources have parallaxes that are consistent with each other within their respective uncertainties. Figure 1 shows 40 data points (corresponding to 39 sources) distributed around the one-to-one relation Π VLBI = Π DR 3 . It seems that the number of sources located below the Π VLBI = Π DR 3 relation is slightly larger than the number located above it. To evaluate the consistency of the parallaxes between VLBI and Gaia DR3, we introduce a parameter Γ , which is related to the residual between the two parallaxes from VLBI and Gaia DR3, as follows:
Γ = Π VLBI Π DR 3 σ Π VLBI 2 + σ Π DR 3 2 ,
where σ Π VLBI and σ Π DR 3 represent errors of Π VLBI and Π DR 3 , respectively (see Table 2).
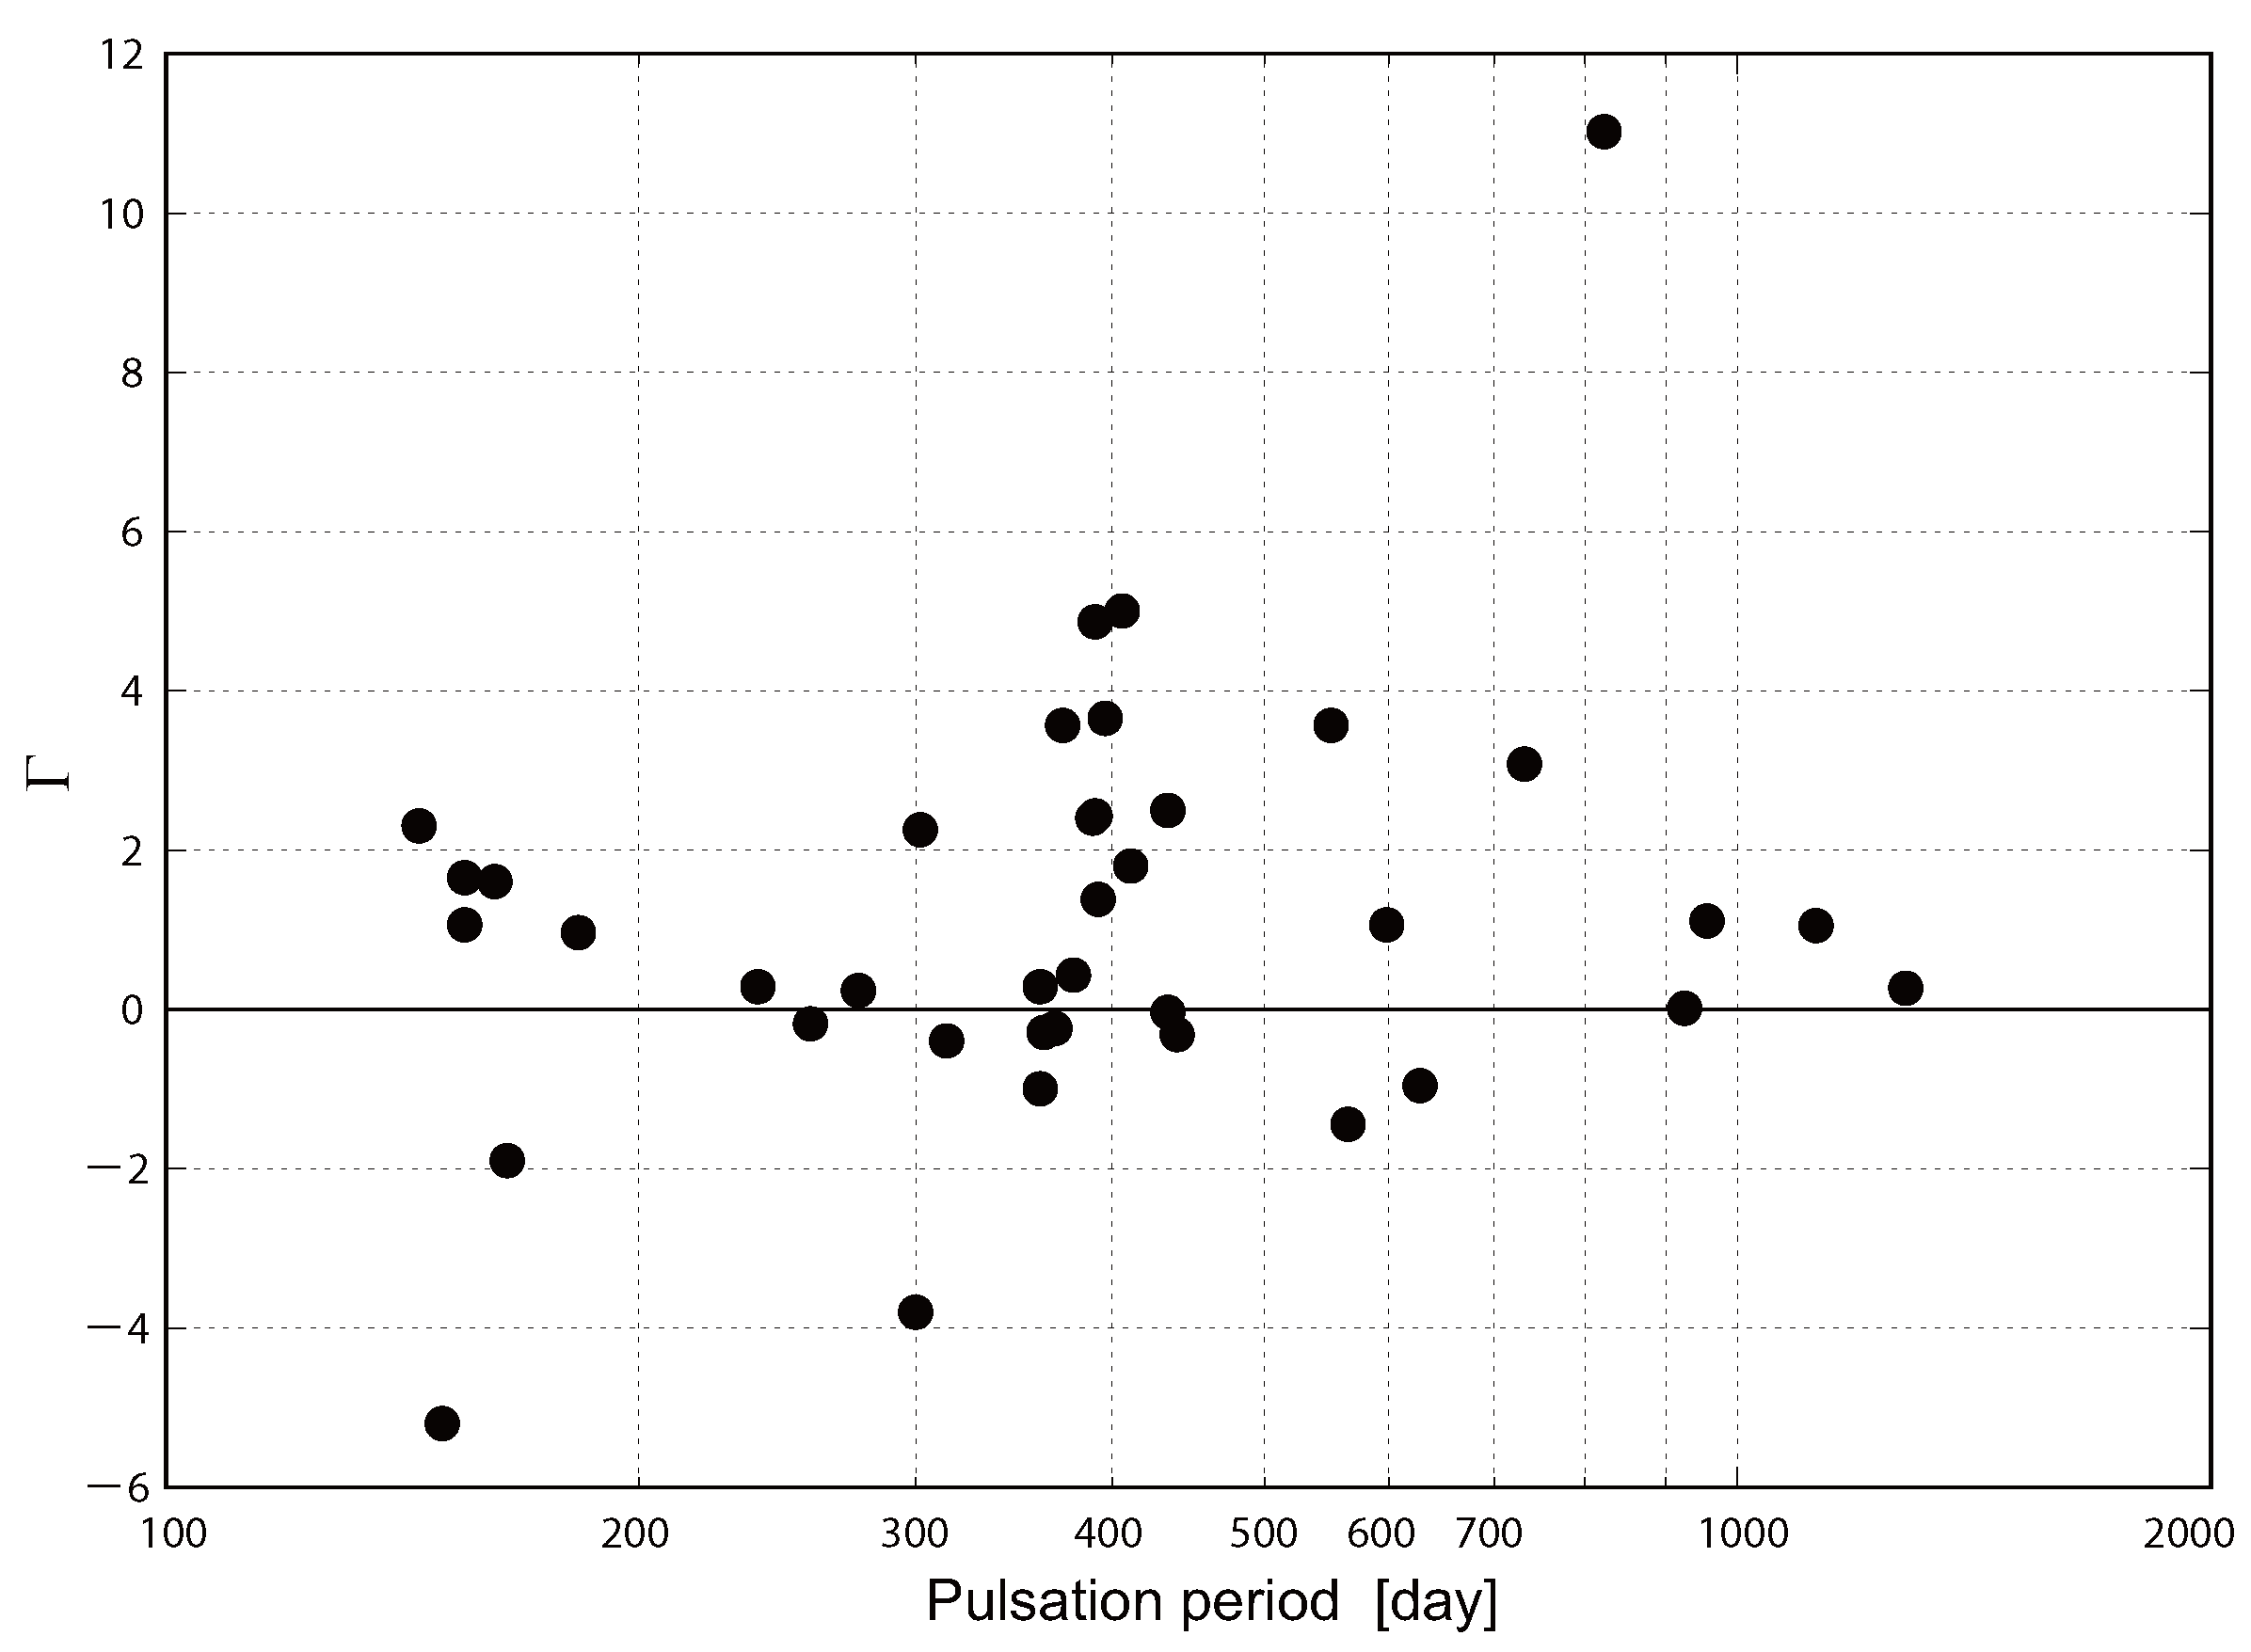
In Figure 4, we represent the number distribution of Γ for 41 data points using histograms. This histogram includes S Per, which has a negative parallax ( 0.50 mas) in Gaia DR3, resulting in one more data point than Figure 1. We fitted the number distribution with a Gaussian function using a least-squares method to determine the peak position and full width at half maximum (FWHM). The solid curve in Figure 4 represents the fitted Gaussian model, from which we obtained a peak position of Γ = + 0.66 ± 0.16 and FWHM = 3.37 . Because of its large deviation from the main group around Γ = 0 , we did not include S Per, which corresponds to the bin at Γ = + 11 , in the fitting analysis. We also calculated the mean and its standard error directly from the individual Γ values, excluding S Per, and obtained Γ = + 0.78 ± 0.33 . This result indicates that VLBI parallaxes tend to be larger than Gaia DR3 parallaxes on average, although the offset is only marginally inconsistent with zero. This finding is directionally consistent with the systematic parallax offset of 38 ± 11 μ as reported by Bobylev [10], who compared VLBI and Gaia DR3 parallaxes for 102 stars. We note that various correction models have been proposed for the Gaia parallax zero-point (e.g., Lindegren et al. [13]), and recent studies have shown that the Gaia astrometric accuracy for AGB stars may be affected by their large angular sizes and time-varying surface brightness distributions (e.g., Chiavassa et al. [9]). These effects should be taken into account when interpreting the systematic offset observed in the Γ distribution.
The width of the fitted Gaussian distribution provides additional insight into the consistency of the two measurement techniques. For perfectly consistent measurements with correctly estimated uncertainties, the Γ distribution would follow a standard normal distribution with FWHM = 2.35 (corresponding to σ = 1 ). The observed FWHM of 3.37 corresponds to σ 1.43 , indicating that the distribution is approximately 40% broader than expected from the formal uncertainties alone. This excess width likely reflects a combination of factors. First, there are physical offsets between the maser emission regions traced by VLBI and the optical photocenters measured by Gaia. Second, source-dependent effects such as photocenter variability may also contribute.
Binarity is now well recognised as a significant factor in the astrometry of evolved stars. Binary companions can shape the circumstellar environment where maser emission originates, and orbital reflex motion can introduce astrometric perturbations for both optical and radio measurements. Among the sources in our sample, three are known binary systems. R Aqr is a symbiotic binary consisting of a Mira variable and a white dwarf companion [47], surrounded by a complex circumstellar environment including jets and extended nebulosity. Two independent VLBI studies using SiO masers yielded parallaxes of 4.7 ± 0.8 mas [18] and 4.59 ± 0.24 mas [17], both significantly larger than the Gaia DR3 value of 2.59 ± 0.33 mas. R Hya also has a known companion at a projected separation of approximately 3500 au [48], and ALMA observations of its inner wind reveal a differentially rotating equatorial density enhancement that strongly suggests the presence of a second, much closer companion [49]. Finally, OH 231.8 + 4.2 is a proto-planetary nebula around the Mira variable QX Pup, which also harbours a main-sequence companion of spectral type A whose gravitational influence has possibly shaped the bipolar outflow of the nebula [50]. The astrometric impact of binarity on evolved stars has been demonstrated by Kervella et al. [51], who used Hipparcos–Gaia proper motion anomalies to identify the signatures of binary companions, and more recently by Montarges et al. [52] and Esseldeurs et al. [53], who characterised and detected the Keplerian orbital motion of a close companion to the AGB star π 1 Gru using ALMA and Hipparcos–Gaia astrometry. Because orbital motion disturbs parallax measurements on a fractional basis, with closer systems showing proportionally larger effects, binarity may contribute to the scatter observed in the Γ distribution and in the proper motion residuals discussed in Section 4.4. A systematic investigation of binarity effects across our full sample is beyond the scope of this study, but worth bearing in mind for future VLBI–Gaia comparisons.
Our results are broadly consistent with those of Andriantsaralaza et al. [11], who compared VLBI and Gaia DR3 parallaxes for a smaller sample of 33 maser-emitting AGB stars that largely overlaps with the present sample. They found that the Gaia DR3 parallax uncertainties are significantly underestimated, requiring error inflation factors of approximately 5.4 for bright sources (G < 8 mag) and 2.7 for sources with 8 < G < 12 mag, and reported a parallax zero-point offset of 0.077 mas for bright AGB stars. Their finding that the Gaia parallaxes are systematically smaller than the VLBI values is consistent with the positive mean Γ found in our analysis. The broader-than-expected Γ distribution obtained here is also consistent with their error inflation factors, which indicate that the nominal Gaia DR3 uncertainties underestimate the true scatter.

4.2. Behavior of Parallax Errors

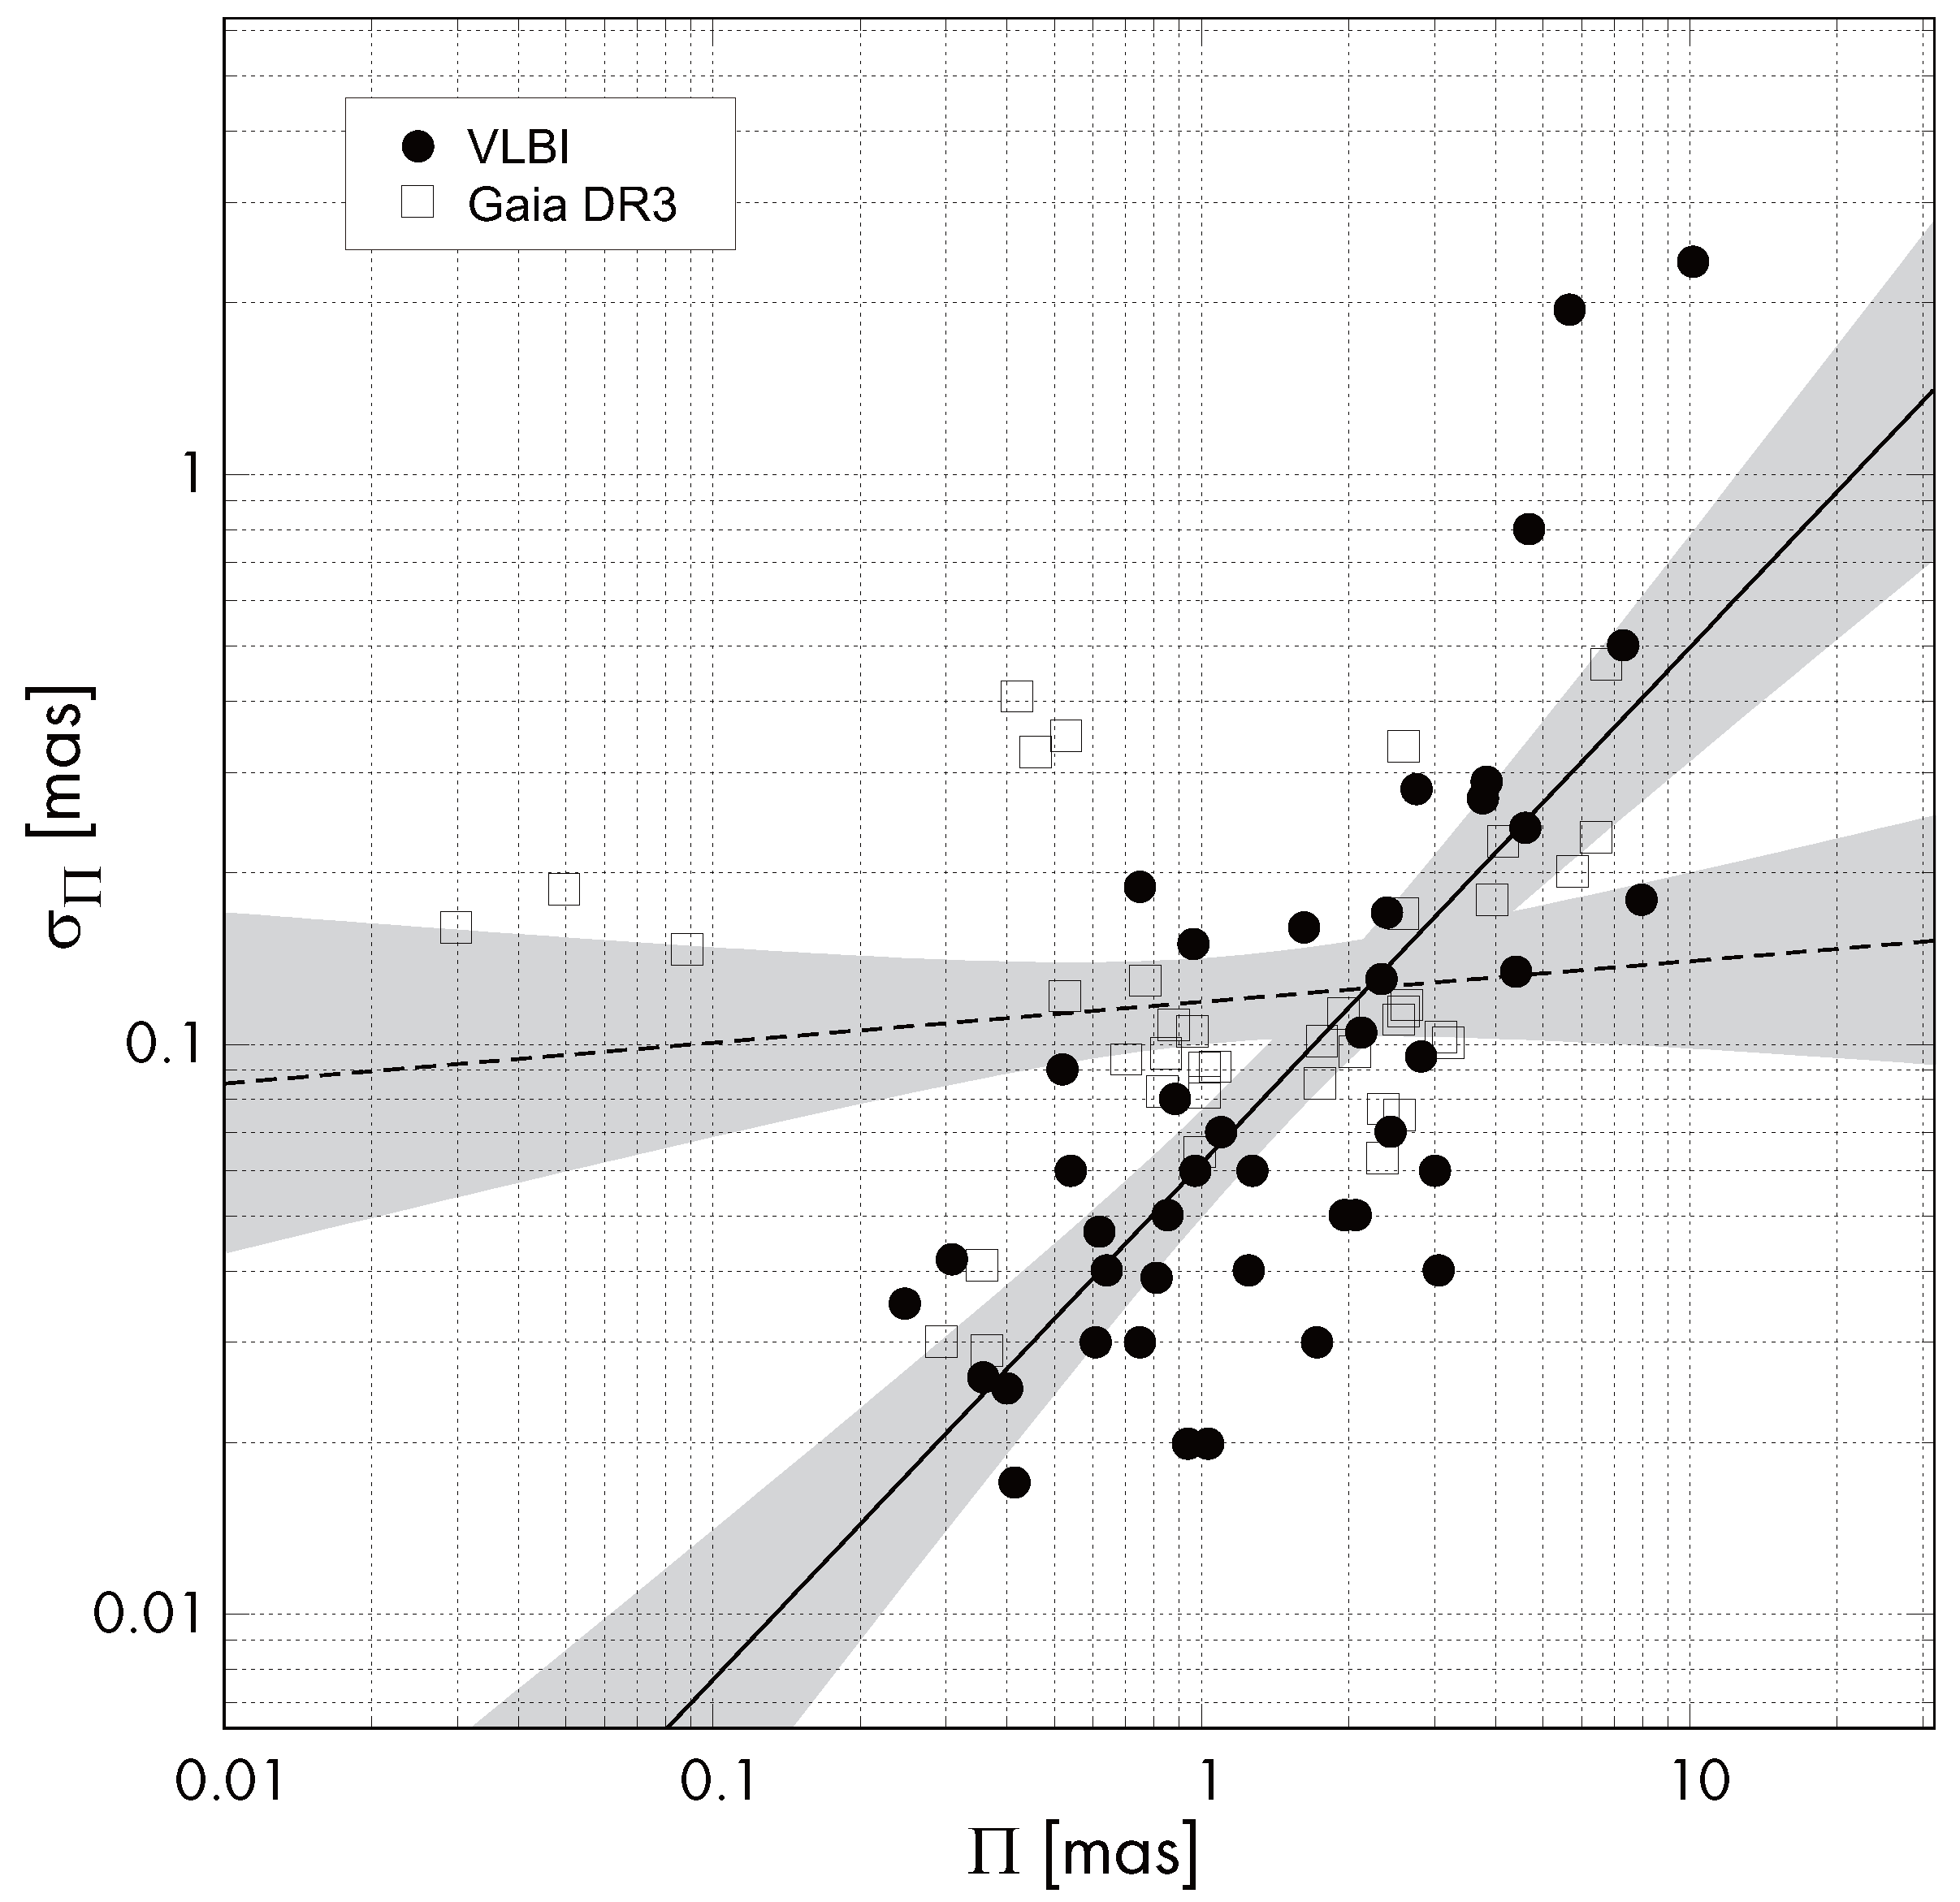
In Figure 5, we present parallaxes and their errors from VLBI (filled circles) and Gaia DR3 (open squares) in units of mas. The parallax errors of VLBI increase with increasing parallax, with the largest and smallest errors being 2.36 mas (W Hya) and 0.017 mas (S Per). We fitted linear models to both distributions using least-squares analysis, shown as a solid line (VLBI) and a dotted line (Gaia DR3) in Figure 5, with 95 % confidence intervals indicated by the shaded regions. The VLBI data exhibit an approximately linear correlation with a correlation coefficient of 0.746. Unlike VLBI, the parallax errors in Gaia DR3 do not increase significantly with parallax (correlation coefficient 0.139), indicating that the uncertainties remain nearly constant regardless of the parallax value. The two linear models intersect at approximately 2 mas. Based on this, VLBI measurements appear to be more effective than those of Gaia DR3 for AGB stars with parallaxes smaller than 2 mas, corresponding to distances greater than 500 pc.
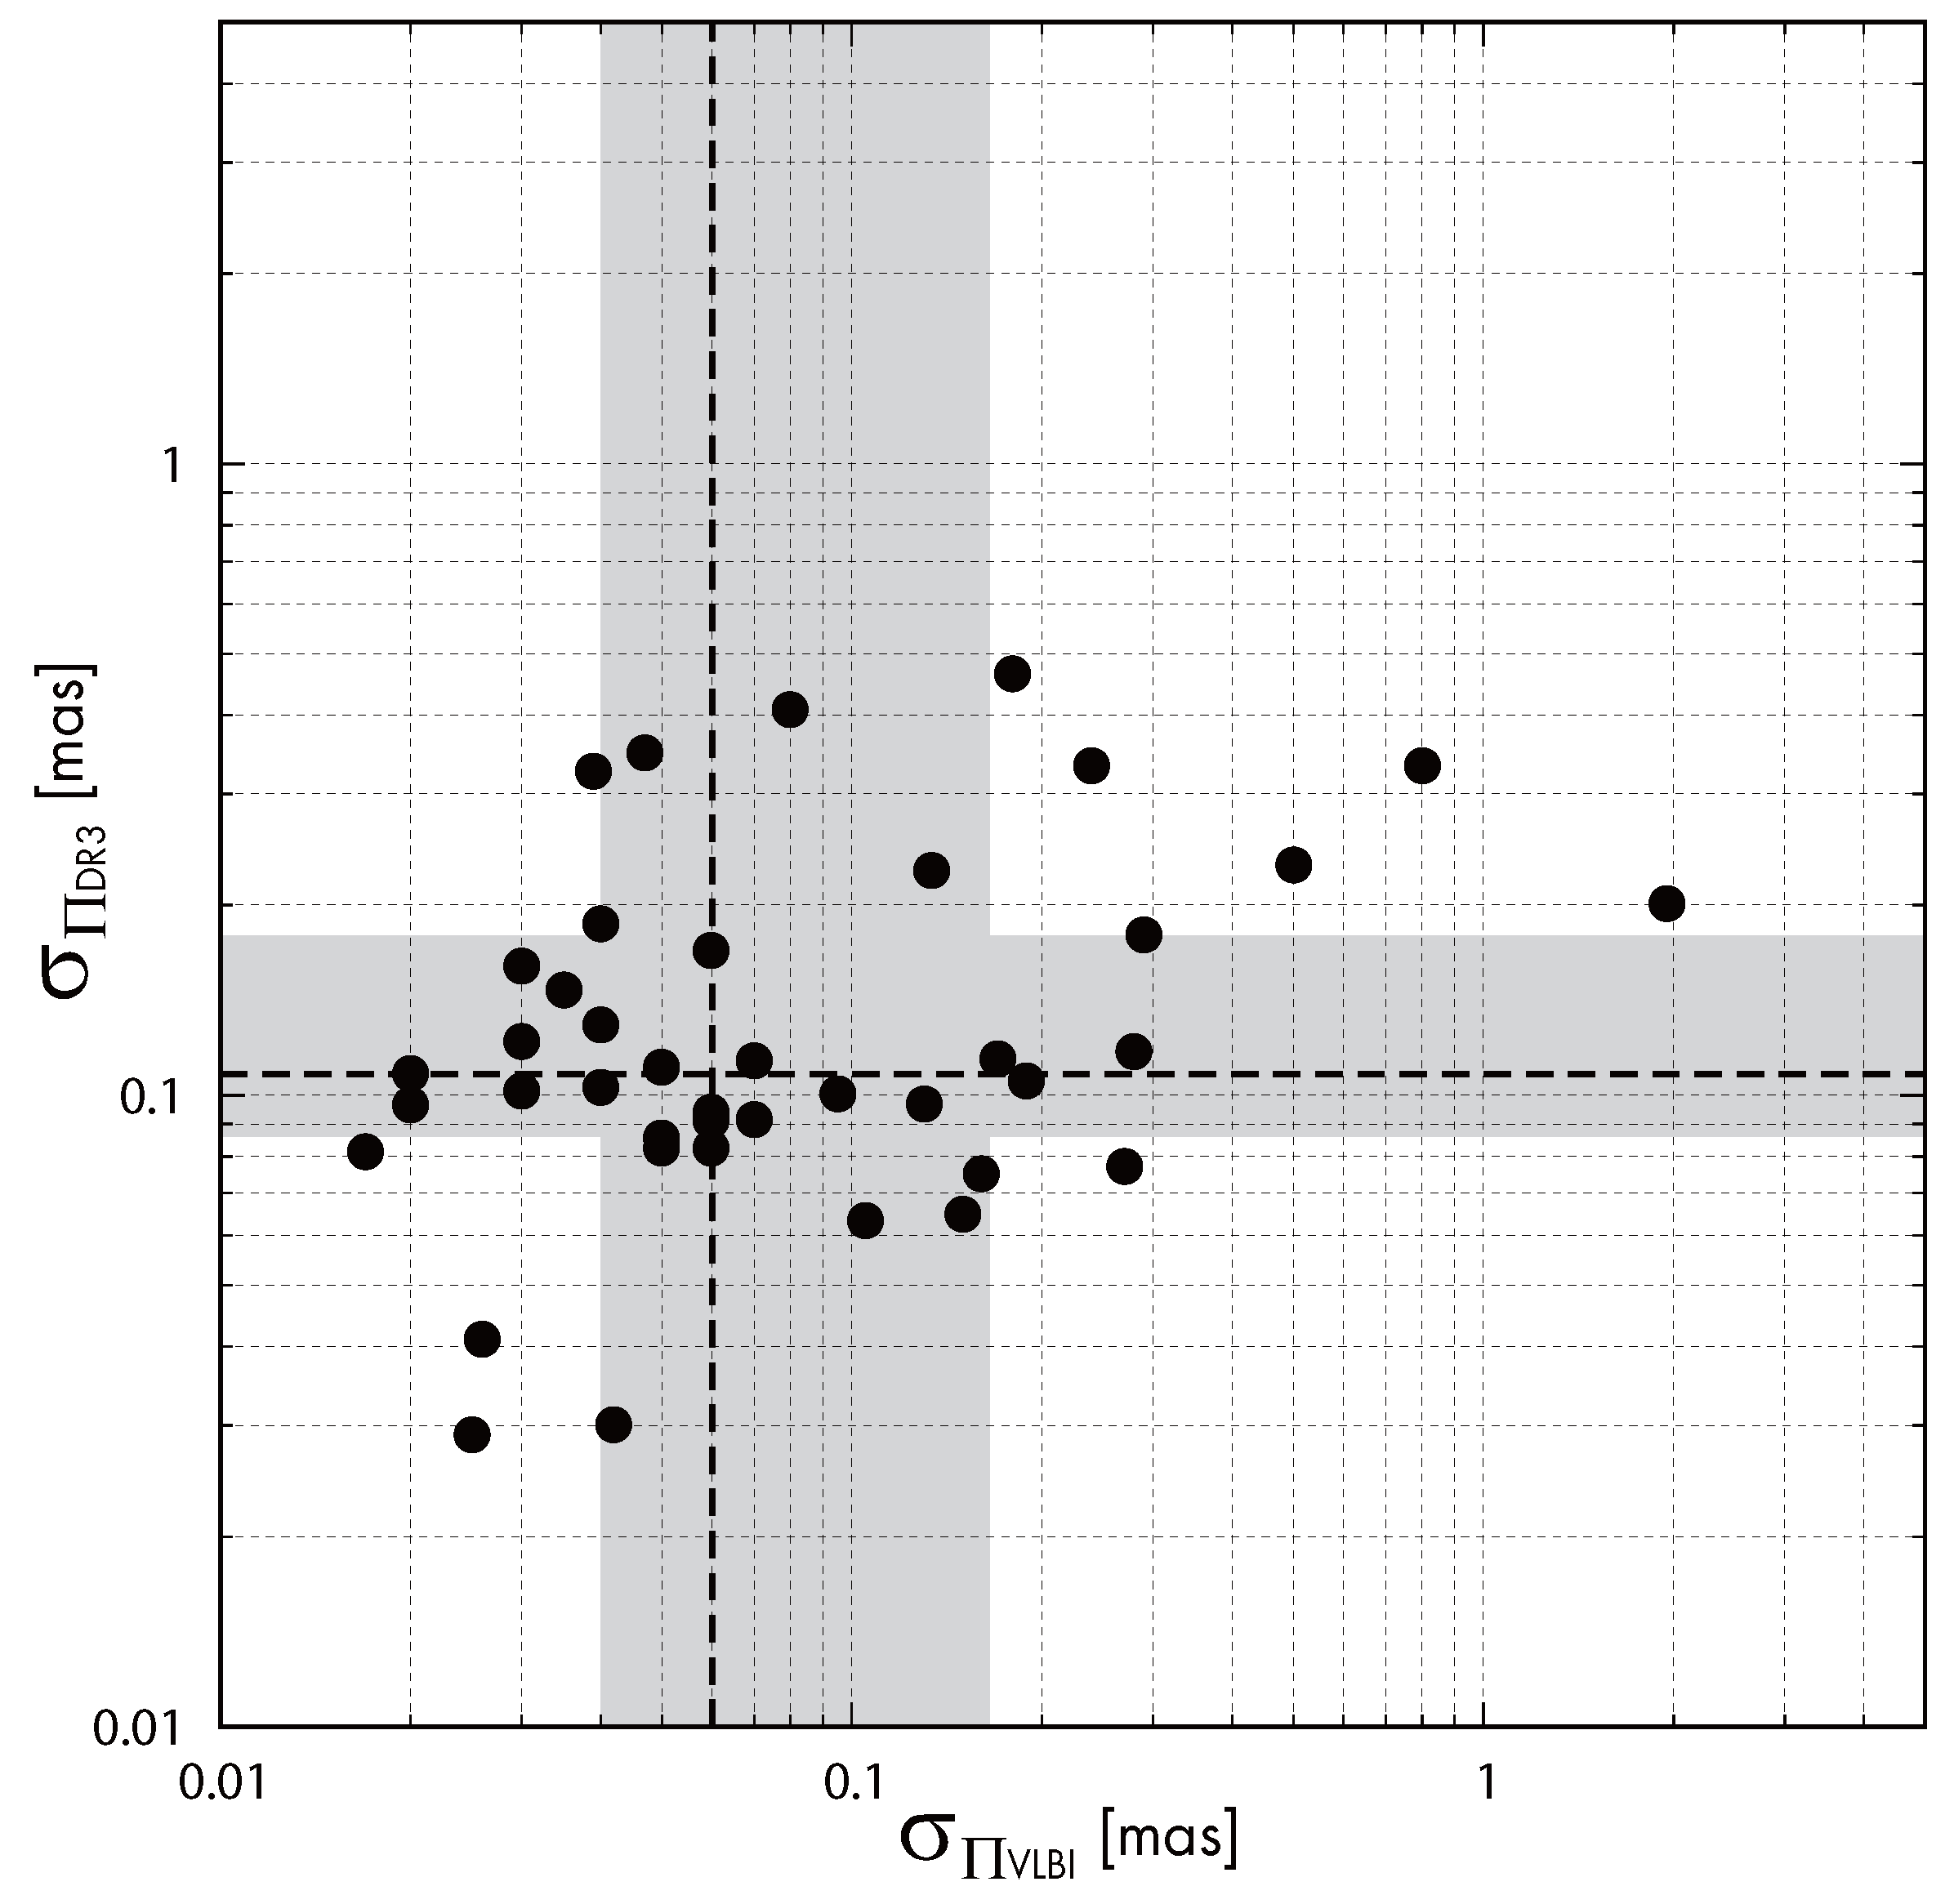
In Figure 6, we compare the parallax errors directly, with VLBI errors on the horizontal axis and Gaia DR3 errors on the vertical axis. VLBI errors span a wide range, from 0.017 mas (S Per) to 2.36 mas (W Hya), while Gaia DR3 errors fall within a narrower range, from 0.029 mas (IRAS 22480 + 6002) to 0.464 mas (R Hya). The dotted lines indicate the second (Q2) quartile in both cases: 0.06 for VLBI and 0.108 for Gaia DR3.
The interquartile ranges, shown in gray, also indicate that the Gaia DR3 errors lie within a narrower interval than those of VLBI.

4.3. Parallax and Stellar Properties

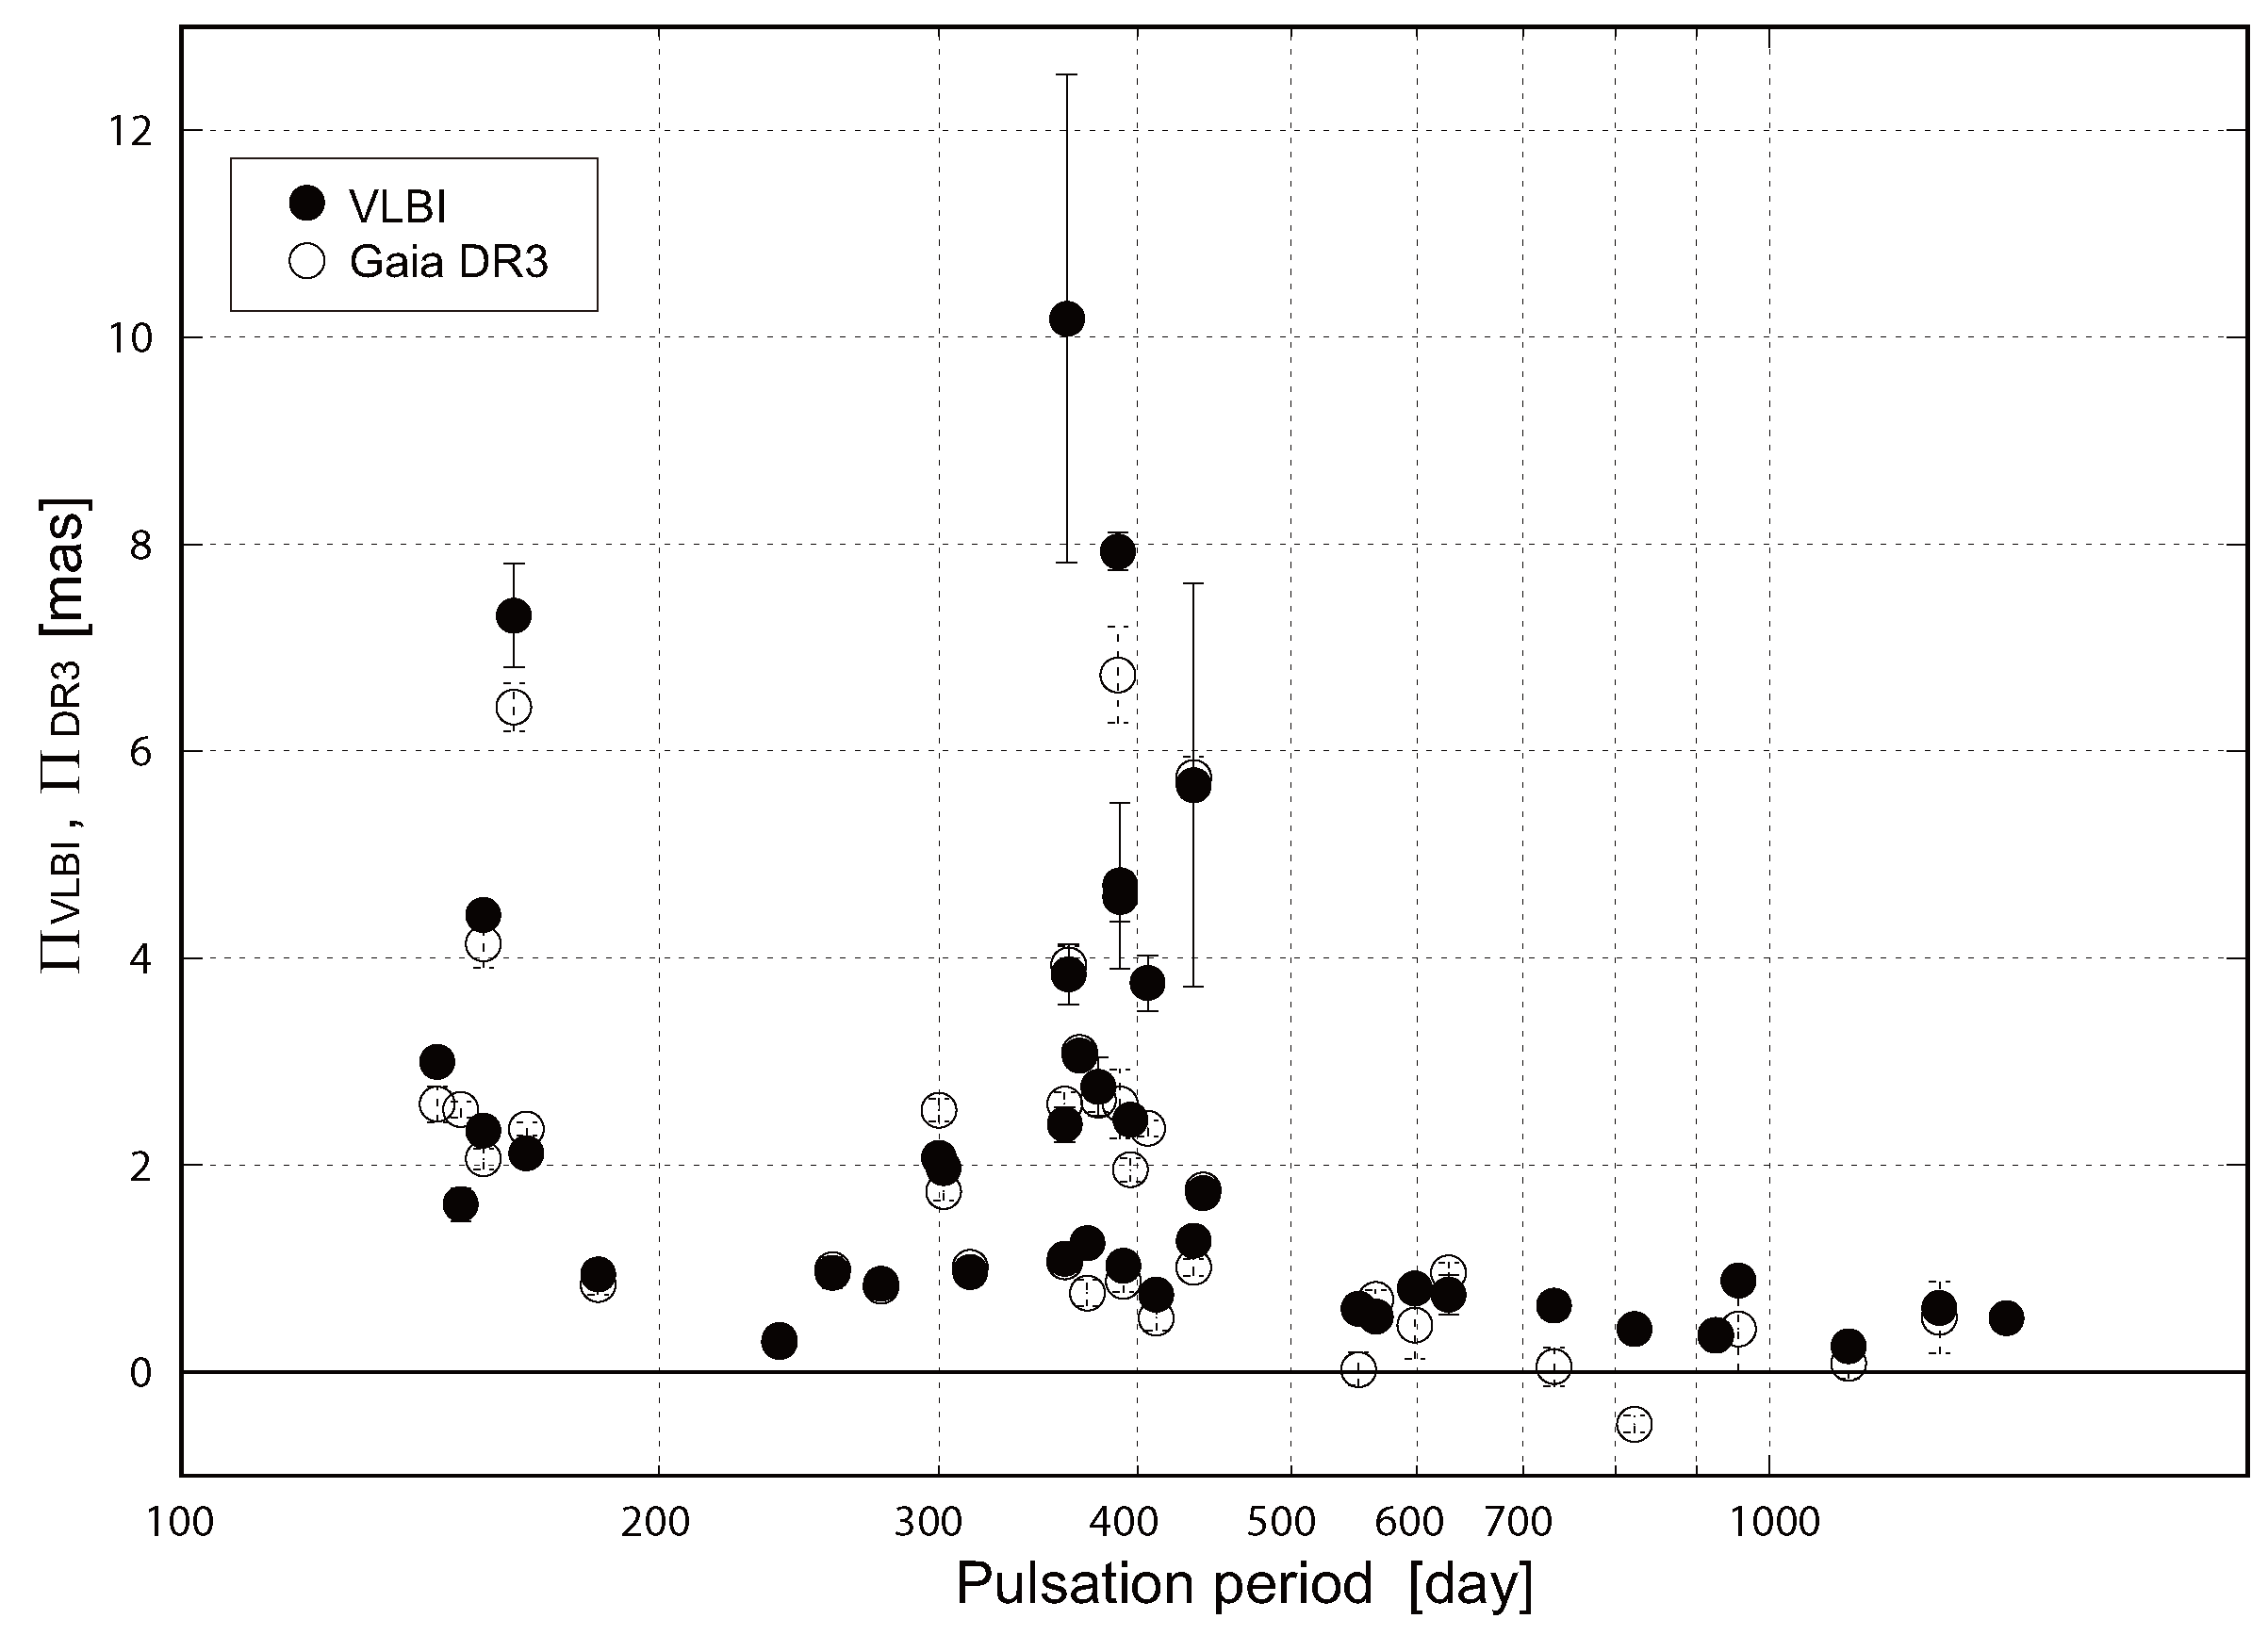
Figure 7 shows the relation between pulsation periods and parallaxes obtained from VLBI ( Π VLBI ) and Gaia DR3 ( Π DR 3 ). In regions with longer pulsation periods (approximately, ≳500 days), smaller parallaxes are observed. However, this trend is not considered to originate from the stellar physics of LPVs. Instead, it can be attributed to a selection effect. LPVs with longer periods tend to have larger stellar sizes and higher luminosities, and thus can be detected at greater distances, resulting in smaller observed parallaxes.
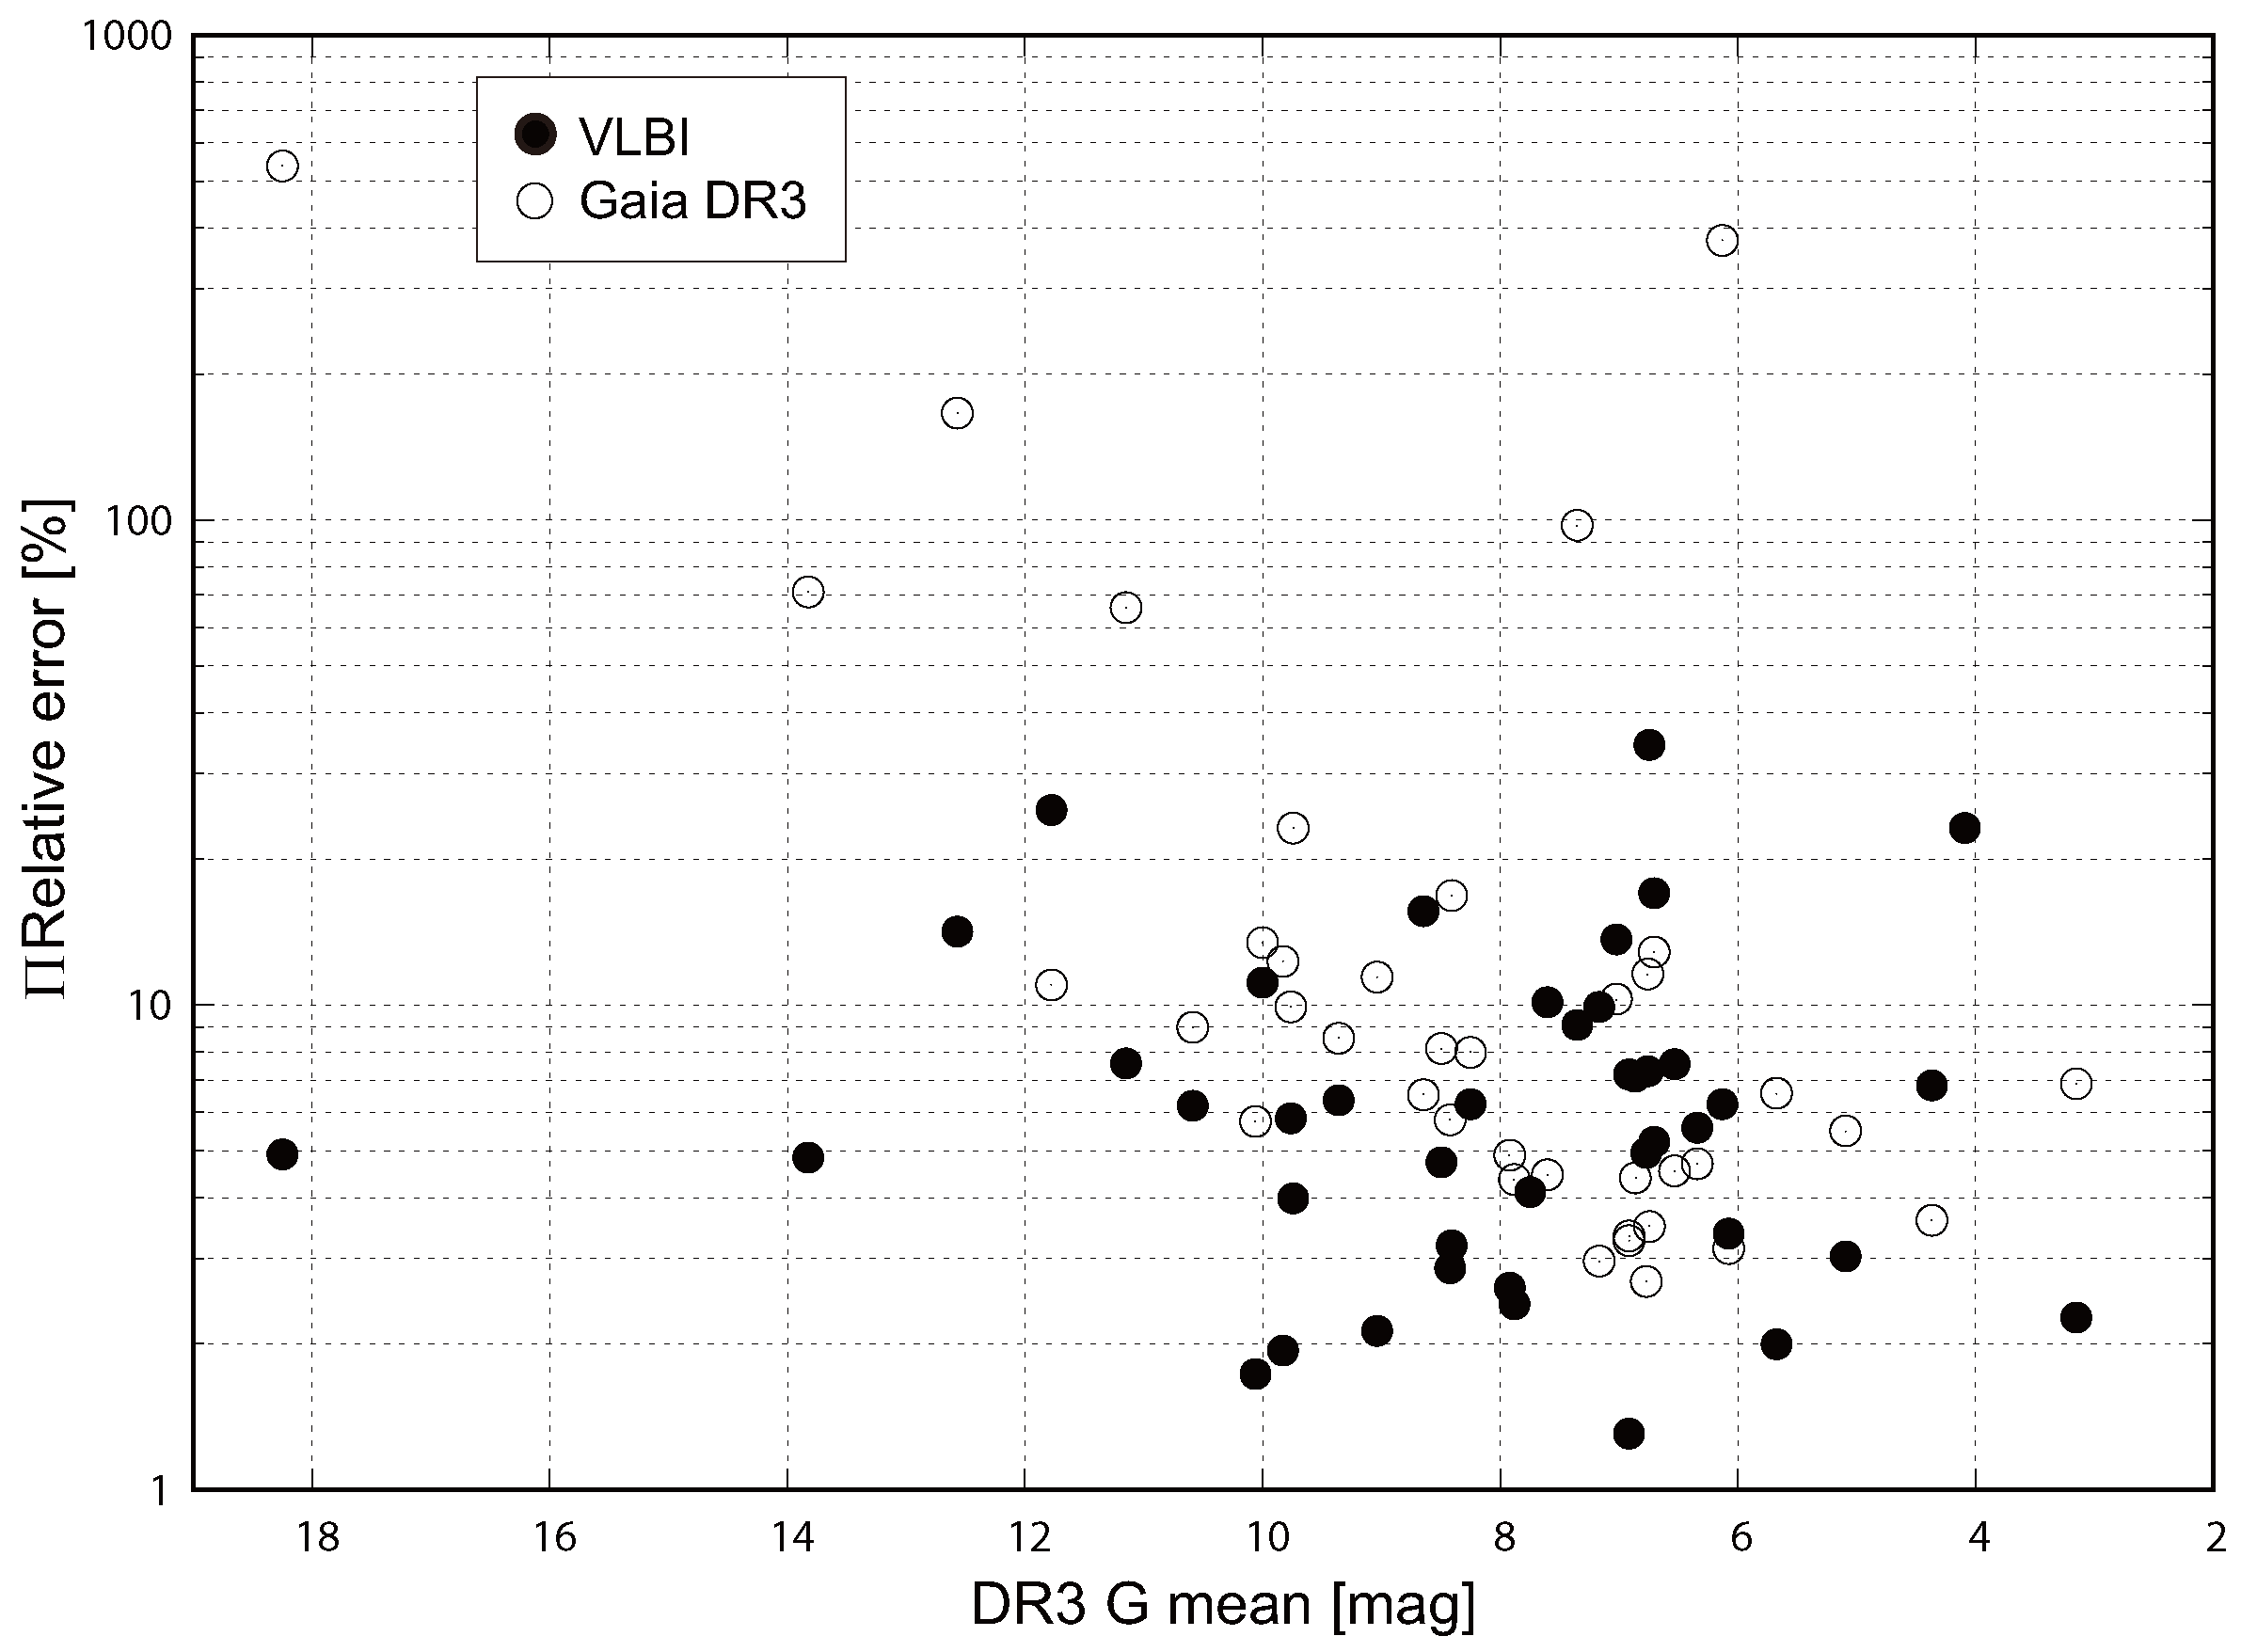
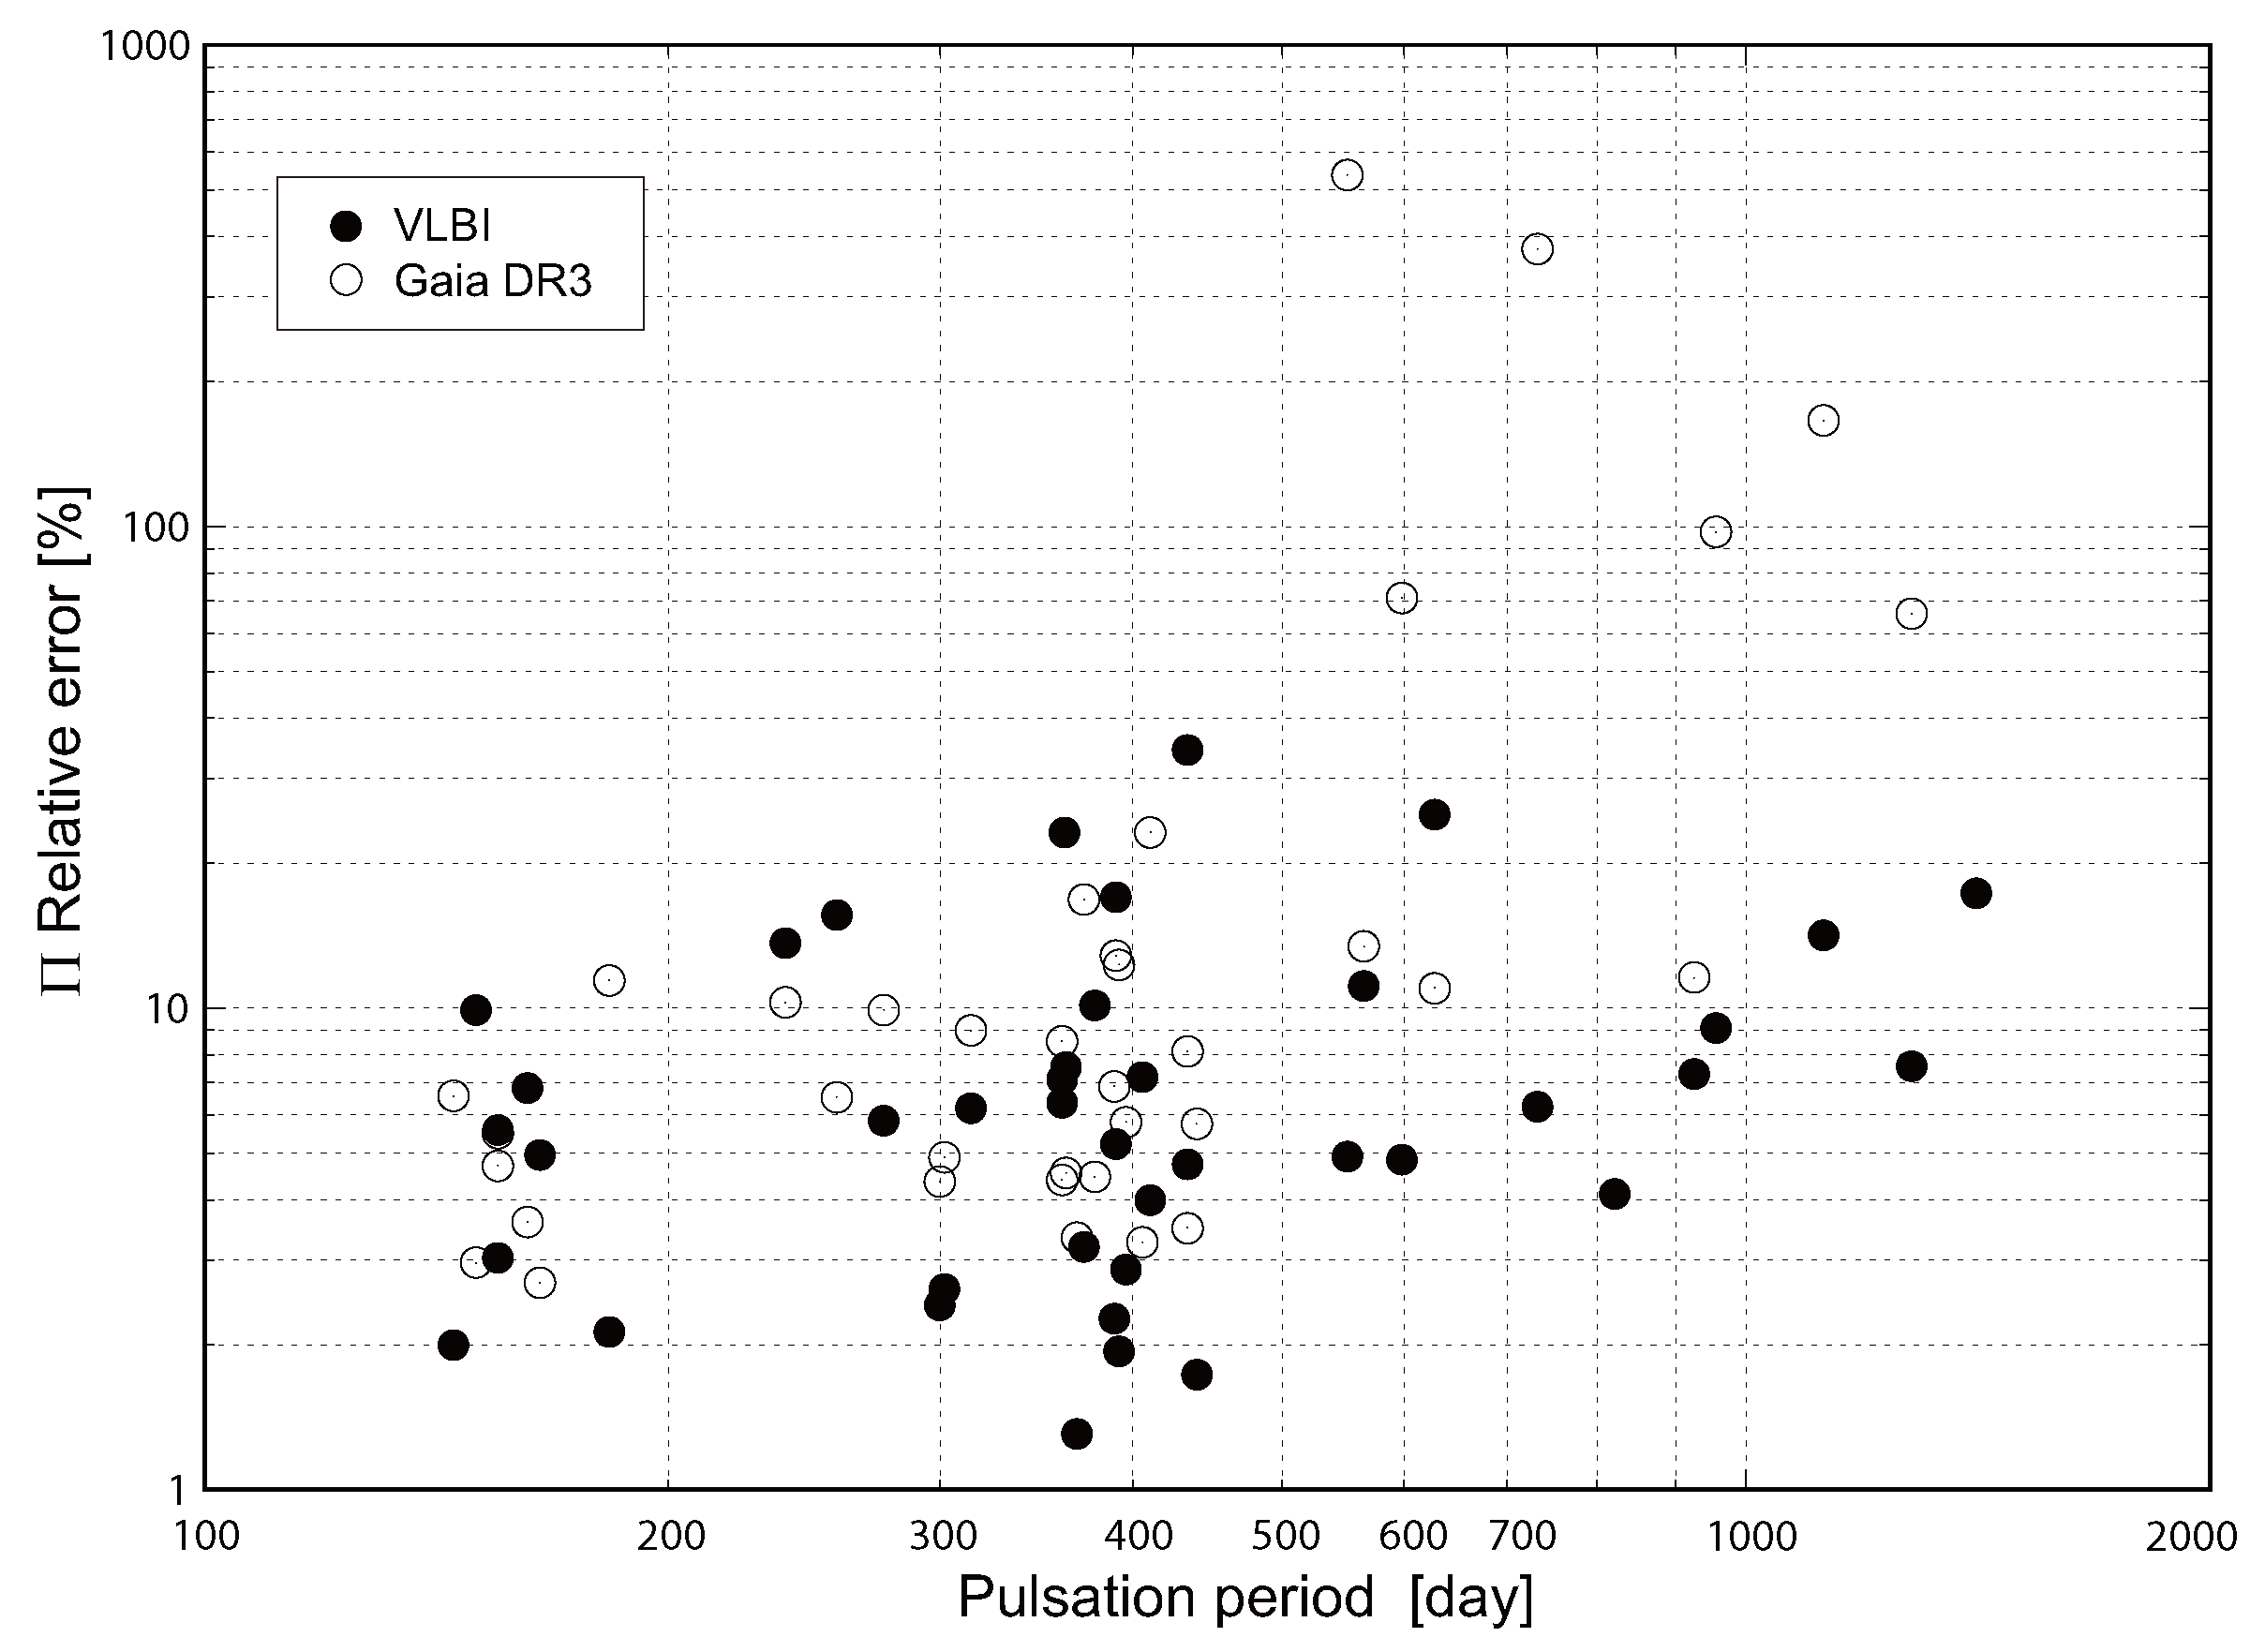
We calculated relative errors of parallaxes obtained from VLBI ( 100 × σ Π VLBI / Π VLBI ) and Gaia DR3 ( 100 × σ Π DR 3 / Π DR 3 ), and presented them against the mean magnitude of Gaia DR3 G-band photometry ( m G ) in Figure 8. Filled and open circles correspond to VLBI and Gaia DR3, respectively. The majority of VLBI parallax relative errors (filled circles) are less than 10%. However, in the Gaia DR3 parallaxes (open circles), optically fainter sources generally exhibit larger relative uncertainties, as expected. Sources with relative errors exceeding 10 % are more common in Gaia DR3 (20 sources) than in VLBI (11 sources). Among the VLBI sources with large errors, three are OH/IR stars, while among the Gaia DR3 sources, nine are either OH/IR or SRc stars. OH/IR and SRc stars thus appear to exhibit larger relative errors in Gaia DR3 than in VLBI.
Figure 9 shows the relation between pulsation periods and relative parallax errors. Filled and open circles correspond to VLBI and Gaia DR3, respectively. Figure 9 shows that, particularly for sources with long pulsation periods, the relative errors from Gaia DR3 are significantly larger than those from VLBI. Following the hydrodynamical simulation studies by Chiavassa et al. [8,9] described in Section 1, Béguin et al. [54] analyzed the relation between photocenter displacement and pulsation period, finding a rapid increase in displacement with increasing period. Béguin et al. [54] considered pulsation periods between 100 and 630 days ( 2.0 Log P 2.8 ). If the same trend is extrapolated toward longer periods, their results are expected to be consistent with our analysis, shown in Figure 9—that is, the relative parallax errors tend to increase as the pulsation period becomes longer.
In Figure 10, we present the parameter Γ for 39 sources as a function of their pulsation periods. A possible feature visible in this figure is an increased dispersion of Γ for sources with pulsation periods near one year (∼365 days), compared to sources at shorter or longer periods. We suggest that this may result from a coupling between the timescale of stellar pulsation and the annual parallax measurement. The annual parallax signal arises from Earth’s orbital motion around the Sun, with a period of exactly one year. If the surface brightness distribution of an AGB star is modulated by its pulsation, the photocenter position will vary accordingly. When the pulsation period is close to one year, this photocenter motion can become partially degenerate with the parallax signature. This complicates the separation of the two effects in the astrometric solution. Furthermore, since circumstellar maser activity is influenced by the pulsation of the central star, a similar coupling effect may also affect VLBI astrometry. These two effects, which may not be clearly separated, could degrade the quality of parallax determination in both methods, leading to a larger dispersion of Γ around the timescale of ∼1 year. We calculated the standard deviation of Γ in three period bins: Bin 1 (short period): P < 300 days, Bin 2 (near 1 year): 300 P < 430 days, and Bin 3 (long period): P 430 days. However, in this calculation, RW Lep in Bin 1 with Γ = 5.1 and S Per in Bin 3 with Γ = + 11.1 were excluded, because their Γ values differ significantly from those of the other sources. The standard deviation of Γ in the period range 300 < P 430 days is 2.33, compared to 1.25 for shorter periods and 1.57 for longer periods. We also note that the number of sources in the relevant period range is limited, and this tentative finding would benefit from confirmation with a larger sample.

4.4. Comparison of Proper Motions from VLBI and Gaia DR3

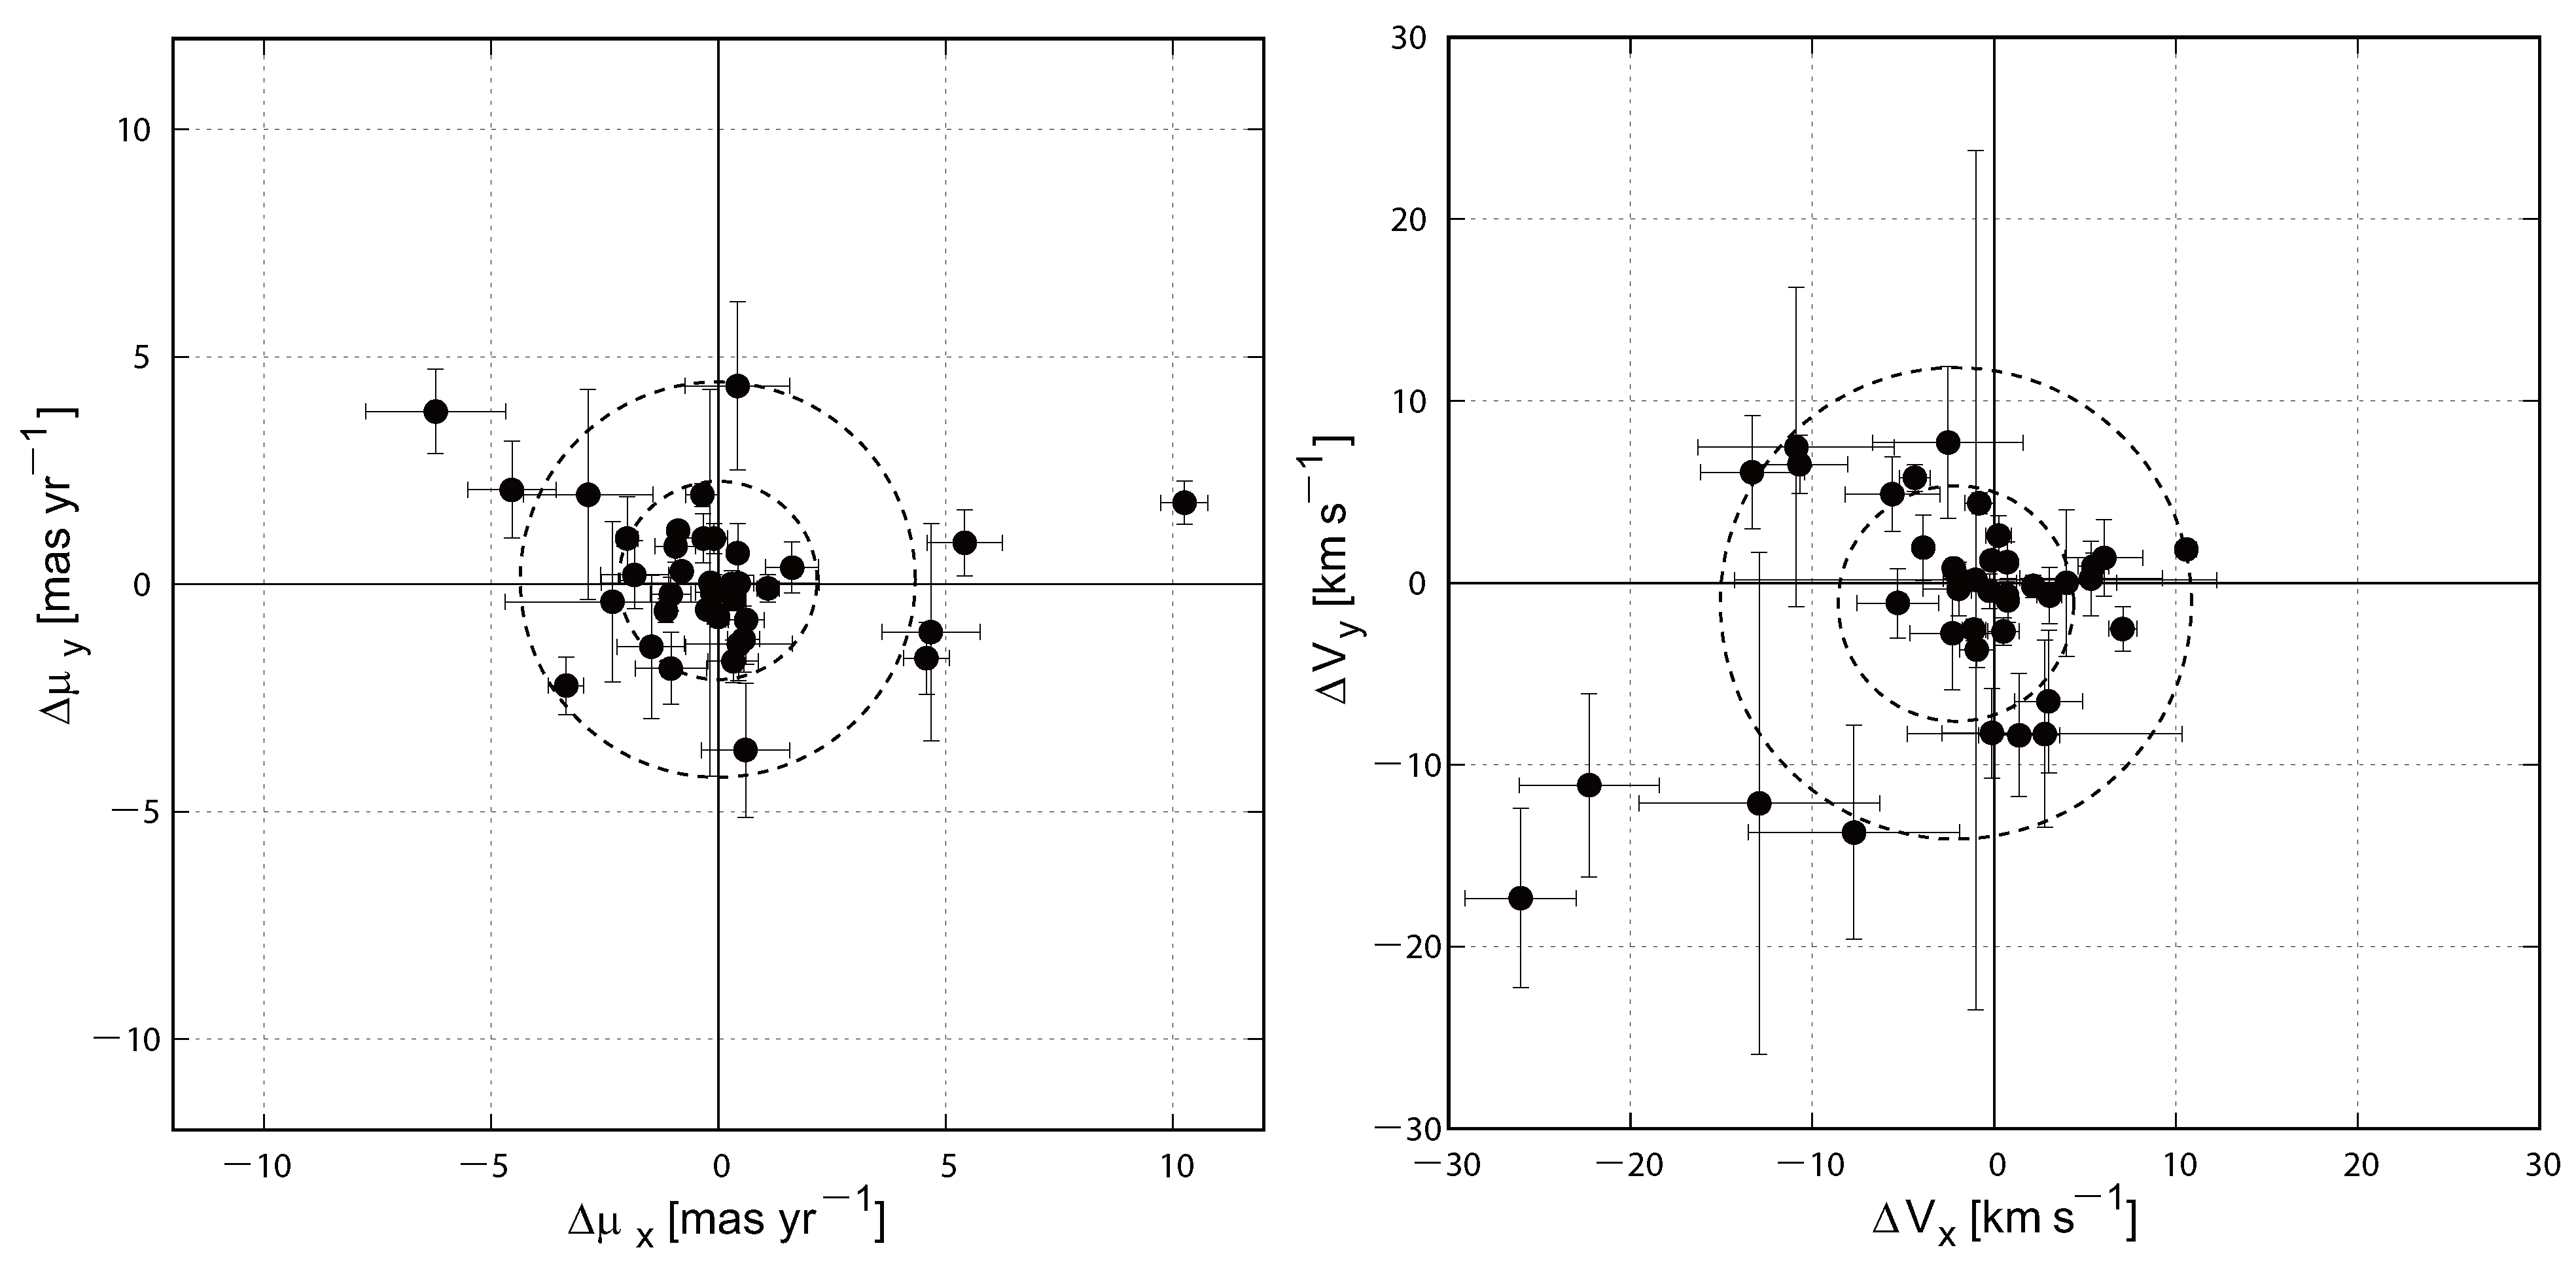
In the comparison of angular proper motions obtained from VLBI and Gaia DR3, we introduced the following residual parameters: Δ μ x = μ x VLBI μ x DR 3 and Δ μ y = μ y VLBI μ y DR 3 in units of mas yr−1. The subscripts x and y denote directions along RA and DEC, respectively. We present the distributions of Δ μ x and Δ μ y in the left panel of Figure 11. For the error estimation of Δ μ x and Δ μ y , we calculated the quadratic sums of each error contribution of proper motions from VLBI and Gaia DR3. A large portion of the sources shows Δ μ x and Δ μ y values less than 5 mas yr−1, showing a compact distribution around zero point. However, a few sources with relatively large error bars tend to fall in the outer region of the distribution.
Using distances to each source, we converted the residuals of angular proper motions into linear velocities in units of km s−1. In this calculation, we adopted the VLBI parallaxes and performed the conversion according to the following equation:
Δ V x ( y ) = 4.74 × Δ μ x ( y ) Π VLBI [ km s 1 ] .
Here, 4.74 is the conversion factor from angular proper motion and parallax to linear velocity. Then, we present the distributions of Δ V x and Δ V y in the right panel of Figure 11. Like the distribution in the left panel, the residuals of linear velocities are basically concentrated around zero, and some sources with large error bars tend to be located away from zero.
For statistical analysis of the two distributions in Figure 11, the residuals of angular proper motions and linear velocities were considered using a two-dimensional Gaussian distribution. We adopted an axisymmetric Gaussian model for simplicity. In the following analysis, we did not take into account the errors of angular proper motions and linear velocities. We assume that the data points ( x , y ) are drawn from a probability density function, given by
P ( x , y ) = 1 2 π σ 2 exp ( x x 0 ) 2 + ( y y 0 ) 2 2 σ 2 .
The parameters (x, y) in the model correspond to ( Δ μ x , Δ μ y ) for the left panel, and ( Δ V x , Δ V y ) for the right panel in Figure 11, respectively. The ( x 0 , y 0 ) denotes the center of the distribution and σ is the common standard deviation along both axes.
The center and dispersion of the distribution were estimated using the maximum likelihood method. The log-likelihood function for N data points is written as
ln L = N ln ( 2 π σ 2 ) 1 2 σ 2 i = 1 N ( x i x 0 ) 2 + ( y i y 0 ) 2 .
The parameters x 0 , y 0 , and σ , which maximize this likelihood function, can be obtained analytically. The center of the Gaussian distribution ( x 0 , y 0 ) corresponds to the sample’s mean as follows:
x 0 = 1 N i = 1 N x i and y 0 = 1 N i = 1 N y i .
The dispersion σ is given by
σ 2 = 1 2 σ x 2 + σ y 2 ,
where σ x and σ y satisfies
σ x 2 = 1 N i = 1 N ( x i x 0 ) 2 and σ y 2 = 1 N i = 1 N ( y i y 0 ) 2 .
As a result, using N = 36 data points, the standard deviation of the angular proper motion residuals was estimated to be σ Δ μ = 2.17 mas yr−1. The center of the distribution was estimated to be ( Δ μ x 0 , Δ μ y 0 ) = ( 0.02 , 0.09 ) mas yr−1.
We present the distributions of linear velocities Δ V x and Δ V y in the right panel of Figure 11. The distribution of the linear velocity residuals was analyzed using the same statistical framework as that applied to the angular proper motion. Regarding the linear velocity, the standard deviation was estimated to be σ Δ V = 6.47 km s−1. The center was estimated to be ( Δ V x 0 , Δ V y 0 ) = ( 2.19 , 1.16 ) km s−1. The 2 × σ Δ V corresponds to a velocity of 12.94 km s−1 for our sample. This indicates that, for the majority of the sources, the differences in proper motions between VLBI and Gaia DR3 are within 12.94 km s−1. We note that this dispersion is comparable to the typical outflow velocities of AGB stars, which fall in the range of 5–15 km s−1 [7]. This does not necessarily mean that the proper motion residuals are directly caused by outflow motions. However, VLBI maser proper motions may include a contribution from the internal motions of the circumstellar envelope, and the outflow velocity provides a natural scale for the magnitude of such effects. As noted in Section 2.2, the reliability of VLBI systemic proper motion determinations varies among sources, which may also contribute to the observed dispersion.
To investigate whether the observed proper motion differences between VLBI and DR3 arise from technique-dependent measurement errors or from other factors, we performed a three-way comparison using Hipparcos proper motions [55] as an independent reference. Of the 43 sources in our sample, the proper motions of 23 sources are available in all three methods (VLBI, Gaia DR3, and Hippracos). For this subsample, we computed the proper motion residuals between Hipparcos and DR3 and compared their standard deviation with that of the already established proper motion residuals between VLBI and DR3. Since the Hipparcos (epoch 1991.25) and DR3 (epoch 2016.0) measurements are separated by 24.75 years and were obtained independently, the astrometric errors between them should be uncorrelated. Excluding outliers VY CMa (an RSG with poor Hipparcos astrometric solution), and R Aqr (a known symbiotic binary) from our sample, the standard deviations are 2.13 mas yr−1 for the Hipparcos–DR3 residuals, 2.02 mas yr−1 for the VLBI–DR3 residuals, and 2.77 mas yr−1 for the Hipparcos–VLBI residuals. The first two are comparable, while the Hipparcos–VLBI residual is relatively larger, as expected since it combines the two catalogs with large individual uncertainties while excluding the most precise one (Gaia DR3). The magnitude of the optical–optical and radio–optical proper motion residuals indicates that the discrepancies are not solely attributable to either VLBI or DR3. Instead, each technique has its own noise floor of comparable magnitude arising from technique-dependent effects (e.g., the photocenter variability for optical, or internal maser motions for radio), plus shared effects such as binarity.

4.5. Pulsation Period and Proper Motion

Using the angular proper motions in Table 3, we calculated the absolute angular proper motions on the plane of the sky for VLBI ( μ VLBI ) and Gaia DR3 ( μ DR 3 ) as follows:
μ VLBI = ( μ x VLBI ) 2 + ( μ y VLBI ) 2 , μ DR 3 = ( μ x DR 3 ) 2 + ( μ y DR 3 ) 2 [ mas yr 1 ] .
Then, we defined the difference of these absolute angular proper motions Δ μ in units of mas yr−1 as follows:
Δ μ = | μ VLBI μ DR 3 | [ mas yr 1 ] .
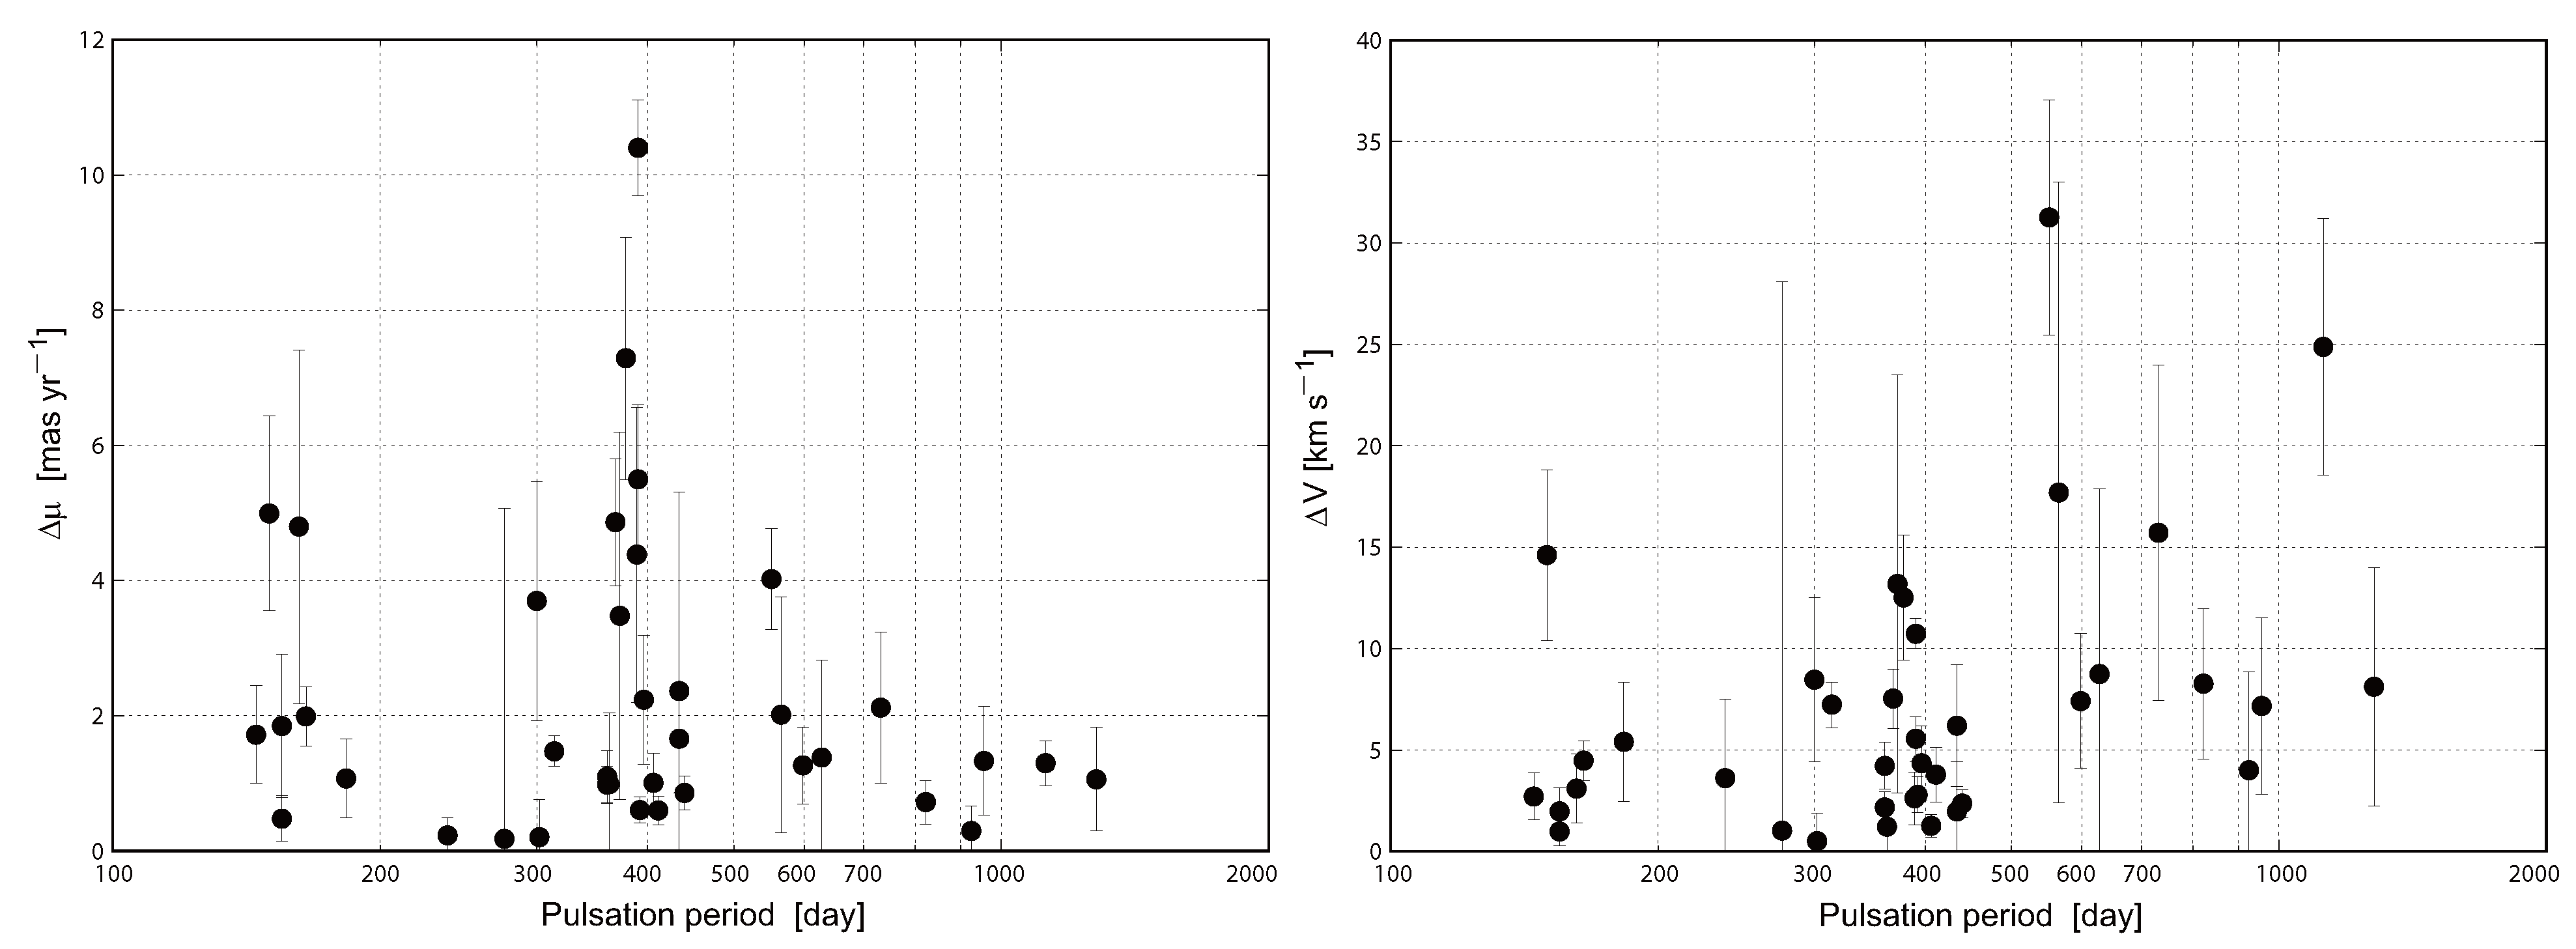
In the left panel of Figure 12, we show Δ μ against the logarithm of the pulsation period ( Log P ). In the right panel of Figure 12, we convert these angular velocities Δ μ into linear velocities Δ V in units of km s−1 according to the following equation. In this conversion, we adopted VLBI parallaxes Π VLBI for all sources.
Δ V = 4.74 × Δ μ Π VLBI = 4.74 × | μ VLBI μ DR 3 | Π VLBI [ km s 1 ]
In the left panel of Figure 12, we find that the discussion in Section 4.3 is applicable again. The dispersion of Δ μ along the vertical axis seems to be larger at the pulsation period around ∼1 yr, compared to periods outside this range. We think this behavior is again affected by the coupling between pulsation periods and the physical time scale of the parallax. Interestingly, the large dispersion of Δ μ around a pulsation period of ∼1 yr is not apparent in the right panel. The dispersion of Δ V becomes larger over a longer period range. This behavior can be interpreted as the same selection bias seen in Figure 7, where sources with longer pulsation periods preferentially have smaller parallaxes. For sources with longer pulsation periods, their larger distances enhance the effect of conversion from angular motions into linear velocities, leading to larger estimated linear velocities.

5. Summary

In this paper, we compared astrometric measurements of 43 Galactic long period variable stars obtained from VLBI observations and Gaia DR3. By focusing on annual parallaxes and proper motions, and by taking pulsation periods into account, we investigated the consistency and limitations of the two independent techniques when applied to LPVs.
The comparison of parallaxes shows that, although many sources show good agreement between VLBI and Gaia DR3, a slight systematic tendency for Gaia DR3 parallaxes to be smaller than those from VLBI is found. This trend is qualitatively consistent with the previously reported offsets in Gaia parallaxes.
The behavior of parallax uncertainties is different. The errors in VLBI parallaxes increase with increasing parallax, whereas those in Gaia DR3 remain nearly constant or show a weak dependence on parallax. From this difference, we identify a transition around a parallax of approximately 2 mas, below which VLBI provides better estimates than Gaia DR3. This implies that VLBI astrometry is particularly valuable for distant LPVs located beyond roughly 500 pc.
The proper motions are also compared. The 2-sigma deviation of the linear velocity differences is 12.94 km s−1, which is comparable to the typical outflow velocities of AGB stars of 5–15 km s−1. This suggests that circumstellar motions may contribute to the observed scatter in the residuals of proper motions, although other effects—such as photocenter variability, binarity, and measurement uncertainties—are also likely to be involved.
From the comparisons, it can also be inferred that the dispersion of the measurement residuals increase slightly for sources with pulsation periods of around one year. This suggests a coupling between stellar pulsation and time scale of the annual parallax. Our results demonstrate that VLBI and Gaia astrometry are highly complementary. By combining both techniques, we obtain a more comprehensive understanding of the distances and kinematics of AGB stars.

Author Contributions

Conceptualization, A.N.; Methodology, A.N., T.K., H.S. and G.O.; writing—original draft preparation, A.N.; writing—review and editing, G.O. and A.N. All authors have read and agreed to the published version of the manuscript.

Funding

This work was partially supported by the Inter-university collaborative project, the Japanese VLBI Network (JVN) of the National Astronomical Observatory of Japan.

Data Availability Statement

Measurements of parallaxes and proper motions used in the manuscript are available in the relevant references.

Acknowledgments

This work has made use of data from the European Space Agency (ESA) mission Gaia (https://www.cosmos.esa.int/gaia (accessed on 16 August 2025), processed by the Gaia Data Processing and Analysis Consortium (DPAC, https://www.cosmos.esa.int/web/gaia/dpac/consortium). Funding for the DPAC has been provided by national institutions, in particular the institutions participating in the Gaia Multilateral Agreement. This research has made use of the SIMBAD database, operated at CDS, Strasbourg, France.

Conflicts of Interest

The authors declare no conflicts of interest.

Notes

1
Gaia Data Release 3; https://www.cosmos.esa.int/web/gaia/data-release-3 (accessed on 16 August 2025).
2
SIMBAD; https://simbad.cds.unistra.fr/simbad/sim-fid (accessed on 10 February 2026).

References

  1. Whitelock, P.A.; Feast, M.W.; Van Leeuwen, F. AGB variables and the Mira period-luminosity relation. Mon. Not. R. Astron. Soc. 2008, 386, 313–323. [Google Scholar] [CrossRef]
  2. Reid, M.J.; Honma, M. Microarcsecond Radio Astrometry. Annu. Rev. Astron. Astrophys. 2014, 52, 339–372. [Google Scholar] [CrossRef]
  3. Hirota, T.; Nagayama, T.; Honma, M.; Adachi, Y.; Burns, R.A.; Chibueze, J.O.; Choi, Y.K.; Hachisuka, K.; Hada, K. et al. [VERA Collaboration] The First VERA Astrometry Catalog. Publ. Astron. Soc. Jpn. 2020, 72, 50. [Google Scholar]
  4. Reid, M.J.; Menten, K.M.; Brunthaler, A.; Zheng, X.W.; Dame, T.M.; Xu, Y.; Li, J.; Sakai, N.; Wu, Y.; Immer, K.; et al. Trigonometric Parallaxes of High-mass Star-forming Regions: Our View of the Milky Way. Astrophys. J. 2019, 885, 131. [Google Scholar] [CrossRef]
  5. Vallenari, A.; Brown, A.G.A.; Prusti, T.; de Bruijne, J.H.J.; Arenou, F.; Babusiaux, C.; Biermann, M.; Creevey, O.L.; Ducourant, C.; Evans, D.W. et al. [Gaia Collaboration] Gaia Data Release 3. Summary of the content and survey properties. Astron. Astrophys. 2023, 674, A1. [Google Scholar]
  6. Lebzelter, T.; Mowlavi, N.; Lecoeur-Taibi, I.; Trabucchi, M.; Audard, M.; García-Lario, P.; Gavras, P.; Holl, B.; Jevardat de Fombelle, G.; Nienartowicz, K.; et al. Gaia Data Release 3. The second Gaia catalogue of long-period variable candidates. Astron. Astrophys. 2023, 674, A15. [Google Scholar] [CrossRef]
  7. Höfner, S.; Olofsson, H. Mass loss of stars on the asymptotic giant branch. Mechanisms, models and measurements. Annu. Rev. Astron. Astrophys. 2018, 26, 1. [Google Scholar] [CrossRef]
  8. Chiavassa, A.; Freytag, B.; Schultheis, M. Heading Gaia to measure atmospheric dynamics in AGB stars. Astron. Astrophys. 2018, 617, L1. [Google Scholar] [CrossRef]
  9. Chiavassa, A.; Kudritzki, R.; Davies, B.; Freytag, B.; de Mink, S.E. Probing red supergiant dynamics through photo-center displacements measured by Gaia. Astron. Astrophys. 2022, 661, L1. [Google Scholar] [CrossRef]
  10. Bobylev, V.V. A new estimate of the zero-point shift of the Gaia DR3 parallaxes obtained from a comparison with VLBI measurements of masers and radio stars. arXiv 2025, arXiv:2511.11871. [Google Scholar] [CrossRef]
  11. Andriantsaralaza, M.; Ramstedt, S.; Vlemmings, W.H.T.; De Beck, E. Distance estimates for AGB stars from parallax measurements. Astron. Astrophys. 2022, 667, A74. [Google Scholar] [CrossRef]
  12. Wenger, M.; Ochsenbein, F.; Egret, D.; Dubois, P.; Bonnarel, F.; Borde, S.; Genova, F.; Jasniewicz, G.; Laloe, S.; Lesteven, S.; et al. The SIMBAD astronomical database. The CDS reference database for astronomical objects. Astron. Astrophys. Suppl. Ser. 2000, 143, 9. [Google Scholar] [CrossRef]
  13. Lindegren, L.; Klioner, S.A.; Hernández, J.; Bombrun, A.; Ramos-Lerate, M.; Steidelmüller, H.; Bastian, U.; Biermann, M.; de Torres, A.; Gerlach, E.; et al. Gaia Early Data Release 3. The astrometric solution. Astron. Astrophys. 2021, 649, A2. [Google Scholar] [CrossRef]
  14. Cutri, R.M.; Skrutskie, M.F.; van Dyk, S.; Beichman, C.A.; Carpenter, J.M.; Chester, T.; Cambresy, L.; Evans, T.; Fowler, J.; Gizis, J.; et al. VizieR Online Data Catalog: II/246; University of Massachusetts and Infrared Processing and Analysis Center: Boston, MA, USA, 2003. [Google Scholar]
  15. Cutri, R.M.; Wright, E.L.; Conrow, T.; Bauer, J.; Benford, D.; Brandenburg, H.; Dailey, J.; Eisenhardt, P.R.M.; Evans, T.; Fajardo-Acosta, S.; et al. Explanatory Supplement to the WISE All-Sky Data Release Products. 2012, 1. Available online: https://irsa.ipac.caltech.edu/data/WISE/docs/release/All-Sky/expsup/ (accessed on 18 March 2026).
  16. Lindegren, L.; Hernández, J.; Bombrun, A.; Klioner, S.; Bastian, U.; Ramos-Lerate, M.; de Torres, A.; Steidelmüller, H.; Stephenson, C.; Hobbs, D.; et al. Gaia Data Release 2. The astrometric solution. Astron. Astrophys. 2018, 616, A2. [Google Scholar] [CrossRef]
  17. Kamohara, R.; Bujarrabal, V.; Honma, M.; Nakagawa, A.; Matsumoto, N.; Oyama, T.; Hirota, T.; Imai, H.; Shibata, K.M.; Kobayashi, H.; et al. VERA observations of SiO maser emission from R Aquarii. Astron. Astrophys. 2010, 510, A69. [Google Scholar] [CrossRef]
  18. Min, C.; Matsumoto, N.; Kim, M.K.; Hirota, T.; Shibata, K.M.; Cho, S.-H.; Shizugami, M.; Honma, M. Accurate parallax measurement toward the symbiotic star R Aquarii. Publ. Astron. Soc. Jpn. 2014, 66, 38. [Google Scholar] [CrossRef]
  19. Nyu, D.; Nakagawa, A.; Matsui, M.; Imai, H.; Sofue, Y.; Omodaka, T.; Kurayama, T.; Kamohara, R.; Hirota, T.; Honma, M. Astrometry of AGB Variables with VERA: Annual Parallax and the Orbit of SY Sculptoris in the Galaxy. Publ. Astron. Soc. Jpn. 2011, 63, 63. [Google Scholar] [CrossRef]
  20. Orosz, G.; Imai, H.; Dodson, R.; Rioja, M.J.; Frey, S.; Burns, R.A.; Etoka, S.; Nakagawa, A.; Nakanishi, H.; Asaki, Y.; et al. Astrometry of OH/IR Stars Using 1612 MHz Hydroxyl Masers. I. Annual Parallaxes of WX Psc and OH 138.0 + 7.2. Astron. J. 2017, 153, 119. [Google Scholar] [CrossRef]
  21. Asaki, Y.; Deguchi, S.; Imai, H.; Hachisuka, K.; Miyoshi, M.; Honma, M. Distance and Proper Motion Measurement of the Red Supergiant, S Persei, with VLBI H2O Maser Astrometry. Astrophys. J. 2010, 721, 267. [Google Scholar] [CrossRef]
  22. Nakagawa, A.; Omodaka, T.; Handa, T.; Honma, M.; Kawaguchi, N.; Kobayashi, H.; Oyama, T.; Sato, K.; Shibata, K.M.; Shizugami, M.; et al. VLBI astrometry of AGB variables with VERA: A Mira-type variable T Lepus. Publ. Astron. Soc. Jpn. 2014, 66, 101. [Google Scholar] [CrossRef]
  23. Kamezaki, T.; Kurayama, T.; Nakagawa, A.; Handa, T.; Omodaka, T.; Nagayama, T.; Kobayashi, H.; Shizugami, M. Annual parallax measurements of a semi-regular variable star, RW Leporis. Publ. Astron. Soc. Jpn. 2014, 66, 107. [Google Scholar] [CrossRef]
  24. Matsuno, M.; Nakagawa, A.; Morita, A.; Kurayama, T.; Omodaka, T.; Nagayama, T.; Honma, M.; Shibata, K.M.; Ueno, Y.; Jike, T.; et al. Annual parallax measurement of the Mira variable star BX Camelopardalis with VERA. Publ. Astron. Soc. Jpn 2020, 72, 56. [Google Scholar] [CrossRef]
  25. Kamezaki, T.; Nakagawa, A.; Omodaka, T.; Handa, T.; Inoue, K.; Kurayama, T.; Kobayashi, H.; Nagayama, T.; Ueno, Y. Annual parallax measurements of a Mira variable star, U Lyncis. Publ. Astron. Soc. Jpn. 2016, 68, 71. [Google Scholar] [CrossRef]
  26. Nakagawa, A.; Morita, A.; Sakai, N.; Kurayama, T.; Sudou, H.; Orosz, G.; Yuda, A.; Kaseda, D.; Matsuno, M.; Hamada, S.; et al. Astrometric VLBI observations of H2O masers in an extreme OH/IR star candidate NSV 17351. Publ. Astron. Soc. Jpn. 2023, 75, 529. [Google Scholar] [CrossRef]
  27. Choi, Y.K.; Hirota, T.; Honma, M.; Kobayashi, H.; Bushimata, T.; Imai, H.; Iwadate, K.; Jike, T.; Kameno, S.; Kameya, O.; et al. Distance to VY Canis Majoris with VERA. Publ. Astron. Soc. Jpn. 2008, 60, 1007. [Google Scholar] [CrossRef]
  28. Nakagawa, A.; Kurayama, T.; Orosz, G.; Burns, R.A.; Oyama, T.; Nagayama, T.; Miyata, T.; Sekido, M.; Baba, J.; Wada, K. Astrometric VLBI Observations of the Galactic LPVs, Miras, and OH/IR stars. In Astrophysical Masers: Unlocking the Mysteries of the Universe, IAU Symp. 376; Cambridge University Press: Cambridge, UK, 2018; pp. 365–368. [Google Scholar]
  29. Nakagawa, A.; Kurayama, T.; Matsui, M.; Omodaka, T.; Honma, M.; Shibata, K.M.; Sato, K.; Jike, T. Parallax of a Mira variable R Ursae Majoris studied with astrometric VLBI. Publ. Astron. Soc. Jpn. 2016, 68, 78. [Google Scholar] [CrossRef]
  30. Nakagawa, A.; Tsushima, M.; Ando, K.; Bushimata, T.; Choi, Y.K.; Hirota, T.; Honma, M.; Imai, H.; Iwadate, K.; Jike, T.; et al. VLBI Astrometry of AGB Variables with VERA—A Semiregular Variable S Crateris. Publ. Astron. Soc. Jpn. 2008, 60, 1013. [Google Scholar] [CrossRef]
  31. Zhang, B.; Zheng, X.; Reid, M.J.; Honma, M.; Menten, K.M.; Brunthaler, A.; Kim, J. VLBA Trigonometric Parallax Measurement of the Semi-regular Variable RT Vir. Astrophys. J. 2017, 849, 99. [Google Scholar] [CrossRef]
  32. Vlemmings, W.H.T.; van Langevelde, H.J.; Diamond, P.J.; Habing, H.J.; Schilizzi, R.T. VLBI astrometry of circumstellar OH masers: Proper motions and parallaxes of four AGB stars. Astron. Astrophys. 2003, 407, 213. [Google Scholar] [CrossRef]
  33. Kamezaki, T.; Nakagawa, A.; Omodaka, T.; Kurayama, T.; Imai, H.; Tafoya, D.; Matsui, M.; Nishida, Y.; Nagayama, T.; Honma, M.; et al. VLBI Astrometry of the Semiregular Variable RX Bootis. Publ. Astron. Soc. Jpn. 2012, 64, 7. [Google Scholar] [CrossRef]
  34. Kamezaki, T.; Nakagawa, A.; Omodaka, T.; Inoue, K.; Chibueze, J.O.; Nagayama, T.; Ueno, Y.; Matsunaga, N. Annual parallax and a dimming event of a Mira variable star, FV Bootis. Publ. Astron. Soc. Jpn. 2016, 68, 75. [Google Scholar] [CrossRef]
  35. Chibueze, J.O.; Omodaka, T.; Urago, R.; Nagayama, T.; Alhassan, J.A.; Nishida, Y.; Aralu, O.U.; van Rooyen, R.; Nakagawa, A.; Honma, M.; et al. Annual parallax and galactic orbit of Y Librae (IRAS 15090-0549) Mira variable star—GALORB release. Publ. Astron. Soc. Jpn. 2019, 71, 92. [Google Scholar] [CrossRef]
  36. Vlemmings, W.H.T.; van Langevelde, H.J. Improved VLBI astrometry of OH maser stars. Astron. Astrophys. 2007, 472, 547. [Google Scholar] [CrossRef]
  37. Xu, S.; Zhang, B.; Reid, M.J.; Menten, K.M.; Zheng, X.; Wang, G. The Parallax of the Red Hypergiant VX Sgr with Accurate Tropospheric Delay Calibration. Astrophys. J. 2018, 859, 14. [Google Scholar] [CrossRef]
  38. Sun, Y.; Zhang, B.; Reid, M.J.; Xu, S.; Wen, S.; Zhang, J.; Zheng, X. A Very Long Baseline Array Trigonometric Parallax for RR Aql and the Mira Period-Luminosity Relation. Astrophys. J. 2022, 931, 74. [Google Scholar] [CrossRef]
  39. Zhang, B.; Reid, M.J.; Menten, K.M.; Zheng, X.W.; Brunthaler, A. The distance and size of the red hypergiant NML Cygni from VLBA and VLA astrometry. Astron. Astrophys. 2012, 544, A42. [Google Scholar] [CrossRef]
  40. Kurayama, T.; Sasao, T.; Kobayashi, H. Parallax Measurements of the Mira-Type Star UX Cygni with Phase-referencing VLBI. Astrophys. J. Lett. 2005, 627, L49. [Google Scholar] [CrossRef]
  41. Sudou, H.; Omodaka, T.; Murakami, K.; Nagayama, T.; Nakagawa, A.; Urago, R.; Nagayama, T.; Hirano, K.; Honma, M. Annual parallax measurements of a semi-regular variable star SV Pegasus with VERA. Publ. Astron. Soc. Jpn. 2019, 71, 16. [Google Scholar] [CrossRef]
  42. Imai, H.; Sakai, N.; Nakanishi, H.; Sakanoue, H.; Honma, M.; Miyaji, T. Annual Parallax of the K-Type Star System IRAS 22480 + 6002 Measured with VERA. Publ. Astron. Soc. Jpn. 2012, 64, 142. [Google Scholar] [CrossRef]
  43. Kusuno, K.; Asaki, Y.; Imai, H.; Oyama, T. Distance and Proper Motion Measurement of the Red Supergiant, PZ Cas, in Very Long Baseline Interferometry H2O Maser Astrometry. Astrophys. J. 2013, 774, 107. [Google Scholar] [CrossRef]
  44. Samus’, N.N.; Kazarovets, E.V.; Durlevich, O.V.; Kireeva, N.N.; Pastukhova, E.N. General catalogue of variable stars: Version GCVS 5.1. Astron. Rep. 2017, 61, 80. [Google Scholar] [CrossRef]
  45. Uttenthaler, S.; Lebzelter, T.; Meingast, S. Infrared period-luminosity relations of Galactic Miras based on multi-epoch photometry and the Gaia parallax uncertainty. arXiv 2026, arXiv:2602.14775. [Google Scholar]
  46. Watson, C.; Henden, A.A.; Price, A. The International Variable Star Index (VSX). J. Am. Assoc. Var. Star Obs. 2007, 35, 414. [Google Scholar]
  47. Bujarrabal, V.; Alcolea, J.; Mikołajewska, J.; Castro-Carrizo, A.; Ramstedt, S. High-resolution observations of the symbiotic system R Aqr. Direct imaging of the gravitational effects of the secondary on the stellar wind. Astron. Astrophys. 2018, 616, L3. [Google Scholar] [CrossRef]
  48. Mason, B.D.; Wycoff, G.L.; Hartkopf, W.I.; Douglass, G.G.; Worley, C.E. The 2001 US Naval Observatory Double Star CD-ROM. I. The Washington Double Star Catalog. Astron. J. 2001, 122, 3466–3471. [Google Scholar] [CrossRef]
  49. Homan, W.; Pimpanuwat, B.; Herpin, F.; Danilovich, T.; McDonald, I.; Wallstrom, S.H.J.; Richards, A.M.S.; Baudry, A.; Sahai, R.; Millar, T.J.; et al. ATOMIUM: The astounding complexity of the near circumstellar environment of the M-type AGB star R Hydrae. I. Morpho-kinematical interpretation of CO and SiO emission. Astron. Astrophys. 2021, 651, A82. [Google Scholar] [CrossRef]
  50. Sánchez Contreras, C.; Gil de Paz, A.; Sahai, R. The Companion to the Central Mira Star of the Protoplanetary Nebula OH 231.8 + 4.2. Astrophys. J. 2004, 616, 519. [Google Scholar] [CrossRef]
  51. Kervella, P.; Arenou, F.; Thévenin, F. Stellar and substellar companions from Gaia EDR3. Proper-motion anomaly and resolved common proper-motion pairs. Astron. Astrophys. 2022, 657, A7. [Google Scholar] [CrossRef]
  52. Montargès, M.; Malfait, J.; Esseldeurs, M.; de Koter, A.; Baron, F.; Kervella, P.; Danilovich, T.; Richards, A.M.S.; Sahai, R.; McDonald, I.; et al. An accreting dwarf star orbiting the S-type giant star π1 Gru. Astron. Astrophys. 2025, 699, A22. [Google Scholar] [CrossRef]
  53. Esseldeurs, M.; Decin, L.; De Ridder, J.; Mori, Y.; Karakas, A.I.; Malfait, J.; Danilovich, T.; Mathis, S.; Richards, A.M.S.; Sahai, R.; et al. Evidence for the Keplerian orbit of a close companion around a giant star. Nat. Astron. 2026, 10, 124. [Google Scholar] [CrossRef]
  54. Béguin, E.; Chiavassa, A.; Ahmad, A.; Freytag, B.; Uttenthaler, S. Retrieving stellar parameters and dynamics of AGB stars with Gaia parallax measurements and CO5BOLD RHD simulations. Astron. Astrophys. 2024, 690, A125. [Google Scholar] [CrossRef]
  55. van Leeuwen, F. Validation of the new Hipparcos reduction. Astron. Astrophys. 2007, 474, 653–664. [Google Scholar] [CrossRef]
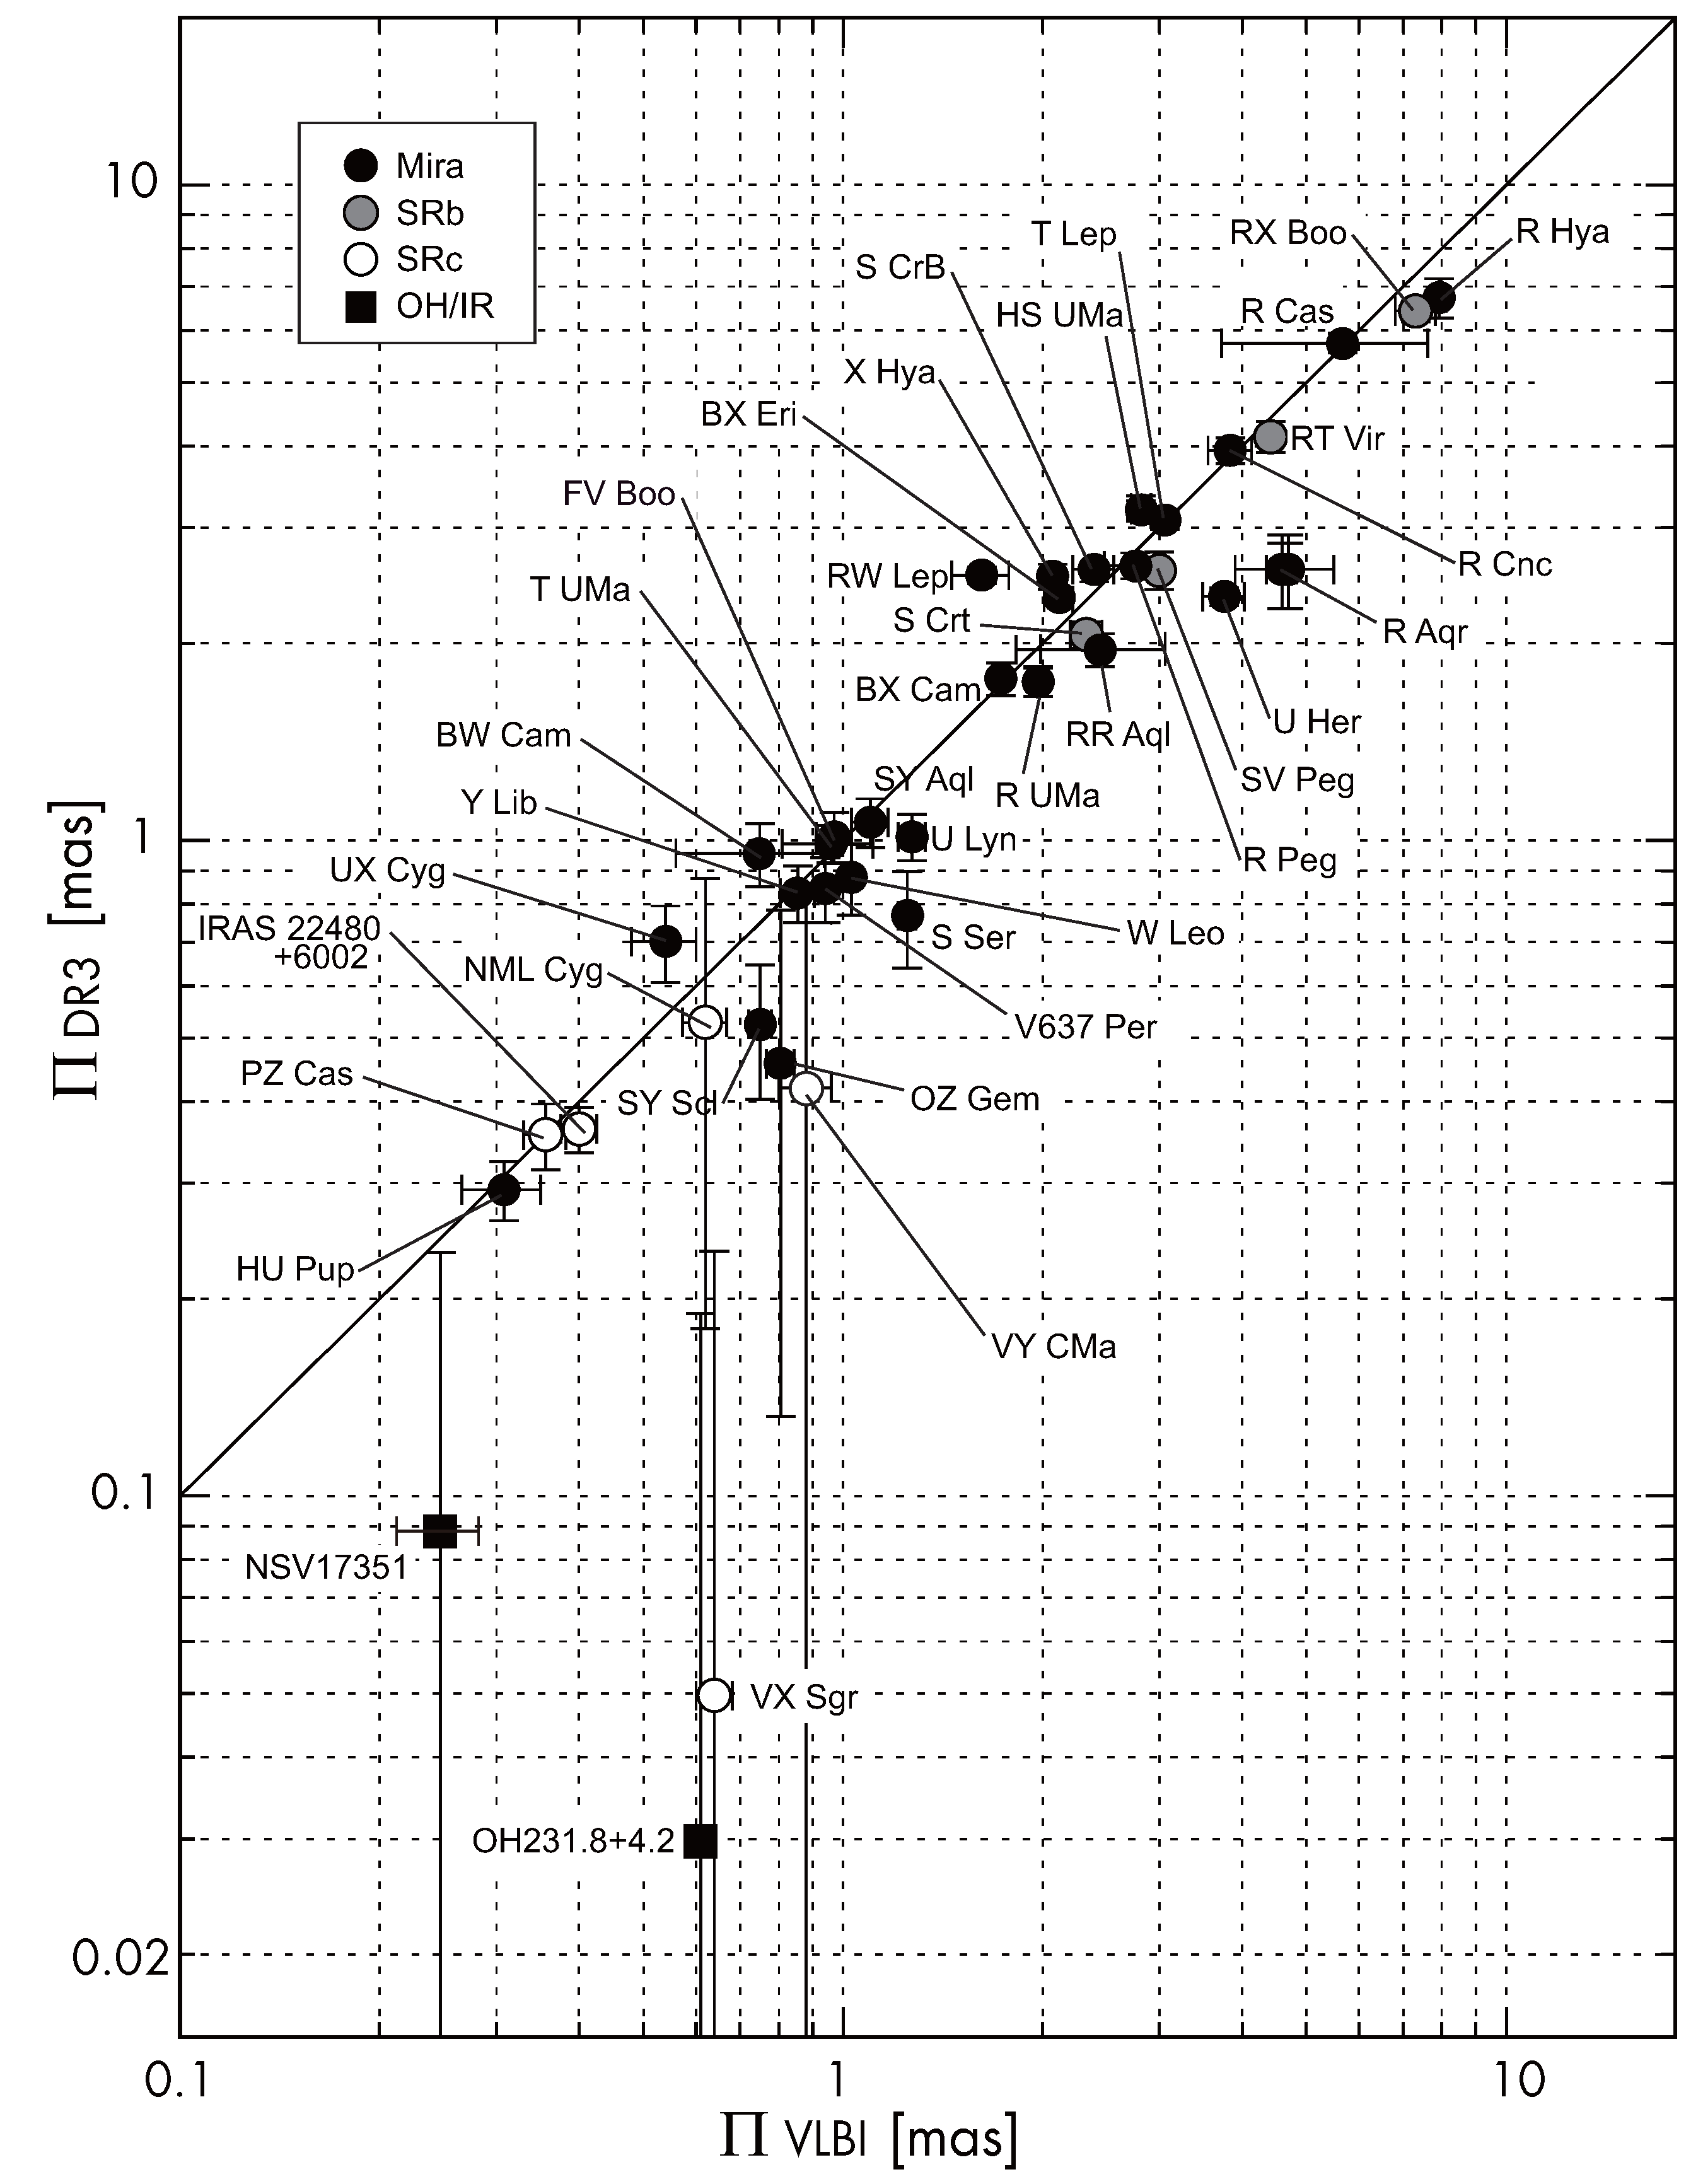
Figure 1. Parallaxes obtained from VLBI ( Π VLBI , horizontal axis) and Gaia DR3 ( Π DR 3 , vertical axis) are presented in logarithmic scale with error bars. The solid line indicates the one-to-one relation of Π VLBI = Π DR 3 . Source names are also indicated. Correspondence of source types and symbols are shown on top-left. This figure contains 39 sources, with 40 data points.
Galaxies 14 00026 g001
Figure 2. Mean magnitude of Gaia DR3 G-band photometry ( m G ) and parallaxes from VLBI ( Π VLBI , filled circle) and Gaia DR3 ( Π DR 3 , open circle).
Galaxies 14 00026 g002
Figure 3. Angular proper motions determined from VLBI (horizontal axis) and Gaia DR3 (vertical axis) are presented in units of mas yr−1. Left and right panels represent proper motions along the axes of RA and DEC, respectively. Dotted lines in each panels indicate one-to-one correspondence.
Galaxies 14 00026 g003
Figure 4. Histogram of Γ = ( Π VLBI Π DR 3 ) / σ Π VLBI 2 + σ Π DR 3 2 . The solid curve represents the fitted Gaussian model for the histogram. The bin at Γ = + 11 , which corresponds to the source S Per, was excluded from the Gaussian fit because it deviates significantly from the main group centered at Γ = 0 . The peak of the Gaussian model and its FWHM were obtained as + 0.66 ± 0.16 and 3.37, respectively.
Galaxies 14 00026 g004
Figure 5. Parallaxes ( Π ) and their errors ( σ Π ) from VLBI (filled circle) and Gaia (open square) in units of mas. Both axes are presented in logarithmic scales. The linear relations between the parallax and its error for VLBI and Gaia DR3 are presented with solid (VLBI) and dotted (DR3) lines, respectively. The 95% confidence intervals for the true linear relations are indicated with the shaded regions.
Galaxies 14 00026 g005
Figure 6. Parallax errors of VLBI (horizontal axis) and Gaia DR3 (vertical axis) in units of mas. Both axes are presented in logarithmic scales. The interquartile ranges, shown in gray, have boundaries that correspond to the first (Q1) and third (Q3) quartiles. The dotted lines along both axes indicate the second (Q2) quartiles. Compared to errors from VLBI, which are distributed over a wide range, those from Gaia DR3 show a narrower distribution.
Galaxies 14 00026 g006
Figure 7. Pulsation periods and parallaxes obtained from VLBI ( Π VLBI , filled circle) and Gaia DR3 ( Π DR 3 , open circle).
Galaxies 14 00026 g007
Figure 8. Mean magnitude of Gaia DR3 G-band photometry ( m G ) and parallax relative errors from VLBI (filled circle) and Gaia DR3 (open circle).
Galaxies 14 00026 g008
Figure 9. Pulsation period and relative errors of parallax measurements from VLBI (filled circle) and Gaia DR3 (open circle). Pulsation period ranges from 100 to 2000 days.
Galaxies 14 00026 g009
Figure 10. Pulsation period and Gamma parameter Γ . Pulsation period ranges from 100 to 2000 days.
Galaxies 14 00026 g010
Figure 11. Residuals of proper motions between VLBI and Gaia DR3. The left panel shows the residuals of angular proper motions ( Δ μ x , Δ μ y ) in units of mas yr−1 and the right panel shows their corresponding linear velocities ( Δ V x , Δ V y ) in units of km s−1. Vertical and horizontal axes represent proper motions along RA and DEC axes, respectively. We used VLBI parallax distances when converting the angular proper motions ( Δ μ x , Δ μ y ) to linear velocities ( Δ V x , Δ V y ).
Galaxies 14 00026 g011
Figure 12. The horizontal axes of both panels are the pulsation periods in the logarithmic scale. The value Δ μ in the vertical axis of the left panel is the difference in absolute angular proper motions between VLBI and Gaia DR3. In the right panel, the Δ μ [mas yr−1] values are converted into linear velocities Δ V [km s−1], and presented in the vertical axis.
Galaxies 14 00026 g012
Table 1. Coordinates of 43 sources.
SourceRADEClb
[h    m    s] [     ′     ″] [] []
SY Scl00 07 36.24344−25 29 39.966539.91161950−80.04538349
WX Psc01 06 25.98797+12 35 52.8964128.64174948−50.10740313
S Per02 22 51.71131+58 35 11.4228134.62069159−2.19499798
OH 138.0 + 7.203 25 08.40648+65 32 07.0584137.96994344+7.25570835
V637 Per03 54 02.25906+36 32 17.9084159.09860779−13.20215427
BX Eri04 40 32.76739−14 12 02.5278211.48288629−35.32877650
T Lep05 04 50.84513−21 54 16.5206222.66736699−32.71461188
BW Cam05 19 52.14696+63 15 54.9635148.28476279+14.56600243
RW Lep05 38 52.73540−14 02 26.8365217.78035923−22.29863413
BX Cam05 46 44.32884+69 58 24.4228143.43211981+20.09086085
U Lyn06 40 46.45814+59 52 01.5424155.65681412+21.93676006
NSV 1735107 07 49.38847−10 44 06.0340224.34188142−1.28769811
VY CMa07 22 58.32614−25 46 03.1944239.35259571−5.06541580
OZ Gem07 33 57.74298+30 30 37.7993188.79807539+21.89807093
OH 231.8 + 4.207 42 16.947−14 42 50.20231.835226+4.220231
HU Pup07 55 40.18456−28 38 54.6738245.43750668−0.14744467
R Cnc08 16 33.82673+11 43 34.4691211.74944559+24.13900182
X Hya09 35 30.26675−14 41 28.6101248.14899743+26.70144926
R UMa10 44 38.47233+68 46 32.6826138.36258555+44.36144070
W Leo10 53 37.43536+13 42 54.3410233.02198033+59.42634251
HS UMa11 35 30.70316+34 52 04.1792182.78133055+72.02365152
S Crt11 52 45.09819−07 35 48.0777278.58836250+52.47912628
T UMa12 36 23.46528+59 29 12.9805126.49000574+57.53724239
RT Vir13 02 37.98146+05 11 08.3629310.35710252+67.89586116
R Hya13 29 42.78016−23 16 52.7516314.22295286+38.74981135
W Hya13 49 02.00183−28 22 03.5320318.02236925+32.81075972
RX Boo14 24 11.62532+25 42 13.394234.27734319+69.21273462
FV Boo15 08 25.74585+09 36 18.371711.02523719+53.26830107
Y Lib15 11 41.30571−06 00 41.3358353.82619033+42.58762758
S CrB15 21 23.95533+31 22 02.584949.47251423+57.17271953
S Ser15 21 39.53409+14 18 53.092220.49818439+52.78651865
U Her16 25 47.47194+18 53 32.863435.34514641+40.35085477
VX Sgr18 08 04.04428−22 13 26.60098.34412037−1.00193451
RR Aql19 57 36.06169−01 53 11.339538.91708910−15.56021367
SY Aql20 07 05.40569+12 57 06.224253.36709158−10.30777071
NML Cyg20 46 25.53928+40 06 59.464380.79837957−1.92098652
UX Cyg20 55 05.51174+30 24 52.015574.34446789−9.40792221
SV Peg22 05 42.08359+35 20 54.562688.71519934−16.28550642
IRAS 22480 + 600222 49 58.96653+60 17 56.6537108.42563749+0.89379706
R Peg23 06 39.16619+10 32 36.080885.40732079−44.56005438
R Aqr23 43 49.46343−15 17 04.176366.51685674−70.32547089
PZ Cas23 44 03.28142+61 47 22.1902115.05817858−0.04780331
R Cas23 58 24.86828+51 23 19.7130114.56083734−10.61906681
Table 2. Results of 43 sources from VLBI and Gaia DR3.
SourceSource Π VLBI Π DR 3 m G PeriodLogPMaser Π VLBI Period
Type [mas] [mas] [mag] P  [day] Ref. † Ref. ‡
SY SclMira0.75 ± 0.030.52 ± 0.129.744112.614H2Onyu11gcvs
WX PscOH/IR5.317.396602.820OHoro17gcvs
S PerSRc0.413 ± 0.017−0.50 ± 0.087.758222.915H2Oasa10gcvs
OH 138.0 + 7.2OH/IR0.52 ± 0.0914103.149OHoro17oro17
V637 PerMira0.94 ± 0.020.85 ± 0.109.041832.262H2Over20utt26
BX EriMira2.116 ± 0.1052.35 ± 0.066.771652.217H2Over20gcvs
T LepMira3.06 ± 0.043.09 ± 0.106.913682.566H2Onak14gcvs
BW CamMira0.749 ± 0.1890.96 ± 0.1111.786282.798H2Over20vsx
RW LepMira1.62 ± 0.162.54 ± 0.087.171502.176H2Okam14gcvs
BX CamMira1.73 ± 0.031.76 ± 0.1010.064402.643H2Omat20mat20
U LynMira1.27 ± 0.061.01 ± 0.088.494342.637H2Okam16agcvs
NSV 17351OH/IR0.247 ± 0.0350.09 ± 0.1512.5711223.050H20nak23nak23
VY CMaSRc0.88 ± 0.080.42 ± 0.417.359562.980H2Ocho08gcvs
OZ GemMira0.806 ± 0.0390.46 ± 0.3313.835982.777H2Oura20vsx
OH 231.8 + 4.2OH/IR0.61 ± 0.030.03 ± 0.1618.255512.741H2Over20vsx
HU PupMira0.308 ± 0.0420.29 ± 0.037.022382.377H2Over20vsx
R CncMira3.84 ± 0.293.94 ± 0.186.533622.559H2Over20gcvs
X HyaMira2.07 ± 0.052.53 ± 0.117.883002.477H2Over20vsx
R UMaMira1.97 ± 0.051.75 ± 0.097.923022.480H2Onak16gcvs
W LeoMira1.03 ± 0.020.88 ± 0.119.833922.593H2Over20gcvs
HS UMaMira2.816 ± 0.0953.20 ± 0.106.08H2Over20
S CrtSRb2.33 ± 0.132.06 ± 0.106.341552.190H2Onak08gcvs
T UMaMira0.96 ± 0.150.99 ± 0.068.652572.410H2Onak18gcvs
RT VirSRb4.417 ± 0.1344.14 ± 0.235.091552.190H2Ozha17gcvs
R HyaMira7.93 ± 0.186.74 ± 0.463.153892.590H2Over20gcvs
W HyaMira10.18 ± 2.364.093612.558OHvle03gcvs
RX BooSRb7.31 ± 0.506.42 ± 0.234.371622.210H2Okam12gcvs
FV BooMira0.97 ± 0.061.01 ± 0.0910.593142.497H2Okam16bgcvs
Y LibMira0.855 ± 0.0500.83 ± 0.089.762762.441H2Ochi19gcvs
S CrBMira2.39 ± 0.172.60 ± 0.116.863602.556OHvle07gcvs
S SerMira1.25 ± 0.040.77 ± 0.138.413722.571H2Over20gcvs
U HerMira3.76 ± 0.272.36 ± 0.086.914062.609OHvle07gcvs
VX SgrSRc0.64 ± 0.040.05 ± 0.196.137322.865H2Oxu18gcvs
RR AqlMira2.44 ± 0.071.95 ± 0.118.433962.598OHsun22gcvs
SY AqlMira1.10 ± 0.071.07 ± 0.099.363602.556H2Over20gcvs
NML CygSRc0.62 ± 0.0470.53 ± 0.3511.1512803.107H2Ozha12vsx
UX CygMira0.54 ± 0.060.70 ± 0.0910.005652.752H2Okur05gcvs
SV PegSRb3.00 ± 0.062.59 ± 0.175.671452.161H2Osud19gcvs
IRAS 22480 + 6002SRc0.400 ± 0.0250.36 ± 0.038.25H2Oima12
R PegMira2.76 ± 0.282.63 ± 0.127.603782.577H2Over20gcvs
R AqrMira4.7 ± 0.82.59 ± 0.336.713902.591SiOkam10gcvs
Mira4.59 ± 0.242.59 ± 0.336.713902.591SiOmin14gcvs
PZ CasSRc0.356 ± 0.0260.36 ± 0.046.769252.966H2Okus13vsx
R CasMira5.67 ± 1.955.74 ± 0.206.744342.637OHvle03gcvs
† Reference of VLBI parallax. nyu11: [19]; oro17: [20]; asa10: [21]; ver20: [3]; nak14: [22]; kam14: [23]; mat20: [24]; kam16a: [25]; nak23: [26]; cho08: [27]; nak18: [28] nak16: [29]; nak08: [30]; zha17: [31]; vle03: [32]; kam12: [33]; kam16b: [34]; chi19: [35]; vle07: [36]; xu18: [37]; sun22: [38]; zha12: [39]; kur05: [40]; sud19: [41]; ima12: [42]; kam10: [17]; min14: [18]; kus13: [43]. ‡ Reference for pulsation period. gcvs: General catalog of variable stars: Version GCVS 5.1 [44]; oro17: [20]; utt26: [45]; vsx: the AAVSO International Variable Star Index: VSX [46]; mat20: [24]; nak23: [26].
Table 3. Proper motion from VLBI and Gaia DR3.
Source μ x VLBI μ y VLBI μ x DR 3 μ y DR 3
[mas yr−1] [mas yr−1] [mas yr−1] [mas yr−1]
SY Scl5.57 ± 0.04−7.32 ± 0.125.72 ± 0.14−6.74 ± 0.10
WX Psc0.1 ± 0.4−7.5 ± 0.7
0.1 ± 0.6−7.5 ± 1.0
S Per−0.49 ± 0.23−1.19 ± 0.20−0.48 ± 0.07−0.47 ± 0.08
OH 138.0 + 7.20.93 ± 0.21−3.89 ± 0.53
V637 Per−0.61 ± 0.43−0.90 ± 0.370.44 ± 0.11−0.68 ± 0.08
BX Eri6.77 ± 0.35−10.79 ± 0.257.13 ± 0.06−12.75 ± 0.05
T Lep14.60 ± 0.50−35.43 ± 0.7910.02 ± 0.07−33.80 ± 0.09
BW Cam7.55 ± 1.19−19.63 ± 0.817.11 ± 0.07−18.32 ± 0.08
RW Lep5.53 ± 0.98−26.30 ± 1.4313.58 ± 0.07−28.69 ± 0.07
12.55 ± 0.59−26.92 ± 0.6813.58 ± 0.07−28.69 ± 0.07
BX Cam13.48 ± 0.14−34.30 ± 0.1814.29 ± 0.07−34.63 ± 0.10
U Lyn0.80 ± 0.57−6.00 ± 0.56−0.82 ± 0.07−6.37 ± 0.06
NSV 17351−1.19 ± 0.111.30 ± 0.19−0.03 ± 0.161.88 ± 0.19
VY CMa−2.09 ± 0.161.02 ± 0.61−2.65 ± 0.312.23 ± 0.40
OZ Gem−1.97 ± 0.32−8.69 ± 0.21−1.02 ± 0.31−9.52 ± 0.28
OH 231.8 + 4.2−4.76 ± 0.37−0.94 ± 0.62−1.41 ± 0.131.29 ± 0.14
HU Pup−1.16 ± 0.153.69 ± 0.20−1.01 ± 0.023.87 ± 0.03
R Cnc+1.24 ± 0.34−11.57 ± 0.970.63 ± 0.20−10.79 ± 0.11
X Hya−51.37 ± 0.97−15.02 ± 1.47−51.97 ± 0.10−11.37 ± 0.12
R UMa−40.77 ± 0.39−24.75 ± 0.38−40.67 ± 0.08−24.57 ± 0.08
W Leo−6.84 ± 0.09−8.65 ± 0.08−6.60 ± 0.11−8.09 ± 0.10
HS UMa−11.48 ± 0.17−10.86 ± 0.65−11.91 ± 0.08−11.54 ± 0.08
S Crt−3.17 ± 0.22−5.41 ± 0.22−3.52 ± 0.10−5.08 ± 0.07
T UMa−15.05 ± 0.06−7.18 ± 0.06
RT Vir35.2 ± 0.7−17.5 ± 0.737.04 ± 0.28−17.71 ± 0.27
R Hya−53.79 ± 1.0516.15 ± 1.83−54.21 ± 0.4711.79 ± 0.30
W Hya−44.24 ± 2.04−55.28 ± 2.93
RX Boo24.55 ± 1.06−49.67 ± 2.3819.87 ± 0.17−48.62 ± 0.18
FV Boo6.81 ± 0.141.01 ± 0.127.70 ± 0.10−0.17 ± 0.09
Y Lib−10.15 ± 2.39−15.02 ± 4.26−9.97 ± 0.10−15.05 ± 0.09
S CrB−9.06 ± 0.23−12.52 ± 0.29−10.15 ± 0.08−12.43 ± 0.10
S Ser−2.56 ± 1.425.20 ± 2.310.31 ± 0.143.23 ± 0.13
U Her−14.98 ± 0.29−9.23 ± 0.32−14.88 ± 0.07−10.23 ± 0.07
VX Sgr0.36 ± 0.76−2.92 ± 0.781.40 ± 0.20−1.07 ± 0.15
RR Aql−22.42 ± 0.19−46.69 ± 0.92−20.42 ± 0.12−47.69 ± 0.08
SY Aql12.26 ± 0.11−15.93 ± 0.2213.06 ± 0.09−16.50 ± 0.06
NML Cyg−1.55 ± 0.42−4.59 ± 0.41−1.22 ± 0.34−5.60 ± 0.36
UX Cyg−6.91 ± 0.75−12.52 ± 1.57−5.44 ± 0.07−11.14 ± 0.10
SV Peg11.59 ± 0.54−8.63 ± 0.4411.26 ± 0.12−6.94 ± 0.16
IRAS 22480 + 6002−2.58 ± 0.33−1.91 ± 0.17−3.03 ± 0.03−1.93 ± 0.03
R Peg3.60 ± 1.53−6.44 ± 0.929.82 ± 0.13−10.24 ± 0.09
R Aqr32.3 ± 0.8−29.5 ± 0.726.88 ± 0.23−30.41 ± 0.18
37.13 ± 0.47−28.62 ± 0.4426.88 ± 0.23−30.41 ± 0.18
PZ Cas−3.7 ± 0.2−2.0 ± 0.3−4.00 ± 0.05−2.00 ± 0.04
R Cas80.52 ± 2.3517.10 ± 1.7582.85 ± 0.1917.49 ± 0.2
Disclaimer/Publisher’s Note: The statements, opinions and data contained in all publications are solely those of the individual author(s) and contributor(s) and not of MDPI and/or the editor(s). MDPI and/or the editor(s) disclaim responsibility for any injury to people or property resulting from any ideas, methods, instructions or products referred to in the content.