
Automatic Segmentation of Mandible from Conventional Methods to Deep Learning—A Review


Abstract
:
1. Introduction
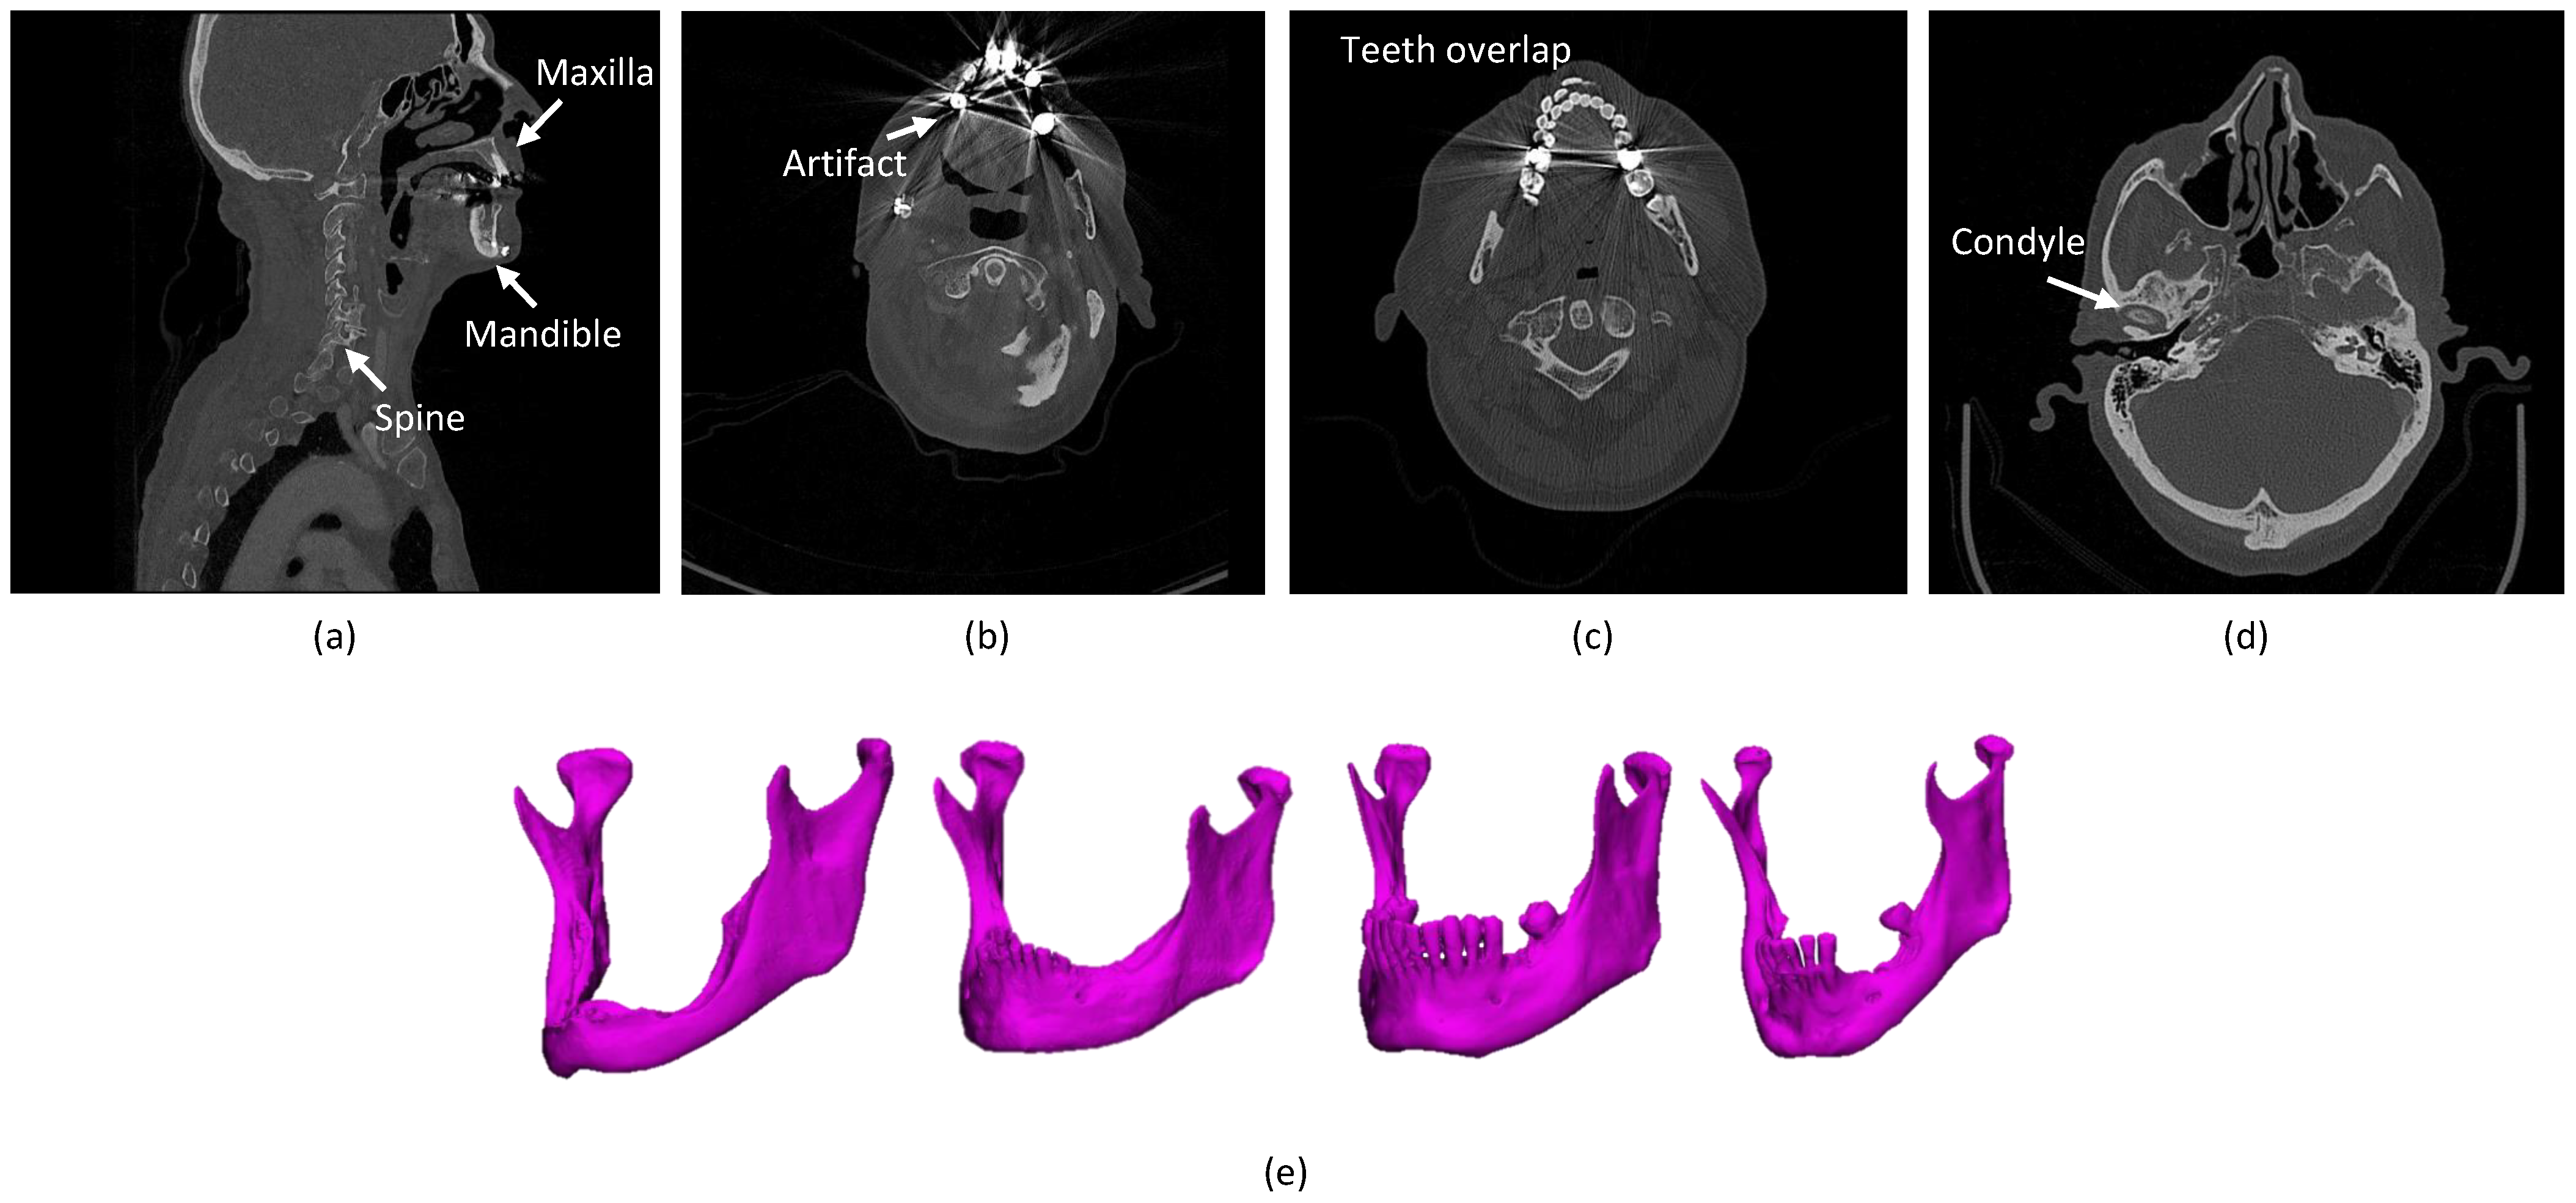
- The presence of anatomically complex bony structures in the scans. As the examples show in Figure 1a, a normal H&N scan includes other bony structures, with a complex anatomy and a similar density. Determining the correct boundaries and separating the mandibular bone from the other bones may be challenging.
- Artifacts. When X-rays pass through high-density structures or materials, including teeth, postoperative metal implants, etc., the signal on the detectors will change, which will lead to attenuation calculation errors in the (cone beam) computed tomography (CBCT/CT) reconstruction process and consequently cause high noise and strong artifacts in the visual impression of the scans [16]. The mandible boundaries nearby teeth tend to be blurred and hard to detect. In particular, the boundaries of mandible rami are difficult to be identified when dental braces and metal implants badly affect the image quality [17], as shown in Figure 1b. Furthermore, the fact that the superior and the inferior teeth are at the same slice and even overlapping that makes segmentation methods challenging, as shown in Figure 1c.
- Annotation Bias. The manual mandible segmentation often leads to inter-observer variability (Dice score of between two clinical experts) [22], which directly influences the quality of treatment planning.
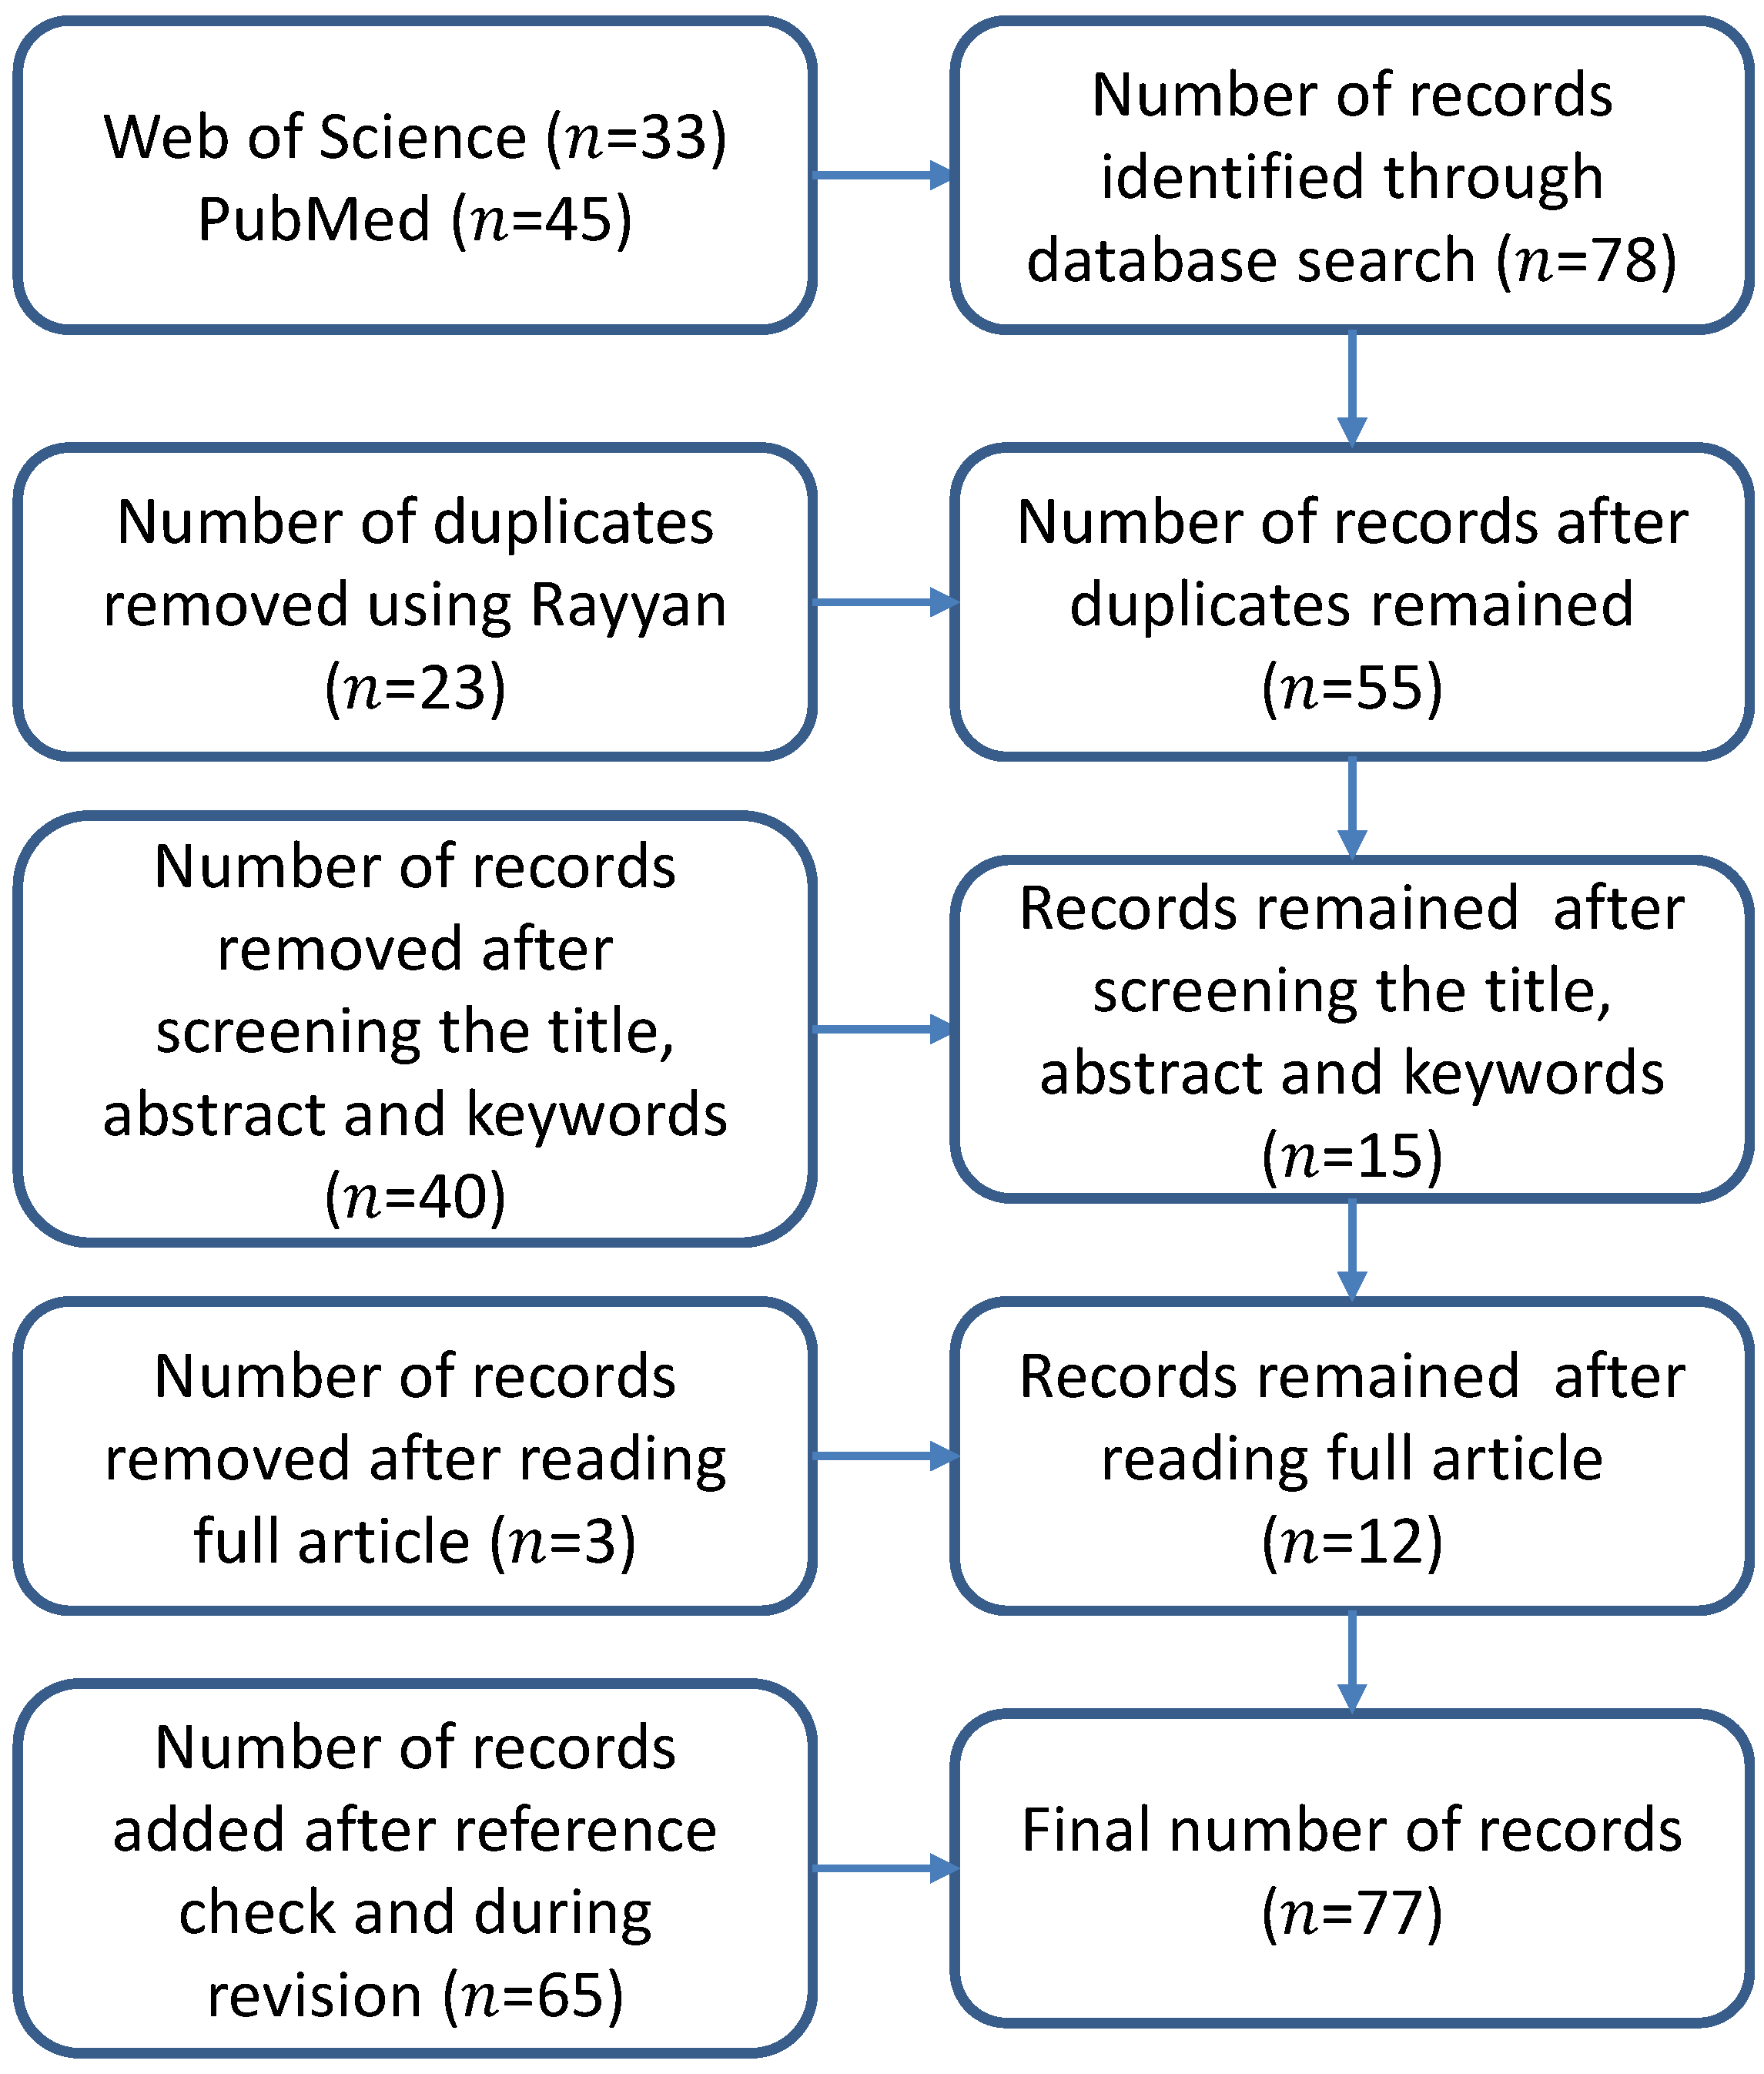
2. Method for Literature Selection
3. Results
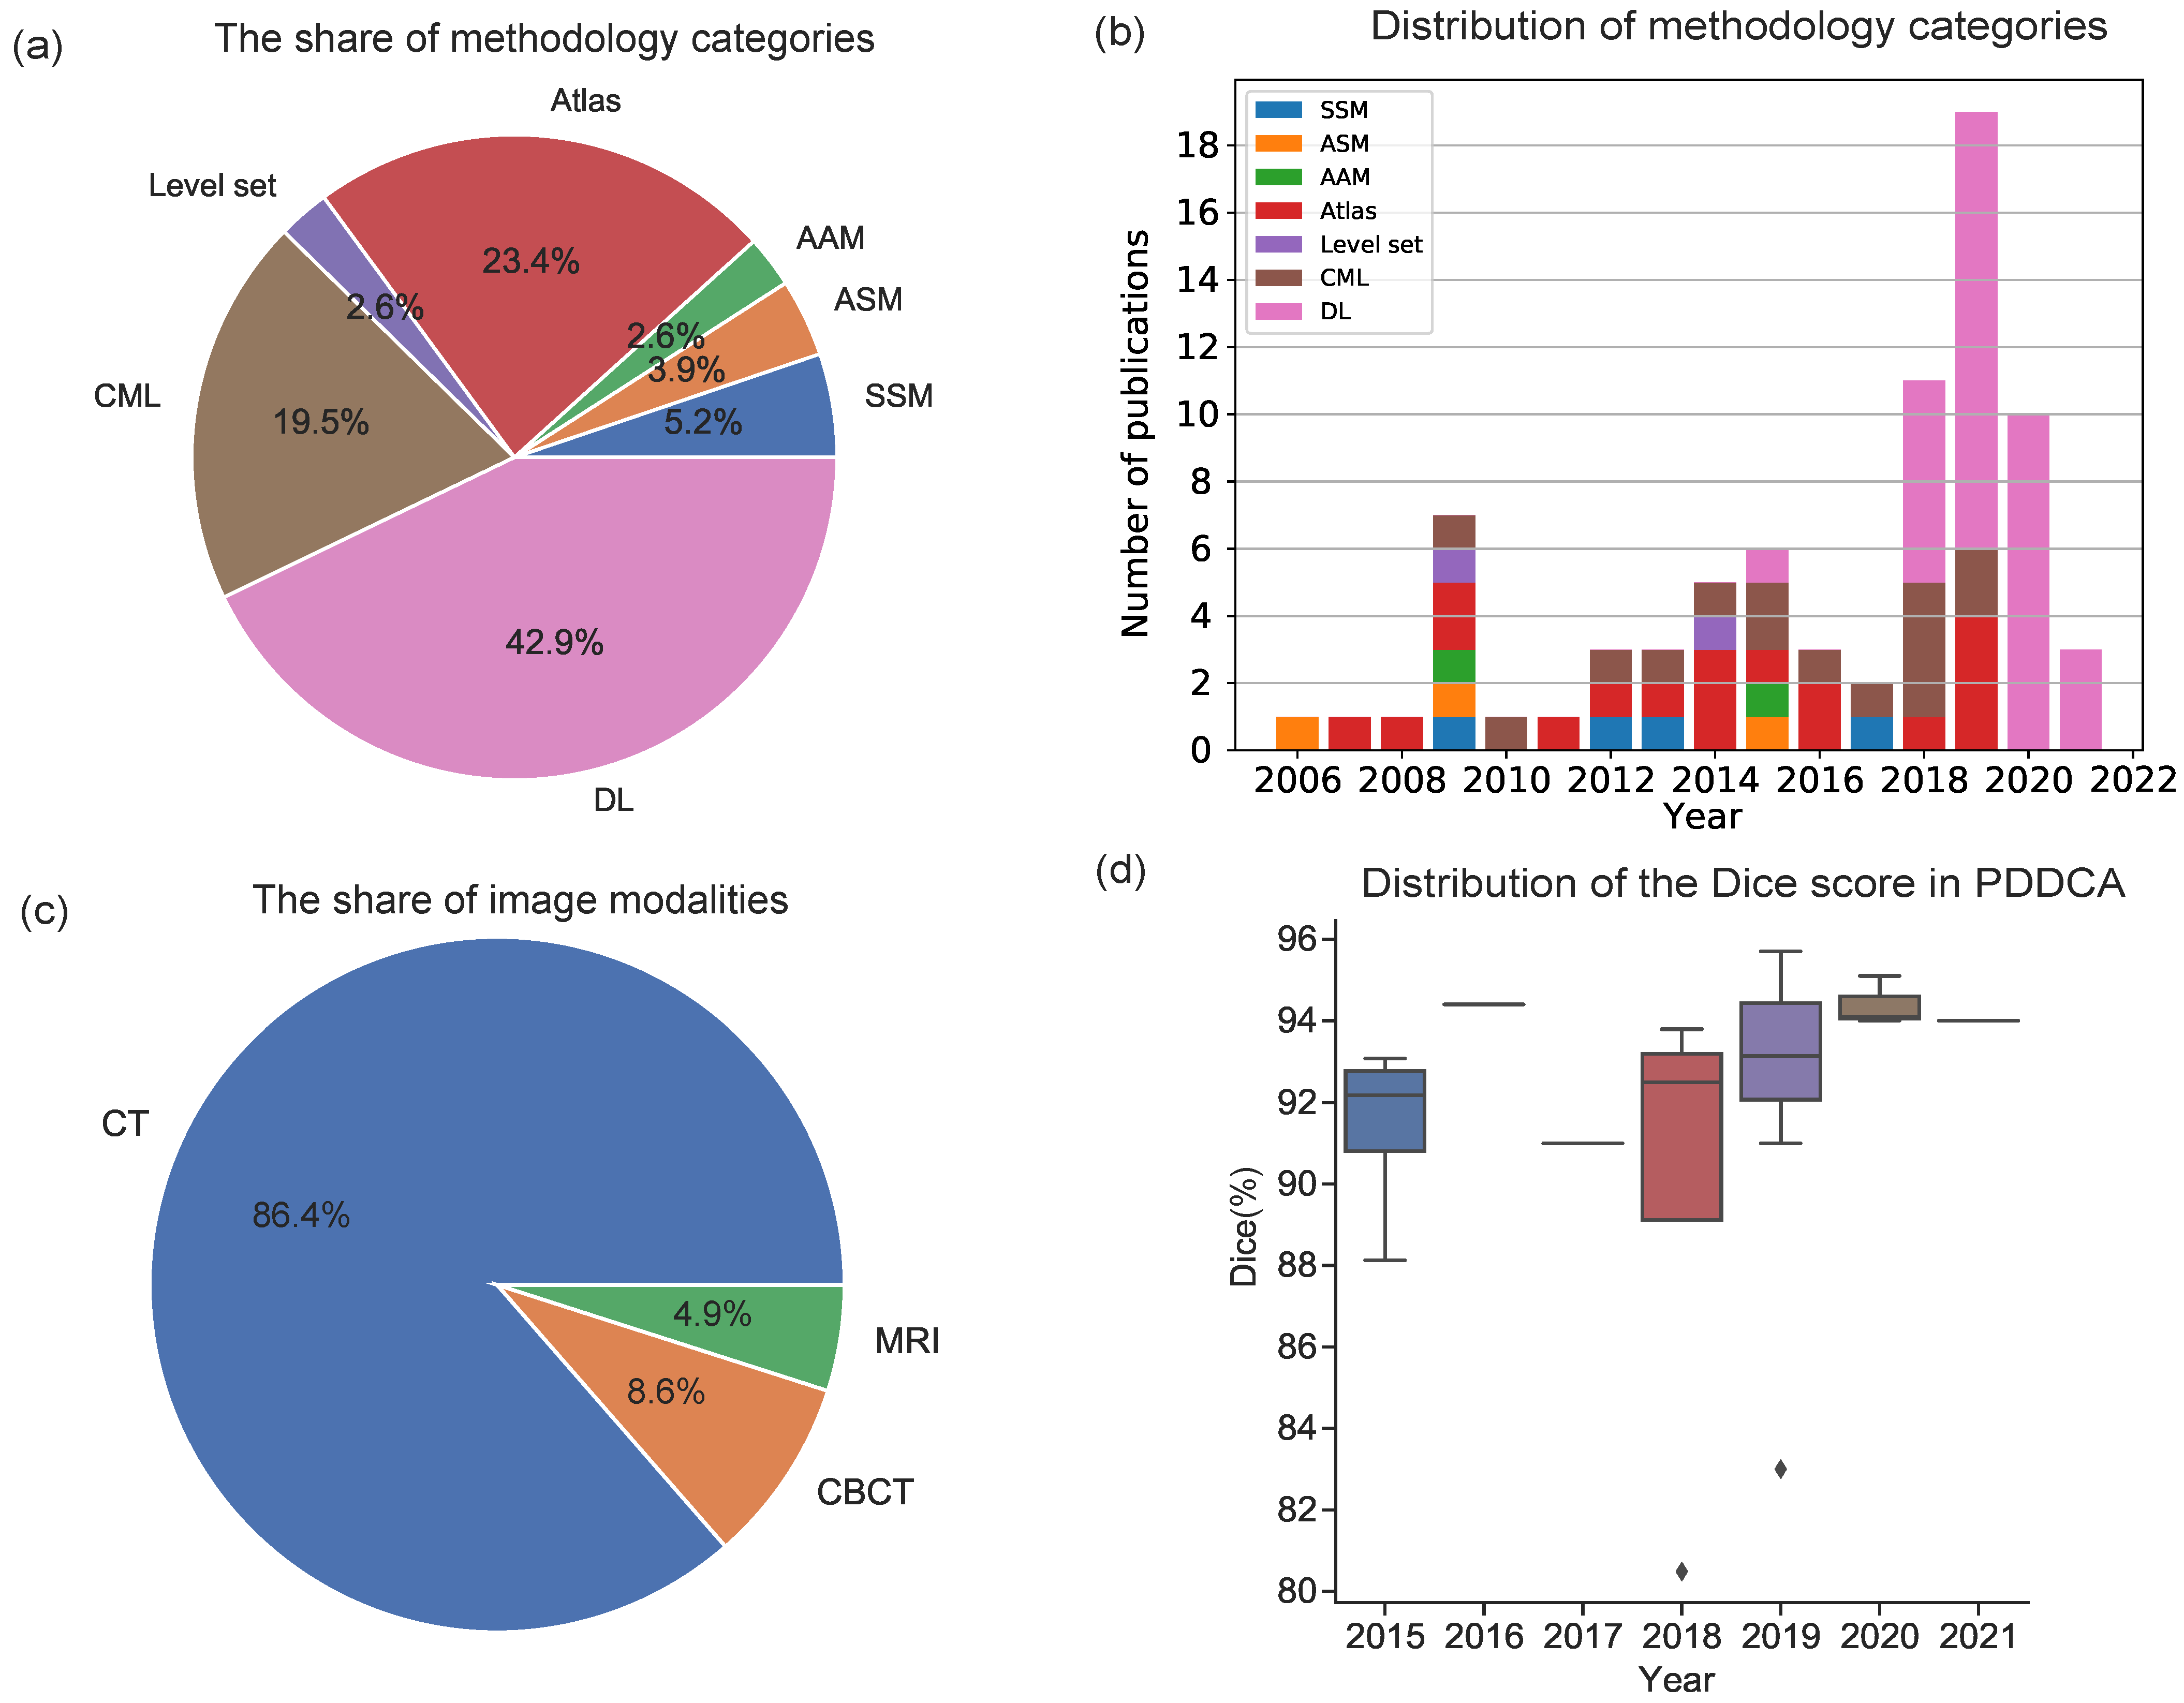
3.1. Image Modality
3.2. Image Database
3.3. Evaluation Metrics
3.4. Methodology
3.4.1. SSM-Based, ASM-Based and AAM-Based Methods
3.4.2. Atlas-Based Methods
3.4.3. Level Set-Based Methods
3.4.4. Classical Machine Learning-Based Methods
3.4.5. Deep Learning-Based Methods
4. Discussion
5. Conclusions
Author Contributions
Funding
Institutional Review Board Statement
Informed Consent Statement
Data Availability Statement
Acknowledgments
Conflicts of Interest
References
- Shah, J.P.; Gil, Z. Current concepts in management of oral cancer–surgery. Oral Oncol. 2009, 45, 394–401. [Google Scholar] [CrossRef] [Green Version]
- Ciocca, L.; Mazzoni, S.; Fantini, M.; Persiani, F.; Marchetti, C.; Scotti, R. CAD/CAM guided secondary mandibular reconstruction of a discontinuity defect after ablative cancer surgery. J. Cranio-Maxillofac. Surg. 2012, 40, e511–e515. [Google Scholar] [CrossRef] [PubMed]
- Kraeima, J. Three Dimensional Virtual Surgical Planning for Patient Specific Osteosynthesis and Devices in Oral and Maxillofacial Surgery. A New Era. Ph.D. Thesis, University of Groningen, Groningen, The Netherlands, 2019. [Google Scholar]
- Kraeima, J.; Dorgelo, B.; Gulbitti, H.; Steenbakkers, R.; Schepman, K.; Roodenburg, J.; Spijkervet, F.; Schepers, R.; Witjes, M. Multi-modality 3D mandibular resection planning in head and neck cancer using CT and MRI data fusion: A clinical series. Oral Oncol. 2018, 81, 22–28. [Google Scholar] [CrossRef]
- Qiu, B.; Guo, J.; Kraeima, J.; Glas, H.H.; Borra, R.J.; Witjes, M.J.; van Ooijen, P.M. Automatic segmentation of the mandible from computed tomography scans for 3D virtual surgical planning using the convolutional neural network. Phys. Med. Biol. 2019, 64, 175020. [Google Scholar] [CrossRef] [PubMed]
- Metzler, P.; Geiger, E.J.; Alcon, A.; Ma, X.; Steinbacher, D.M. Three-dimensional virtual surgery accuracy for free fibula mandibular reconstruction: Planned versus actual results. J. Oral Maxillofac. Surg. 2014, 72, 2601–2612. [Google Scholar] [CrossRef] [PubMed]
- Huff, T.J.; Ludwig, P.E.; Zuniga, J.M. The potential for machine learning algorithms to improve and reduce the cost of 3-dimensional printing for surgical planning. Expert Rev. Med. Devices 2018, 15, 349–356. [Google Scholar] [CrossRef]
- Wallner, J.; Hochegger, K.; Chen, X.; Mischak, I.; Reinbacher, K.; Pau, M.; Zrnc, T.; Schwenzer-Zimmerer, K.; Zemann, W.; Schmalstieg, D.; et al. Clinical evaluation of semi-automatic open-source algorithmic software segmentation of the mandibular bone: Practical feasibility and assessment of a new course of action. PLoS ONE 2018, 13, e0196378. [Google Scholar] [CrossRef] [PubMed]
- Wang, L.; Chen, K.C.; Gao, Y.; Shi, F.; Liao, S.; Li, G.; Shen, S.G.; Yan, J.; Lee, P.K.; Chow, B.; et al. Automated bone segmentation from dental CBCT images using patch-based sparse representation and convex optimization. Med. Phys. 2014, 41, 043503. [Google Scholar] [CrossRef] [Green Version]
- Heimann, T.; Meinzer, H.P. Statistical shape models for 3D medical image segmentation: A review. Med. Image Anal. 2009, 13, 543–563. [Google Scholar] [CrossRef]
- Long, J.; Shelhamer, E.; Darrell, T. Fully convolutional networks for semantic segmentation. In Proceedings of the IEEE Conference on Computer Vision and Pattern Recognition, Boston, MA, USA, 7–12 June 2015; pp. 3431–3440. [Google Scholar]
- Badrinarayanan, V.; Kendall, A.; Cipolla, R. Segnet: A deep convolutional encoder-decoder architecture for image segmentation. IEEE Trans. Pattern Anal. Mach. Intell. 2017, 39, 2481–2495. [Google Scholar] [CrossRef]
- Ronneberger, O.; Fischer, P.; Brox, T. U-net: Convolutional networks for biomedical image segmentation. In International Conference on Medical Image Computing and Computer-Assisted Intervention; Springer: Cham, Switzerland, 2015; pp. 234–241. [Google Scholar]
- Yu, F.; Koltun, V. Multi-scale context aggregation by dilated convolutions. arXiv 2015, arXiv:1511.07122. [Google Scholar]
- Garcia-Garcia, A.; Orts-Escolano, S.; Oprea, S.; Villena-Martinez, V.; Garcia-Rodriguez, J. A review on deep learning techniques applied to semantic segmentation. arXiv 2017, arXiv:1704.06857. [Google Scholar]
- Vaitiekūnas, M.; Jegelevičius, D.; Sakalauskas, A.; Grybauskas, S. Automatic Method for Bone Segmentation in Cone Beam Computed Tomography Data Set. Appl. Sci. 2020, 10, 236. [Google Scholar] [CrossRef] [Green Version]
- Hirschinger, V.; Hanke, S.; Hirschfelder, U.; Hofmann, E. Artifacts in orthodontic bracket systems in cone-beam computed tomography and multislice computed tomography. J. Orofac. Orthop. 2015, 76, 152–163. [Google Scholar] [CrossRef]
- Abdolali, F.; Zoroofi, R.A.; Abdolali, M.; Yokota, F.; Otake, Y.; Sato, Y. Automatic segmentation of mandibular canal in cone beam CT images using conditional statistical shape model and fast marching. Int. J. Comput. Assist. Radiol. Surg. 2017, 12, 581–593. [Google Scholar] [CrossRef]
- Linares, O.C.; Bianchi, J.; Raveli, D.; Neto, J.B.; Hamann, B. Mandible and skull segmentation in cone beam computed tomography using super-voxels and graph clustering. Vis. Comput. 2019, 35, 1461–1474. [Google Scholar]
- Vovk, U.; Pernus, F.; Likar, B. A review of methods for correction of intensity inhomogeneity in MRI. IEEE Trans. Med. Imaging 2007, 26, 405–421. [Google Scholar] [CrossRef]
- Bag, A.K.; Gaddikeri, S.; Singhal, A.; Hardin, S.; Tran, B.D.; Medina, J.A.; Curé, J.K. Imaging of the temporomandibular joint: An update. World J. Radiol. 2014, 6, 567. [Google Scholar] [CrossRef]
- Wallner, J.; Mischak, I.; Egger, J. Computed tomography data collection of the complete human mandible and valid clinical ground truth models. Sci. Data 2019, 6, 190003. [Google Scholar] [CrossRef] [PubMed] [Green Version]
- Ouzzani, M.; Hammady, H.; Fedorowicz, Z.; Elmagarmid, A. Rayyan—A web and mobile app for systematic reviews. Syst. Rev. 2016, 5, 210. [Google Scholar] [CrossRef] [PubMed] [Green Version]
- Nikolov, S.; Blackwell, S.; Mendes, R.; De Fauw, J.; Meyer, C.; Hughes, C.; Askham, H.; Romera-Paredes, B.; Karthikesalingam, A.; Chu, C.; et al. Deep learning to achieve clinically applicable segmentation of head and neck anatomy for radiotherapy. arXiv 2018, arXiv:1809.04430. [Google Scholar]
- Fourie, Z.; Damstra, J.; Schepers, R.H.; Gerrits, P.O.; Ren, Y. Segmentation process significantly influences the accuracy of 3D surface models derived from cone beam computed tomography. Eur. J. Radiol. 2012, 81, e524–e530. [Google Scholar] [CrossRef]
- Branstetter, I.V.B.F.; Blodgett, T.M.; Zimmer, L.A.; Snyderman, C.H.; Johnson, J.T.; Raman, S.; Meltzer, C.C. Head and neck malignancy: Is PET/CT more accurate than PET or CT alone? Radiology 2005, 235, 580–586. [Google Scholar] [CrossRef]
- Comelli, A. Fully 3D Active Surface with Machine Learning for PET Image Segmentation. J. Imaging 2020, 6, 113. [Google Scholar] [CrossRef]
- Comelli, A.; Bignardi, S.; Stefano, A.; Russo, G.; Sabini, M.G.; Ippolito, M.; Yezzi, A. Development of a new fully three-dimensional methodology for tumours delineation in functional images. Comput. Biol. Med. 2020, 120, 103701. [Google Scholar] [CrossRef] [PubMed]
- Raudaschl, P.F.; Zaffino, P.; Sharp, G.C.; Spadea, M.F.; Chen, A.; Dawant, B.M.; Albrecht, T.; Gass, T.; Langguth, C.; Lüthi, M.; et al. Evaluation of segmentation methods on head and neck CT: Auto-segmentation challenge 2015. Med. Phys. 2017, 44, 2020–2036. [Google Scholar] [CrossRef] [PubMed]
- Bosch, W.; Straube, W.; Matthews, J.; Purdy, J. Head-Neck Cetuximab. The Cancer Imaging Archive. 2015. Available online: https://wiki.cancerimagingarchive.net/display/Public/Head-Neck+Cetuximab (accessed on 23 February 2021).
- Clark, K.; Vendt, B.; Smith, K.; Freymann, J.; Kirby, J.; Koppel, P.; Moore, S.; Phillips, S.; Maffitt, D.; Pringle, M.; et al. The Cancer Imaging Archive (TCIA): Maintaining and operating a public information repository. J. Digit. Imaging 2013, 26, 1045–1057. [Google Scholar] [CrossRef] [PubMed] [Green Version]
- Tang, H.; Chen, X.; Liu, Y.; Lu, Z.; You, J.; Yang, M.; Yao, S.; Zhao, G.; Xu, Y.; Chen, T.; et al. Clinically applicable deep learning framework for organs at risk delineation in CT images. Nat. Mach. Intell. 2019, 1, 480–491. [Google Scholar] [CrossRef]
- Vallieres, M.; Kay-Rivest, E.; Perrin, L.J.; Liem, X.; Furstoss, C.; Aerts, H.J.; Khaouam, N.; Nguyen-Tan, P.F.; Wang, C.S.; Sultanem, K.; et al. Radiomics strategies for risk assessment of tumour failure in head-and-neck cancer. Sci. Rep. 2017, 7, 10117. [Google Scholar] [CrossRef] [Green Version]
- Zuley, M.L.; Jarosz, R.; Kirk, S.; Lee, Y.; Colen, R.; Garcia, K.; Aredes, N. Radiology data from the cancer genome atlas head-neck squamous cell carcinoma [TCGA-HNSC] collection. Cancer Imaging Arch. 2016, 10, K9. [Google Scholar]
- Fan, X.; Yang, J.; Cheng, L. A novel segmentation method for MR brain images based on fuzzy connectedness and FCM. In International Conference on Fuzzy Systems and Knowledge Discovery; Springer: Berlin/Heidelberg, Germany, 2005; pp. 505–513. [Google Scholar]
- Tam, C.; Yang, X.; Tian, S.; Jiang, X.; Beitler, J.; Li, S. Automated delineation of organs-at-risk in head and neck ct images using multi-output support vector regression. In Medical Imaging 2018: Biomedical Applications in Molecular, Structural, and Functional Imaging; International Society for Optics and Photonics: Bellingham, WA, USA, 2018; Volume 10578, p. 1057824. [Google Scholar]
- Gollmer, S.T.; Buzug, T.M. Fully automatic shape constrained mandible segmentation from cone-beam CT data. In Proceedings of the 2012 9th IEEE International Symposium on Biomedical Imaging (ISBI), Barcelona, Spain, 2–5 May 2012; pp. 1272–1275. [Google Scholar]
- Gollmer, S.T.; Buzug, T.M. Relaxed Statistical Shape Models for 3D Image Segmentation–Application to Mandible Bone in Cone-beam CT Data. Curr. Med. Imaging 2013, 9, 129–137. [Google Scholar] [CrossRef]
- Kainmueller, D.; Lamecker, H.; Seim, H.; Zachow, S. Multi-object segmentation of head bones. Presented at the Head and Neck Auto-Segmentation Challenge (MICCAI), London, UK, 20–24 September 2009. [Google Scholar]
- Lamecker, H.; Zachow, S.; Wittmers, A.; Weber, B.; Hege, H.; Isholtz, B.; Stiller, M. Automatic segmentation of mandibles in low-dose CT-data. Int. J. Comput. Assist. Radiol. Surg. 2006, 1, 393. [Google Scholar]
- Albrecht, T.; Gass, T.; Langguth, C.; Lüthi, M. Multi atlas segmentation with active shape model refinement for multi-organ segmentation in head and neck cancer radiotherapy planning. In Proceedings of the Head Neck Auto-Segmentation Challenge (MICCAI), Munich, Germany, 5–9 October 2015. [Google Scholar]
- Kainmueller, D.; Lamecker, H.; Seim, H.; Zinser, M.; Zachow, S. Automatic extraction of mandibular nerve and bone from cone-beam CT data. In International Conference on Medical Image Computing and Computer-Assisted Intervention; Springer: Berlin/Heidelberg, Germany, 2009; pp. 76–83. [Google Scholar]
- Mannion-Haworth, R.; Bowes, M.; Ashman, A.; Guillard, G.; Brett, A.; Vincent, G. Fully automatic segmentation of head and neck organs using active appearance models. In Proceedings of the Head Neck Auto-Segmentation Challenge (MICCAI), Munich, Germany, 5–9 October 2015. [Google Scholar]
- Babalola, K.; Cootes, T. AAM Segmentation of the Mandible and Brainstem. Presented at the Head and Neck Auto-Segmentation Challenge (MICCAI), London, UK, 20–24 September 2009. [Google Scholar]
- Chuang, Y.J.; Doherty, B.M.; Adluru, N.; Chung, M.K.; Vorperian, H.K. A novel registration-based semi-automatic mandible segmentation pipeline using computed tomography images to study mandibular development. J. Comput. Assist. Tomogr. 2018, 42, 306. [Google Scholar] [CrossRef] [PubMed]
- Mencarelli, A.; Van Beek, S.; Zijp, L.; Rasch, C.; Van Herk, M.; Sonke, J. Automatic detection system for multiple region of interest registration to account for posture changes in head and neck radiotherapy. Phys. Med. Biol. 2014, 59, 2005. [Google Scholar] [CrossRef] [PubMed]
- Chen, A.; Dawant, B. A multi-atlas approach for the automatic segmentation of multiple structures in head and neck CT images. In Proceedings of the Head Neck Auto-Segmentation Challenge (MICCAI), Munich, Germany, 5–9 October 2015. [Google Scholar]
- Han, X.; Hoogeman, M.S.; Levendag, P.C.; Hibbard, L.S.; Teguh, D.N.; Voet, P.; Cowen, A.C.; Wolf, T.K. Atlas-based auto-segmentation of head and neck CT images. In International Conference on Medical Image Computing and Computer-Assisted Intervention; Springer: Berlin/Heidelberg, Germany, 2008; pp. 434–441. [Google Scholar]
- Wang, L.; Chen, K.C.; Shi, F.; Liao, S.; Li, G.; Gao, Y.; Shen, S.G.; Yan, J.; Lee, P.K.; Chow, B.; et al. Automated segmentation of CBCT image using spiral CT atlases and convex optimization. In International Conference on Medical Image Computing and Computer-Assisted Intervention; Springer: Berlin/Heidelberg, Germany, 2013; pp. 251–258. [Google Scholar]
- Zhang, T.; Chi, Y.; Meldolesi, E.; Yan, D. Automatic delineation of on-line head-and-neck computed tomography images: Toward on-line adaptive radiotherapy. Int. J. Radiat. Oncol. Biol. Phys. 2007, 68, 522–530. [Google Scholar] [CrossRef]
- Qazi, A.A.; Pekar, V.; Kim, J.; Xie, J.; Breen, S.L.; Jaffray, D.A. Auto-segmentation of normal and target structures in head and neck CT images: A feature-driven model-based approach. Med. Phys. 2011, 38, 6160–6170. [Google Scholar] [CrossRef]
- Gorthi, S.; Duay, V.; Bach Cuadra, M.; Tercier, P.A.; Allal, A.S.; Thiran, J.P. Active Contour-Based Segmentation of Head and Neck with Adaptive Atlas Selection. Presented at the Head and Neck Auto-Segmentation Challenge (MICCAI), London, UK, 20–24 September 2009. [Google Scholar]
- Han, X.; Hibbard, L.; O’Connell, N.; Willcut, V. Automatic segmentation of head and neck CT images by GPU-accelerated multi-atlas fusion. Presented at the Head and Neck Auto-Segmentation Challenge (MICCAI), London, UK, 20–24 September 2009. [Google Scholar]
- Ayyalusamy, A.; Vellaiyan, S.; Subramanian, S.; Ilamurugu, A.; Satpathy, S.; Nauman, M.; Katta, G.; Madineni, A. Auto-segmentation of head and neck organs at risk in radiotherapy and its dependence on anatomic similarity. Radiat. Oncol. J. 2019, 37, 134. [Google Scholar] [CrossRef] [Green Version]
- Haq, R.; Berry, S.L.; Deasy, J.O.; Hunt, M.; Veeraraghavan, H. Dynamic multiatlas selection-based consensus segmentation of head and neck structures from CT images. Med. Phys. 2019, 46, 5612–5622. [Google Scholar] [CrossRef]
- Liu, Q.; Qin, A.; Liang, J.; Yan, D. Evaluation of atlas-based auto-segmentation and deformable propagation of organs-at-risk for head-and-neck adaptive radiotherapy. Recent Patents Top Imaging 2016, 5, 79–87. [Google Scholar] [CrossRef]
- Zhu, M.; Bzdusek, K.; Brink, C.; Eriksen, J.G.; Hansen, O.; Jensen, H.A.; Gay, H.A.; Thorstad, W.; Widder, J.; Brouwer, C.L.; et al. Multi-institutional quantitative evaluation and clinical validation of Smart Probabilistic Image Contouring Engine (SPICE) autosegmentation of target structures and normal tissues on computer tomography images in the head and neck, thorax, liver, and male pelvis areas. Int. J. Radiat. Oncol. Biol. Phys. 2013, 87, 809–816. [Google Scholar]
- Walker, G.V.; Awan, M.; Tao, R.; Koay, E.J.; Boehling, N.S.; Grant, J.D.; Sittig, D.F.; Gunn, G.B.; Garden, A.S.; Phan, J.; et al. Prospective randomized double-blind study of atlas-based organ-at-risk autosegmentation-assisted radiation planning in head and neck cancer. Radiother. Oncol. 2014, 112, 321–325. [Google Scholar] [CrossRef] [PubMed] [Green Version]
- McCarroll, R.E.; Beadle, B.M.; Balter, P.A.; Burger, H.; Cardenas, C.E.; Dalvie, S.; Followill, D.S.; Kisling, K.D.; Mejia, M.; Naidoo, K.; et al. Retrospective validation and clinical implementation of automated contouring of organs at risk in the head and neck: A step toward automated radiation treatment planning for low-and middle-income countries. J. Glob. Oncol. 2018, 4, 1–11. [Google Scholar] [CrossRef]
- La Macchia, M.; Fellin, F.; Amichetti, M.; Cianchetti, M.; Gianolini, S.; Paola, V.; Lomax, A.J.; Widesott, L. Systematic evaluation of three different commercial software solutions for automatic segmentation for adaptive therapy in head-and-neck, prostate and pleural cancer. Radiat. Oncol. 2012, 7, 160. [Google Scholar] [CrossRef] [PubMed] [Green Version]
- Zaffino, P.; Raudaschl, P.; Fritscher, K.; Sharp, G.C.; Spadea, M.F. Plastimatch MABS, an open source tool for automatic image segmentation. Med. Phys. 2016, 43, 5155–5160. [Google Scholar] [CrossRef] [PubMed]
- Huang, C.; Badiei, M.; Seo, H.; Ma, M.; Liang, X.; Capaldi, D.; Gensheimer, M.; Xing, L. Atlas Based Segmentations via Semi-Supervised Diffeomorphic Registrations. arXiv 2019, arXiv:1911.10417. [Google Scholar]
- Zhang, X.; Tian, J.; Wu, Y.; Zheng, J.; Deng, K. Segmentation of head and neck CT scans using atlas-based level set method. Presented at the Head and Neck Auto-Segmentation Challenge (MICCAI), London, UK, 20–24 September 2009. [Google Scholar]
- Ji, D.X.; Foong, K.W.C.; Ong, S.H. A two-stage rule-constrained seedless region growing approach for mandibular body segmentation in MRI. Int. J. Comput. Assist. Radiol. Surg. 2013, 8, 723–732. [Google Scholar] [CrossRef]
- Wang, L.; Gao, Y.; Shi, F.; Li, G.; Chen, K.C.; Tang, Z.; Xia, J.J.; Shen, D. Automated segmentation of dental CBCT image with prior-guided sequential random forests. Med. Phys. 2016, 43, 336–346. [Google Scholar] [CrossRef] [Green Version]
- Udupa, J.K.; Odhner, D.; Zhao, L.; Tong, Y.; Matsumoto, M.M.; Ciesielski, K.C.; Falcao, A.X.; Vaideeswaran, P.; Ciesielski, V.; Saboury, B.; et al. Body-wide hierarchical fuzzy modeling, recognition, and delineation of anatomy in medical images. Med. Image Anal. 2014, 18, 752–771. [Google Scholar] [CrossRef] [Green Version]
- Barandiaran, I.; Macía, I.; Berckmann, E.; Wald, D.; Dupillier, M.P.; Paloc, C.; Grana, M. An automatic segmentation and reconstruction of mandibular structures from CT-data. In International Conference on Intelligent Data Engineering and Automated Learning; Springer: Berlin/Heidelberg, Germany, 2009; pp. 649–655. [Google Scholar]
- Orbes-Arteaga, M.; Pea, D.; Dominguez, G. Head and neck auto segmentation challenge based on non-local generative models. In Proceedings of the Head Neck Auto-Segmentation Challenge (MICCAI), Munich, Germany, 5–9 October 2015. [Google Scholar]
- Wang, Z.; Wei, L.; Wang, L.; Gao, Y.; Chen, W.; Shen, D. Hierarchical vertex regression-based segmentation of head and neck CT images for radiotherapy planning. IEEE Trans. Image Process. 2018, 27, 923–937. [Google Scholar] [CrossRef]
- Qazi, A.A.; Kim, J.J.; Jaffray, D.A.; Pekar, V. Probabilistic refinement of model-based segmentation: Application to radiation therapy planning of the head and neck. In International Workshop on Medical Imaging and Virtual Reality; Springer: Berlin/Heidelberg, Germany, 2010; pp. 403–410. [Google Scholar]
- Torosdagli, N.; Liberton, D.K.; Verma, P.; Sincan, M.; Lee, J.; Pattanaik, S.; Bagci, U. Robust and fully automated segmentation of mandible from CT scans. In Proceedings of the 2017 IEEE 14th International Symposium on Biomedical Imaging (ISBI 2017), Melbourne, Australia, 18–21 April 2017; pp. 1209–1212. [Google Scholar]
- Wu, X.; Udupa, J.K.; Tong, Y.; Odhner, D.; Pednekar, G.V.; Simone, C.B.; McLaughlin, D.; Apinorasethkul, C.; Lukens, J.; Mihailidis, D.; et al. Auto-contouring via automatic anatomy recognition of organs at risk in head and neck cancer on CT images. In Medical Imaging 2018: Image-Guided Procedures, Robotic Interventions, and Modeling; International Society for Optics and Photonics: Bellingham, WA, USA, 2018; Volume 10576, p. 1057617. [Google Scholar]
- Tong, Y.; Udupa, J.K.; Wu, X.; Odhner, D.; Pednekar, G.; Simone, C.B.; McLaughlin, D.; Apinorasethkul, C.; Shammo, G.; James, P.; et al. Hierarchical model-based object localization for auto-contouring in head and neck radiation therapy planning. In Medical Imaging 2018: Biomedical Applications in Molecular, Structural, and Functional Imaging; International Society for Optics and Photonics: Bellingham, WA, USA, 2018; Volume 10578, p. 1057822. [Google Scholar]
- Wu, X.; Udupa, J.K.; Tong, Y.; Odhner, D.; Pednekar, G.V.; Simone, C.B., II; McLaughlin, D.; Apinorasethkul, C.; Apinorasethkul, O.; Lukens, J.; et al. AAR-RT—A system for auto-contouring organs at risk on CT images for radiation therapy planning: Principles, design, and large-scale evaluation on head-and-neck and thoracic cancer cases. Med. Image Anal. 2019, 54, 45–62. [Google Scholar]
- Gacha, S.J.; León, S.A.G. Segmentation of Mandibles in Computer Tomography Volumes of Patients with Foam Cells Carcinoma. In Proceedings of the 2018 IX International Seminar of Biomedical Engineering (SIB), Bogota, Colombia, 16–18 May 2018; pp. 1–7. [Google Scholar]
- Spampinato, C.; Pino, C.; Giordano, D.; Leonardi, R. Automatic 3D segmentation of mandible for assessment of facial asymmetry. In Proceedings of the 2012 IEEE International Symposium on Medical Measurements and Applications Proceedings, Budapest, Hungary, 18–19 May 2012; pp. 1–4. [Google Scholar]
- Ibragimov, B.; Xing, L. Segmentation of organs-at-risks in head and neck CT images using convolutional neural networks. Med. Phys. 2017, 44, 547–557. [Google Scholar] [CrossRef] [PubMed] [Green Version]
- Kodym, O.; Španěl, M.; Herout, A. Segmentation of Head and Neck Organs at Risk Using CNN with Batch Dice Loss. arXiv 2018, arXiv:1812.02427. [Google Scholar]
- Yan, M.; Guo, J.; Tian, W.; Yi, Z. Symmetric Convolutional Neural Network for Mandible Segmentation. Knowl. Based Syst. 2018, 159, 63–71. [Google Scholar] [CrossRef]
- Xue, J.; Wang, Y.; Kong, D.; Wu, F.; Yin, A.; Qu, J.; Liu, X. Deep hybrid neural-like P systems for multiorgan segmentation in head and neck CT/MR images. Expert Syst. Appl. 2021, 168, 114446. [Google Scholar] [CrossRef]
- Chan, J.W.; Kearney, V.; Haaf, S.; Wu, S.; Bogdanov, M.; Reddick, M.; Dixit, N.; Sudhyadhom, A.; Chen, J.; Yom, S.S.; et al. A convolutional neural network algorithm for automatic segmentation of head and neck organs at risk using deep lifelong learning. Med. Phys. 2019, 46, 2204–2213. [Google Scholar] [CrossRef] [PubMed]
- Zhu, W.; Huang, Y.; Tang, H.; Qian, Z.; Du, N.; Fan, W.; Xie, X. AnatomyNet: Deep 3D Squeeze-and-excitation U-Nets for fast and fully automated whole-volume anatomical segmentation. arXiv 2018, arXiv:1808.05238. [Google Scholar]
- Xia, W.J.; Han, W.Q.; Zhang, Y.; Wang, L.; Chai, G.; Huang, Y.J. Automatic Masseter Thickness Measurement and Ideal Point Localization for Botulinum Toxin Injection. In Proceedings of the 2019 41st Annual International Conference of the IEEE Engineering in Medicine and Biology Society (EMBC), Berlin, Germany, 23–27 July 2019; pp. 2801–2804. [Google Scholar]
- Willems, S.; Crijns, W.; Saint-Esteven, A.L.G.; Van Der Veen, J.; Robben, D.; Depuydt, T.; Nuyts, S.; Haustermans, K.; Maes, F. Clinical implementation of DeepVoxNet for auto-delineation of organs at risk in head and neck cancer patients in radiotherapy. In OR 2.0 Context-Aware Operating Theaters, Computer Assisted Robotic Endoscopy, Clinical Image-Based Procedures, and Skin Image Analysis; Springer: Berlin/Heidelberg, Germany, 2018; pp. 223–232. [Google Scholar]
- Ren, X.; Xiang, L.; Nie, D.; Shao, Y.; Zhang, H.; Shen, D.; Wang, Q. Interleaved 3D-CNN s for joint segmentation of small-volume structures in head and neck CT images. Med. Phys. 2018, 45, 2063–2075. [Google Scholar] [CrossRef] [PubMed] [Green Version]
- He, B.; Jia, F. Head and Neck CT Segmentation Based on a Combined U-Net Model. J. Integr. Technol. 2020, 9, 17–24. [Google Scholar]
- Rhee, D.J.; Cardenas, C.E.; Elhalawani, H.; McCarroll, R.; Zhang, L.; Yang, J.; Garden, A.S.; Peterson, C.B.; Beadle, B.M.; Court, L.E. Automatic detection of contouring errors using convolutional neural networks. Med. Phys. 2019, 46, 5086–5097. [Google Scholar] [CrossRef] [Green Version]
- Tong, N.; Gou, S.; Yang, S.; Cao, M.; Sheng, K. Shape constrained fully convolutional DenseNet with adversarial training for multiorgan segmentation on head and neck CT and low-field MR images. Med. Phys. 2019, 46, 2669–2682. [Google Scholar] [CrossRef]
- Xue, Y.; Tang, H.; Qiao, Z.; Gong, G.; Yin, Y.; Qian, Z.; Huang, C.; Fan, W.; Huang, X. Shape-aware organ segmentation by predicting signed distance maps. In Proceedings of the AAAI Conference on Artificial Intelligence, New York, USA, 7–12 February 2020; Volume 34, pp. 12565–12572. [Google Scholar]
- Lei, W.; Mei, H.; Sun, Z.; Ye, S.; Gu, R.; Wang, H.; Huang, R.; Zhang, S.; Zhang, S.; Wang, G. Automatic Segmentation of Organs-at-Risk from Head-and-Neck CT using Separable Convolutional Neural Network with Hard-Region-Weighted Loss. arXiv 2021, arXiv:2102.01897. [Google Scholar]
- Liang, S.; Thung, K.H.; Nie, D.; Zhang, Y.; Shen, D. Multi-View Spatial Aggregation Framework for Joint Localization and Segmentation of Organs at Risk in Head and Neck CT Images. IEEE Trans. Med. Imaging 2020, 39, 2794–2805. [Google Scholar] [CrossRef]
- Qiu, B.; Guo, J.; Kraeima, J.; Glas, H.H.; Borra, R.J.; Witjes, M.J.; Ooijen, P.M.v. Recurrent convolutional neural networks for mandible segmentation from computed tomography. arXiv 2020, arXiv:2003.06486. [Google Scholar]
- Gou, S.; Tong, N.; Qi, S.; Yang, S.; Chin, R.; Sheng, K. Self-channel-and-spatial-attention neural network for automated multi-organ segmentation on head and neck CT images. Phys. Med. Biol. 2020, 65, 245034. [Google Scholar] [CrossRef] [PubMed]
- Jiang, J.; Sharif, E.; Um, H.; Berry, S.; Veeraraghavan, H. Local block-wise self attention for normal organ segmentation. arXiv 2019, arXiv:1909.05054. [Google Scholar]
- Sun, S.; Liu, Y.; Bai, N.; Tang, H.; Chen, X.; Huang, Q.; Liu, Y.; Xie, X. AttentionAnatomy: A unified framework for whole-body organs at risk segmentation using multiple partially annotated datasets. In Proceedings of the 2020 IEEE 17th International Symposium on Biomedical Imaging (ISBI), Iowa City, IA, USA, 3–7 April 2020; pp. 1–5. [Google Scholar]
- Liu, Z.; Wang, H.; Lei, W.; Wang, G. CSAF-CNN: Cross-Layer Spatial Attention Map Fusion Network for Organ-at-Risk Segmentation in Head and Neck CT Images. In Proceedings of the 2020 IEEE 17th International Symposium on Biomedical Imaging (ISBI), Iowa City, IA, USA, 3–7 April 2020; pp. 1522–1525. [Google Scholar]
- Zhang, S.; Wang, H.; Tian, S.; Zhang, X.; Li, J.; Lei, R.; Gao, M.; Liu, C.; Yang, L.; Bi, X.; et al. A slice classification model-facilitated 3D encoder–decoder network for segmenting organs at risk in head and neck cancer. J. Radiat. Res. 2021, 62, 94–103. [Google Scholar] [CrossRef]
- Tappeiner, E.; Pröll, S.; Hönig, M.; Raudaschl, P.F.; Zaffino, P.; Spadea, M.F.; Sharp, G.C.; Schubert, R.; Fritscher, K. Multi-organ segmentation of the head and neck area: An efficient hierarchical neural networks approach. Int. J. Comput. Assist. Radiol. Surg. 2019, 14, 745–754. [Google Scholar] [CrossRef]
- Mu, G.; Yang, Y.; Gao, Y.; Feng, Q. Multi-scale 3D convolutional neural network-based segmentation of head and neck organs at risk. J. South. Med. Univ. 2020, 40, 491–498. [Google Scholar]
- Wang, Y.; Zhao, L.; Wang, M.; Song, Z. Organ at Risk Segmentation in Head and Neck CT Images Using a Two-Stage Segmentation Framework Based on 3D U-Net. IEEE Access 2019, 7, 144591–144602. [Google Scholar] [CrossRef]
- Lei, Y.; Zhou, J.; Dong, X.; Wang, T.; Mao, H.; McDonald, M.; Curran, W.J.; Liu, T.; Yang, X. Multi-organ segmentation in head and neck MRI using U-Faster-RCNN. In Medical Imaging 2020: Image Processing; International Society for Optics and Photonics: Bellingham, WA, USA, 2020; Volume 11313, p. 113133A. [Google Scholar]
- Lei, Y.; Harms, J.; Dong, X.; Wang, T.; Tang, X.; David, S.Y.; Beitler, J.J.; Curran, W.J.; Liu, T.; Yang, X. Organ-at-Risk (OAR) segmentation in head and neck CT using U-RCNN. In Medical Imaging 2020: Computer-Aided Diagnosis; International Society for Optics and Photonics: Bellingham, WA, USA, 2020; Volume 11314, p. 1131444. [Google Scholar]
- Liang, S.; Tang, F.; Huang, X.; Yang, K.; Zhong, T.; Hu, R.; Liu, S.; Yuan, X.; Zhang, Y. Deep-learning-based detection and segmentation of organs at risk in nasopharyngeal carcinoma computed tomographic images for radiotherapy planning. Eur. Radiol. 2019, 29, 1961–1967. [Google Scholar] [CrossRef]
- van Dijk, L.V.; Van den Bosch, L.; Aljabar, P.; Peressutti, D.; Both, S.; Steenbakkers, R.J.; Langendijk, J.A.; Gooding, M.J.; Brouwer, C.L. Improving automatic delineation for head and neck organs at risk by Deep Learning Contouring. Radiother. Oncol. 2020, 142, 115–123. [Google Scholar] [CrossRef] [Green Version]
- Men, K.; Geng, H.; Cheng, C.; Zhong, H.; Huang, M.; Fan, Y.; Plastaras, J.P.; Lin, A.; Xiao, Y. More accurate and efficient segmentation of organs-at-risk in radiotherapy with convolutional neural networks cascades. Med. Phys. 2019, 46, 286–292. [Google Scholar] [CrossRef] [PubMed] [Green Version]
- Egger, J.; Pfarrkirchner, B.; Gsaxner, C.; Lindner, L.; Schmalstieg, D.; Wallner, J. Fully convolutional mandible segmentation on a valid ground-truth dataset. In Proceedings of the 2018 40th Annual International Conference of the IEEE Engineering in Medicine and Biology Society (EMBC), Honolulu, HI, USA, 18–21 July 2018; pp. 656–660. [Google Scholar]
- Krzanowski, W. Principles of Multivariate Analysis; OUP Oxford: Oxford, UK, 2000; Volume 23. [Google Scholar]
- Wold, S.; Esbensen, K.; Geladi, P. Principal component analysis. Chemom. Intell. Lab. Syst. 1987, 2, 37–52. [Google Scholar] [CrossRef]
- Cootes, T.; Baldock, E.; Graham, J. An introduction to active shape models. Image Process. Anal. 2000, 328, 223–248. [Google Scholar]
- Cootes, T.F.; Edwards, G.J.; Taylor, C.J. Active appearance models. IEEE Trans. Pattern Anal. Mach. Intell. 2001, 23, 681–685. [Google Scholar] [CrossRef] [Green Version]
- Cootes, T.F.; Twining, C.J.; Petrovic, V.S.; Schestowitz, R.; Taylor, C.J. Groupwise Construction of Appearance Models using Piece-wise Affine Deformations. BMVC 2005, 5, 879–888. [Google Scholar]
- Pekar, V.; Allaire, S.; Kim, J.; Jaffray, D.A. Head and neck auto-segmentation challenge. MIDAS J. 2009, 11, 2009. [Google Scholar]
- Kass, M.; Witkin, A.; Terzopoulos, D. Snakes: Active contour models. Int. J. Comput. Vis. 1988, 1, 321–331. [Google Scholar] [CrossRef]
- Otsu, N. A threshold selection method from gray-level histograms. IEEE Trans. Syst. Man Cybern. 1979, 9, 62–66. [Google Scholar] [CrossRef] [Green Version]
- O’Mahony, N.; Campbell, S.; Carvalho, A.; Harapanahalli, S.; Hernandez, G.V.; Krpalkova, L.; Riordan, D.; Walsh, J. Deep learning vs. traditional computer vision. In Science and Information Conference; Springer: Cham, Switzerland, 2019; pp. 128–144. [Google Scholar]
- Kamnitsas, K.; Ledig, C.; Newcombe, V.F.; Simpson, J.P.; Kane, A.D.; Menon, D.K.; Rueckert, D.; Glocker, B. Efficient multi-scale 3D CNN with fully connected CRF for accurate brain lesion segmentation. Med. Image Anal. 2017, 36, 61–78. [Google Scholar] [CrossRef]
- Vaswani, A.; Shazeer, N.; Parmar, N.; Uszkoreit, J.; Jones, L.; Gomez, A.N.; Kaiser, L.; Polosukhin, I. Attention is all you need. arXiv 2017, arXiv:1706.03762. [Google Scholar]
- Oktay, O.; Schlemper, J.; Folgoc, L.L.; Lee, M.; Heinrich, M.; Misawa, K.; Mori, K.; McDonagh, S.; Hammerla, N.Y.; Kainz, B.; et al. Attention U-Net: Learning where to look for the pancreas. arXiv 2018, arXiv:1804.03999. [Google Scholar]
- Ji, Y.; Zhang, H.; Zhang, Z.; Liu, M. CNN-based encoder-decoder networks for salient object detection: A comprehensive review and recent advances. Inf. Sci. 2021, 546, 835–857. [Google Scholar] [CrossRef]
- Ren, S.; He, K.; Girshick, R.; Sun, J. Faster R-CNN: Towards real-time object detection with region proposal networks. IEEE Trans. Pattern Anal. Mach. Intell. 2016, 39, 1137–1149. [Google Scholar] [CrossRef] [Green Version]
- Milletari, F.; Navab, N.; Ahmadi, S.A. V-net: Fully convolutional neural networks for volumetric medical image segmentation. In Proceedings of the 2016 Fourth International Conference on 3D Vision (3DV), Stanford, CA, USA, 25–28 October 2016; pp. 565–571. [Google Scholar]
- Yang, J.; Veeraraghavan, H.; Armato, S.G., III; Farahani, K.; Kirby, J.S.; Kalpathy-Kramer, J.; van Elmpt, W.; Dekker, A.; Han, X.; Feng, X.; et al. Autosegmentation for thoracic radiation treatment planning: A grand challenge at AAPM 2017. Med. Phys. 2018, 45, 4568–4581. [Google Scholar] [CrossRef] [PubMed]


| Metric | Abbreviation | Definition |
|---|---|---|
| Overlap-based metrics, reported in percents (%) | ||
| Dice similarity index | Dice | |
| Sensitivity | Sen | |
| Recall | Rec | |
| Positive Predictive Value | PVV | |
| Jaccard similarity coefficient | Jac | |
| Intersection over union | IoU | |
| Specificity | Spe | |
| False positive volume fraction | FPVF | |
| False negative volume fraction | FNVF | |
| Distance-based metrics, reported in millimeters (mm) | ||
| Average symmetric surface distance | ASD | where |
| Hausdorff distance | HD | where |
| 95th-percentile Hausdorff distance | 95HD | where |
| Mean square error | MSE | , where is the boundary of the i-th OAR and is the boundary of the i-th prediction. |
| Root mean square error | RMSE | |
| Volume-based metrics, reported in percents (%) | ||
| Volume overlap error | VOE | |
| Volume error | VE | |
| Methodology Categories | Publications | Number of Publications |
|---|---|---|
| SSM-based | [18,37,38,39] | 4 |
| ASM-based | [40,41,42] | 3 |
| AAM-based | [43,44] | 2 |
| Atlas-based | [45,46,47,48,49,50,51,52,53,54,55,56,57,58,59,60,61,62] | 18 |
| Level set-based | [9,63] | 2 |
| Classical machine learning-based | [19,36,64,65,66,67,68,69,70,71,72,73,74,75,76] | 15 |
| Deep learning-based | [5,24,32,77,78,79,80,81,82,83,84,85,86,87,88,89,90,91,92,93,94,95,96,97,98,99,100,101,102,103,104,105,106] | 33 |
| Study | Year | Datasets | No. of Patients | Performance | Image Modalities | Time/ Equipment | Category | ||||
|---|---|---|---|---|---|---|---|---|---|---|---|
| Dice (%) | ASD (mm) | HD (mm) | 95HD (mm) | VOE (%) | |||||||
| Abdolali [18] | 2017 | In-house | 120 | — | — | — | CBCT | 5 min/CPU | SSM-based | ||
| Gollmer [37] | 2012 | In-house | 30 | — | — | CT | — | SSM-based | |||
| Gollmer [38] | 2013 | In-house | 30 + 6 | — | — | CT(train)/ CBCT(test) | — | SSM-based | |||
| Kainmueller [39] | 2009 | MICCAI 2009 | 18 | — | — | — | CT | 15 min/CPU | SSM-based | ||
| Lamecker [40] | 2006 | In-house | 15 | — | — | — | — | — | CT | — | ASM-based |
| Albrecht [41] | 2015 | PDDCA | 40 | — | — | — | CT | 5 min/CPU | ASM-based | ||
| Kainmueller [42] | 2009 | In-house | 106 | — | — | — | CBCT | — | ASM-based | ||
| Mannion-Haworth [43] | 2015 | PDDCA | 48 | — | — | — | CT | 30 min/CPU | AAM-based | ||
| Babalola [44] | 2009 | MICCAI 2009 | 18 | (exclude the 13th case) | — | — | — | — | CT | 17 min/CPU | AAM-based |
| Study | Year | Datasets | No. of Patients | Performance | Image Modalities | Time/ Equipment | Category | |||||
|---|---|---|---|---|---|---|---|---|---|---|---|---|
| Dice (%) | ASD (mm) | HD (mm) | 95HD (mm) | VE (%) | Sen (%)/PPV (%) | |||||||
| Chuang [45] | 2019 | In-house | 54 + 20 | — | — | — | — | — | CT | 3–8 h/CPU | Atlas-based | |
| Mencarelli [46] | 2014 | In-house | 188 | — | — | — | — | — | — | CT | — | Atlas-based |
| Chen [47] | 2015 | PDDCA | 40 | — | — | — | — | CT | 100 min/CPU | Atlas-based | ||
| Han [48] | 2008 | In-house | 10 | — | — | — | — | — | CT | 1 h/CPU | Atlas-based | |
| Wang [49] | 2014 | In-house | 13 + 30 | — | — | — | CBCT + CT | — | Atlas-based | |||
| Zhang [50] | 2007 | In-house | 7 | — | — | — | — | CT | — | Atlas-based | ||
| Qazi [51] | 2011 | In-house | 25 | — | — | — | — | CT | 12 min/CPU | Atlas-based | ||
| Gorthi [52] | 2009 | MICCAI 2009 | 18 | — | — | — | — | CT | — | Atlas-based | ||
| Han [53] | 2009 | MICCAI 2009 | 18 | — | — | — | — | CT | 1 min/GPU | Atlas-based | ||
| Ayyalusamy [54] | 2019 | In-house | 40 | — | — | — | — | CT | — | Atlas-based | ||
| Haq [55] | 2019 | In-house PDDCA | 45 32 | — | — | — | CT | — | Atlas-based | |||
| Liu [56] | 2016 | In-house | 6 | — | — | — | — | — | CT | 10 min/— | Atlas-based | |
| Zhu [57] | 2013 | In-house | 32 | — | — | — | — | CT | 11.1 min/— | Atlas-based | ||
| Walker [58] | 2014 | In-house | 40 | — | — | — | — | — | CT | 19.7 min/— | Atlas-based | |
| McCarroll [59] | 2018 | In-house | 128 | — | — | — | CT | 11.5 min/CPU | Atlas-based | |||
| La Macchia [60] | 2012 | In-house | 5 | — | — | — | / | CT | 10.6 min/CPU | Atlas-based | ||
| Zaffino [61] | 2016 | In-house | 25 | — | — | — | — | — | CT | 120 min/CPU | Atlas-based | |
| Huang [62] | 2019 | In-house | 500 | — | — | — | — | — | CT | —/GPU | Atlas-based | |
| Study | Year | Datasets | No. of Patients | Performance | Image Modalities | Time/ Equipment | Category | ||
|---|---|---|---|---|---|---|---|---|---|
| Dice (%) | ASD (mm) | HD (mm) | |||||||
| Wang [9] | 2014 | In-house | 15 | CBCT | 5 h/CPU | Level set-based | |||
| Zhang [63] | 2009 | MICCAI 2009 | 18 | — | CT | — | Level set-based | ||
| Study | Year | Datasets | No. of Patients | Performance | Image Modalities | Time/ Equipment | Category | |||||
|---|---|---|---|---|---|---|---|---|---|---|---|---|
| Dice (%) | ASD (mm) | HD (mm) | Jac (%) | FPVF/FNVF (%) | MSE/RMSE (mm) | |||||||
| Ji [64] | 2013 | In-house | 12 | — | — | — | MRI | 128 s/CPU | CML | |||
| Wang [65] | 2015 | In-house | 30 60 | — | — | — | CBCT CT | 20 min/— | CML | |||
| Udupa [66] | 2014 | In-house | 15 | — | — | — | / | — | MRI | 54 s/CPU | CML | |
| Linares [19] | 2019 | In-house | 16 | — | — | — | — | CBCT | 5 min/CPU | CML | ||
| Barandiaran [67] | 2009 | In-house | 12 | — | — | — | — | — | — | CT | 10 s/CPU | CML |
| Orbes-Arteaga [68] | 2015 | PDDCA | 40 | — | — | — | — | — | CT | — | CML | |
| Wang [69] | 2016 | PDDCA | 48 | — | — | — | — | CT | —/CPU | CML | ||
| Qazi [70] | 2010 | In-house | 25 | — | — | — | — | — | CT | 3 min/CPU | CML | |
| Torosdagli [71] | 2017 | PDDCA | 40 | — | <1.00 | — | — | — | CT | —/CPU | CML | |
| Wu [72] | 2018 | In-house | 216 | — | — | — | — | CT | — | CML | ||
| Tam [36] | 2018 | In-house | 56 | — | — | — | — | / | CT | 1 s/CPU | CML | |
| Tong [73] | 2018 | In-house | 246 | — | — | — | — | — | — | CT | — | CML |
| Wu [74] | 2019 | In-house | 216 | — | — | — | — | — | CT | 30 s/CPU | CML | |
| Gacha [75] | 2018 | PDDCA | 30 | — | — | — | — | — | CT | — | CML | |
| Spampinato [76] | 2012 | In-house | 10 | — | — | — | — | — | — | CT | — | CML |
| Study | Year | Datasets | No. of Patients | Performance | Image Modalities | Time/ Equipment | Category | |||
|---|---|---|---|---|---|---|---|---|---|---|
| Dice (%) | ASD (mm) | HD (mm) | IoU (%) | |||||||
| Ibragimov [77] | 2015 | In-house | 50 | — | — | — | CT | 4 min/GPU | DL | |
| Kodym [78] | 2019 | PDDCA | 35 | — | — | CT | — | DL | ||
| Yan [79] | 2018 | In-house | 93 | — | — | CT | —/GPU | DL | ||
| Xue [80] | 2021 | PDDCA | 48 | — | CT | —/GPU | DL | |||
| Study | Year | Datasets | No. of Patients | Performance | Image Modalities | Time/ Equipment | Category | ||||||
|---|---|---|---|---|---|---|---|---|---|---|---|---|---|
| Dice (%) | ASD (mm) | HD (mm) | 95HD (mm) | Rec/Sen (%) | RMSE (mm) | PPV (%) | |||||||
| Chan [81] | 2019 | In-house | 200 | — | — | — | — | — | CT | 20 s/GPU | DL | ||
| Zhu [82] | 2019 | PDDCA + TCIA | 48 + 223 | — | — | — | — | — | — | CT | 0.12 s/GPU | DL | |
| Xia [83] | 2019 | In-house | 53 | — | — | — | — | CT | 1 s/GPU | DL | |||
| Willems [84] | 2018 | In-house | 70 | — | — | — | — | CT | 1 min/GPU | DL | |||
| Ren [85] | 2018 | PDDCA | 48 | ; | — | — | — | — | — | CT | —/GPU | DL | |
| He [86] | 2020 | StructSeg2019 | 50 | ; | — | — | — | — | — | — | CT | 1 min/GPU | DL |
| Rhee [87] | 2019 | In-house + TCIA | 1403 + 24 | — | — | — | — | — | CT | 2 min/GPU | DL | ||
| Nikolov [24] | 2018 | In-house TCIA PDDCA | 459 30 15 | — | — | — | — | — | — | CT | —/GPU | DL | |
| Tong [88] | 2019 | PDDCA In-house | 32 25 | — | — | CT MRI | 14 s/GPU | DL | |||||
| Xue [89] | 2019 | PDDCA | 48 | — | — | — | — | — | CT | —/GPU | DL | ||
| Study | Year | Datasets | No. of Patients | Performance | Image Modalities | Time/ Equipment | Category | |||
|---|---|---|---|---|---|---|---|---|---|---|
| Dice (%) | ASD (mm) | 95HD (mm) | RMSE (mm) | |||||||
| Qiu [5] | 2019 | In-house PDDCA | 109 40 | — | — | — | CT | 2.5 min/GPU | DL | |
| Lei [90] | 2021 | StructSeg2019 | 50 | ; | — | ; | — | CT | 2 min/GPU | DL |
| StructSeg2019 + PDDCA + In-house | 50 + 48 + 67 | |||||||||
| Liang [91] | 2020 | PDDCA In-house | 48 96 | ; | ; | — | — | CT | —/GPU | DL |
| Qiu [92] | 2020 | In-house PDDCA | 109 40 | — | CT | 1.5 min/GPU | DL | |||
| Study | Year | Datasets | No. of Patients | Performance | Image Modalities | Time/ Equipment | Category | ||||
|---|---|---|---|---|---|---|---|---|---|---|---|
| Dice (%) | ASD (mm) | 95HD (mm) | Rec/Sen (%) | PPV (%) | |||||||
| Gou [93] | 2020 | PDDCA | 48 | CT | 2 s/GPU | DL | |||||
| Jiang [94] | 2019 | In-house + PDDCA | 48 + 48 | (trained in in-house dataset) | — | — | — | — | CT | 0.1 s/GPU | DL |
| Sun [95] | 2020 | In-house | 129 | — | — | — | — | CT | —/GPU | DL | |
| Liu [96] | 2020 | StructSeg2019 | 50 | ; | — | — | — | — | CT | —/GPU | DL |
| Study | Year | Datasets | No. of Patients | Performance | Image Modalities | Time/ Equipment | Category | ||
|---|---|---|---|---|---|---|---|---|---|
| Dice (%) | HD (mm) | 95HD (mm) | |||||||
| Zhang [97] | 2021 | In-house | 170 | — | CT | 40.1 s/GPU | DL | ||
| Tappeiner [98] | 2019 | PDDCA | 40 | — | CT | 38.3 s/GPU | DL | ||
| Mu [99] | 2020 | In-house | 50 | ; | — | — | CT | 3 s/GPU | DL |
| Wang [100] | 2018 | PDDCA | 48 | — | CT | 6 s/GPU | DL | ||
| Tang [32] | 2019 | In-house HNC+ HNPETCT PDDCA | 175 35 + 105 48 | — | — | CT | 2 s/GPU | DL | |
| Lei [101] | 2020 | In-house | 15 | — | — | MRI | — | DL | |
| Lei [102] | 2020 | In-house | 15 | — | — | CT | — | DL | |
| Liang [103] | 2019 | In-house | 185 | ; | — | — | CT | 30 s/GPU | DL |
| Dijk [104] | 2020 | In-house | 693 | — | CT | — | DL | ||
| Men [105] | 2019 | HNSCC | 100 | — | CT | 5.5 min/GPU | DL | ||
| Egger [106] | 2018 | In-house | 20 | — | — | CT | —/CPU | DL | |
Publisher’s Note: MDPI stays neutral with regard to jurisdictional claims in published maps and institutional affiliations. |
© 2021 by the authors. Licensee MDPI, Basel, Switzerland. This article is an open access article distributed under the terms and conditions of the Creative Commons Attribution (CC BY) license (https://creativecommons.org/licenses/by/4.0/).
Share and Cite
Qiu, B.; van der Wel, H.; Kraeima, J.; Glas, H.H.; Guo, J.; Borra, R.J.H.; Witjes, M.J.H.; van Ooijen, P.M.A. Automatic Segmentation of Mandible from Conventional Methods to Deep Learning—A Review. J. Pers. Med. 2021, 11, 629. https://doi.org/10.3390/jpm11070629
Qiu B, van der Wel H, Kraeima J, Glas HH, Guo J, Borra RJH, Witjes MJH, van Ooijen PMA. Automatic Segmentation of Mandible from Conventional Methods to Deep Learning—A Review. Journal of Personalized Medicine. 2021; 11(7):629. https://doi.org/10.3390/jpm11070629
Chicago/Turabian StyleQiu, Bingjiang, Hylke van der Wel, Joep Kraeima, Haye Hendrik Glas, Jiapan Guo, Ronald J. H. Borra, Max Johannes Hendrikus Witjes, and Peter M. A. van Ooijen. 2021. "Automatic Segmentation of Mandible from Conventional Methods to Deep Learning—A Review" Journal of Personalized Medicine 11, no. 7: 629. https://doi.org/10.3390/jpm11070629
APA StyleQiu, B., van der Wel, H., Kraeima, J., Glas, H. H., Guo, J., Borra, R. J. H., Witjes, M. J. H., & van Ooijen, P. M. A. (2021). Automatic Segmentation of Mandible from Conventional Methods to Deep Learning—A Review. Journal of Personalized Medicine, 11(7), 629. https://doi.org/10.3390/jpm11070629