Article

Predicting 1-Year Mortality after Hip Fracture Surgery: An Evaluation of Multiple Machine Learning Approaches

by
Maximilian Peter Forssten
1,2,
Gary Alan Bass
2,3,
Ahmad Mohammad Ismail
1,2,
Shahin Mohseni
2,4 and
Yang Cao
5,*
1
Department of Orthopedic Surgery, Orebro University Hospital, 701 85 Orebro, Sweden
2
School of Medical Sciences, Orebro University, 702 81 Orebro, Sweden
3
Division of Traumatology, Emergency Surgery and Surgical Critical Care, University of Pennsylvania, Philadelphia, PA 19104, USA
4
Division of Trauma and Emergency Surgery, Department of Surgery, Orebro University Hospital, 701 85 Orebro, Sweden
5
Clinical Epidemiology and Biostatistics, School of Medical Sciences, Orebro University, 702 81 Orebro, Sweden
*
Author to whom correspondence should be addressed.
J. Pers. Med. 2021, 11(8), 727; https://doi.org/10.3390/jpm11080727
Submission received: 21 June 2021 / Revised: 24 July 2021 / Accepted: 24 July 2021 / Published: 27 July 2021
(This article belongs to the Special Issue Application of Artificial Intelligence in Personalized Medicine)

Abstract

:
Postoperative death within 1 year following hip fracture surgery is reported to be up to 27%. In the current study, we benchmarked the predictive precision and accuracy of the algorithms support vector machine (SVM), naïve Bayes classifier (NB), and random forest classifier (RF) against logistic regression (LR) in predicting 1-year postoperative mortality in hip fracture patients as well as assessed the relative importance of the variables included in the LR model. All adult patients who underwent primary emergency hip fracture surgery in Sweden, between 1 January 2008 and 31 December 2017 were included in the study. Patients with pathological fractures and non-operatively managed hip fractures, as well as those who died within 30 days after surgery, were excluded from the analysis. A LR model with an elastic net regularization were fitted and compared to NB, SVM, and RF. The relative importance of the variables in the LR model was then evaluated using the permutation importance. The LR model including all the variables demonstrated an acceptable predictive ability on both the training and test datasets for predicting one-year postoperative mortality (Area under the curve (AUC) = 0.74 and 0.74 respectively). NB, SVM, and RF tended to over-predict the mortality, particularly NB and SVM algorithms. In contrast, LR only over-predicted mortality when the predicted probability of mortality was larger than 0.7. The LR algorithm outperformed the other three algorithms in predicting 1-year postoperative mortality in hip fracture patients. The most important predictors of 1-year mortality were the presence of a metastatic carcinoma, American Society of Anesthesiologists(ASA) classification, sex, Charlson Comorbidity Index (CCI) ≤ 4, age, dementia, congestive heart failure, hypertension, surgery using pins/screws, and chronic kidney disease.

1. Introduction

Some patient-level evidence exists associating comorbidity burden with short-term survival after hip fracture surgery [1]. Postoperative death within 1 year following hip fracture surgery is also relatively common, with reported estimates up to 27% [2,3]. Thus, given the per annum denominator of approximately 18,000 hip fractures, this disease accrues excess morbidity, mortality and an annual direct cost of approximately 1.5 billion SEK (175 million USD/147 million EUR) to the Swedish healthcare system [4,5,6]. Costs are predicted to increase with an ageing population [7].
There is a potential utility in outcome prediction, particularly in better matching perioperative resources to this population’s needs. The logistic regression (LR) method of prediction is well-known to researchers and surgeons, and our recent work demonstrated that convolutional neural networks do not outperform LR in predicting 30-day postoperative mortality in hip fracture patients [8]. There are, however, other viable alternatives that should be explored. Support vector machines (SVM), for example, have been shown to require fewer variables than LR to achieve a lower, or equivalent, misclassification rate [9]. A naïve Bayes classifier (NB) offers speed advantages when fitting the model [10], while random forest classifiers (RF) often outperform LR in feature-rich datasets [11]. In the current study, we benchmarked the predictive precision and accuracy of SVM, NB, and RF against LR in predicting 1-year postoperative mortality in hip fracture patients as well as compared the relative importance of the variables included in the LR model.

2. Materials and Methods

2.1. Study Population

The principles of the Transparent reporting of a multivariable prediction model for individual prognosis or diagnosis (TRIPOD) guidelines were adhered to while conducting this study (Table S1). We used the high-fidelity Swedish National Quality Register for Hip Fracture Patients, RIKSHOFT, to identify a study population composed of all adult patients (18 years or older) who underwent primary emergency hip fracture surgery in Sweden, between 1 January 2008 and 31 December 2017 [12]. Patients with pathological fractures and non-operatively managed hip fractures, as well as those who died within 30 days after surgery, were excluded from the current analysis. Studying the association between the variables included in the prediction models and mortality in the first year, conditional on patients surviving 30 days or more after surgery, allows for the evaluation of the long-term association between the potential predictors and mortality, in isolation. This may reduce the effect of short-term mortality due to surgical and anesthesiologic complications as well as the higher degree of advanced directives present in the study population compared to the general population.
The selected patients were cross referenced with the Swedish National Patient and Cause of Death registers maintained by the Swedish National Board of Health and Welfare to retrieve comorbidity and mortality data. Variables used in the prediction model include survival status one year after surgery, age, sex, American Society of Anesthesiologists (ASA) classification, age-adjusted Charlson Comorbidity Index (CCI) [13], Revised Cardiac Risk Index (RCRI) [14], concurrent comorbidities (arrhythmia, hypertension, myocardial infarction, congestive heart failure, cerebrovascular disease, chronic obstructive pulmonary disease, connective tissue disease, dementia, diabetes mellitus, liver disease, hemiplegia, chronic kidney disease, local tumor, metastatic carcinoma, peptic ulcer disease), type of fracture, and surgical procedure performed.

2.2. Descriptive Analysis

Continuous variables were presented as a mean ± standard deviation (SD), and the ordered and nominal variables were presented as a count and percentage. The Pearson’s chi-squared test was used to test the statistical significance of differences between groups for categorical variables, while the Student’s t-test and Mann–Whitney U test were used for continuous variables [15,16,17]. Missing values were imputed using the chained method with the nearest neighbor algorithm [18,19]. Two-tailed p-values < 0.05 were considered statistically significant.

2.3. Predictive Models

A LR model with an elastic net regularization (the final ratio of L1 penalty: L2 penalty = 0.5:0.5 based on the random search) was used in the current study [20,21]. Two LR models were constructed, one including all the included variables and the other including the 10 most important variables. The relative importance of the variables was evaluated using the permutation importance (PI) [22]. PI was measured by looking at how much a predefined performance metric (in the current study Youden’s index, i.e., the sum of sensitivity and specificity minus 1, was used) is impacted by missing specific variable data [23]. To mask the information of a variable during evaluation, instead of removing the variable from the dataset, the PI method replaces it with random noise from other participants by shuffling the values of the variable. The relative importance of a variable was then calculated as the decrease in Youden’s index of the variable relative to the range of the decreases of all the variables [22]. LR was also compared with three other commonly used supervised classification algorithms, i.e., NB, SVM, and RF, and presented using a calibration plot. NB is a probabilistic classifier based on applying Bayes’ theorem with strong (naïve) independence assumptions between the variables. It can be trained very efficiently in a supervised learning setting. SVM is an algorithm aiming to find a hyperplane in an N-dimensional space (N is the number of variables) that may distinctly classify the data points. RF is an ensemble learning method for classification, regression and other tasks that operates by constructing a multitude of decision trees at training time. For classification tasks, the output of RF is the class selected by most trees [24,25,26,27].

2.4. Data Normalization and Model Construction

Multinomial variables were converted into multiple binary variables before entering the models. Ordinal and continuous variables were normalized using the min–max transformation to have values between 0 and 1 [28]. Eighty percent of the randomly selected patients were used as a training dataset to train the LR models. During the model training stage, K-fold cross-validation was used [29]. The training dataset was randomly split into five equal partitions, which instantiated five identical model building and validation processes. The LR models were built on four partitions while the predictive ability was evaluated using the remaining partition. The predictive ability of the models and importance of the variables based on the training dataset were calculated as the average over the five validations. The remaining 20% of the patients were used as a test dataset to provide an unbiased evaluation of the final models’ fit on the training dataset.
Because tuning of hyperparameters, which define the model architecture, is an important issue for model optimization, during the model training, we used the recommended random search method to find the optimal hyperparameters for the compared machine learning algorithms, including the penalty parameters for the LR models. The method searches the hyperparameters based on presumptive distributions (both Gaussian distribution and uniform distribution were implemented in the current study) from which values may be randomly sampled. The method is able to find the optimized models within a small fraction of the computation time that are as good as or better than those based on the exhaustive grid search method [30].

2.5. Metrics of Predictive Ability

Given that our prediction task was a binary classification question, i.e., whether the patient would die or survive, we used the threshold-dependent metrics, including overall accuracy, sensitivity, specificity, to evaluate the performance of the LR models [31]. In the current study, we reported the accuracy, specificity, and sensitivity at the threshold that maximized the Youden index (or sensitivity + specificity −1) [32]. The receiver operating characteristic (ROC) curve and the area under the ROC curve (AUC) with 95% confidence interval (CI) were also reported based on the model-predicted probabilities. The boundaries for acceptable, good, and great predictive models were defined as an AUC value greater than 0.7, 0.8, and 0.9, respectively [33].
The descriptive analysis was conducted in R 4.0.3 (R Foundation for Statistical Computing, Vienna, Austria, https://www.r-project.org (accessed on 9 May 2021)). The creation of the machine learning models and calculation of each model’s predictive ability along with the PI were performed in Python 3.7 (Python Software Foundation, https://www.python.org (accessed on 9 May 2021)) using the Scikit-learn 0.24 and ELI5 0.11.0 packages.

3. Results

3.1. Patient Demographics

We identified 124,707 traumatic hip fracture cases who survived beyond 30 days after their operation, of whom 21,045 (16.9%) died within the 1-year postoperative period. The patients who died were on average older and more often male. Patients who died tended to have a higher comorbidity burden (CCI ≥ 7: 31.2% vs. 14.3%, p < 0.001), were less fit for surgery based on their ASA classification (ASA ≥ 3: 74.9% vs. 53.0%), and had a higher cardiac risk (RCRI ≥ 2: 20.5% vs. 10.7%, p < 0.001) [1]. All comorbidities were more prevalent among patients who died except for hypertension and connective tissue disease (Table 1).

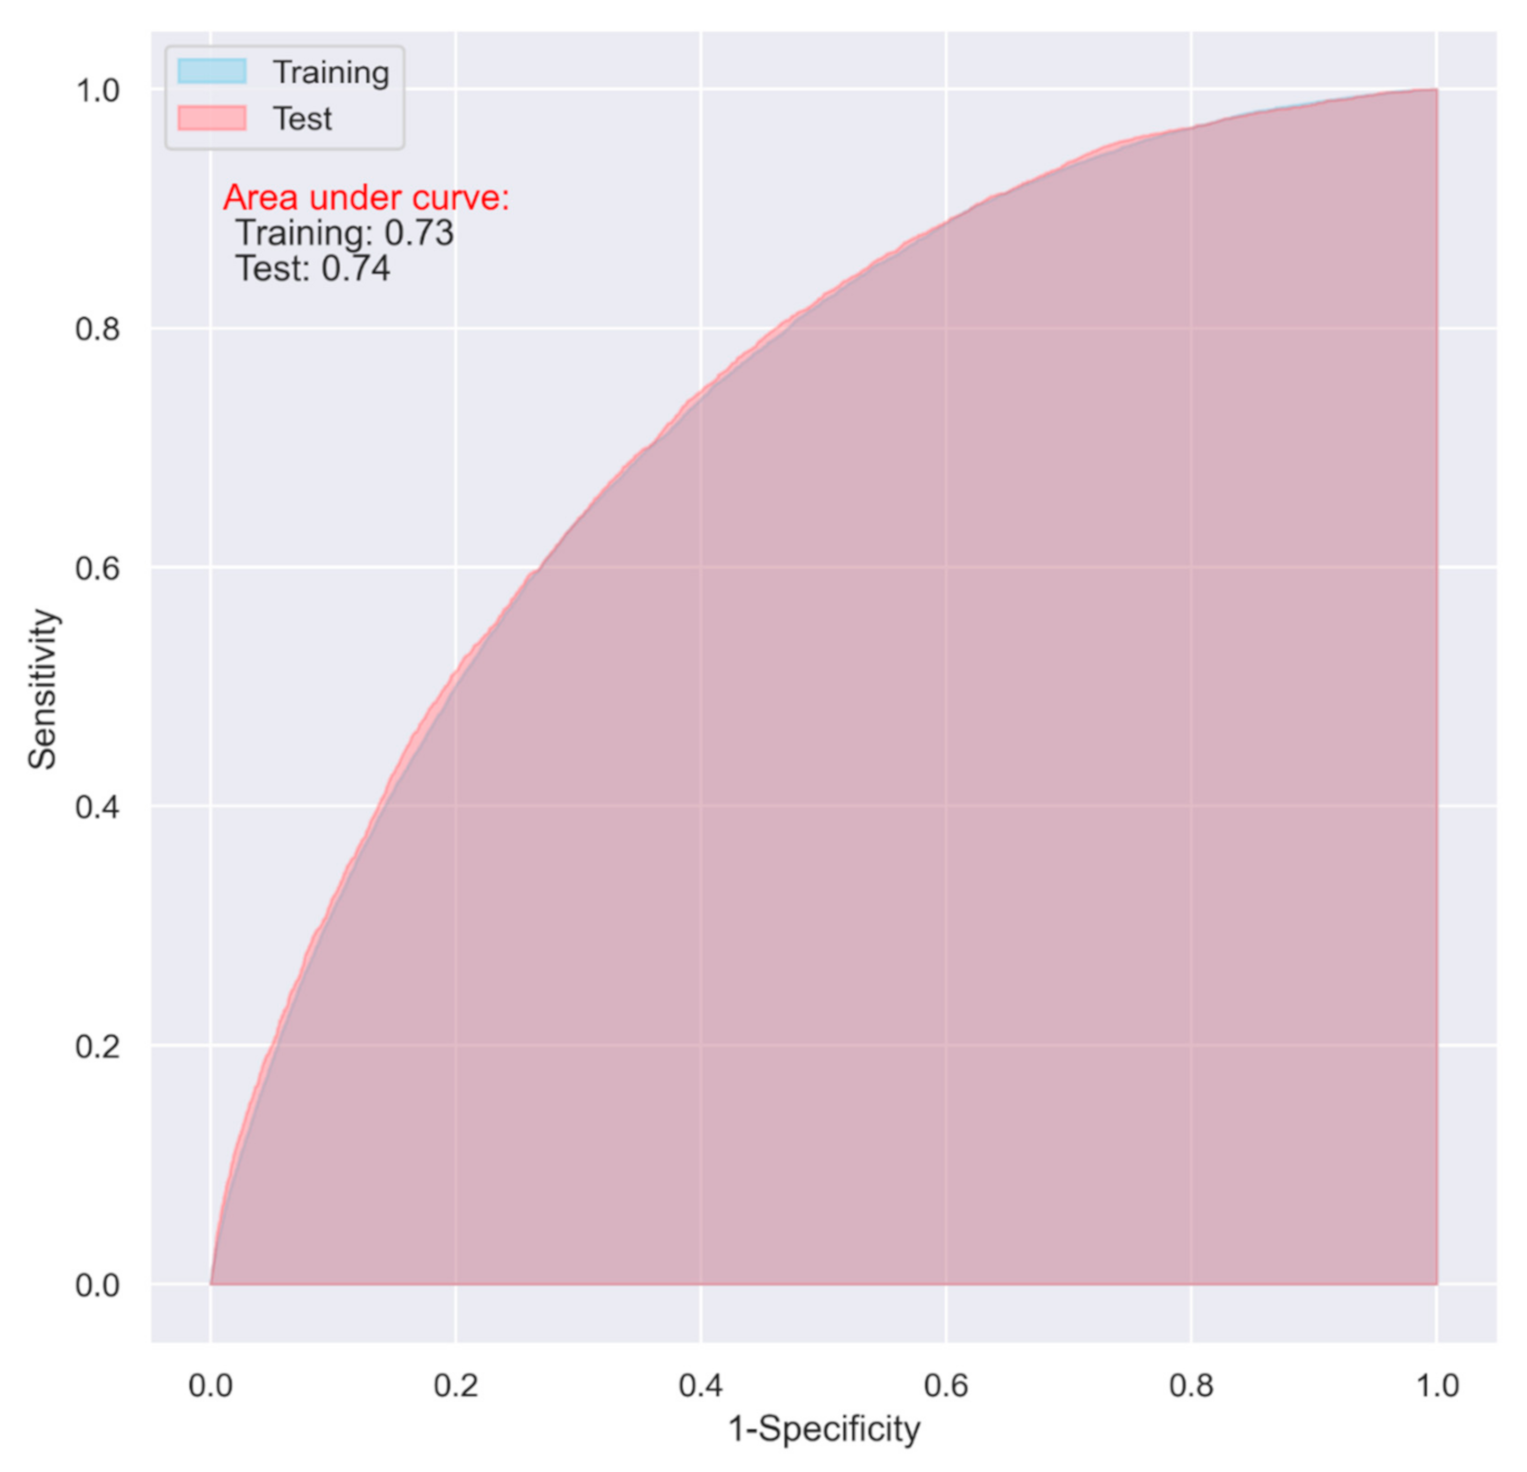
3.2. Predictive Performance of the LR Models

The relative importance of the variables in predicting one-year postoperative mortality based on the LR algorithm and cross-validation using the training dataset is shown in Figure 1. The 10 most important variables were: metastatic carcinoma, ASA classification, sex, CCI ≤ 4, age, dementia, congestive heart failure, hypertension, surgery using pins/screws, and chronic kidney disease.
The LR model including all the variables demonstrated an acceptable predictive ability on both the training and test datasets for predicting one-year postoperative mortality (AUC = 0.74 and 0.74 respectively) (Figure 2, Table 2). When including only the top ten most important variables, the model still achieved an acceptable predictive ability on both the training and test datasets (AUC = 0.73 and 0.74 respectively) (Figure 3, Table 2)

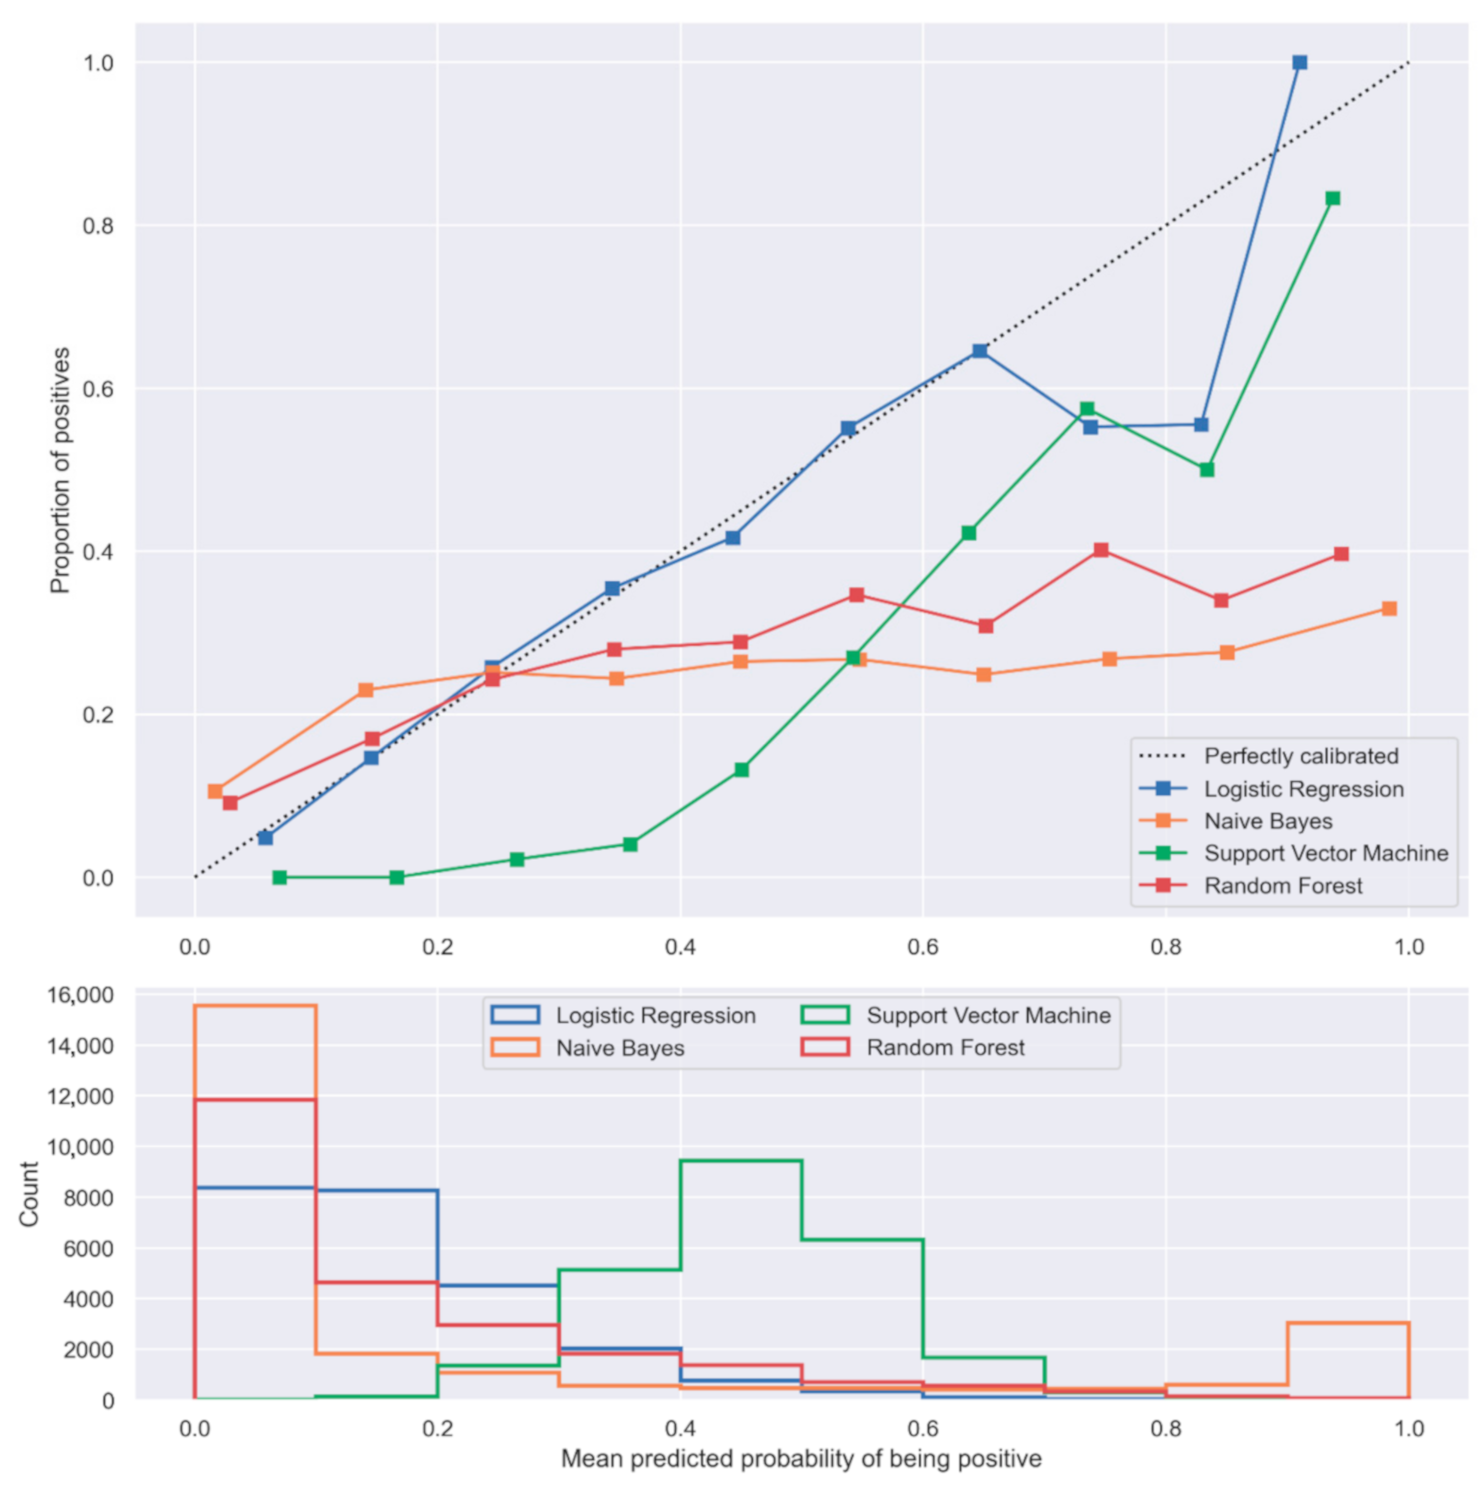
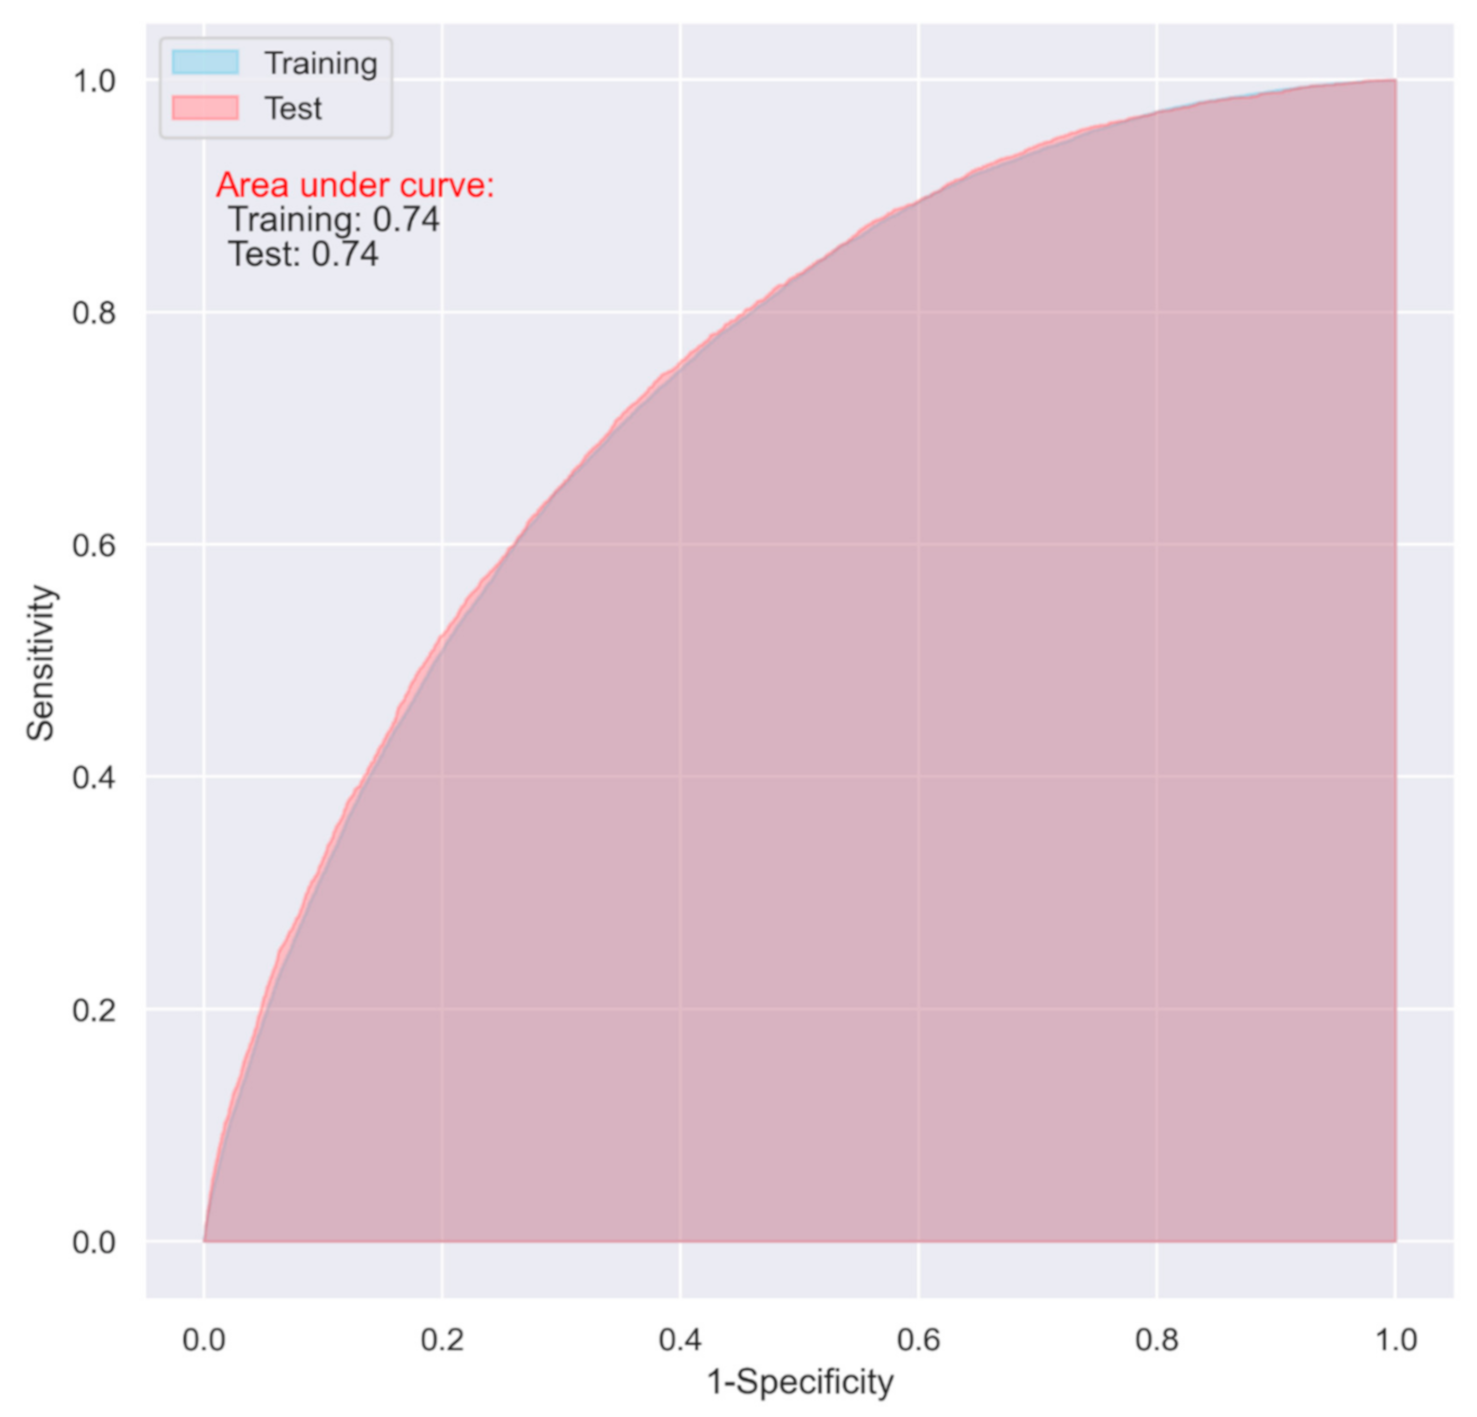
3.3. Comparison of LR with the Selected Machine Learning Algorithms

In our dataset, the LR model showed superiority over the commonly used NB, SVM, and RF algorithms. In general, the three compared algorithms presented lower AUC, sensitivity, or specificity for both the training and test datasets (Table 2) and tended to over-predict the mortality overall as shown in Figure 4, where their calibration curves are all below the diagonal. The over-prediction was more prominent for NB and SVM algorithms, which significantly over-predicted mortality in the middle and upper end of the calibration curve (Figure 4). In contrast, LR only over-predicted mortality when the predicted probability of mortality was larger than 0.7 (Figure 4).

4. Discussion

A key benefit of precision medicine is the ability to predict the risk of mortality and determine when the marginal benefit of additional interventions is negligible. Prediction models have an important role to play, and as the models increase in sophistication the goal may be shifted from precision medicine tailored to cohorts to personalized medicine adapted for individuals. To date, this is the largest study investigating the performance of machine learning models in predicting 1-year postoperative mortality after hip fracture surgery beyond the admission/early 30-day mortality. We found that out of the tested algorithms, LR performed significantly better than the alternatives. While all others tended to overpredict mortality, the LR models only did so in higher risk patients. From a clinical perspective, this is not completely undesirable, as it efficiently flags high-risk patients in a population that is already at an elevated risk of mortality [1,3,34,35]. The LR model itself demonstrated an acceptable predictive ability, with an AUC of 0.74 in the test dataset using all variables and the top ten most important predictive variables [33].
As the name implies, NB assumes that the included features are conditionally independent; however, this is rarely the case in real datasets even if they can come close [36]. LR, on the other hand, splits the feature space linearly and is able to handle a certain degree of multicollinearity, particularly with the help of regularization [37]. NB has also been demonstrated to perform better on smaller datasets, while LR tends to gain the advantage as the training size increases [10,36]. This dataset is relatively large, and a degree of collinearity is undoubtedly present; the type of surgery selected for a hip fracture is in part dictated by the type of fracture and a patient’s age affects which comorbidities are present [38,39]. This, in combination with NB tending to have a higher bias than LR [10,36], likely all contributed to the LR models superior performance. This is important to note as large amounts of correlated data is the standard, rather than the exception, when working with data collected in the medical setting [40].
SVM makes use of the geometrical relationship between the features and outcome rather than the probabilistic model of LR [20,41]. This entails that SVM in most useful when working with unstructured and semi-structure data like text and images [42], while LR instead requires previously identified independent variables [20]. SVM also requires less features than LR to achieve an equivalent, or better, misclassification rate [9]. Conversely, the current dataset is feature rich and has clearly defined variables, which gives LR the overall advantage. In a broader context, this is also generally the case with medical big data [40]. The problems facing many researchers today is not a paucity in features, but rather an overabundance with a sometimes dubious accuracy and consistency [40].
The final machine learning algorithm that was investigated, RF, is an ensemble learning technique that combines the Bagging algorithm with the random subspace method while using decision trees as the classifier [43]. While not always the case [11], LR has previously been found to achieve a higher overall accuracy compared to RF [44]. LR also consistently outperforms RF in datasets with higher variance in their features [44]. As a whole, hip fracture patients are a heterogenous patient population; this is evident from both the distribution of risk scores, such as the ASA classification, RCRI, and CCI, in the current dataset as well as previous research [45]. Consequently, it is to be expected that LR surpasses RF in hip fracture patients. Nevertheless, in a larger medical context care should be taken to consider the specific population being studied as a higher degree of homogeneity may make RF a more viable option.
Of the variables analyzed, metastatic carcinoma, ASA classification, sex, CCI ≤ 4, age, dementia, congestive heart failure, hypertension, surgery using pins/screws, and chronic kidney disease were the most important for predicting mortality 1 year postoperatively. In contrast, a previous study from our group investigating 30-day postoperative mortality found that the most important predictors were age, hypertension, dementia, sex, ASA classification, RCRI, CCI, congestive heart failure, non-displaced cervical hip fractures, and cerebrovascular disease [8]. There was a significant overlap, with age, sex, ASA classification, CCI, dementia, congestive heart failure and hypertension being important for predicting both 30-day and 1-year mortality [8]. The increased importance of metastatic carcinoma and chronic kidney disease for predicting 1-year mortality is understandable as they are both chronic conditions with systemic, long-term effects; however, the remaining differences require further discussion.
Of particular note, the RCRI had previously demonstrated superiority over the CCI in predicting 30-day mortality [8]. However, while the CCI remained valuable for predicting 1-year mortality, the RCRI was significantly less useful. This is not altogether surprising as the RCRI was originally developed for predicting the 30-day risk of postoperative myocardial infarction, cardiac arrest, and mortality [46]. On the other hand, the CCI has been thoroughly validated for predicting 1-year mortality [13,47,48]. It is also worth noting that the CCI includes variables such as metastatic carcinoma, age, dementia, congestive heart failure, and chronic kidney disease in its calculation, all of which were variables that individually demonstrated the highest predictive ability for 1-year postoperative mortality in hip fracture patients. The fact that a CCI specifically ≤4 demonstrated a high importance is likely due to the fact this excludes or limits many of these previously mentioned comorbidities, which means this one variable contains a significant amount of information that is relevant to 1-year mortality. A patient with a CCI ≤ 4 cannot have a metastatic carcinoma since that would result in at least a CCI of 6. The patient must also either be old without any comorbidities, or relatively young with a few comorbidities, to stay at a CCI of 4; i.e., a patient in this category will undoubtably be healthier than the typical hip fracture patient [1,3,34,35].
Another significant change, compared to the prediction of 30-day mortality, was the inclusion of pins/screws rather than non-displaced cervical hip fractures as one of the variables with the highest predictive ability. To a certain extent these two variables can be considered interchangeable since the primary method used for fixating non-displaced cervical hip fractures is with pins/screws [38,39]. However, pins/screws are also at times used in the fixation of displaced femoral neck fractures, despite a consensus among orthopedic surgeons that hemiarthroplasty is the preferred surgical method for displaced femoral neck fractures in older patients [49,50,51]. This may be because of a belief that arthroplasty will result in a higher perioperative mortality in frailer patients, due to the increased stress caused by a longer period of time spent under general anesthesia with a more extensive surgical approach and intervention [50]. At least in patients with dementia, those who were operated on using pins/screws tended to have more comorbidities and were less fit for surgery [49]. An a priori preference for pin/screw fixation on the part of the operating surgeon may allow it to function as an indirect patient-level indicator of frailty, which could explain the variable’s increased importance for predicting 1-year mortality.
In clinical practice several factors, such as age and comorbidities, have intuitively been associated with an increased mortality risk by physicians. Hip fractures predominantly affect older patients with several preexisting conditions [1,3,34,35,52]. As such, it is important to delineate other factors, which could be modifiable in the perioperative and postoperative period, that could aid in achieving better outcomes beyond the immediate postoperative period. For instance, while the RCRI does not excel at predicting 1-year mortality, it has been found to be predictive of, and associated with, worse short-term outcomes after emergency surgery [1,8,53,54]. This variable is readily available at the time of admission and for those with an increased cardiac risk, higher levels of care and cardioprotective medication such as beta-blockers are recommended by American Heart Association [55]. There is also evidence that patients with an elevated RCRI receive a greater survival benefit from beta-blocker therapy [35,56]. Another modifiable factor may be the type of surgery; observational studies indicate that hemiarthroplasty may be associated with lower mortality in patients with displaced femoral neck fractures [49,50,51].
This study makes use of the thoroughly validated Swedish National Quality Registry for Hip Fracture Patients, which is highly regarded for its high case coverage, encompassing between 80–90% of all hip fractures in Sweden [4,57]. The current dataset includes ten consecutive years of data from this database. Even so, the limitations of retrospective studies remain. The current analysis was limited to the data available in the registry so no anesthesiologic variables could be included in the prediction model, aside from the ASA classification. We also lacked data regarding more direct indicators of frailty, changes in functional status pre- and postoperatively as well as postoperative complications. Future studies investigating the role of frailty in predicting postoperative mortality as well as studying the predictors of postoperative complications are warranted.

5. Conclusions

LR outperformed the three other commonly use machine learning algorithms in predicting 1-year postoperative mortality in hip fracture patients. The most important predictors of 1-year mortality were the presence of a metastatic carcinoma, ASA classification, sex, CCI ≤ 4, age, dementia, congestive heart failure, hypertension, surgery using pins/screws, and chronic kidney disease. Further studies are required to determine the importance of frailty in predicting postoperative mortality in hip fracture patients.

Supplementary Materials

The following are available online at https://www.mdpi.com/article/10.3390/jpm11080727/s1, Table S1: Transparent reporting of a multivariable prediction model for individual prognosis or diagnosis (TRIPOD) Checklist.

Author Contributions

M.P.F.: Study design, interpretation of analyses, drafting of manuscript; G.A.B.: Interpretation of analyses, drafting of manuscript; A.M.I.: Interpretation of analyses, critical revision of manuscript; S.M.: Study design, interpretation of analyses, critical revision of manuscript; Y.C.: Study design, analysis of data, interpretation of analyses, drafting of manuscript. All authors have read and agreed to the published version of the manuscript.

Funding

This research received no external funding.

Institutional Review Board Statement

The study was conducted according to the guidelines of the Declaration of Helsinki and approved by the Regional Ethical Review Authority of Uppsala/Orebro (approval no. 2019-02094).

Informed Consent Statement

Not applicable.

Data Availability Statement

The ethical approval obtained for this study prevents the human data being shared publicly to protect patients’ privacy. Interested readers can contact Shahin Mohseni with their research plan to request access. This would be passed to Rikshöft who will decide whether they can access the data directly from the relevant Swedish authority.

Conflicts of Interest

The authors declare no conflict of interest.

References

  1. Forssten, M.P.; Mohammad Ismail, A.; Sjolin, G.; Ahl, R.; Wretenberg, P.; Borg, T.; Mohseni, S. The Association between the Revised Cardiac Risk Index and Short-Term Mortality after Hip Fracture Surgery. Eur. J. Trauma Emerg. Surg. 2020. [Google Scholar] [CrossRef]
  2. NHFD 2019 Annual Report. Available online: https://www.nhfd.co.uk/20/hipfractureR.nsf/docs/2019Report (accessed on 18 October 2020).
  3. Gundel, O.; Thygesen, L.C.; Gögenur, I.; Ekeloef, S. Postoperative Mortality after a Hip Fracture over a 15-Year Period in Denmark: A National Register Study. Acta Orthop. 2020, 91, 58–62. [Google Scholar] [CrossRef]
  4. Rikshoft Arsrapport. 2018. Available online: https://www.xn--rikshft-e1a.se/forsking-och-utv%C3%A4rdering (accessed on 2 October 2020).
  5. Thorngren, K.-G. Fractures in the Elderly. Acta Orthop. Scand. 1995, 66, 208–210. [Google Scholar] [CrossRef]
  6. Statens beredning för medicinsk utvärdering. Rehabilitering av Äldre Personer Med Höftfrakturer—Interdisciplinära Team: En Systematisk Litteraturöversikt; Statens beredning för medicinsk utvärdering (SBU): Stockholm, Sweden, 2015; ISBN 978-91-85413-79-9. [Google Scholar]
  7. Kanis, J.A.; Odén, A.; McCloskey, E.V.; Johansson, H.; Wahl, D.A.; Cooper, C. IOF Working Group on Epidemiology and Quality of Life A Systematic Review of Hip Fracture Incidence and Probability of Fracture Worldwide. Osteoporos Int. 2012, 23, 2239–2256. [Google Scholar] [CrossRef] [Green Version]
  8. Cao, Y.; Forssten, M.P.; Mohammad Ismail, A.; Borg, T.; Ioannidis, I.; Montgomery, S.; Mohseni, S. Predictive Values of Preoperative Characteristics for 30-Day Mortality in Traumatic Hip Fracture Patients. J. Pers. Med. 2021, 11, 353. [Google Scholar] [CrossRef] [PubMed]
  9. Salazar, D.A.; Vélez, J.I.; Salazar, J.C. Comparison between SVM and Logistic Regression: Which One Is Better to Discriminate? Rev. Colomb. Estadística 2012, 35, 223–237. [Google Scholar]
  10. Ng, A.Y.; Jordan, M.I. On Discriminative vs. Generative Classifiers: A Comparison of Logistic Regression and Naive Bayes. In Proceedings of the 14th International Conference on Neural Information Processing Systems: Natural and Synthetic, Vancouver, BC, Canada, 3–8 December 2001; MIT Press: Cambridge, MA, USA, 2001; pp. 841–848. [Google Scholar]
  11. Couronné, R.; Probst, P.; Boulesteix, A.-L. Random Forest versus Logistic Regression: A Large-Scale Benchmark Experiment. BMC Bioinform. 2018, 19, 270. [Google Scholar] [CrossRef]
  12. Om Rikshöft—RIKSHÖFT. Available online: https://www.xn--rikshft-e1a.se/om-oss (accessed on 20 April 2021).
  13. Charlson, M.E.; Pompei, P.; Ales, K.L.; MacKenzie, C.R. A New Method of Classifying Prognostic Comorbidity in Longitudinal Studies: Development and Validation. J. Chronic Dis. 1987, 40, 373–383. [Google Scholar] [CrossRef]
  14. Lee, T.H.; Marcantonio, E.R.; Mangione, C.M.; Thomas, E.J.; Polanczyk, C.A.; Cook, E.F.; Sugarbaker, D.J.; Donaldson, M.C.; Poss, R.; Ho, K.K.; et al. Derivation and Prospective Validation of a Simple Index for Prediction of Cardiac Risk of Major Noncardiac Surgery. Circulation 1999, 100, 1043–1049. [Google Scholar] [CrossRef] [Green Version]
  15. Pearson, K. On the Criterion that a Given System of Deviations from the Probable in the Case of a Correlated System of Variables is Such that it Can be Reasonably Supposed to have Arisen from Random Sampling. In Breakthroughs in Statistics: Methodology and Distribution; Kotz, S., Johnson, N.L., Eds.; Springer Series in Statistics; Springer: New York, NY, USA, 1992; pp. 11–28. ISBN 978-1-4612-4380-9. [Google Scholar]
  16. Student. The Probable Error of a Mean. Biometrika 1908, 6, 1–25. [Google Scholar] [CrossRef]
  17. Mann, H.B.; Whitney, D.R. On a Test of Whether One of Two Random Variables Is Stochastically Larger than the Other. Ann. Math. Stat. 1947, 18, 50–60. [Google Scholar] [CrossRef]
  18. Azur, M.J.; Stuart, E.A.; Frangakis, C.; Leaf, P.J. Multiple Imputation by Chained Equations: What Is It and How Does It Work? Int J. Methods Psychiatr. Res. 2011, 20, 40–49. [Google Scholar] [CrossRef]
  19. Fix, E.; Hodges, J.L. Discriminatory Analysis. Nonparametric Discrimination: Consistency Properties. Int. Stat. Rev. Rev. Int. De Stat. 1989, 57, 238–247. [Google Scholar] [CrossRef]
  20. Cox, D.R. The Regression Analysis of Binary Sequences. J. R. Stat. Society. Ser. B 1958, 20, 215–242. [Google Scholar] [CrossRef]
  21. Zou, H.; Hastie, T. Regularization and Variable Selection via the Elastic Net. J. R. Stat. Soc. Ser. B 2005, 67, 301–320. [Google Scholar] [CrossRef] [Green Version]
  22. Altmann, A.; Toloşi, L.; Sander, O.; Lengauer, T. Permutation Importance: A Corrected Feature Importance Measure. Bioinformatics 2010, 26, 1340–1347. [Google Scholar] [CrossRef] [PubMed]
  23. Youden, W.J. Index for Rating Diagnostic Tests. Cancer 1950, 3, 32–35. [Google Scholar] [CrossRef]
  24. Hand, D.J.; Yu, K. Idiot’s Bayes: Not So Stupid after All? Int. Stat. Rev. Rev. Int. Stat. 2001, 69, 385–398. [Google Scholar] [CrossRef]
  25. Cortes, C.; Vapnik, V. Support-Vector Networks. Mach. Learn. 1995, 20, 273–297. [Google Scholar] [CrossRef]
  26. Breiman, L. Random Forests. Mach. Learn. 2001, 45, 5–32. [Google Scholar] [CrossRef] [Green Version]
  27. Dormann, C.F. Calibration of Probability Predictions from Machine-Learning and Statistical Models. Glob. Ecol. Biogeogr. 2020, 29, 760–765. [Google Scholar] [CrossRef]
  28. Obaid, H.S.; Dheyab, S.A.; Sabry, S.S. The Impact of Data Pre-Processing Techniques and Dimensionality Reduction on the Accuracy of Machine Learning. In Proceedings of the 2019 9th Annual Information Technology, Electromechanical Engineering and Microelectronics Conference (IEMECON), Jaipur, India, 13–15 March 2019; pp. 279–283. [Google Scholar]
  29. Wong, T.T.; Yeh, P.Y. Reliable Accuracy Estimates from K-Fold Cross Validation. IEEE Trans. Knowl. Data Eng. 2020, 32, 1586–1594. [Google Scholar] [CrossRef]
  30. Bergstra, J.; Bengio, Y. Random Search for Hyper-Parameter Optimization. J. Mach. Learn. Res. 2012, 13, 281–305. [Google Scholar]
  31. Lawson, C.R.; Hodgson, J.A.; Wilson, R.J.; Richards, S.A. Prevalence, Thresholds and the Performance of Presence–Absence Models. Methods Ecol. Evol. 2014, 5, 54–64. [Google Scholar] [CrossRef] [Green Version]
  32. Fluss, R.; Faraggi, D.; Reiser, B. Estimation of the Youden Index and Its Associated Cutoff Point. Biom. J. 2005, 47, 458–472. [Google Scholar] [CrossRef] [Green Version]
  33. Mandrekar, J.N. Receiver Operating Characteristic Curve in Diagnostic Test Assessment. J. Thorac. Oncol. 2010, 5, 1315–1316. [Google Scholar] [CrossRef] [Green Version]
  34. Mohammad Ismail, A.; Borg, T.; Sjolin, G.; Pourlotfi, A.; Holm, S.; Cao, Y.; Wretenberg, P.; Ahl, R.; Mohseni, S. β-Adrenergic Blockade Is Associated with a Reduced Risk of 90-Day Mortality after Surgery for Hip Fractures. Trauma Surg. Acute Care Open 2020, 5, e000533. [Google Scholar] [CrossRef]
  35. Ahl, R.; Mohammad Ismail, A.; Borg, T.; Sjölin, G.; Forssten, M.P.; Cao, Y.; Wretenberg, P.; Mohseni, S. A Nationwide Observational Cohort Study of the Relationship between Beta-Blockade and Survival after Hip Fracture Surgery. Eur J. Trauma Emerg. Surg. 2021. [Google Scholar] [CrossRef]
  36. Webb, G.I. Naïve Bayes. In Encyclopedia of Machine Learning; Sammut, C., Webb, G.I., Eds.; Springer US: Boston, MA, USA, 2010; pp. 713–714. ISBN 978-0-387-30164-8. [Google Scholar]
  37. Barker, L.; Brown, C. Logistic Regression When Binary Predictor Variables Are Highly Correlated. Stat. Med. 2001, 20, 1431–1442. [Google Scholar] [CrossRef]
  38. Mears, S. Fixing Hip Fractures. Available online: https://www.hopkinsmedicine.org/gec/series/fixing_hip_fractures (accessed on 7 June 2021).
  39. Raaymakers, E.; Schipper, I.; Simmermacher, R.; van der Werken, C. Treatment of Femoral Neck Fracture, Subcapital, Undisplaced or Impacted. Available online: https://surgeryreference.aofoundation.org/orthopedic-trauma/adult-trauma/proximal-femur/femoral-neck-fracture-subcapital-undisplaced-or-impacted (accessed on 7 June 2021).
  40. Lee, C.H.; Yoon, H.-J. Medical Big Data: Promise and Challenges. Kidney Res. Clin. Pract. 2017, 36, 3–11. [Google Scholar] [CrossRef] [Green Version]
  41. Bennett, K.; Bredensteiner, E. Duality and Geometry in SVM Classifiers, ICML ’00. In Proceedings of the Seventeenth International Conference on Machine Learning, Stanford University, Stanford, CA, USA, 29 June–2 July 2000; Morgan Kaufmann Publishers: San Francisco, CA, USA, 2000; pp. 57–64. [Google Scholar]
  42. Zhang, X. Support Vector Machines. In Encyclopedia of Machine Learning; Sammut, C., Webb, G.I., Eds.; Springer US: Boston, MA, USA, 2010; pp. 941–946. ISBN 978-0-387-30164-8. [Google Scholar]
  43. Random Forests. In Encyclopedia of Machine Learning; Sammut, C.; Webb, G.I. (Eds.) Springer US: Boston, MA, USA, 2010; p. 828. ISBN 978-0-387-30164-8. [Google Scholar]
  44. Kirasich, K.; Smith, T.; Sadler, B. Random Forest vs Logistic Regression: Binary Classification for Heterogeneous Datasets. SMU Data Sci. Rev. 2018, 1, 9. [Google Scholar]
  45. Penrod, J.D.; Litke, A.; Hawkes, W.G.; Magaziner, J.; Koval, K.J.; Doucette, J.T.; Silberzweig, S.B.; Siu, A.L. Heterogeneity in Hip Fracture Patients: Age, Functional Status, and Comorbidity. J. Am. Geriatr. Soc. 2007, 55, 407–413. [Google Scholar] [CrossRef]
  46. Duceppe, E.; Parlow, J.; MacDonald, P.; Lyons, K.; McMullen, M.; Srinathan, S.; Graham, M.; Tandon, V.; Styles, K.; Bessissow, A.; et al. Canadian Cardiovascular Society Guidelines on Perioperative Cardiac Risk Assessment and Management for Patients Who Undergo Noncardiac Surgery. Can. J. Cardiol. 2017, 33, 17–32. [Google Scholar] [CrossRef] [Green Version]
  47. Quan, H.; Li, B.; Couris, C.M.; Fushimi, K.; Graham, P.; Hider, P.; Januel, J.-M.; Sundararajan, V. Updating and Validating the Charlson Comorbidity Index and Score for Risk Adjustment in Hospital Discharge Abstracts Using Data from 6 Countries. Am. J. Epidemiol. 2011, 173, 676–682. [Google Scholar] [CrossRef] [Green Version]
  48. Radovanovic, D.; Seifert, B.; Urban, P.; Eberli, F.R.; Rickli, H.; Bertel, O.; Puhan, M.A.; Erne, P. AMIS Plus Investigators Validity of Charlson Comorbidity Index in Patients Hospitalised with Acute Coronary Syndrome. Insights from the Nationwide AMIS Plus Registry 2002–2012. Heart 2014, 100, 288–294. [Google Scholar] [CrossRef] [PubMed] [Green Version]
  49. Ioannidis, I.; Mohammad Ismail, A.; Forssten, M.P.; Ahl, R.; Cao, Y.; Borg, T.; Mohseni, S. Surgical Management of Displaced Femoral Neck Fractures in Patients with Dementia: A Comparison in Mortality between Hemiarthroplasty and Pins/Screws. Eur. J. Trauma Emerg. Surg. 2021. [Google Scholar] [CrossRef]
  50. Rogmark, C.; Carlsson, A.; Johnell, O. Sernbo I Primary Hemiarthroplasty in Old Patients with Displaced Femoral Neck Fracture: A 1-Year Follow-up of 103 Patients Aged 80 Years or More. Acta Orthop. Scand. 2002, 73, 605–610. [Google Scholar] [CrossRef]
  51. Rogmark, C.; Carlsson, å.; Johnell, O.; Sernbo, I. A Prospective Randomised Trial of Internal Fixation versus Arthroplasty for Displaced Fractures of the Neck of the Femur. J. Bone Jt. Surg. Br. Vol. 2002, 84-B, 183–188. [Google Scholar] [CrossRef]
  52. Groff, H.; Kheir, M.M.; George, J.; Azboy, I.; Higuera, C.A.; Parvizi, J. Causes of In-Hospital Mortality after Hip Fractures in the Elderly. Hip Int. 2020, 30, 204–209. [Google Scholar] [CrossRef]
  53. Bass, G.A.; Forssten, M.; Pourlotfi, A.; Ahl Hulme, R.; Cao, Y.; Matthiessen, P.; Mohseni, S. Cardiac Risk Stratification in Emergency Resection for Colonic Tumours. BJS Open 2021, 5, zrab057. [Google Scholar] [CrossRef]
  54. Forssten, M.P.; Mohammad Ismail, A.; Borg, T.; Ahl, R.; Wretenberg, P.; Cao, Y.; Peden, C.J.; Mohseni, S. Postoperative Mortality in Hip Fracture Patients Stratified by The Revised Cardiac Risk Index: A Swedish Nationwide Retrospective Cohort Study. Trauma Surg. Acute Care Open 2021, 6, e000778. [Google Scholar] [CrossRef]
  55. Fleisher, L.A.; Beckman, J.A.; Brown, K.A.; Calkins, H.; Chaikof, E.; Fleischmann, K.E.; Freeman, W.K.; Froehlich, J.B.; Kasper, E.K.; Kersten, J.R.; et al. ACC/AHA 2007 Guidelines on Perioperative Cardiovascular Evaluation and Care for Noncardiac Surgery: A Report of the American College of Cardiology/American Heart Association Task Force on Practice Guidelines (Writing Committee to Revise the 2002 Guidelines on Perioperative Cardiovascular Evaluation for Noncardiac Surgery): Developed in Collaboration with the American Society of Echocardiography, American Society of Nuclear Cardiology, Heart Rhythm Society, Society of Cardiovascular Anesthesiologists, Society for Cardiovascular Angiography and Interventions, Society for Vascular Medicine and Biology, and Society for Vascular Surgery. Circulation 2007, 116, e418–e499. [Google Scholar] [CrossRef] [PubMed] [Green Version]
  56. Ismail, A.M.; Ahl, R.; Forssten, M.P.; Cao, Y.; Wretenberg, P.; Borg, T.; Mohseni, S. The Interaction Between Per-Admission β-Blocker Therapy, The Revised Cardiac Risk Index, and Mortality in Geriatric Hip Fracture Patients. J. Trauma Acute Care Surg. 2021. [Google Scholar] [CrossRef] [PubMed]
  57. Meyer, A.C.; Hedström, M.; Modig, K. The Swedish Hip Fracture Register and National Patient Register Were Valuable for Research on Hip Fractures: Comparison of Two Registers. J. Clin. Epidemiol. 2020, 125, 91–99. [Google Scholar] [CrossRef] [PubMed]
Figure 1. Relative variable importance in predicting one-year postoperative mortality based on the LR algorithm. ASA, American Society of Anesthesiologists; CCI, Charlson Comorbidity Index; RCRI, Revised Cardiac Risk Index.
Jpm 11 00727 g001
Figure 2. ROC of the LR model including all the variables with elastic net regularization.
Jpm 11 00727 g002
Figure 3. ROC of the LR model including only the top ten important variables with elastic net regularization.
Jpm 11 00727 g003
Figure 4. Calibration curves and histograms of the predicted probabilities of one-year postoperative mortality of the investigated machine learning algorithms.
Jpm 11 00727 g004
Table 1. Characteristics of the traumatic hip fracture patients in Sweden between 2008 and 2017.
VariableTotal
(n = 124,707)
Alive
(n = 103,662)
Dead
(n = 21,045)
p-Value
Age, mean (SD)81.55 (10.10)80.75 (10.29)85.46 (8.01)<0.001
Sex, n (%) <0.001
  Female86,379 (69.3)73,166 (70.6)13,213 (62.8)
  Male38,314 (30.7)30,483 (29.4)7831 (37.2)
  Missing14 (0.0)13 (0.0)1 (0.0)
ASA classification, n (%) <0.001
  16356 (5.3)6216 (6.1)320 (1.6)
  246,507 (38.0)41,626 (40.9)4878 (23.6)
  360,857 (49.7)48,278 (47.4)12,579 (60.9)
  48459 (6.9)5606 (5.5)2853 (13.8)
  579 (0.1)44 (0.1)35 (0.2)
CCI, n (%) <0.001
  ≤457,634 (46.2)52,281 (50.4)5353 (25.4)
  5–646,733 (36.7)36,604 (35.3)9129 (43.4)
  ≥721,340 (17.1)14,777 (14.3)6563 (31.2)
RCRI, n (%) <0.001
  075,864 (60.8)65,476 (63.2)10,388 (49.4)
  133,476 (26.8)27,135 (26.2)6341 (30.1)
  211,284 (9.1)8352 (8.1)2932 (13.9)
  33245 (2.6)2174 (2.1)1071 (5.1)
  ≥4838 (0.7)525 (0.5)313 (1.5)
Arrhythmia, n (%)22,305 (17.9)17,223 (16.6)5082 (24.1)<0.001
Hypertension, n (%)47,990 (38.5)39,849 (38.4)8141 (38.7)0.515
Myocardial infarction, n (%)6789 (5.4)5065 (4.9)1724 (8.2)<0.001
Congestive heart failure, n (%)17,475 (14.0)12,276 (11.8)5199 (24.7)<0.001
Cerebrovascular disease, n (%)21,036 (16.9)16,669 (16.1)4367 (20.8)<0.001
COPD, n (%)13,933 (11.2)11,094 (10.7)2839 (13.5)<0.001
Connective tissue disease, n (%)6036 (4.8)5017 (4.8)1019 (4.8)1.000
Dementia, n (%)23,789 (19.1)17,283 (16.7)6506 (30.9)<0.001
Diabetes mellitus, n (%)18,166 (14.6)14,588 (14.1)3578 (17.0)<0.001
Liver disease, n (%)1232 (1.0)985 (1.0)247 (1.2)0.003
Hemiplegia, n (%)2715 (2.2)2302 (2.2)413 (2.0)0.021
Chronic kidney disease, n (%)5774 (4.6)3920 (3.8)1854 (8.8)<0.001
Local tumor, n (%)13,108 (10.5)10,037 (9.7)3071 (14.6)<0.001
Metastatic carcinoma, n (%)2498 (2.0)1357 (1.3)1141 (5.4)<0.001
Peptic ulcer disease, n (%)3918 (3.1)3036 (2.9)882 (4.2)<0.001
Type of fracture, n (%) <0.001
  Non-displaced cervical (Garden 1–2)16,840 (13.5)14,138 (13.6)2702 (12.8)
  Displaced cervical (Garden 3–4)46,248 (37.1)38,824 (37.5)7424 (35.3)
  Basicervical4126 (3.3)3337 (3.2)789 (3.7)
  Peritrochanteric (two fragments)24,775 (19.9)20,314 (19.6)4461 (21.2)
  Peritrochanteric (multiple fragments)22,487 (18.0)18,502 (17.8)3985 (18.9)
  Subtrochanteric10,178 (8.2)8501 (8.2)1677 (8.0)
  Missing53 (0.0)46 (0.0)7 (0.0)
Type of surgery, n (%) <0.001
  Pins or screws21,849 (17.5)18,026 (17.4)3823 (18.2)
  Screws or pins with sideplate32,146 (25.8)26,221 (25.3)5925 (28.2)
  Intramedullary nail29,496 (23.7)24,461 (23.6)5035 (23.9)
  Hemiarthroplasty31,473 (25.2)25,729 (24.8)5744 (27.3)
  Total hip replacement9676 (7.8)9170 (8.8)506 (2.4)
  Missing67 (0.1)55 (0.1)12 (0.1)
ASA, American Society of Anesthesiologists; CCI, Charlson Comorbidity Index; RCRI, Revised Cardiac Risk Index; COPD, Chronic obstructive pulmonary disease.
Table 2. Predictive ability of the investigated machine learning algorithms.
ModelTrainingTest
SpecificitySensitivityAUC (95% CI)SpecificitySensitivityAUC (95% CI)
LR0.640.720.74 (0.73–0.74)0.620.750.74 (0.74–0.75)
LR (including only the top ten variables)0.650.730.73 (0.73–0.75)0.610.740.74 (0.74–0.75)
NB0.620.670.69 (0.69–0.70)0.630.670.70 (0.69–0.70)
SVM0.620.740.74 (0.73–0.74)0.610.700.72 (0.72–0.73)
RF0.570.730.71 (0.70–0.71)0.660.670.72 (0.71–0.72)
Publisher’s Note: MDPI stays neutral with regard to jurisdictional claims in published maps and institutional affiliations.

