Left Ventricular Dysfunction and Plasmatic NT-proBNP Are Associated with Adverse Evolution in Respiratory Syncytial Virus Bronchiolitis

 , ,
, ,
Abstract
1. Introduction
2. Materials and Methods
2.1. Design, Settings and Study Population
2.2. Clinical and Laboratory Assessment and Outcomes
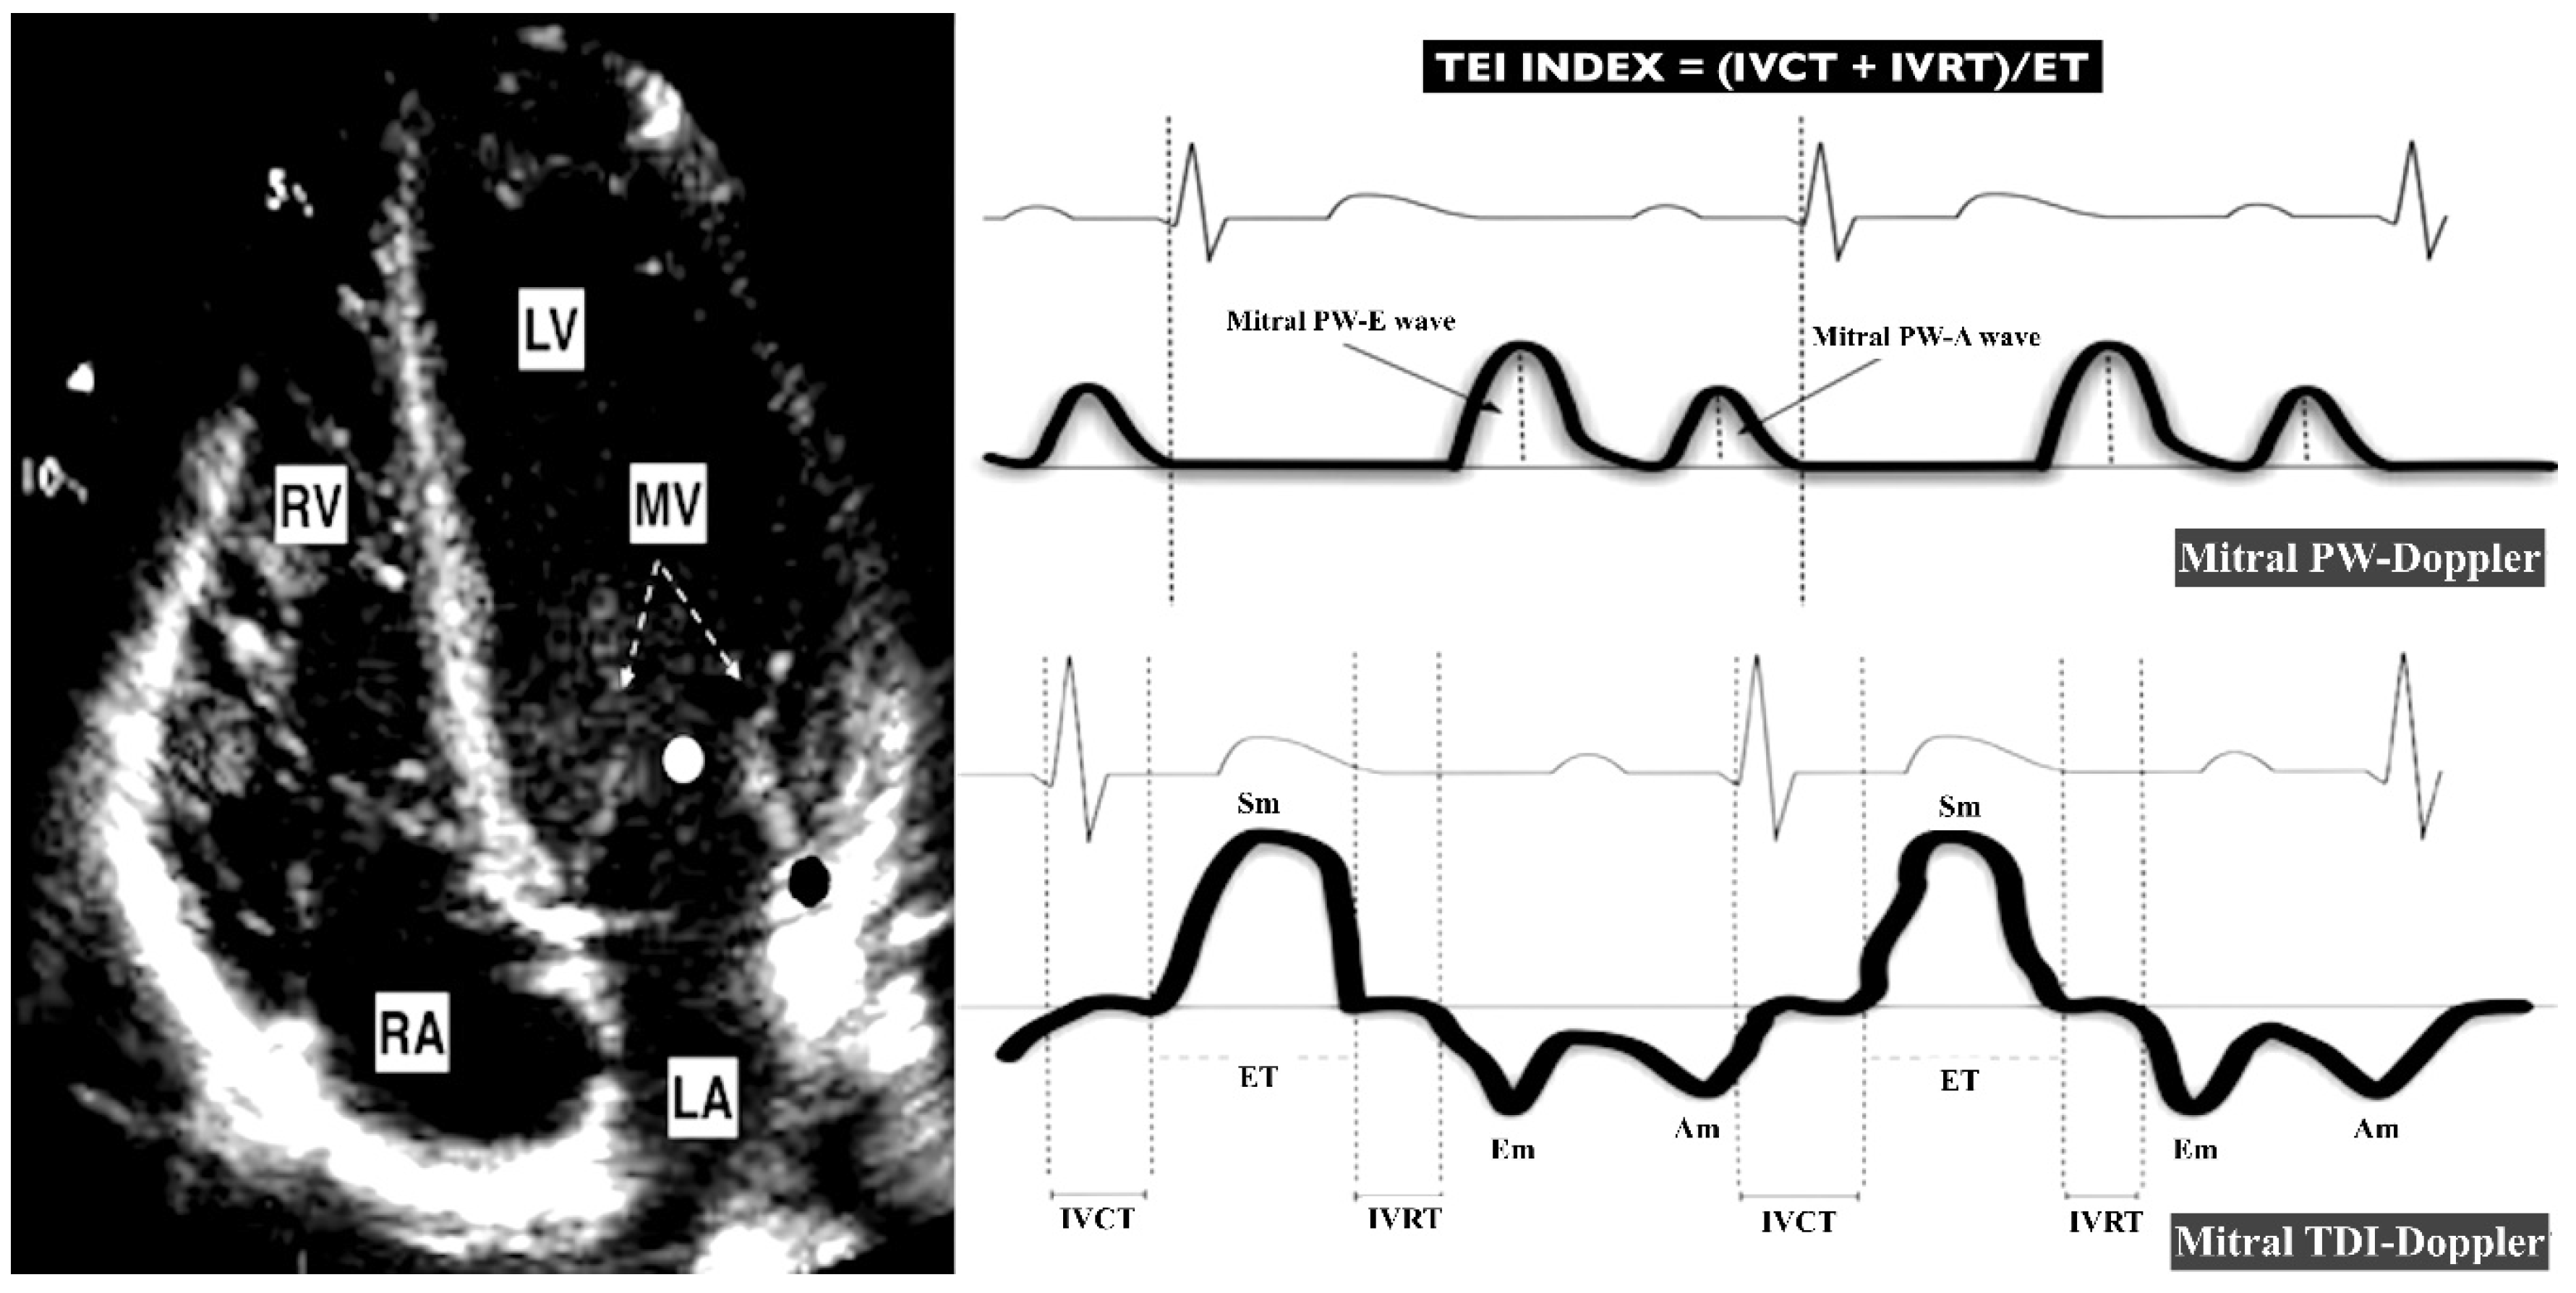
2.3. Echocardiographic Assessment
2.3.1. Right-Sided Echocardiographic Assessment
2.3.2. Left-Sided Echocardiographic Assessment
2.4. Reproductibility
2.5. Statistical Analysis
3. Results
3.1. Baseline Characteristics and Outcomes of Patients with RSVB
3.2. Echocardiographic Alterations in Patients with RSVB
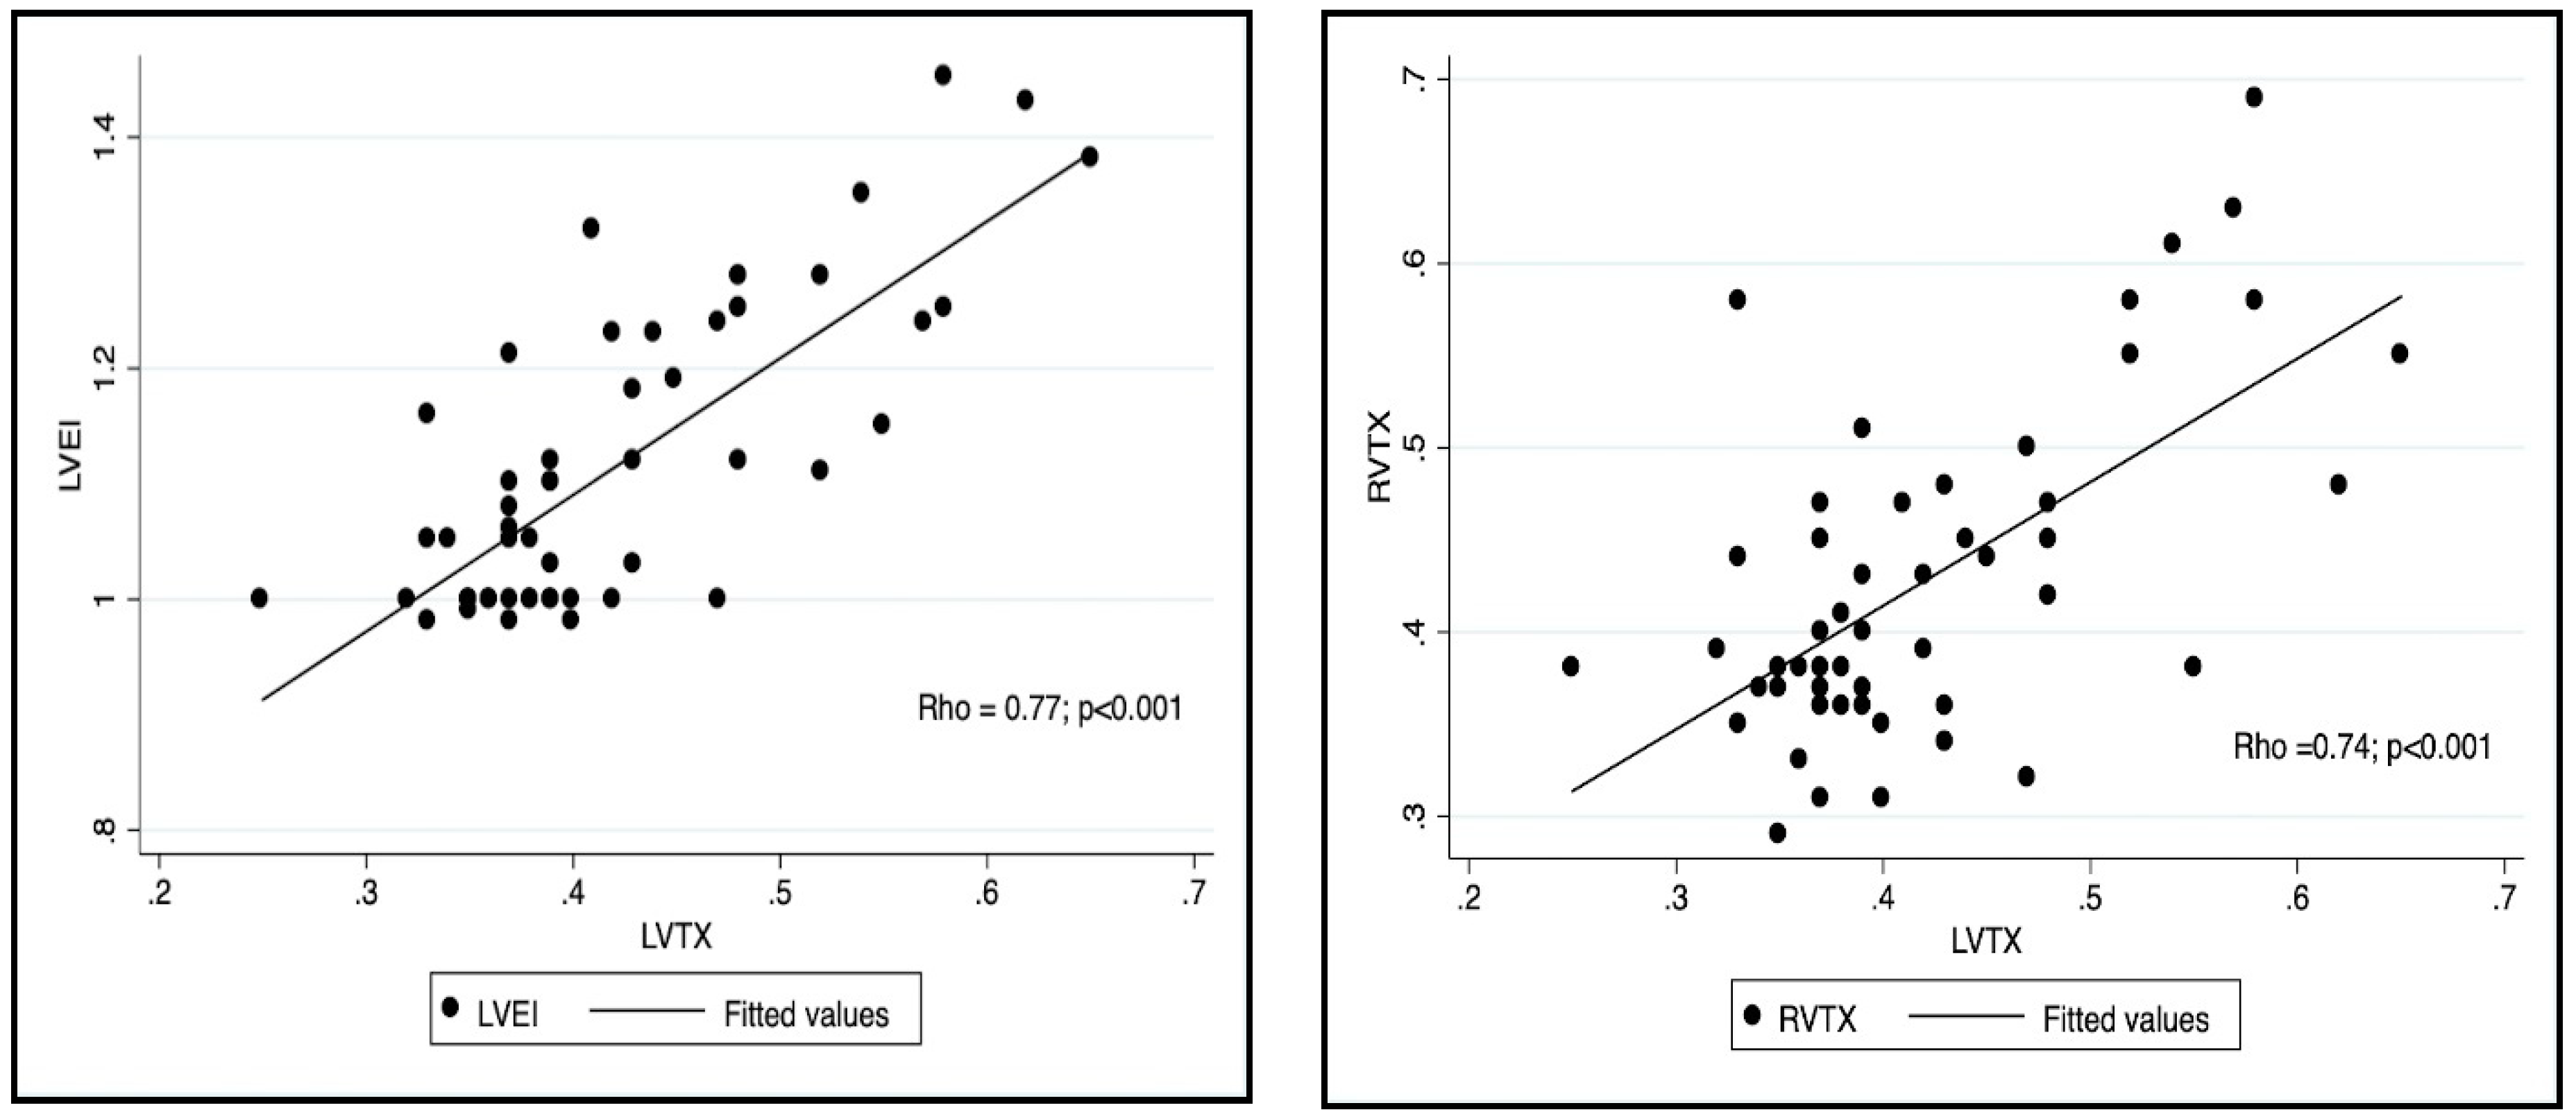
3.3. Adverse LV–RV Interactions in Patients with RSVB
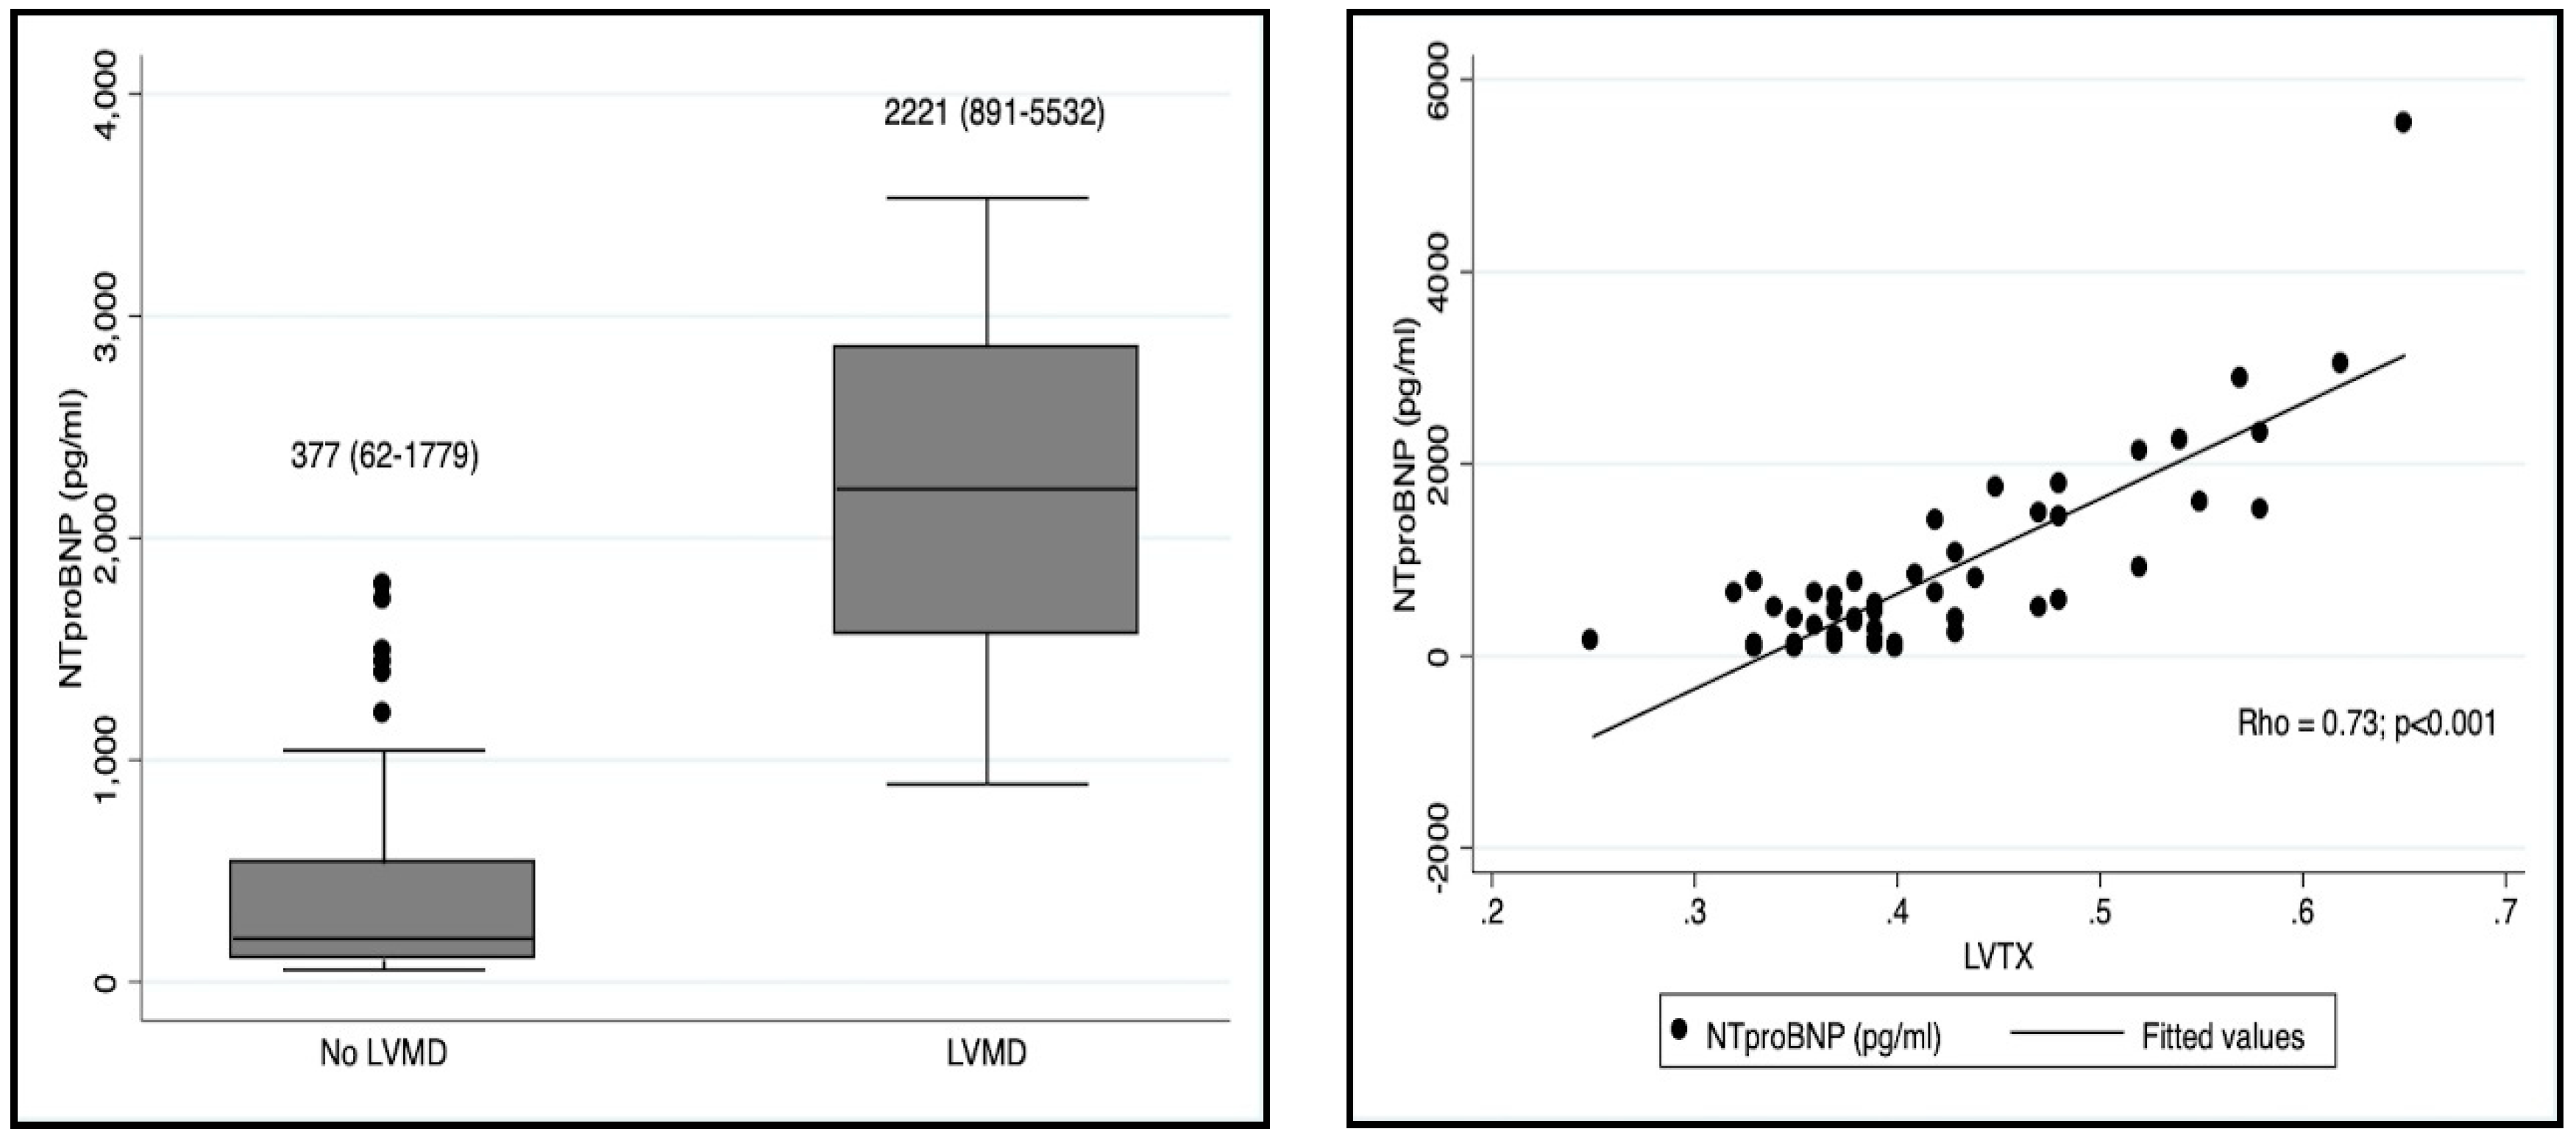
3.4. LVMD in Patients with RSVB
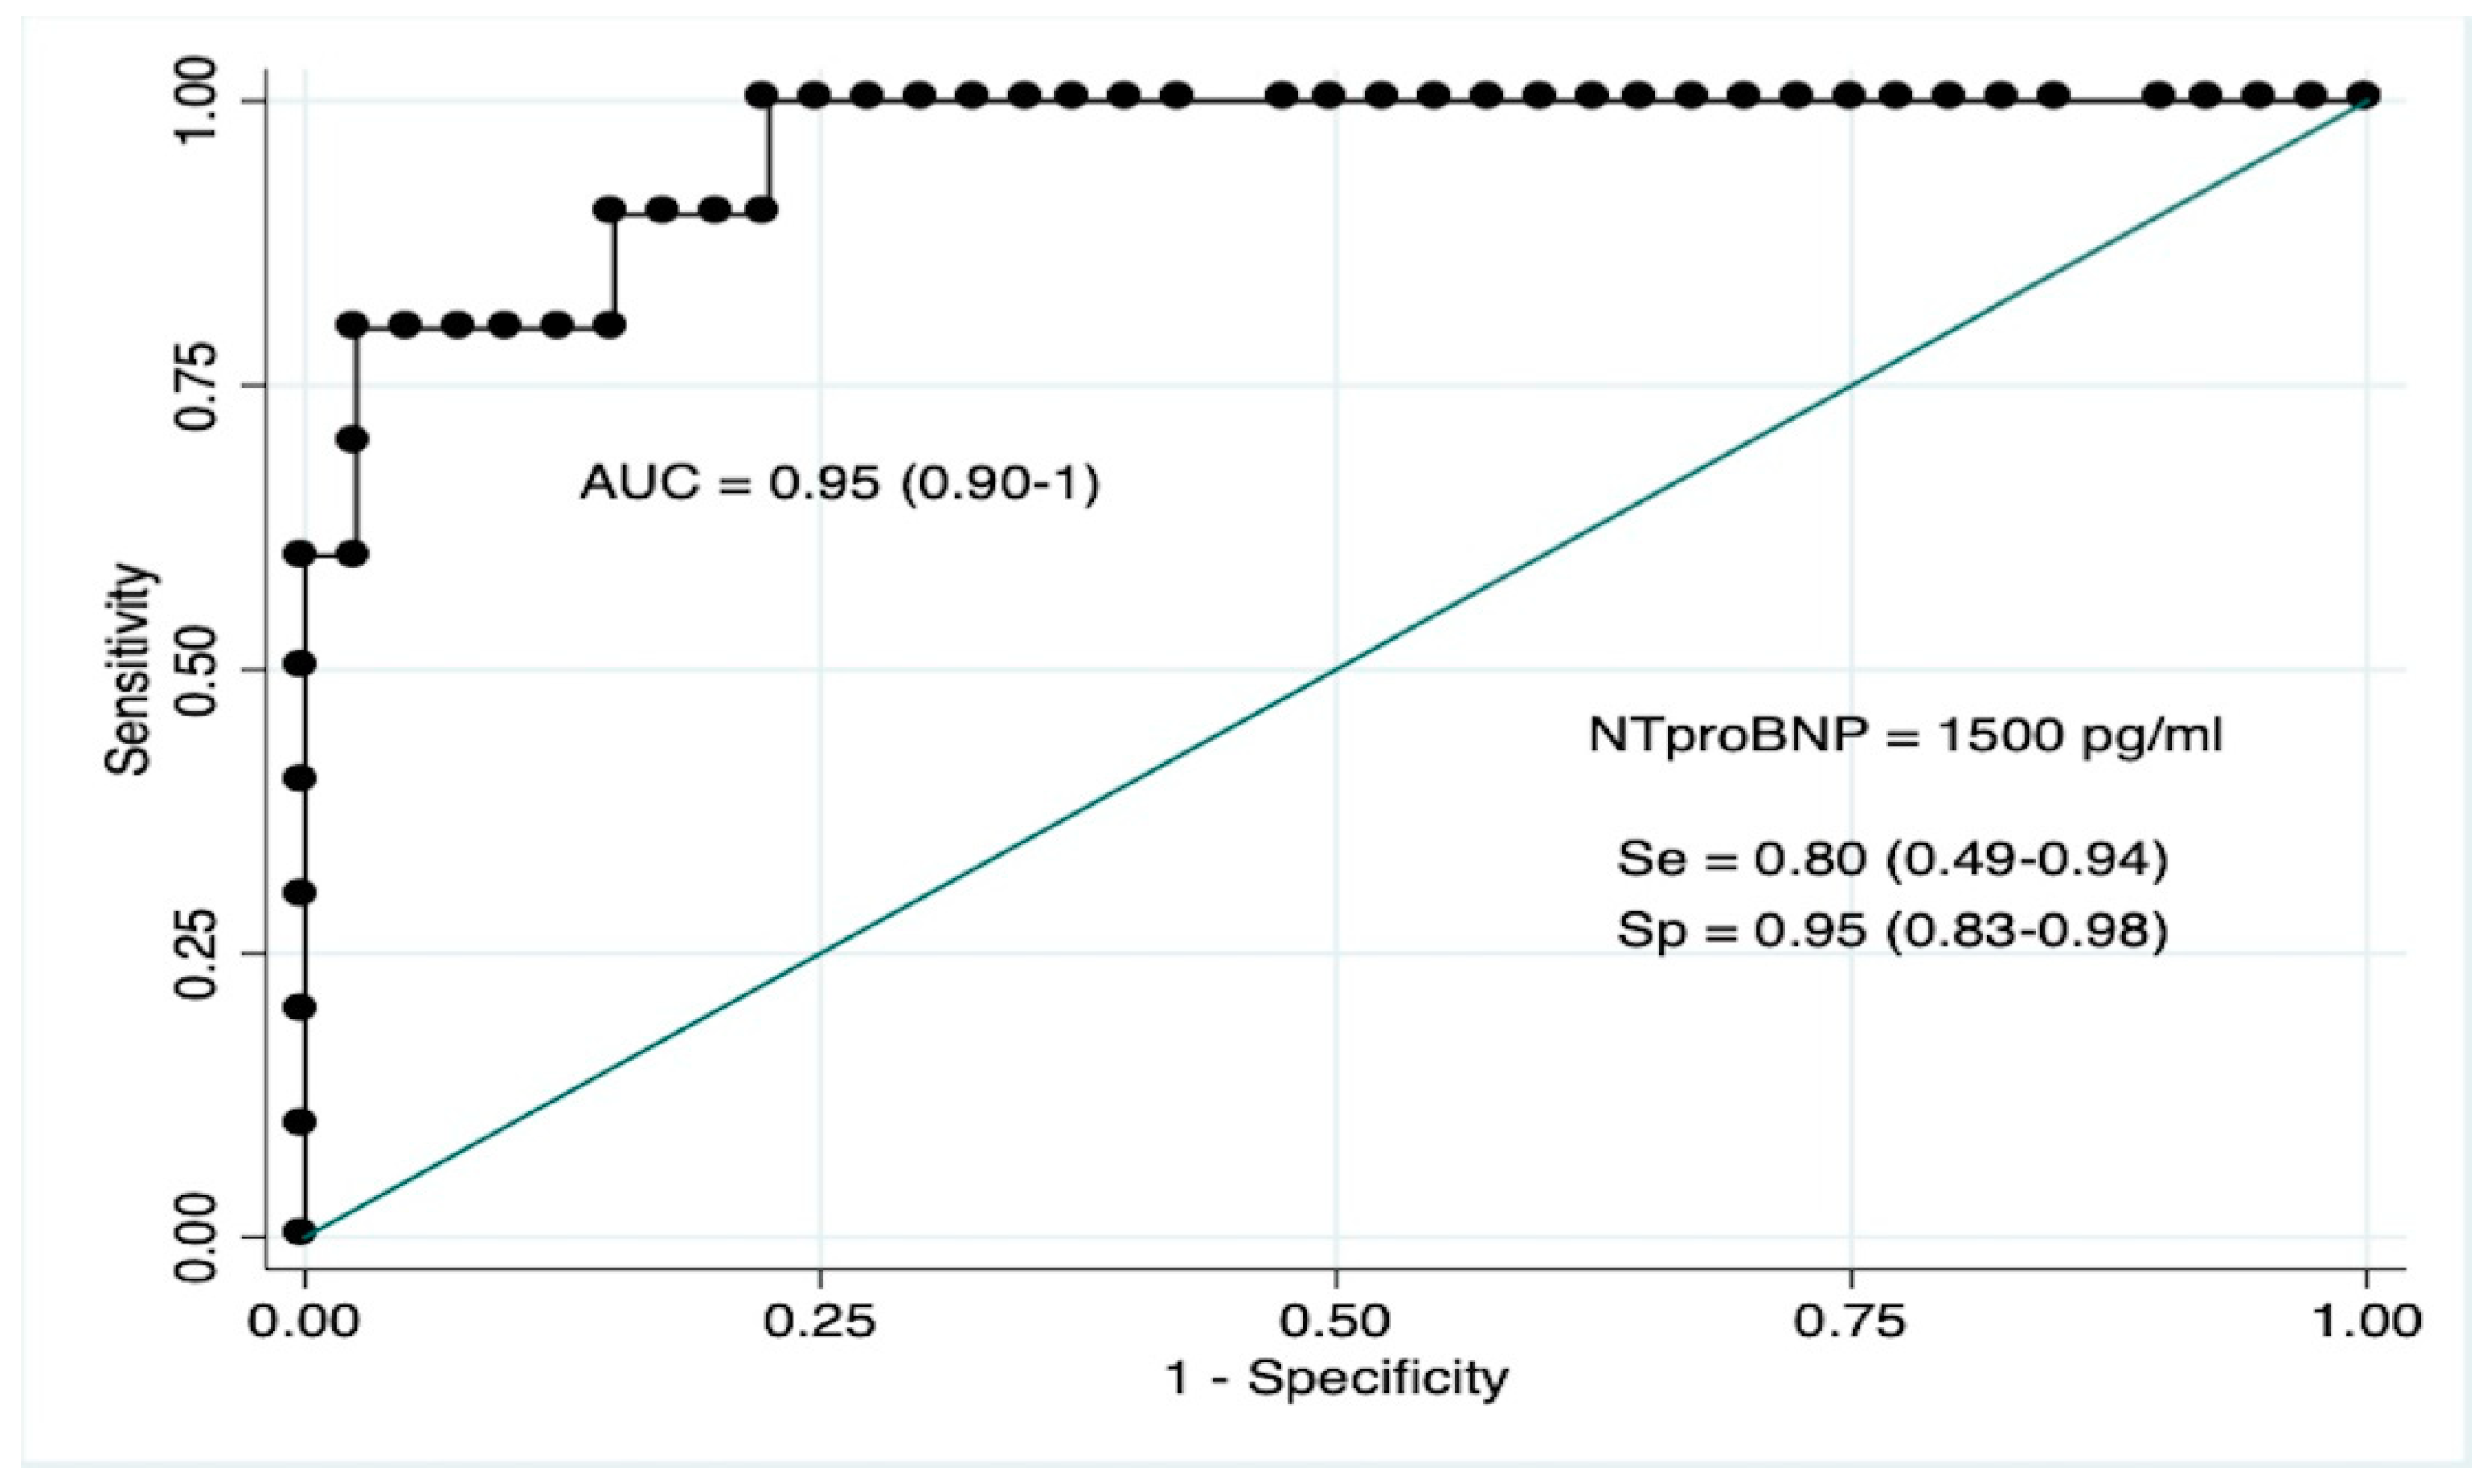
3.5. NT-ProBNP as Biomarker for LVMD
3.6. Clinical and Laboratory Predictors of PICU Admission in RSVB
3.7. Reproductibility
4. Discussion
5. Conclusions
Author Contributions
Funding
Conflicts of Interest
References
- Hasegawa, K.; Tsugawa, Y.; Brown, D.F.M.; Mansbach, J.M.; Camargo, C.A. Trends in bronchiolitis hospitalizations in the United States, 2000–2009. Pediatrics. Am. Acad. Pediatr. 2013, 132, 28–36. [Google Scholar]
- Ghazaly, M.; Nadel, S. Characteristics of children admitted to intensive care with acute bronchiolitis. Eur. J. Pediatr. 2018, 177, 913–920. [Google Scholar] [CrossRef] [PubMed]
- Ralston, S.L.; Lieberthal, A.S.; Meissner, H.C.; Alverson, B.K.; Baley, J.E.; Gadomski, A.M.; Johnson, D.W.; Light, M.J.; Maraga, N.F.; Mendonca, E.A.; et al. Clinical practice guideline: The diagnosis, management, and prevention of bronchiolitis. Am. Acad. Pediatr. 2014, 134, e1474–e1502. [Google Scholar] [CrossRef] [PubMed]
- Willson, D.F.; Landrigan, C.P.; Horn, S.D.; Smout, R.J. Complications in infants hospitalized for bronchiolitis or respiratory syncytial virus pneumonia. J. Pediatr. 2003, 143, S142–S149. [Google Scholar] [CrossRef]
- Tulloh, R.M.; Medrano-Lopez, C.; Checchia, P.A.; Stapper, C.; Sumitomo, N.; Gorenflo, M.; Bae, E.J.; Juanico, A.; Gil-Jaurena, J.M.; Wu, M.H.; et al. CHD and respiratory syncytial virus: Global expert exchange recommendations. Cardiol. Young 2017, 27, 1504–1521. [Google Scholar] [CrossRef] [PubMed]
- Fitzgerald, D.; Davis, G.M.; Rohlicek, C.; Gottesman, R. Quantifying pulmonary hypertension in ventilated infants with bronchiolitis: A pilot study. J. Paediatr. Child Health 2001, 37, 64–66. [Google Scholar] [CrossRef] [PubMed]
- Bardi-Peti, L.; Ciofu, E.P. Bronchiolitis and pulmonary hypertension. Pneumologia 2010, 59, 95–100. [Google Scholar] [PubMed]
- Kimura, D.; McNamara, I.F.; Wang, J.; Fowke, J.H.; West, A.N.; Philip, R. Pulmonary hypertension during respiratory syncytial virus bronchiolitis: A risk factor for severity of illness. Cardiol. Young 2019, 20, 1–5. [Google Scholar] [CrossRef] [PubMed]
- Clark, S.J.; Eisenhut, M.; Sidaras, D.; Hancock, S.W.; Newland, P.; Thorburn, K. Myocardial injury in infants ventilated on the paediatric intensive care unit: A case control study. Crit. Care 2006, 10, R128. [Google Scholar] [CrossRef]
- Moynihan, J.A.; Brown, L.; Sehra, R.; Checchia, P.A. Cardiac troponin I as a predictor of respiratory failure in children hospitalized with respiratory syncytial virus (RSV) infections: A pilot study. Am. J. Emerg. Med. 2003, 21, 479–482. [Google Scholar] [CrossRef]
- Thorburn, K. Cardiac Troponin T levels and myocardial involvement in children with severe respiratory syncytial virus lung disease. Acta Paediatr. 2004, 93, 887–890. [Google Scholar]
- Thorburn, K.; Eisenhut, M.; Shauq, A.; Narayanswamy, S.; Burgess, M. Right ventricular function in children with severe respiratory syncytial virus (RSV) bronchiolitis. Minerva Anestesiol. 2011, 77, 46–53. [Google Scholar] [PubMed]
- Rodriguez-Gonzalez, M.; Benavente Fernández, I.; Castellano-Martinez, A.; Lechuga-Sancho, A.M.; Lubián-López, S.P. NT-proBNP plasma levels as biomarkers for pulmonary hypertension in healthy infants with respiratory syncytial virus infection. Biomark. Med. 2019, 3. [Google Scholar] [CrossRef] [PubMed]
- Driessen, M.M.P.; Meijboom, F.J. Adverse ventricular-ventricular interactions in right ventricular pressure load: Insights from pediatric pulmonary hypertension versus pulmonary stenosis. Physiol. Rep. 2016, 4, e12833. [Google Scholar] [CrossRef] [PubMed]
- Burkett, D.A.; Slorach, C.; Patel, S.S.; Redington, A.N.; Ivy, D.D.; Mertens, L.; Younoszai, A.K.; Friendberg, M.K. Impact of Pulmonary Hemodynamics and Ventricular Interdependence on Left Ventricular Diastolic Function in Children with Pulmonary Hypertension. Circ. Cardiovasc. Imaging 2016, 9, e004612. [Google Scholar] [CrossRef] [PubMed]
- Motoji, Y.; Tanaka, H.; Fukuda, Y.; Sano, H.; Ryo, K.; Imanishi, J.; Miyoshi, T.; Sawa, T.; Mochizuki, Y.; Matsumoto, K.; et al. Interdependence of right ventricular systolic function and left ventricular filling and its association with outcome for patients with pulmonary hypertension. Int. J. Cardiovasc. Imaging 2015, 23, 691–698. [Google Scholar] [CrossRef]
- Pahl, E.; Gidding, S.S. Echocardiographic assessment of cardiac function during respiratory syncytial virus infection. Pediatrics 1988, 81, 830–834. [Google Scholar] [PubMed]
- Esposito, S.; Salice, P.; Bosis, S.; Ghiglia, S.; Tremolati, E.; Tagliabue, C.; Gualtieri, L.; Barbier, P.; Galeone, C.; Marchisio, P.; et al. Altered cardiac rhythm in infants with bronchiolitis and respiratory syncytial virus infection. BMC Infect Dis. 2010, 24, 305. [Google Scholar] [CrossRef]
- Horter, T.; Nakstad, B.; Ashtari, O.; Solevåg, A.L. Right and left ventricular function in hospitalized children with respiratory syncytial virus infection. Infect. Drug Resist. 2017, 10, 419–424. [Google Scholar] [CrossRef]
- Martinez-Rumayor, A.; Richards, A.M.; Burnett, J.C.; Januzzi, J.L., Jr. Biology of the Natriuretic Peptides. Am. J. Cardiol. 2008, 101, S3–S8. [Google Scholar] [CrossRef]
- Kate ten, C.A.; Tibboel, D.; Kraemer, U.S. B-type natriuretic peptide as a parameter for pulmonary hypertension in children. A systematic review. Eur. J. Pediatr. 2015, 23, 1267–1275. [Google Scholar] [CrossRef] [PubMed]
- Takatsuki, S.; Wagner, B.D.; Ivy, D.D. B-type natriuretic peptide and amino-terminal pro-B-type natriuretic peptide in pediatric patients with pulmonary arterial hypertension. Congenit Heart Dis. 2012, 7, 259–267. [Google Scholar] [CrossRef] [PubMed]
- Hauser, J.A.; Demyanets, S.; Rusai, K.; Goritschan, C.; Weber, M.; Panesar, D.; Rindler, L.; Taylor, A.M.; Marculescus, R.; Burch, M.; et al. Diagnostic performance and reference values of novel biomarkers of paediatric heart failure. Heart 2016, 27, 1633–1639. [Google Scholar] [CrossRef] [PubMed]
- Mladosievicova, B.; Urbanova, D.; Radvanska, E.; Slavkovsky, P.; Simkova, I. Role of NT-proBNP in detection of myocardial damage in childhood leukemia survivors treated with and without anthracyclines. J. Exp. Clin. Cancer Res. 2012, 11, 1. [Google Scholar] [CrossRef] [PubMed]
- Li, Q.; Cui, C.-Y.; Zhang, C.; Guo, S.-Y.; Zhang, Q. On the changes of NT-proBNP level in children having undergone radical operation of tetralogy of Fallot and the clinical significance. Eur. Rev. Med. Pharmacol. Sci. 2015, 19, 3018–3022. [Google Scholar] [PubMed]
- Balaguer, M.; Alejandre, C.; Vila, D.; Esteban, E.; Carrasco, J.L.; Cambra, F.J.; Jordan, I. Bronchiolitis Score of Sant Joan de Déu: BROSJOD Score, validation and usefulness. Pediatr. Pulmonol. 2017, 52, 533–539. [Google Scholar] [CrossRef] [PubMed]
- Lai, W.W.; Geva, T.; Shirali, G.S.; Frommelt, P.C.; Humes, R.A.; Brook, M.M.; Pignatelli, R.H.; Rychik, J. Guidelines and Standards for Performance of a Pediatric Echocardiogram: A Report from the Task Force of the Pediatric Council of the American Society of Echocardiography. J. Am. Soc. Echocardiogr. 2006, 19, 1413–1430. [Google Scholar] [CrossRef] [PubMed]
- Koestenberger, M.; Ravekes, W.; Everett, A.D.; Stueger, H.P.; Heinzl, B.; Gamillscheg, A.; Cvirn, G.; Boysen, A.; Fandl, A.; Nagel, B. Right ventricular function in infants, children and adolescents: Reference values of the tricuspid annular plane systolic excursion (TAPSE) in 640 healthy patients and calculation of z score values. J. Am. Soc. Echocardiogr. 2009, 22, 715–719. [Google Scholar] [CrossRef] [PubMed]
- Tei, C.; Dujardin, K.S.; Hodge, D.O.; Bailey, K.R.; McGoon, M.D.; Tajik, A.J.; Seward, S.B. Doppler echocardiographic index for assessment of global right ventricular function. J. Am. Soc. Echocardiogr. 1996, 9, 838–847. [Google Scholar] [CrossRef]
- Koestenberger, M.; Apitz, C.; Abdul-Khaliq, H.; Hansmann, G. Transthoracic echocardiography for the evaluation of children and adolescents with suspected or confirmed pulmonary hypertension. Expert consensus statement on the diagnosis and treatment of paediatric pulmonary hypertension. The European Paediatric Pulmonary Vascular Disease Network, endorsed by ISHLT and D6PK. Heart 2016, 102, ii14–ii22. [Google Scholar] [PubMed]
- Habash, S.; Laser, K.T.; Moosmann, J.; Reif, R.; Adler, W.; Glöckler, M.; Kececioglu, D.; Dittrich, S. Normal values of the pulmonary artery acceleration time (PAAT) and the right ventricular ejection time (RVET) in children and adolescents and the impact of the PAAT/RVET-index in the assessment of pulmonary hypertension. Int. J. Cardiovasc. Imaging 2019, 35, 295–306. [Google Scholar] [CrossRef] [PubMed]
- Abraham, S.; Weismann, C.G. Left Ventricular End-Systolic Eccentricity Index for Assessment of Pulmonary Hypertension in Infants. Echocardiography 2016, 16, 910–915. [Google Scholar] [CrossRef] [PubMed]
- Cui, W.; Roberson, D.A. Left ventricular Tei index in children: Comparison of tissue Doppler imaging, pulsed wave Doppler, and M-mode echocardiography normal values. J. Am. Soc. Echocardiogr. 2006, 19, 1438–1445. [Google Scholar] [CrossRef] [PubMed]
- DeLong, E.R.; DeLong, D.M.; Clarke-Pearson, D.L. Comparing the areas under two or more correlated receiver operating characteristic curves: A nonparametric approach. Biometrics 1988, 44, 837–845. [Google Scholar] [CrossRef] [PubMed]
- Koo, T.K.; Li, M.Y. A Guideline of Selecting and Reporting Intraclass Correlation Coefficients for Reliability. Res. J. Chiropr. Med. 2016, 15, 155–163. [Google Scholar] [CrossRef] [PubMed]
- Cui, W.; Roberson, D.A.; Chen, Z.; Madronero, L.F.; Cuneo, B.F. Systolic and diastolic time intervals measured from Doppler tissue imaging: Normal values and Z-score tables, and effects of age, heart rate, and body surface area. J. Am. Soc. Echocardiogr. 2008, 21, 361–370. [Google Scholar] [CrossRef] [PubMed]
- Burkett, D.A.; Slorach, C.; Patel, S.S.; Redington, A.N.; Ivy, D.D.; Mertens, L.; Younoszai, A.K.; Friendberg, M.K. Left Ventricular Myocardial Function in Children with Pulmonary Hypertension: Relation to Right Ventricular Performance and Hemodynamics. Circ. Cardiovasc. Imaging 2015, 8, e003260. [Google Scholar] [CrossRef]
- Haeck, M.L.A.; Höke, U.; Marsan, N.A.; Holman, E.R.; Wolterbeek, R.; Bax, J.J.; Schalij, M.J.; Vliegen, H.W.; Delgado, V. Impact of right ventricular dyssynchrony on left ventricular performance in patients with pulmonary hypertension. Int. J. Cardiovasc. Imaging 2014, 30, 713–720. [Google Scholar] [CrossRef]
- Bekhof, J.; Reimink, R.; Brand, P.L.P. Systematic review: Insufficient validation of clinical scores for the assessment of acute dyspnoea in wheezing children. Paediatric. Respiratory Rev. 2014, 15, 98–112. [Google Scholar] [CrossRef]
- Destino, L.; Weisgerber, M.C.; Soung, P.; Bakalarski, D.; Yan, K.; Rehborg, R.; Wagner, D.R.; Gorelick, M.H.; Simpson, P. Validity of respiratory scores in bronchiolitis. Hosp. Pediatr. 2012, 2, 202–209. [Google Scholar] [CrossRef]
- Brown, P.M.; Schneeberger, D.L.; Piedimonte, G. Biomarkers of respiratory syncytial virus (RSV) infection: Specific neutrophil and cytokine levels provide increased accuracy in predicting disease severity. Paediatric. Respiratory Rev. 2015, 16, 232–240. [Google Scholar] [CrossRef] [PubMed][Green Version]
- Takeuchi, D.; Saji, T.; Takatsuki, S.; Fujiwara, M. Abnormal tissue doppler images are associated with elevated plasma brain natriuretic peptide and increased oxidative stress in acute Kawasaki disease. Circ. J. 2007, 71, 357–362. [Google Scholar] [CrossRef] [PubMed][Green Version]
- Ozde, C.; Dogru, M.; Ozde, Ş.; Kayapinar, O.; Kaya, A.; Korkmaz, A. Subclinical right ventricular dysfunction in intermittent and persistent mildly asthmatic children on tissue Doppler echocardiography and serum NT-proBNP: Observational study. Pediatr. Int. 2018, 60, 1024–1032. [Google Scholar] [CrossRef] [PubMed]
- Mikkelsen, K.V.; Møller, J.E.; Bie, P.; Ryde, H.; Videbaek, L.; Haghfelt, T. Tei index and neurohormonal activation in patients with incident heart failure: Serial changes and prognostic value. Eur. J. Heart Failure 2006, 8, 599–608. [Google Scholar] [CrossRef] [PubMed]


| Variable | RSVB Group (n = 50) | Control Group (n = 50) | p Value |
|---|---|---|---|
| Age (months) | 2 (1–6.5) | 2 (1–9) | 0.591 |
| Female sex | 20 (40) | 23 (46) | 0.545 |
| BSA (m2) | 0.28 (0.18–0.43) | 0.27 (0.18–0.42) | 0.617 |
| Time of symptoms (days) | 2.76 (1.23) | - | - |
| BROSJOD score | 6 (1–14) | - | - |
| SpO2 (%) | 93 (87–98) | 99 (95–100) | <0.001 |
| Heart rate (bpm) | 118 (89–179) | 109 (87–133) | 0.002 |
| pH | 7.36 (7.22–7.45) | - | - |
| pCO2 | 42 (31–71) | - | - |
| Nt-proBNP (pg/mL) | 511 (62–5532) | - | - |
| Respiratory Acidosis | 9 (18) | - | - |
| BROSJOD > 10 | 9 (18) | - | - |
| PICU admission | 10 (20) | - | - |
| Variable | RSVB Group (n = 50) | Control Group (n = 50) | p Value |
|---|---|---|---|
| Pericardial effusion | 17 (34) | 3 (6) | <0.001 |
| Left ventricle | |||
| LVDD (mm) | 21 (17–29) | 21 (14–28) | 0.470 |
| LVSF (%) | 38.5 (5.6) | 39 (5) | 0.851 |
| Sm (cm/s) | 8.7 (1.6) | 9 (1.2) | 0.573 |
| Mitral E (cm/s) | 98 (79–125) | 96 (76–123) | 0.798 |
| Mitral A (cm/s) | 75 (49–97) | 71 (51–93) | 0.259 |
| Mitral E/A | 1.25 (0.93–1.98) | 1.43 (1–2) | 0.200 |
| Mitral Em (cm/s) | 9.4 (6–5–14) | 10 (6.6–15) | 0.110 |
| Mitral Am (cm/s) | 9 (5–15) | 9 (6–13) | 0.182 |
| Mitral E/Em (cm/s) | 10.2 (5.8–20) | 9.8 (5.2–17) | 0.283 |
| LVTX | 0.42 (0.25–0.65) | 0.36 (0.26–0.47) | 0.008 |
| Right ventricle | |||
| RVDD (mm) | 10 (7–19) | 10 (7–14) | 0.264 |
| RV/LV ratio | 0.49 (0.28–0.80) | 0.46 (0.28–0.76) | 0.473 |
| TAPSE (mm) | 12.3 (1.6) | 12 (1.8) | 0.624 |
| St (cm/s) | 8.5 (2) | 9.1 (1.7) | 0.901 |
| RVTX | 0.39 (0.25–0.65) | 0.37 (0.26–0.48) | 0.005 |
| Adequate TRJ | 25 (50) | 30 (60) | 0.633 |
| TRJG (mmHg) | 27 (18–47) | 22 (16–34) | 0.013 |
| ATET | 0.38 (0.06) | 0.39 (0.03) | 0.288 |
| LVEI | 1.08 (0.98–1.45) | 1 (0.95–1.12) | <0.001 |
| Septal Flattening | 14 (28) | 3 (6) | 0.003 |
| Variable | Rho | p Value |
|---|---|---|
| RVDD | 0.56 | 0.003 |
| RV/LV ratio | 0.60 | 0.001 |
| TAPSE | −0.19 | 0.159 |
| St | −0.12 | 0.217 |
| RVTX | 0.738 | <0.001 |
| TRJG | 0.54 | 0.004 |
| ATET | −0.50 | 0.009 |
| LVEI | 0.77 | <0.001 |
| NT-proBNP | 0.73 | <0.001 |
| Variable | LVMD (n = 9; 18%) | Normal LV Function (n = 41; 82%) | p Value |
|---|---|---|---|
| Age (months) | 2 (1–4.5) | 2 (1–6.5) | 0.538 |
| Female sex | 2 (22) | 18 (44) | 0.230 |
| BSA (m2) | 0.29 (0.18–0.33) | 0.28 (0.18–0.43) | 0.742 |
| Time of symptoms (days) | 2 (1.5) | 3 (1–7) | 0.488 |
| BROSJOD score | 11 (9–14) | 6 (1–13) | <0.001 |
| SpO2 (%) | 90 (87–93) | 94 (88–98) | <0.001 |
| Heart rate (bpm) | 135 (100–164) | 116 (89–179) | 0.141 |
| pH | 7.3 (7.25–7.42) | 7.36 (7.22–7.45) | 0.115 |
| pCO2 (mmHg) | 54 (31–61) | 41 (31–71) | 0.009 |
| Nt-proBNP (pg/mL) | 2221 (891–5532) | 377 (62–1779) | <0.001 |
| PICU admission | 8 (89) | 2 (5) | <0.001 |
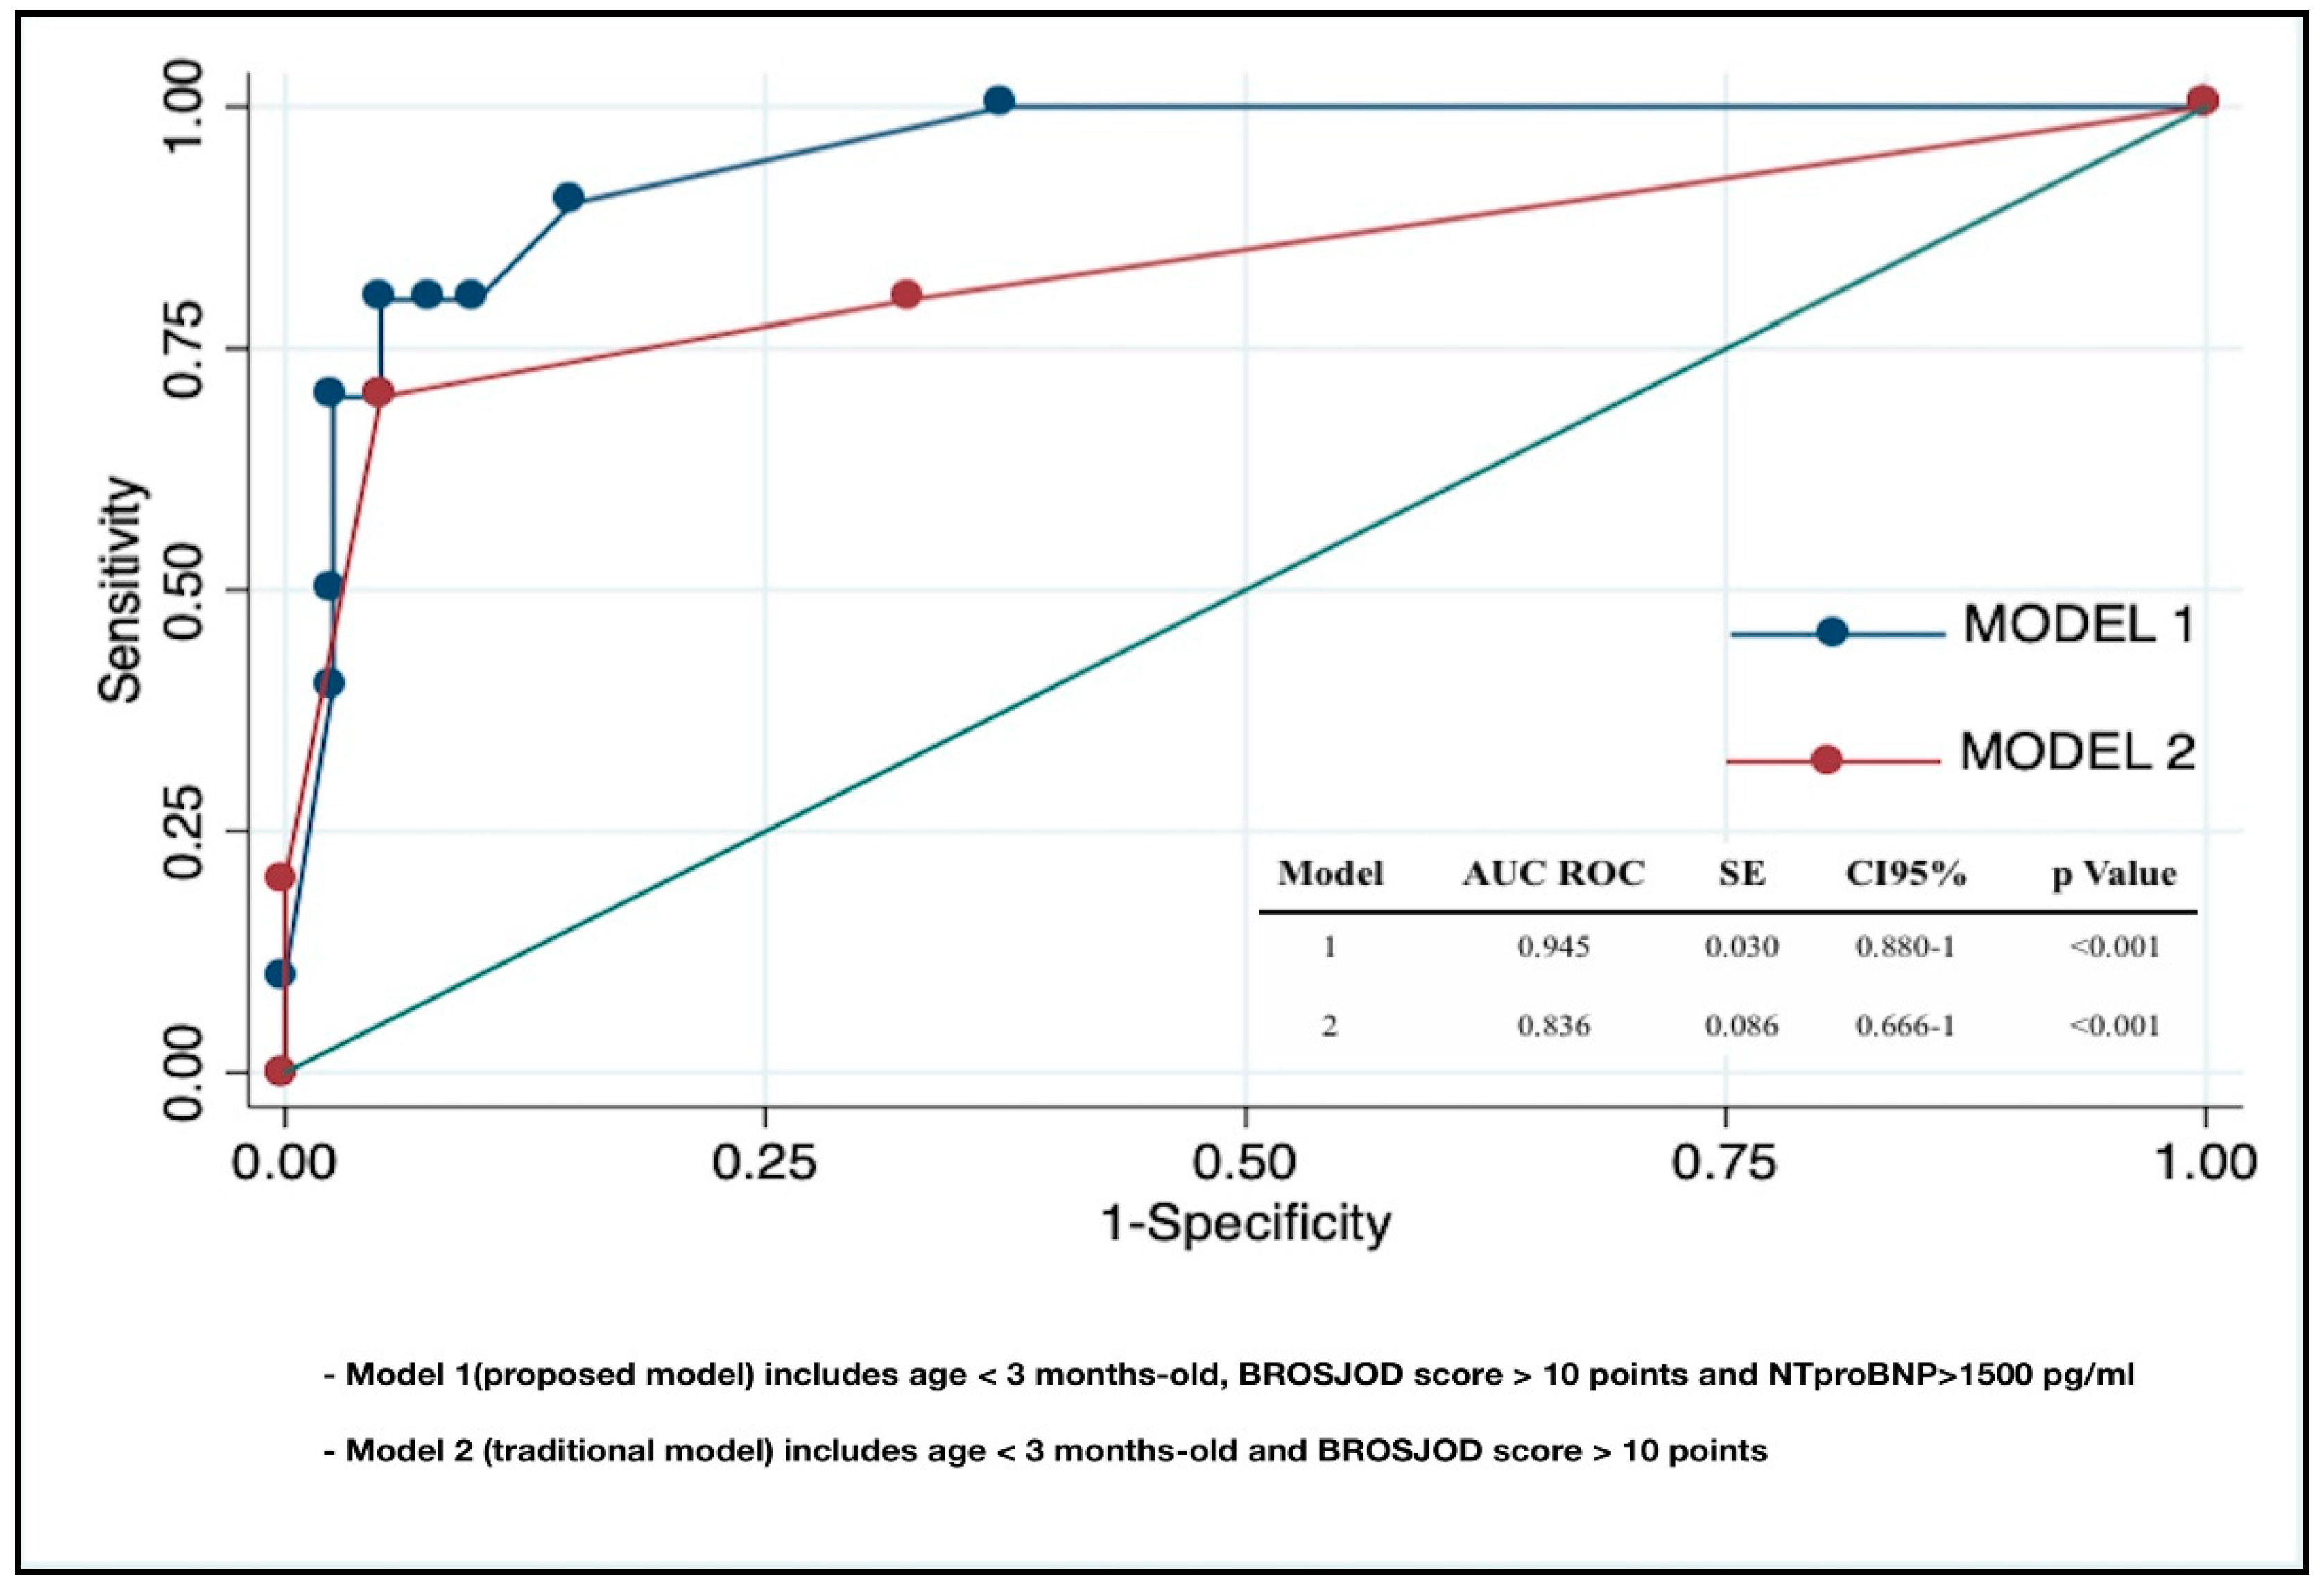
| Variable | Univariate Analysis OR (CI 95%) | p Value | Multivariate Analysis OR (CI 95%) | p Value | pseudoR2 |
|---|---|---|---|---|---|
| Model 1 | <0.001 | 0.51 | |||
| Age < 3 months | 0.88 (0.19–4.04) | 0.875 | 0.71 (0.66–7.58) | 0.777 | |
| BROSJOD score > 10 | 44.33 (6.22–315.50) | <0.001 | 3.06 (0.12–76.44) | 0.494 | |
| NT-proBNP > 1500 pg/mL | 76 (9.27–622) | <0.001 | 27.03 (1.50–487) | 0.025 | |
| Model 2 | <0.001 | 0.38 | |||
| Age < 3 months | 0.88 (0.19–4.04) | 0.875 | 0.52 (0.06–4.21) | 0.541 | |
| BROSJOD score > 10 | 44.33 (6.22–315.50) | <0.001 | 49.27 (6.38–380) | <0.001 |
| Variable | Intra-observer (RG.M) | Inter-observer (RG.M and PR.A) | ||
|---|---|---|---|---|
| ICC (95% CI) | BA (LOA) | ICC (95% CI) | BA (LOA) | |
| LVTX | 0.95 (0.93–0.99) | 0.00 (−0.03–0.03) | 0.84 (0.74–0.93) | −0.01 (−0.07–0.05) |
| RVTX | 0.97 (0.95–0.99) | −0.002 (−0.02–0.02) | 0.86 (0.77–0.95) | −0.015 (−0.07–0.04) |
| LVEI | 0.89 (0.82–0.96) | −0.007 (−0.04–0.03) | 0.84 (0.73–0.94) | −0.01 (−0.05–0.03) |
© 2019 by the authors. Licensee MDPI, Basel, Switzerland. This article is an open access article distributed under the terms and conditions of the Creative Commons Attribution (CC BY) license (http://creativecommons.org/licenses/by/4.0/).
Share and Cite
Rodriguez-Gonzalez, M.; Perez-Reviriego, A.A.; Castellano-Martinez, A.; Lubian-Lopez, S.; Benavente-Fernandez, I. Left Ventricular Dysfunction and Plasmatic NT-proBNP Are Associated with Adverse Evolution in Respiratory Syncytial Virus Bronchiolitis. Diagnostics 2019, 9, 85. https://doi.org/10.3390/diagnostics9030085
Rodriguez-Gonzalez M, Perez-Reviriego AA, Castellano-Martinez A, Lubian-Lopez S, Benavente-Fernandez I. Left Ventricular Dysfunction and Plasmatic NT-proBNP Are Associated with Adverse Evolution in Respiratory Syncytial Virus Bronchiolitis. Diagnostics. 2019; 9(3):85. https://doi.org/10.3390/diagnostics9030085
Chicago/Turabian StyleRodriguez-Gonzalez, Moises, Alvaro Antonio Perez-Reviriego, Ana Castellano-Martinez, Simon Lubian-Lopez, and Isabel Benavente-Fernandez. 2019. "Left Ventricular Dysfunction and Plasmatic NT-proBNP Are Associated with Adverse Evolution in Respiratory Syncytial Virus Bronchiolitis" Diagnostics 9, no. 3: 85. https://doi.org/10.3390/diagnostics9030085
APA StyleRodriguez-Gonzalez, M., Perez-Reviriego, A. A., Castellano-Martinez, A., Lubian-Lopez, S., & Benavente-Fernandez, I. (2019). Left Ventricular Dysfunction and Plasmatic NT-proBNP Are Associated with Adverse Evolution in Respiratory Syncytial Virus Bronchiolitis. Diagnostics, 9(3), 85. https://doi.org/10.3390/diagnostics9030085