Predictive Value of Serum Ferritin in Combination with Alanine Aminotransferase and Glucose Levels for Noninvasive Assessment of NAFLD: Fatty Liver in Obesity (FLiO) Study

 , , , ,
  , , and
Abstract
1. Introduction
2. Materials and Methods
2.1. Participants
2.2. Anthropometrics, Body Composition, and Biochemical Assessment
2.3. Hepatic Imaging Techniques
2.4. Dietary Intake Estimate
2.5. Statistical Analyses
3. Results
4. Discussion
5. Conclusions
Author Contributions
Funding
Acknowledgments
Conflicts of Interest
Appendix A

| Characteristics | Overall (n = 112) | Men (n = 65) | p Value | Women (n = 47) | p Value | ||
|---|---|---|---|---|---|---|---|
| <p50th of Serum Ferritin (n = 33) | ≥p50th of Serum Ferritin (n = 32) | <p50th of Serum Ferritin (n = 24) | ≥p50th of Serum Ferritin (n = 23) | ||||
| Serum ferritin level (ng/mL) | 150.1 (130) | 0.01 to <184.0 | 184.0 to 588.1 | 0.01 to <51.3 | 51.3 to 254.3 | ||
| Age (years) | 51.1 (9) | 53.5 (10) | 49.7 (9) | 0.091 | 50.2 (10) | 50.7 (8) | 0.160 |
| BMI (kg/m2) | 33.7 (4) | 34.4 (4) | 33.4 (3) | 0.208 | 33.4 (4) | 33.7 (4) | 0.741 |
| Cardiometabolic Risk Factors | |||||||
| Waist Circumference (cm) | 109.8 (10) | 114.2 (9) | 113.4 (9) | 0.487 | 104.4 (9) | 104.3 (8) | 0.924 |
| Total Fat Mass (kg) | 39.5 (9) | 38.7 (8) | 37.7 (8) | 0.573 | 41.7 (9) | 40.7 (10) | 0.509 |
| Visceral Fat Mass (g) | 2371 (1071) | 2350 (888) | 2565 (1180) | 0.461 | 2565 (1034) | 1924 (1091) | 0.013 |
| Systolic blood pressure (mmHg) | 131.3 (14) | 138.5 (16) | 134.1 (11) | 0.276 | 123.7 (12) | 125.3 (12) | 0.462 |
| Diastolic blood pressure (mmHg) | 86.9 (9) | 91.0 (10) | 88.7 (7) | 0.422 | 83.0 (8) | 82.7 (7) | 0.915 |
| Glucose Metabolism Variables | |||||||
| Glucose (mg/dL) | 109.0 (32) | 112.5 (29) | 116.6 (46) | 0.679 | 102.5 (12) | 100.2 (22) | 0.122 |
| Insulin (mU/L) | 18.3 (11) | 18.7 (11) | 22.0 (14) | 0.273 | 15.2 (8) | 15.8 (7) | 0.840 |
| HbA1c (%) | 5.9 (1) | 6.1 (1) | 6.0 (1) | 0.087 | 5.7 (0.4) | 5.7 (0.8) | 0.622 |
| HOMA-IR | 5.2 (5) | 5.3 (4) | 7.0 (7) | 0.345 | 3.9 (2) | 4.0 (2) | 0.983 |
| TyG index | 8.8 (0.6) | 8.8 (0.6) | 9.1 (0.6) | 0.012 | 8.6 (0.5) | 8.4 (0.4) | 0.070 |
| TG/HDL-c index | 3.1 (3) | 3.0 (3) | 4.7 (3) | 0.003 | 2.2 (1) | 1.9 (1) | 0.701 |
| Lipid Metabolism Variables | |||||||
| Total cholesterol (mg/dL) | 197.0 (39) | 201.0 (40) | 192.8 (40) | 0.209 | 202.4 (43) | 191.3 (34) | 0.365 |
| LDL cholesterol (mg/dL) | 117.7 (35) | 123.9 (36) | 110.7 (35) | 0.466 | 117.2 (39) | 119.3 (29) | 0.932 |
| HDL cholesterol (mg/dL) | 52.1 (14) | 51.6 (13) | 44.8 (11) | 0.022 | 61.5 (15) | 53.0 (12) | 0.073 |
| Triglyceride (mg/dL) | 137.8 (79) | 134.5 (85) | 186.6 (89) | 0.004 | 118.6 (56) | 94.9 (37) | 0.139 |
| Liver Status Variables | |||||||
| ALT (IU/L) | 33.2 (18) | 31.4 (13) | 43.1 (16) | <0.001 | 27.1 (23) | 28.4 (15) | 0.254 |
| AST (IU/L) | 24.5 (10) | 23.6 (6) | 29.3 (11) | 0.004 | 22.1 (12) | 21.6 (7) | 0.724 |
| GGT (IU/L) | 37.6 (25) | 34.6 (16) | 54.9 (31) | 0.002 | 29.5 (21) | 26.0 (19) | 0.571 |
| Liver fat mass (%) | 11.7 (8) | 10.2 (7) | 16.5 (10) | 0.004 | 8.6 (7) | 10.6 (8) | 0.204 |
| Liver Iron (%) | 26.9 (4) | 26.8 (2) | 28.5 (6) | 0.007 | 25.5 (3) | 26.1 (2) | 0.541 |
| Hepatic Volume (mL) | 1813 (530) | 1962 (511) | 1974 (528) | 0.812 | 1565 (494) | 1642 (472) | 0.525 |
| Eco Steatosis Degree (1–3) | 1.6 (0.7) | 1.6 (0.7) | 1.8 (0.8) | 0.136 | 1.4 (0.6) | 1.4 (0.6) | 0.918 |
| Characteristics | Overall (n = 112) | Men (n = 65) | p Value | Women (n = 47) | p Value | ||
|---|---|---|---|---|---|---|---|
| <p50th of Serum Ferritin (n = 33) | ≥p50th of Serum Ferritin (n = 32) | <p50th of Serum Ferritin (n = 24) | ≥p50th of Serum Ferritin (n = 23) | ||||
| Serum ferritin level (ng/mL) | 150.1 (130) | 0.01 to <184.0 | 184.0 to 588.1 | 0.01 to <51.3 | 51.3 to 254.3 | ||
| Nutrients | |||||||
| Energy intake (kcal/day) | 2689 (1014) | 2468 (761) | 2802 (1191) | 0.265 | 2666 (793) | 2872 (1250) | 0.848 |
| Carbohydrates (%E) | 43.2 (7) | 43.0 (7) | 43.0 (7) | 0.793 | 43.5 (8) | 43.3 (6) | 0.733 |
| Proteins (%E) | 17.3 (4) | 17.5 (4) | 16.7 (3) | 0.704 | 18.1 (4) | 17.1 (3) | 0.865 |
| Lipids (%E) | 37.1 (7) | 36.5 (6) | 37.1 (6) | 0.844 | 37.0 (8) | 37.8 (7) | 0.717 |
| Fiber (g/day) | 24.7 (9) | 25.0 (10) | 22.8 (9) | 0.243 | 26.2 (10) | 25.1 (9) | 0.915 |
| Alcohol intake (g/day) | 8.8 (11) | 10.2 (12) | 11.7 (11) | 0.665 | 5.6 (8) | 6.1 (11) | 0.731 |
| Iron (mg/day) | 18.4 (6) | 17.5 (4) | 18.0 (5) | 0.704 | 19.5 (9) | 19.0 (6) | 0.815 |
| Vitamin C (mg/day) | |||||||
| Food Groups | |||||||
| Vegetables (g/day) | 303.5 (143) | 337.1 (183) | 267.5 (129) | 0.121 | 304.6 (101) | 304.3 (131) | 1.000 |
| Fruits (g/day) | 289.4 (195) | 326.6 (183) | 234.7 (180) | 0.016 | 287.8 (203) | 313.9 (219) | 0.782 |
| Legumes (g/day) | 19.7 (9) | 20.9 (8) | 18.1 (7) | 0.193 | 20.0 (15) | 19.6 (7) | 0.388 |
| Cereals (g/day) | 187 (123) | 155.0 (103) | 213.1 (131) | 0.101 | 210.9 (159) | 171.2 (82) | 0.678 |
| Dairy products (g/day) | 397.2 (415) | 331.1 (209) | 299.0 (169) | 0.546 | 440.0 (412) | 583.9 (726) | 0.349 |
| Meat (g/day) | 189.8 (75) | 155.3 (58) | 215.4 (61) | <0.001 | 199.5 (64) | 193.7 (104) | 0.217 |
| Fish (g/day) | 91.1 (44) | 103.4 (45) | 74.0 (36) | 0.005 | 89.8 (51) | 98.7 (39) | 0.580 |
| Dietary Quality Indices | |||||||
| Glycemic Index | 53.7 (7) | 51.8 (5) | 55.1 (8) | 0.006 | 54.1 (7) | 54.2 (6) | 0.798 |
| Glycemic Load | 161.7 (81) | 140.9 (58) | 176.2 (104) | 0.213 | 165.6 (81) | 167.1 (71) | 0.949 |
| Total Antioxidant Capacity (mmol/day) | 10.7 (4) | 10.5 (4) | 10.7 (4) | 0.854 | 10.7 (4) | 11.2 (5) | 0.949 |
| Mediterranean diet score (points) | 6.3 (3) | 7.6 (4) | 5.5 (2) | 0.005 | 5.9 (2) | 6.0 (2) | 0.956 |
| Ferritin (ng/mL) | |||
|---|---|---|---|
| r | p | 95% CI | |
| Glucose Metabolism Variables | |||
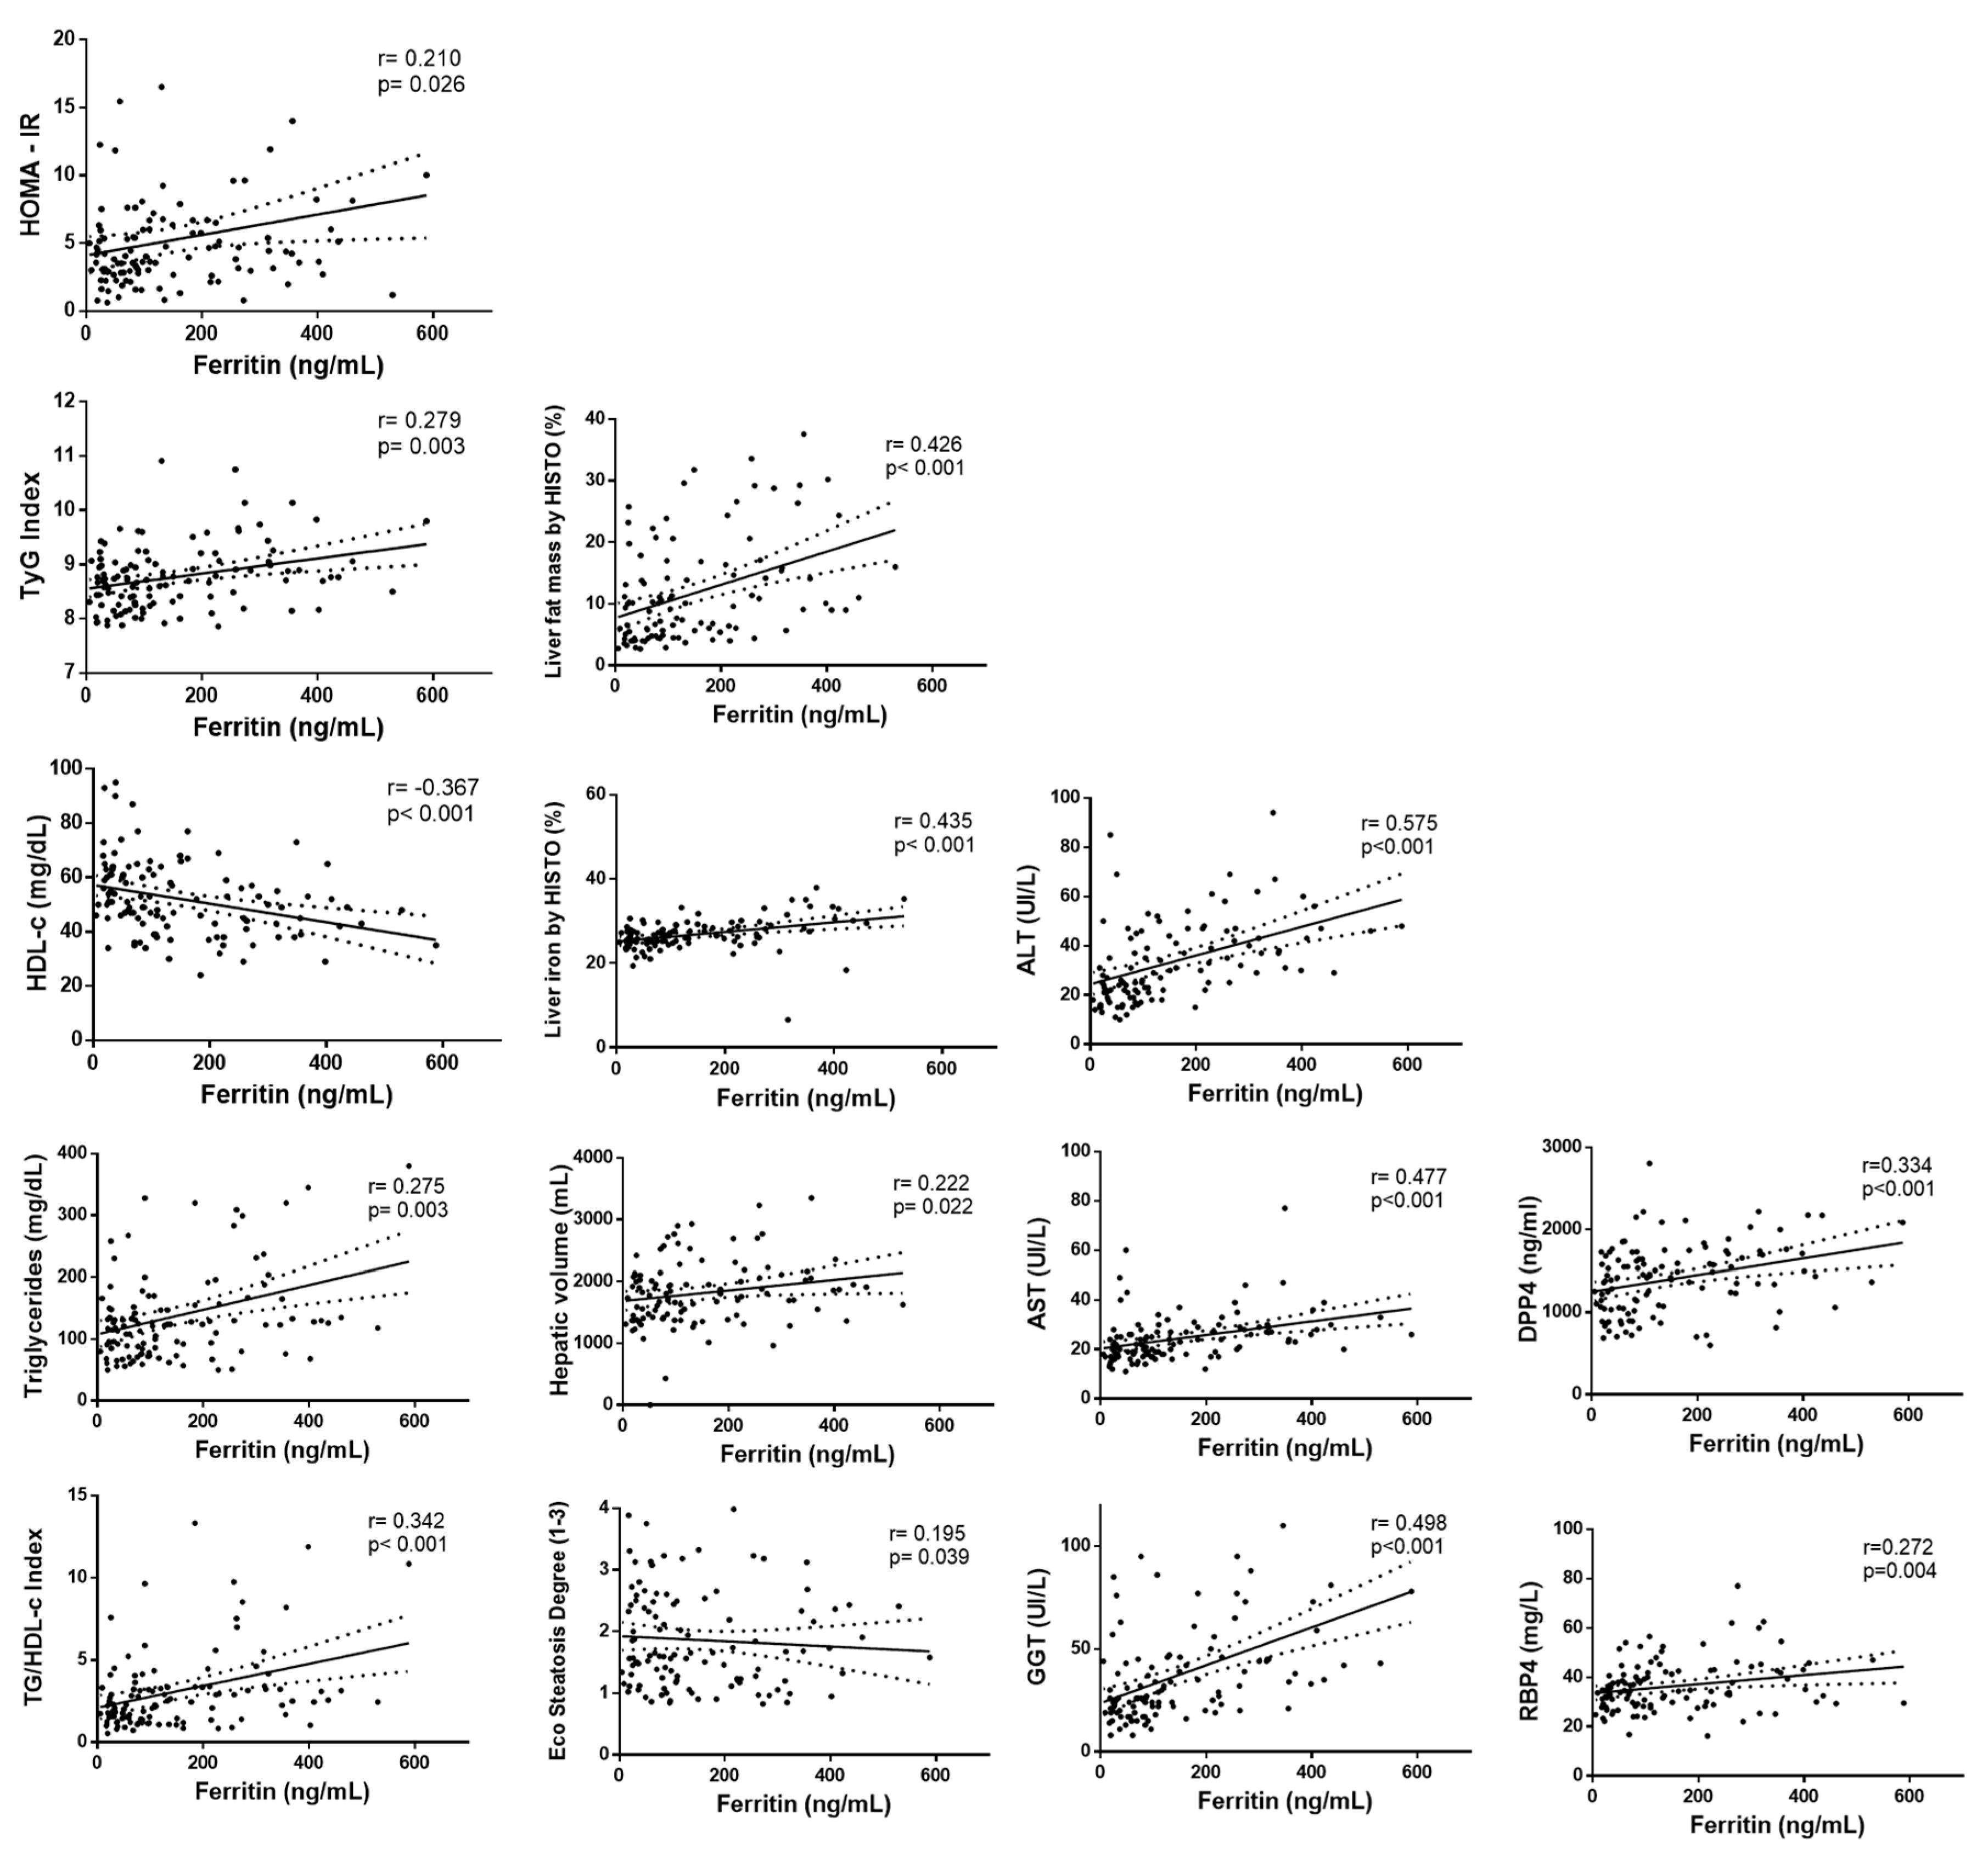
| Glucose (mg/d) | 0.088 | 0.358 | −0.100; 0.269 |
| Insulin (mU/L) | 0.185 | 0.050 | −0.000; 0.359 |
| HbA1c (%) | 0.050 | 0.605 | −0.152; 0.220 |
| HOMA-IR | 0.210 | 0.026 | 0.025; 0.380 |
| TyG index | 0.279 | 0.003 | 0.099; 0.442 |
| Lipid Metabolism Variables | |||
| Total cholesterol (mg/dL) | 0.018 | 0.848 | −0.168; 0.203 |
| LDL cholesterol (mg/dL) | 0.011 | 0.905 | −0.175; 0.197 |
| HDL cholesterol (mg/dL) | −0.367 | <0.001 | −0.518; −0.195 |
| Triglyceride (mg/dL) | 0.275 | 0.003 | 0.094; 0.438 |
| TG/HDL-c index | 0.342 | <0.001 | 0.167; 0.496 |
| Liver Status Variables | |||
| ALT (IU/L) | 0.575 | <0.001 | 0.436; 0.687 |
| AST (IU/L) | 0.477 | <0.001 | 0.320; 0.609 |
| GGT (IU/L) | 0.498 | <0.001 | 0.344; 0.626 |
| Liver fat mass (%) | 0.426 | <0.001 | 0.255; 0.571 |
| Liver Iron (%) | 0.435 | <0.001 | 0.266; 0.579 |
| Hepatic Volume (mL) | 0.222 | 0.022 | 0.032; 0.396 |
| Eco Steatosis Degree (1–3) | 0.195 | 0.039 | 0.020; 0.280 |
| Blood Cytokines Concentrations | |||
| FGF21 | 0.070 | 0.465 | −0.117; 0.252 |
| DPP4 | 0.334 | <0.001 | 0.158; 0.489 |
| Adiponectin | −0.139 | 0.145 | −0.316; 0.048 |
| RBP4 | 0.272 | 0.004 | 0.091; 0.435 |
References
- Chalasani, N.; Younossi, Z.; Lavine, J.E.; Charlton, M.; Cusi, K.; Rinella, M.; Harrison, S.A.; Brunt, E.M.; Sanyal, A.J. The diagnosis and management of nonalcoholic fatty liver disease: Practice guidance from the American Association for the Study of Liver Diseases. Hepatology 2018, 67, 328–357. [Google Scholar] [CrossRef] [PubMed]
- Younossi, Z.M.; Koenig, A.B.; Abdelatif, D.; Fazel, Y.; Henry, L.; Wymer, M. Global epidemiology of nonalcoholic fatty liver disease-Meta-analytic assessment of prevalence, incidence, and outcomes. Hepatology 2016, 64, 73–84. [Google Scholar] [CrossRef] [PubMed]
- Byrne, C.D.; Targher, G. NAFLD: A multisystem disease. J. Hepatol. 2015, 62, S47–S64. [Google Scholar] [CrossRef] [PubMed]
- Younossi, Z.M.; Stepanova, M.; Afendy, M.; Fang, Y.; Younossi, Y.; Mir, H.; Srishord, M. Changes in the prevalence of the most common causes of chronic liver diseases in the United States from 1988 to 2008. Clin. Gastroenterol. Hepatol. 2011, 9, 524–530.e1, quiz e60. [Google Scholar] [CrossRef] [PubMed]
- McGettigan, B.; McMahan, R.; Orlicky, D.; Burchill, M.; Danhorn, T.; Francis, P.; Cheng, L.L.; Golden-Mason, L.; Jakubzick, C.V.; Rosen, H.R. Dietary Lipids Differentially Shape Nonalcoholic Steatohepatitis Progression and the Transcriptome of Kupffer Cells and Infiltrating Macrophages. Hepatology 2019, 70, 67–83. [Google Scholar] [CrossRef] [PubMed]
- Perez-Diaz-Del-Campo, N.; Abete, I.; Cantero, I.; Marin-Alejandre, B.A.; Monreal, J.I.; Elorz, M.; Herrero, J.I.; Benito-Boillos, A.; Riezu-Boj, J.I.; Milagro, F.I.; et al. Association of the SH2B1 rs7359397 Gene Polymorphism with Steatosis Severity in Subjects with Obesity and Non-Alcoholic Fatty Liver Disease. Nutrients 2020, 12, 1260. [Google Scholar] [CrossRef] [PubMed]
- Marin-Alejandre, B.A.; Abete, I.; Cantero, I.; Monreal, J.I.; Elorz, M.; Herrero, J.I.; Benito-Boillos, A.; Quiroga, J.; Martinez-Echeverria, A.; Uriz-Otano, J.I.; et al. The Metabolic and Hepatic Impact of Two Personalized Dietary Strategies in Subjects with Obesity and Nonalcoholic Fatty Liver Disease: The Fatty Liver in Obesity (FLiO) Randomized Controlled Trial. Nutrients 2019, 11, 2543. [Google Scholar] [CrossRef]
- Recaredo, G.; Marin-Alejandre, B.A.; Cantero, I.; Monreal, J.I.; Herrero, J.I.; Benito-Boillos, A.; Elorz, M.; Tur, J.A.; Martínez, J.A.; Zulet, M.A.; et al. Association between Different Animal Protein Sources and Liver Status in Obese Subjects with Non-Alcoholic Fatty Liver Disease: Fatty Liver in Obesity (FLiO) Study. Nutrients 2019, 11, 2359. [Google Scholar] [CrossRef]
- Cantero, I.; Elorz, M.; Abete, I.; Marin, B.A.; Herrero, J.I.; Monreal, J.I.; Benito, A.; Quiroga, J.; Martínez, A.; Huarte, M.P.; et al. Ultrasound/Elastography techniques, lipidomic and blood markers compared to Magnetic Resonance Imaging in non-alcoholic fatty liver disease adults. Int. J. Med. Sci. 2019, 16, 75–83. [Google Scholar] [CrossRef]
- Chang, Y.; Cho, Y.K.; Cho, J.; Jung, H.S.; Yun, K.E.; Ahn, J.; Sohn, C.I.; Shin, H.; Ryu, S. Alcoholic and Nonalcoholic Fatty Liver Disease and Liver-Related Mortality: A Cohort Study. Am. J. Gastroenterol. 2019, 114, 620–629. [Google Scholar] [CrossRef]
- Wong, V.W.; Adams, L.A.; de Lédinghen, V.; Wong, G.L.; Sookoian, S. Noninvasive biomarkers in NAFLD and NASH—Current progress and future promise. Nat. Rev. Gastroenterol. Hepatol. 2018, 15, 461–478. [Google Scholar] [CrossRef] [PubMed]
- Spivak, I.; Arora, J.; Meinzer, C.; Durkalski-Mauldin, V.; Lee, W.M.; Trautwein, C.; Fontana, R.J.; Strnad, P.; Acute Liver Failure Study Group (ALFSG). Low Serum Hepcidin Is Associated with Reduced Short-Term Survival in Adults with Acute Liver Failure. Hepatology 2019, 69, 2136–2149. [Google Scholar] [CrossRef]
- Fernández-Real, J.M.; McClain, D.; Manco, M. Mechanisms Linking Glucose Homeostasis and Iron Metabolism Toward the Onset and Progression of Type 2 Diabetes. Diabetes Care 2015, 38, 2169–2176. [Google Scholar] [CrossRef] [PubMed]
- Britton, L.; Bridle, K.; Reiling, J.; Santrampurwala, N.; Wockner, L.; Ching, H.; Stuart, K.; Subramaniam, V.N.; Jeffrey, G.; St Pierre, T.; et al. Hepatic iron concentration correlates with insulin sensitivity in nonalcoholic fatty liver disease. Hepatol. Commun. 2018, 2, 644–653. [Google Scholar] [CrossRef]
- Mehta, K.J.; Farnaud, S.J.; Sharp, P.A. Iron and liver fibrosis: Mechanistic and clinical aspects. World J. Gastroenterol. 2019, 25, 521–538. [Google Scholar] [CrossRef]
- Elin, R.J.; Wolff, S.M.; Finch, C.A. Effect of induced fever on serum iron and ferritin concentrations in man. Blood 1977, 49, 147–153. [Google Scholar] [CrossRef] [PubMed]
- Daru, J.; Colman, K.; Stanworth, S.J.; De La Salle, B.; Wood, E.M.; Pasricha, S.R. Serum ferritin as an indicator of iron status: What do we need to know? Am. J. Clin. Nutr. 2017, 106, 1634S–1639S. [Google Scholar] [CrossRef]
- Valenti, L.; Dongiovanni, P.; Piperno, A.; Fracanzani, A.L.; Maggioni, M.; Rametta, R.; Loria, P.; Casiraghi, M.A.; Suigo, E.; Ceriani, R.; et al. Alpha 1-antitrypsin mutations in NAFLD: High prevalence and association with altered iron metabolism but not with liver damage. Hepatology 2006, 44, 857–864. [Google Scholar] [CrossRef]
- Shah, R.A.; Kowdley, K.V. Serum ferritin as a biomarker for NAFLD: Ready for prime time? Hepatol Int. 2019, 13, 110–112. [Google Scholar] [CrossRef]
- Hagström, H.; Nasr, P.; Bottai, M.; Ekstedt, M.; Kechagias, S.; Hultcrantz, R.; Stål, P. Elevated serum ferritin is associated with increased mortality in non-alcoholic fatty liver disease after 16 years of follow-up. Liver Int. 2016, 36, 1688–1695. [Google Scholar] [CrossRef]
- Sanyal, A.J.; Brunt, E.M.; Kleiner, D.E.; Kowdley, K.V.; Chalasani, N.; Lavine, J.E.; Ratziu, V.; McCullough, A. Endpoints and clinical trial design for nonalcoholic steatohepatitis. Hepatology 2011, 54, 344–353. [Google Scholar] [CrossRef] [PubMed]
- Zulet, M.A.; Bondia-Pons, I.; Abete, I.; de la Iglesia, R.; López-Legarrea, P.; Forga, L.; Navas-Carretero, S.; Martínez, J.A. The reduction of the metabolyc syndrome in Navarra-Spain (RESMENA-S) study: A multidisciplinary strategy based on chrononutrition and nutritional education, together with dietetic and psychological control. Nutr. Hosp. 2011, 26, 16–26. [Google Scholar] [PubMed]
- Friedewald, W.T.; Levy, R.I.; Fredrickson, D.S. Estimation of the concentration of low-density lipoprotein cholesterol in plasma, without use of the preparative ultracentrifuge. Clin. Chem. 1972, 18, 499–502. [Google Scholar] [CrossRef] [PubMed]
- Acosta, A.M.; Escalona, M.; Maiz, A.; Pollak, F.; Leighton, F. Determinación del índice de resistencia insulínica mediante HOMA en una población de la región metropolitana de Chile [Determination of the insulin resistance index by the Homeostasis Model Assessment in a population of Metropolitan Region in Chile]. Rev. Med. Chil. 2002, 130, 1227–1231. [Google Scholar] [CrossRef]
- Navarro-González, D.; Sánchez-Íñigo, L.; Pastrana-Delgado, J.; Fernández-Montero, A.; Martinez, J.A. Triglyceride-glucose index (TyG index) in comparison with fasting plasma glucose improved diabetes prediction in patients with normal fasting glucose: The Vascular-Metabolic CUN cohort. Prev. Med. 2016, 86, 99–105. [Google Scholar] [CrossRef]
- Dobiásová, M.; Frohlich, J. The plasma parameter log (TG/HDL-C) as an atherogenic index: Correlation with lipoprotein particle size and esterification rate in apoB-lipoprotein-depleted plasma (FER(HDL)). Clin. Biochem. 2001, 34, 583–588. [Google Scholar] [CrossRef]
- Lee, S.S.; Park, S.H. Radiologic evaluation of nonalcoholic fatty liver disease. World J. Gastroenterol. 2014, 20, 7392–7402. [Google Scholar] [CrossRef] [PubMed]
- Pineda, N.; Sharma, P.; Xu, Q.; Hu, X.; Vos, M.; Martin, D.R. Measurement of hepatic lipid: High-speed T2-corrected multiecho acquisition at 1H MR spectroscopy—A rapid and accurate technique. Radiology 2009, 252, 568–576. [Google Scholar] [CrossRef]
- Martin-Moreno, J.M.; Boyle, P.; Gorgojo, L.; Maisonneuve, P.; Fernandez-Rodriguez, J.C.; Salvini, S.; Willett, W.C. Development and validation of a food frequency questionnaire in Spain. Int. J. Epidemiol. 1993, 22, 512–519. [Google Scholar] [CrossRef]
- Fernández-Ballart, J.D.; Piñol, J.L.; Zazpe, I.; Corella, D.; Carrasco, P.; Toledo, E.; Perez-Bauer, M.; Martínez-González, M.A.; Salas-Salvadó, J.; Martín-Moreno, J.M. Relative validity of a semi-quantitative food-frequency questionnaire in an elderly Mediterranean population of Spain. Br. J. Nutr. 2010, 103, 1808–1816. [Google Scholar] [CrossRef]
- Galarregui, C.; Zulet, M.Á.; Cantero, I.; Marín-Alejandre, B.A.; Monreal, J.I.; Elorz, M.; Benito-Boillos, A.; Herrero, J.I.; Tur, J.A.; Abete, I.; et al. Interplay of Glycemic Index, Glycemic Load, and Dietary Antioxidant Capacity with Insulin Resistance in Subjects with a Cardiometabolic Risk Profile. Int. J. Mol. Sci. 2018, 19, 3662. [Google Scholar] [CrossRef]
- PLoS ONE Staff. Correction: Lifestyle factors and visceral adipose tissue: Results from the PREDIMED-PLUS study. PLoS ONE 2019, 14, e0214837, Erratum for: PLoS ONE 2019, 14, e0210726. [Google Scholar] [CrossRef]
- Harrell, F.E., Jr. Regression Modeling Strategies. In Applications to Linear Models, Logistic and Ordinal Regression, and Survival Analysis, 2nd ed.; Springer: New York, NY, USA, 2015. [Google Scholar] [CrossRef]
- Arosio, P.; Ingrassia, R.; Cavadini, P. Ferritins: A family of molecules for iron storage, antioxidation and more. Biochim. Biophys. Acta 2009, 1790, 589–599. [Google Scholar] [CrossRef]
- Jung, J.Y.; Shim, J.J.; Park, S.K.; Ryoo, J.H.; Choi, J.M.; Oh, I.H.; Jung, K.W.; Cho, H.; Ki, M.; Won, Y.J.; et al. Serum ferritin level is associated with liver steatosis and fibrosis in Korean general population. Hepatol. Int. 2019, 13, 222–233. [Google Scholar] [CrossRef]
- McKay, A.; Wilman, H.R.; Dennis, A.; Kelly, M.; Gyngell, M.L.; Neubauer, S.; Bell, J.D.; Banerjee, R.; Thomas, E.L. Measurement of liver iron by magnetic resonance imaging in the UK Biobank population. PLoS ONE 2018, 13, e0209340. [Google Scholar] [CrossRef] [PubMed]
- Pan, X.; Chen, B.; Liu, W.; Li, Y.; Hu, Z.; Lin, X.; Xu, S.; Peng, X.E. Circulating Iron Levels Interaction with Central Obesity on the Risk of Nonalcoholic Fatty Liver Disease: A Case-Control Study in Southeast China. Ann. Nutr. Metab. 2019, 74, 207–214. [Google Scholar] [CrossRef]
- Sabrina, N.; Bai, C.H.; Chang, C.C.; Chien, Y.W.; Chen, J.R.; Chang, J.S. Serum Iron:Ferritin Ratio Predicts Healthy Body Composition and Reduced Risk of Severe Fatty Liver in Young Adult Women. Nutrients 2017, 9, 833. [Google Scholar] [CrossRef]
- Ryan, J.D.; Armitage, A.E.; Cobbold, J.F.; Banerjee, R.; Borsani, O.; Dongiovanni, P.; Neubauer, S.; Morovat, R.; Wang, L.M.; Pasricha, S.R.; et al. Hepatic iron is the major determinant of serum ferritin in NAFLD patients. Liver Int. 2018, 38, 164–173. [Google Scholar] [CrossRef]
- Ma, H.; Lin, H.; Hu, Y.; Li, X.; He, W.; Jin, X.; Gao, J.; Zhao, N.; Pan, B.; Gao, X. Serum ferritin levels are associated with insulin resistance in Chinese men and post-menopausal women: The Shanghai Changfeng study. Br. J. Nutr. 2018, 120, 863–871. [Google Scholar] [CrossRef]
- Simcox, J.A.; McClain, D.A. Iron and diabetes risk. Cell Metab. 2013, 17, 329–341. [Google Scholar] [CrossRef]
- Marchisello, S.; Di Pino, A.; Scicali, R.; Urbano, F.; Piro, S.; Purrello, F.; Rabuazzo, A.M. Pathophysiological, Molecular and Therapeutic Issues of Nonalcoholic Fatty Liver Disease: An Overview. Int. J. Mol. Sci. 2019, 20, 1948. [Google Scholar] [CrossRef]
- Liu, J.; Sun, B.; Yin, H.; Liu, S. Hepcidin: A Promising Therapeutic Target for Iron Disorders: A Systematic Review. Medicine 2016, 95, e3150. [Google Scholar] [CrossRef]
- Arvind, A.; Osganian, S.A.; Cohen, D.E.; Corey, K.E. Lipid and Lipoprotein Metabolism in Liver Disease 2019. In Endotext [Internet]; Feingold, K.R., Anawalt, B., Boyce, A., Chrousos, G., de Herder, W.W., Dungan, K., Grossman, A., Hershman, J.M., Hofland, H.J., Kaltsas, G., et al., Eds.; MDText.com, Inc.: South Dartmouth, MA, USA, 2000. [Google Scholar]
- Suárez-Ortegón, M.F.; Ensaldo-Carrasco, E.; Shi, T.; McLachlan, S.; Fernández-Real, J.M.; Wild, S.H. Ferritin, metabolic syndrome and its components: A systematic review and meta-analysis. Atherosclerosis 2018, 275, 97–106. [Google Scholar] [CrossRef]
- Dongiovanni, P.; Anstee, Q.M.; Valenti, L. Genetic predisposition in NAFLD and NASH: Impact on severity of liver disease and response to treatment. Curr. Pharm. Des. 2013, 19, 5219–5238. [Google Scholar] [CrossRef]
- Zelber-Sagi, S.; Ivancovsky-Wajcman, D.; Fliss Isakov, N.; Webb, M.; Orenstein, D.; Shibolet, O.; Kariv, R. High red and processed meat consumption is associated with non-alcoholic fatty liver disease and insulin resistance. J. Hepatol. 2018, 68, 1239–1246. [Google Scholar] [CrossRef]
- Quintana Pacheco, D.A.; Sookthai, D.; Wittenbecher, C.; Graf, M.E.; Schübel, R.; Johnson, T.; Katzke, V.; Jakszyn, P.; Kaaks, R.; Kühn, T. Red meat consumption and risk of cardiovascular diseases-is increased iron load a possible link? Am. J. Clin. Nutr. 2018, 107, 113–119. [Google Scholar] [CrossRef]
- Zhu, Z.; Wu, F.; Lu, Y.; Wu, C.; Wang, Z.; Zang, J.; Guo, C.; Jia, X.; Yao, J.; Peng, H.; et al. Total and Nonheme Dietary Iron Intake Is Associated with Metabolic Syndrome and Its Components in Chinese Men and Women. Nutrients 2018, 10, 1663. [Google Scholar] [CrossRef]
- Nogueira, M.A.; Oliveira, C.P.; Ferreira Alves, V.A.; Stefano, J.T.; Rodrigues, L.S.; Torrinhas, R.S.; Cogliati, B.; Barbeiro, H.; Carrilho, F.J.; Waitzberg, D.L. Omega-3 polyunsaturated fatty acids in treating non-alcoholic steatohepatitis: A randomized, double-blind, placebo-controlled trial. Clin. Nutr. 2016, 35, 578–586. [Google Scholar] [CrossRef] [PubMed]
- Ma, Y.; Yang, W.; Li, T.; Liu, Y.; Simon, T.G.; Sui, J.; Wu, K.; Giovannucci, E.L.; Chan, A.T.; Zhang, X. Meat intake and risk of hepatocellular carcinoma in two large US prospective cohorts of women and men. Int. J. Epidemiol. 2019, 48, 1863–1871. [Google Scholar] [CrossRef]
- Kühn, J.P.; Meffert, P.; Heske, C.; Kromrey, M.L.; Schmidt, C.O.; Mensel, B.; Völzke, H.; Lerch, M.M.; Hernando, D.; Mayerle, J.; et al. Prevalence of Fatty Liver Disease and Hepatic Iron Overload in a Northeastern German Population by Using Quantitative MR Imaging. Radiology 2017, 284, 706–716. [Google Scholar] [CrossRef]


| Characteristics | Overall (n = 112) | Serum Ferritin Tertiles | p-Value | ||
|---|---|---|---|---|---|
| T1 (n = 38) | T2 (n = 37) | T3 (n = 37) | |||
| Serum ferritin level (ng/mL) | 100.7 (51; 226) | 5.3 to <68.7 | 68.7 to <177.1 | 177.1 to <588.1 | |
| Age (years) | 51.0 (45; 56) | 53 (48; 64) | 47 (43; 52) * | 51 (46; 56) | 0.006 |
| Sex (male/female) | 65/47 | 22/16 | 22/16 | 21/15 | 0.999 |
| BMI (kg/m2) | 33.5 (31; 36) | 34.0 (32; 36) | 33.6 (31; 36) | 31.9 (31; 35) | 0.152 |
| Physical activity (%) | |||||
| Never | 41.1 | 47.4 | 34.2 | 41.7 | 0.440 |
| Mild | 23.2 | 26.3 | 21.0 | 22.2 | |
| Moderated | 23.2 | 13.2 | 31.6 | 25.0 | |
| Elevated | 12.5 | 13.2 | 13.2 | 11.1 | |
| Cardiometabolic Risk Factors | |||||
| Waist circumference (cm) | 108.9 (104; 116) | 114.1 (105; 118) | 108.8 (101; 115) | 106.8 (102; 112) | 0.142 |
| Total fat mass (kg) | 38.2 (33; 44) | 39.7 (35; 46) | 39.6 (34; 45) | 35.4 (32; 41) | 0.128 |
| Visceral fat mass (kg) | 2.2 (2; 3) | 2.3 (2; 3) | 2.1 (2; 3) | 2.1 (1; 3) | 0.399 |
| Systolic blood pressure (mmHg) | 130.0 (122; 142) | 132.0 (124; 143) | 130.0 (121; 142) | 127.5 (120; 139) | 0.433 |
| Diastolic blood pressure (mmHg) | 87.0 (80; 92) | 87.5 (82; 93) | 88.0 (83; 92) | 85.0 (79; 91) | 0.493 |
| Glucose Metabolism Variables | |||||
| Glucose (mg/dL) | 102.0 (93; 111) | 103.5 (97; 112) | 97.5 (91; 111) | 100.5 (91; 109) | 0.217 |
| Insulin (mU/L) | 16.4 (11; 23) | 16.5 (12; 21) | 13.1 (9; 21) | 19.3 (13; 25) | 0.097 |
| HbA1c (%) | 5.6 (5; 6) | 5.7 (5; 6) | 5.5 (5; 6) | 5.6 (5; 6) | 0.081 |
| HOMA-IR | 4.1 (3; 6) | 4.2 (3; 6) | 3.3 (2; 6) | 4.6 (3; 7) | 0.102 |
| TyG index | 8.8 (8; 9) | 8.7 (8; 9) | 8.7 (8; 9) | 8.7 (8; 9) | 0.873 |
| TG/HDL-c index | 2.4 (1; 3) | 2.2 (2; 3) | 2.5 (1; 3) | 2.5 (1; 3) | 0.851 |
| Lipid Metabolism Variables | |||||
| Total cholesterol (mg/dL) | 199.5 (167; 225) | 185.5 (159; 234) | 210.0 (161; 232) | 201.5 (178; 213) | 0.847 |
| LDL cholesterol (mg/dL) | 118.4 (91; 143) | 113.8 (93; 145) | 120.1 (86; 144) | 128.2 (99; 138) | 0.948 |
| HDL cholesterol (mg/dL) | 50.0 (43; 61) | 52.0 (46; 61) | 47.5 (41; 64) | 49.0 (40; 58) | 0.417 |
| Triglyceride (mg/dL) | 123.0 (82; 156) | 121.0 (91; 150) | 123.0 (89; 147) | 123.5 (76; 172) | 0.992 |
| Liver Status Variables | |||||
| ALT (IU/L) | 29.0 (21; 43) | 23.0 (19; 28) | 29.5 (18; 46) | 38.5 (29; 47) #† | <0.001 |
| AST (IU/L) | 22.5 (18; 28) | 20.5 (17; 25) | 20.5 (17; 28) | 26.5 (21; 33) #† | 0.003 |
| GGT (IU/L) | 29.0 (20; 45) | 25.0 (19; 34) | 29.5 (20; 46) | 39.0 (22; 62) # | 0.043 |
| Liver fat mass (%) | 9.4 (5; 16) | 9.4 (5; 13) | 6.0 (4; 11) | 14.2 (9; 22) #† | 0.002 |
| Liver iron (%) | 26.6 (25; 29) | 26.0 (25; 27) | 26.1 (25; 28) | 28.6 (26; 32) #† | 0.006 |
| Hepatic volume (mL) | 1791 (1425; 2078) | 1922 (1397; 2131) | 1676 (1425; 1956) | 1701 (1474; 2054) | 0.480 |
| Eco steatosis degree (1–3 range) | 1.6 (1; 2) | 1.6 (1; 2) | 1.7 (1; 3) | 1.6 (1; 2) | 0.493 |
| Characteristics | Overall (n = 112) | Serum Ferritin Tertiles | p-Value | ||
|---|---|---|---|---|---|
| T1 (n = 38) | T2 (n = 37) | T3 (n = 37) | |||
| Serum ferritin level (ng/mL) | 100.7 (51; 226) | 5.3 to <68.7 | 68.7 to <177.1 | 177.1 to <588.1 | |
| Nutrients | |||||
| Energy intake (kcal/day) | 2559 (2057; 3085) | 2541 (2031; 3241) | 2650 (1941; 3001) | 2548 (2173; 3085) | 0.866 |
| Carbohydrates (%E) | 43.3 (39; 48) | 44.4 (39; 48) | 42.0 (38; 45) | 45.2 (40; 49) | 0.118 |
| Proteins (%E) | 16.8 (15; 19) | 15.8 (14; 19) | 17.8 (15; 20) | 16.7 (15; 19) | 0.113 |
| Lipids (%E) | 36.5 (32; 42) | 37.0 (31; 41) | 37.7 (34; 43) | 34.7 (33; 42) | 0.506 |
| Fiber (g/day) | 24.1 (19; 30) | 24.7 (19; 31) | 24.3 (18; 29) | 23.2 (18; 28) | 0.586 |
| Alcohol intake (g/day) | 5.4 (1; 12) | 6.8 (1; 12) | 4.4 (1; 11) | 4.8 (1; 13) | 0.686 |
| Iron (mg/day) | 17.1 (15; 21) | 16.9 (15; 22) | 17.2 (14; 21) | 17.6 (15; 21) | 0.809 |
| Vitamin C (mg/day) | 180.1 (133; 242) | 187.0 (134; 247) | 181.0 (151; 264) | 165.1 (101; 227) | 0.276 |
| Food Groups | |||||
| Vegetables (g/day) | 283.6 (205; 380) | 270.2 (220; 348) | 303.1 (212; 402) | 277.3 (161; 375) | 0.602 |
| Fruits (g/day) | 246.3 (142; 454) | 262.1 (165; 504) | 290.7 (163; 468) | 190.1 (127; 357) | 0.206 |
| Legumes (g/day) | 16.8 (12; 25) | 16.8 (12; 25) | 16.5 (12; 25) | 20.5 (16; 25) | 0.812 |
| Cereals (g/day) | 197.9 (83; 228) | 198.8 (75; 222) | 197.7 (83; 221) | 198.0 (101; 235) | 0.602 |
| Dairy products (g/day) | 308.7 (234; 466) | 308.7 (231; 435) | 314.4 (254; 484) | 314.8 (227; 530) | 0.750 |
| Meat (g/day) | 187.9 (139; 237) | 151.7 (111; 211) | 210.2 (147; 256) * | 206.2 (140; 237) # | 0.012 |
| Fish (g/day) | 88.5 (60; 122) | 104.3 (69; 136) | 86.6 (60; 135) | 76.9 (53; 101) # | 0.033 |
| Nuts (g/day) | 6.0 (2; 15) | 4.2 (0; 25) | 6.0 (2; 15) | 6.0 (2; 12) | 0.999 |
| Dietary Quality Indices | |||||
| Glycemic index | 54.7 (49; 59) | 54.3 (47; 59) | 53.4 (50; 57) | 56.3 (51; 59) | 0.234 |
| Glycemic load | 153.2 (101; 194) | 158.8 (91; 203) | 140.2 (93; 185) | 153.8 (125; 192) | 0.543 |
| Total antioxidant capacity (mmol/day) | 9.7 (8; 13) | 9.6 (8; 12) | 10.5 (8; 14) | 9.7 (8; 13) | 0.773 |
| Mediterranean diet score (points) | 6.0 (5; 7) | 6.5 (5; 8) | 6.0 (5; 7) | 6.0 (4; 7) | 0.057 |
| Variables | Model 1 β (95% CI) | p-Value | Model 2 β (95% CI) | p-Value | Model 3 β (95% CI) | p-Value | Model 4 β (95% CI) | p-Value | Model 5 β (95% CI) | p-Value | Model 6 β (95% CI) | p-Value |
|---|---|---|---|---|---|---|---|---|---|---|---|---|
| ALT level (n = 112) | ||||||||||||
| Serum ferritin level (ng/mL) | ||||||||||||
| T1 (5.3-68.7) | 1.00 (ref.) | 1.00 (ref.) | 1.00 (ref.) | 1.00 (ref.) | 1.00 (ref.) | 1.00 (ref.) | ||||||
| T2 (68.7–177.1) | 6.00 (−1.19; 13.19) | 0.101 | 5.28 (−1.66; 12.22) | 0.134 | 4.79 (−3.11; 12.69) | 0.232 | 5.66 (−2.62; 13.96) | 0.178 | 5.38 (−2.28; 13.04) | 0.167 | 5.40 (−2.58; 13.38) | 0.183 |
| T3 (177.1–588.1) | 18.76 (10.70; 26.82) | <0.001 | 22.10 (13.89; 30.31) | <0.001 | 20.76 (11.79; 29.74) | <0.001 | 20.57 (11.07; 30.07) | <0.001 | 19.21 (10.39; 28.03) | <0.001 | 21.19 (12.14; 30.24) | <0.001 |
| Liver fat (n = 112) | ||||||||||||
| Serum ferritin level (ng/mL) | ||||||||||||
| T1 (5.3–68.7) | 1.00 (ref.) | 1.00 (ref.) | 1.00 (ref.) | 1.00 (ref.) | 1.00 (ref.) | 1.00 (ref.) | ||||||
| T2 (68.7–177.1) | 4.06 (−1.27; 9.39) | 0.134 | 2.82 (−2.0; 7.66) | 0.249 | 2.84 (−2.31; 8.00) | 0.277 | 2.41 (−1.71; 6.54) | 0.249 | 3.69 (−1.94; 9.32) | 0.196 | 2.22 (−2.59; 7.04) | 0.361 |
| T3 (177.1–588.1) | 9.09 (3.19; 14.99) | 0.003 | 9.81 (4.16; 15.47) | 0.001 | 10.04 (4.29; 15.78) | 0.001 | 6.42 (1.77; 11.08) | 0.007 | 8.70 (2.37; 15.03) | 0.008 | 8.71 (3.35; 14.06) | 0.002 |
| Liver iron (n = 112) | ||||||||||||
| Serum ferritin level (ng/mL) | ||||||||||||
| T1 (5.3–68.7) | 1.00 (ref.) | 1.00 (ref.) | 1.00 (ref.) | 1.00 (ref.) | 1.00 (ref.) | 1.00 (ref.) | ||||||
| T2 (68.7–177.1) | 1.61 (−0.44; 3.66) | 0.122 | 1.08 (−0.91; 3.06) | 0.285 | 1.16 (−0.52; 2.85) | 0.174 | 1.11 (−0.65; 2.88) | 0.212 | 1.26 (−0.45; 2.97) | 0.147 | 0.84 (−1.18; 2.86) | 0.410 |
| T3 (177.1–588.1) | 3.44 (1.18; 5.71) | 0.003 | 2.61 (0.29; 4.93) | 0.028 | 3.69 (1.81; 5.57) | <0.001 | 3.72 (1.73; 5.71) | <0.001 | 3.76 (1.84; 5.69) | <0.001 | 4.20 (1.96; 6.45) | <0.001 |
Publisher’s Note: MDPI stays neutral with regard to jurisdictional claims in published maps and institutional affiliations. |
© 2020 by the authors. Licensee MDPI, Basel, Switzerland. This article is an open access article distributed under the terms and conditions of the Creative Commons Attribution (CC BY) license (http://creativecommons.org/licenses/by/4.0/).
Share and Cite
Galarregui, C.; Marin-Alejandre, B.A.; Perez-Diaz-Del-Campo, N.; Cantero, I.; Monreal, J.I.; Elorz, M.; Benito-Boillos, A.; Herrero, J.I.; Tur, J.A.; Martínez, J.A.; et al. Predictive Value of Serum Ferritin in Combination with Alanine Aminotransferase and Glucose Levels for Noninvasive Assessment of NAFLD: Fatty Liver in Obesity (FLiO) Study. Diagnostics 2020, 10, 917. https://doi.org/10.3390/diagnostics10110917
Galarregui C, Marin-Alejandre BA, Perez-Diaz-Del-Campo N, Cantero I, Monreal JI, Elorz M, Benito-Boillos A, Herrero JI, Tur JA, Martínez JA, et al. Predictive Value of Serum Ferritin in Combination with Alanine Aminotransferase and Glucose Levels for Noninvasive Assessment of NAFLD: Fatty Liver in Obesity (FLiO) Study. Diagnostics. 2020; 10(11):917. https://doi.org/10.3390/diagnostics10110917
Chicago/Turabian StyleGalarregui, Cristina, Bertha Araceli Marin-Alejandre, Nuria Perez-Diaz-Del-Campo, Irene Cantero, J. Ignacio Monreal, Mariana Elorz, Alberto Benito-Boillos, José Ignacio Herrero, Josep A. Tur, J. Alfredo Martínez, and et al. 2020. "Predictive Value of Serum Ferritin in Combination with Alanine Aminotransferase and Glucose Levels for Noninvasive Assessment of NAFLD: Fatty Liver in Obesity (FLiO) Study" Diagnostics 10, no. 11: 917. https://doi.org/10.3390/diagnostics10110917
APA StyleGalarregui, C., Marin-Alejandre, B. A., Perez-Diaz-Del-Campo, N., Cantero, I., Monreal, J. I., Elorz, M., Benito-Boillos, A., Herrero, J. I., Tur, J. A., Martínez, J. A., Zulet, M. A., & Abete, I. (2020). Predictive Value of Serum Ferritin in Combination with Alanine Aminotransferase and Glucose Levels for Noninvasive Assessment of NAFLD: Fatty Liver in Obesity (FLiO) Study. Diagnostics, 10(11), 917. https://doi.org/10.3390/diagnostics10110917