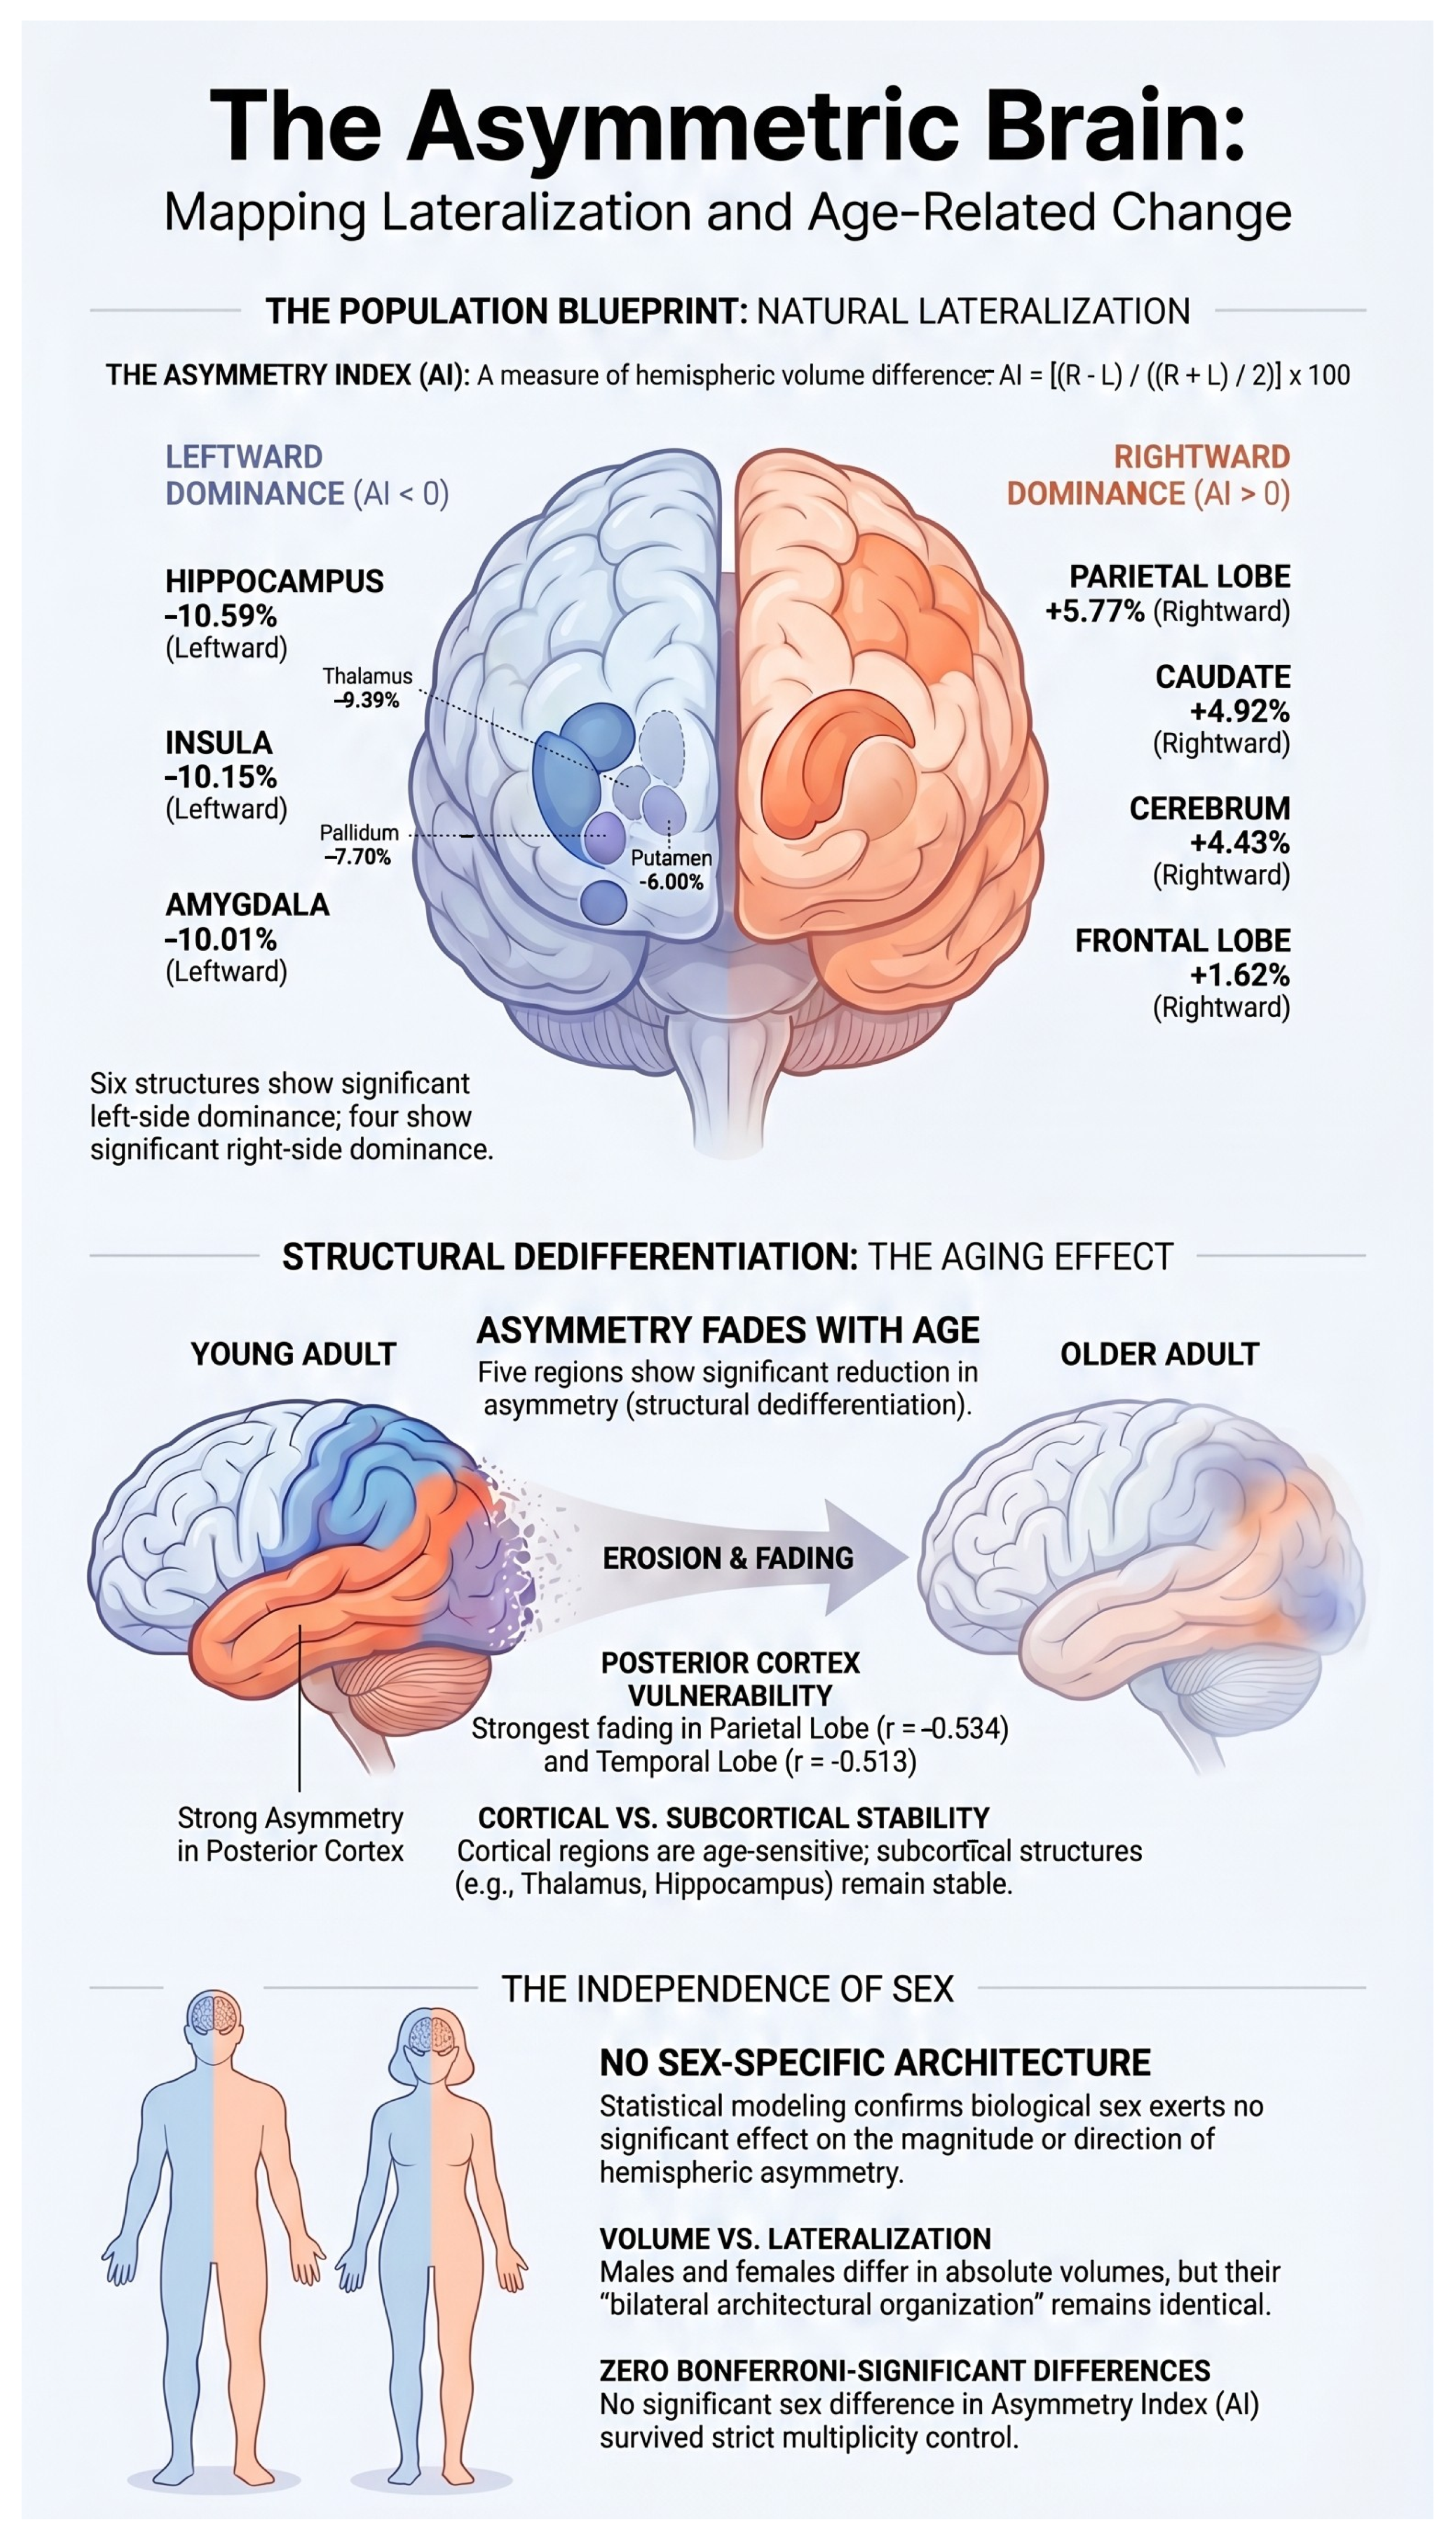
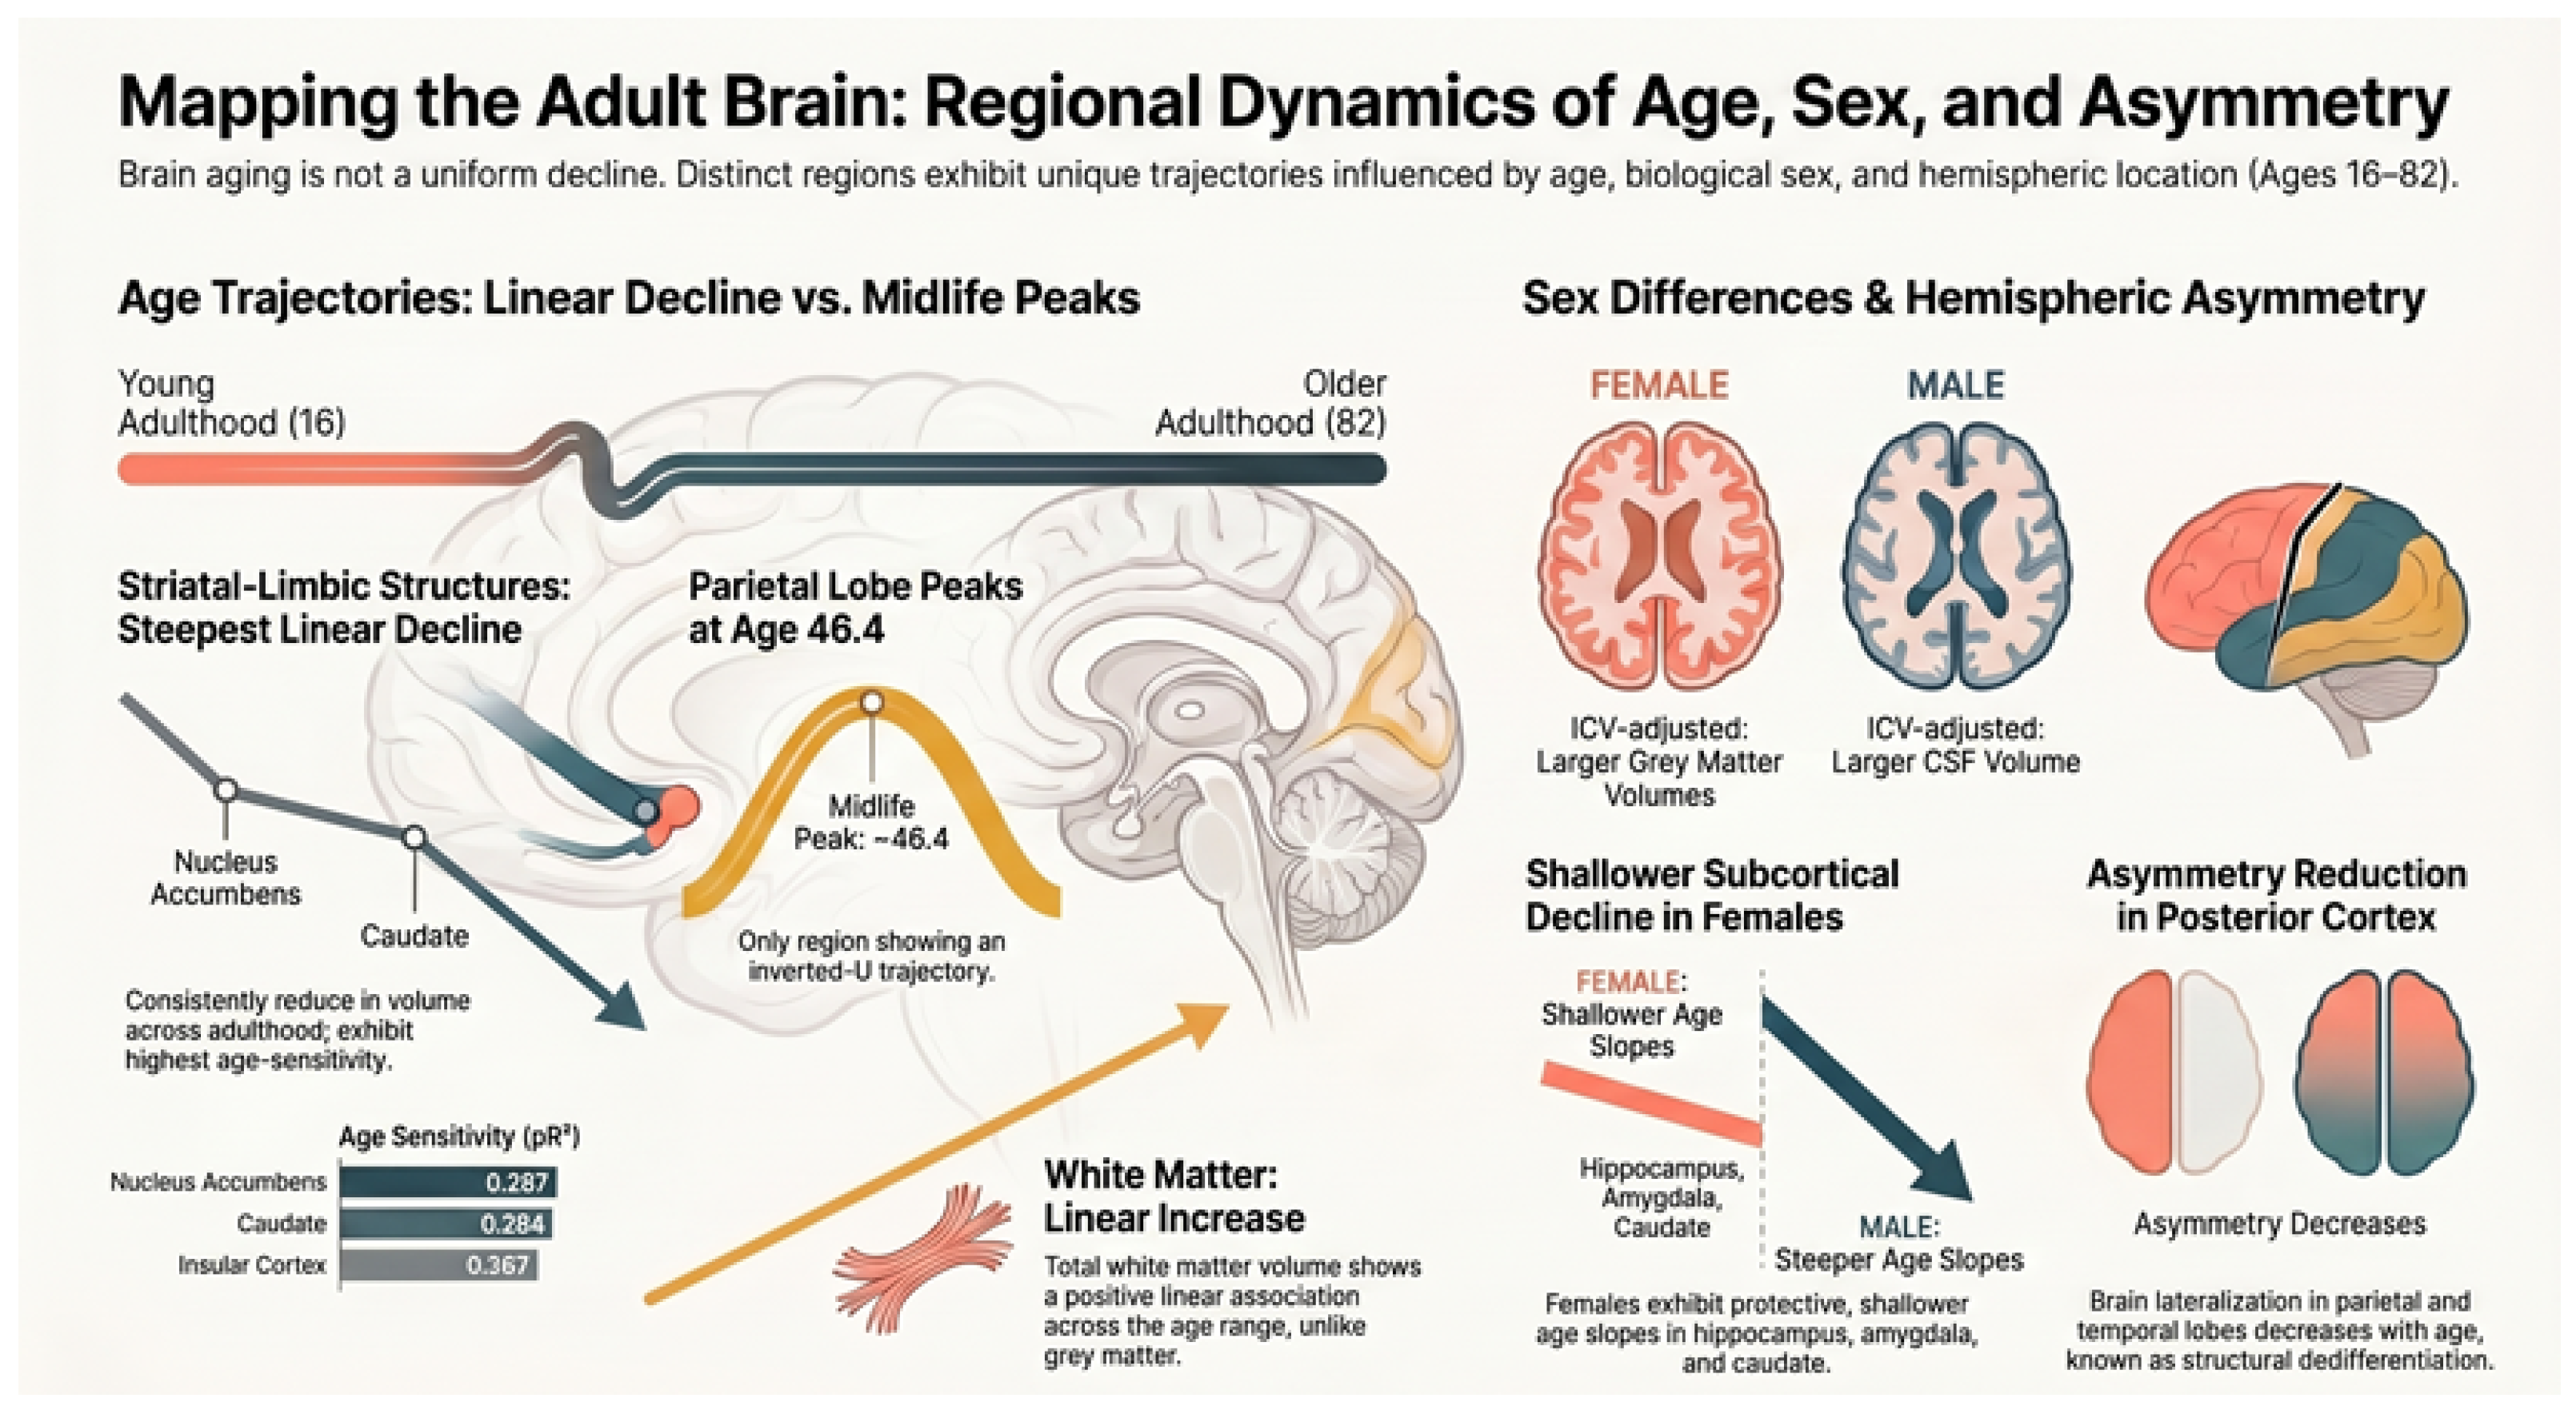
Regional Brain Volume Variation Across Adulthood: A Cross-Sectional MRI Analysis of Age, Sex, and Hemispheric Asymmetry

Abstract
1. Introduction
2. Methods
2.1. Participants and Study Design
2.2. MRI Acquisition and Preprocessing
2.3. Vol2Brain Segmentation
2.4. Hypothesis-Specific Analyses: Volume Models
2.4.1. H1: Age Associations (19 Regions)
- H1a-i: Linear age effect () across 9 subcortical regions (FDR, ).
- H1a-ii: Quadratic age effect () in the parietal lobe (FDR).
- H1b: Quadratic age effect () in WM (FDR).
- H1c: Rank ordering of linear age , with insula and striatum expected to be highest.
2.4.2. H2: Sex Differences (19 Regions)
- H2a: Sex main effects in GM regions.
- H2b: Sex main effects in CSF.
- H2c: Sex main effects in cerebellum and WM, where null effects are expected.
- H2d: Sex × age interaction terms tested across all 19 regions as a sixth predictor family (FDR, ).
2.4.3. H3: Hemispheric Asymmetry (Confirmatory: 12 Regions)
3. Results and Discussion
3.1. Sample Characteristics
3.2. Results: Age-Related Regional Brain Volume Associations
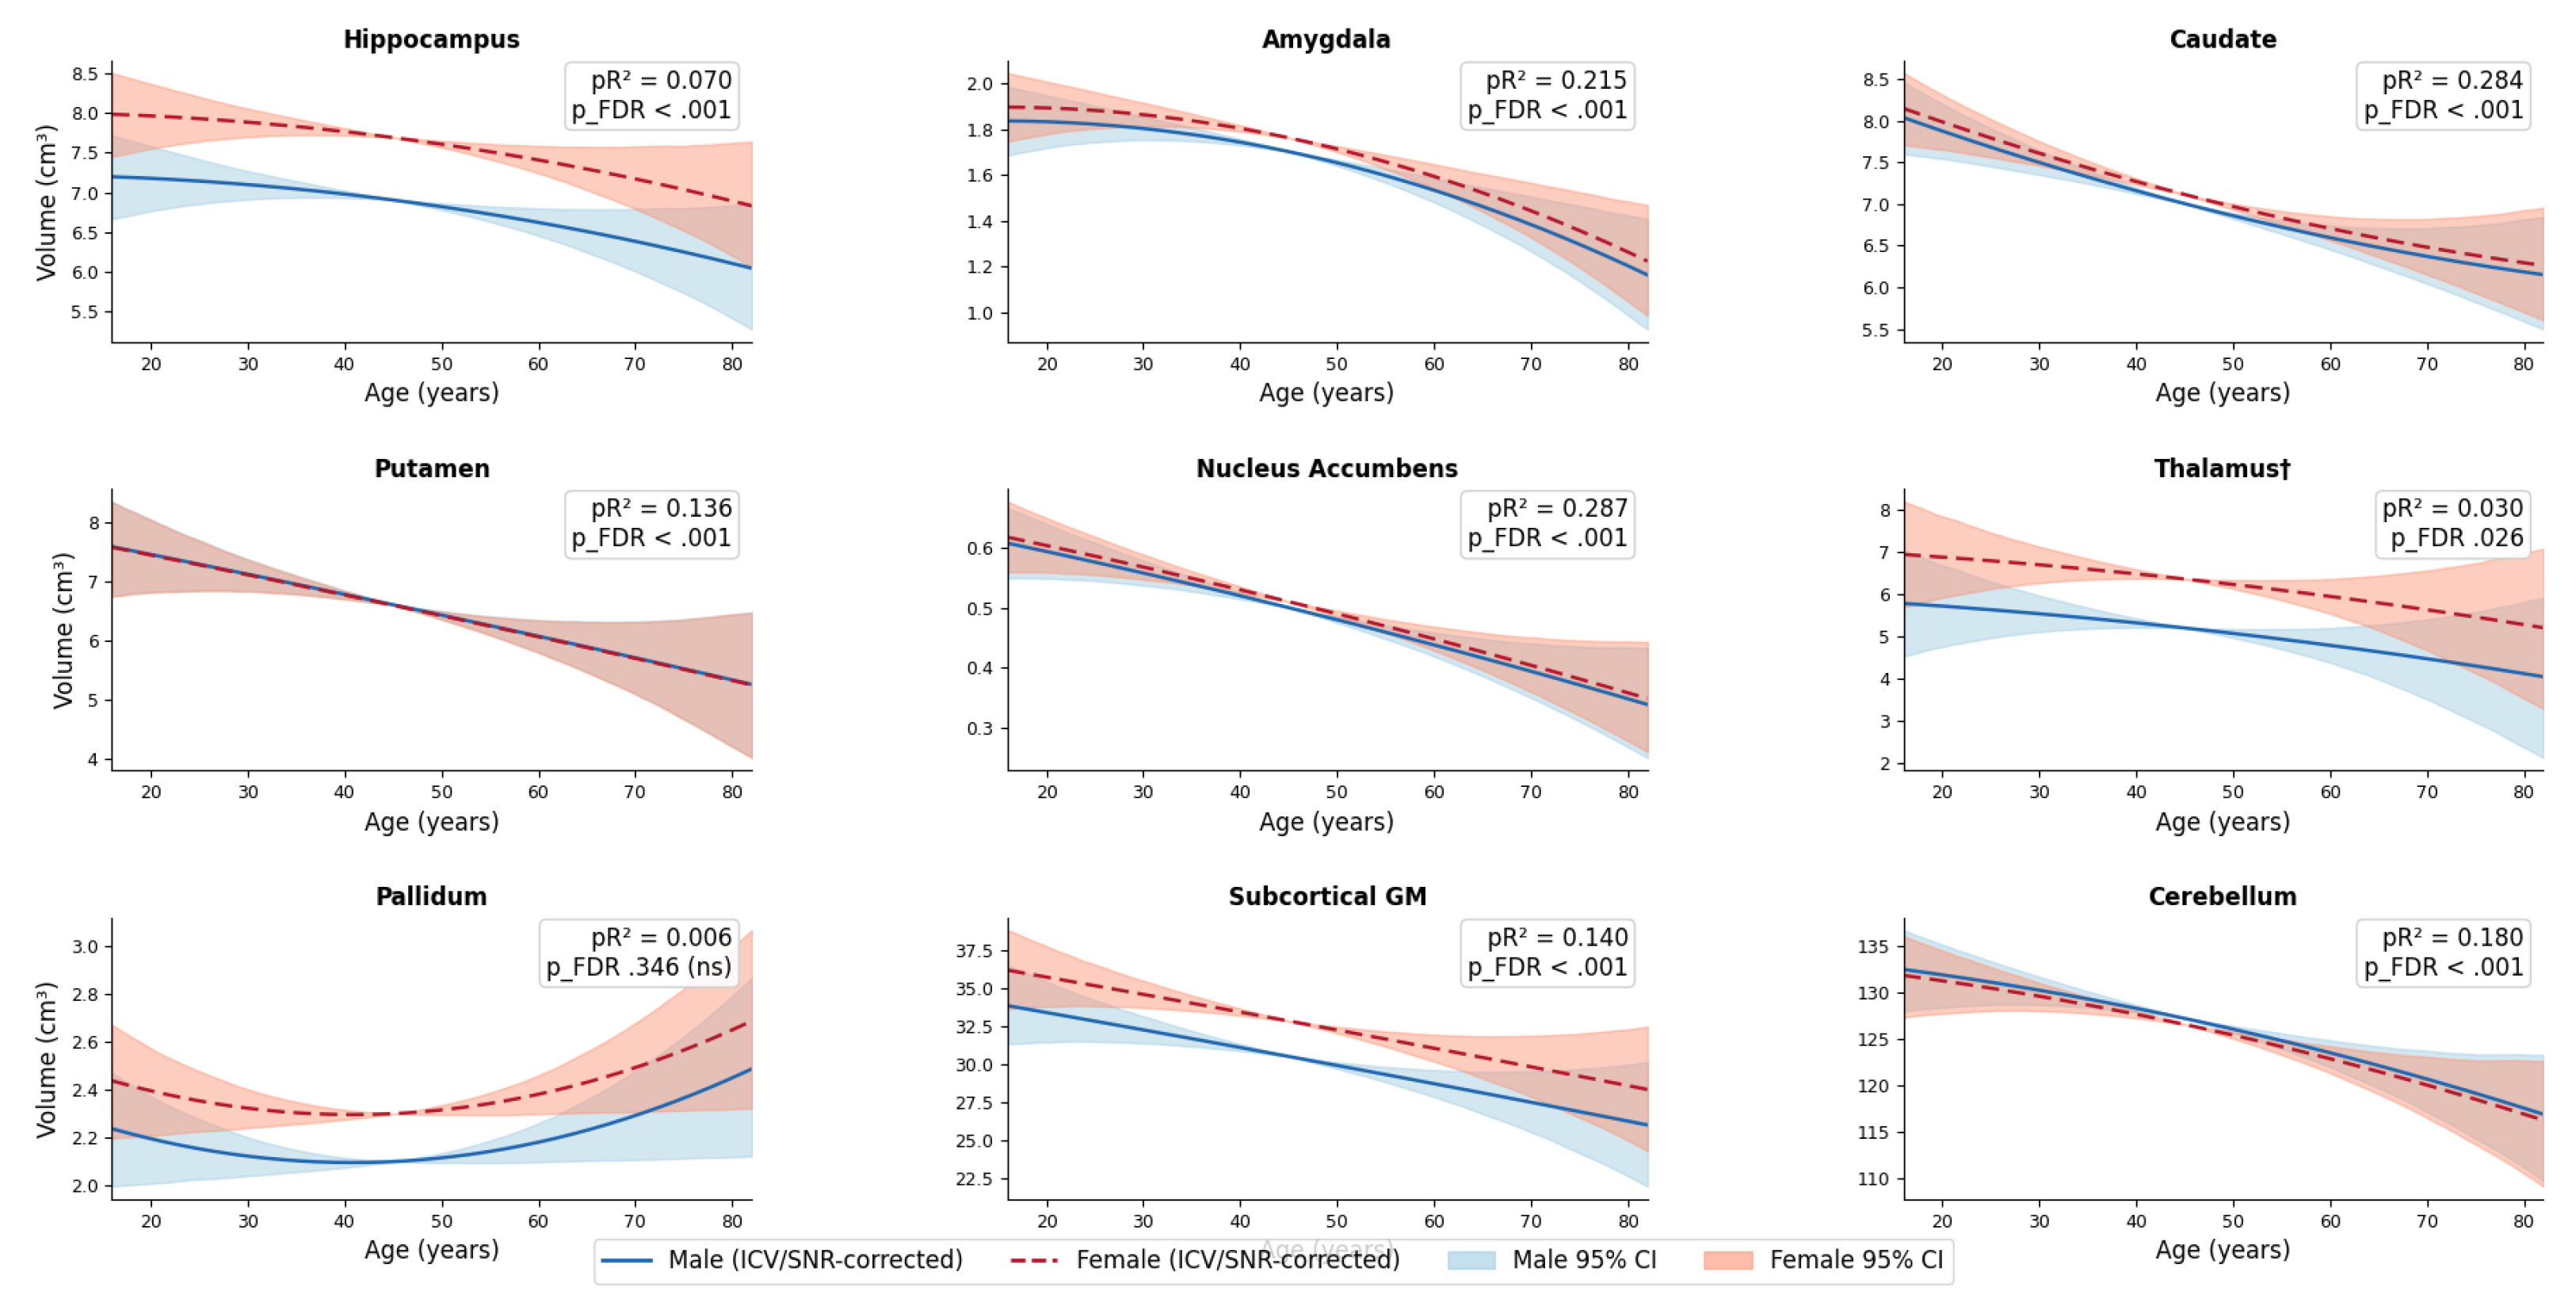
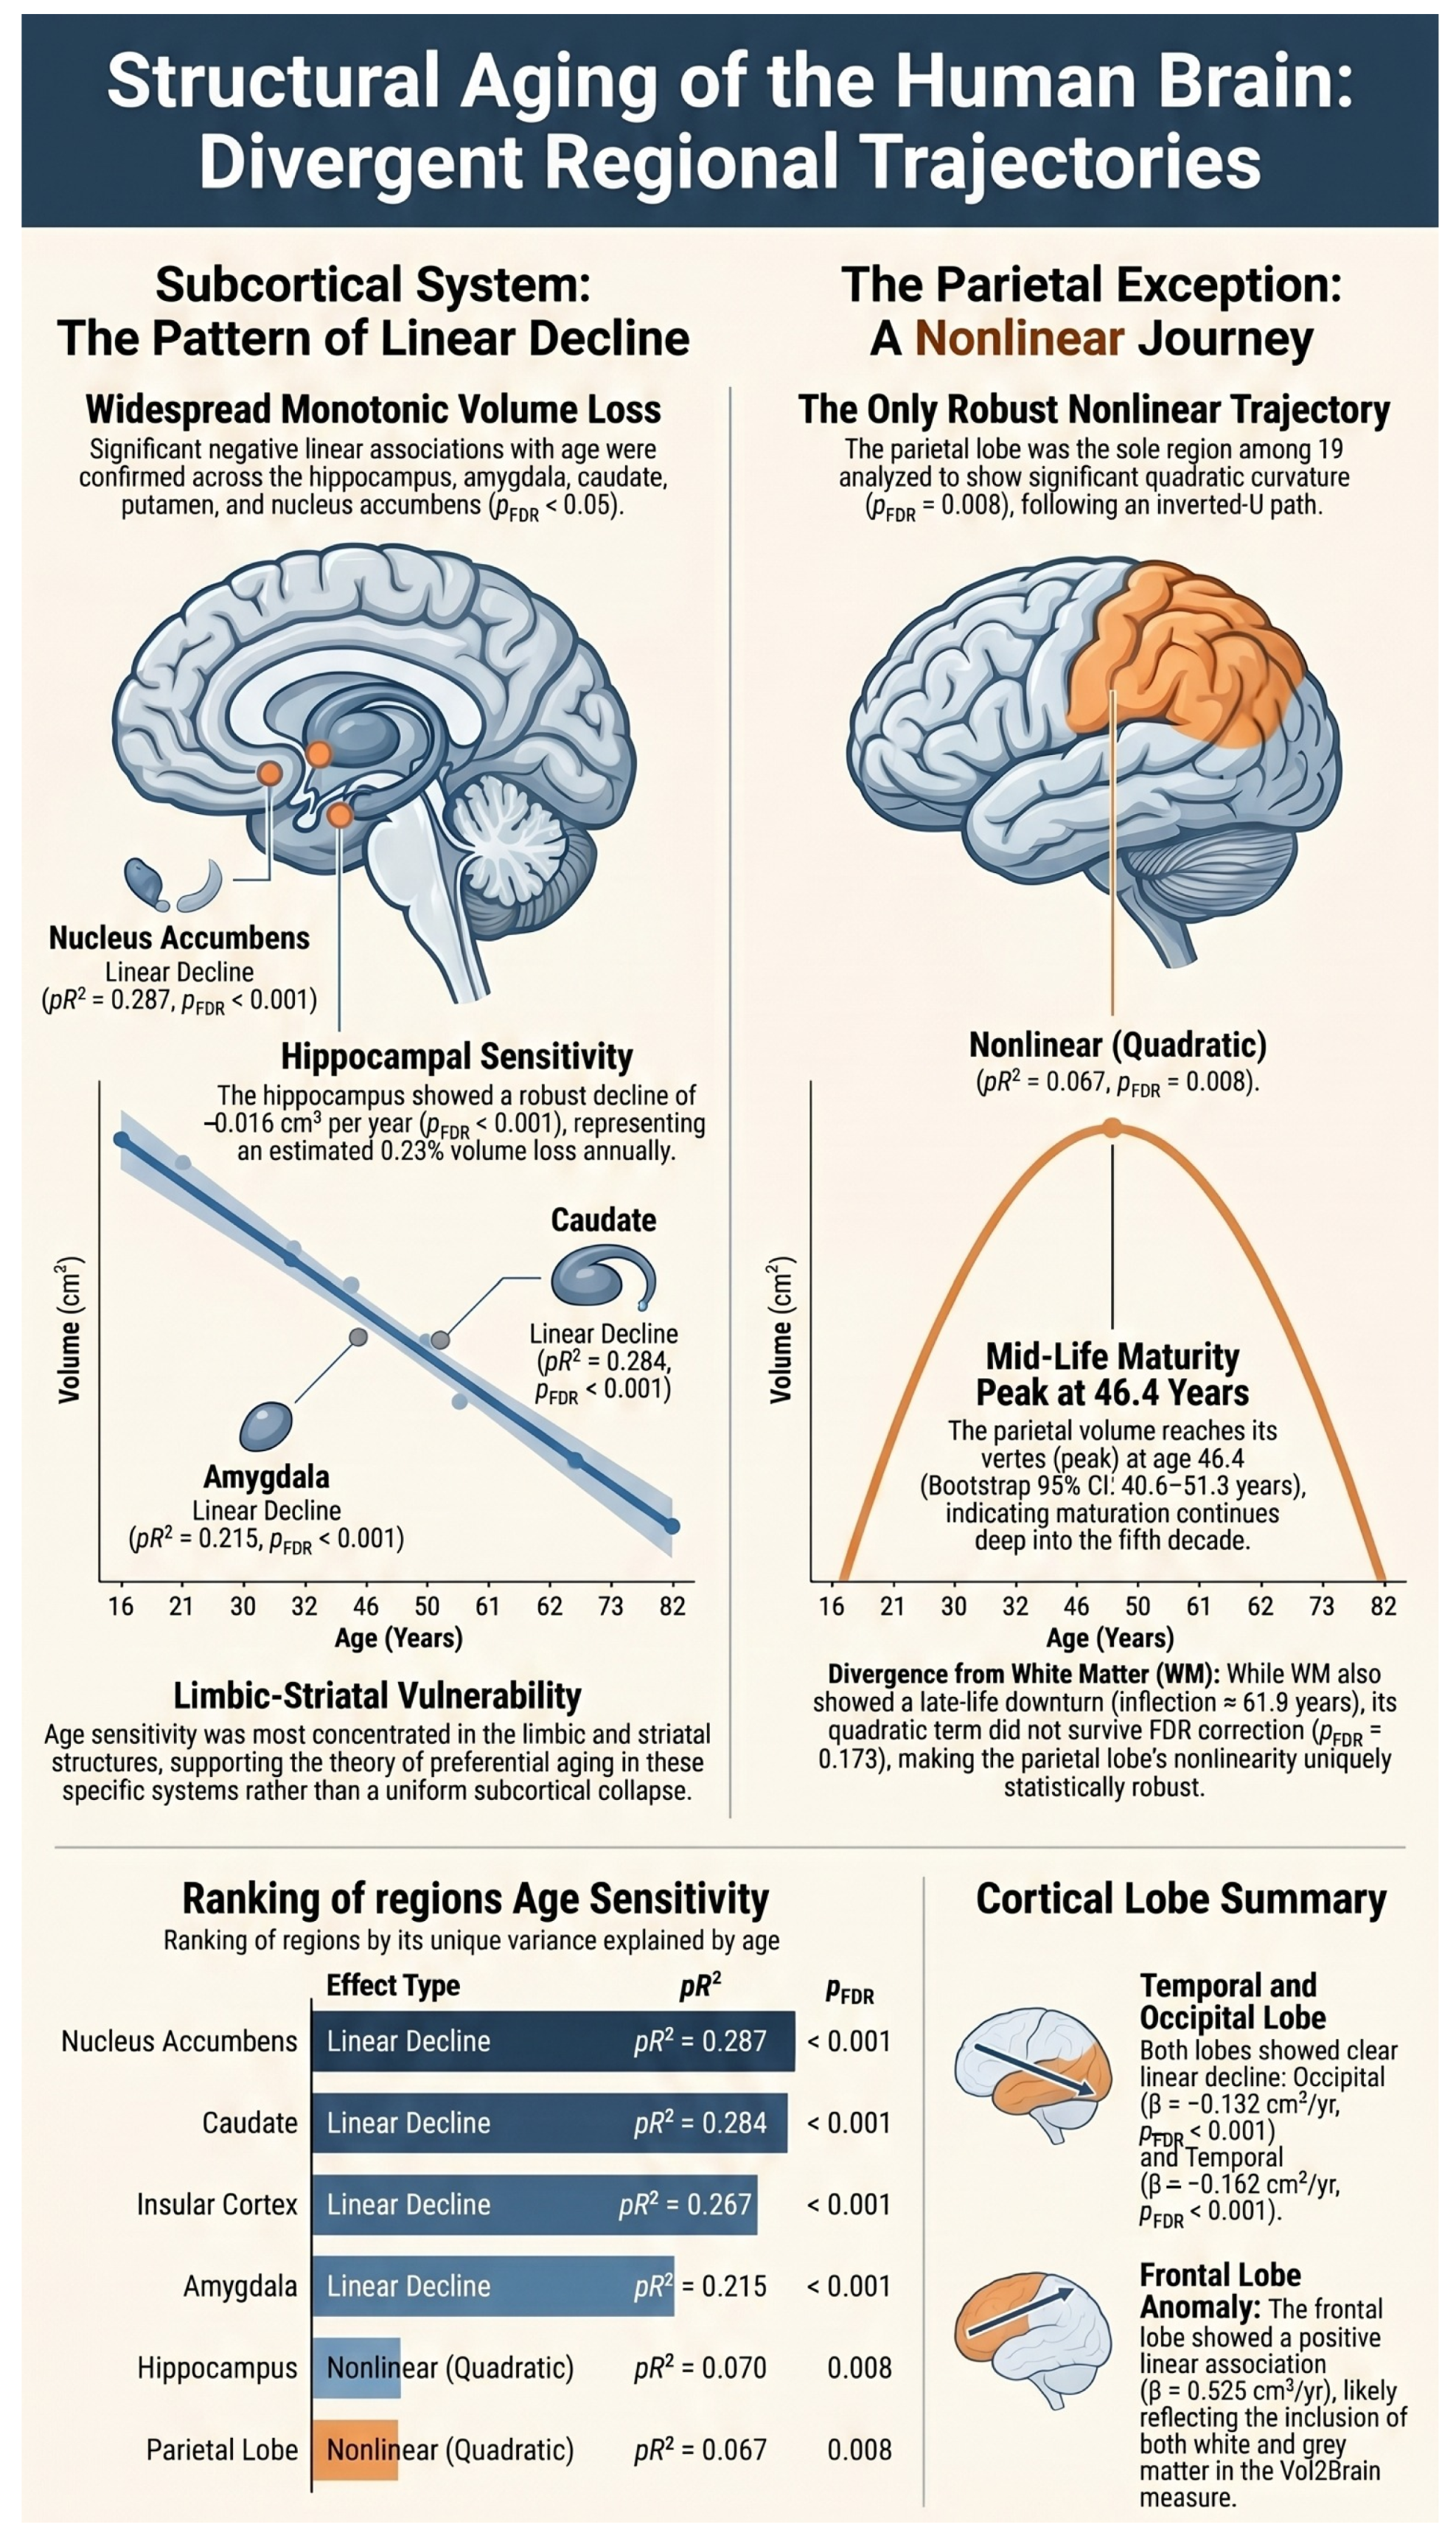
3.2.1. Subcortical Structures (H1a-i)
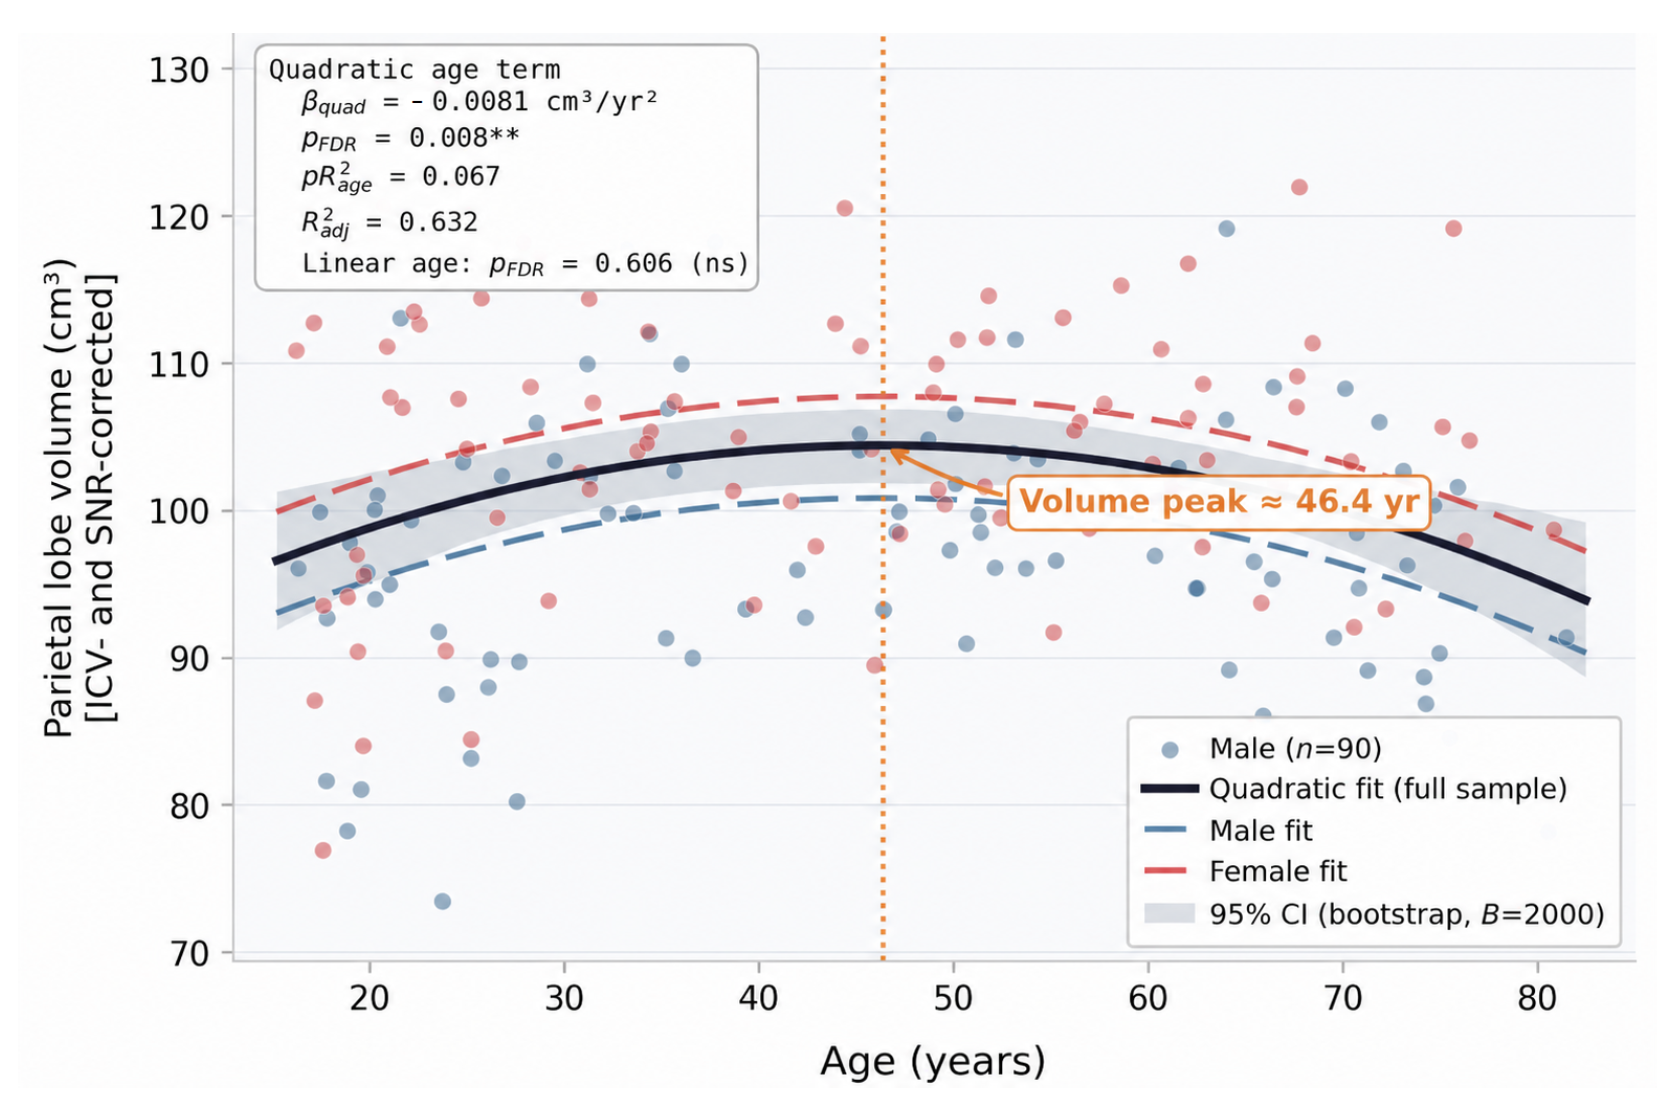
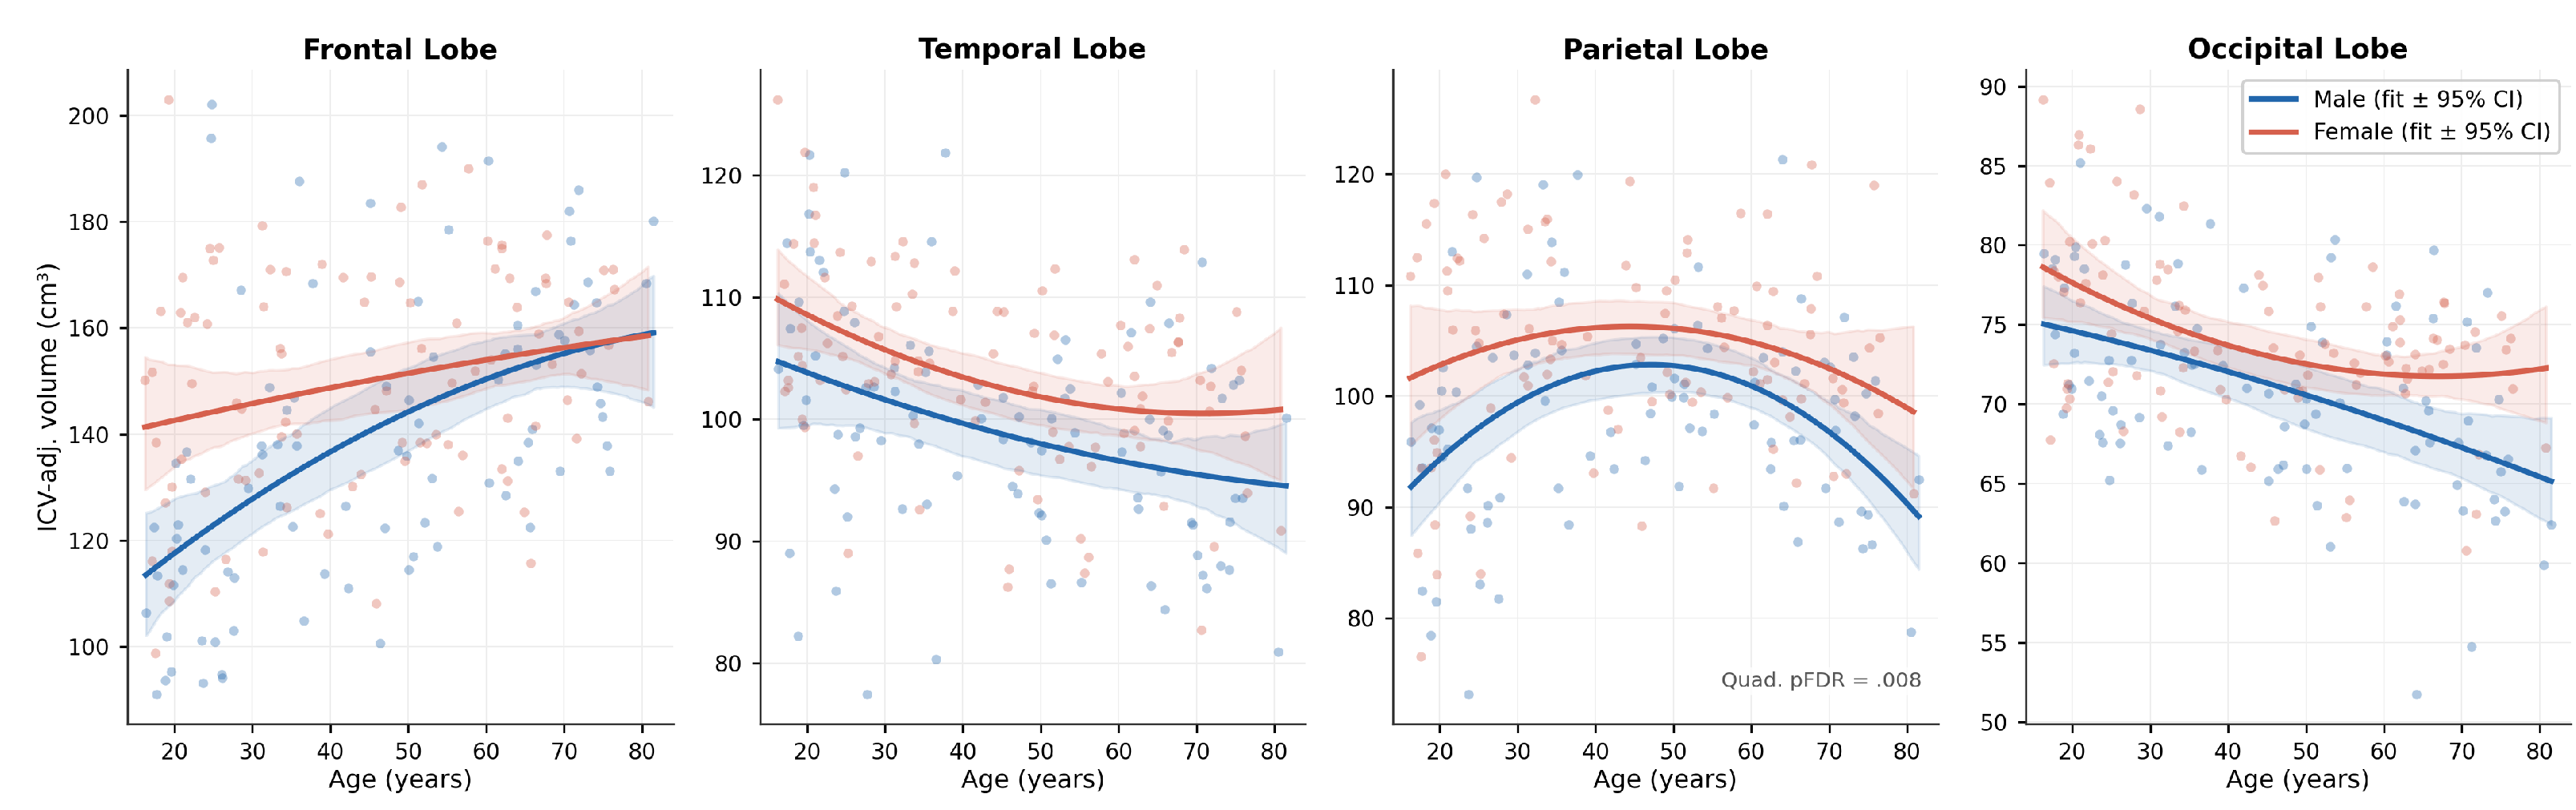
3.2.2. Cortical Lobar Volumes and Insular Cortex
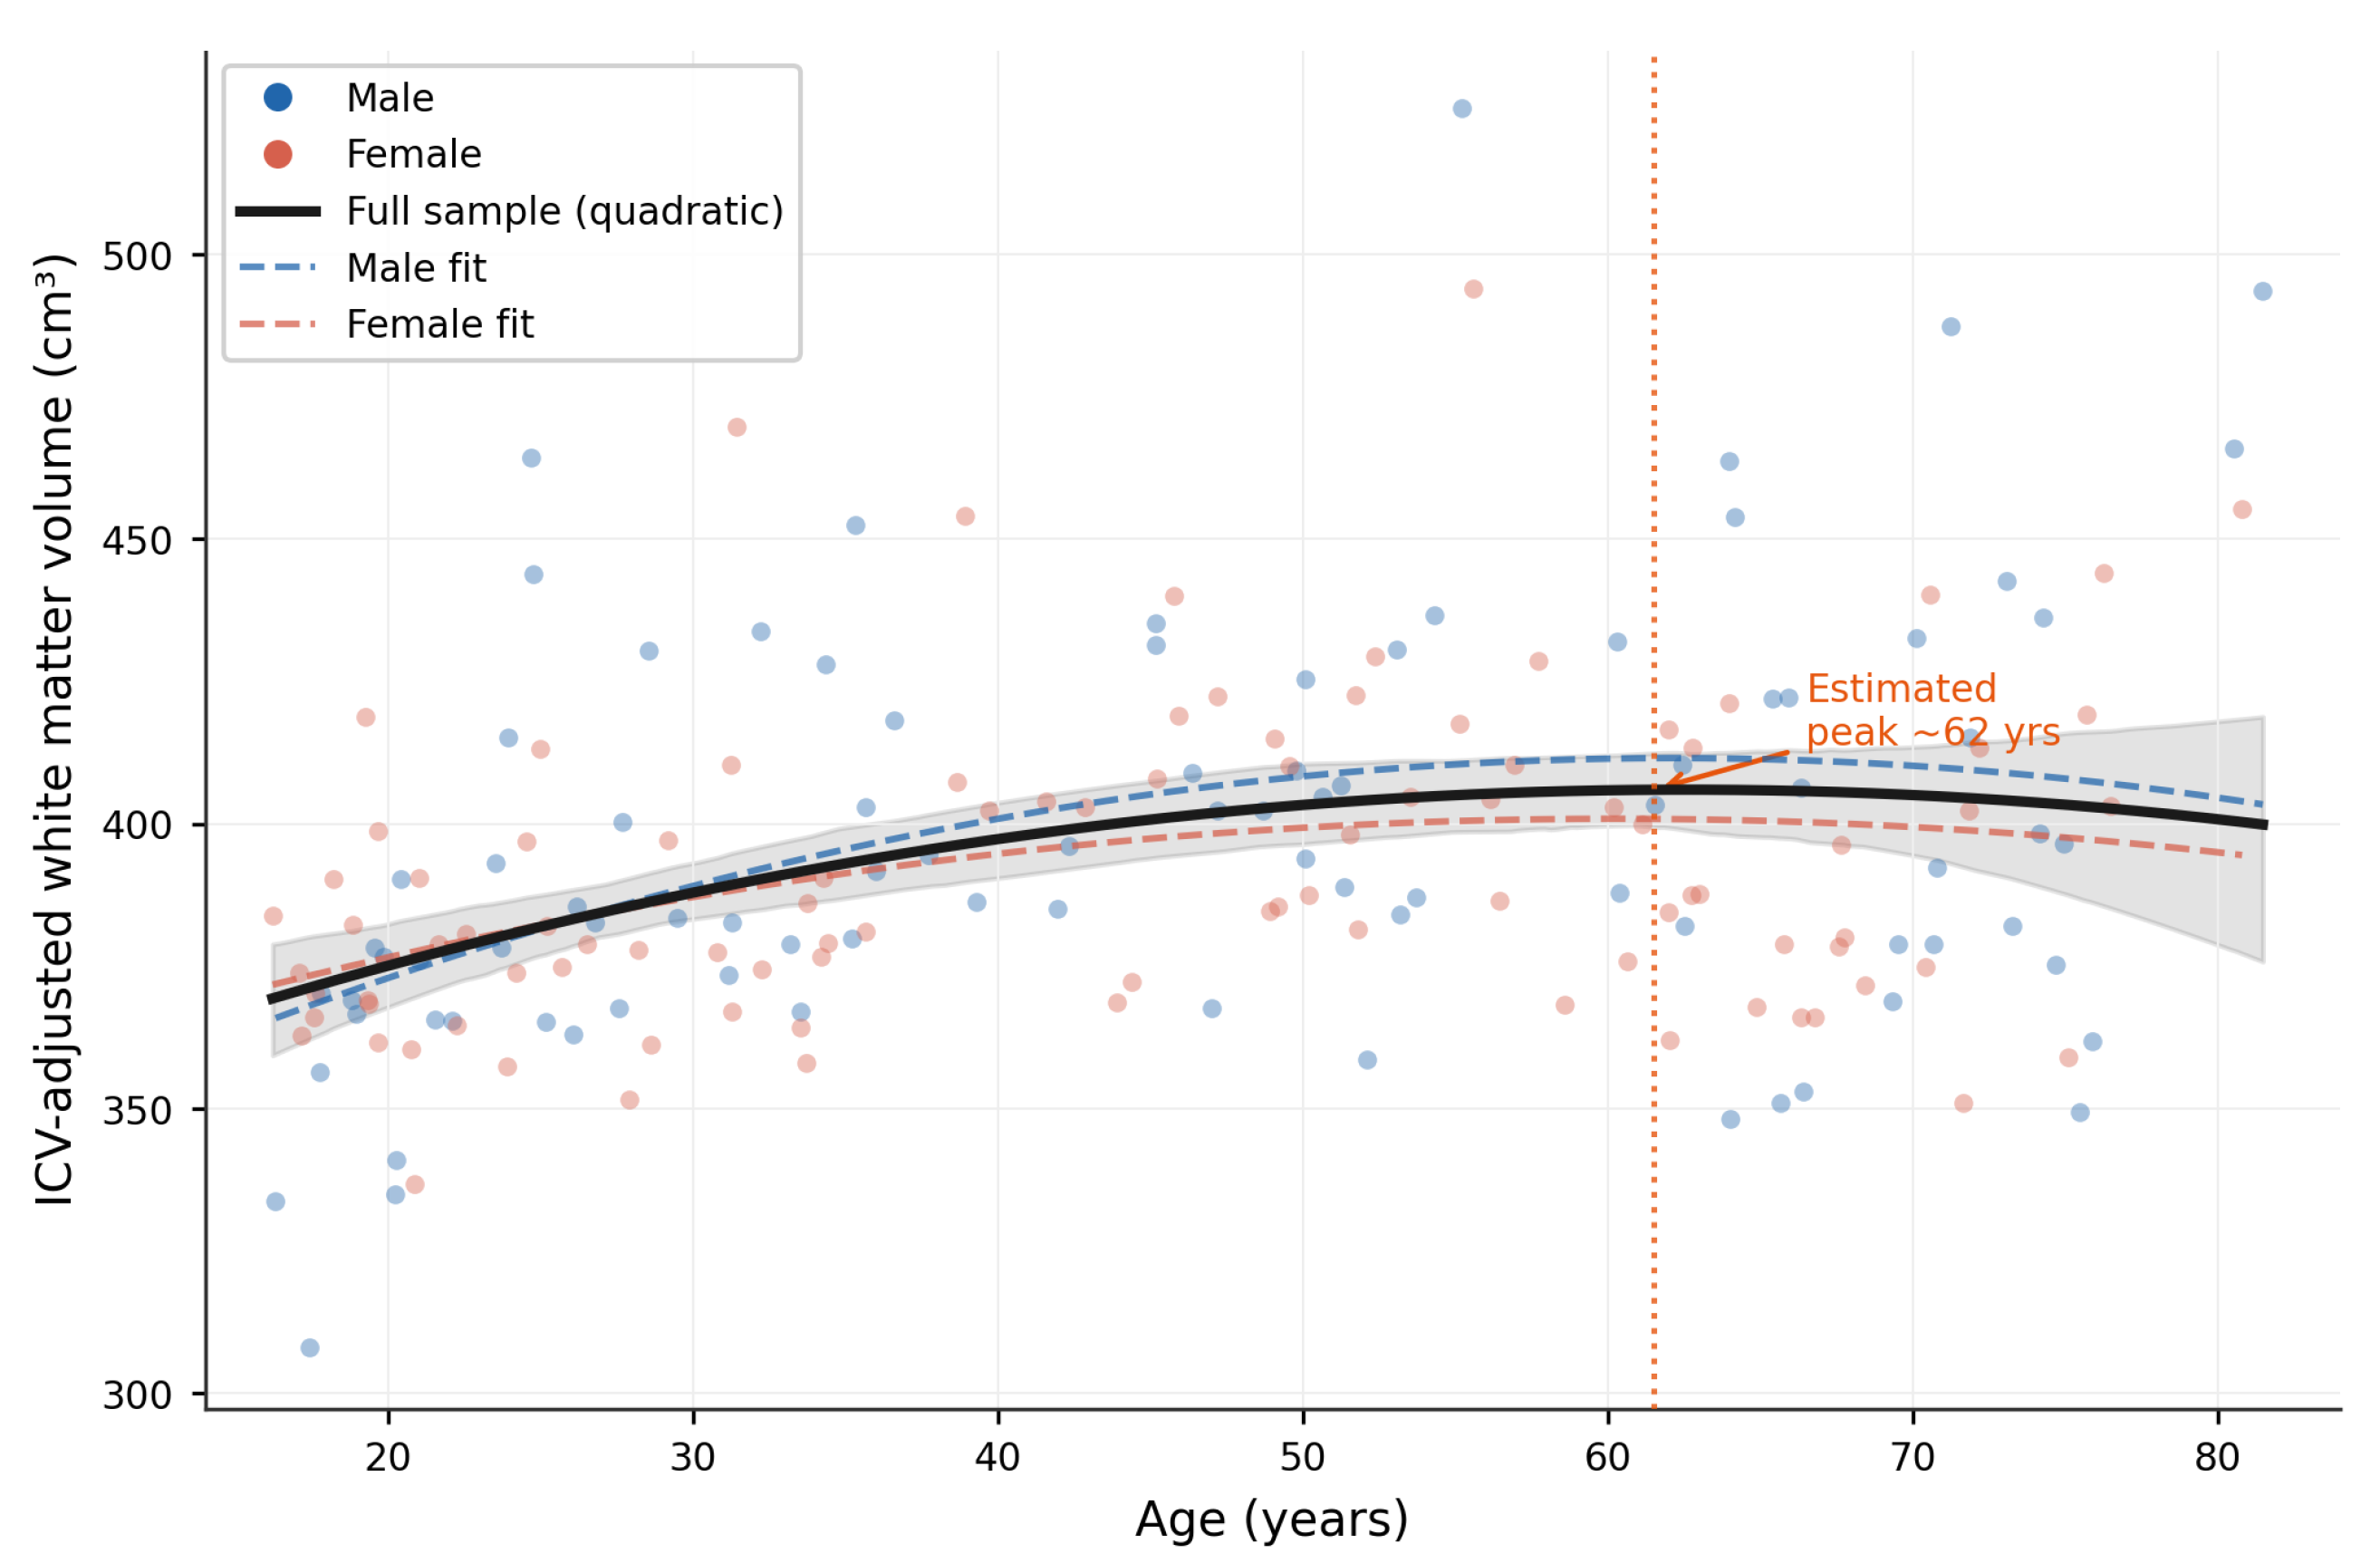
3.2.3. White Matter Volume
3.2.4. Synthesis and Evaluation of Regional Age Associations (H1)
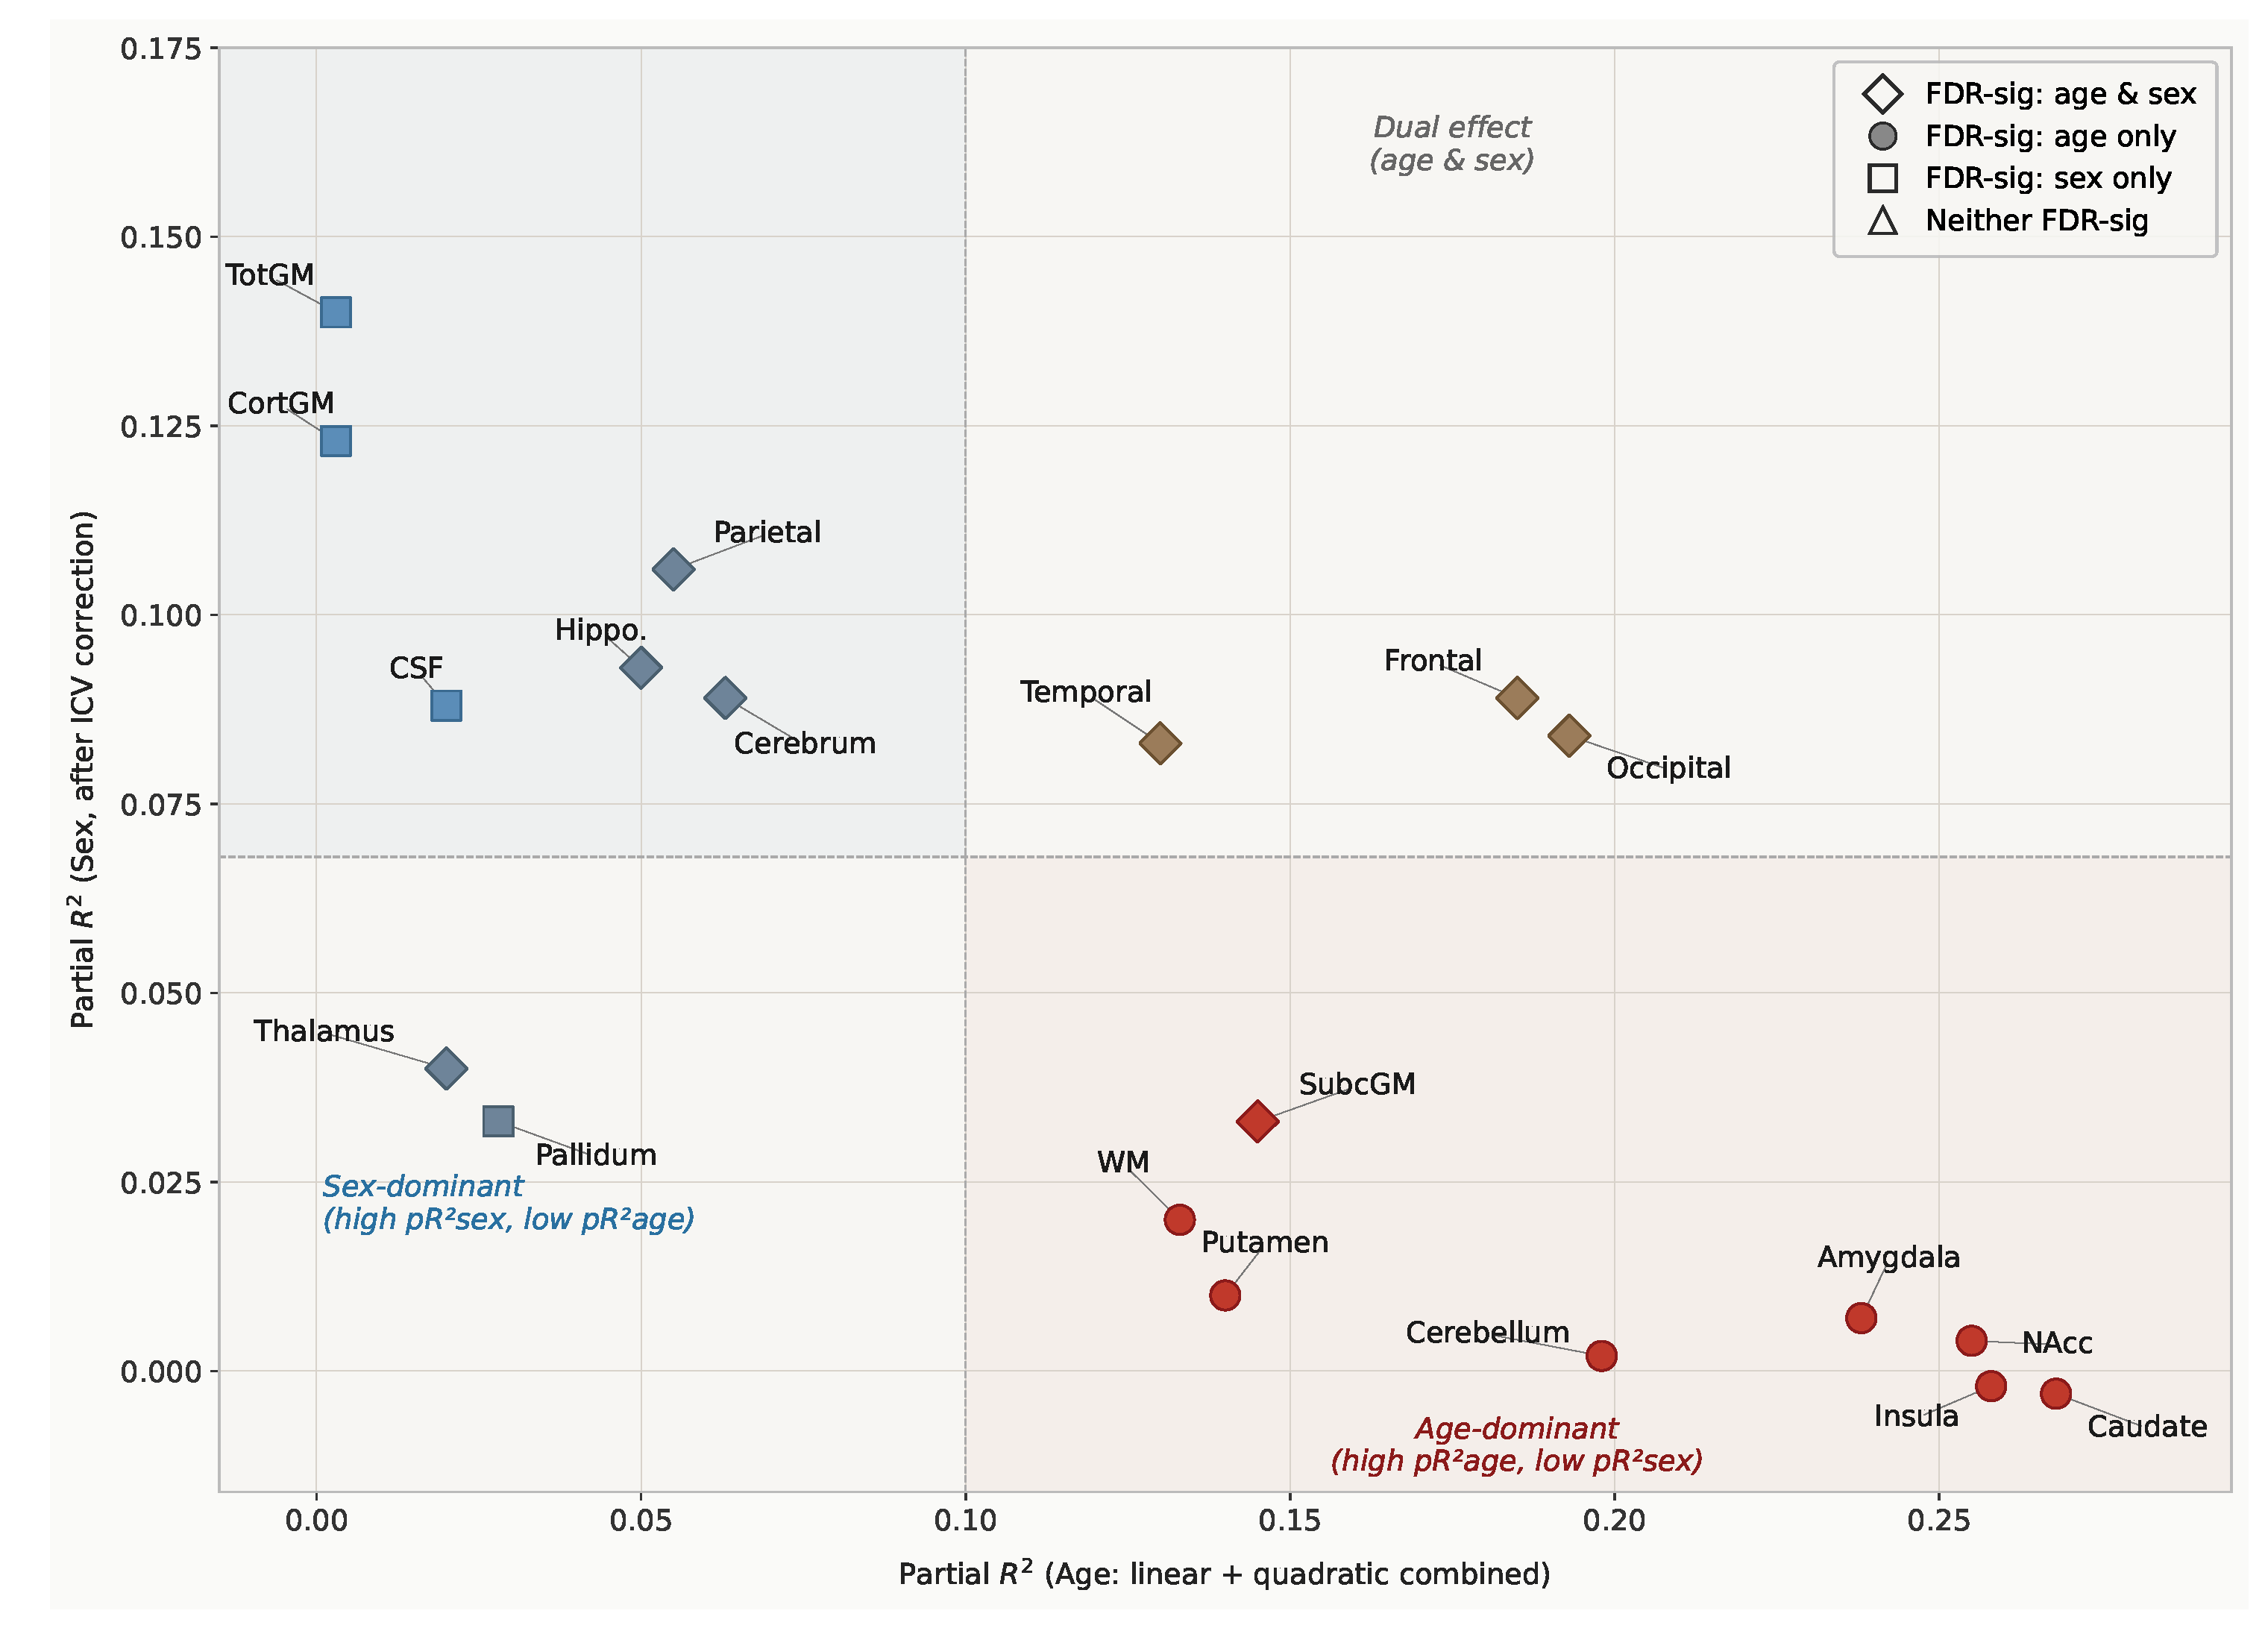
3.3. Sex Differences in Regional Brain Volume (H2a–H2d)
3.3.1. ICV Correction and the Direction of Sex Effects (H2a–H2c)
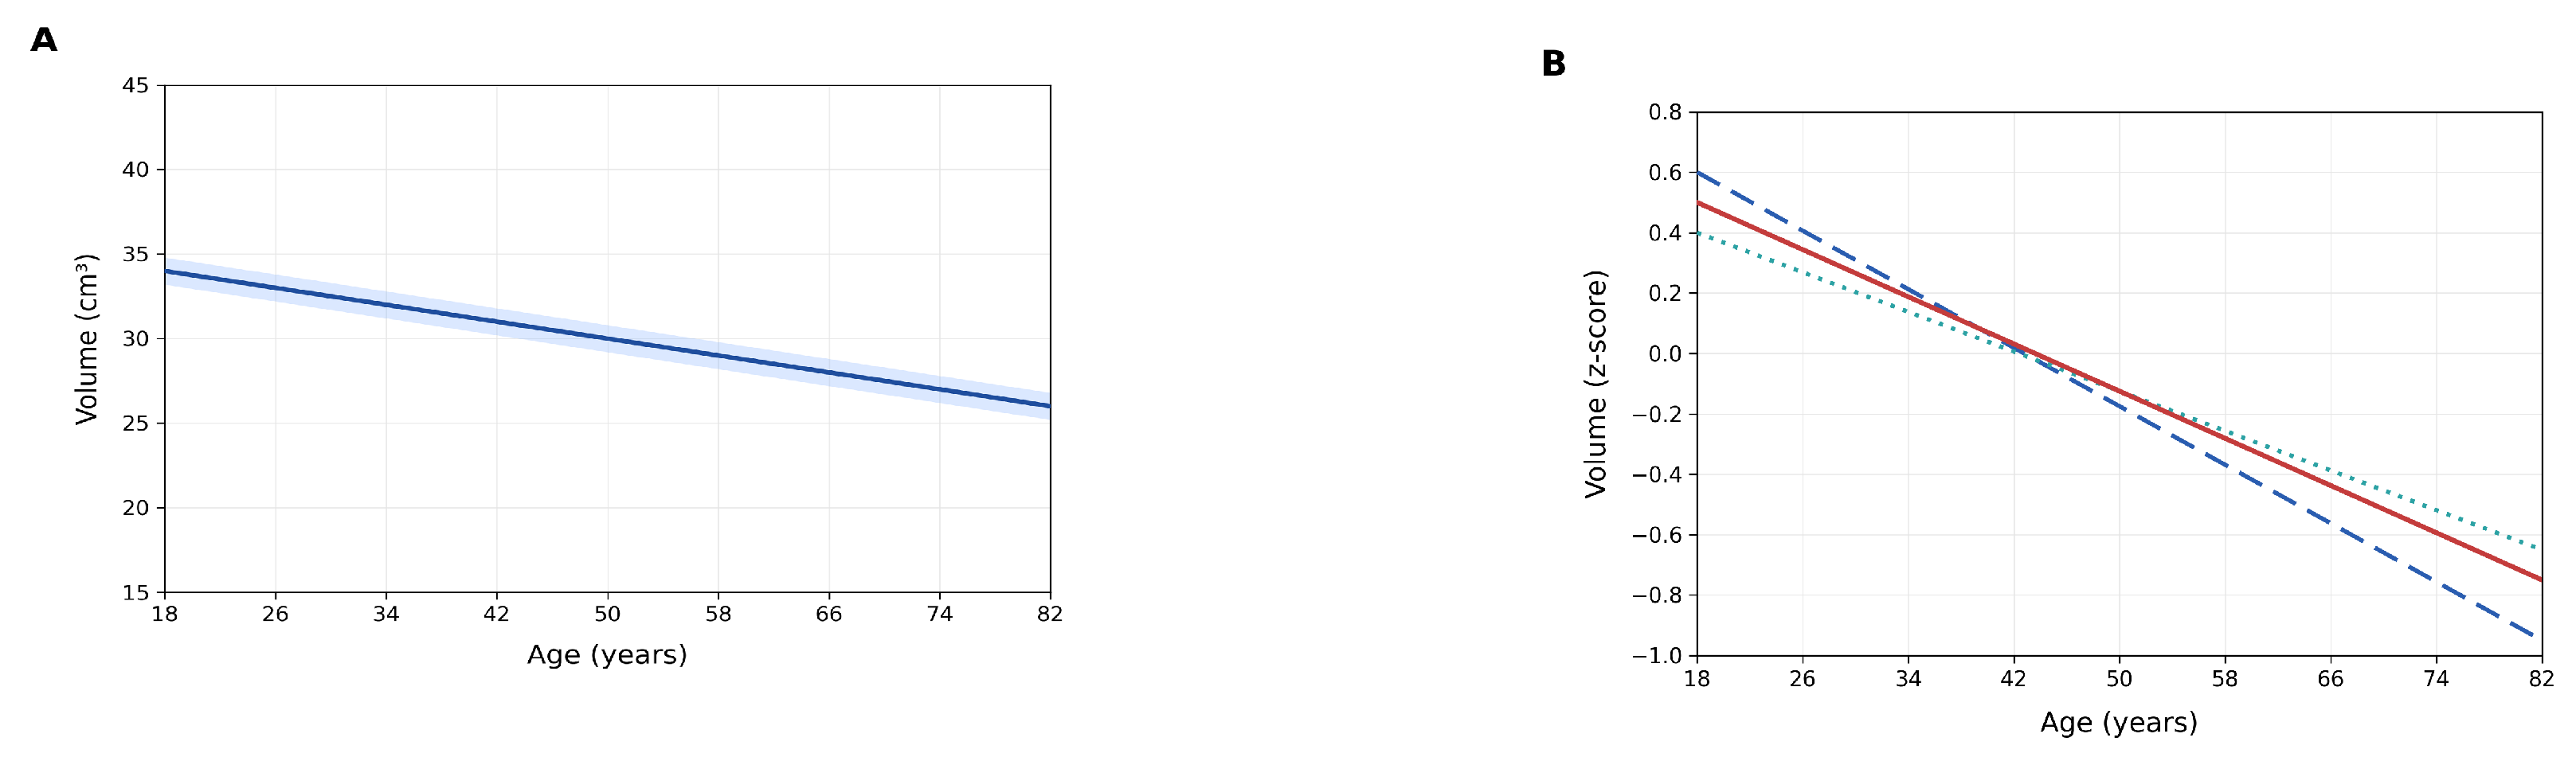
3.3.2. Sex × Age Interactions (H2d)
3.3.3. Synthesis of Sex Effects (H2 Verdict)
3.3.4. The Frontal Positive Age Association
3.3.5. Potential Neurobiological Contributors to Sex-Differentiated Regional Ageing
3.4. Hemispheric Asymmetry
3.4.1. H3a: Population-Level Directional Lateralisation
3.4.2. H3b: Age-Related Asymmetry Reduction (Cortical Dedifferentiation)
3.4.3. Sex Differences in Hemispheric Asymmetry (H3c)
3.4.4. Synthesis of Hemispheric Asymmetry Findings (H3 Verdict)
4. Limitations and Future Directions
- Cross-sectional design: All age-related findings reflect cross-sectional between-person differences rather than within-person longitudinal change. Phrases such as “decline”, “trajectories”, or “age-related reduction” refer exclusively to fitted cross-sectional patterns and should not be interpreted as implying individual-level biological ageing rates or causal longitudinal atrophy. Longitudinal studies are required to confirm true intra-individual change.
- Modest sample size for interactions: With , the study had limited power to detect modest sex × age interaction effects. The four significant subcortical interactions are hypothesis-consistent but provisional and require replication in larger cohorts.
- Segmentation variability: Vol2Brain provides useful subcortical estimates but shows higher variance in thalamic volumes () and occasional hemisphere-specific failures ( to in the hippocampus, amygdala, and nucleus accumbens). These cases were handled transparently as missing data. A further methodological point concerns the differential treatment of the thalamus across the volumetric and asymmetry analyses: absolute thalamic volume was excluded from primary inference because of high segmentation variance, whereas the thalamic AI was retained because the underlying instability is substantially shared across hemispheres and is therefore attenuated in the derived ratio measure. This is supported by the near-collinearity of left and right thalamic volumes in this sample () and by the independence of thalamic AI from both absolute volume () and SNR (). We treat this as a resolved methodological distinction rather than an open limitation, though independent replication using a segmentation pipeline with established thalamic reliability (e.g., FreeSurfer’s probabilistic thalamic nuclei atlas) would further strengthen confidence in this result.
- Absence of biomarker data: The AgeRisk imaging release does not include hormonal (e.g., estradiol and testosterone), vascular (e.g., blood pressure and arterial stiffness), inflammatory (e.g., cytokines, CRP), or metabolic (e.g., glucose and lipid profile) measures. Consequently, the mechanistic interpretation of observed sex differences in regional volume remains literature-based rather than empirically tested within this sample [73,74,75,76]. Future work integrating endocrine panels, vascular indices, and inflammatory markers with structural MRI would enable direct mediation testing of these candidate pathways.
- Structural vs. functional asymmetry: Volumetric asymmetry indices are not equivalent to functional lateralisation measures. The present findings are compatible with, but do not validate, the HAROLD framework, which was derived from task-based fMRI.
- Multiple-testing strategy: Family-wise FDR correction across predictor domains is statistically defensible but less stringent than omnibus correction across all 114 tests (19 regions × 6 families). This increases type I error risk relative to a single global threshold [77].
- No behavioural or clinical correlates: The study provides structural reference data without cognitive, clinical, or functional outcomes, limiting direct translational implications [78].
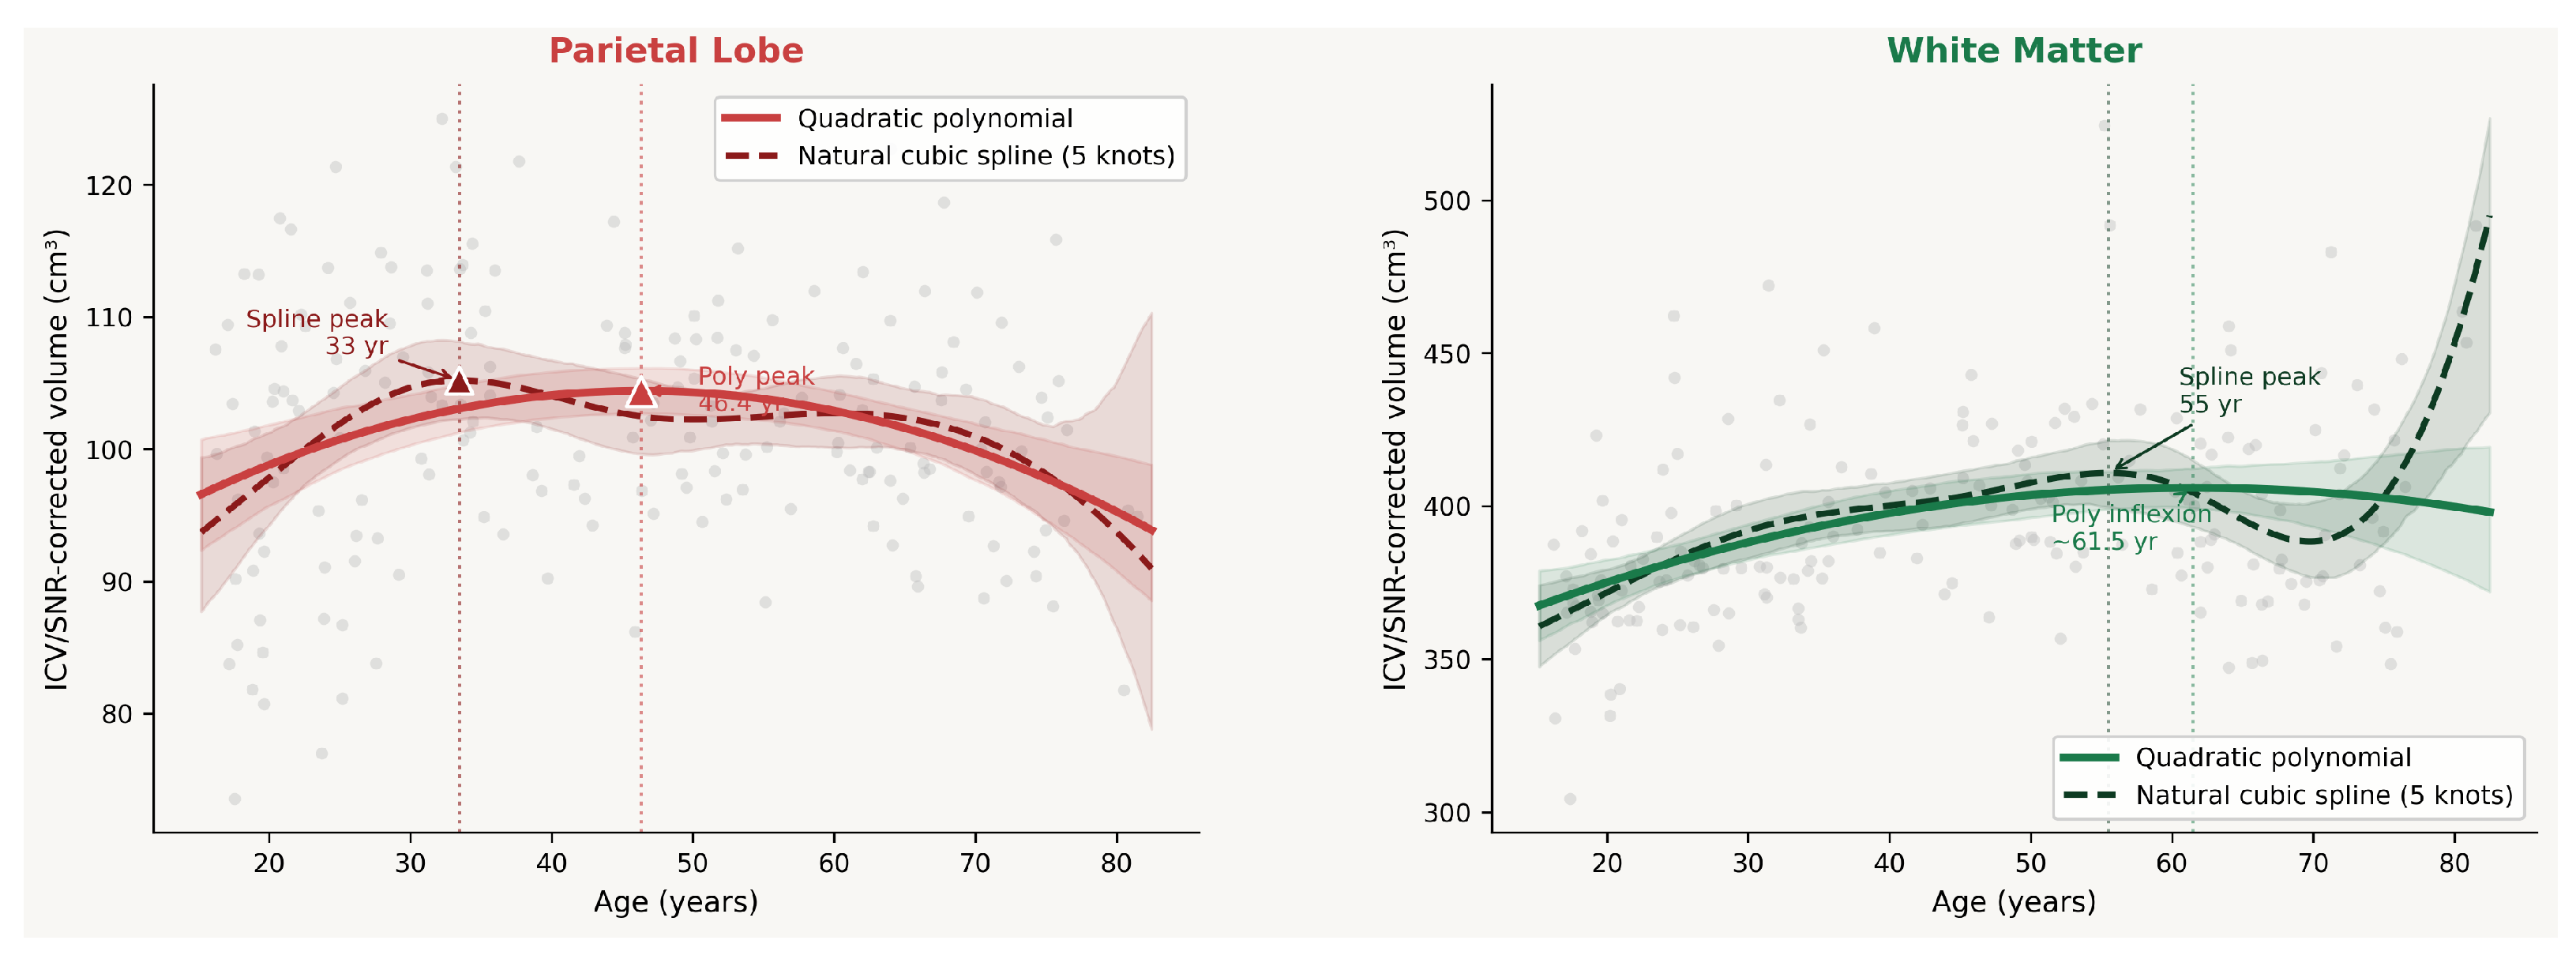
- Constrained functional form for age: Regional age associations were modelled using linear and quadratic terms only, selected a priori as part of a confirmatory, pre-registered design. This fixed low-order polynomial permits only a single symmetric inflexion and cannot capture more complex (e.g., bimodal or plateauing) trajectories. A post hoc comparison with natural cubic splines for the two regions with an a priori nonlinearity hypothesis (parietal lobe and white matter; Figure 5) supported the overall pattern of results but showed that turning-point estimates were model-dependent. As spline models were not evaluated for the remaining 17 regions, more complex nonlinear associations cannot be excluded. Future studies should re-estimate all regional age associations using GAMs or GAMLSS with penalised regression splines in larger, adequately powered samples.
5. Conclusions
Supplementary Materials
Author Contributions
Funding
Institutional Review Board Statement
Informed Consent Statement
Data Availability Statement
Conflicts of Interest
Abbreviations
| AI | Asymmetry Index |
| ANCOVA | Analysis of Covariance |
| BIDS | Brain Imaging Data Structure |
| BET | Brain Extraction Tool |
| CI | Confidence Interval |
| CortGM | Cortical Grey Matter |
| CSF | Cerebrospinal Fluid |
| CV | Coefficient of Variation |
| DTI | Diffusion Tensor Imaging |
| FDR | False Discovery Rate |
| fMRI | Functional Magnetic Resonance Imaging |
| FSL | FMRIB Software Library |
| GAMLSS | Generalised Additive Models for Location, Scale and Shape |
| GM | Grey Matter |
| HAROLD | Hemispheric Asymmetry Reduction in Older Adults |
| ICV | Intracranial Volume |
| IQR | Interquartile Range |
| MNI | Montreal Neurological Institute |
| MRI | Magnetic Resonance Imaging |
| NAcc | Nucleus Accumbens |
| OLS | Ordinary Least Squares |
| OSF | Open Science Framework |
| PET | Positron-emission-tomography |
| Benjamini–Hochberg false discovery rate corrected p-value | |
| Semi-partial (unique variance explained by a single predictor) | |
| r | Pearson partial correlation coefficient |
| Adjusted (model-level goodness-of-fit statistic) | |
| SD | Standard Deviation |
| SE | Standard Error |
| SNR | Signal-to-Noise Ratio |
| SubGM | Subcortical Grey Matter |
| T1 | T1-weighted MRI contrast |
| TotGM | Total Grey Matter |
| WM | White Matter |
References
- Jeong, J. Limitations of MMSE in Cognitive Assessment: Revealing Latent Risk via Structural Brain Atrophy. Life 2026, 16, 451. [Google Scholar] [CrossRef] [Scilit] [PubMed]
- Bethlehem, R.A.I.; Seidlitz, J.; White, S.R.; Vogel, J.W.; Anderson, K.M.; Adamson, C.; Adler, S.; Alexopoulos, G.S.; Anagnostou, E.; Areces-Gonzalez, A.; et al. Brain charts for the human lifespan. Nature 2022, 604, 525–533. [Google Scholar] [CrossRef] [Scilit] [PubMed]
- Debnath, S.; Debnath, T.; Chau, S.; Rahman, M.G. Artificial Intelligence in Medical Imaging. In Artificial Intelligence and Data Analytics in Medical Imaging; CRC Press: Boca Raton, FL, USA, 2025; pp. 1–33. [Google Scholar]
- Tian, Y.E.; Cropley, V.; Maier, A.B.; Lautenschlager, N.T.; Breakspear, M.; Zalesky, A. Heterogeneous aging across multiple organ systems and prediction of chronic disease and mortality. Nat. Med. 2023, 29, 1221–1231. [Google Scholar] [CrossRef] [Scilit] [PubMed]
- Yu, J. Age-related decline in thickness and surface area in the cortical surface and hippocampus: Lifespan trajectories and decade-by-decade analyses. GeroScience 2024, 46, 6213–6227. [Google Scholar] [CrossRef] [Scilit] [PubMed]
- Conte, S.; Zimmerman, D.; Richards, J.E. White matter trajectories over the lifespan. PLoS ONE 2024, 19, e0301520. [Google Scholar] [CrossRef] [Scilit] [PubMed]
- Walhovd, K.B.; Lövden, M.; Fjell, A.M. Timing of lifespan influences on brain and cognition. Trends Cogn. Sci. 2023, 27, 901–915. [Google Scholar] [CrossRef] [Scilit] [PubMed]
- Manuello, J.; Min, J.; McCarthy, P.; Alfaro-Almagro, F.; Lee, S.; Smith, S.; Elliott, L.T.; Winkler, A.M.; Douaud, G. The effects of genetic and modifiable risk factors on brain regions vulnerable to ageing and disease. Nat. Commun. 2024, 15, 2576. [Google Scholar] [CrossRef] [Scilit] [PubMed]
- Chen, J.; Bayanagari, V.L.; Chung, S.; Wang, Y.; Lui, Y.W. Deep learning with diffusion MRI as in vivo microscope reveals sex-related differences in human white matter microstructure. Sci. Rep. 2024, 14, 9835. [Google Scholar] [CrossRef] [Scilit] [PubMed]
- Dhamala, E.; Ooi, L.Q.R.; Chen, J.; Kong, R.; Anderson, K.M.; Chin, R.; Yeo, B.T.T.; Holmes, A.J. Proportional intracranial volume correction differentially biases behavioral predictions across neuroanatomical features, sexes, and development. NeuroImage 2022, 260, 119485. [Google Scholar] [CrossRef] [Scilit] [PubMed]
- Vucic, S.N.; Georges, B.; Frangou, S.; Sadeghi, N.; White, T. Sex differences in global metrics of brain size across the lifespan. Front. Neurosci. 2026, 20, 1646144. [Google Scholar] [CrossRef] [Scilit] [PubMed]
- Vu, D.L.; Do, T.P.L.; Nguyen, K.V.; Nguyen, H.A.; Nguyen, Q.A.; Le, V.K.; Nguyen, N.T.; Vo, H.K.; Nguyen, V.H.; Nguyen, C.T.; et al. Preliminary assessment of age- and sex-related differences in brain volume using Quantib™ brain quantification: A study in a Vietnamese cohort. Front. Neurol. 2025, 16, 1552559. [Google Scholar] [CrossRef] [Scilit] [PubMed]
- Debnath, T.; Chau, S.; Rahman, M.G. Brain MRI Segmentation. In Artificial Intelligence and Data Analytics in Medical Imaging; CRC Press: Boca Raton, FL, USA, 2026; pp. 94–129. [Google Scholar]
- Marano, G.; d’Abate, C. Neuroinflammation and the Female Brain: Sex-Specific Mechanisms Underlying Mood Disorders and Stress Vulnerability. Life 2026, 16, 139. [Google Scholar] [CrossRef] [Scilit] [PubMed]
- Aggarwal, N.T.; Mielke, M.M. Sex differences in Alzheimer’s disease. Neurol. Clin. 2023, 41, 343–358. [Google Scholar] [CrossRef] [Scilit] [PubMed]
- Levine, H.T.; Appelbe, I.W. Vasoactive signalling or vascular remodelling? Sex variances in mechanisms of cerebrovascular ageing. J. Physiol. 2026, 604, 2621–2623. [Google Scholar] [CrossRef] [Scilit] [PubMed]
- Ramezan, M.; Demetriou, A.; Burke, S.N.; Nalvarte, I.; Shin, A.C. Sex differences in brain glucose metabolism and Alzheimer’s disease risk and progression. Alzheimer’s Dement. 2026, 22, e71491. [Google Scholar] [CrossRef] [Scilit] [PubMed]
- Korbmacher, M.; van der Meer, D.; Beck, D.; de Lange, A.M.G.; Eikefjord, E.; Lundervold, A.; Andreassen, O.A.; Westlye, L.T.; Maximov, I.I. Brain asymmetries from mid- to late life and hemispheric brain age. Nat. Commun. 2024, 15, 956. [Google Scholar] [CrossRef] [Scilit] [PubMed]
- Li, H.; Qu, J.; Gong, G. Methodological considerations for quantifying brain asymmetry using neuroimaging techniques. Brain Res. 2025, 1867, 149979. [Google Scholar] [CrossRef] [Scilit] [PubMed]
- Ferreira, S.M.; Cuypers, K.; Hehl, M. Studying lateralization changes in the aging brain. Aging 2023, 15, 884. [Google Scholar]
- Saltoun, K.; Adolphs, R.; Paul, L.K.; Sharma, V.; Diedrichsen, J.; Yeo, B.T.T.; Bzdok, D. Dissociable brain structural asymmetry patterns reveal unique phenome-wide profiles. Nat. Hum. Behav. 2023, 7, 251–268. [Google Scholar] [CrossRef] [Scilit] [PubMed]
- Cabeza, R. Hemispheric asymmetry reduction in older adults: The HAROLD model. Psychol. Aging 2002, 17, 85–100. [Google Scholar] [CrossRef] [PubMed]
- Setton, R.; Mwilambwe-Tshilobo, L.; Girn, M.; Lockrow, A.W.; Baracchini, G.; Hughes, C.; Lowe, A.J.; Cassidy, B.N.; Li, J.; Luh, W.M.; et al. Age differences in the functional architecture of the human brain. Cereb. Cortex 2023, 33, 114–134. [Google Scholar] [CrossRef] [Scilit] [PubMed]
- Rudolph, J.; Rueckel, J.; Döpfert, J.; Ling, W.X.; Opalka, J.; Brem, C.; Hesse, N.; Ingenerf, M.; Koliogiannis, V.; Solyanik, O.; et al. Artificial intelligence–based rapid brain volumetry substantially improves differential diagnosis in dementia. Alzheimer’s Dement. Diagn. Assess. Dis. Monit. 2024, 16, e70037. [Google Scholar] [CrossRef] [Scilit] [PubMed]
- Manjón, J.V.; Romero, J.E.; Vivo-Hernando, R.; Rubio, G.; Aparici, F.; de la Iglesia-Vaya, M.; Coupé, P. vol2Brain: A new online pipeline for whole brain MRI analysis. Front. Neuroinform. 2022, 16, 862805. [Google Scholar] [CrossRef] [Scilit] [PubMed]
- Tisdall, L.; Mata, R. AgeRisk [Dataset]; OpenNeuro: Stanford, CA, USA, 2023. [Google Scholar] [CrossRef]
- Han, L.K.; Bruin, W.B.; Bas-Hoogendam, J.M.; Groenewold, N.A.; Hilbert, K.; Winkler, A.M.; Zugman, A.; Asami, T.; Barber, J.P.; Benedetti, F.; et al. Structural brain differences associated with panic disorder: An ENIGMA-Anxiety Working Group mega-analysis of 4924 individuals worldwide. Mol. Psychiatry 2026, 31, 2402–2417. [Google Scholar] [CrossRef] [Scilit] [PubMed]
- DiPentima, A.R.; Lyday, R.G.; Laurienti, P.J.; Dagenbach, D. Sex differences in human brain dynamics assessed with edge functional connectivity. Brain Imaging Behav. 2026, 20, 13. [Google Scholar] [CrossRef] [Scilit] [PubMed]
- Ritchie, S.J.; Cox, S.R.; Shen, X.; Lombardo, M.V.; Reus, L.M.; Alloza, C.; Harris, M.A.; Alderson, H.L.; Hunter, S.; Neilson, E.; et al. Sex Differences in the Adult Human Brain: Evidence from 5,216 UK Biobank Participants. Cereb. Cortex 2018, 28, 2959–2975. [Google Scholar] [CrossRef] [Scilit] [PubMed]
- Muer, J.D.; Didier, K.D.; Wannebo, B.M.; Sanchez, S.; Khademi Motlagh, H.; Haley, T.L.; Carter, K.J.; Banks, N.F.; Eldridge, M.W.; Serlin, R.C.; et al. Sex differences in gray matter, white matter, and regional brain perfusion in young, healthy adults. Am. J. Physiol.-Heart Circ. Physiol. 2024, 327, H847–H858. [Google Scholar] [CrossRef] [Scilit] [PubMed]
- Open Science Framework. Protocol. Available online: https://osf.io/sh34n (accessed on 2 June 2026).
- Manjón, J.V.; Morell-Ortega, S.; Ruiz-Perez, M.; Mansencal, B.; Le Bot, E.; Gadea, M.; Lanuza, E.; Catheline, G.; Tourdias, T.; Planche, V.; et al. Ultra-high resolution multimodal MRI densely labelled holistic structural brain atlas. Sci. Rep. 2026, 16, 9457. [Google Scholar] [CrossRef] [Scilit] [PubMed]
- Puzio, T.; Matera, K.; Karwowski, J.; Piwnik, J.; Białkowski, S.; Podyma, M.; Dunikowski, K.; Siger, M.; Stasiołek, M.; Grzelak, P.; et al. Deep learning-based automatic segmentation of brain structures on MRI: A test-retest reproducibility analysis. Comput. Struct. Biotechnol. J. 2025, 28, 128–140. [Google Scholar] [CrossRef] [Scilit] [PubMed]
- Mastropietro, A.; Scalco, E.; Figini, M. Editorial: Innovative AI approaches in quantitative MRI: From image enhancement to biomarker estimation. Front. Radiol. 2026, 6, 1796451. [Google Scholar] [CrossRef] [Scilit] [PubMed]
- Brzezinski-Rittner, A.; Moqadam, R.; Zeighami, Y.; Dadar, M. Intracranial volume: To adjust or not to adjust? It is not a matter of if, but how. Imaging Neurosci. 2026, 4, IMAG-a. [Google Scholar] [CrossRef] [Scilit] [PubMed]
- Wang, J.; Hill-Jarrett, T.; Buto, P.; Pederson, A.; Sims, K.D.; Zimmerman, S.C.; DeVost, M.A.; Ferguson, E.; Lacar, B.; Yang, Y.; et al. Comparison of approaches to control for intracranial volume in research on the association of brain volumes with cognitive outcomes. Hum. Brain Mapp. 2024, 45, e26633. [Google Scholar] [CrossRef] [Scilit] [PubMed]
- Liu, P.; Zemlyanker, D.; Gopinath, K.; Cheng, Y.; He, Y.; Izquierdo-Garcia, D.; Gomez-Isla, T.; Das, S.; Nasr, S.; Sheth, K.N.; et al. The Normalizing Properties of Intracranial Volume Across Race and Sex. Brain Commun. 2025, 7, fcaf271. [Google Scholar] [CrossRef] [Scilit] [PubMed]
- Reuter, M.; Tisdall, M.D.; Qureshi, A.; Buckner, R.L.; van der Kouwe, A.J.; Fischl, B. Head motion during MRI acquisition reduces gray matter volume and thickness estimates. Neuroimage 2015, 107, 107–115. [Google Scholar] [CrossRef] [Scilit] [PubMed]
- Wood, S.N. On p-values for smooth components of an extended generalized additive model. Biometrika 2013, 100, 221–228. [Google Scholar] [CrossRef] [Scilit]
- Dima, D.; Modabbernia, A.; Papachristou, E.; Doucet, G.E.; Agartz, I.; Aghajani, M.; Akudjedu, T.N.; Albajes-Eizagirre, A.; Alnæs, D.; Alpert, K.I.; et al. Subcortical volumes across the lifespan: Data from 18,605 healthy individuals aged 3–90 years. Hum. Brain Mapp. 2022, 43, 452–469. [Google Scholar] [CrossRef] [Scilit] [PubMed]
- Potvin, O.; Mouiha, A.; Dieumegarde, L.; Duchesne, S. Alzheimer’s Disease Neuroimaging Initiative. Normative data for subcortical regional volumes over the lifetime of the adult human brain. NeuroImage 2016, 137, 9–20. [Google Scholar] [CrossRef] [Scilit] [PubMed]
- Walhovd, K.B.; Westlye, L.T.; Amlien, I.; Espeseth, T.; Reinvang, I.; Raz, N.; Agartz, I.; Salat, D.H.; Greve, D.N.; Fischl, B.; et al. Consistent neuroanatomical age-related volume differences across multiple samples. Neurobiol. Aging 2011, 32, 916–932. [Google Scholar] [CrossRef] [Scilit] [PubMed]
- Harris, C.R.; Millman, K.J.; van der Walt, S.J.; Gommers, R.; Virtanen, P.; Cournapeau, D.; Wieser, E.; Taylor, J.; Berg, S.; Smith, N.J.; et al. Array programming with NumPy. Nature 2020, 585, 357–362. [Google Scholar] [CrossRef] [Scilit] [PubMed]
- Virtanen, P.; Gommers, R.; Haberland, M.; Burovski, E.; Weckesser, W.; Reddy, T.; Oliphant, T.E.; Cournapeau, D.; Nelson, A.; Roy, P.; et al. SciPy, Version 1.14.0; Zenodo: Geneva, Switzerland, 2024. [CrossRef]
- The Pandas Development Team. Pandas-Dev/Pandas: Pandas, Version 2.2; Zenodo: Geneva, Switzerland, 2024. [CrossRef] [Scilit]
- Virtanen, P.; Gommers, R.; Oliphant, T.E.; Haberland, M.; Reddy, T.; Cournapeau, D.; Burovski, E.; Peterson, P.; Weckesser, W.; Bright, J.; et al. SciPy 1.0: Fundamental algorithms for scientific computing in Python. Nat. Methods 2020, 17, 261–272. [Google Scholar] [CrossRef] [Scilit] [PubMed]
- Christensen, D.; Shin, Y.S.; Wang, J.; Cuomo, C.R.; Dentry, T.; Gemmell, H.M.; Pulver, S.L.; Orlando, A.M.; McKinney, W.S.; Stevens, C.J.; et al. Subcortical brain volume variations in autistic individuals across the lifespan. Mol. Autism 2025, 16, 46. [Google Scholar] [CrossRef] [Scilit] [PubMed]
- Schultz, V.; Schmitz-Koep, B.; Menegaux, A.; Thalhammer, M.; Schramm, S.; Kim, S.H.; Zimmer, C.; Sorg, C.; Giannakopoulos, P.; Montandon, M.L.; et al. Lower hippocampal volumes at baseline are associated with higher volume loss in healthy elderly. Front. Aging Neurosci. 2025, 17, 1542857. [Google Scholar] [CrossRef] [Scilit] [PubMed]
- Khadhraoui, E.; Nickl-Jockschat, T.; Henkes, H.; Behme, D.; Müller, S.J. Automated brain segmentation and volumetry in dementia diagnostics: A narrative review with emphasis on FreeSurfer. Front. Aging Neurosci. 2024, 16, 1459652. [Google Scholar] [CrossRef] [Scilit] [PubMed]
- Vidal-Piñeiro, D.; Sørensen, Ø.; Strømstad, M.; Amlien, I.K.; Baaré, W.; Bartrés-Faz, D.; Brandmaier, A.M.; Cattaneo, G.; Düzel, S.; Ghisletta, P.; et al. Vulnerability to memory decline in aging revealed by a mega-analysis of structural brain change. Nat. Commun. 2025, 16, 11488. [Google Scholar] [CrossRef] [Scilit] [PubMed]
- Ma, X.; Zhao, L.; Pan, H.; Feng, Z.; Lin, J.; Ji, J.; Li, J.; Liu, X.; Wang, J.; Tang, X.; et al. Atlas of Human Cerebellar Aging: Nonlinear Molecular Trajectories Reveal Multidimensional Mechanisms Underlying Cognitive and Motor Function Regulation. J. Gerontol. Ser. A Biol. Sci. Med. Sci. 2026, 81, glag022. [Google Scholar] [CrossRef] [Scilit] [PubMed]
- Ghiyamihoor, F.; Peymani, P.; Perron, J.; Asemi-Rad, A.; Marzban, M.; Mohite, A.; Ardila, K.; Aljada, B.; Marzban, A.; Toback, M.; et al. Volumetric changes in cerebellar transverse zones: Age and sex effects in health and neurological disorders. Hum. Brain Mapp. 2025, 46, e70214. [Google Scholar] [CrossRef] [Scilit] [PubMed]
- Wang, Y.; Teng, Y.; Liu, T.; Tang, Y.; Liang, W.; Wang, W.; Li, Z.; Xia, Q.; Xu, F.; Liu, S. Morphological changes in the cerebellum during aging: Evidence from convolutional neural networks and shape analysis. Front. Aging Neurosci. 2024, 16, 1359320. [Google Scholar] [CrossRef] [Scilit] [PubMed]
- Carnemolla, S.; Debnath, T.; Rahman, G.; Chau, S. Integrity in Six Key Brain Regions Predicts Numeric Working Memory Performance in 30,000 Middle-Aged and Older Adults: A UK Biobank Magnetic Resonance Imaging Study. Neuropsychology 2026. [Google Scholar] [CrossRef] [Scilit] [PubMed]
- Cristian, G.; Kooper, C.C.; Avramiea, A.E.; Ramautar, J.R.; Ramjith, J.; Anand, S.; Königs, M.; van der Wilt, G.J.; Bruining, H.; Linkenkaer-Hansen, K. Critical Dynamics in the Association Cortex predict Higher Intelligence in Typically Developing Children. J. Neurosci. 2026, 46, e1414252026. [Google Scholar] [CrossRef] [Scilit] [PubMed]
- Li, Q.; Liang, X.; Zeng, D.; Zhao, T.; Liao, X.; Gong, G.; Wang, Q.; Pang, C.; Yu, Q.; Dong, X.; et al. Spatiotemporal dynamics of the human cortical functional hierarchy across the lifespan. Nat. Commun. 2026, 17, 4951. [Google Scholar] [CrossRef] [Scilit] [PubMed]
- Nishio, M.; Liu, X.; Mackey, A.P.; Arcaro, M.J. Humans have a longer period of cortical maturation across depth and hierarchy than macaques. PLoS Biol. 2025, 23, e3003378. [Google Scholar] [CrossRef] [Scilit] [PubMed]
- Shim, J.H.; Baek, H.M.; Hoon, J. Regional Brain Volume Changes Across Adulthood: A Multi-Cohort Study Using MRI Data. Brain Sci. 2025, 15, 1096. [Google Scholar] [CrossRef] [Scilit] [PubMed]
- Roseborough, A.D.; Saad, L.; Goodman, M.; Cipriano, L.E.; Hachinski, V.C.; Whitehead, S.N. White matter hyperintensities and longitudinal cognitive decline in cognitively normal populations and across diagnostic categories: A meta-analysis, systematic review, and recommendations for future study harmonisation. Alzheimer’s Dement. 2023, 19, 194–207. [Google Scholar] [CrossRef] [Scilit] [PubMed]
- Bloomberg, M.; Steptoe, A. Sex and education differences in trajectories of physiological ageing: Longitudinal analysis of a prospective English cohort study. Age Ageing 2025, 54, afaf067. [Google Scholar] [CrossRef] [Scilit] [PubMed]
- Ravndal, A.; Fjell, A.M.; Vidal-Piñeiro, D.; Sørensen, Ø.; Falch, E.S.; Kropiunig, J.; Garrido, P.F.; Roe, J.M.; Alatorre-Warren, J.L.; Sneve, M.H.; et al. Sex differences in healthy brain aging are unlikely to explain higher Alzheimer’s disease prevalence in women. Proc. Natl. Acad. Sci. USA 2025, 122, e2510486122. [Google Scholar] [CrossRef] [Scilit] [PubMed]
- Sun, Y.; Hu, N.; Wang, M.; Lu, L.; Luo, C.; Tang, B.; Yao, C.; Sweeney, J.A.; Gong, Q.; Qiu, C.; et al. Hippocampal subfield alterations in schizophrenia and major depressive disorder: A systematic review and network meta-analysis of anatomic MRI studies. J. Psychiatry Neurosci. 2023, 48, E34–E49. [Google Scholar] [CrossRef] [Scilit] [PubMed]
- Sahab-Negah, S.; Hajali, V.; Moradi, H.R.; Gorji, A. The impact of estradiol on neurogenesis and cognitive functions in Alzheimer’s disease. Cell. Mol. Neurobiol. 2020, 40, 283–299. [Google Scholar] [CrossRef] [Scilit] [PubMed]
- Mak, E.; Kantarci, K.; Arvanitakis, Z. Sex differences in in vivo biomarkers of neurodegenerative dementia. Front. Dement. 2025, 4, 1706177. [Google Scholar] [CrossRef] [Scilit] [PubMed]
- Ocklenburg, S. Leftward asymmetry of the planum temporale and its association with language. Brain Struct. Funct. 2025, 230, 112. [Google Scholar] [CrossRef] [Scilit]
- Kurth, F.; Cherbuin, N.; Gaser, C.; Luders, E. Changes in voxel-wise gray matter asymmetry over time. Front. Neurosci. 2025, 19, 1671341. [Google Scholar] [CrossRef] [Scilit] [PubMed]
- Deery, H.A.; Di Paolo, R.; Moran, C.; Egan, G.F.; Jamadar, S.D. The older adult brain is less modular, more integrated, and less efficient at rest: A systematic review of large-scale resting-state functional brain networks in aging. Psychophysiology 2023, 60, e14159. [Google Scholar] [CrossRef] [Scilit] [PubMed]
- Woodward, M.; Bennett, D.A.; Rundek, T.; Perry, G.; Rudka, T. The relationship between hippocampal changes in healthy aging and Alzheimer’s disease: A systematic literature review. Front. Aging Neurosci. 2024, 16, 1390574. [Google Scholar] [CrossRef] [Scilit] [PubMed]
- Thompson, P.M.; Jahanshad, N.; Ching, C.R.K.; Salminen, L.E.; Thomopoulos, S.I.; Bright, J.; Baune, B.T.; Bertolín, S.; Bralten, J.; Bruin, W.B.; et al. ENIGMA and global neuroscience: A decade of large-scale studies of the brain in health and disease across more than 40 countries. Transl. Psychiatry 2020, 10, 100. [Google Scholar] [CrossRef] [Scilit] [PubMed]
- Zhu, A.H.; Nir, T.M.; Javid, S.; Villalón-Reina, J.E.; Rodrigue, A.L.; Strike, L.T.; de Zubicaray, G.I.; McMahon, K.L.; Wright, M.J.; Medland, S.E.; et al. Lifespan reference curves for harmonising multi-site regional brain white matter metrics from diffusion MRI. Sci. Data 2025, 12, 748. [Google Scholar] [CrossRef] [Scilit] [PubMed]
- Wilckens, K.A.; Stillman, C.M.; Waiwood, A.M.; Kang, C.; Leckie, R.L.; Peven, J.C.; Foust, J.E.; Fraundorf, S.H.; Erickson, K.I. Exercise interventions preserve hippocampal volume: A meta-analysis. Hippocampus 2021, 31, 335–347. [Google Scholar] [CrossRef] [Scilit] [PubMed]
- García-Marín, L.M.; Rabinowitz, J.A.; Mitchell, B.L.; Martin, N.G.; Hickie, I.B.; Medland, S.E.; Rentería, M.E. Genomic analysis of intracranial and subcortical brain volumes yields polygenic scores accounting for variation across ancestries. Nat. Genet. 2024, 56, 2333–2344. [Google Scholar] [CrossRef] [Scilit] [PubMed]
- Honea, R.A.; Watts, A.; Donofry, S.D.; Molina-Hidalgo, C.; Ripperger, H.S.; Aghjayan, S.L.; Kang, C.; Gujral, S.; Oberlin, L.E.; Grove, G.; et al. Lifespan exposure to hormone therapies and structural brain morphometry in older women. NeuroImage 2026, 334, 121974. [Google Scholar] [CrossRef] [Scilit] [PubMed]
- Saminathan, P.; Corey, M.; Gibbons, A.; Rayadurgam, M.; Reddy, N.; Ramesh, P.; Sharma, S. Sex Differences in Metabolite-Immune Circuits of Neuroinflammation. Immunol. Rev. 2026, 338, e70114. [Google Scholar] [CrossRef] [Scilit] [PubMed]
- Glavan, D.; Doeppner, T.R.; Abuzan, M.; Hermann, D.M.; Capitanescu, B.; Olaru, D.G.; Popa-Wagner, A. Targeting the Biology of Aging in Cerebrovascular Disease: Inflammation, Metabolism, Senescence, and Regeneration. Int. J. Mol. Sci. 2026, 27, 1880. [Google Scholar] [CrossRef] [Scilit] [PubMed]
- Kim, Y.K.; Song, J. Ketone metabolism at the interface of atherosclerosis and brain dysfunction. Pharmacol. Res. 2026, 230, 108301. [Google Scholar] [CrossRef] [Scilit] [PubMed]
- Kim, T.; Shu, H.; Jia, Q.; de Leon, M.J. Alzheimer’s Disease Neuroimaging Initiative. Deepfdr: A deep learning-based false discovery rate control method for neuroimaging data. Proc. Mach. Learn. Res. 2024, 238, 946. [Google Scholar] [PubMed]
- Pappalettera, C.; Carrarini, C.; Miraglia, F.; Vecchio, F.; Rossini, P.M. Cognitive resilience/reserve: Myth or reality? A review of definitions and measurement methods. Alzheimer’s Dement. 2024, 20, 3567–3586. [Google Scholar] [CrossRef] [Scilit] [PubMed]
- Tisdall, L.; Frey, R.; Wulff, D.U.; Kellen, D.; Mata, R. Convergence of age differences in risk preference, impulsivity, and self-control: A multiverse analysis. J. Gerontol. Ser. B Psychol. Sci. Soc. Sci. 2024, 79, gbae092. [Google Scholar] [CrossRef] [Scilit] [PubMed]
- Parker, T.D.; Bethlehem, R.A.; Seidlitz, J.; White, S.R.; David, M.C.; Kolanko, M.A.; Bernstock, J.D.; Dorfschmidt, L.; Bourke, N.; Gailly de Taurines, A.; et al. Generalizable MRI normative modelling to detect age-inappropriate neurodegeneration. Alzheimer’s Res. Ther. 2025, 17, 244. [Google Scholar] [CrossRef] [Scilit] [PubMed]
- Sihag, S.; Mateos, G.; Ribeiro, A. Disentangling Neurodegeneration With Brain Age Gap Prediction Models: A graph signal processing perspective. IEEE Signal Process. Mag. 2025, 42, 58–77. [Google Scholar] [CrossRef] [Scilit]
- Kim, M.E.; Gao, C.; Ramadass, K.; Newlin, N.R.; Kanakaraj, P.; Bogdanov, S.; Rudravaram, G.; Archer, D.; Hohman, T.J.; Jefferson, A.L.; et al. White matter micro-and macrostructure brain charts for the human lifespan. Nature 2026, 655, 979–989. [Google Scholar] [CrossRef] [Scilit] [PubMed]
- Gi, Y.; Jung, A.H.; Lim, H.; Park, S.; Lee, J.; Kim, J.H.; Kim, B.-J.; Baek, S.-H.; Yoon, M. Inclusion of intracranial volume as a covariate feature improves MRI-based Alzheimer’s disease classification. Magn. Reson. Mater. Phys. Biol. Med. 2026, 39, 1–15. [Google Scholar] [CrossRef] [Scilit] [PubMed]
- Jin, S.; Wang, J.; He, Y. The brain network hub degeneration in Alzheimer’s disease. Biophys. Rep. 2024, 10, 213–229. [Google Scholar] [CrossRef] [Scilit] [PubMed]
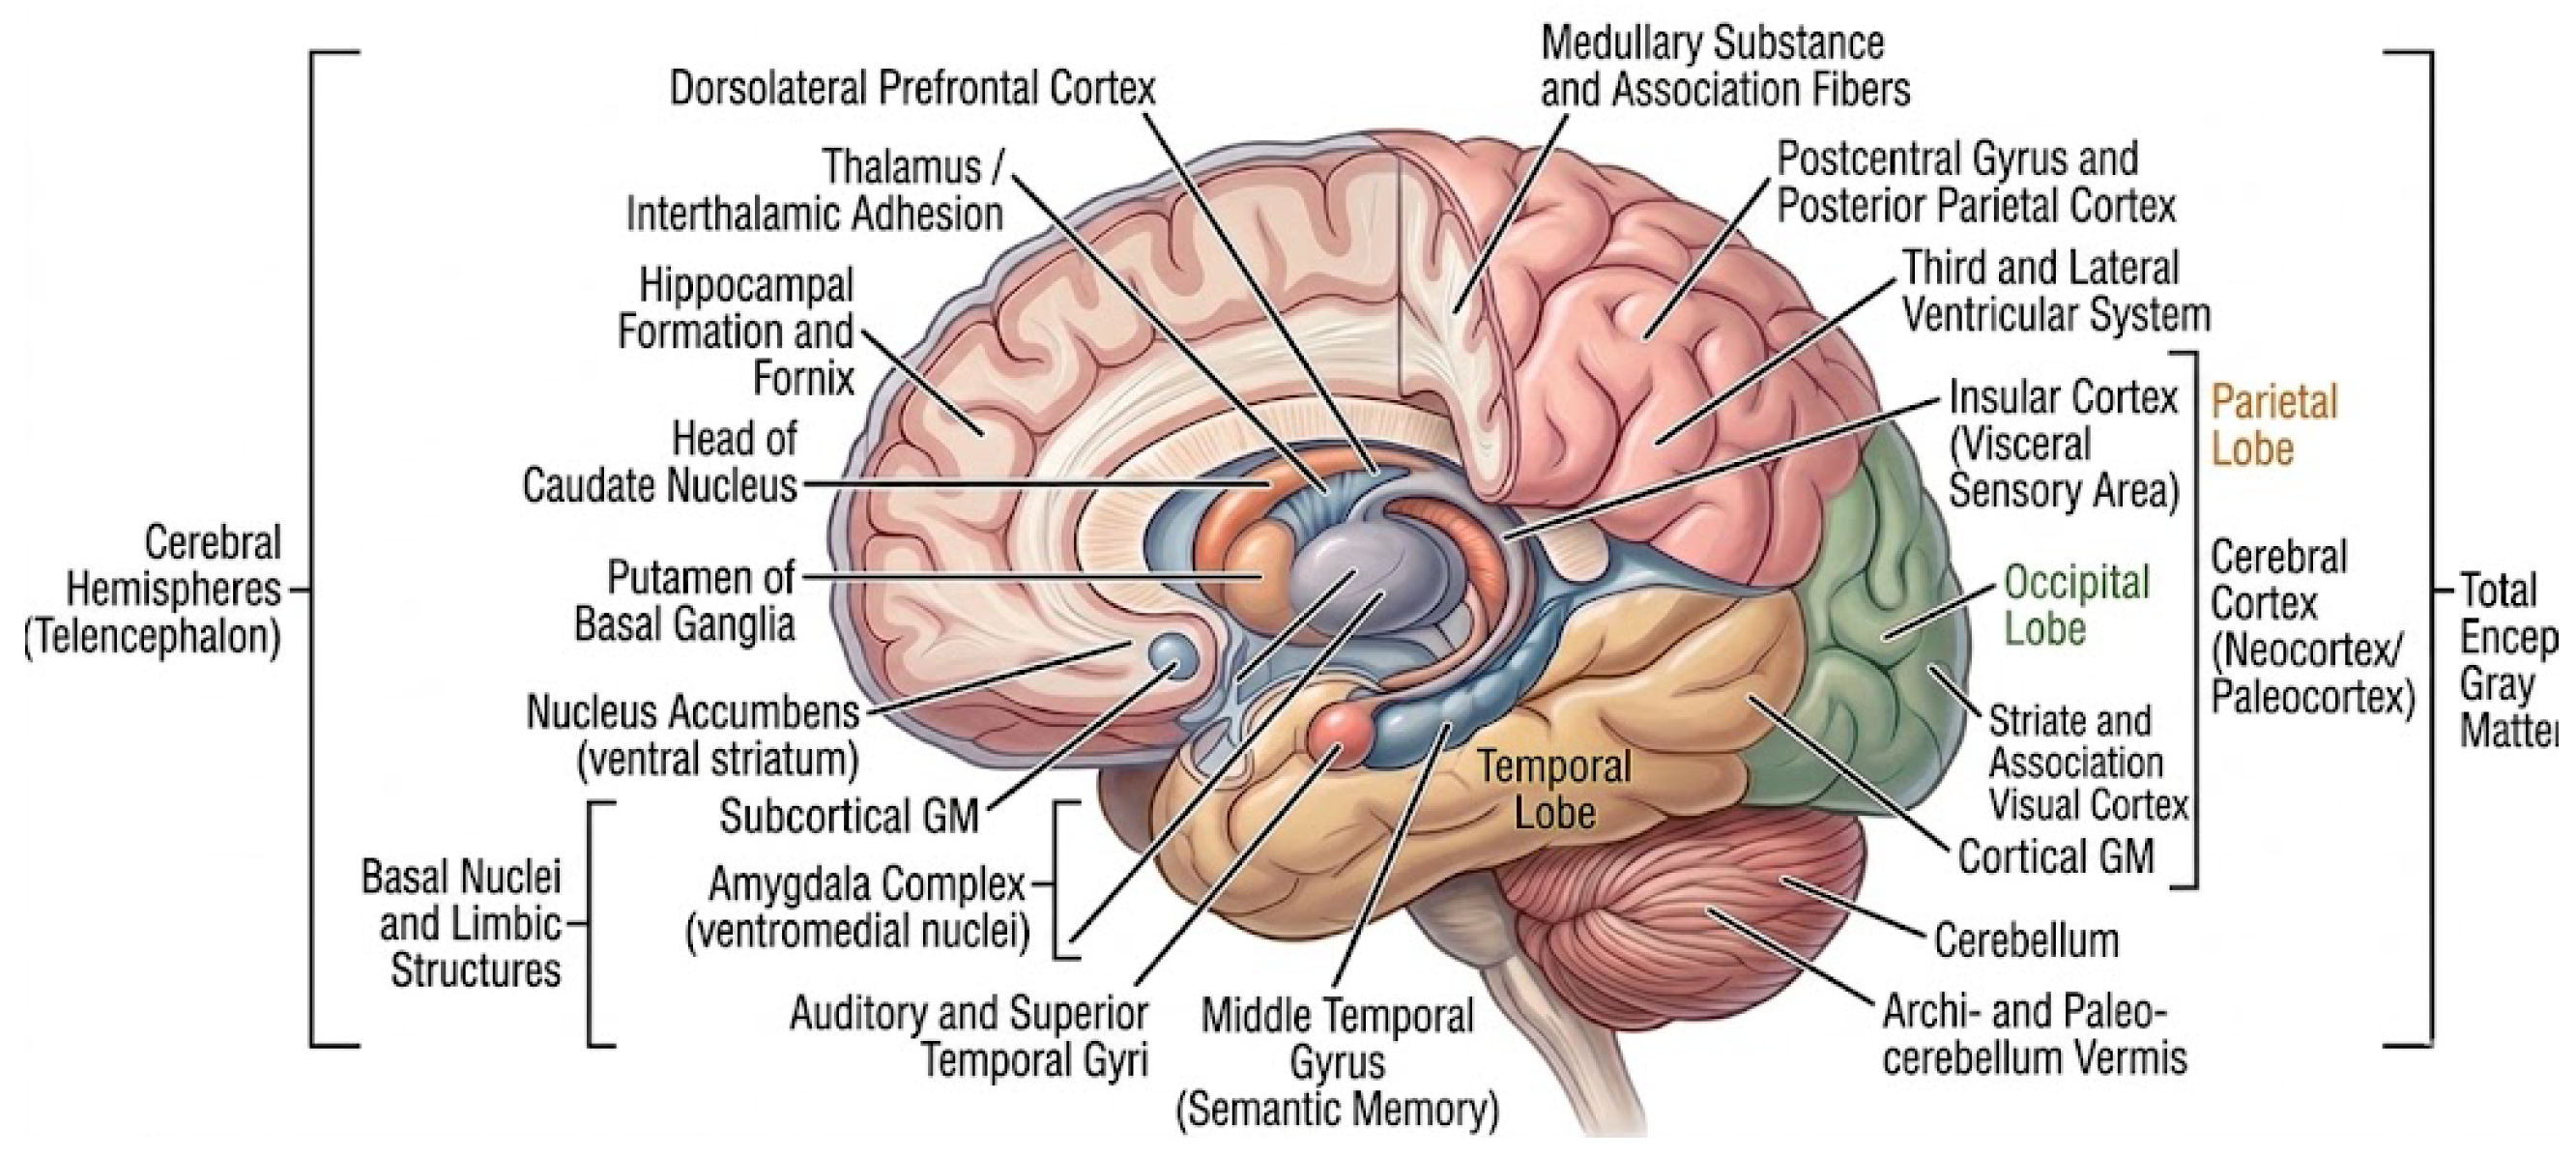



| Domain | Hypothesis Label | Directional Prediction | Deciding Test |
|---|---|---|---|
| Age association | H1a-i: Subcortical linear decline | Negative linear age association across subcortical regions | FDR-corrected p for linear age () |
| H1a-ii: Parietal nonlinearity | Parietal lobe shows a nonlinear association | FDR-corrected p for quadratic age | |
| H1b: WM inverted-U | WM peaks in mid-adulthood before declining | FDR-corrected p for quadratic age | |
| H1c: Insular/striatal sensitivity | Accumbens, caudate, and insula show highest age | Rank order of linear age across 19 regions | |
| Sex differences | H2a: Female GM advantage | Greater ICV-adjusted GM volumes in females | FDR-corrected sex main effect in GM regions |
| H2b: Male CSF advantage | Greater ICV-adjusted CSF volume in males | FDR-corrected sex main effect for CSF | |
| H2c: No sex effects in cerebellum/WM | Non-significant sex effects after ICV correction | FDR-corrected sex p for cerebellum, WM | |
| H2d: Female-favouring interactions | Shallower cross-sectional age slopes in females for subcortical structures | FDR-corrected sex×age interaction across 19 regions | |
| Hemispheric asymmetry | H3a: Population-level asymmetry | Directional lateralisation across bilateral structures | One-sample t-test vs. zero for each asymmetry index (AI), Bonferroni |
| H3b: Age-related asymmetry reduction | Negative age–AI correlation in posterior cortex; subcortical stability | Pearson r age–AI, Bonferroni () across 12 regions |
| Sub-118 | Sub-015 | |
|---|---|---|
| Gyrus a | Male, 71 y | Female, 46 y |
| FRP | 4.61 | 3.20 |
| GRe | 1.41 | 2.99 |
| OpIFG | 2.59 | 8.27 |
| OrIFG | 1.58 | 1.70 |
| TrIFG | 1.78 | 7.65 |
| MFC | 0.26 | 1.95 |
| MFG | 22.50 | 34.38 |
| AOrG | 1.22 | 3.22 |
| LOrG | 2.10 | 2.91 |
| MOrG | 1.67 | 7.01 |
| POrG | 1.67 | 5.97 |
| PrG | 17.57 | 28.15 |
| MPrG | 4.15 | 4.92 |
| SCA | 0.00 | 1.80 |
| SFG | 22.46 | 24.79 |
| MSFG | 6.02 | 9.53 |
| SMC | 6.60 | 9.04 |
| Sum of 17 gyri | 98.19 | 157.48 |
| Reported “Frontal total volume” b | 98.20 | 157.48 |
| Difference | 0.01 | 0.00 |
| Age Group | 16–29 yr | 30–39 yr | 40–49 yr | 50–59 yr | 60–69 yr | 70+ yr | ||||||
|---|---|---|---|---|---|---|---|---|---|---|---|---|
| Sex | M | F | M | F | M | F | M | F | M | F | M | F |
| n | 27 | 29 | 13 | 15 | 9 | 12 | 11 | 13 | 15 | 18 | 15 | 10 |
| Hippocampus | 7.43 ± 0.95 | 7.06 ± 0.84 | 7.49 ± 0.89 | 7.12 ± 0.75 | 7.21 ± 1.19 | 6.77 ± 0.78 | 6.87 ± 1.07 | 6.51 ± 2.34 | 6.49 ± 2.12 | 7.09 ± 0.8 | 5.6 ± 1.91 | 6.33 ± 2.25 |
| Amygdala | 2.02 ± 0.28 | 1.77 ± 0.29 | 2.02 ± 0.18 | 1.77 ± 0.22 | 1.8 ± 0.31 | 1.64 ± 0.22 | 1.72 ± 0.3 | 1.53 ± 0.56 | 1.63 ± 0.51 | 1.72 ± 0.21 | 1.24 ± 0.51 | 1.32 ± 0.41 |
| Caudate | 8.17 ± 1.09 | 7.3 ± 0.57 | 7.56 ± 1.13 | 6.95 ± 0.89 | 6.93 ± 1.05 | 6.83 ± 0.86 | 7.19 ± 0.96 | 6.18 ± 1.86 | 7.05 ± 0.87 | 6.39 ± 0.86 | 5.69 ± 1.65 | 5.94 ± 1.53 |
| Putamen | 7.81 ± 1.92 | 6.87 ± 1.36 | 7.54 ± 1.91 | 6.95 ± 1.91 | 7.2 ± 1.81 | 6.19 ± 1.15 | 6.74 ± 1.33 | 5.02 ± 2.29 | 6.55 ± 1.7 | 6.44 ± 1.27 | 4.91 ± 2.25 | 5.39 ± 2.24 |
| Accumbens | 0.64 ± 0.11 | 0.55 ± 0.11 | 0.584 ± 0.147 | 0.53 ± 0.13 | 0.51 ± 0.19 | 0.43 ± 0.07 | 0.55 ± 0.09 | 0.39 ± 0.17 | 0.45 ± 0.12 | 0.45 ± 0.11 | 0.3 ± 0.213 | 0.37 ± 0.16 |
| Thalamus | 5.34 ± 2.3 | 5.92 ± 3.06 | 5.17 ± 1.29 | 7.0 ± 3.86 | 4.03 ± 0.72 | 4.4 ± 1.44 | 5.74 ± 3.81 | 4.22 ± 2.69 | 4.84 ± 3.1 | 5.9 ± 2.52 | 3.13 ± 1.14 | 4.62 ± 3.24 |
| Pallidum | 2.06 ± 0.46 | 2.13 ± 0.54 | 2.201 ± 0.39 | 2.24 ± 0.6 | 1.76 ± 0.39 | 1.86 ± 0.36 | 2.27 ± 0.65 | 1.95 ± 0.6 | 2.26 ± 0.58 | 2.03 ± 0.57 | 2.28 ± 0.72 | 2.06 ± 0.83 |
| Subcortical GM | 34.2 ± 5.6 | 32.2 ± 5.5 | 33.2 ± 4.8 | 33.1 ± 2.2 | 30.0 ± 4.8 | 28.6 ± 3.1 | 31.7 ± 5.8 | 26.3 ± 9.7 | 29.8 ± 6.5 | 30.6 ± 5.0 | 23.6 ± 7.3 | 26.5 ± 9.2 |
| Cortical GM | 493 ± 65 | 497 ± 64 | 541 ± 79 | 482 ± 55 | 499 ± 38 | 473 ± 46 | 520 ± 43 | 493 ± 82 | 506 ± 57 | 481 ± 46 | 495 ± 90 | 456 ± 109 |
| Total GM | 628 ± 72 | 626 ± 71 | 674 ± 93 | 610 ± 66 | 622 ± 47 | 592 ± 55 | 651 ± 47 | 608 ± 108 | 622 ± 70 | 603 ± 56 | 599 ± 112 | 565 ± 139 |
| WM | 395 ± 47 | 366 ± 33 | 432 ± 51 | 370 ± 51 | 421 ± 32 | 384 ± 33 | 440 ± 58 | 404 ± 39 | 414 ± 31 | 363 ± 34 | 422 ± 64 | 377 ± 72 |
| CSF | 337 ± 64 | 269 ± 53 | 308 ± 42 | 233 ± 58 | 313 ± 62 | 256 ± 48 | 303 ± 61 | 264 ± 61 | 316 ± 67 | 246 ± 38 | 307 ± 69 | 251 ± 73 |
| Cerebellum | 139.4 ± 12.8 | 126.8 ± 9.7 | 138.0 ± 16.8 | 124.8 ± 12.0 | 135.8 ± 9.8 | 121.3 ± 7.4 | 137.3 ± 11.3 | 121.4 ± 18.0 | 124.8 ± 16.8 | 117.3 ± 10.4 | 121.3 ± 19.5 | 110.5 ± 27.9 |
| Cerebrum | 876 ± 96 | 858 ± 91 | 960 ± 118 | 847 ± 97 | 900 ± 71 | 848 ± 64 | 946 ± 89 | 884 ± 117 | 904 ± 72 | 841 ± 75 | 893 ± 140 | 825 ± 174 |
| Temporal Lobe | 107.8 ± 12.9 | 104.6 ± 11.2 | 110.7 ± 16.3 | 99.8 ± 10.7 | 102.5 ± 7.6 | 94.9 ± 10.1 | 104.7 ± 11.4 | 97.5 ± 17.6 | 101.3 ± 12.2 | 97.7 ± 8.5 | 97.1 ± 20.4 | 89.0 ± 22.4 |
| Frontal Lobe | 125.4 ± 32.4 | 139.7 ± 28.5 | 150.7 ± 29.8 | 139.2 ± 24.1 | 141.4 ± 23.4 | 142.9 ± 22.3 | 153.7 ± 28.9 | 149.9 ± 26.8 | 153.1 ± 20.1 | 147.5 ± 22.6 | 163.6 ± 28.9 | 147.2 ± 32.4 |
| Parietal Lobe | 99.6 ± 13.6 | 100.0 ± 15.6 | 114.8 ± 17.8 | 100.8 ± 10.9 | 104.1 ± 8.4 | 99.0 ± 9.9 | 109.0 ± 9.1 | 103.8 ± 15.8 | 103.7 ± 14.2 | 97.8 ± 11.3 | 97.2 ± 16.8 | 92.1 ± 23.9 |
| Occipital Lobe | 77.5 ± 6.2 | 75.5 ± 8.8 | 80.4 ± 8.9 | 69.4 ± 8.1 | 72.7 ± 7.8 | 67.7 ± 6.9 | 75.9 ± 5.6 | 70.7 ± 12.6 | 72.0 ± 8.5 | 68.8 ± 5.4 | 67.9 ± 14.5 | 64.0 ± 16.0 |
| Insula | 35.4 ± 5.3 | 32.0 ± 3.4 | 35.4 ± 4.4 | 29.5 ± 3.2 | 31.2 ± 1.8 | 28.0 ± 3.3 | 31.9 ± 3.1 | 28.9 ± 2.8 | 31.4 ± 5.4 | 28.0 ± 2.2 | 27.7 ± 6.8 | 25.2 ± 3.6 |
| Region | Predictor | Direction/ (95% CI) | /p | (Unique Variance) |
|---|---|---|---|---|
| Hippocampus | Age (linear) | Negative; ; 95% CI | 0.001 | 0.070 |
| Hippocampus | Sex (female > male) | ; 95% CI | 0.001 | 0.090 |
| Amygdala | Age (linear) | Negative; full in Table S1 | 0.05 | (see Table S1) |
| Caudate | Age (linear) | Negative; full in Table S1 | 0.05 | (see Table S1) |
| Putamen | Age (linear) | Negative; full in Table S1 | 0.05 | (see Table S1) |
| Nucleus accumbens | Age (linear) | Negative; full in Table S1 | 0.05 | (see Table S1) |
| Insular cortex | Age (linear) | Negative; full in Table S1 | 0.05 | (see Table S1) |
| Temporal lobe | Age (linear) | Negative; full in Table S1 | 0.05 | (see Table S1) |
| Occipital lobe | Age (linear) | Negative; full in Table S1 | 0.05 | (see Table S1) |
| Parietal lobe | Age2 (quadratic) | Inverted-U; vertex ≈ midlife; full in Table S1 | 0.008 | (see Table S1) |
| WM (total) | Age (linear) | Positive linear association and no FDR-significant quadratic term; full in Table S1 | 0.05 | (see Table S1) |
| Cerebrospinal fluid (CSF) | Sex (male > female) | Male > female (ICV-adjusted); full in Table S1 | 0.05 | (see Table S1) |
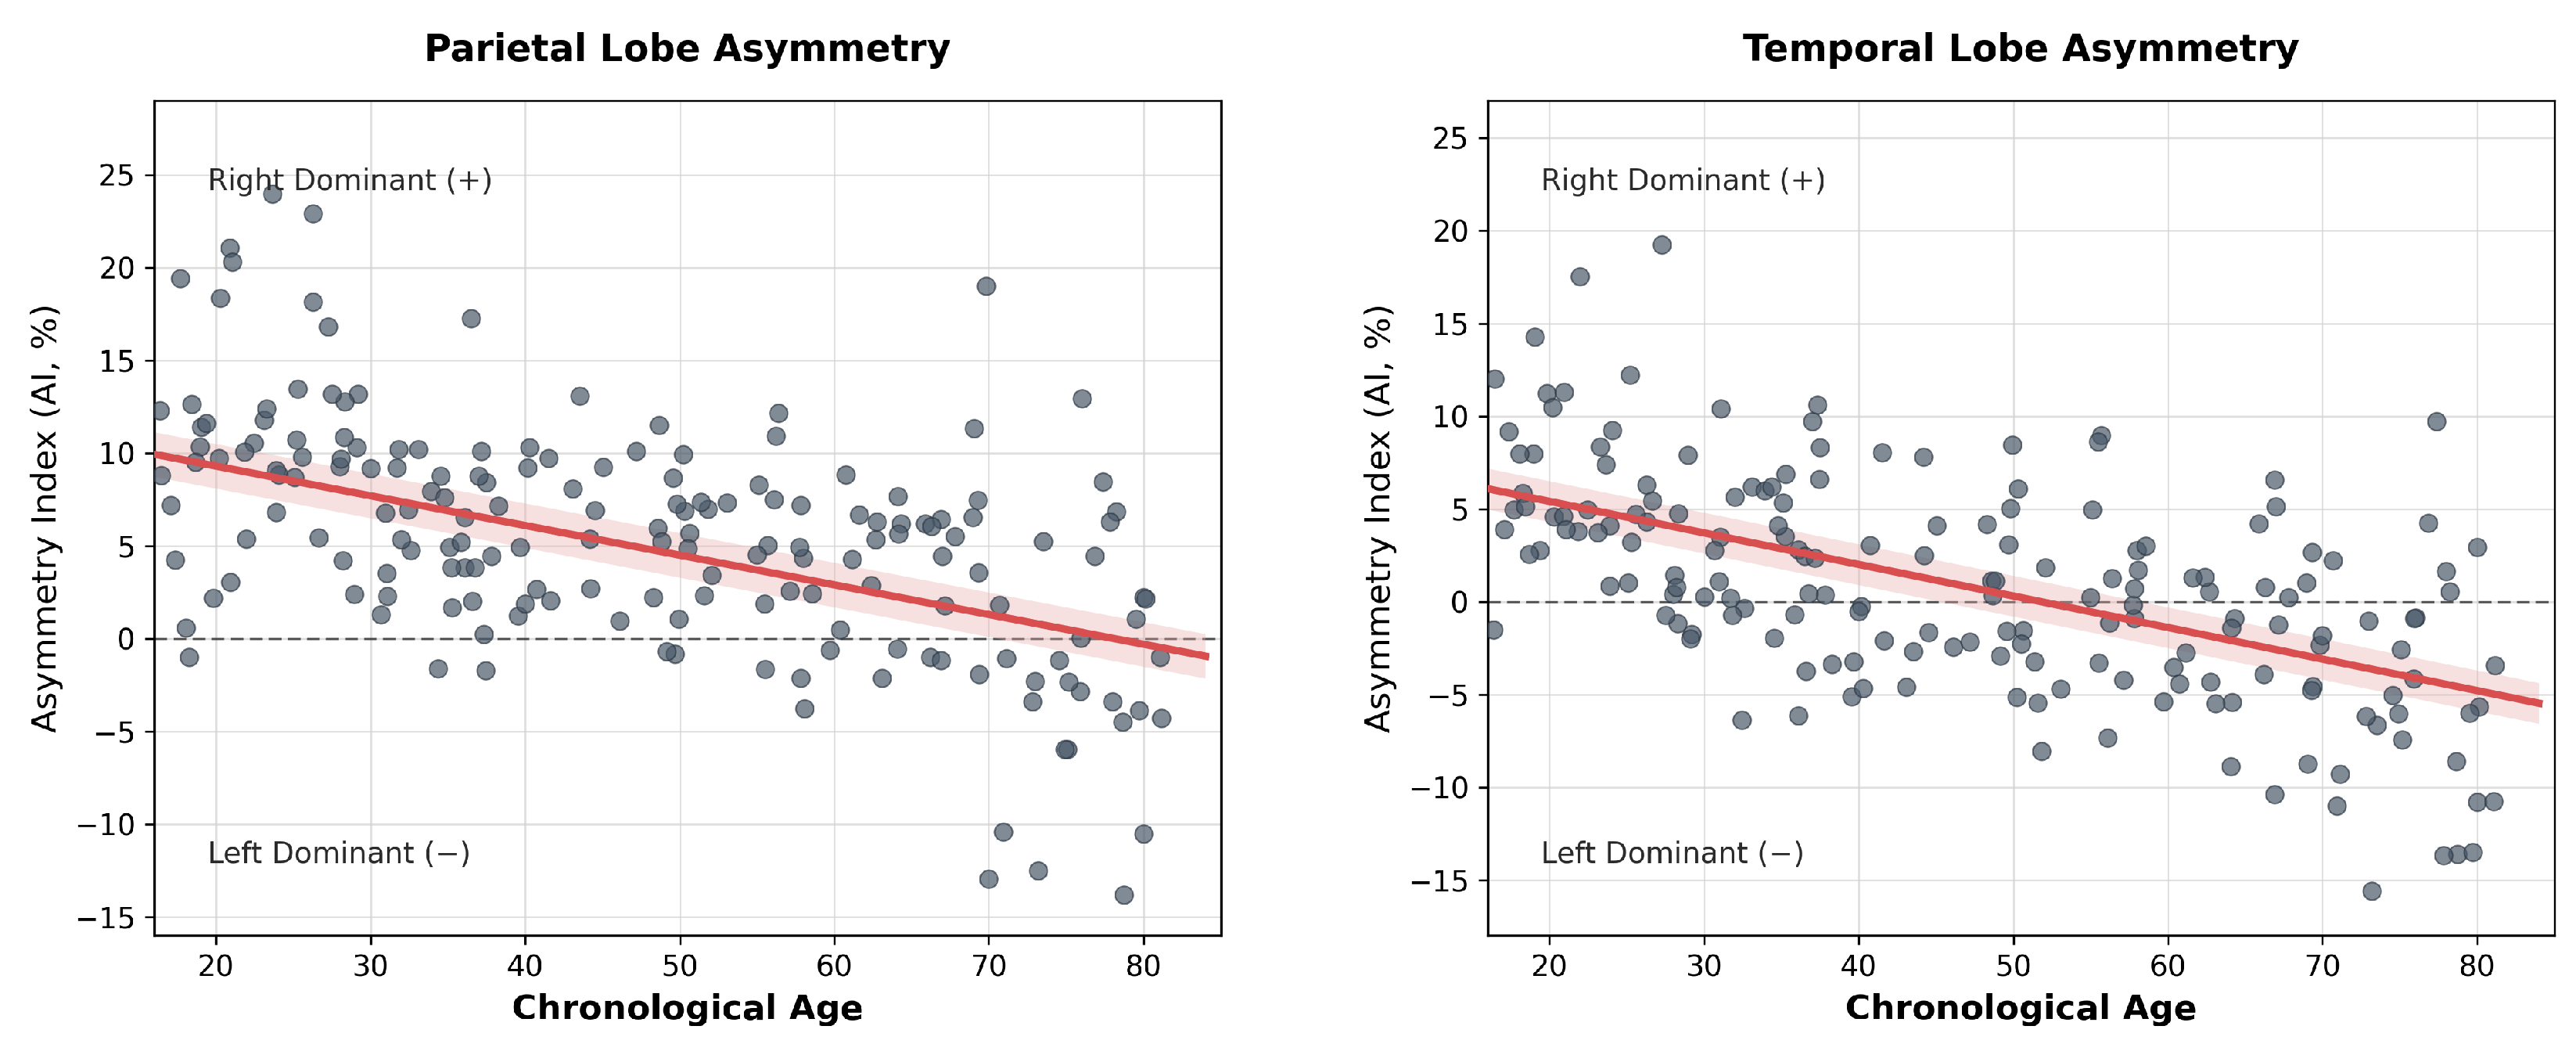
| Asymmetry: Parietal AI | Age → AI | Negative (reduced asymmetry with age) | 0.001 | (see Table S1) |
| Region | Male | Female | SE | p (Raw) | ||
|---|---|---|---|---|---|---|
| (cm3/yr) | (cm3/yr) | |||||
| Hippocampus | −0.028 | −0.004 | +0.024 | 0.008 | 0.005 | 0.029 * |
| Amygdala | −0.013 | −0.004 | +0.008 | 0.002 | 0.001 | 0.007 ** |
| Caudate | −0.039 | −0.021 | +0.018 | 0.007 | 0.009 | 0.034 * |
| Putamen | −0.047 | −0.023 | +0.024 | 0.013 | 0.063 | 0.150 |
| Accumbens | −0.006 | −0.003 | +0.003 | 0.001 | 0.002 | 0.019 * |
| Thalamus † | −0.029 | −0.020 | +0.009 | 0.021 | 0.677 | 0.756 |
| Pallidum | +0.005 | −0.001 | −0.006 | 0.004 | 0.116 | 0.244 |
| Subcortical GM | −0.160 | −0.077 | +0.083 | 0.043 | 0.054 | 0.150 |
| Cortical GM | +0.235 | −0.120 | −0.355 | 0.301 | 0.239 | 0.349 |
| Total GM | −0.240 | −0.341 | −0.102 | 0.351 | 0.773 | 0.815 |
| WM | +0.726 | +0.448 | −0.278 | 0.234 | 0.235 | 0.349 |
| CSF | −0.459 | −0.106 | +0.354 | 0.400 | 0.377 | 0.478 |
| Cerebellum | −0.273 | −0.179 | +0.095 | 0.071 | 0.186 | 0.349 |
| Cerebrum | +0.782 | +0.292 | −0.491 | 0.387 | 0.207 | 0.349 |
| Temporal Lobe | −0.168 | −0.155 | +0.014 | 0.062 | 0.828 | 0.828 |
| Frontal Lobe | +0.749 | +0.301 | −0.448 | 0.168 | 0.009 | 0.034 * |
| Parietal Lobe | +0.038 | +0.001 | −0.037 | 0.070 | 0.594 | 0.706 |
| Occipital Lobe | −0.152 | −0.112 | +0.040 | 0.040 | 0.321 | 0.436 |
| Insula | −0.127 | −0.079 | +0.047 | 0.025 | 0.060 | 0.150 |
| Region | N (Fail) | (cm3) | (cm3) | Mean AI (%) | SD | Median [IQR] | Boot. 95% CI | Raw Test and p | Adj. p | Verdict |
|---|---|---|---|---|---|---|---|---|---|---|
| Left-hemisphere dominant (AI < 0) | ||||||||||
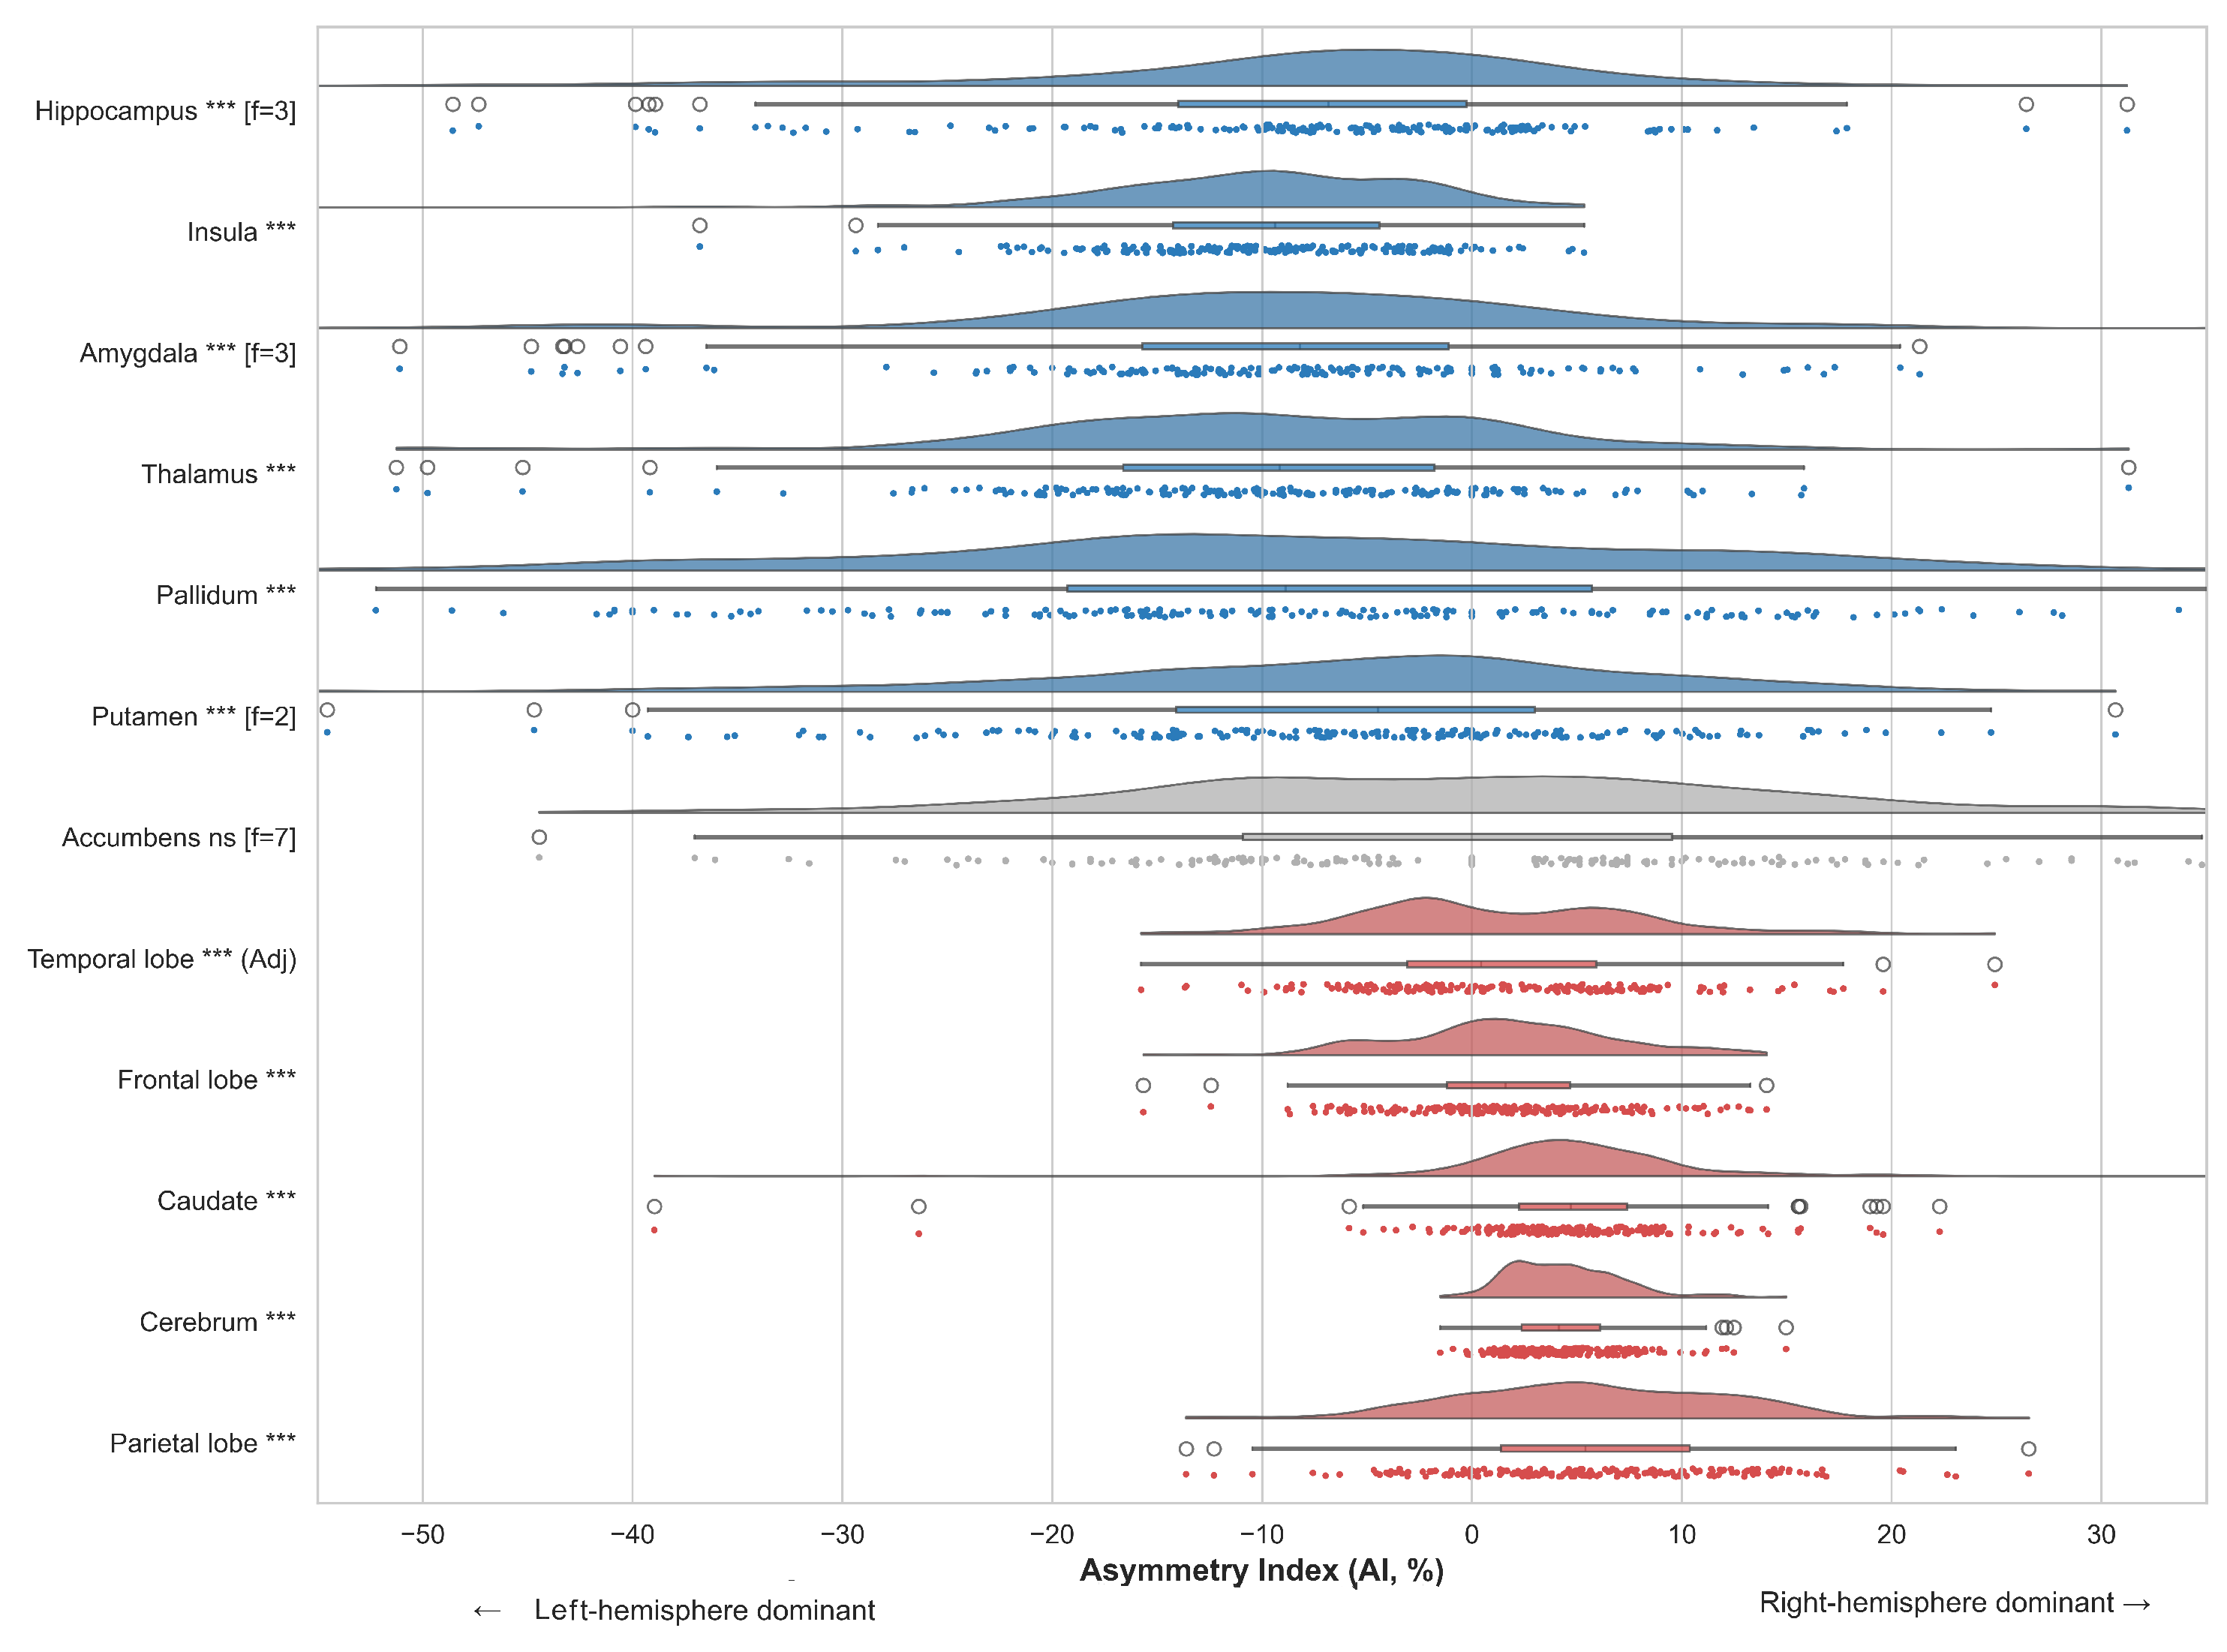
| Hippocampus | 184 (f = 3) | 3.33 | 3.65 | −10.59 | 19.37 | −6.83 {[−13.99, −0.27]} | [−13.46, −7.89] | Wilcoxon, <0.001 | <0.001 | ✓ |
| Insula | 187 (f = 0) | 14.68 | 16.19 | −10.15 | 8.40 | −9.38 {[−14.24, −4.42]} | [−11.39, −9.03] | Wilcoxon, <0.001 | <0.001 | ✓ |
| Amygdala | 184 (f = 3) | 0.83 | 0.90 | −10.01 | 18.92 | −8.21 {[−15.70, −1.12]} | [−12.77, −7.31] | Wilcoxon, <0.001 | <0.001 | ✓ |
| Thalamus a | 187 (f = 0) | 2.47 | 2.70 | −9.39 | 11.38 | −9.16 {[−16.62, −1.78]} | [−11.01, −7.80] | Wilcoxon, <0.001 | <0.001 | ✓ |
| Pallidum | 187 (f = 0) | 1.01 | 1.09 | −7.70 | 22.67 | −8.89 {[−19.28, +5.71]} | [−10.98, −4.41] | Wilcoxon, <0.001 | <0.001 | ✓ |
| Putamen | 185 (f = 2) | 3.23 | 3.42 | −6.00 | 14.47 | −4.47 {[−14.09, +2.99]} | [−8.15, −3.94] | Wilcoxon, <0.001 | <0.001 | ✓ |
| Right-hemisphere dominant (AI > 0) | ||||||||||
| Accumbens | 180 (f = 7) | 0.25 | 0.25 | +0.72 | 18.03 | +0.00 {[−10.91, +9.52]} | [−1.84, +3.40] | Wilcoxon, 0.819 | 0.592 | ✗ ns |
| Temporal lobe | 187 (f = 0) | 51.12 | 50.41 | +1.33 | 6.67 | +0.44 {[−3.08, +5.92]} | [+0.39, +2.31] | Wilcoxon, 0.020 | 0.002 | ✓ |
| Frontal lobe | 187 (f = 0) | 72.75 | 71.59 | +1.62 | 5.14 | +1.59 {[−1.19, +4.67]} | [+0.88, +2.35] | t-test, <0.001 | <0.001 | ✓ |
| Cerebrum | 187 (f = 0) | 448.74 | 429.52 | +4.43 | 2.70 | +4.15 {[+2.37, +6.10]} | [+4.05, +4.83] | Wilcoxon, <0.001 | <0.001 | ✓ |
| Caudate | 187 (f = 0) | 3.57 | 3.40 | +4.92 | 6.45 | +4.71 {[+2.26, +7.38]} | [+3.98, +5.80] | Wilcoxon, <0.001 | <0.001 | ✓ |
| Parietal lobe | 187 (f = 0) | 52.14 | 49.27 | +5.77 | 6.66 | +5.41 {[+1.38, +10.38]} | [+4.81, +6.73] | t-test, <0.001 | <0.001 | ✓ |
| Region | Partial r | 95% CI | Raw p | Quadratic p | Verdict | |
|---|---|---|---|---|---|---|
| Cortical & Global | Parietal lobe | −0.534 | [−0.635, −0.413] | <0.001 | 0.270 | ✓ |
| Temporal lobe | −0.513 | [−0.548, −0.288] | <0.001 | 0.435 | ✓ | |
| Cerebrum | −0.318 | [−0.444, −0.176] | <0.001 | 0.390 | ✓ | |
| Insula | −0.252 | [−0.385, −0.108] | <0.001 | 0.393 | ✓ | |
| Frontal lobe | −0.173 | [−0.294, −0.007] | 0.034 | 0.866 | ✓ | |
| Subcortical | Amygdala | −0.242 | [−0.376, −0.096] | <0.001 | 0.069 | ✓ |
| Hippocampus | −0.207 | [−0.344, −0.060] | 0.005 | 0.376 | ✗ ns | |
| Caudate | +0.011 | [+0.052, +0.333] | 0.016 | 0.679 | ✗ ns | |
| Putamen | −0.058 | [−0.204, +0.091] | 0.435 | 0.102 | ✗ ns | |
| Accumbens | −0.040 | [−0.188, +0.110] | 0.579 | 0.093 | ✗ ns | |
| Pallidum | +0.014 | [−0.193, +0.158] | 0.889 | 0.229 | ✗ ns | |
| Thalamus | +0.010 | [−0.139, +0.158] | 0.889 | 0.229 | ✗ ns |
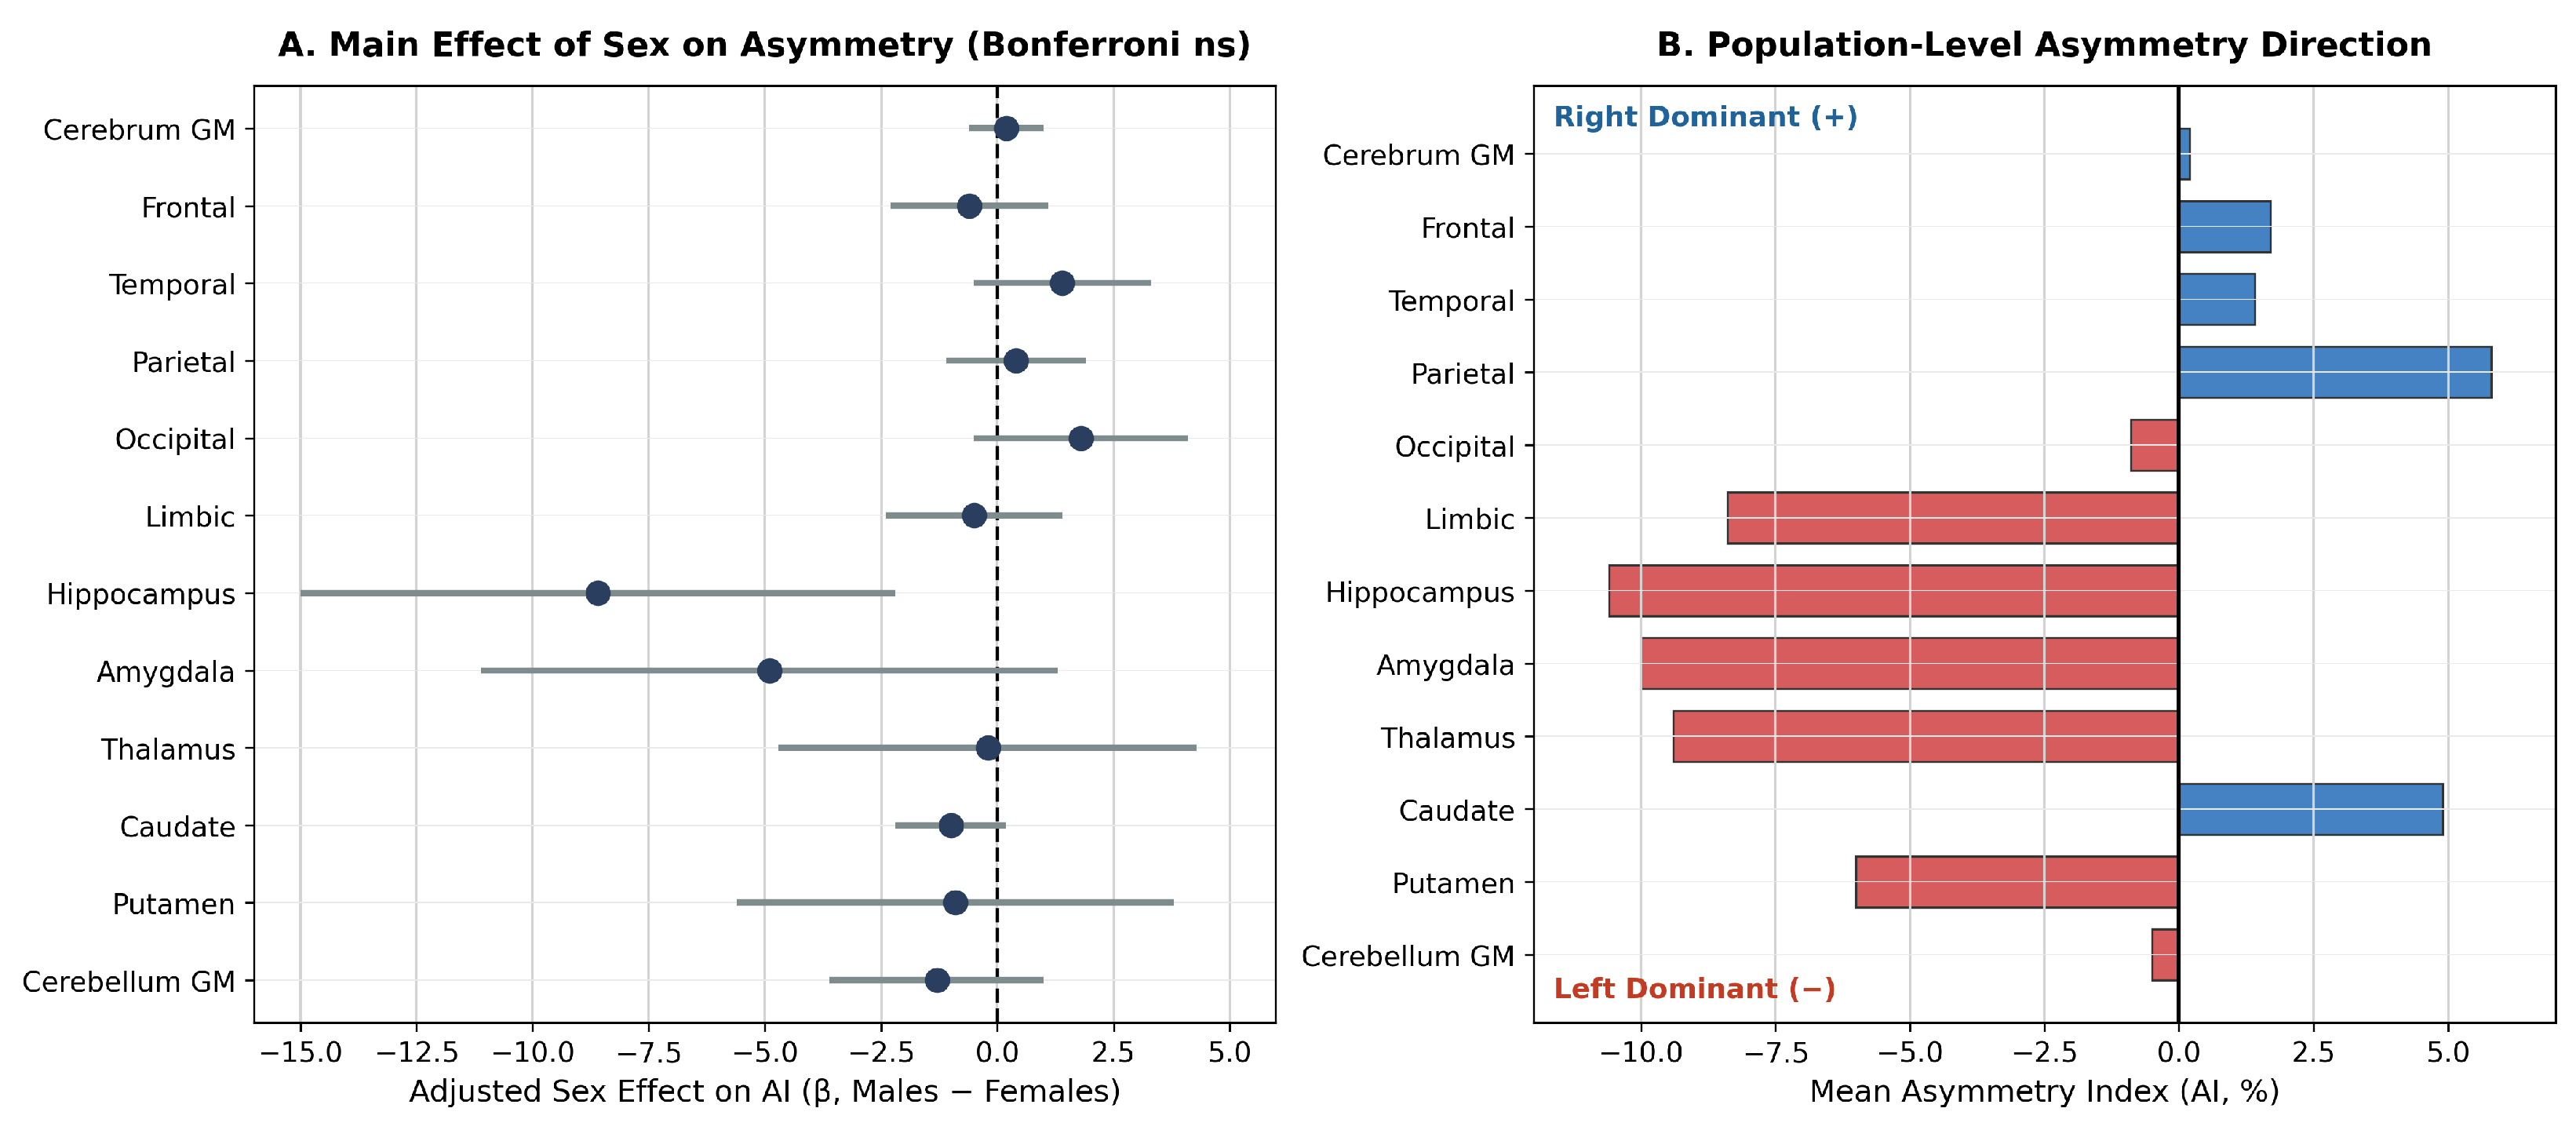
| Region | Sex | SE | t | Raw p | Bonf. p | Verdict |
|---|---|---|---|---|---|---|
| Cortical & Global | ||||||
| Cerebrum GM | +0.17 | 0.44 | 0.39 | 0.699 | 1.000 | ✗ ns |
| Frontal lobe | −0.54 | 0.85 | −0.64 | 0.522 | 1.000 | ✗ ns |
| Temporal lobe | +1.44 | 0.95 | 1.51 | 0.133 | 1.000 | ✗ ns |
| Parietal lobe | +0.43 | 0.94 | 0.46 | 0.647 | 1.000 | ✗ ns |
| Occipital lobe † | +1.77 | 1.17 | 1.51 | 0.133 | 1.000 | ✗ ns |
| Limbic cortex † | −0.46 | 0.95 | −0.48 | 0.630 | 1.000 | ✗ ns |
| Subcortical | ||||||
| Hippocampus | −8.62 | 3.23 | −2.67 | 0.008 | 1.000 | ✗ ns |
| Amygdala | −4.92 | 3.12 | −1.58 | 0.117 | 1.000 | ✗ ns |
| Thalamus | −0.18 | 1.88 | −0.10 | 0.922 | 1.000 | ✗ ns |
| Caudate | −1.02 | 1.03 | −0.99 | 0.325 | 1.000 | ✗ ns |
| Putamen | −0.82 | 2.38 | −0.35 | 0.729 | 1.000 | ✗ ns |
| Cerebellum GM † | −1.29 | 1.21 | −1.07 | .287 | 1.000 | ✗ ns |
| Domain | Hypothesis and Verdict | Prediction | Key Evidence |
|---|---|---|---|
| Age association | H1a-i: Subcortical linear decline (Supported) | Negative linear age (9 regions) | FDR-significant negative linear age associations in multiple subcortical regions (hippocampus , ; amygdala, caudate, putamen, nucleus accumbens; all ). Thalamus absolute volume nominally significant () but designated preliminary and excluded from primary volume interpretation due to absolute-volume CV ; thalamic AI retained separately under H3 due to within-subject stability (bilateral , 0 failures, ). |
| H1a-ii: Parietal nonlinearity (Supported) | Parietal lobe shows a nonlinear association | The parietal lobe was the sole region (1 of 19) with a significant nonlinear association (, ): inverted-U peaking at 46.4 (bootstrap 95% CI: 40.6 yr to 51.3 ). | |
| H1b: WM inverted-U (Not Supported) | Quadratic peak midlife | Positive linear association; non-significant. Linear (, ); quadratic non-significant (). Estimated inflexion: ≈61.5 , but did not survive FDR (). | |
| H1c: Insular/striatal sensitivity (Supported) | Highest age | Accumbens (1st, age ), caudate (2nd, ), insula (3rd, ) in age-sensitivity. | |
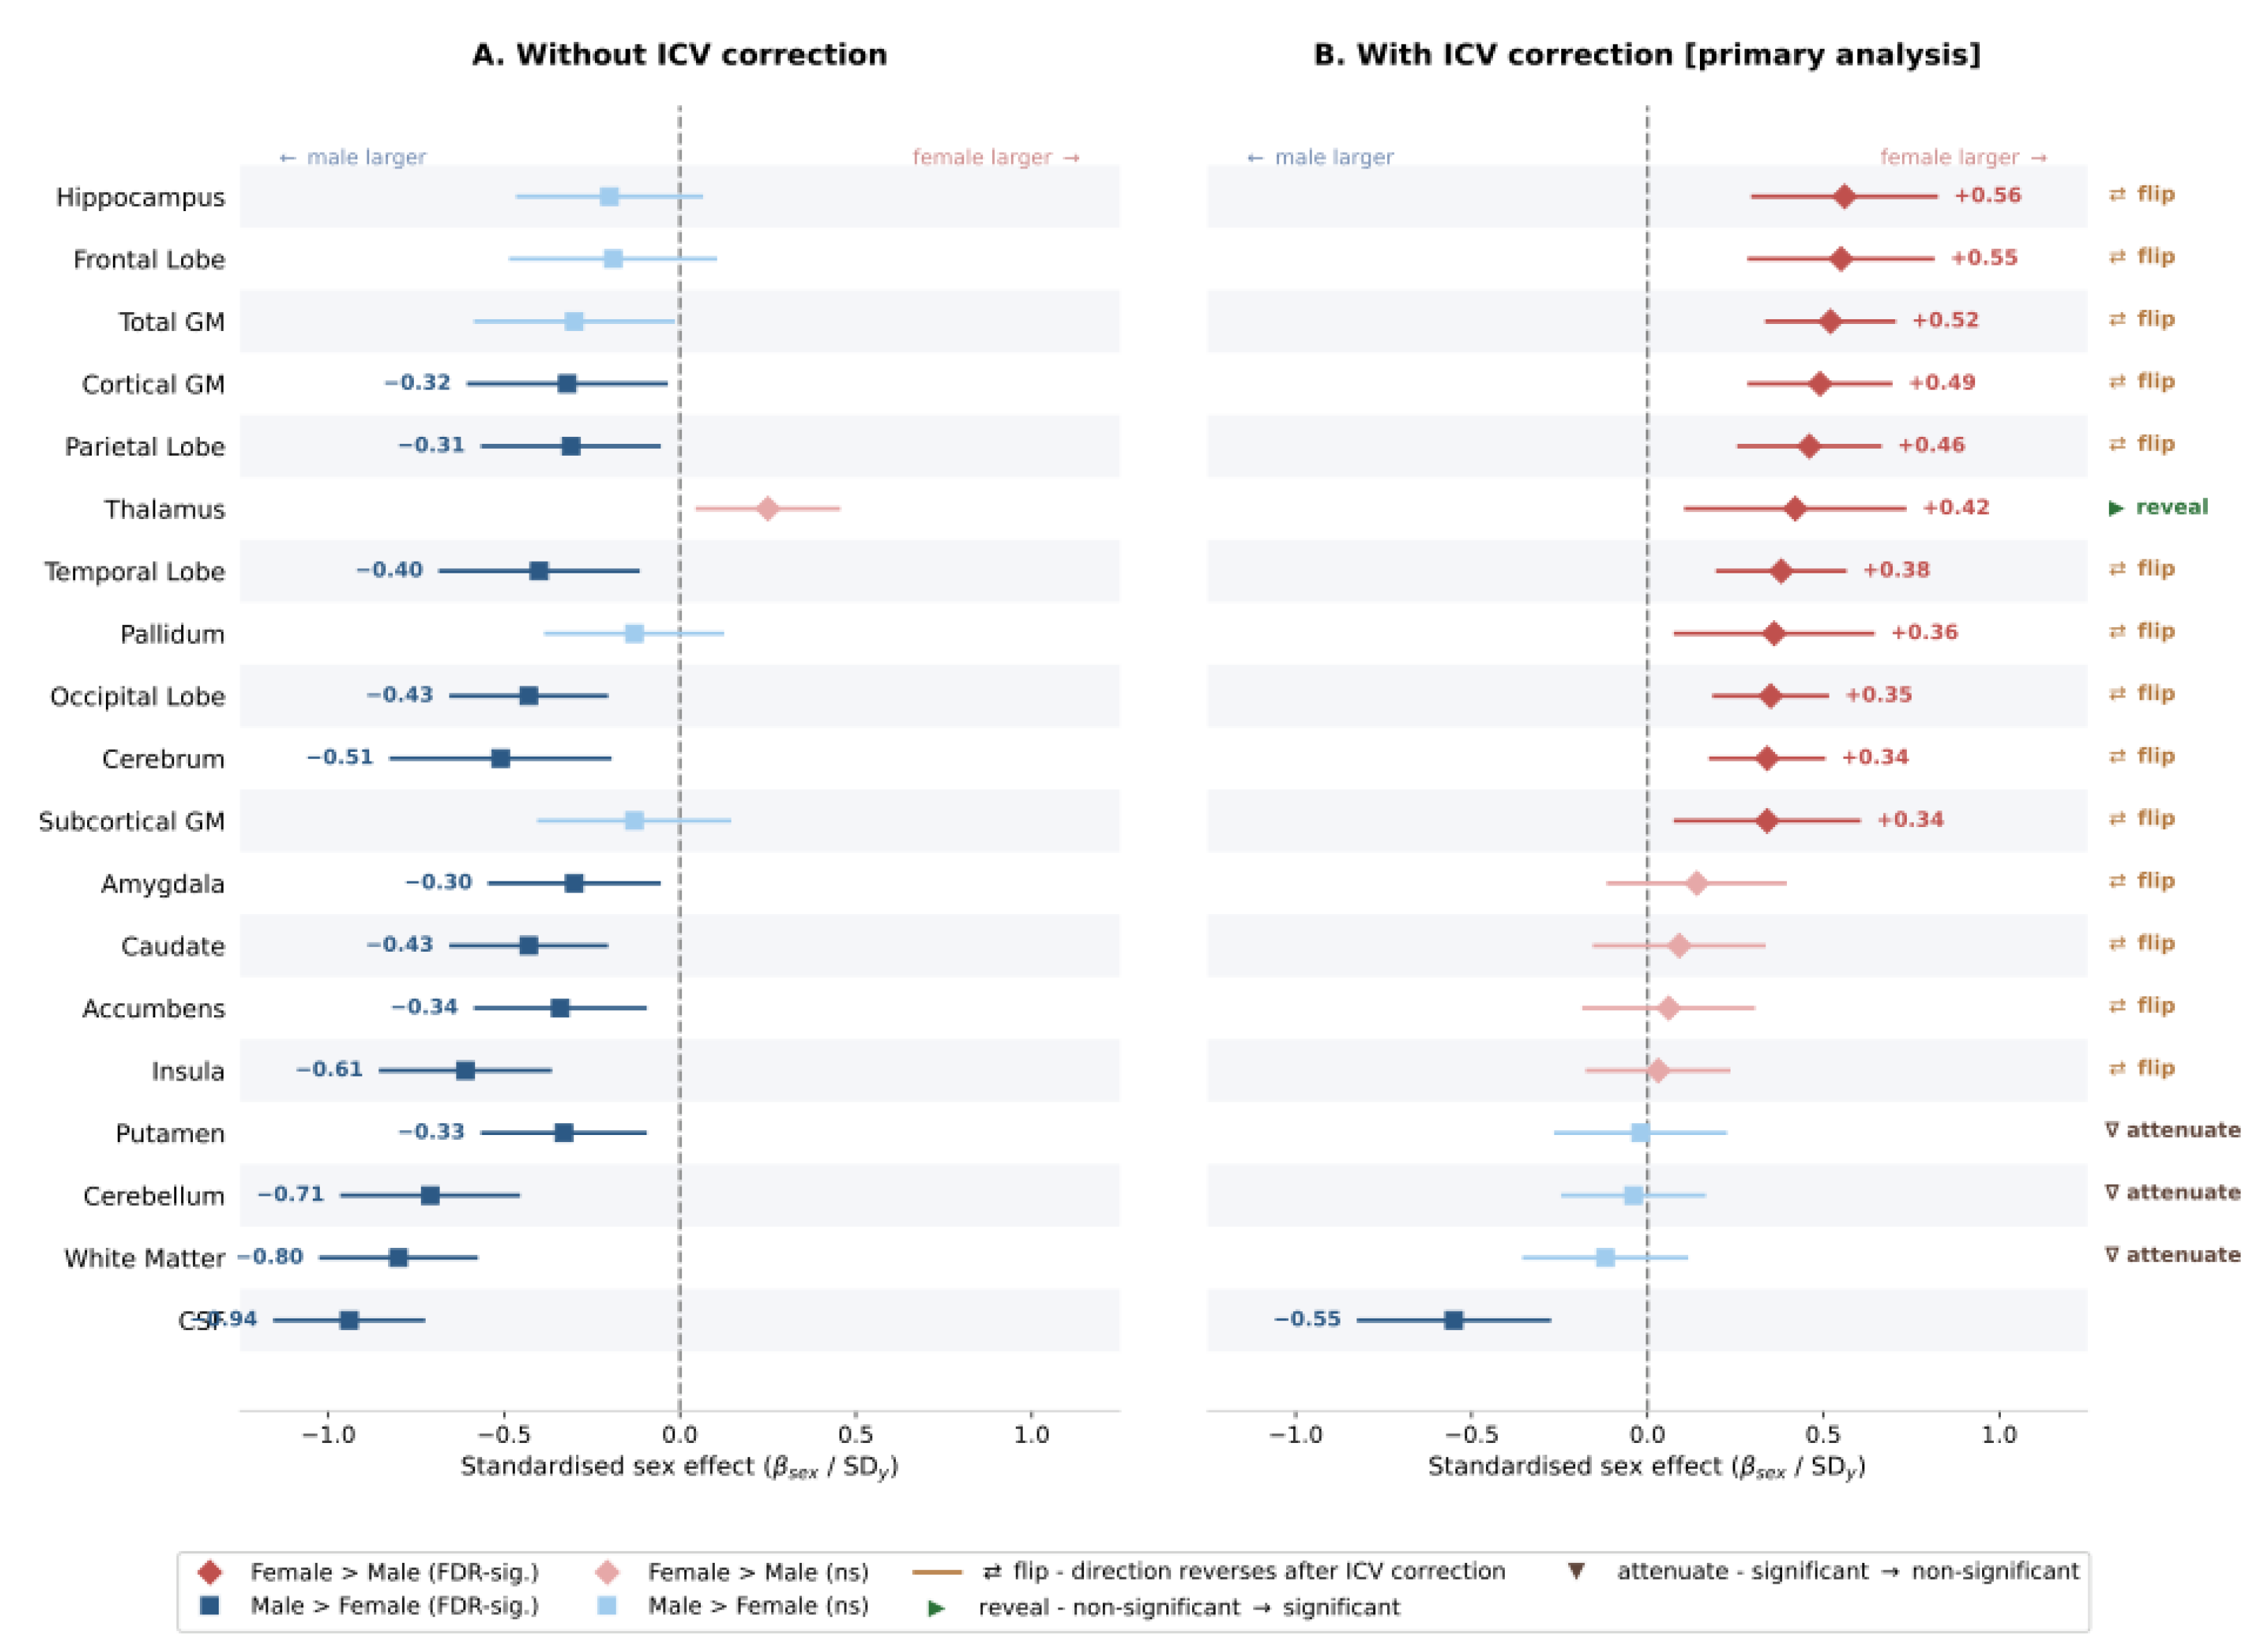
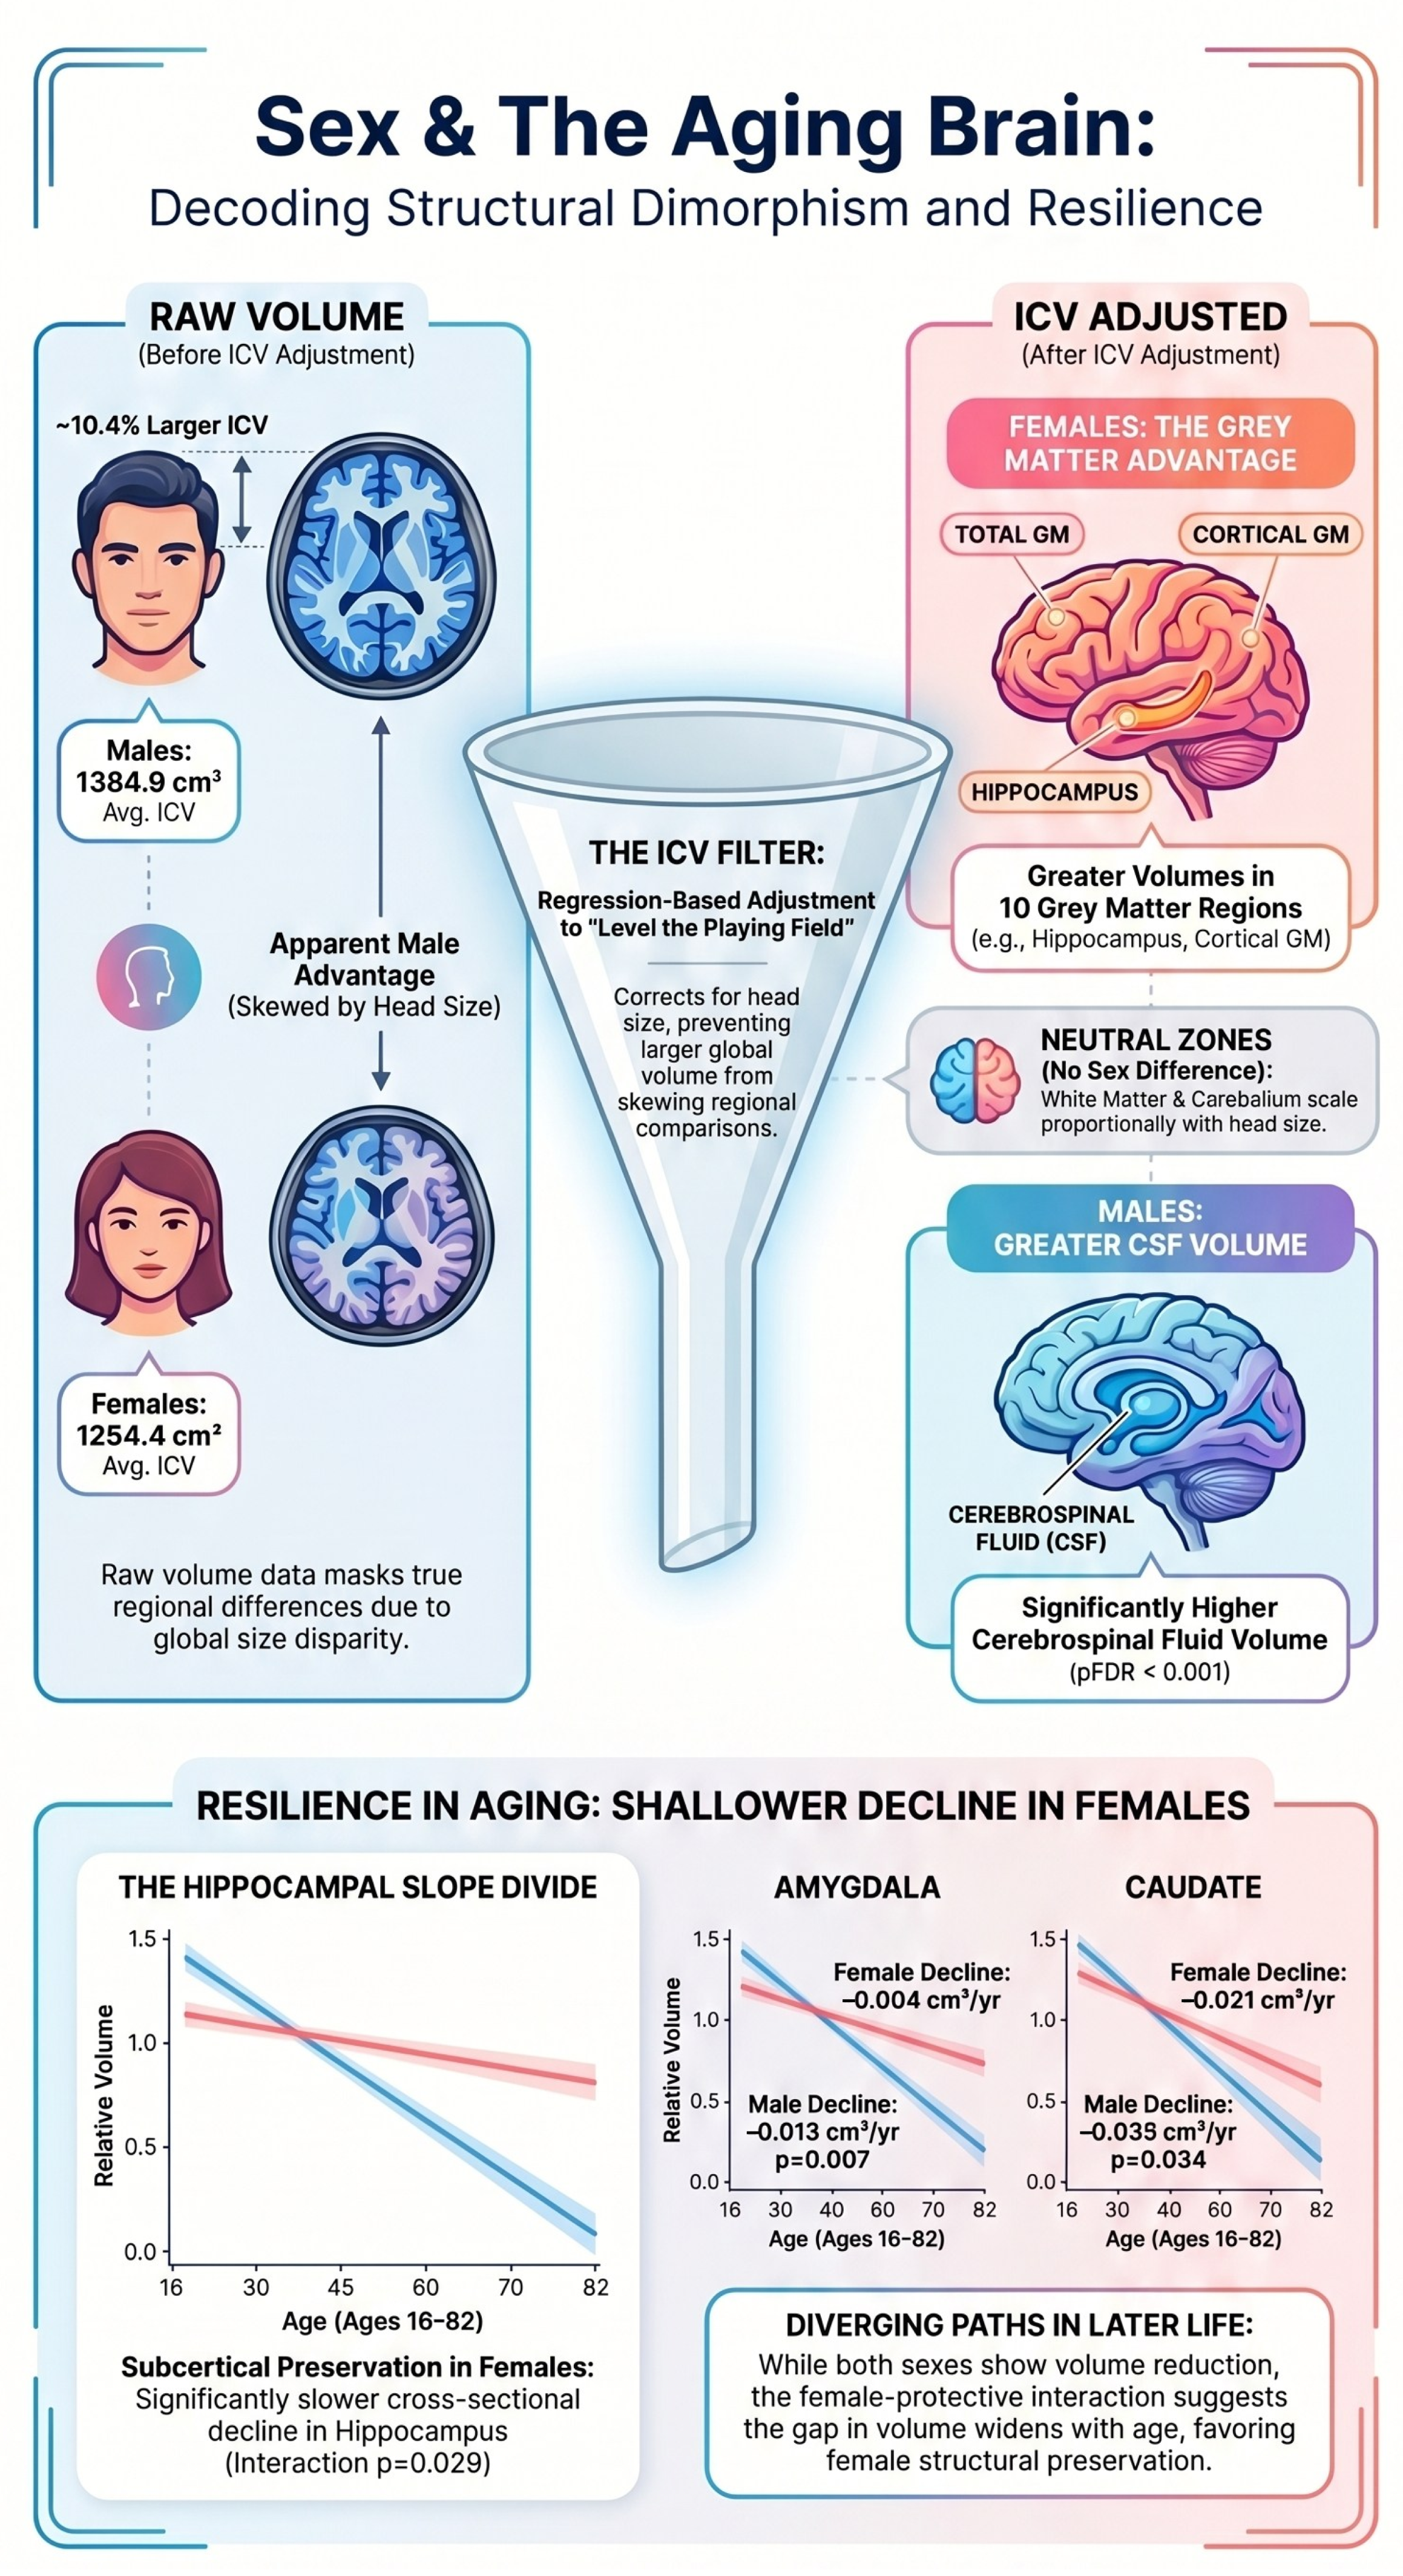
| Sex differences | H2a: Female GM advantage (Supported) | Greater ICV-adj. GM | Post-ICV adjustment, females were larger in 10 of 19 regions (all ). Total GM (, ); Cortical GM: , ; Hippocampus: , ; Total/cortical GM, hippocampus significant (all ). |
| H2b: Male CSF advantage (Supported) | Greater ICV-adj. CSF | (, ). Male > female, . | |
| H2c: No cerebellum/WM sex effects (Supported) | after ICV | No FDR-significant sex effects (Cerebellum ; WM ; both after ICV correction). | |
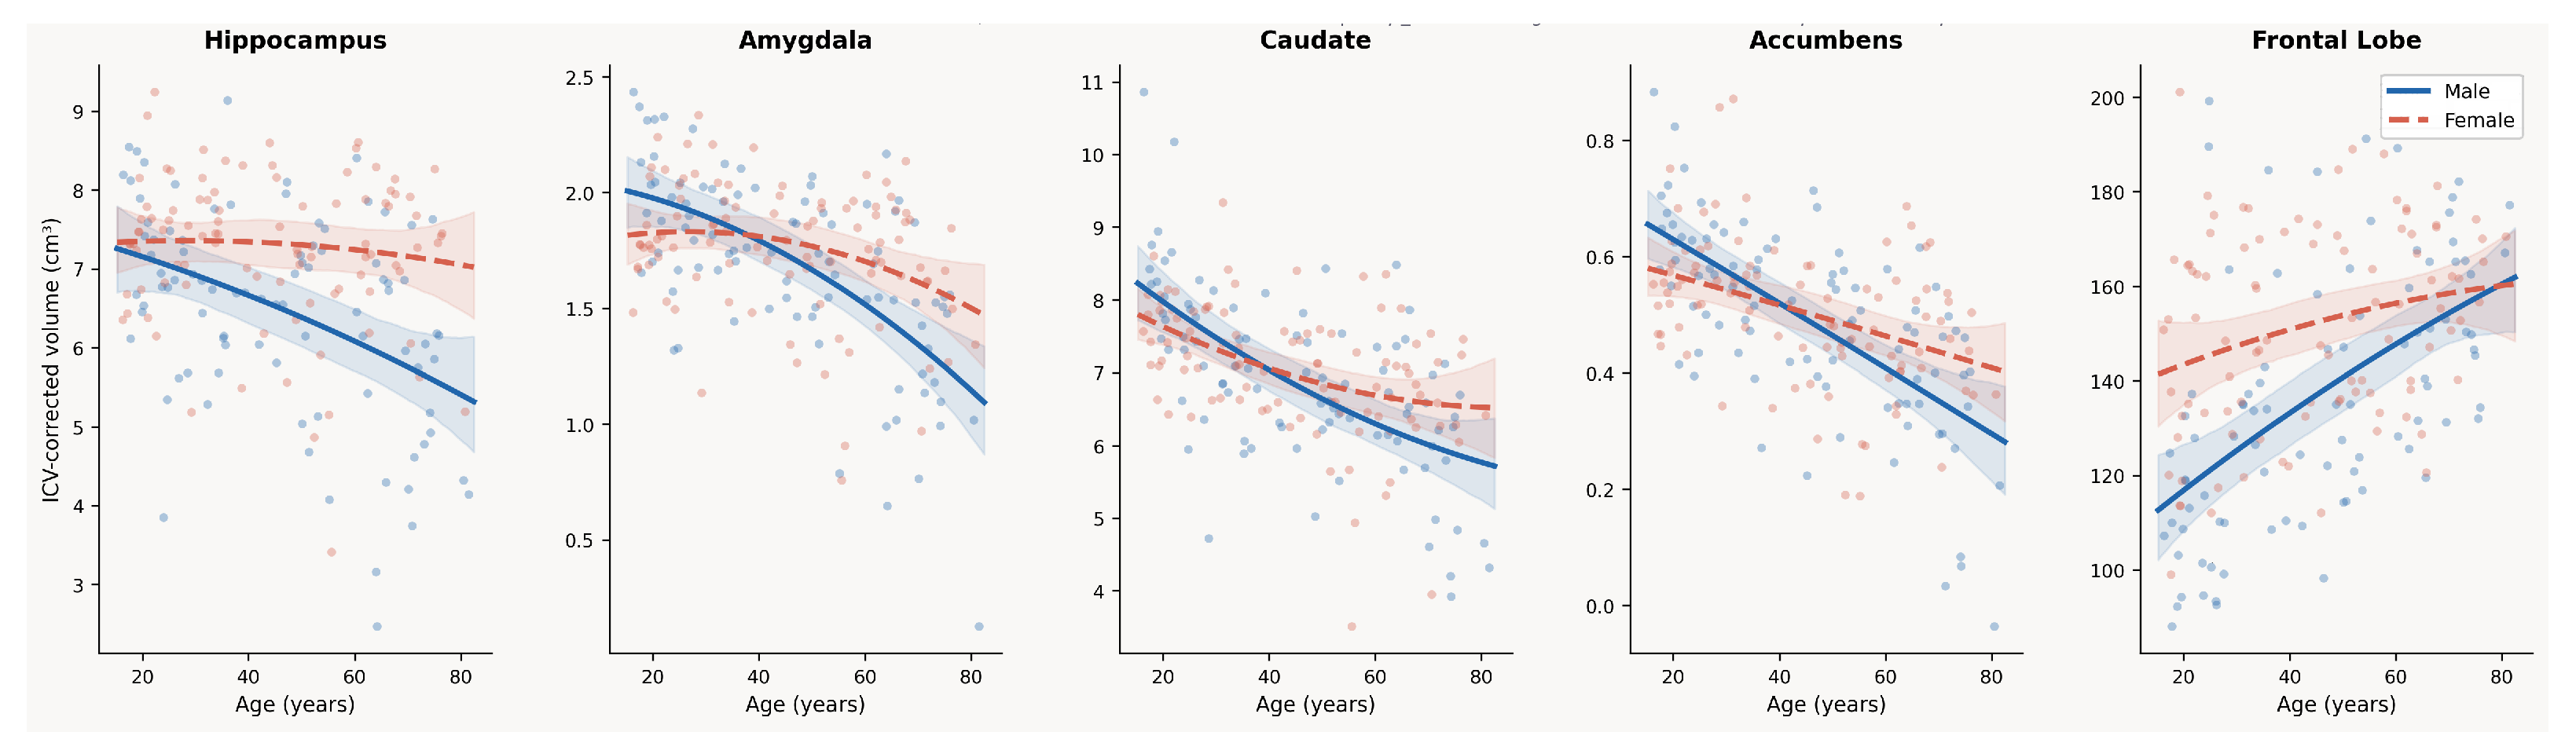
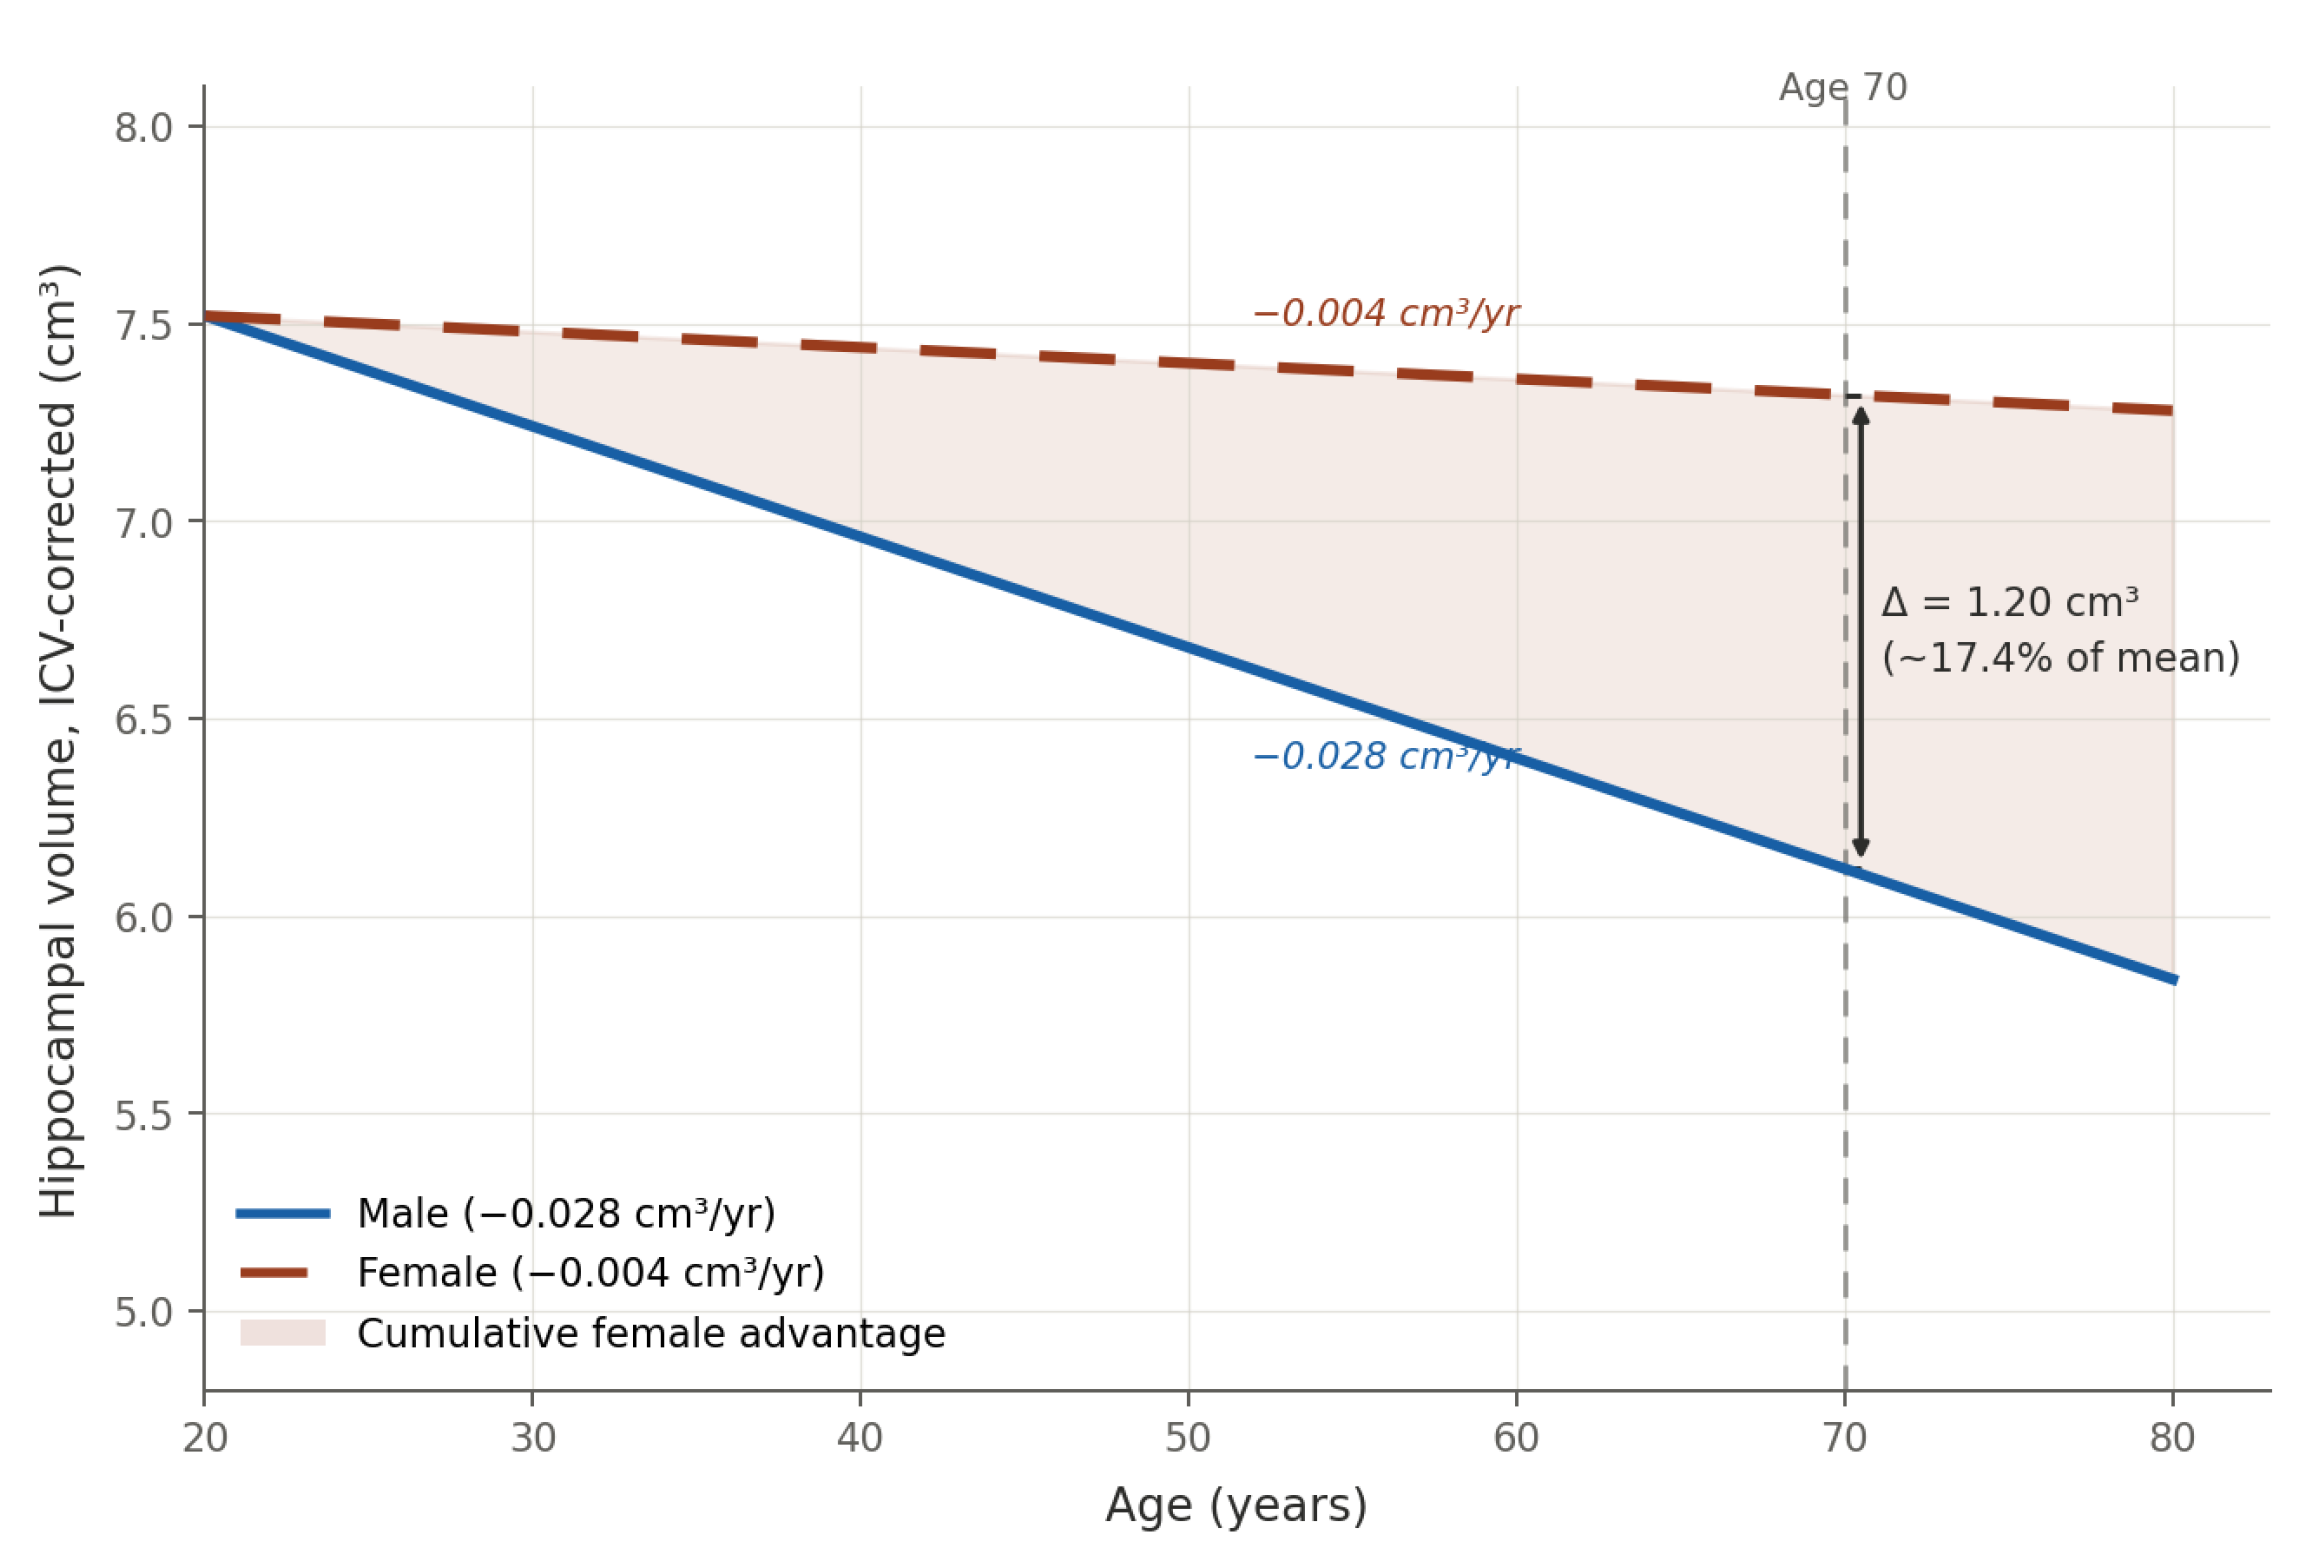
| Hemispheric Asymmetry | H2d: Female-favouring interactions (subcortical associations) (Partially Supported) | Shallower subcortical slopes | 4 of 9 subcortical regions showed FDR-significant female-protective interactions (hippocampus, amygdala, accumbens, caudate). Hippocampus: , , ; Amygdala: , , ; Caudate: ; Accumbens: . Interactions modest and region-specific. |
| H3a: Population-level asymmetry (Supported) | Directional AI ≠ 0 (12 regions) | Directional lateralisation confirmed in 11 of 12 pre-specified bilateral structures (all Bonferroni); accumbens ns/exception (). Exploratory: WM mean AI = 10.71%, ; Cerebellum mean AI = 4.09%, . | |
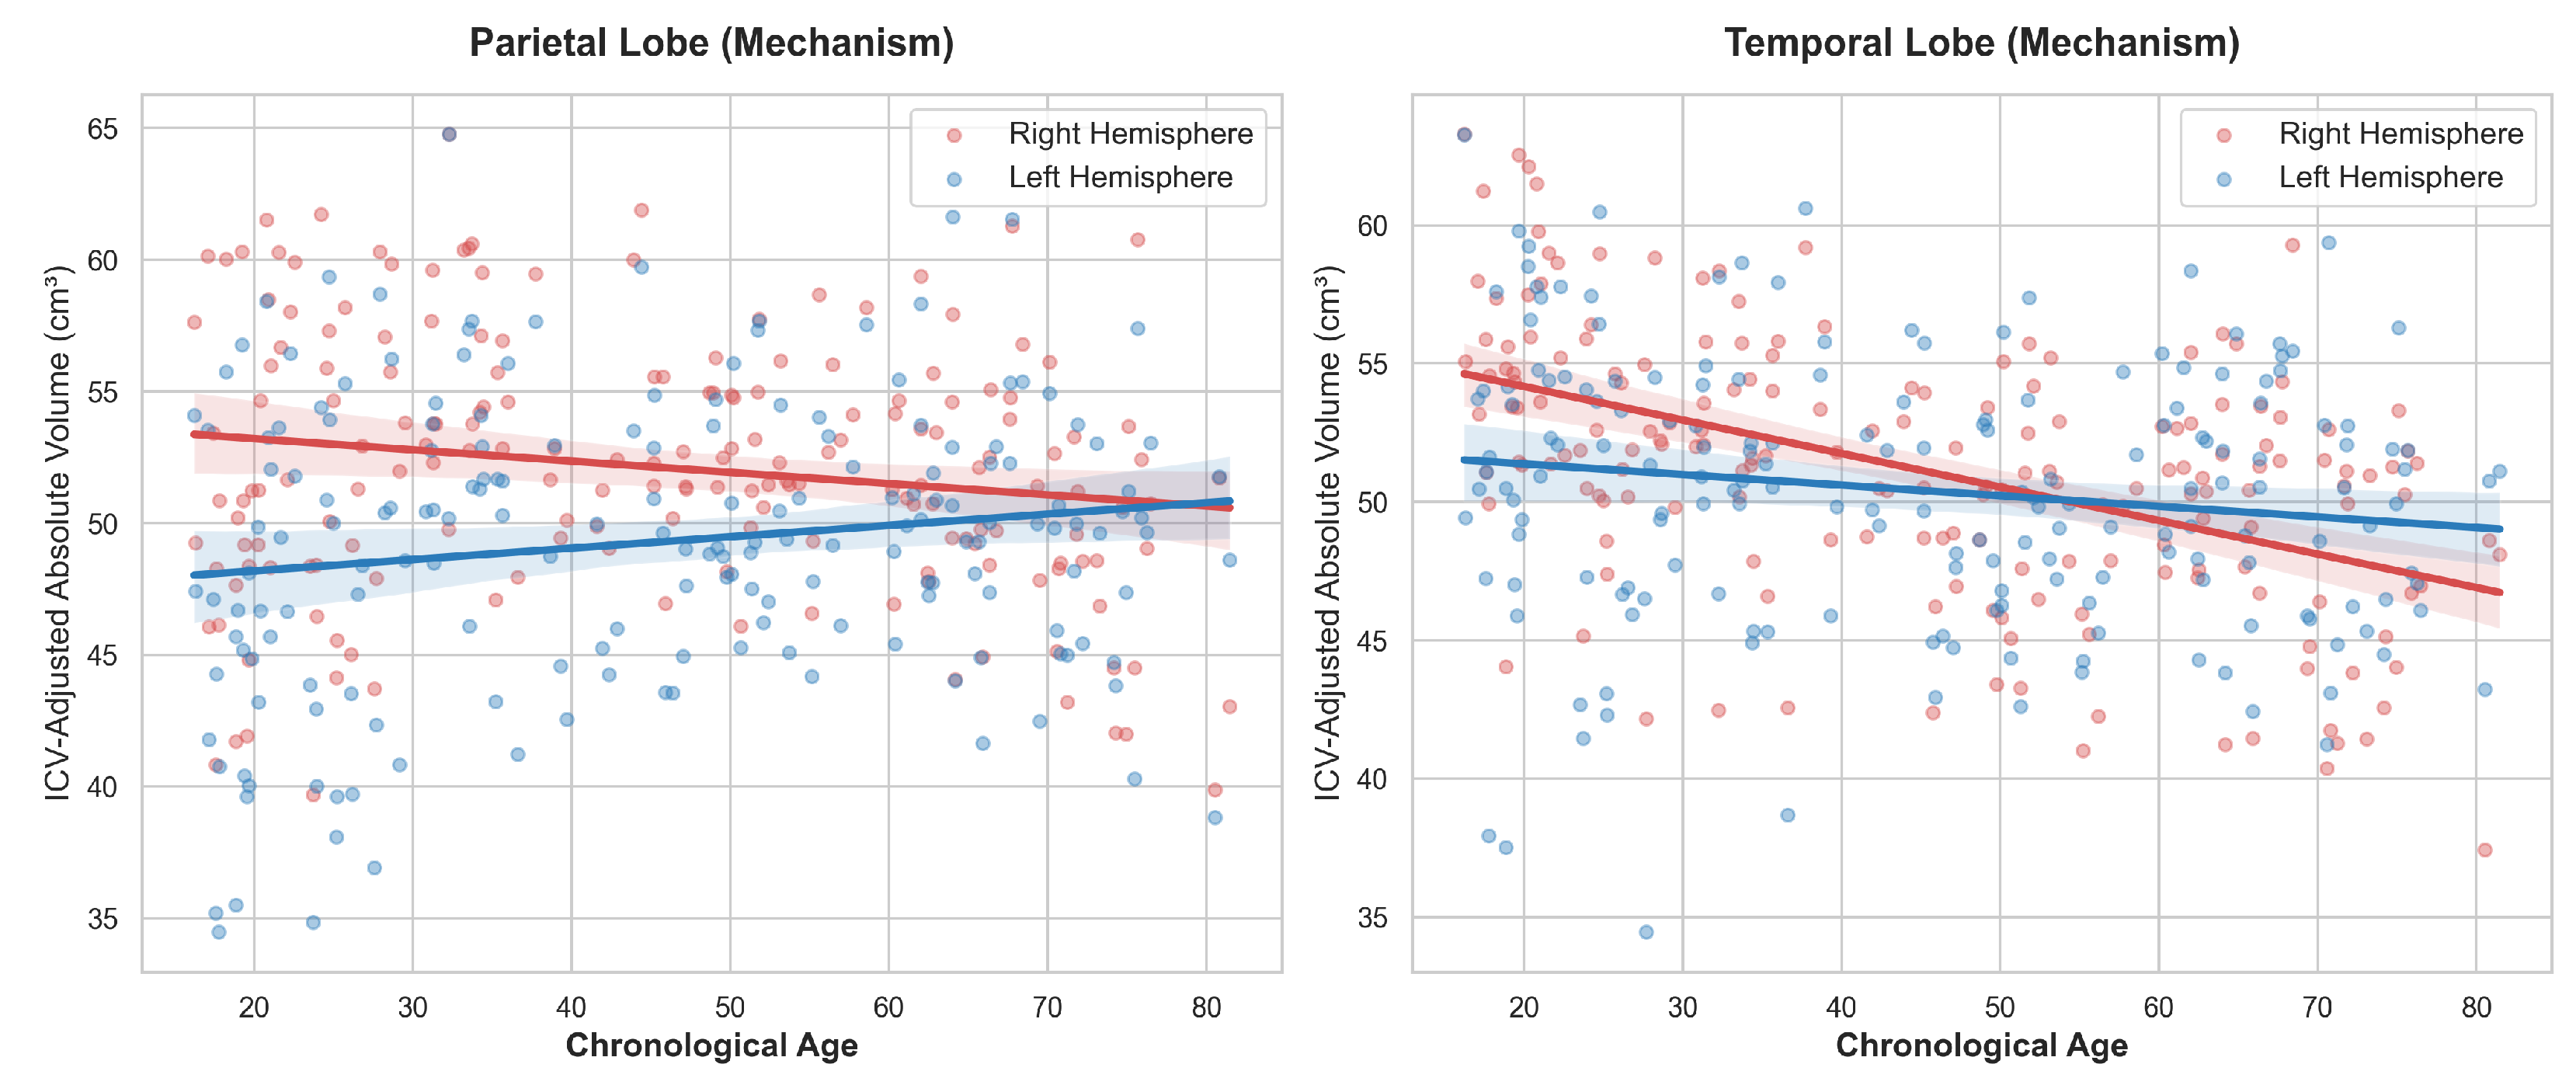
| H3b: Age-related reduction (Partially Supported) | Posterior cortex ; subcortical stable | Age-related AI reduction confined to the posterior cortex. Most subcortical structures are stable (all except amygdala: , ). |
Disclaimer/Publisher’s Note: The statements, opinions and data contained in all publications are solely those of the individual author(s) and contributor(s) and not of MDPI and/or the editor(s). MDPI and/or the editor(s) disclaim responsibility for any injury to people or property resulting from any ideas, methods, instructions or products referred to in the content. |
© 2026 by the authors. Licensee MDPI, Basel, Switzerland. This article is an open access article distributed under the terms and conditions of the Creative Commons Attribution (CC BY) license.
Share and Cite
Debnath, T.; Rahman, M.G.; Debnath, S.; Chau, M. Regional Brain Volume Variation Across Adulthood: A Cross-Sectional MRI Analysis of Age, Sex, and Hemispheric Asymmetry. Life 2026, 16, 1356. https://doi.org/10.3390/life16081356
Debnath T, Rahman MG, Debnath S, Chau M. Regional Brain Volume Variation Across Adulthood: A Cross-Sectional MRI Analysis of Age, Sex, and Hemispheric Asymmetry. Life. 2026; 16(8):1356. https://doi.org/10.3390/life16081356
Chicago/Turabian StyleDebnath, Tanmoy, Md Geaur Rahman, Sourabhi Debnath, and Minh Chau. 2026. "Regional Brain Volume Variation Across Adulthood: A Cross-Sectional MRI Analysis of Age, Sex, and Hemispheric Asymmetry" Life 16, no. 8: 1356. https://doi.org/10.3390/life16081356
APA StyleDebnath, T., Rahman, M. G., Debnath, S., & Chau, M. (2026). Regional Brain Volume Variation Across Adulthood: A Cross-Sectional MRI Analysis of Age, Sex, and Hemispheric Asymmetry. Life, 16(8), 1356. https://doi.org/10.3390/life16081356