

Constitutive Serotonin Tone as a Modulator of Brown Adipose Tissue Thermogenesis: A Rat Study


 and
and 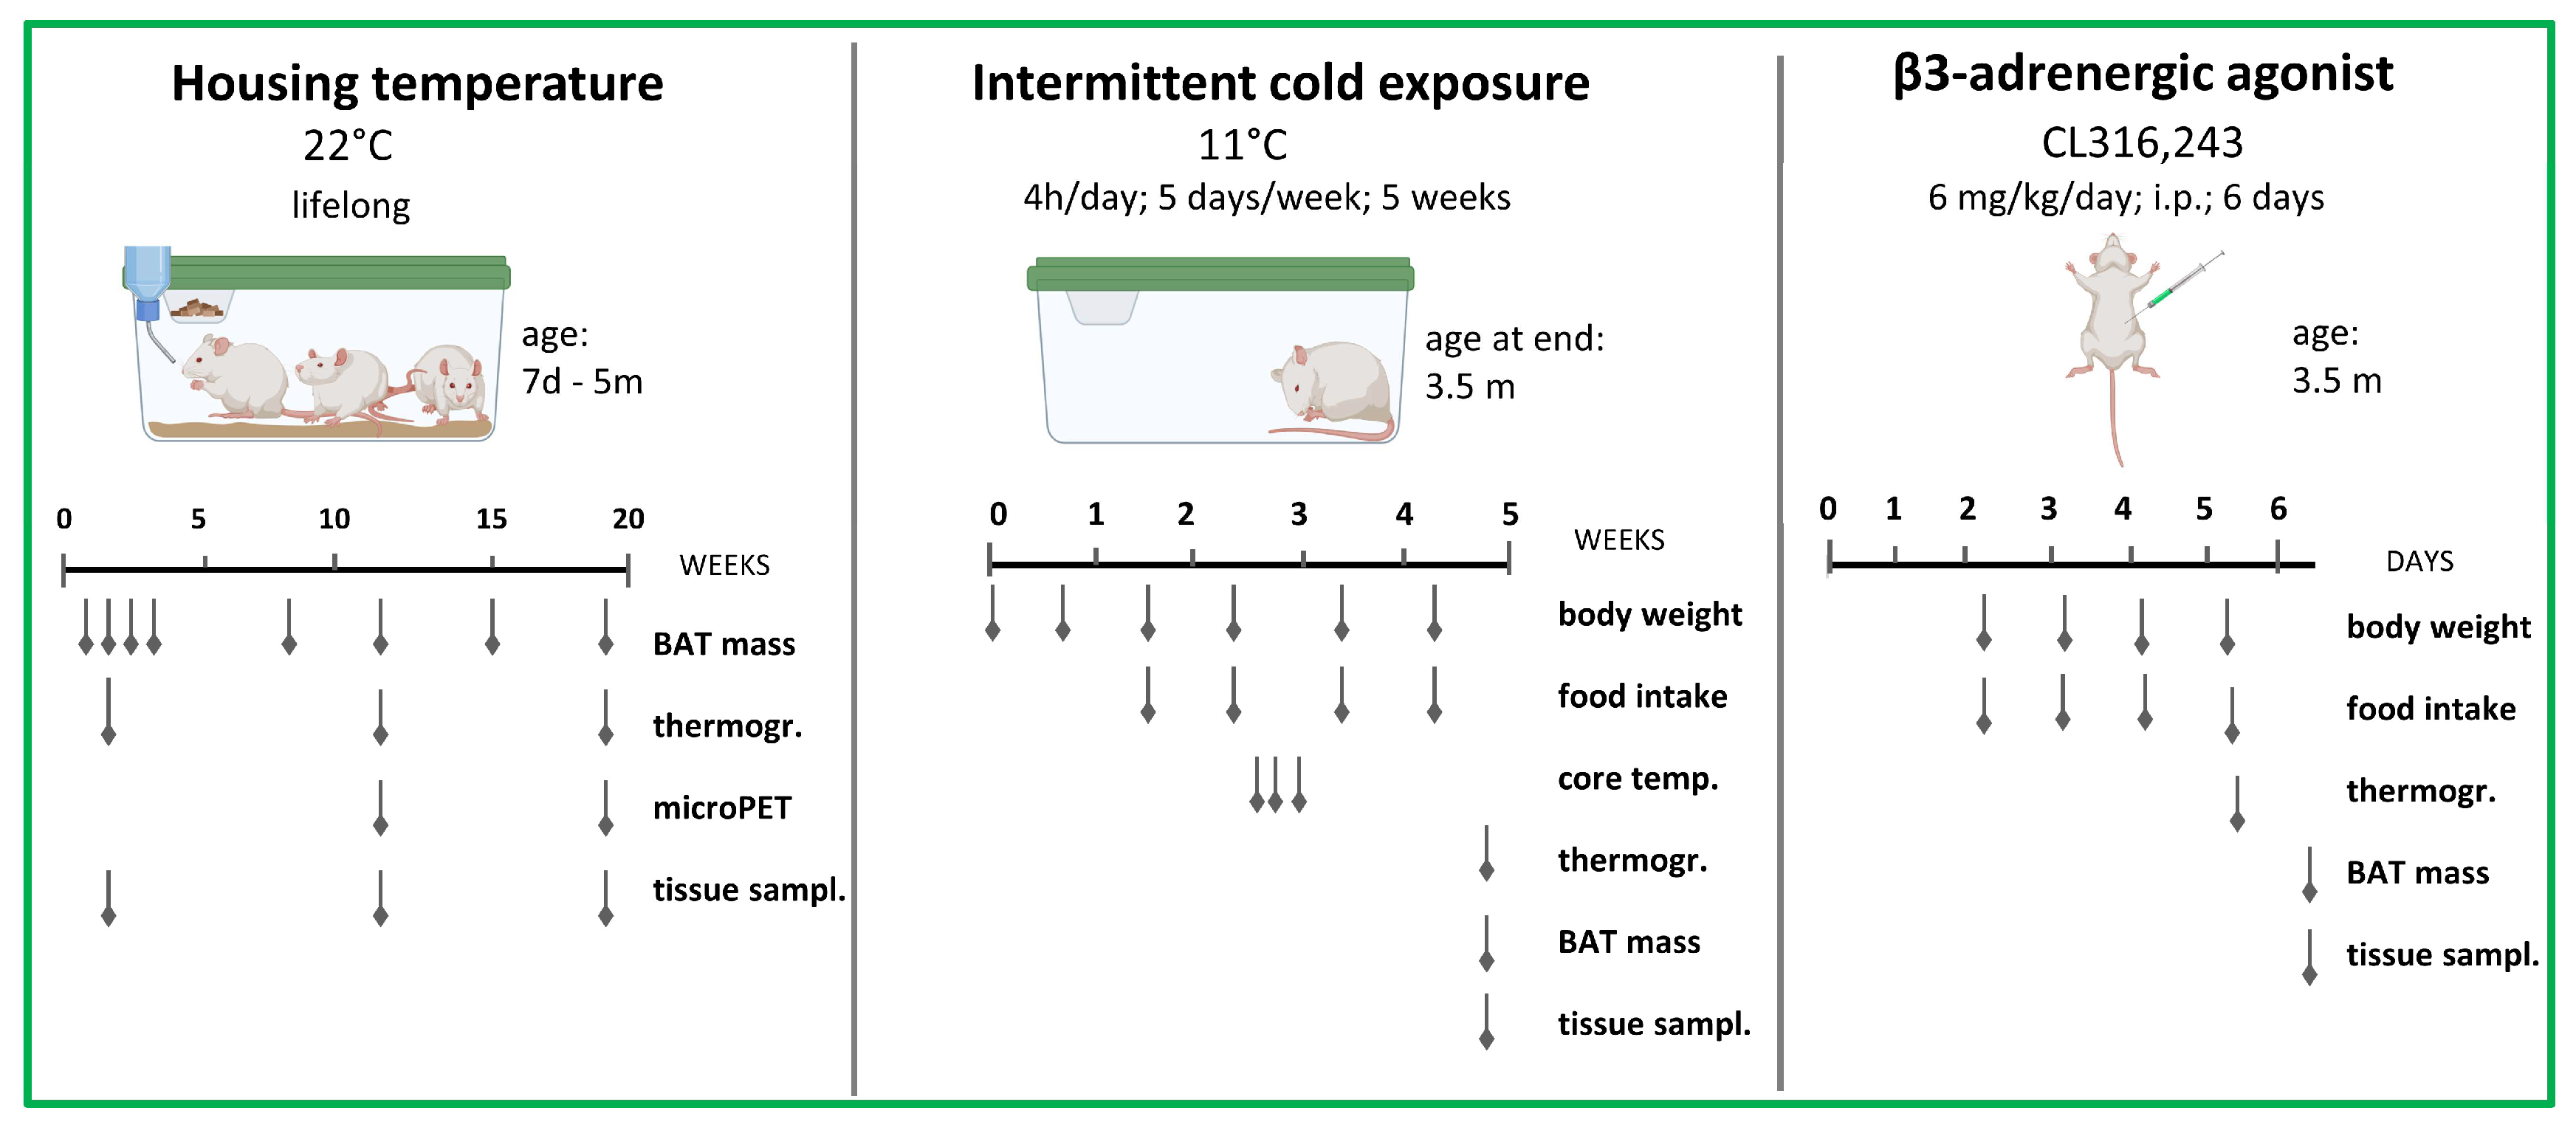
Abstract
1. Introduction
2. Materials and Methods
2.1. Animals
2.2. Cold Exposure Experiments
2.3. Pharmacological Experiments
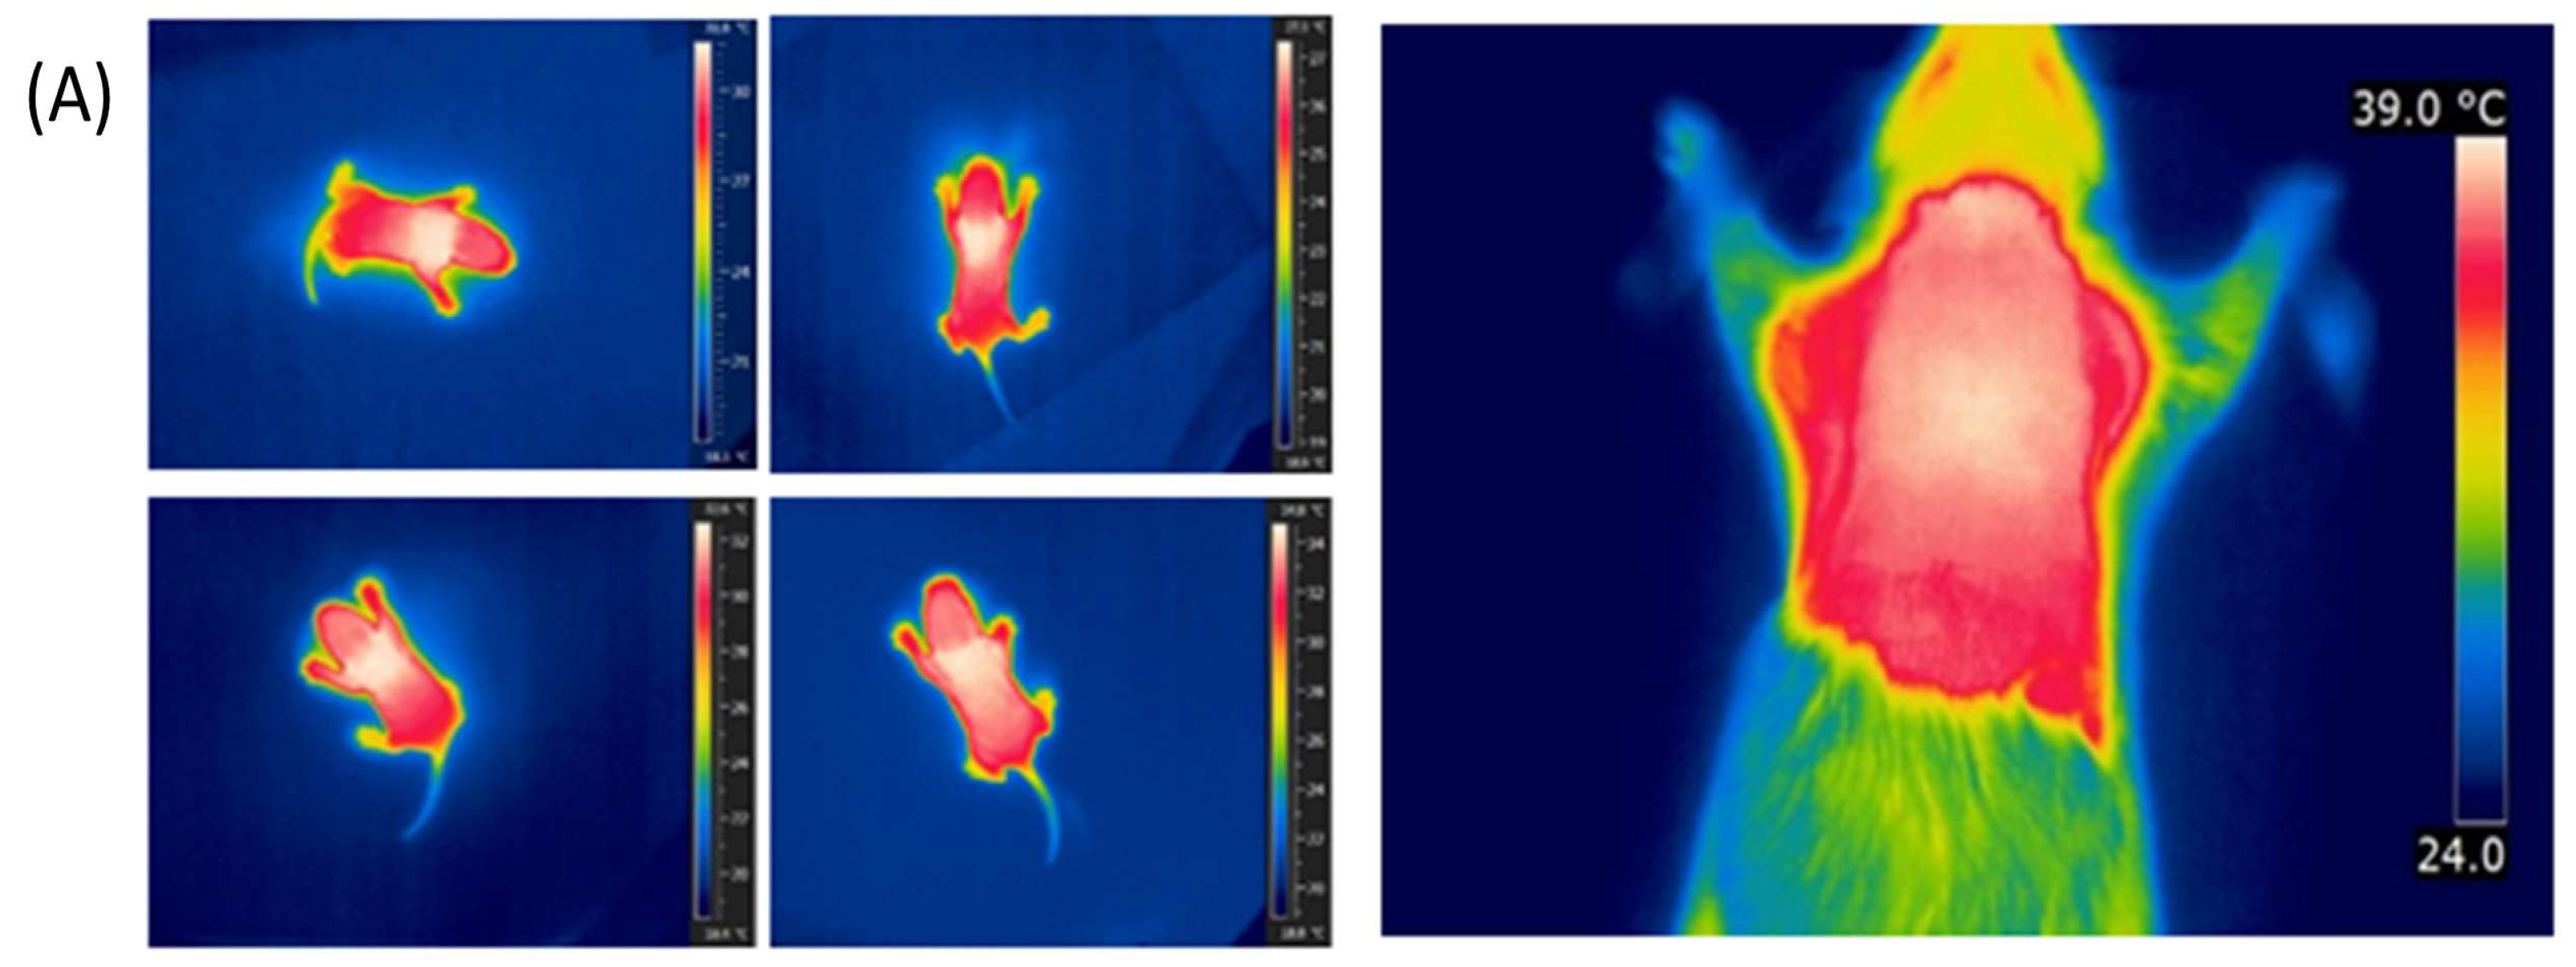
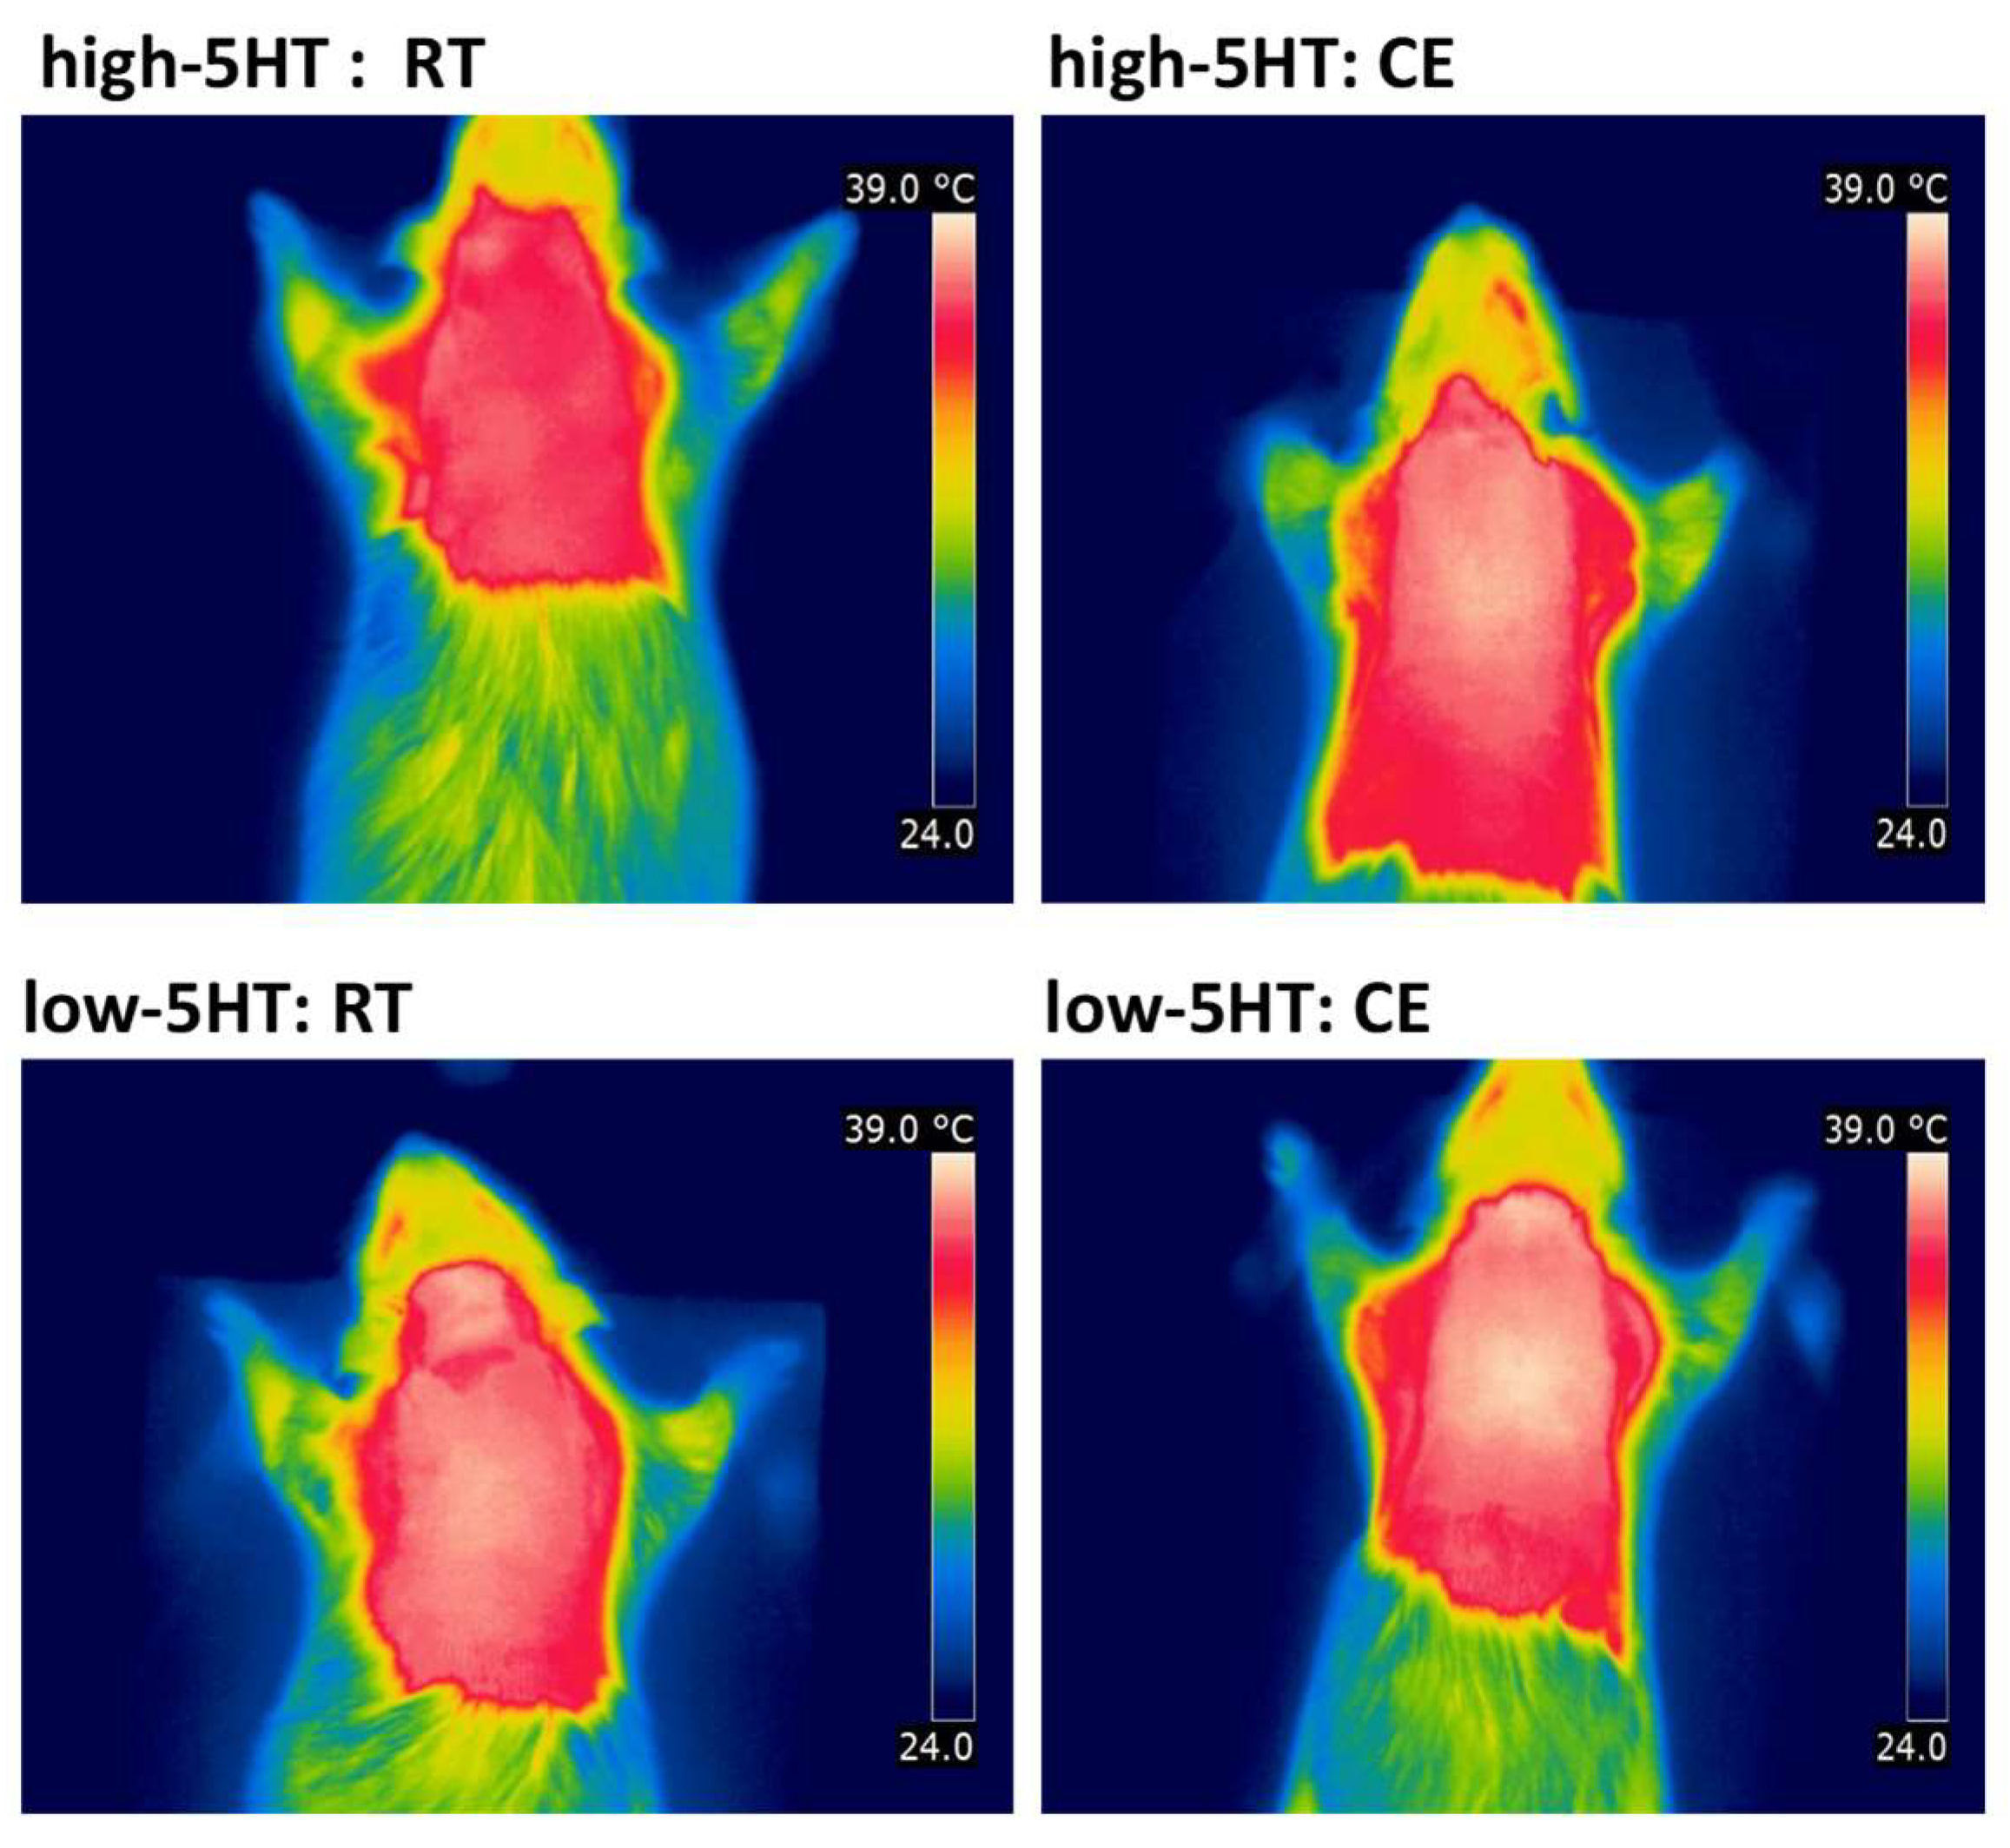
2.4. Infrared Thermography
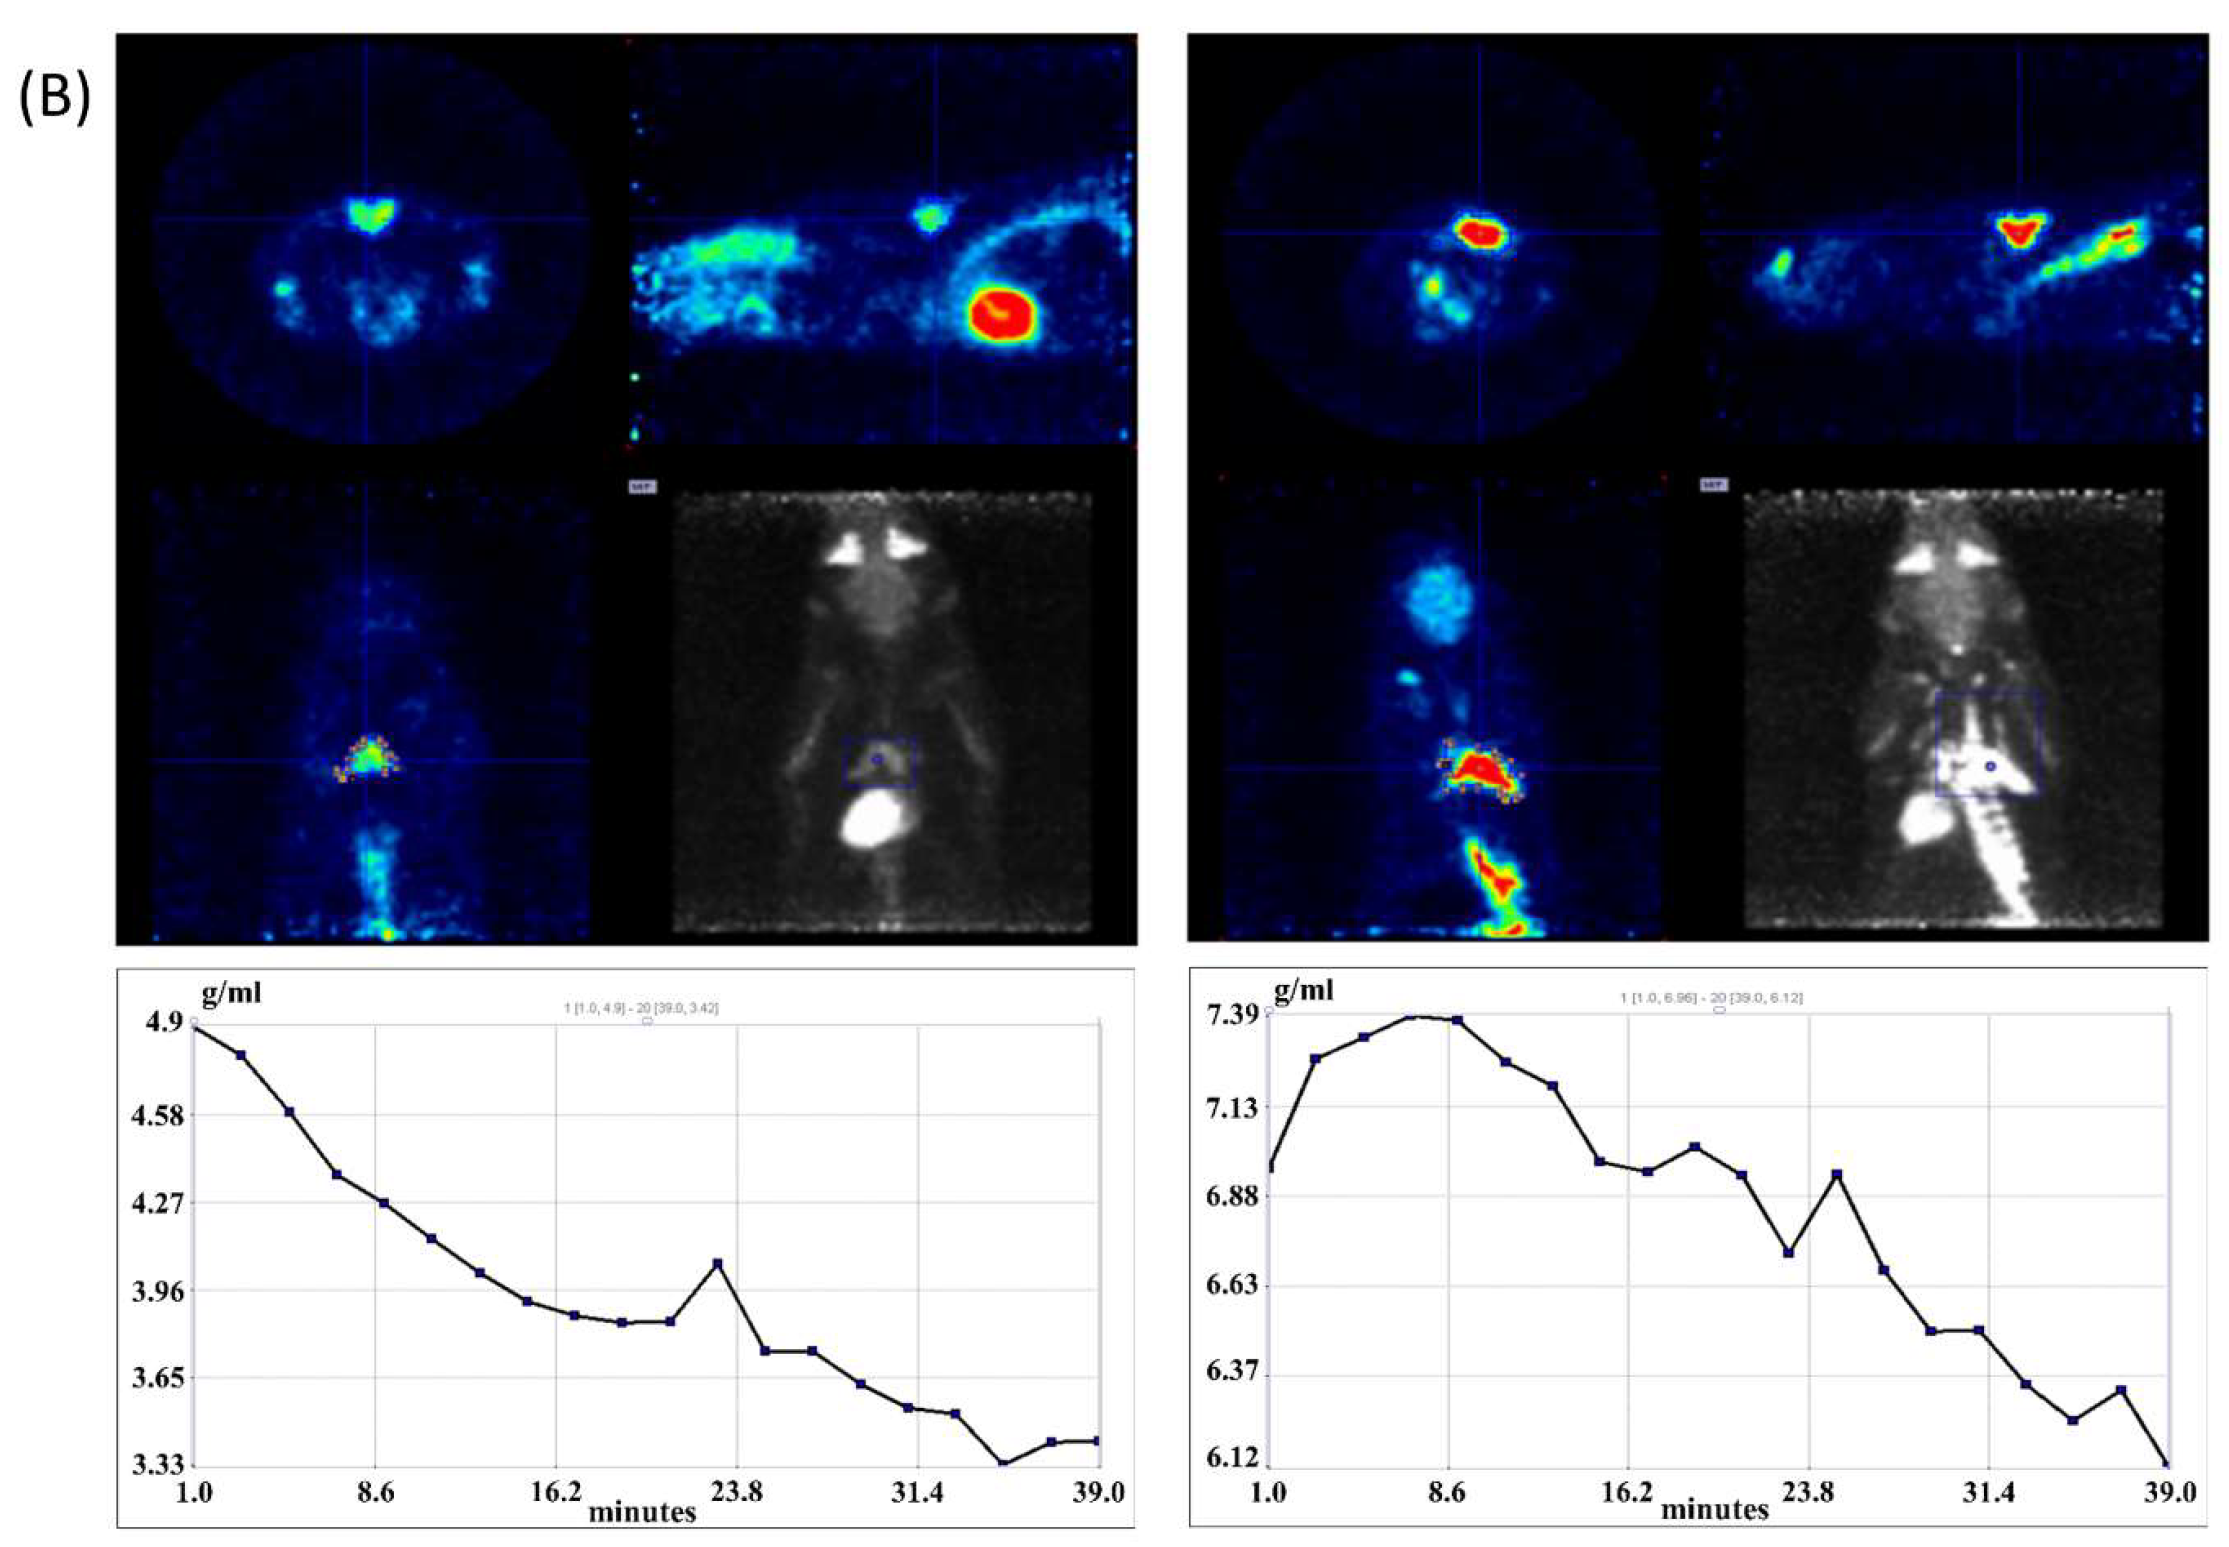
2.5. 18F-FDG-microPET Imaging
2.6. Tissue Collection for Molecular Analyses
2.7. mRNA Expression Studies
2.8. ELISA Measurements
2.9. Statistical Analysis
3. Results
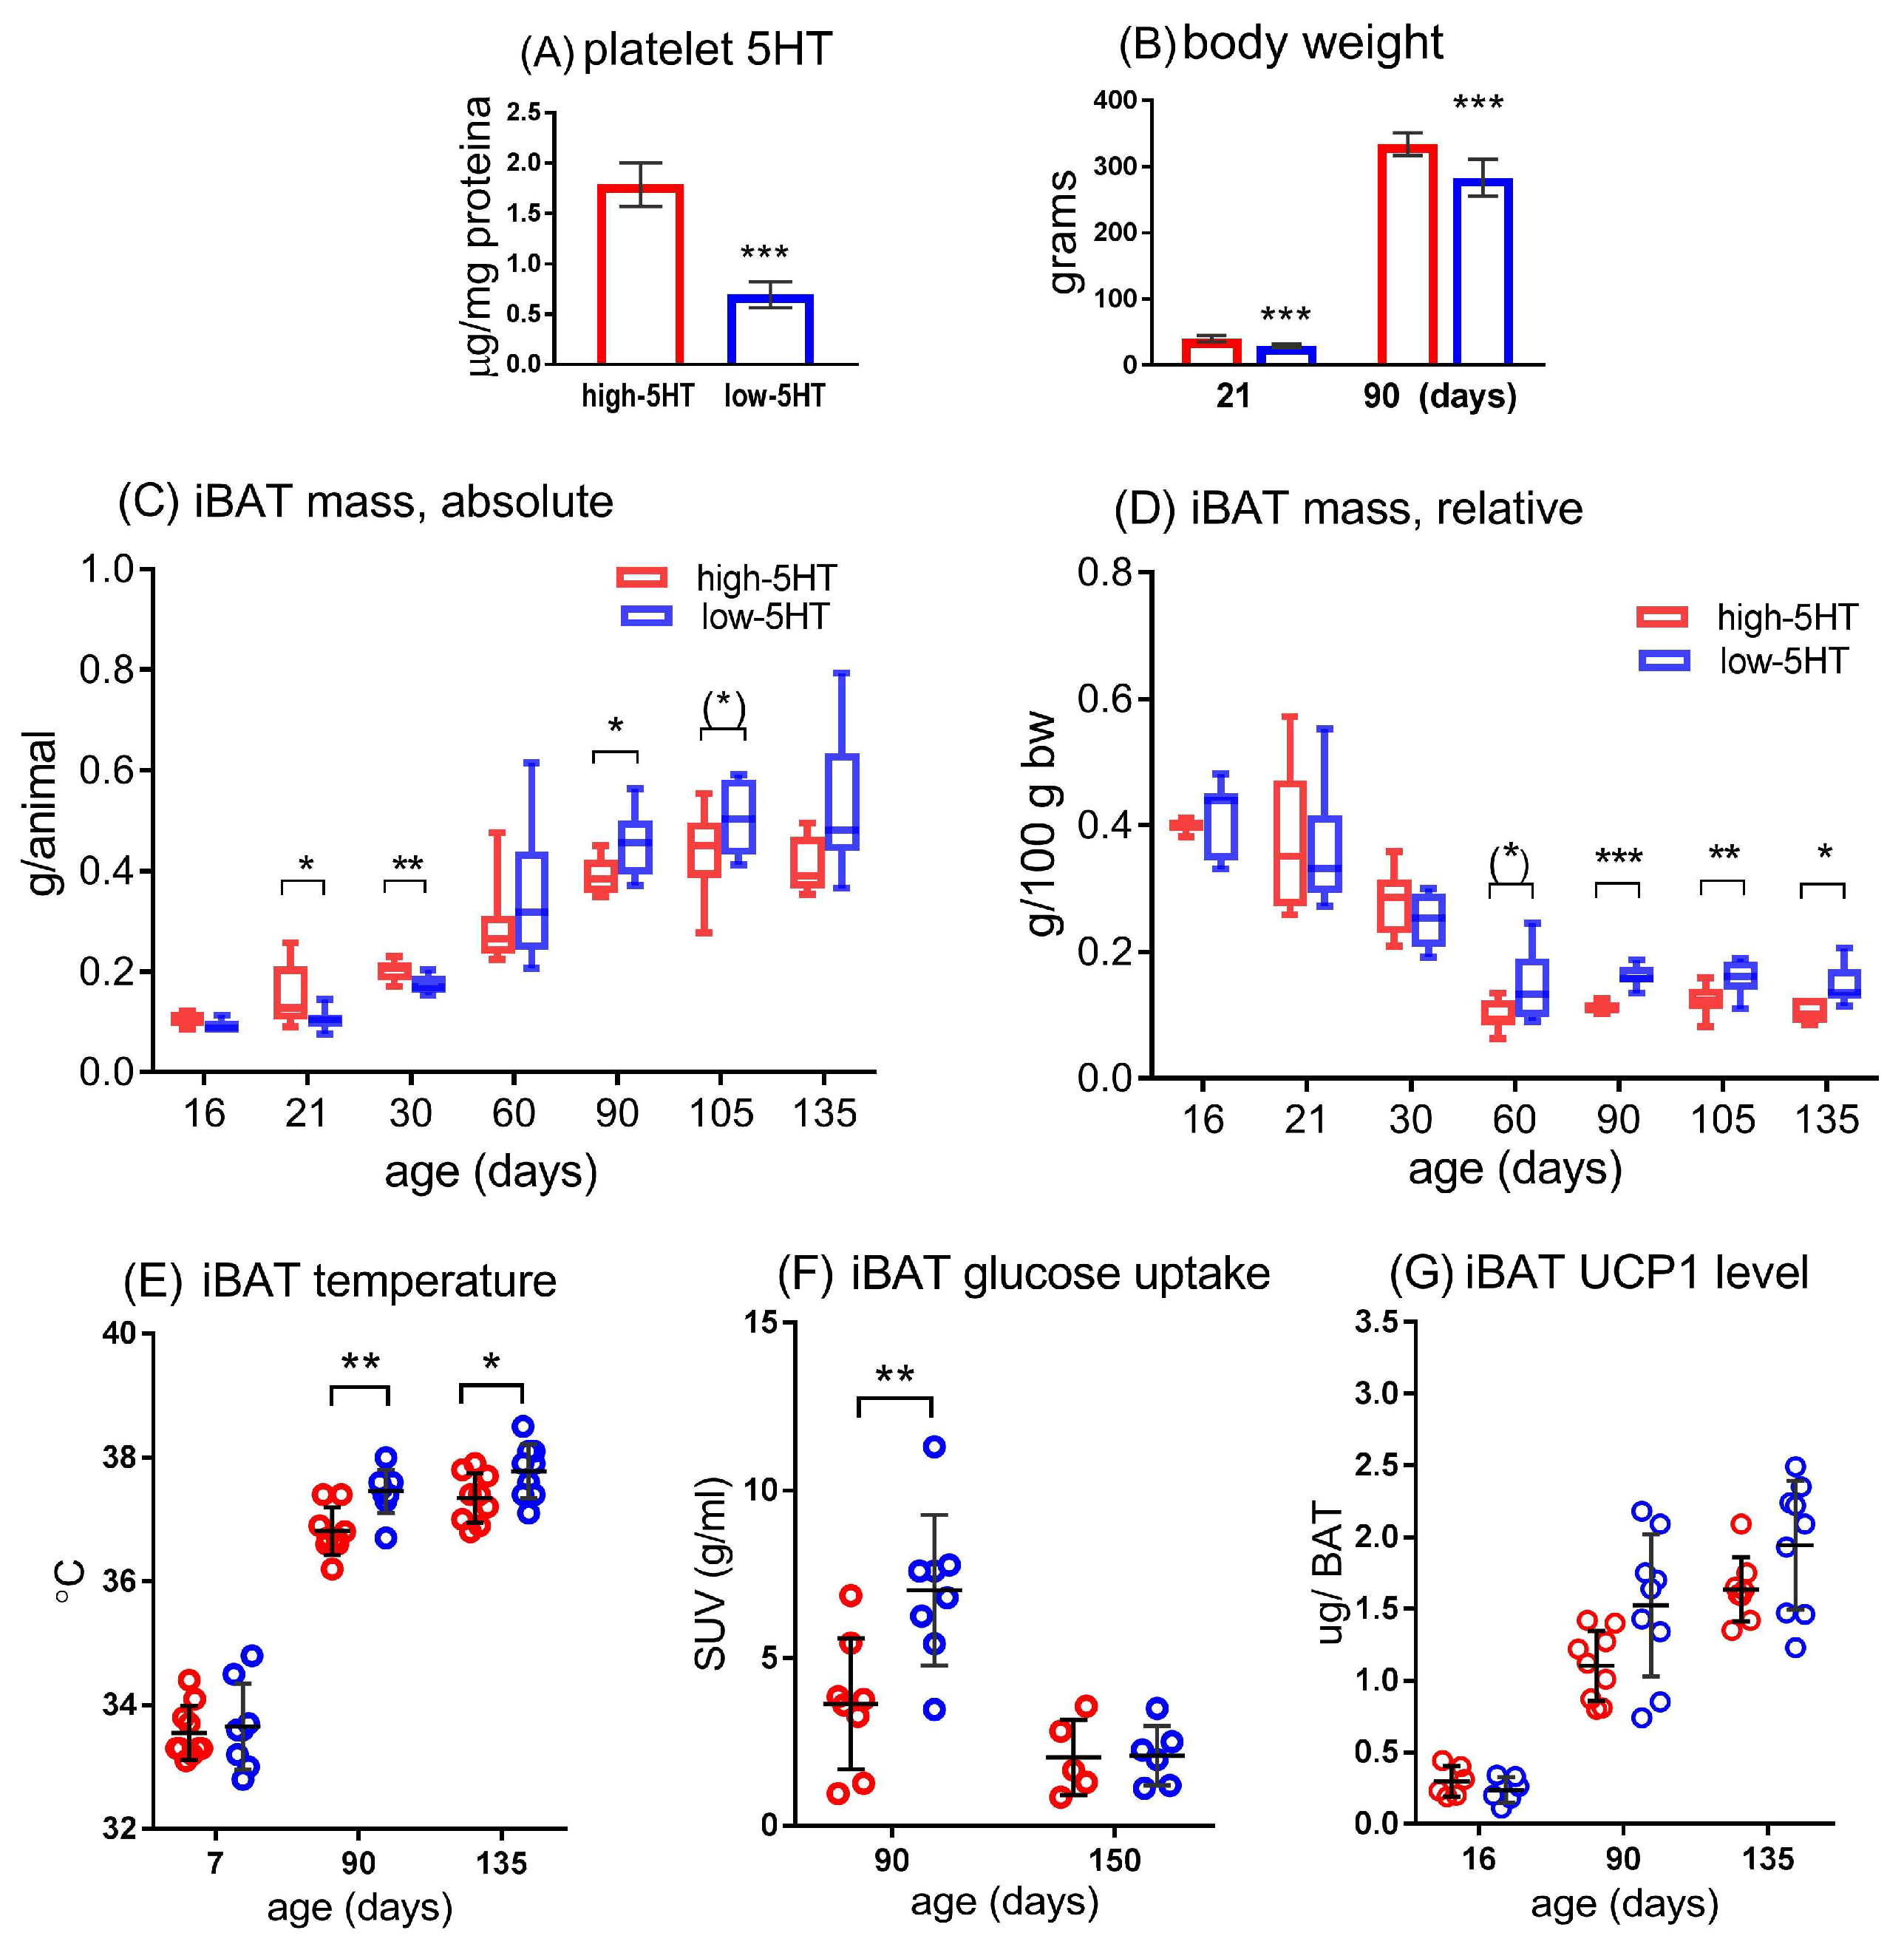
3.1. Basal Characteristics of the Study Animals
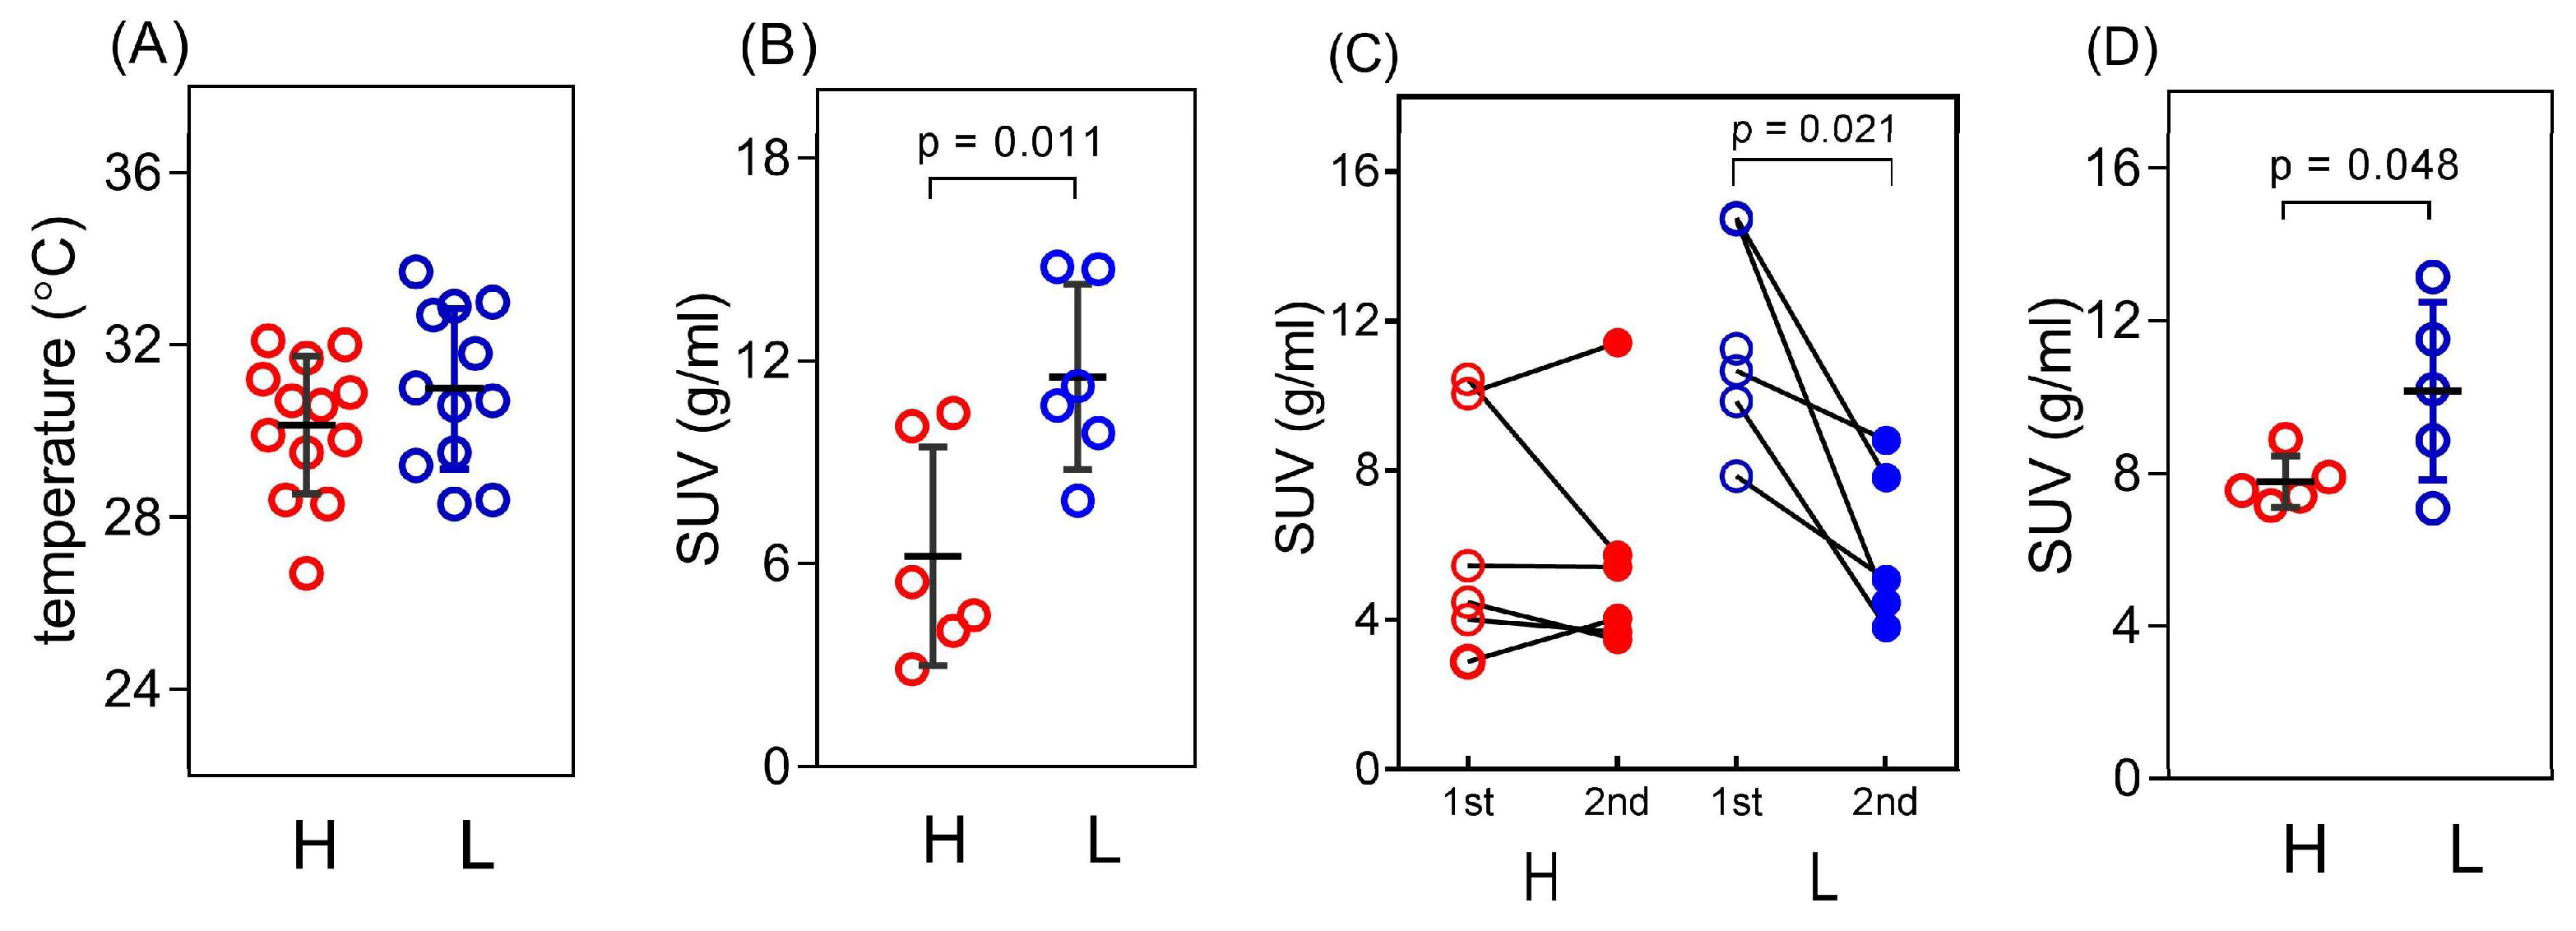
3.2. iBAT Functioning of 5HT Sublines in Conditions of Experimentally Induced Thermogenesis
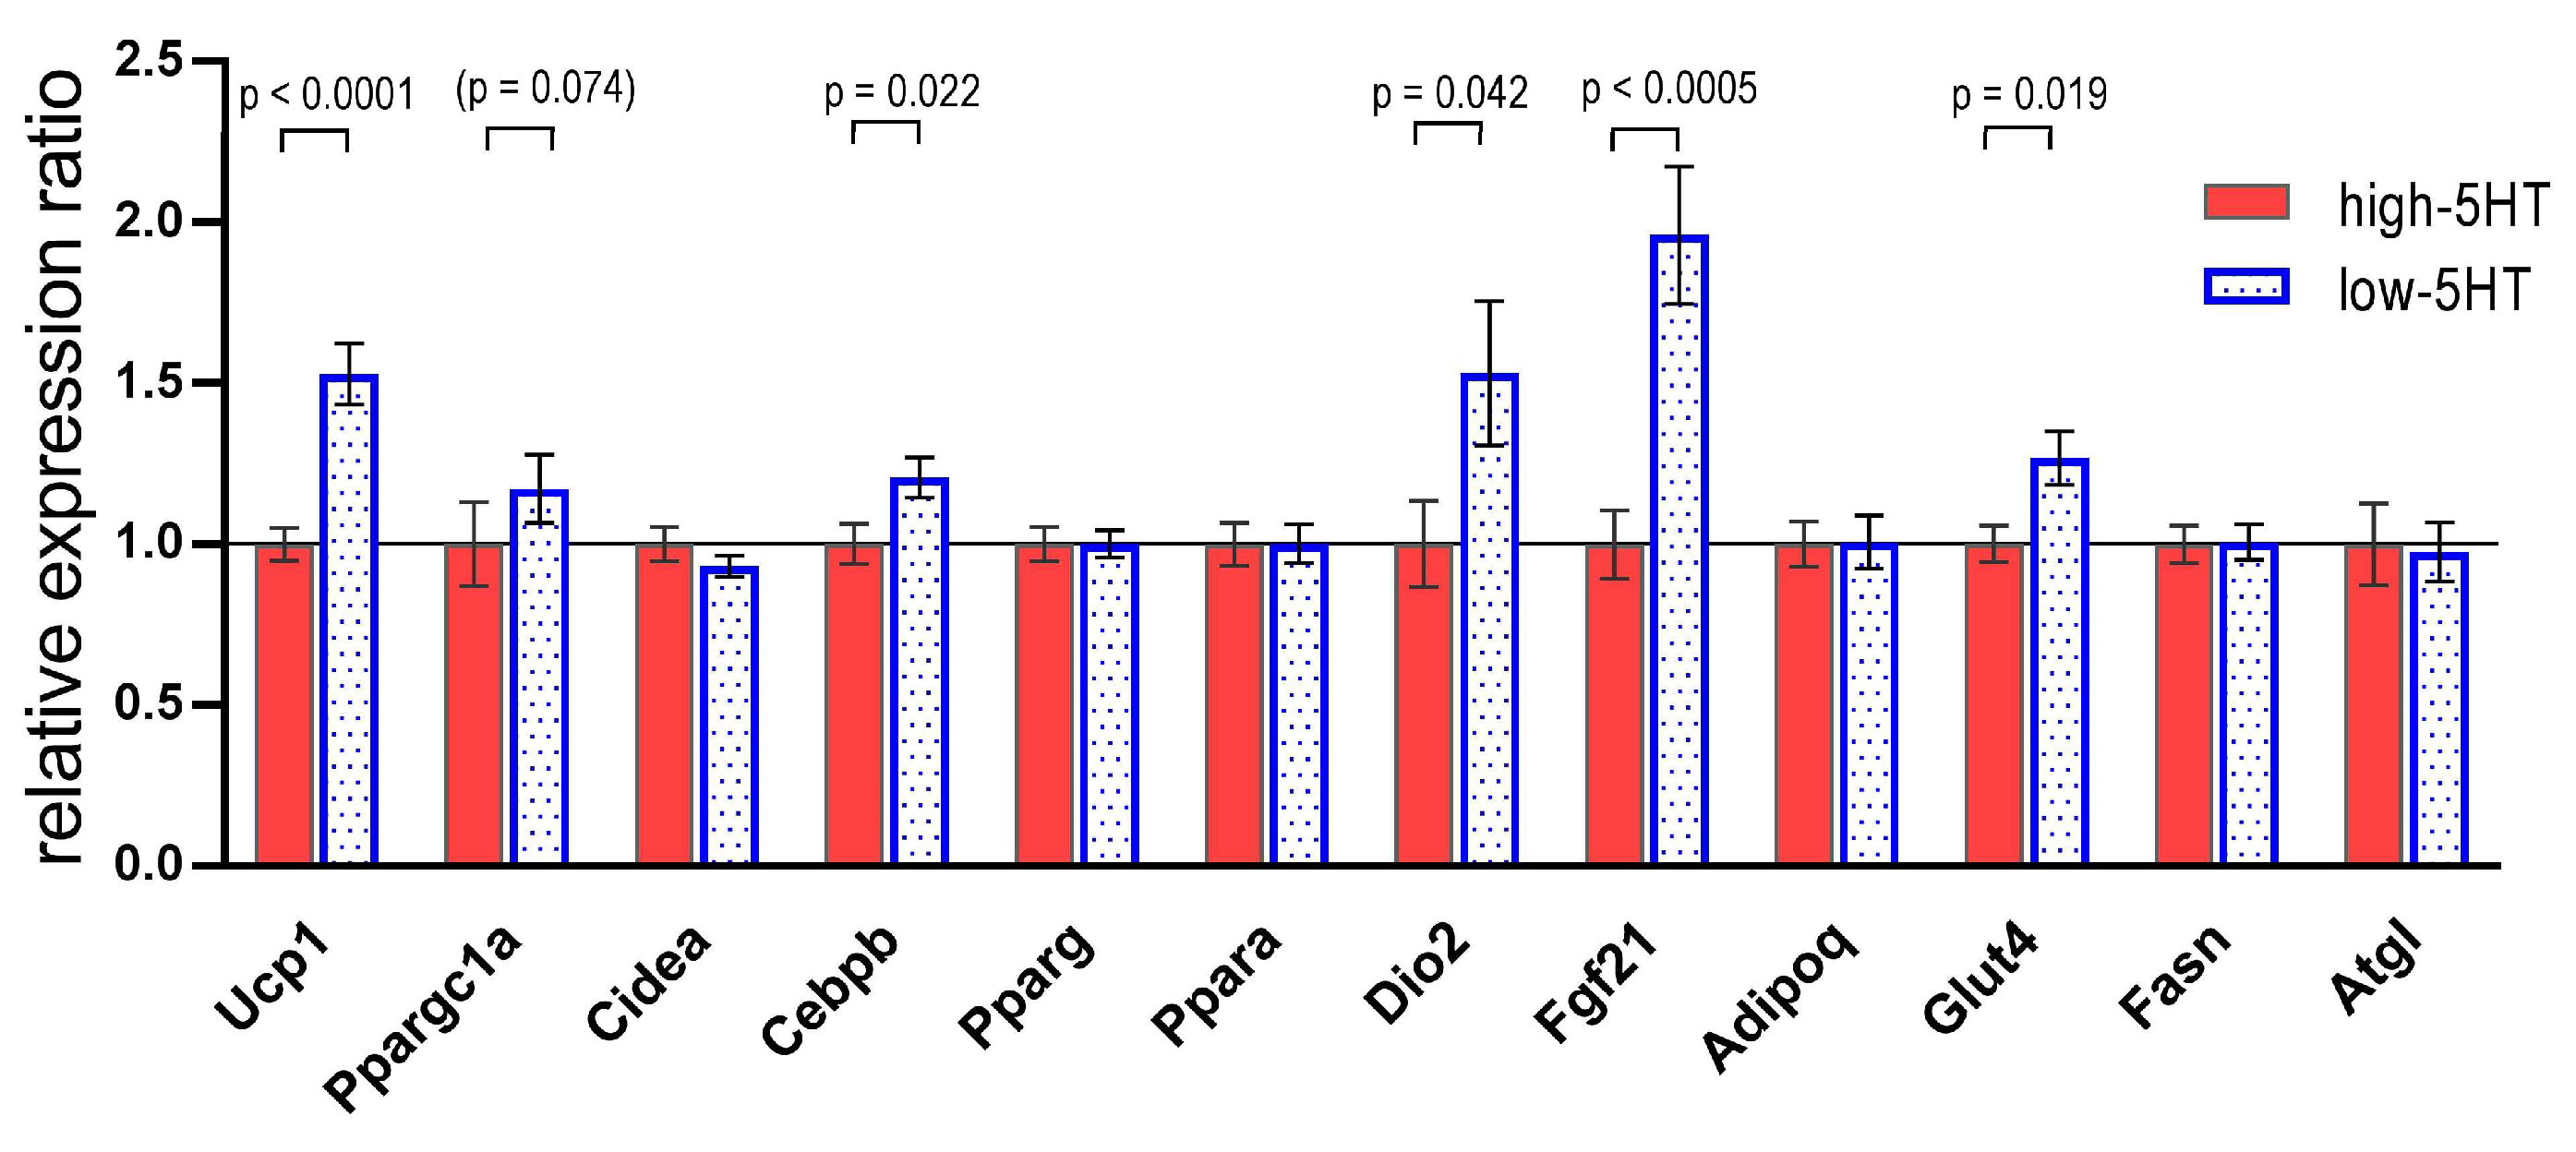
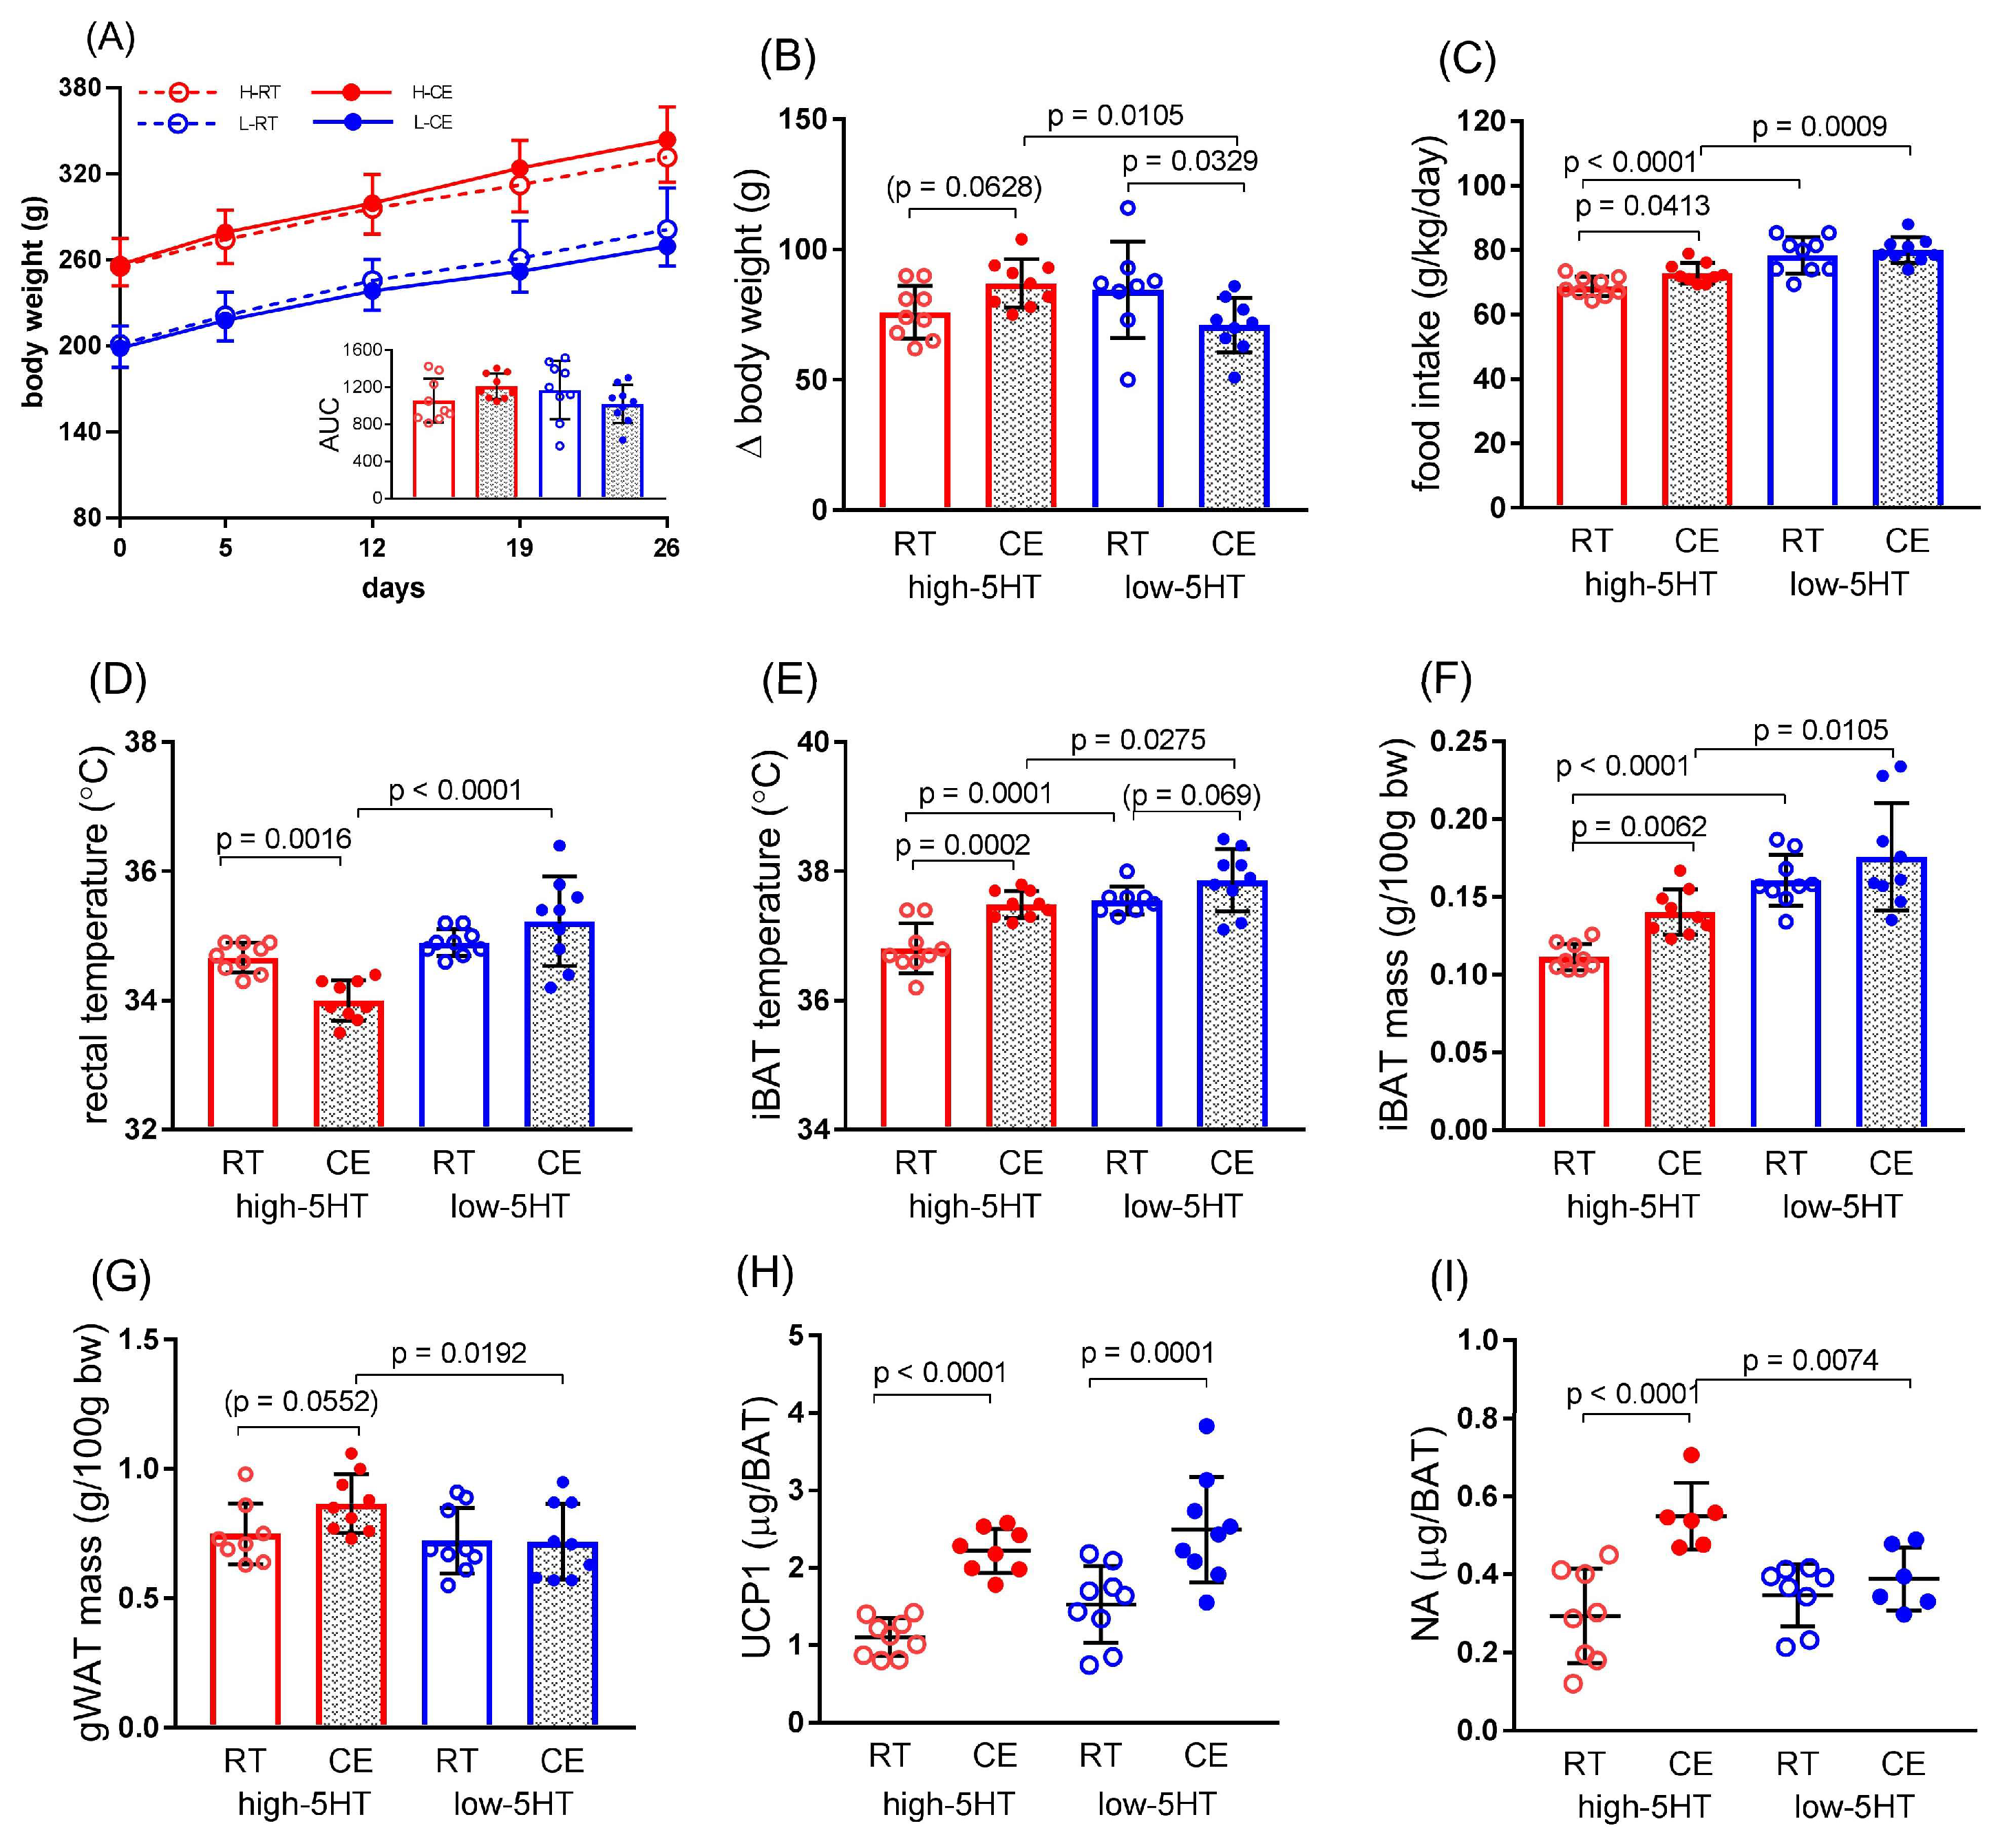
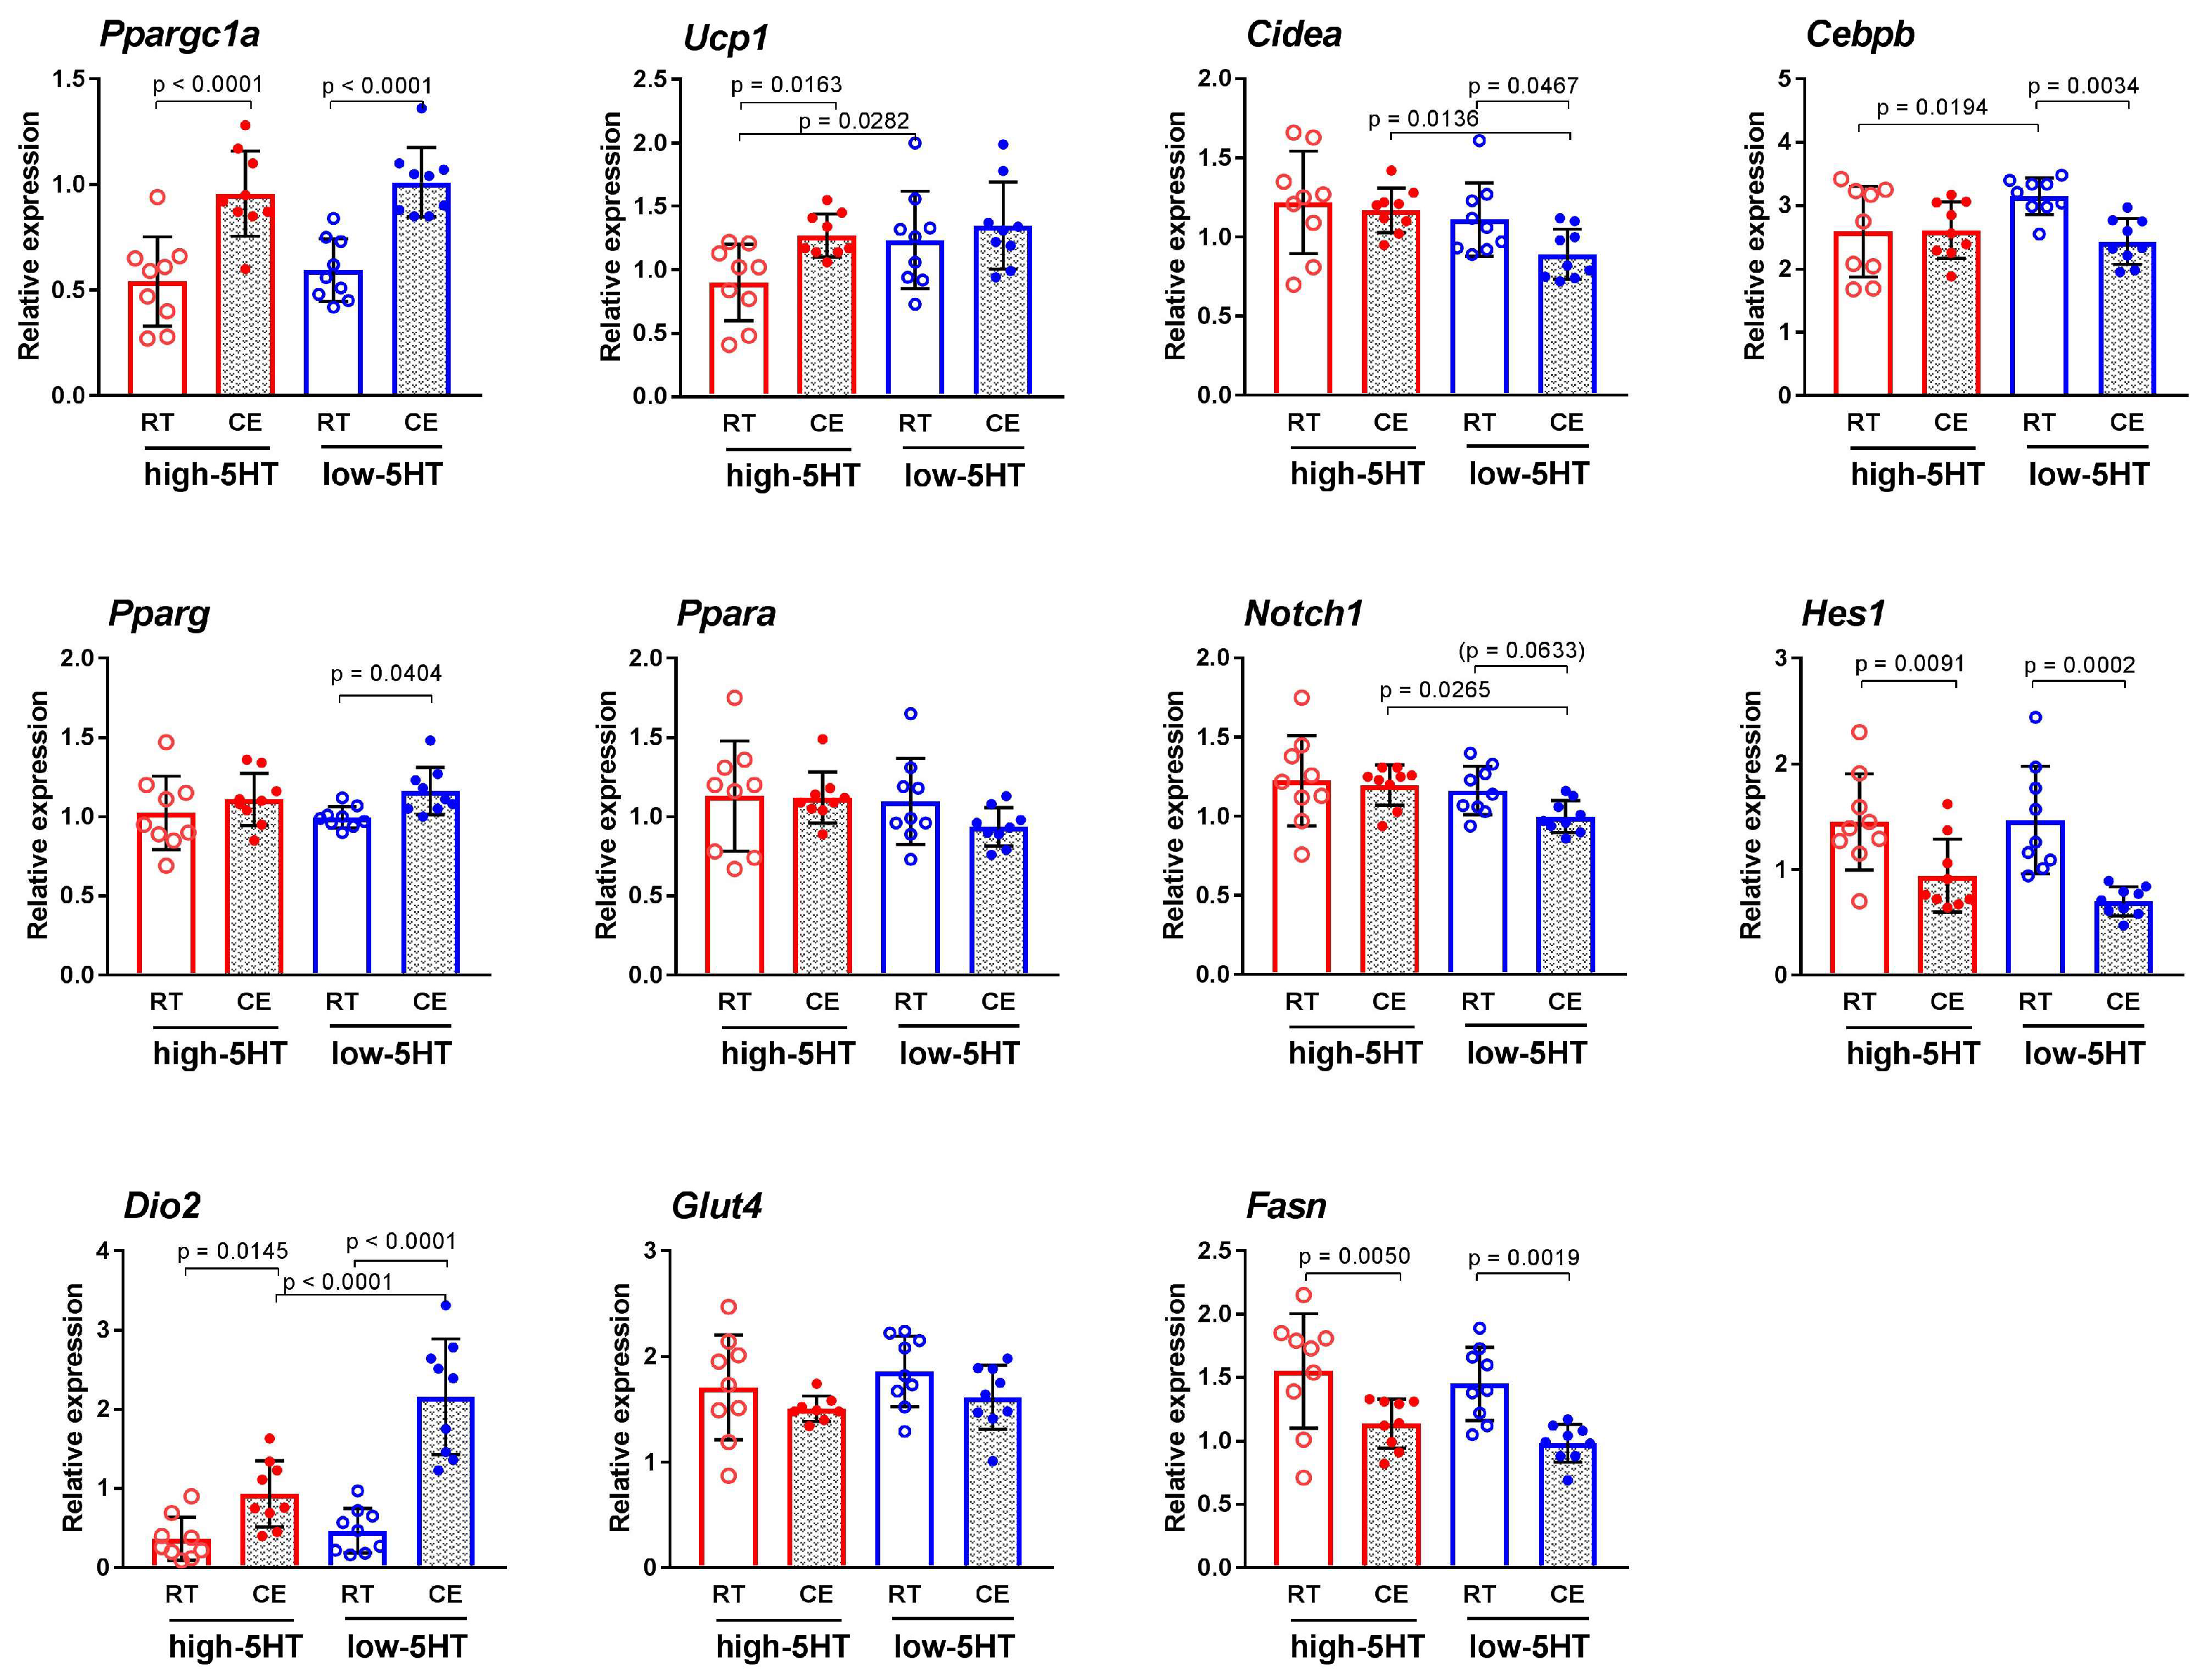
3.3. Functional and Molecular Response to Chronic Cold Exposure
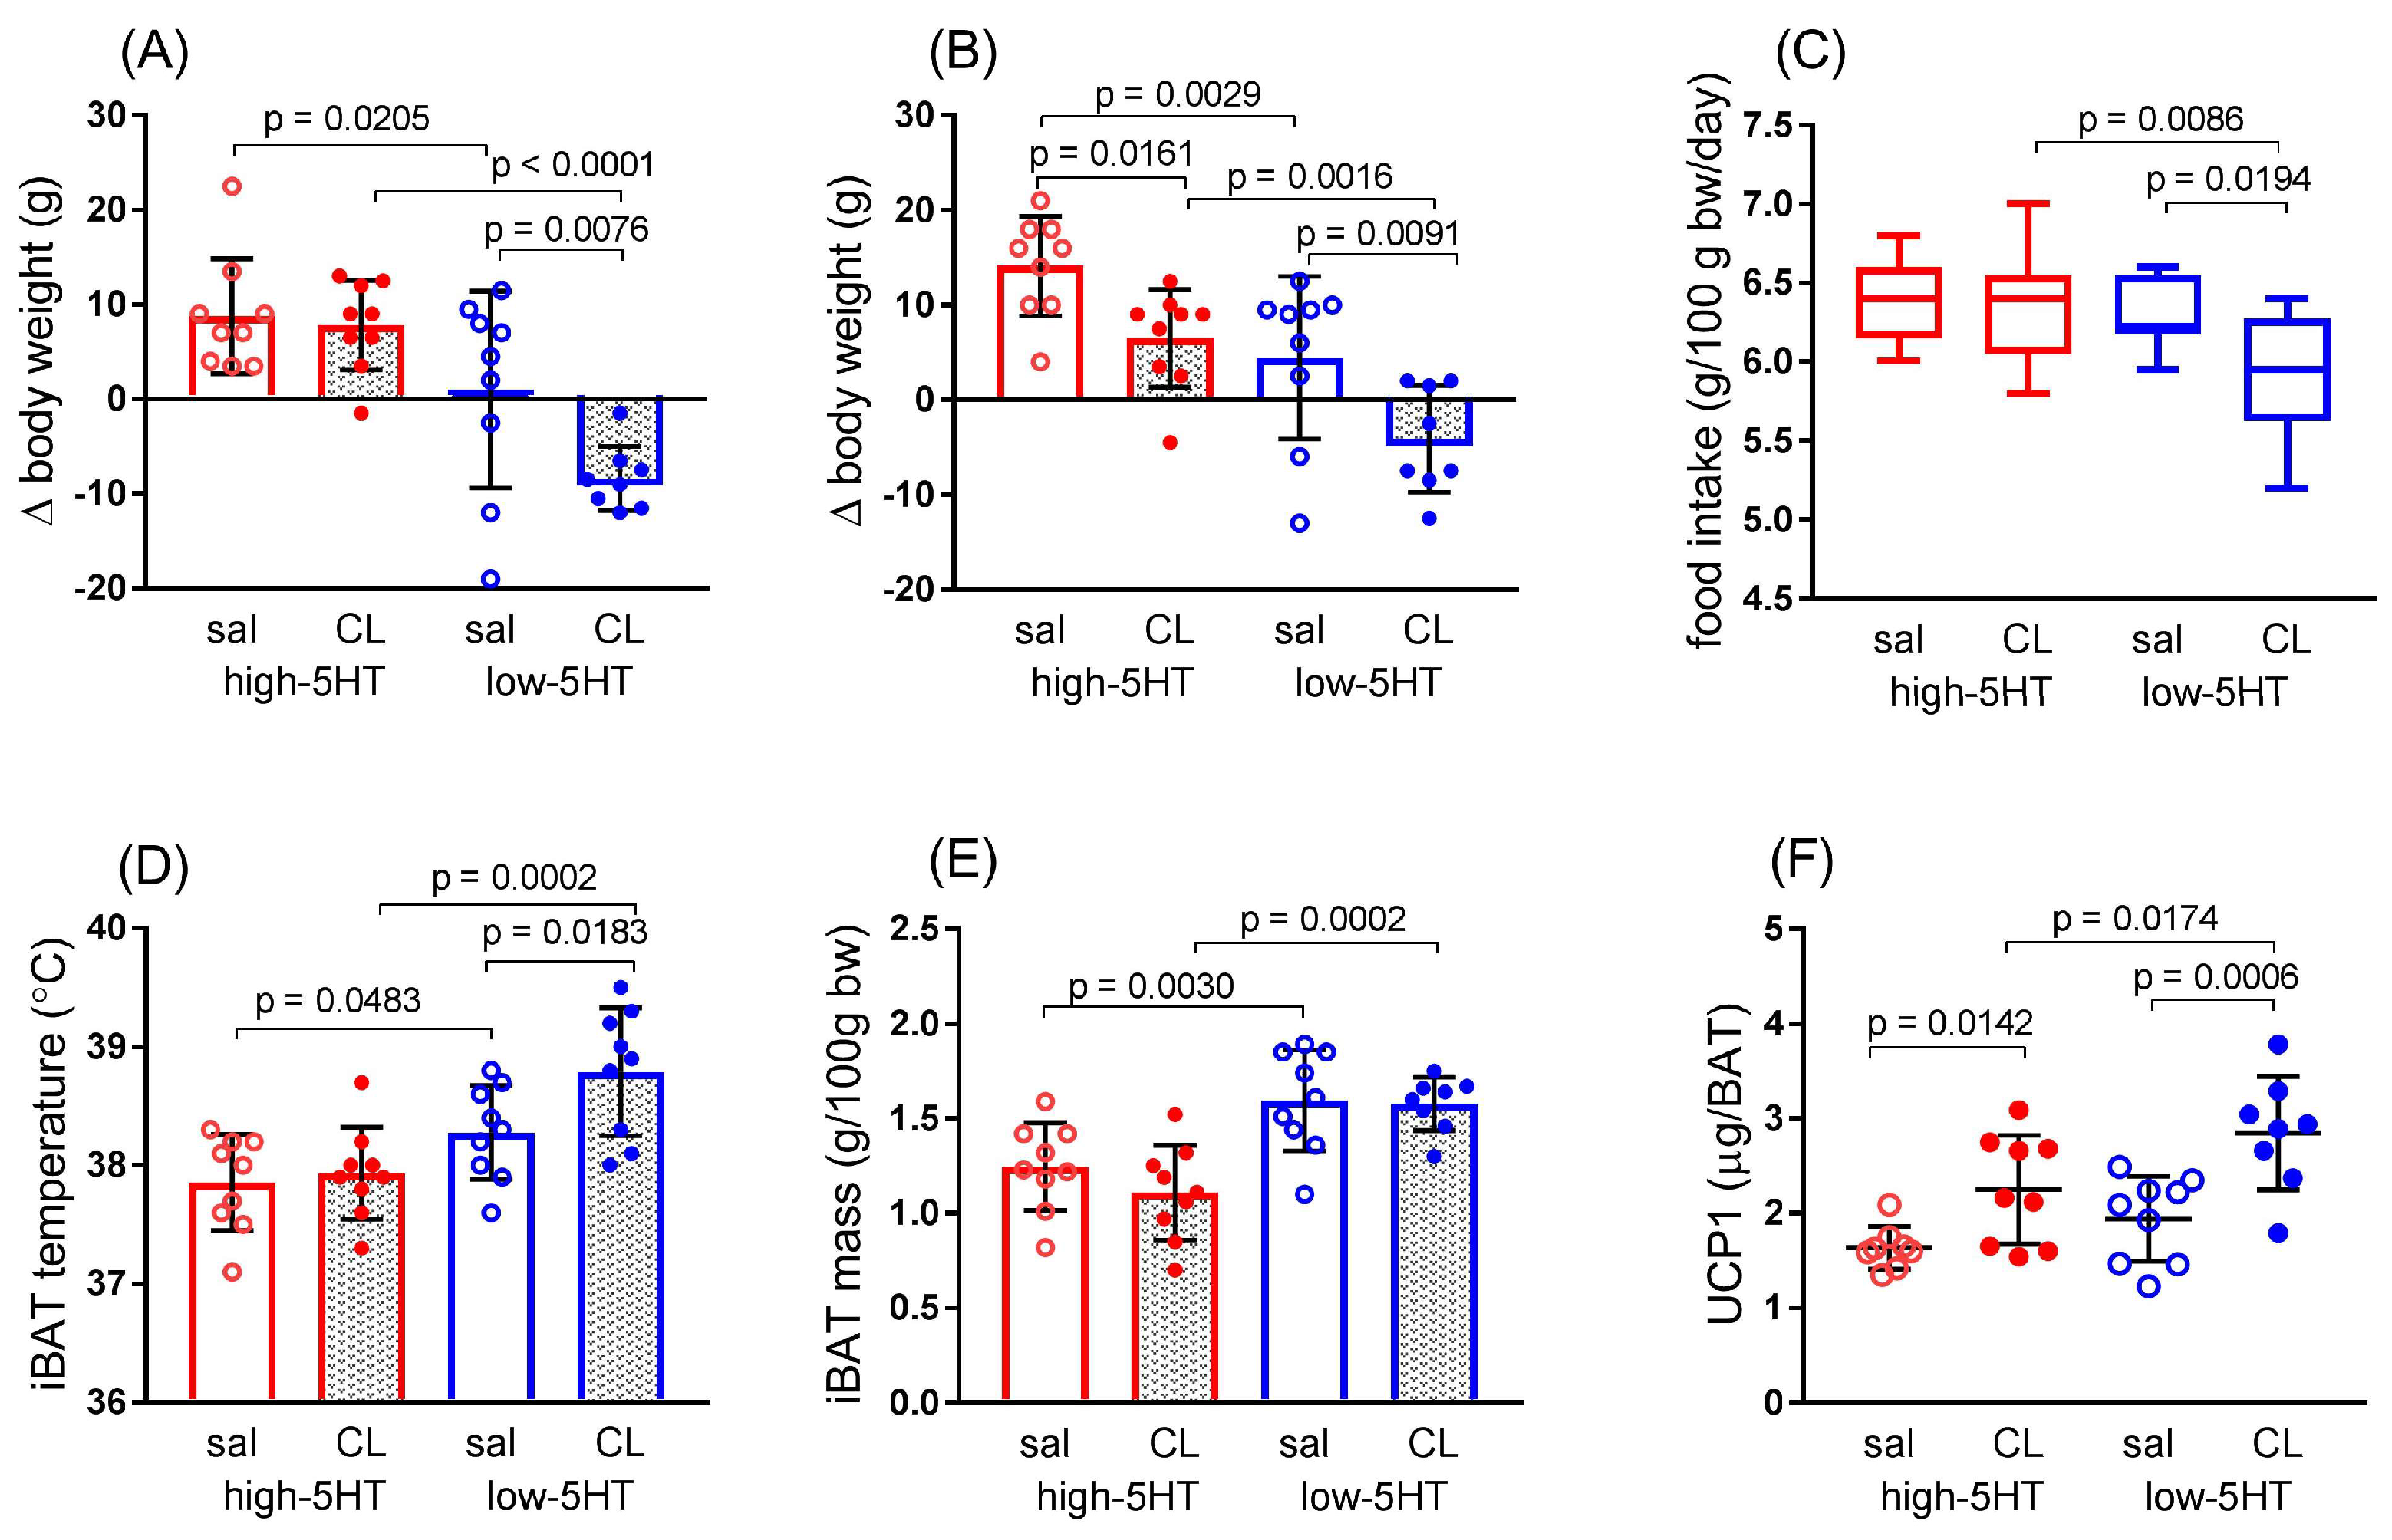
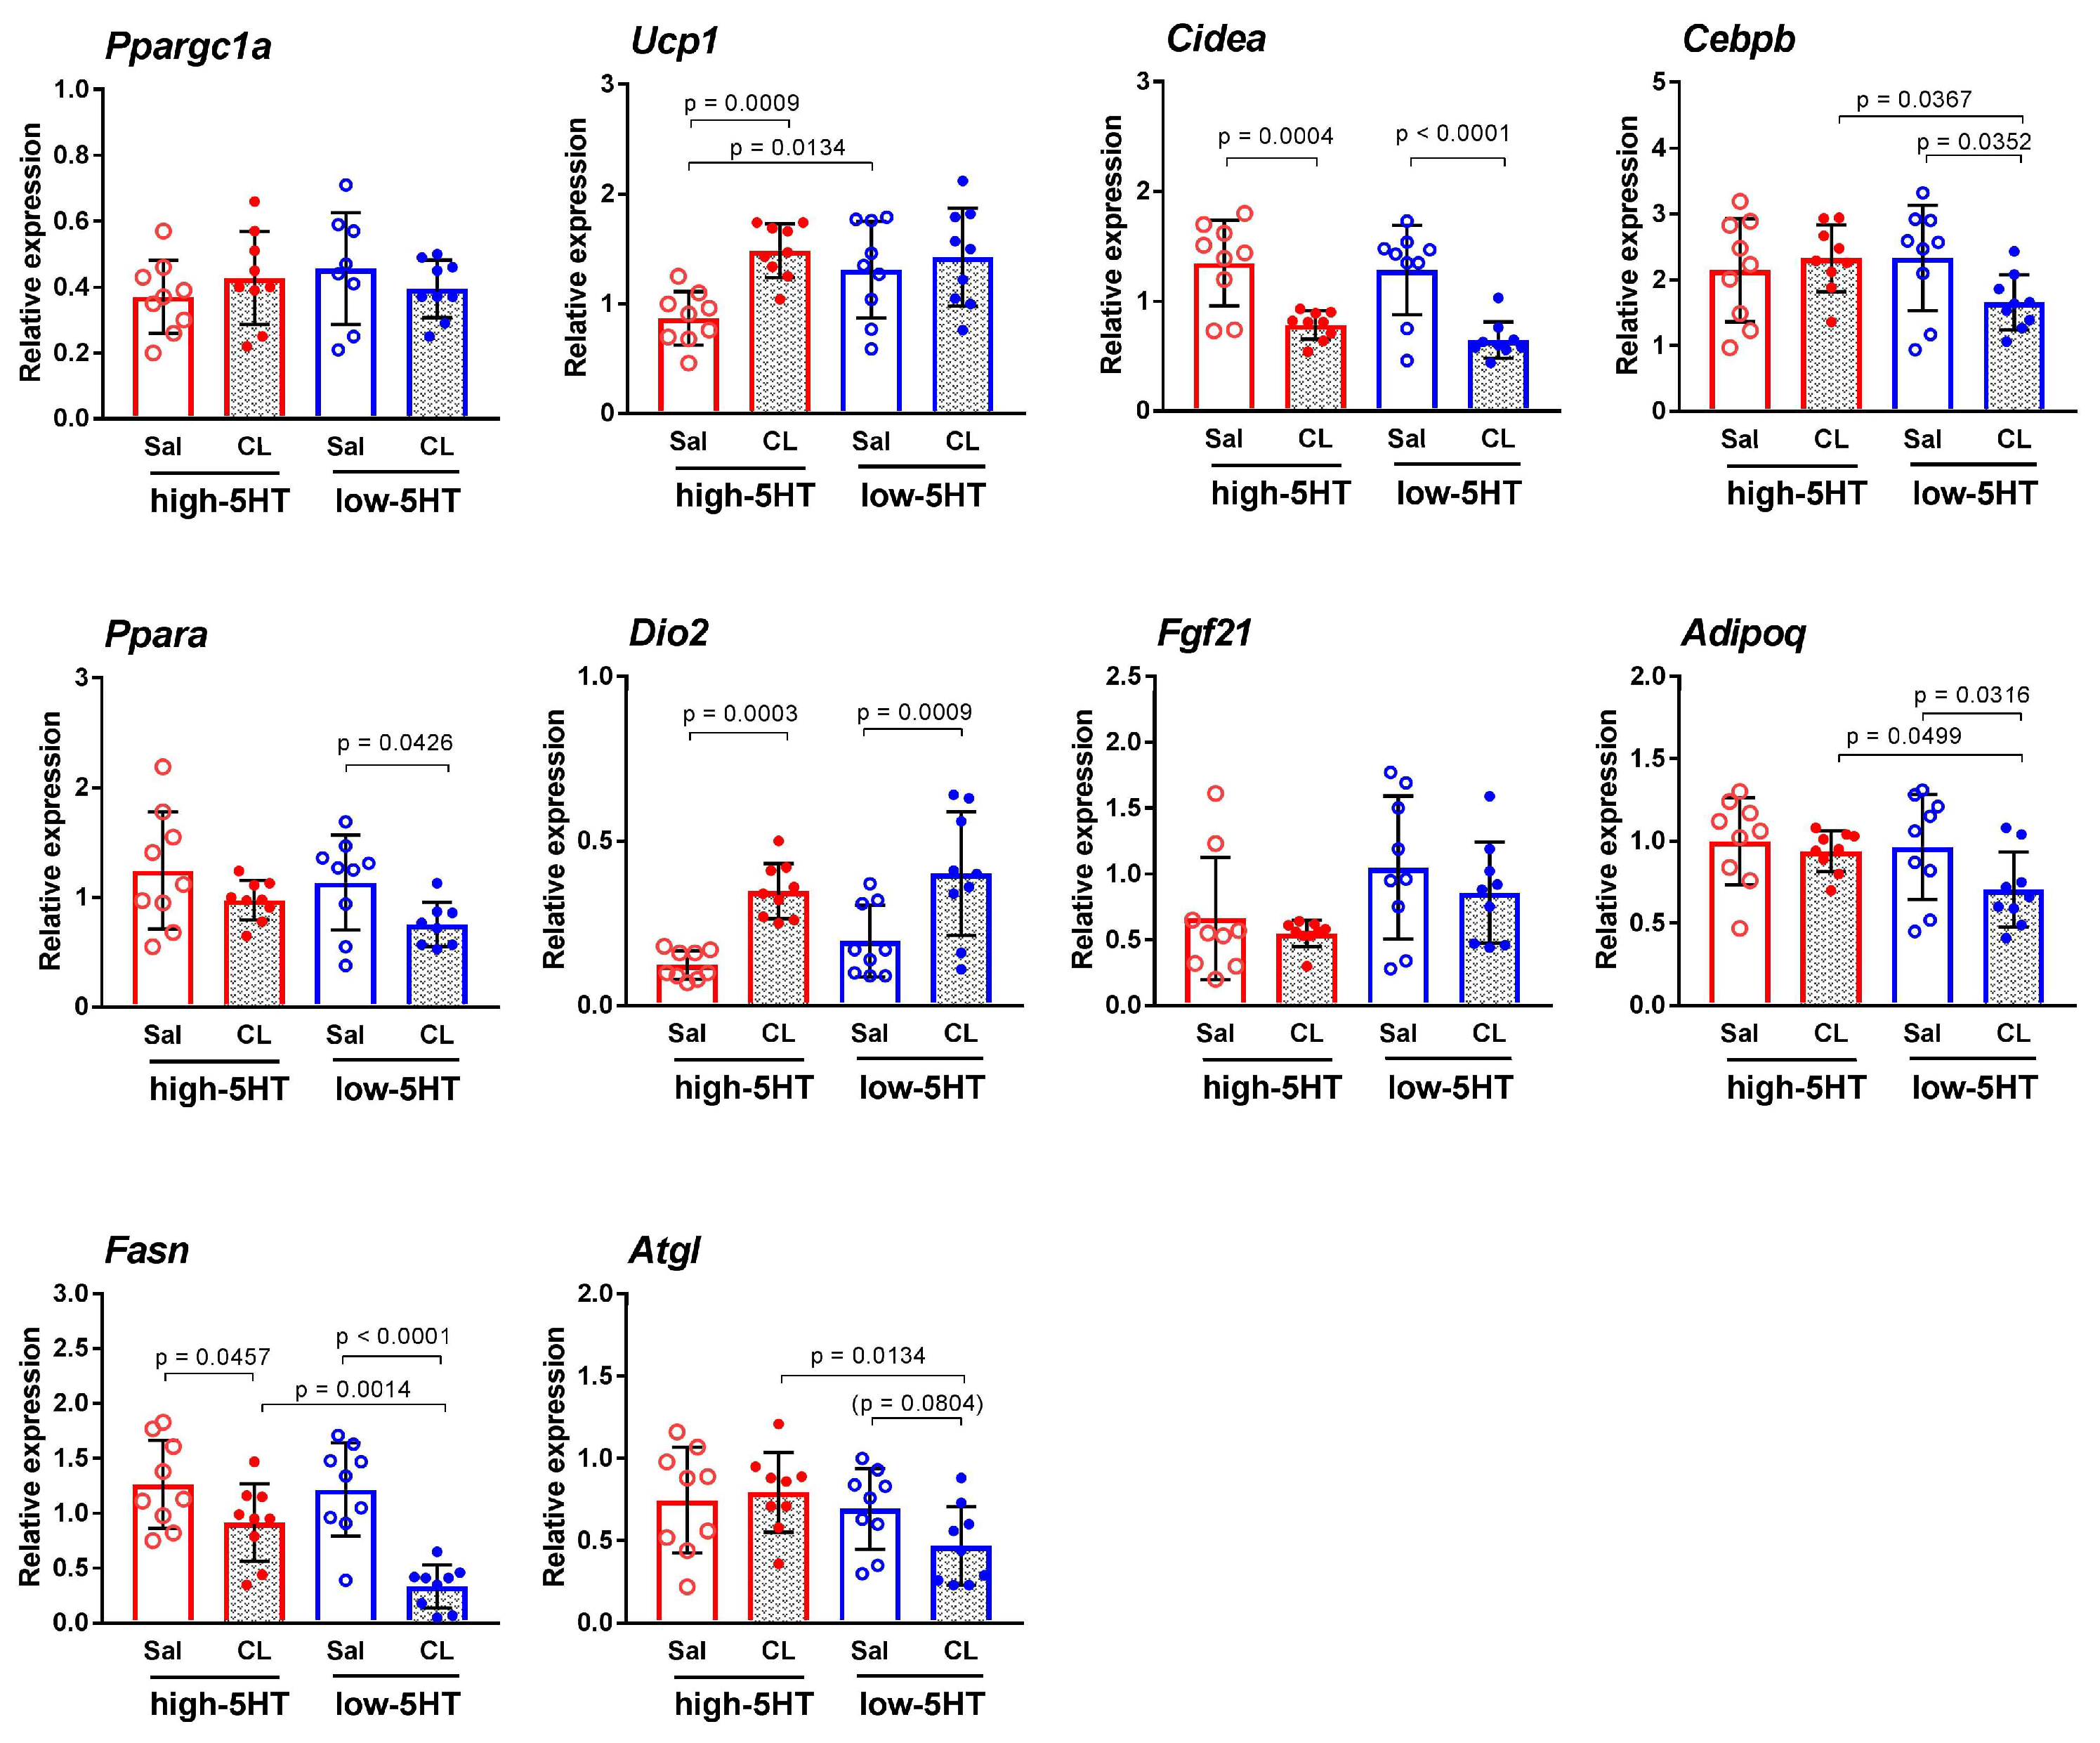
3.4. Functional and Molecular Response to Repeated Treatment with β3-Adrenergic Agonist
4. Discussion
5. Conclusions
Supplementary Materials
Author Contributions
Funding
Institutional Review Board Statement
Informed Consent Statement
Data Availability Statement
Conflicts of Interest
Abbreviations
References
- World Obesity Day 2022—Accelerating Action to Stop Obesity. Available online: https://www.who.int/news/item/04-03-2022-world-obesity-day-2022-accelerating-action-to-stop-obesity (accessed on 27 March 2023).
- Spiegelman, B.M.; Flier, J.S. Obesity and the Regulation of Energy Balance. Cell 2001, 104, 531–543. [Google Scholar] [CrossRef]
- Müller, T.D.; Blüher, M.; Tschöp, M.H.; DiMarchi, R.D. Anti-Obesity Drug Discovery: Advances and Challenges. Nat. Rev. Drug Discov. 2022, 21, 201–223. [Google Scholar] [CrossRef]
- Giordano, A.; Frontini, A.; Cinti, S. Convertible Visceral Fat as a Therapeutic Target to Curb Obesity. Nat. Rev. Drug Discov. 2016, 15, 405–424. [Google Scholar] [CrossRef] [PubMed]
- Whittle, A.; Relat-Pardo, J.; Vidal-Puig, A. Pharmacological Strategies for Targeting BAT Thermogenesis. Trends Pharmacol. Sci. 2013, 34, 347–355. [Google Scholar] [CrossRef] [PubMed]
- Savona-Ventura, C.; Hasan, A.; Mahmood, T. Obesity Based on Genetic and Molecular Influences. In Obesity and Obstetrics; Mahmood, T.A., Arulkumaran, S., Chervenak, F.A., Eds.; Elsevier: Amsterdam, The Netherlands, 2020; pp. 25–35. ISBN 978-0-12-817921-5. [Google Scholar]
- Cannon, B.; Nedergaard, J. Brown Adipose Tissue: Function and Physiological Significance. Physiol. Rev. 2004, 84, 277–359. [Google Scholar] [CrossRef] [PubMed]
- Cypess, A.M.; Lehman, S.; Williams, G.; Tal, I.; Rodman, D.; Goldfine, A.B.; Kuo, F.C.; Palmer, E.L.; Tseng, Y.-H.; Doria, A.; et al. Identification and Importance of Brown Adipose Tissue in Adult Humans. N. Engl. J. Med. 2009, 360, 1509–1517. [Google Scholar] [CrossRef] [PubMed]
- Zingaretti, M.C.; Crosta, F.; Vitali, A.; Guerrieri, M.; Frontini, A.; Cannon, B.; Nedergaard, J.; Cinti, S. The Presence of UCP1 Demonstrates That Metabolically Active Adipose Tissue in the Neck of Adult Humans Truly Represents Brown Adipose Tissue. FASEB J. 2009, 23, 3113–3120. [Google Scholar] [CrossRef]
- Vijgen, G.H.; Bouvy, N.D.; Teule, G.J.; Brans, B.; Schrauwen, P.; van Marken Lichtenbelt, W.D. Brown Adipose Tissue in Morbidly Obese Subjects. PLoS ONE 2011, 6, e17247. [Google Scholar] [CrossRef]
- Matsushita, M.; Yoneshiro, T.; Aita, S.; Kameya, T.; Sugie, H.; Saito, M. Impact of Brown Adipose Tissue on Body Fatness and Glucose Metabolism in Healthy Humans. Int. J. Obes. 2014, 38, 812–817. [Google Scholar] [CrossRef]
- Ouellet, V.; Routhier-Labadie, A.; Bellemare, W.; Lakhal-Chaieb, L.; Turcotte, E.; Carpentier, A.C.; Richard, D. Outdoor Temperature, Age, Sex, Body Mass Index, and Diabetic Status Determine the Prevalence, Mass, and Glucose-Uptake Activity of 18F-FDG-Detected BAT in Humans. J. Clin. Endocrinol. Metab. 2011, 96, 192–199. [Google Scholar] [CrossRef]
- Rui, L. Brown and Beige Adipose Tissues in Health and Disease. Compr. Physiol. 2017, 7, 1281–1306. [Google Scholar] [CrossRef]
- Becher, T.; Palanisamy, S.; Kramer, D.J.; Eljalby, M.; Marx, S.J.; Wibmer, A.G.; Butler, S.D.; Jiang, C.S.; Vaughan, R.; Schöder, H.; et al. Brown Adipose Tissue Is Associated with Cardiometabolic Health. Nat. Med. 2021, 27, 58–65. [Google Scholar] [CrossRef] [PubMed]
- Cinti, S. Adipose Organ Development and Remodeling. Compr. Physiol. 2018, 8, 1357–1431. [Google Scholar] [CrossRef] [PubMed]
- Giroud, M.; Jodeleit, H.; Prentice, K.J.; Bartelt, A. Adipocyte Function and the Development of Cardiometabolic Disease. J. Physiol. 2022, 600, 1189–1208. [Google Scholar] [CrossRef] [PubMed]
- Fuller-Jackson, J.P.; Henry, B.A. Adipose and Skeletal Muscle Thermogenesis: Studies from Large Animals. J. Endocrinol. 2018, 237, R99–R115. [Google Scholar] [CrossRef]
- Morrison, S.F.; Madden, C.J.; Tupone, D. Central Neural Regulation of Brown Adipose Tissue Thermogenesis and Energy Expenditure. Cell Metab. 2014, 19, 741–756. [Google Scholar] [CrossRef] [PubMed]
- Chondronikola, M.; Sidossis, L.S. Brown and Beige Fat: From Molecules to Physiology. Biochim. Biophys. Acta Mol. Cell Biol. Lipids 2019, 1864, 91–103. [Google Scholar] [CrossRef] [PubMed]
- Till, A.; Fries, C.; Fenske, W.K. Brain-to-BAT—And Back?: Crosstalk between the Central Nervous System and Thermogenic Adipose Tissue in Development and Therapy of Obesity. Brain Sci. 2022, 12, 1646. [Google Scholar] [CrossRef]
- Carobbio, S.; Guénantin, A.C.; Samuelson, I.; Bahri, M.; Vidal-Puig, A. Brown and Beige Fat: From Molecules to Physiology and Pathophysiology. Biochim. Biophys. Acta Mol. Cell Biol. Lipids 2019, 1864, 37–50. [Google Scholar] [CrossRef]
- Tran, L.T.; Park, S.; Kim, S.K.; Lee, J.S.; Kim, K.W.; Kwon, O. Hypothalamic Control of Energy Expenditure and Thermogenesis. Exp. Mol. Med. 2022, 54, 358–369. [Google Scholar] [CrossRef]
- Tecott, L.H. Serotonin and the Orchestration of Energy Balance. Cell Metab. 2007, 6, 352–361. [Google Scholar] [CrossRef]
- Heisler, L.K.; Lam, D.D. An Appetite for Life: Brain Regulation of Hunger and Satiety. Curr. Opin. Pharmacol. 2017, 37, 100–106. [Google Scholar] [CrossRef]
- Van Galen, K.A.; Ter Horst, K.W.; Serlie, M.J. Serotonin, Food Intake, and Obesity. Obes. Rev. 2021, 22, e13210. [Google Scholar] [CrossRef]
- Oh, C.M.; Park, S.; Kim, H. Serotonin as a New Therapeutic Target for Diabetes Mellitus and Obesity. Diabetes Metab. J. 2016, 40, 89–98. [Google Scholar] [CrossRef] [PubMed]
- Wyler, S.C.; Lord, C.C.; Lee, S.; Elmquist, J.K.; Liu, C. Serotonergic Control of Metabolic Homeostasis. Front. Cell. Neurosci. 2017, 11, 277. [Google Scholar] [CrossRef] [PubMed]
- Moon, J.H.; Oh, C.M.; Kim, H. Serotonin in the Regulation of Systemic Energy Metabolism. J. Diabetes Investig. 2022, 13, 1639–1645. [Google Scholar] [CrossRef] [PubMed]
- Yabut, J.M.; Crane, J.D.; Green, A.E.; Keating, D.J.; Khan, W.I.; Steinberg, G.R. Emerging Roles for Serotonin in Regulating Metabolism: New Implications for an Ancient Molecule. Endocr. Rev. 2019, 40, 1092–1107. [Google Scholar] [CrossRef] [PubMed]
- Zha, W.; Ho, H.T.B.; Hu, T.; Hebert, M.F.; Wang, J. Serotonin Transporter Deficiency Drives Estrogen-Dependent Obesity and Glucose Intolerance. Sci. Rep. 2017, 7, 1137. [Google Scholar] [CrossRef]
- Rozenblit-Susan, S.; Chapnik, N.; Froy, O. Serotonin Prevents Differentiation into Brown Adipocytes and Induces Transdifferentiation into White Adipocytes. Int. J. Obes. 2018, 42, 704–710. [Google Scholar] [CrossRef]
- Crane, J.D.; Palanivel, R.; Mottillo, E.P.; Bujak, A.L.; Wang, H.; Ford, R.J.; Collins, A.; Blümer, R.M.; Fullerton, M.D.; Yabut, J.M.; et al. Inhibiting Peripheral Serotonin Synthesis Reduces Obesity and Metabolic Dysfunction by Promoting Brown Adipose Tissue Thermogenesis. Nat. Med. 2015, 21, 166–172. [Google Scholar] [CrossRef]
- Oh, C.M.; Namkung, J.; Go, Y.; Shong, K.E.; Kim, K.; Kim, H.; Park, B.Y.; Lee, H.W.; Jeon, Y.H.; Song, J.; et al. Regulation of Systemic Energy Homeostasis by Serotonin in Adipose Tissues. Nat. Commun. 2015, 6, 6794. [Google Scholar] [CrossRef]
- Choi, W.; Namkung, J.; Hwang, I.; Kim, H.; Lim, A.; Park, H.J.; Lee, H.W.; Han, K.H.; Park, S.; Jeong, J.S.; et al. Serotonin Signals through a Gut-Liver Axis to Regulate Hepatic Steatosis. Nat. Commun. 2018, 9, 4824. [Google Scholar] [CrossRef] [PubMed]
- McGlashon, J.M.; Gorecki, M.C.; Kozlowski, A.E.; Thirnbeck, C.K.; Markan, K.R.; Leslie, K.L.; Kotas, M.E.; Potthoff, M.J.; Richerson, G.B.; Gillum, M.P. Central Serotonergic Neurons Activate and Recruit Thermogenic Brown and Beige Fat and Regulate Glucose and Lipid Homeostasis. Cell Metab. 2015, 21, 692–705. [Google Scholar] [CrossRef] [PubMed]
- Čičin-Šain, L.; Perović, S.; Iskrić, S.; Jernej, B. Development of Sublines of Wistar-Derived Rats with High or Low Platelet Serotonin Levels. Period. Biol. 1995, 97, 211–215. [Google Scholar]
- Čičin-Šain, L.; Froebe, A.; Bordukalo-Nikšić, T.; Jernej, B. Serotonin Transporter Kinetics in Rats Selected for Extreme Values of Platelet Serotonin Level. Life Sci. 2005, 77, 452–461. [Google Scholar] [CrossRef] [PubMed]
- Čičin-Šain, L.; Jernej, B. Wistar–Zagreb 5HT Rats: A Rodent Model with Constitutional Upregulation/Downregulation of Serotonin Transporter. In Experimental Models in Serotonin Transporter Research; Kalueff, A.V., LaPorte, J.L., Eds.; Cambridge University Press: Cambridge, UK, 2010; pp. 214–243. ISBN 978-0-521-51487-3. [Google Scholar]
- Romero, L.; Jernej, B.; Bel, N.; Čičin-Šain, L.; Cortés, R.; Artigas, F. Basal and Stimulated Extracellular Serotonin Concentration in the Brain of Rats with Altered Serotonin Uptake. Synapse 1998, 28, 313–321. [Google Scholar] [CrossRef]
- Bordukalo-Nikšić, T.; Mokrović, G.; Štefulj, J.; Zivin, M.; Jernej, B.; Čičin-Šain, L. 5HT-1A Receptors and Anxiety-like Behaviours: Studies in Rats with Constitutionally Upregulated/Downregulated Serotonin Transporter. Behav. Brain Res. 2010, 213, 238–245. [Google Scholar] [CrossRef]
- Hranilović, D.; Čičin-Šain, L.; Bordukalo-Nikšić, T.; Jernej, B. Rats with Constitutionally Upregulated/Downregulated Platelet 5HT Transporter: Differences in Anxiety-Related Behavior. Behav. Brain Res. 2005, 165, 271–277. [Google Scholar] [CrossRef]
- Gabrilovac, J.; Čičin-Šain, L.; Osmak, M.; Jernej, B. Alteration of NK- and ADCC-Activities in Rats Genetically Selected for Low or High Platelet Serotonin Level. J. Neuroimmunol. 1992, 37, 213–222. [Google Scholar] [CrossRef]
- Erjavec, I.; Bordukalo-Nikšić, T.; Brkljačić, J.; Grčević, D.; Mokrović, G.; Kesić, M.; Rogić, D.; Zavadoski, W.; Paralkar, V.M.; Grgurević, L.; et al. Constitutively Elevated Blood Serotonin Is Associated with Bone Loss and Type 2 Diabetes in Rats. PLoS ONE 2016, 11, e0150102. [Google Scholar] [CrossRef]
- Kesić, M.; Baković, P.; Stojković, R.; Štefulj, J.; Čičin-Šain, L. Metabolic Disturbances in Rat Sublines with Constitutionally Altered Serotonin Homeostasis. Int. J. Mol. Sci. 2021, 22, 5400. [Google Scholar] [CrossRef]
- Baković, P.; Kesić, M.; Kolarić, D.; Štefulj, J.; Čičin-Šain, L. Metabolic and Molecular Response to High-Fat Diet Differs between Rats with Constitutionally High and Low Serotonin Tone. Int. J. Mol. Sci. 2023, 24, 2169. [Google Scholar] [CrossRef]
- Kesić, M.; Baković, P.; Horvatiček, M.; Proust, B.L.J.; Štefulj, J.; Čičin-Šain, L. Constitutionally High Serotonin Tone Favors Obesity: Study on Rat Sublines with Altered Serotonin Homeostasis. Front. Neurosci. 2020, 14, 219. [Google Scholar] [CrossRef] [PubMed]
- Jernej, B.; Čičin-Šain, L. Platelet Serotonin Level in Rats Is under Genetic Control. Psychiatry Res. 1990, 32, 167–174. [Google Scholar] [CrossRef] [PubMed]
- Kolarić, D.; Skala, K.; Dubravić, A. ThermoWEB-Remote Control and Measurement of Temperature over the Web. Period. Biol. 2007, 108, 117–119. [Google Scholar]
- McNeill, B.T.; Suchacki, K.J.; Stimson, R.H. MECHANISMS IN ENDOCRINOLOGY: Human Brown Adipose Tissue as a Therapeutic Target: Warming up or Cooling Down? Eur. J. Endocrinol. 2021, 184, R243–R259. [Google Scholar] [CrossRef]
- Romanovsky, A.A.; Ivanov, A.I.; Shimansky, Y.P. Selected Contribution: Ambient Temperature for Experiments in Rats: A New Method for Determining the Zone of Thermal Neutrality. J. Appl. Physiol. 2002, 92, 2667–2679. [Google Scholar] [CrossRef]
- Raun, S.H.; Henriquez-Olguín, C.; Karavaeva, I.; Ali, M.; Møller, L.L.V.; Kot, W.; Castro-Mejía, J.L.; Nielsen, D.S.; Gerhart-Hines, Z.; Richter, E.A.; et al. Housing Temperature Influences Exercise Training Adaptations in Mice. Nat. Commun. 2020, 11, 1560. [Google Scholar] [CrossRef]
- Van der Stelt, I.; Hoevenaars, F.; Široká, J.; de Ronde, L.; Friedecký, D.; Keijer, J.; van Schothorst, E. Metabolic Response of Visceral White Adipose Tissue of Obese Mice Exposed for 5 Days to Human Room Temperature Compared to Mouse Thermoneutrality. Front. Physiol. 2017, 8, 179. [Google Scholar] [CrossRef]
- Rusyniak, D.E.; Ootsuka, Y.; Blessing, W.W. When Administered to Rats in a Cold Environment, 3,4-Methylenedioxymethamphetamine Reduces Brown Adipose Tissue Thermogenesis and Increases Tail Blood Flow: Effects of Pretreatment with 5-HT1A and Dopamine D2 Antagonists. Neuroscience 2008, 154, 1619–1626. [Google Scholar] [CrossRef]
- Herz, C.T.; Kulterer, O.C.; Prager, M.; Schmöltzer, C.; Langer, F.B.; Prager, G.; Marculescu, R.; Kautzky-Willer, A.; Hacker, M.; Haug, A.R.; et al. Active Brown Adipose Tissue Is Associated with a Healthier Metabolic Phenotype in Obesity. Diabetes 2021, 71, 93–103. [Google Scholar] [CrossRef] [PubMed]
- Kulterer, O.C.; Herz, C.T.; Prager, M.; Schmöltzer, C.; Langer, F.B.; Prager, G.; Marculescu, R.; Kautzky-Willer, A.; Hacker, M.; Haug, A.R.; et al. Brown Adipose Tissue Prevalence Is Lower in Obesity but Its Metabolic Activity Is Intact. Front. Endocrinol. 2022, 13, 858417. [Google Scholar] [CrossRef]
- Szczepańska, E.; Gietka-Czernel, M. FGF21: A Novel Regulator of Glucose and Lipid Metabolism and Whole-Body Energy Balance. Horm. Metab. Res. 2022, 54, 203–211. [Google Scholar] [CrossRef] [PubMed]
- Fisher, F.M.; Kleiner, S.; Douris, N.; Fox, E.C.; Mepani, R.J.; Verdeguer, F.; Wu, J.; Kharitonenkov, A.; Flier, J.S.; Maratos-Flier, E.; et al. FGF21 Regulates PGC-1α and Browning of White Adipose Tissues in Adaptive Thermogenesis. Genes Dev. 2012, 26, 271–281. [Google Scholar] [CrossRef] [PubMed]
- Lee, P.; Linderman, J.D.; Smith, S.; Brychta, R.J.; Wang, J.; Idelson, C.; Perron, R.M.; Werner, C.D.; Phan, G.Q.; Kammula, U.S.; et al. Irisin and FGF21 Are Cold-Induced Endocrine Activators of Brown Fat Function in Humans. Cell Metab. 2014, 19, 302–309. [Google Scholar] [CrossRef]
- Hondares, E.; Iglesias, R.; Giralt, A.; Gonzalez, F.J.; Giralt, M.; Mampel, T.; Villarroya, F. Thermogenic Activation Induces FGF21 Expression and Release in Brown Adipose Tissue. J. Biol. Chem. 2011, 286, 12983–12990. [Google Scholar] [CrossRef]
- Mota, C.M.D.; Branco, L.G.S.; Morrison, S.F.; Madden, C.J. Systemic Serotonin Inhibits Brown Adipose Tissue Sympathetic Nerve Activity via a GABA Input to the Dorsomedial Hypothalamus, Not via 5HT1A Receptor Activation in Raphe Pallidus. Acta Physiol. 2020, 228, e13401. [Google Scholar] [CrossRef] [PubMed]
- Szabo, S.T.; de Montigny, C.; Blier, P. Progressive Attenuation of the Firing Activity of Locus Coeruleus Noradrenergic Neurons by Sustained Administration of Selective Serotonin Reuptake Inhibitors. Int. J. Neuropsychopharmacol. 2000, 3, 1–11. [Google Scholar] [CrossRef]
- Gitlin, M.; Altshuler, L.L.; Frye, M.A.; Suri, R.; Huynh, E.L.; Fairbanks, L.; Bauer, M.; Korenman, S. Peripheral Thyroid Hormones and Response to Selective Serotonin Reuptake Inhibitors. J. Psychiatry Neurosci. 2004, 29, 383–386. [Google Scholar]
- Schulz, T.J.; Tseng, Y.H. Brown Adipose Tissue: Development, Metabolism and Beyond. Biochem. J. 2013, 453, 167–178. [Google Scholar] [CrossRef]
- de Almeida, D.L.; Fabrício, G.S.; Trombini, A.B.; Pavanello, A.; Tófolo, L.P.; da Silva Ribeiro, T.A.; de Freitas Mathias, P.C.; Palma-Rigo, K. Early Overfeed-Induced Obesity Leads to Brown Adipose Tissue Hypoactivity in Rats. Cell. Physiol. Biochem. 2013, 32, 1621–1630. [Google Scholar] [CrossRef] [PubMed]
- Nedergaard, J.; Cannon, B. Diet-Induced Thermogenesis: Principles and Pitfalls. Methods Mol. Biol. 2022, 2448, 177–202. [Google Scholar] [CrossRef] [PubMed]
- Malison, R.T.; Price, L.H.; Berman, R.; van Dyck, C.H.; Pelton, G.H.; Carpenter, L.; Sanacora, G.; Owens, M.J.; Nemeroff, C.B.; Rajeevan, N.; et al. Reduced Brain Serotonin Transporter Availability in Major Depression as Measured by [123I]-2 Beta-Carbomethoxy-3 Beta-(4-Iodophenyl)Tropane and Single Photon Emission Computed Tomography. Biol. Psychiatry 1998, 44, 1090–1098. [Google Scholar] [CrossRef]
- Murphy, D.L.; Lesch, K.P. Targeting the Murine Serotonin Transporter: Insights into Human Neurobiology. Nat. Rev. Neurosci. 2008, 9, 85–96. [Google Scholar] [CrossRef] [PubMed]
- Porter, C.; Herndon, D.N.; Chondronikola, M.; Chao, T.; Annamalai, P.; Bhattarai, N.; Saraf, M.K.; Capek, K.D.; Reidy, P.T.; Daquinag, A.C.; et al. Human and Mouse Brown Adipose Tissue Mitochondria Have Comparable UCP1 Function. Cell Metab. 2016, 24, 246–255. [Google Scholar] [CrossRef]
- Ravussin, Y.; Xiao, C.; Gavrilova, O.; Reitman, M.L. Effect of Intermittent Cold Exposure on Brown Fat Activation, Obesity, and Energy Homeostasis in Mice. PLoS ONE 2014, 9, e85876. [Google Scholar] [CrossRef]
- Westerterp-Plantenga, M.S.; van Marken Lichtenbelt, W.D.; Strobbe, H.; Schrauwen, P. Energy Metabolism in Humans at a Lowered Ambient Temperature. Eur. J. Clin. Nutr. 2002, 56, 288–296. [Google Scholar] [CrossRef]
- Wang, X.; Che, H.; Zhang, W.; Wang, J.; Ke, T.; Cao, R.; Meng, S.; Li, D.; Weiming, O.; Chen, J.; et al. Effects of Mild Chronic Intermittent Cold Exposure on Rat Organs. Int. J. Biol. Sci. 2015, 11, 1171–1180. [Google Scholar] [CrossRef]
- Voronova, I.P. 5-HT Receptors and Temperature Homeostasis. Biomolecules 2021, 11, 1914. [Google Scholar] [CrossRef]
- Shore, A.M.; Karamitri, A.; Kemp, P.; Speakman, J.R.; Graham, N.S.; Lomax, M.A. Cold-Induced Changes in Gene Expression in Brown Adipose Tissue, White Adipose Tissue and Liver. PLoS ONE 2013, 8, e68933. [Google Scholar] [CrossRef]
- Puigserver, P.; Wu, Z.; Park, C.W.; Graves, R.; Wright, M.; Spiegelman, B.M. A Cold-Inducible Coactivator of Nuclear Receptors Linked to Adaptive Thermogenesis. Cell 1998, 92, 829–839. [Google Scholar] [CrossRef]
- Guardiola-Diaz, H.M.; Rehnmark, S.; Usuda, N.; Albrektsen, T.; Feltkamp, D.; Gustafsson, J.A.; Alexson, S.E. Rat Peroxisome Proliferator-Activated Receptors and Brown Adipose Tissue Function during Cold Acclimatization. J. Biol. Chem. 1999, 274, 23368–23377. [Google Scholar] [CrossRef]
- Carpentier, A.C.; Blondin, D.P.; Haman, F.; Richard, D. Brown Adipose Tissue-A Translational Perspective. Endocr. Rev. 2023, 44, 143–192. [Google Scholar] [CrossRef]
- Lee, P.; Bova, R.; Schofield, L.; Bryant, W.; Dieckmann, W.; Slattery, A.; Govendir, M.A.; Emmett, L.; Greenfield, J.R. Brown Adipose Tissue Exhibits a Glucose-Responsive Thermogenic Biorhythm in Humans. Cell Metab. 2016, 23, 602–609. [Google Scholar] [CrossRef] [PubMed]
- de Goede, P.; Sen, S.; Oosterman, J.E.; Foppen, E.; Jansen, R.; la Fleur, S.E.; Challet, E.; Kalsbeek, A. Differential Effects of Diet Composition and Timing of Feeding Behavior on Rat Brown Adipose Tissue and Skeletal Muscle Peripheral Clocks. Neurobiol. Sleep Circadian Rhythm. 2018, 4, 24–33. [Google Scholar] [CrossRef] [PubMed]
- Gasparetti, A.L.; de Souza, C.T.; Pereira-da-Silva, M.; Oliveira, R.L.; Saad, M.J.; Carneiro, E.M.; Velloso, L.A. Cold Exposure Induces Tissue-Specific Modulation of the Insulin-Signalling Pathway in Rattus Norvegicus. J. Physiol. 2003, 552, 149–162. [Google Scholar] [CrossRef]
- Olichon-Berthe, C.; Van Obberghen, E.; Le Marchand-Brustel, Y. Effect of Cold Acclimation on the Expression of Glucose Transporter Glut 4. Mol. Cell. Endocrinol. 1992, 89, 11–18. [Google Scholar] [CrossRef] [PubMed]
- Shimizu, Y.; Nikami, H.; Tsukazaki, K.; Machado, U.F.; Yano, H.; Seino, Y.; Saito, M. Increased Expression of Glucose Transporter GLUT-4 in Brown Adipose Tissue of Fasted Rats after Cold Exposure. Am. J. Physiol. 1993, 264, E890–E895. [Google Scholar] [CrossRef]
- Wang, X.; Wahl, R. Responses of the Insulin Signaling Pathways in the Brown Adipose Tissue of Rats Following Cold Exposure. PLoS ONE 2014, 9, e99772. [Google Scholar] [CrossRef]
- Dallner, O.S.; Chernogubova, E.; Brolinson, K.A.; Bengtsson, T. Beta3-Adrenergic Receptors Stimulate Glucose Uptake in Brown Adipocytes by Two Mechanisms Independently of Glucose Transporter 4 Translocation. Endocrinology 2006, 147, 5730–5739. [Google Scholar] [CrossRef]
- Gasparetti, A.L.; Alvarez-Rojas, F.; de Araujo, E.P.; Hirata, A.E.; Saad, M.J.; Velloso, L.A. Beta3-Adrenergic-Dependent and -Independent Mechanisms Participate in Cold-Induced Modulation of Insulin Signal Transduction in Brown Adipose Tissue of Rats. Pflugers Arch. 2005, 449, 537–546. [Google Scholar] [CrossRef] [PubMed]
- Clayton, Z.S.; McCurdy, C.E. Short-Term Thermoneutral Housing Alters Glucose Metabolism and Markers of Adipose Tissue Browning in Response to a High-Fat Diet in Lean Mice. Am. J. Physiol. Regul. Integr. Comp. Physiol. 2018, 315, R627–R637. [Google Scholar] [CrossRef] [PubMed]


Disclaimer/Publisher’s Note: The statements, opinions and data contained in all publications are solely those of the individual author(s) and contributor(s) and not of MDPI and/or the editor(s). MDPI and/or the editor(s) disclaim responsibility for any injury to people or property resulting from any ideas, methods, instructions or products referred to in the content. |
© 2023 by the authors. Licensee MDPI, Basel, Switzerland. This article is an open access article distributed under the terms and conditions of the Creative Commons Attribution (CC BY) license (https://creativecommons.org/licenses/by/4.0/).
Share and Cite
Kesić, M.; Baković, P.; Farkaš, V.; Bagarić, R.; Kolarić, D.; Štefulj, J.; Čičin-Šain, L. Constitutive Serotonin Tone as a Modulator of Brown Adipose Tissue Thermogenesis: A Rat Study. Life 2023, 13, 1436. https://doi.org/10.3390/life13071436
Kesić M, Baković P, Farkaš V, Bagarić R, Kolarić D, Štefulj J, Čičin-Šain L. Constitutive Serotonin Tone as a Modulator of Brown Adipose Tissue Thermogenesis: A Rat Study. Life. 2023; 13(7):1436. https://doi.org/10.3390/life13071436
Chicago/Turabian StyleKesić, Maja, Petra Baković, Vladimir Farkaš, Robert Bagarić, Darko Kolarić, Jasminka Štefulj, and Lipa Čičin-Šain. 2023. "Constitutive Serotonin Tone as a Modulator of Brown Adipose Tissue Thermogenesis: A Rat Study" Life 13, no. 7: 1436. https://doi.org/10.3390/life13071436
APA StyleKesić, M., Baković, P., Farkaš, V., Bagarić, R., Kolarić, D., Štefulj, J., & Čičin-Šain, L. (2023). Constitutive Serotonin Tone as a Modulator of Brown Adipose Tissue Thermogenesis: A Rat Study. Life, 13(7), 1436. https://doi.org/10.3390/life13071436