
Effects of Home-Based Exercise Training on Cardiac Autonomic Neuropathy and Metabolic Profile in Diabetic Hemodialysis Patients

 ,
,  ,
, 
 , , , and
Abstract
1. Introduction
2. Materials and Methods
2.1. Patients
2.2. Study Design
2.3. Charlson Comorbidity Index
2.4. Blood Analysis Assessment
2.5. Cardiopulmonary Exercise Testing
2.6. 24-H Electrocardiographic Monitoring
2.7. Exercise Training Program
2.8. Statistical Analysis
3. Results
3.1. Patients’ Characteristics
3.2. Blood Analysis
3.3. Cardiorespiratory Fitness
3.4. 24-H Holter Monitoring
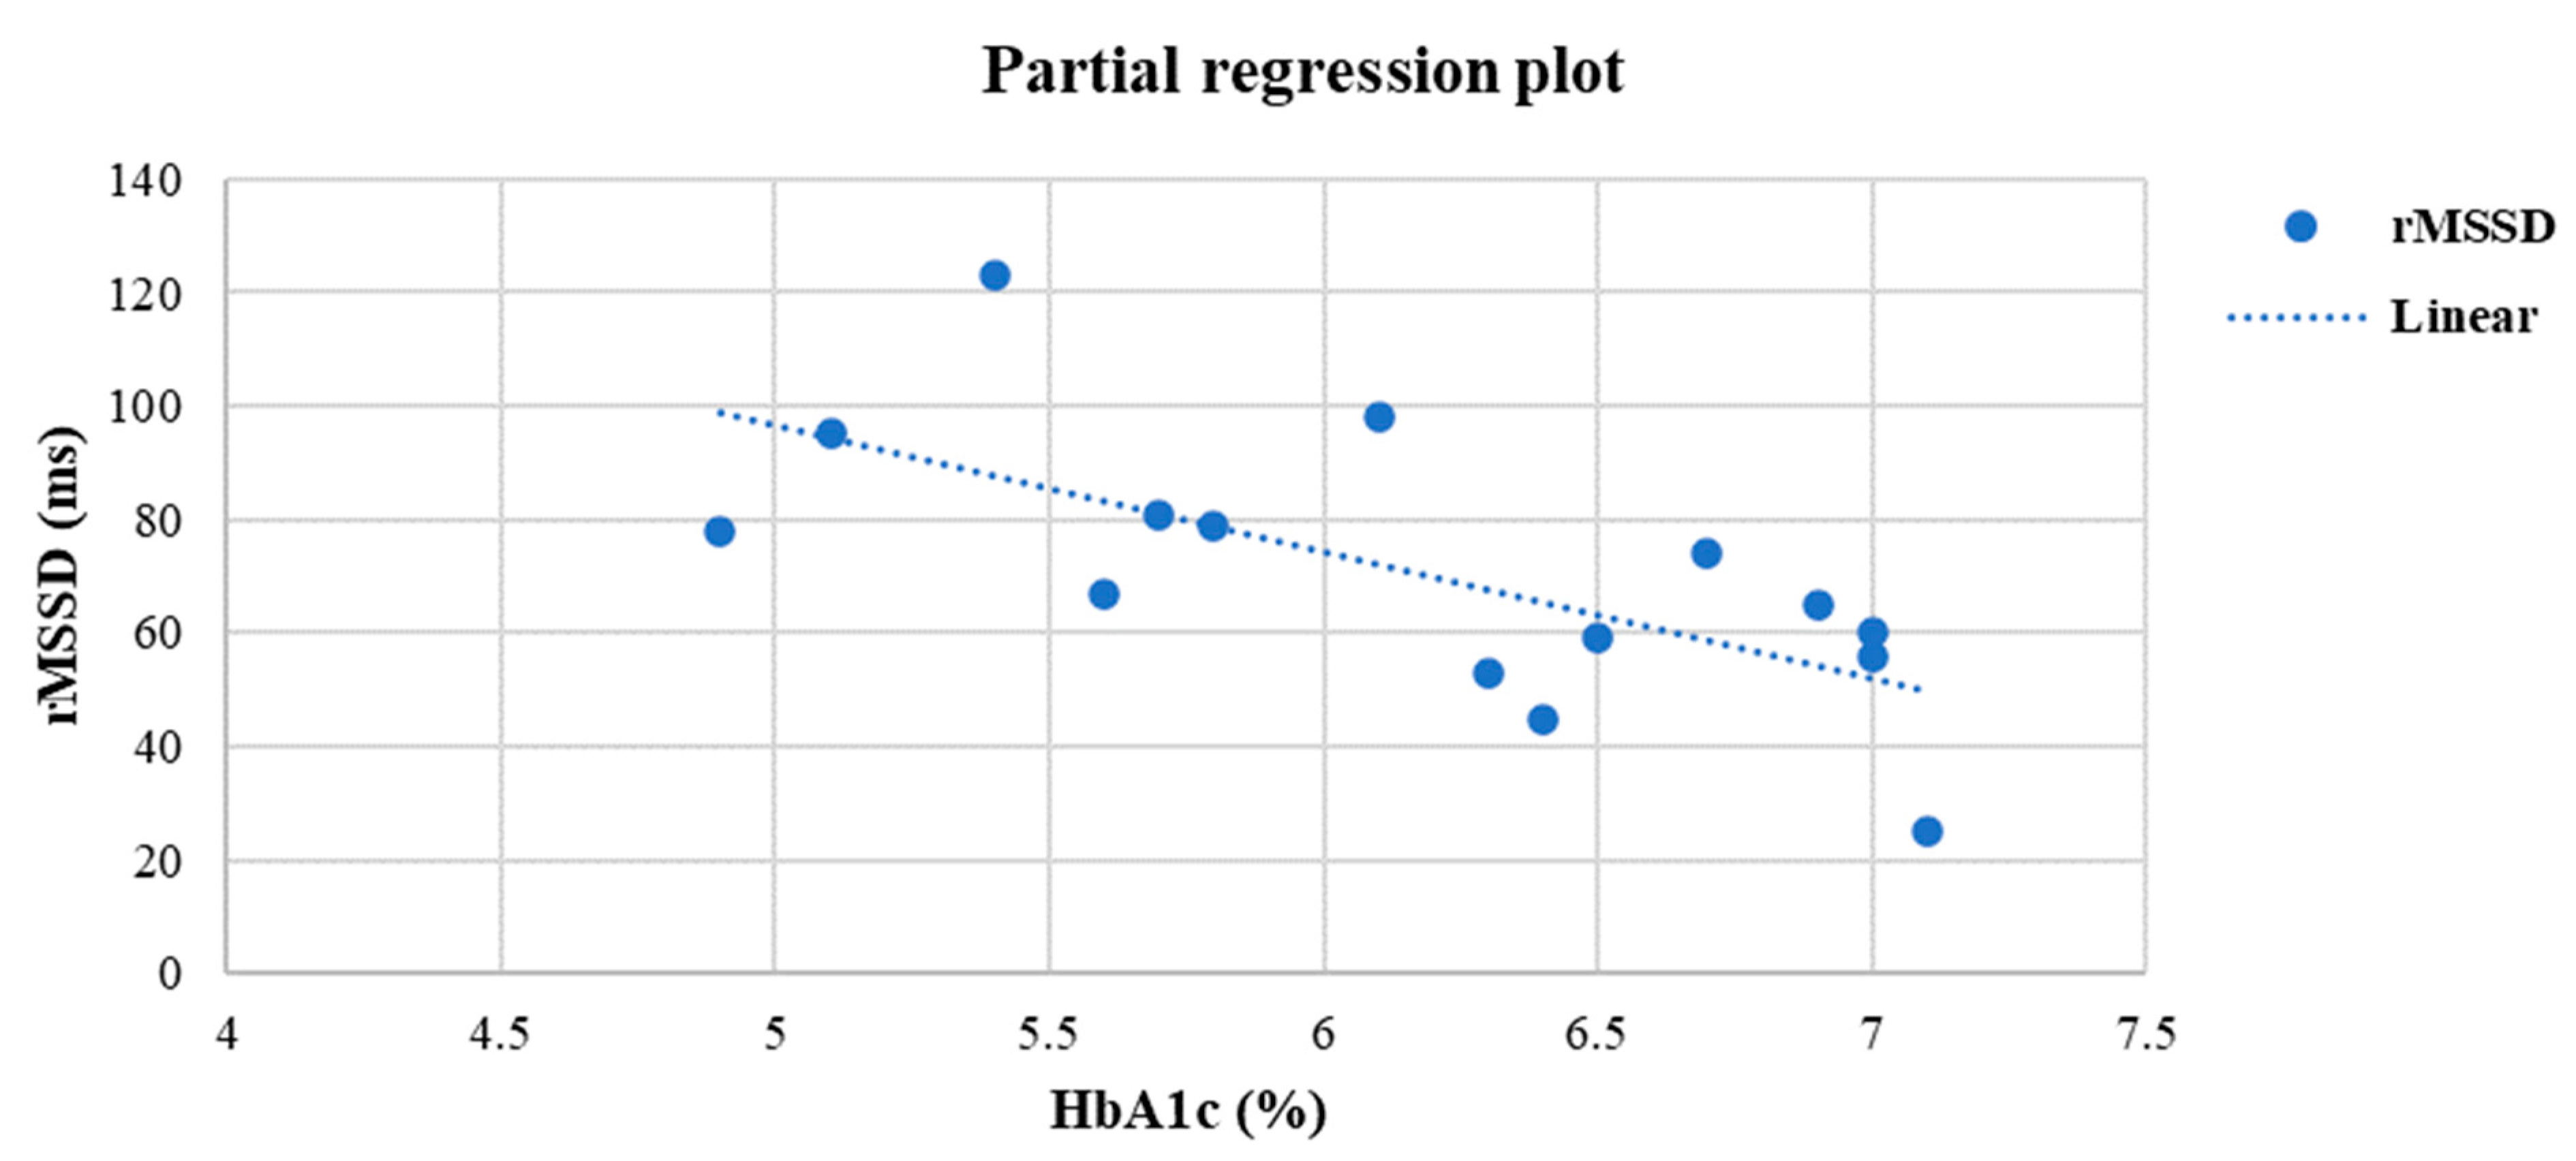
3.5. Linear Regression Analysis
3.6. Multiple Linear Regression Analysis
4. Discussion
5. Conclusions
Author Contributions
Funding
Institutional Review Board Statement
Informed Consent Statement
Data Availability Statement
Conflicts of Interest
References
- Pop-Busui, R.; Boulton, A.J.M.; Feldman, E.L.; Bril, V.; Freeman, R.; Malik, R.A.; Sosenko, J.M.; Ziegler, D. Diabetic Neuropathy: A Position Statement by the American Diabetes Association. Diabetes Care 2017, 40, 136–154. [Google Scholar] [CrossRef] [PubMed]
- Yun, J.-S.; Ahn, Y.-B.; Song, K.-H.; Yoo, K.-D.; Kim, H.-W.; Park, Y.-M.; Ko, S.-H. The association between abnormal heart rate variability and new onset of chronic kidney disease in patients with type 2 diabetes: A ten-year follow-up study. Diabetes Res. Clin. Pract. 2015, 108, 31–37. [Google Scholar] [CrossRef] [PubMed]
- Agashe, S.; Petak, S. Cardiac Autonomic Neuropathy in Diabetes Mellitus. Methodist Debakey Cardiovasc. J. 2018, 14, 251. [Google Scholar] [CrossRef]
- Dimitropoulos, G. Cardiac autonomic neuropathy in patients with diabetes mellitus. World J. Diabetes 2014, 5, 17. [Google Scholar] [CrossRef] [PubMed]
- Vinik, A.I.; Erbas, T. Cardiovascular autonomic neuropathy: Diagnosis and management. Curr. Diabetes Rep. 2006, 6, 424–430. [Google Scholar] [CrossRef]
- Laursen, J.C.; Rasmussen, I.K.B.; Zobel, E.H.; Hasbak, P.; von Scholten, B.J.; Holmvang, L.; Hansen, T.W. The Association Between Cardiovascular Autonomic Function and Changes in Kidney and Myocardial Function in Type 2 Diabetes and Healthy Controls. Front. Endocrinol. 2021, 12, 780679. [Google Scholar] [CrossRef]
- Perkovic, V.; Heerspink, H.L.; Chalmers, J.; Woodward, M.; Jun, M.; Li, Q.; MacMahon, S.; Cooper, M.E.; Hamet, P.; Marre, M.; et al. Intensive glucose control improves kidney outcomes in patients with type 2 diabetes. Kidney Int. 2013, 83, 517–523. [Google Scholar] [CrossRef]
- Lim, A. Diabetic nephropathy & complications and treatment. Int. J. Nephrol. Renov. Dis. 2014, 7, 361. [Google Scholar]
- Cai, Z.; Yang, Y.; Zhang, J. Effects of physical activity on the progression of diabetic nephropathy: A meta-analysis. Biosci. Rep. 2021, 41, BSR20203624. [Google Scholar] [CrossRef]
- Neveen, A.R.A.; Nesreen, E.N.G.; Nadia, M.K.; al Shaimaa, G.M. Effect of intradialytic aerobic exercise on patients with diabetic nephropathy. Bull. Fac. Phys. Ther. 2019, 24, 1–7. [Google Scholar] [CrossRef]
- Huppertz, N.; Beetham, K.S.; Howden, E.J.; Leicht, A.S.; Isbel, N.M.; Coombes, J.S. A 12-month lifestyle intervention does not improve cardiac autonomic function in patients with chronic kidney disease. Auton. Neurosci. 2020, 224, 102642. [Google Scholar] [CrossRef] [PubMed]
- Reboredo, M.d.M.; Pinheiro, B.d.V.; Neder, J.A.; Ávila, M.P.W.; Araujo, E.; Ribeiro, M.L.d.B.; de Mendonça, A.F. Effects of aerobic training during hemodialysis on heart rate variability and left ventricular function in end-stage renal disease patients. J. Br. Nefrol. 2010, 32, 367–373. [Google Scholar]
- Charlson, M.E.; Carrozzino, D.; Guidi, J.; Patierno, C. Charlson Comorbidity Index: A Critical Review of Clinimetric Properties. Psychother. Psychosom. 2022, 91, 8–35. [Google Scholar] [CrossRef] [PubMed]
- Fraccaro, P.; Kontopantelis, E.; Sperrin, M.; Peek, N.; Mallen, C.; Urban, P.; Buchan, I.E.; Mamas, M.A. Predicting mortality from change-over-time in the Charlson Comorbidity Index. Medicine 2016, 95, e4973. [Google Scholar] [CrossRef]
- Quan, H.; Li, B.; Couris, C.M.; Fushimi, K.; Graham, P.; Hider, P.; Januel, J.-M.; Sundararajan, V. Updating and Validating the Charlson Comorbidity Index and Score for Risk Adjustment in Hospital Discharge Abstracts Using Data From 6 Countries. Am. J. Epidemiol. 2011, 173, 676–682. [Google Scholar] [CrossRef]
- Huang, Y.-Q.; Gou, R.; Diao, Y.-S.; Yin, Q.-H.; Fan, W.-X.; Liang, Y.-P.; Chen, Y.; Wu, M.; Zang, L.; Li, L.; et al. Charlson comorbidity index helps predict the risk of mortality for patients with type 2 diabetic nephropathy. J. Zhejiang Univ. Sci. B 2014, 15, 58–66. [Google Scholar] [CrossRef]
- Nerlekar, N.; Mulley, W.; Rehmani, H.; Ramkumar, S.; Cheng, K.; Vasanthakumar, S.A.; Mottram, P.M. Feasibility of exercise stress echocardiography for cardiac risk assessment in chronic kidney disease patients prior to renal transplantation. Clin. Transplant. 2016, 30, 1209–1215. [Google Scholar] [CrossRef]
- Bhati, P.; Shenoy, S.; Hussain, M.E. Exercise training and cardiac autonomic function in type 2 diabetes mellitus: A systematic review. Diabetes Metab. Syndr. Clin. Res. Rev. 2018, 12, 69–78. [Google Scholar]
- Chowdhary, S.; Townend, J.N. Role of nitric oxide in the regulation of cardiovascular autonomic control. Clin. Sci. 1999, 97, 5–17. [Google Scholar] [CrossRef]
- Townend, J.N.; Al-Ani, M.; West, J.N.; Littler, W.A.; Coote, J.H. Modulation of Cardiac Autonomic Control in Humans by Angiotensin II. Hypertension 1995, 25, 1270–1275. [Google Scholar] [CrossRef]
- Buch, A.N.; Coote, J.H.; Townend, J.N. Mortality, cardiac vagal control and physical training—What’s the link? Exp. Physiol. 2002, 87, 423–435. [Google Scholar] [CrossRef] [PubMed]
- Gourine, A.V.; Ackland, G.L. Cardiac Vagus and Exercise. Physiology 2019, 34, 71–80. [Google Scholar] [CrossRef] [PubMed]
- Cole, C.R.; Blackstone, E.H.; Pashkow, F.J.; Snader, C.E.; Lauer, M.S. Heart-Rate Recovery Immediately after Exercise as a Predictor of Mortality. N. Engl. J. Med. 1999, 341, 1351–1357. [Google Scholar] [CrossRef] [PubMed]
- Cole, C.R.; Foody, J.M.; Blackstone, E.H.; Lauer, M.S. Heart Rate Recovery after Submaximal Exercise Testing as a Predictor of Mortality in a Cardiovascularly Healthy Cohort. Ann. Intern. Med. 2000, 132, 552. [Google Scholar] [CrossRef] [PubMed]
- Myers, J.; Handley, D.; Oswald, U.; Bruner, K.; Kottman, W.; Hsu, L.; Dubach, P. Effects of exercise training on heart rate recovery in patients with chronic heart failure. Am. Heart J. 2007, 153, 1056–1063. [Google Scholar] [CrossRef]
- Pearson, M.J.; Smart, N.A. Exercise therapy and autonomic function in heart failure patients: A systematic review and meta-analysis. Heart Fail Rev. 2018, 23, 91–108. [Google Scholar] [CrossRef]
- Task Force of the European Society of Cardiology and the North American Society of Pacing Electrophysiology. Heart Rate Variability. Standards of Measurement, Physiological Interpretation, and Clinical Use. Circulation 1996, 93, 1043–1065. [Google Scholar] [CrossRef]
- Bonete, G.; Dias, B.A.L.; Leandro, D.A.; Fernandes, A.T.N.; Pereira, C.H.; Ribeiro, C.T.D.; Sousa, A.G.P.; Resqueti, V.; Fregonezi, G.A.F.; Dias, F.A.L. Impaired heart rate variability, Valsalva and 30:15 ratio indexes are associated with reduced submaximal exercise capacity in subjects with diabetes mellitus. Diabetes Res. Clin. Pract. 2019, 155, 107813. [Google Scholar] [CrossRef]
- Kleiger, R.E.; Miller, J.P.; Bigger, J.T.; Moss, A.J. Decreased heart rate variability and its association with increased mortality after acute myocardial infarction. Am. J. Cardiol. 1987, 59, 256–262. [Google Scholar] [CrossRef]
- Pagkalos, M.; Koutlianos, N.; Kouidi, E.; Pagkalos, E.; Mandroukas, K.; Deligiannis, A. Heart rate variability modifications following exercise training in type 2 diabetic patients with definite cardiac autonomic neuropathy. Br. J. Sports Med. 2007, 42, 47–54. [Google Scholar] [CrossRef]
- Piralaiy, E.; Siahkuhian, M.; Nikookheslat, S.D.; Pescatello, L.S.; Sheikhalizadeh, M.; Khani, M. Cardiac Autonomic Modulation in Response to Three Types of Exercise in Patients with Type 2 Diabetic Neuropathy. J. Diabetes Metab. Disord. 2021, 20, 1469–1478. [Google Scholar] [CrossRef] [PubMed]
- Deligiannis, A.; Kouidi, E.; Tourkantonis, A. Effects of physical training on heart rate variability in patients on hemodialysis. Am. J. Cardiol. 1999, 84, 197–202. [Google Scholar] [CrossRef] [PubMed]
- Kouidi, E.J.; Grekas, D.M.; Deligiannis, A.P. Effects of Exercise Training on Noninvasive Cardiac Measures in Patients Undergoing Long-term Hemodialysis: A Randomized Controlled Trial. Am. J. Kidney Dis. 2009, 54, 511–521. [Google Scholar] [CrossRef] [PubMed]
- Kouidi, E.; Karagiannis, V.; Grekas, D.; Iakovides, A.; Kaprinis, G.; Tourkantonis, A.; Deligiannis, A. Depression, heart rate variability, and exercise training in dialysis patients. Eur. J. Cardiovasc. Prev. Rehabil. 2010, 17, 160–167. [Google Scholar] [CrossRef]
- Morais, M.J.d.D.; de Abreu, L.C.; de Oliveira, F.S.; Bezerra, I.M.P.; Raimundo, R.D.; Silva, R.P.M. Is aerobic exercise training during hemodialysis a reliable intervention for autonomic dysfunction in individuals with chronic kidney disease? A prospective longitudinal clinical trial. J. Multidiscip. Healthc. 2019, 12, 711–718. [Google Scholar] [CrossRef] [PubMed]
- Wooton, A.K.; Melchior, L. Diabetes-associated cardiac autonomic neuropathy. Nurse Pract. 2020, 45, 24–31. [Google Scholar] [CrossRef]
- Calvo, C.; Maule, S.; Mecca, F.; Quadri, R.; Martina, G.; Perin, P.C. The influence of autonomic neuropathy on hypotension during hemodialysis. Clin. Auton. Res. 2002, 12, 84–87. [Google Scholar] [CrossRef] [PubMed]
- Watanabe, M.A.; Schmidt, G. Heart rate turbulence: A 5-year review. Heart Rhythm 2004, 1, 732–738. [Google Scholar] [CrossRef]
- Lin, K.; Wei, L.; Huang, Z.; Zeng, Q. Combination of Ewing test, heart rate variability, and heart rate turbulence analysis for early diagnosis of diabetic cardiac autonomic neuropathy. Medicine 2017, 96, e8296. [Google Scholar] [CrossRef]
- Disertori, M.; Masè, M.; Rigoni, M.; Nollo, G.; Ravelli, F. Heart Rate Turbulence Is a Powerful Predictor of Cardiac Death and Ventricular Arrhythmias in Postmyocardial Infarction and Heart Failure Patients. Circ. Arrhythm. Electrophysiol. 2016, 9, e004610. [Google Scholar] [CrossRef] [PubMed]
- Myers, J.; Chan, K.; Chen, Y.; Lit, Y.; Patti, A.; Massaband, P.; Kiratli, B.J.; Tamura, M.; Chertow, G.M.; Rabkin, R. Effect of a Home-Based Exercise Program on Indices of Physical Function and Quality of Life in Elderly Maintenance Hemodialysis Patients. Kidney Blood Press. Res. 2021, 46, 196–206. [Google Scholar] [CrossRef] [PubMed]
- Baggetta, R.; on behalf of the EXCITE Working group; D’Arrigo, G.; Torino, C.; ElHafeez, S.A.; Manfredini, F.; Mallamaci, F.; Zoccali, C.; Tripepi, G. Effect of a home based, low intensity, physical exercise program in older adults dialysis patients: A secondary analysis of the EXCITE trial. BMC Geriatr. 2018, 18, 248. [Google Scholar] [CrossRef] [PubMed]
- De Villar, L.O.P.; Martínez-Olmos, F.J.; Pérez-Domínguez, F.d.B.; Benavent-Caballer, V.; Montañez-Aguilera, F.J.; Mercer, T.; Segura-Orti, E. Comparison of intradialytic versus home-based exercise programs on physical functioning, physical activity level, adherence, and health-related quality of life: Pilot study. Sci. Rep. 2020, 10, 8302. [Google Scholar] [CrossRef] [PubMed]
- Muscella, A.; Stefàno, E.; Marsigliante, S. The effects of exercise training on lipid metabolism and coronary heart disease. Am. J. Physiol. Heart Circ. Physiol. 2020, 319, H76–H88. [Google Scholar] [CrossRef]
- Sanavi, S.; Afshar, R.; Shegarfy, L.; Shavandi, N. Effects of aerobic exercise and resistance training on lipid profiles and inflammation status in patients on maintenance hemodialysis. Indian J. Nephrol. 2010, 20, 185. [Google Scholar] [CrossRef] [PubMed]
- Song, W.J.; Sohng, K.Y. Effects of Progressive Resistance Training on Body Composition, Physical Fitness and Quality of Life of Patients on Hemodialysis. J. Korean Acad. Nurs. 2012, 42, 947. [Google Scholar] [CrossRef] [PubMed]
- Torres, E.; Aragoncillo, I.; Moreno, J.; Vega, A.; Abad, S.; García-Prieto, A.; Macias, N.; Hernandez, A.; Godino, M.T.; Luño, J. Exercise training during hemodialysis sessions: Physical and biochemical benefits. Ther. Apher. Dial. 2020, 24, 648–654. [Google Scholar] [CrossRef]
- Meher, M.; Panda, J.K. Impact of glycemic control over cardiac autonomic neuropathy. J. Diabetes Metab. Disord. 2020, 19, 1339–1344. [Google Scholar] [CrossRef]
- Loimaala, A.; Huikuri, H.V.; Kööbi, T.; Rinne, M.; Nenonen, A.; Vuori, I. Exercise Training Improves Baroreflex Sensitivity in Type 2 Diabetes. Diabetes 2003, 52, 1837–1842. [Google Scholar] [CrossRef]
- Achmad, C.; Lim, N.S.; Pramudyo, M.; Iqbal, M.; Karwiky, G.; Febrianora, M.; Natalia, N. Relation Between Glycemic Control and Cardiac Autonomic Neuropathy in Patients with Diabetes Mellitus Type 2. Curr. Probl. Cardiol. 2022, 101135. [Google Scholar] [CrossRef]
- Ng, C.H.; Ong, Z.H.; Sran, H.K.; Wee, T.B. Comparison of cardiovascular mortality in hemodialysis versus peritoneal dialysis. Int. Urol. Nephrol. 2021, 53, 1363–1371. [Google Scholar] [CrossRef] [PubMed]
- Wild, S.; Roglic, G.; Green, A.; Sicree, R.; King, H. Global Prevalence of Diabetes. Diabetes Care 2004, 27, 1047–1053. [Google Scholar] [CrossRef]
- Mascia, G.; Crotti, L.; Groppelli, A.; Canepa, M.; Merlo, A.C.; Benenati, S.; Michele, P. Syncope in hypertrophic cardiomyopathy (part I): An updated systematic review and meta-analysis. Int. J. Cardiol. 2022, 357, 88–94. [Google Scholar] [CrossRef]
- Krahn, A.D.; Wilde, A.A.M.; Calkins, H.; la Gerche, A.; Cadrin-Tourigny, J.; Roberts, J.D. Arrhythmogenic Right Ventricular Cardiomyopathy. JACC Clin. Electrophysiol. 2022, 8, 533–553. [Google Scholar] [CrossRef]
- Mohananey, A.; Tseng, A.S.; Julakanti, R.R.; Gonzalez-Bonilla, H.M.; Kruisselbrink, T.; Prochnow, C.; Rodman, S.; Lin, G.; Redfield, M.M.; Rosenbaum, A.N.; et al. An intervention strategy to improve genetic testing for dilated cardiomyopathy in a heart failure clinic. Genet. Med. 2022, 100341. [Google Scholar] [CrossRef] [PubMed]
- Lin, Y.S.; Chen, T.H.; Lin, M.S.; Chen, D.Y.; Mao, C.T.; Hsu, J.T.; Chen, M.C. Impact of Chronic Kidney Disease on Short-Term Cardiac Implantable Electronic Device Related Infection. Medicine 2016, 95, e2587. [Google Scholar] [CrossRef] [PubMed]
- Fumagalli, S.; Pieragnoli, P.; Haugaa, K.H.; Potpara, T.S.; Rasero, L.; Ramacciati, N.; Ricciardi, G.; Solimene, F.; Mascia, G.; Mascioli, G.; et al. The influence of age on the psychological profile of patients with cardiac implantable electronic devices: Results from the Italian population in a multicenter study conducted by the European Heart Rhythm Association. Aging Clin. Exp. Res. 2019, 31, 1219–1226. [Google Scholar] [CrossRef]


| EX Group | CO Group | p-Value | |
|---|---|---|---|
| Medication at home | |||
| Calcium channel inhibitors | 6 (40.00%) | 5 (38.46%) | p = 0.75 |
| Antidiabetic drugs (per os) | 4 (26.66%) | 4 (30.76%) | p = 0.84 |
| Beta-adrenergic blockers | 4 (26.66%) | 4 (30.76%) | p = 0.82 |
| Slow and/or intermediate-acting insulin | 13 (86.66%) | 12 (92.30%) | p = 0.76 |
| Corticosteroids | 2 (13.33%) | 1 (7.69%) | p = 0.73 |
| Lipid-lowering drugs | 8 (53.33%) | 9 (69.23%) | p = 0.77 |
| Diuretics | 4 (26.66%) | 3 (23.07%) | p = 0.80 |
| Antithrombotic agents | 4 (26.66%) | 4 (30.76%) | p = 0.92 |
| Antihypertensive agents acting on the renin-angiotensin system | 10 (66.66%) | 9 (69.23%) | p = 0.81 |
| Other | 2 (13.33%) | 1 (7.69%) | p = 0.79 |
| Medication during hemodialysis sessions | |||
| Erythropoietin | 14 (93.33%) | 12 (92.30%) | p = 0.56 |
| Levocarnitine | 14 (93.33%) | 13 (100.00%) | p = 0.85 |
| Analogues of vitamin D, Paricalcitol | 12 (80.00%) | 10 (76.92%) | p = 0.61 |
| Vitamin complexes | 7 (46.66%) | 5 (38.46%) | p = 0.59 |
| Other | 2 (13.33%) | 3 (23.07%) | p = 0.82 |
| EX Group (n = 15) | CO Group (n = 13) | p-Value | |
|---|---|---|---|
| Sex (male/female) | 10/5 | 7/6 | p = 0.51 |
| Age (years) | 62.06 ± 6.34 | 63.30 ± 8.50 | p = 0.66 |
| Employment status | |||
| Employed | 3 (20.00%) | 2 (15.39%) | p = 0.76 |
| Unemployed | 2 (13.33%) | 2 (15.39%) | p = 0.93 |
| Retired | 10 (66.66%) | 9 (69.23%) | p = 0.81 |
| HD vintage (years) | 6.53 ± 5.70 | 4.70 ± 3.17 | p = 0.31 |
| Dry weight (kg) | 78.80 ± 17.34 | 79.38 ± 15.01 | p = 0.92 |
| BMI (kg/m2) | 28.28 ± 6.22 | 29.05 ± 5.71 | p = 0.73 |
| Dialysis access | |||
| Arteriovenous fistula or graft | 9 (60.00%) | 5 (38.46%) | p = 0.27 |
| Central venous catheter | 6 (40.00%) | 8 (61.54%) | p = 0.45 |
| Previous transplantation | |||
| Yes | 3 (20.00%) | 2 (15.39%) | p = 0.76 |
| No | 12 (80.00%) | 11 (84.61%) | p = 0.76 |
| Primary causes of ESKD | |||
| Diabetes mellitus | 7 (46.66%) | 6 (46.15%) | p = 0.77 |
| Hypertension | 5 (33.33%) | 3 (23.07%) | p = 0.81 |
| Glomerulonephritis | 2 (13.33%) | 2 (15.38%) | p = 0.79 |
| Other | 1 (6.66%) | 2 (15.38%) | p = 0.73 |
| CCΙ | 7.20 ± 1.78 | 7.15 ± 1.67 | p = 0.94 |
| Comorbidities | |||
| Hypertension | 7 (46.66%) | 6 (46.15%) | p = 0.64 |
| Dyslipidemia | 2 (13.33%) | 2 (15.38%) | p = 0.91 |
| Hypothyroidism | 0 (0.00%) | 1 (7.69%) | p = 0.84 |
| Diabetic retinopathy | 2 (13.33%) | 1 (7.69%) | p = 0.71 |
| Peripheral neuropathy | 1 (6.66%) | 0 (0.00%) | p = 0.83 |
| Multiple myeloma | 0 (0.00% | 1 (7.69%) | p = 0.82 |
| Secondary hyperthyroidism | 1 (6.66%) | 1 (7.69%) | p = 0.95 |
| Venous insufficiency | 2 (13.33%) | 2 (15.38%) | p = 0.92 |
| Mitral valve insufficiency | 1 (6.66%) | 0 (0.00%) | p = 0.82 |
| Varicose veins | 1 (6.66%) | 0 (0.00%) | p = 0.82 |
| Osteoporosis | 0 (0.00%) | 1 (7.69%) | p = 0.84 |
| COPD | 1 (6.66%) | 0 (0.00%) | p = 0.82 |
| Other | 1 (6.66%) | 0 (0.00%) | p = 0.85 |
| EX Group | CO Group | EX vs. CO Group | ||||||||||
|---|---|---|---|---|---|---|---|---|---|---|---|---|
| Baseline | After 6-Months | p-Value | Intra-Observer Variability ICC (95% CI) | Baseline | After 6-Months | p-Value | Intra-Observer Variability ICC (95% CI) | Pre | Inter-Observer Variability ICC (95% CI) | Post | Inter-Observer Variability ICC (95% CI) | |
| Hematocrit (%) | 35.86 ± 3.28 | 36.22 ± 3.54 | p = 0.19 | 0.97 (0.93/0.99) | 36.13 ± 2.39 | 36.35 ± 2.23 | p = 0.31 | 0.78 (0.55/0.99) | p = 0.80 | 0.41 (−1.06/0.76) | p = 0.78 | 0.21 (−1.57/0.76) |
| Hemoglobin (g/dL) | 11.61 ± 0.85 | 11.80 ± 1.35 | p = 0.38 | 0.85 (0.56/0.95) | 11.68 ± 0.68 | 11.73 ± 0.76 | p = 0.55 | 0.90 (0.69/0.97) | p = 0.81 | −0.75 (−4.75/0.46) | p = 0.73 | −1.00 (−5.56/0.38) |
| Na+ (mg/dL) | 138.46 ± 2.47 | 138.53 ± 3.06 | p = 0.68 | 0.93 (0.77/0.97) | 137.84 ± 4.77 | 137.85 ± 4.48 | p = 0.94 | 0.93 (0.77/0.97) | p = 0.66 | −1.11 (−5.92/0.35) | p = 0.61 | −0.41 (−3.64/0.56) |
| Κ+ (mg/dL) | 5.18 ± 0.71 | 5.16 ± 0.54 | p = 0.71 | 0.87 (0.61/0.95) | 5.04 ± 0.57 | 5.07 ± 0.55 | p = 0.69 | 0.78 (0.28/0.93) | p = 0.57 | 0.04 (−2.12/0.70) | p = 0.52 | 0.41 (−0.91/0.82) |
| Ca+ (mg/dL) | 8.81 ± 0.71 | 8.94 ± 0.74 | p = 0.66 | 0.81 (0.44/0.93) | 8.67 ± 0.83 | 8.52 ± 0.91 | p = 0.27 | 0.95 (0.84/0.98) | p = 0.64 | −0.60 (−4.24/0.51) | p = 0.65 | 0.009 (−2.24/0.69) |
| p (mg/dL) | 4.88 ± 1.07 | 4.82 ± 1.03 | p = 0.72 | 0.99 (0.97/0.99) | 5.00 ± 0.59 | 4.90 ± 0.51 | p = 0.50 | 0.66 (0.45/0.84) | p = 0.72 | 0.12 (−1.87/0.73) | p = 0.77 | 0.22 (−1.52/0.76) |
| Mg+ (mg/dL) | 2.01 ± 0.14 | 2.04 ± 0.11 | p = 0.54 | 0.94 (0.82/0.98) | 2.02 ± 0.22 | 2.03 ± 0.18 | p = 0.84 | 0.85 (0.53/0.95) | p = 0.89 | 0.35 (−1.11/0.80) | p = 0.95 | 0.58 (−0.34/0.87) |
| Fe+ (mg/dL) | 72.73 ± 10.40 | 72.53 ± 10.82 | p = 0.97 | 0.74 (0.63/0.98) | 72.84 ± 11.48 | 72.92 ± 11.60 | p = 0.76 | 0.82 (0.43/0.94) | p = 0.79 | −0.14 (−2.74/0.65) | p = 0.44 | 0.53 (−0.53/0.85) |
| Urea (mg/dL) | 136.20 ± 24.83 | 136.40 ± 15.20 | p = 0.81 | 0.41 (−0.73/0.80) | 136.84 ± 23.04 | 136.84 ± 20.49 | p = 0.98 | 0.38 (0.16/0.79) | p = 0.94 | 0.06 (−2.05/0.71) | p = 0.33 | −0.96 (−5.44/0.40) |
| Creatinine (mg/dL) | 7.32 ± 1.70 | 7.37 ± 1.84 | p = 0.68 | 0.85 (0.57/0.95) | 7.54 ± 1.65 | 7.58 ± 1.60 | p = 0.92 | 0.89 (0.64/0.96) | p = 0.72 | 0.65 (−0.13/0.89) | p = 0.16 | 0.55 (−0.46/0.86) |
| ALP (mg/dL) | 76.13 ± 11.10 | 75.93 ± 17.13 | p = 0.33 | 0.58 (−0.24/0.85) | 75.92 ± 9.66 | 75.69 ± 11.10 | p = 0.68 | 0.97 (0.92/0.99) | p = 0.95 | 0.59 (−0.32/0.87) | p = 0.68 | 0.47 (−0.71/0.84) |
| Uric acid (mg/dL) | 6.21 ± 0.57 | 6.11 ± 0.62 | p = 0.46 | 0.64 (−0.04/0.88) | 6.26 ± 0.88 | 6.26 ± 0.92 | p = 0.99 | 0.67 (−0.02/0.79) | p = 0.84 | 0.33 (−1.17/0.79) | p = 0.61 | −0.37 (−3.51/0.58) |
| Serum albumin (g/dL) | 5.02 ± 1.08 | 5.00 ± 1.03 | p = 0.75 | −0.15 (−2.44/0.61) | 4.99 ± 0.74 | 5.00 ± 0.64 | p = 0.91 | 0.79 (0.33/0.93) | p = 0.93 | 0.53 (−0.52/0.85) | p = 0.98 | −0.02 (−2.37/0.68) |
| SGOT (IU/L) | 15.46 ± 3.41 | 15.13 ± 3.66 | p = 0.82 | 0.94 (0.82/0.98) | 15.76 ± 6.32 | 15.69 ± 6.47 | p = 0.77 | 0.97 (0.92/0.99) | p = 0.87 | 0.16 (−1.73/0.74) | p = 0.38 | −1.07 (−5.79/0.36) |
| SGPT (IU/L) | 16.40 ± 3.88 | 16.46 ± 3.24 | p = 0.76 | 0.91 (0.73/0.97) | 15.84 ± 6.44 | 16.15 ± 5.47 | p = 0.23 | 0.96 (0.89/0.99) | p = 0.78 | 0.17 (−1.73/0.75) | p = 0.35 | −0.32 (−3.35/0.59) |
| FPG (mg/dL) | 144.73 ± 41.13 | 121.66 ± 36.28 | p < 0.05 | 0.95 (0.87/0.98) | 152.69 ± 60.55 | 151.76 ± 61.29 | p = 0.42 | 0.55 (0.10/0.79) | p = 0.65 | −1.07 (−5.79/0.36) | p = 0.20 | −1.22 (−6.30/0.32) |
| TC (mg/dL) | 239.40 ± 80.46 | 224.53 ± 84.05 | p = 0.04 | 0.82 (0.65/0.94) | 237.15 ± 95.69 | 237.15 ± 97.02 | p = 0.98 | 0.87 (0.76/0.98) | p = 0.94 | −0.05 (−2.44/0.68) | p = 0.79 | 0.08 (−2.00/0.72) |
| TG (mg/dL) | 191.06 ± 62.57 | 171.66 ± 40.12 | p = 0.01 | 0.92 (0.77/0.97) | 179.69 ± 53.11 | 179.84 ± 54.30 | p = 0.97 | 0.97 (0.93/0.99) | p = 0.61 | 0.57 (−0.41/0.86) | p = 0.53 | 0.30 (−1.27/0.78) |
| HDL (mg/dL) | 43.53 ± 20.02 | 56.00 ± 22.60 | p < 0.05 | 0.86 (0.58/0.96) | 44.07 ± 19.92 | 43.84 ± 19.87 | p = 0.78 | 0.89 (0.73/0.95) | p = 0.94 | 0.59 (0.33/0.96) | p = 0.01 | 0.86 (0.56/0.45) |
| LDL (mg/dL) | 102.93 ± 16.78 | 97.06 ± 15.07 | p = 0.06 | 0.58 (0.45/0.75) | 94.53 ± 22.45 | 94.92 ± 22.82 | p = 0.48 | 0.99 (0.99/0.99) | p = 0.26 | 0.89 (0.65/0.94) | p = 0.66 | −0.10 (−2.63/0.66) |
| HbA1c (%) | 6.85 ± 0.69 | 6.16 ± 0.70 | p < 0.05 | 0.86 (0.60/0.95) | 7.01 ± 1.20 | 7.04 ± 1.15 | p = 0.53 | 0.93 (0.84/0.98) | p = 0.67 | 0.04 (−2.12/0.70) | p = 0.04 | 0.007 (−2.04/0.71) |
| EX Group | CO Group | EX vs. CO Group | ||||||||||
|---|---|---|---|---|---|---|---|---|---|---|---|---|
| Baseline | After 6-Months | p-Value | Intra-Observer Variability ICC (95% CI) | Baseline | After 6-Months | p-Value | Intra-Observer Variability ICC (95% CI) | Pre | Inter-Observer Variability ICC (95% CI) | Post | Inter-Observer Variability ICC (95% CI) | |
| Time (min) | 6.45 ± 2.04 | 6.96 ± 1.73 | p = 0.03 | 0.94 (0.84/0.98) | 6.40 ± 1.24 | 6.43 ± 1.32 | p = 0.66 | 0.91(0.97/0.99) | p = 0.36 | 0.64 (−0.16/0.89) | p = 0.88 | 0.30 (−1.27/0.78) |
| METs (%pred) | 67.20 ± 4.79 | 70.53 ± 4.18 | p < 0.05 | 0.83 (0.50/0.94) | 67.00 ± 4.37 | 66.92 ± 5.04 | p = 0.89 | 0.94 (0.82/0.98) | p = 0.95 | 0.72 (0.009/0.91) | p = 0.04 | 0.66 (−0.10/0.89) |
| VO2peak (mL/kg/min) | 19.94 ± 2.13 | 21.90 ± 1.75 | p < 0.05 | 0.90 (0.72/0.96) | 19.80 ± 1.90 | 19.87 ± 1.87 | p = 0.40 | 0.98 (0.77/0.99) | p = 0.68 | 0.77 (0.25/0.93) | p < 0.05 | 0.76 (0.23/0.92) |
| RERmax | 1.12 ± 0.10 | 1.14 ± 0.09 | p = 0.54 | 0.79 (0.38/0.93) | 1.09 ± 0.07 | 1.09 ± 0.08 | p = 0.98 | 0.73 (0.44/0.98) | p = 0.41 | 0.37 (−1.04/0.81) | p = 0.51 | 0.44 (−1.01/0.78) |
| VO2/HRmax | 11.81 ± 1.88 | 11.90 ± 1.97 | p = 0.74 | 0.67 (0.21/0.88) | 11.59 ± 1.32 | 11.64 ± 1.26 | p = 0.50 | 0.96 (0.65/0.98) | p = 0.73 | 0.77 (0.26/0.93) | p = 0.36 | 0.72 (0.08/0.91) |
| VE/VO2max | 31.41 ± 4.46 | 29.67 ± 4.42 | p < 0.05 | 0.82 (0.45/0.95) | 31.63 ± 5.60 | 31.33 ± 5.27 | p = 0.22 | 0.77 (0.32/0.95) | p = 0.51 | 0.70 (0.04/0.91) | p = 0.24 | 0.75 (0.20/0.92) |
| VE/VCO2max | 35.77 ± 4.96 | 34.32 ± 5.07 | p = 0.01 | 0.76 (0.37/0.89) | 36.66 ± 7.75 | 36.32 ± 7.33 | p = 0.23 | 0.98 (0.94/0.99) | p = 0.14 | 0.77 (0.26/0.91) | p = 0.11 | 0.37 (−1.03/0.81) |
| HRrest (bpm) | 71.80 ± 8.24 | 69.60 ± 9.18 | p < 0.05 | 0.98 (0.96/0.99) | 73.69 ± 6.43 | 73.69 ± 5.99 | p = 0.99 | 0.97 (0.92/0.99) | p = 0.75 | 0.47 (−0.70/0.84) | p = 0.54 | 0.50 (0.01/0.89) |
| SBPrest (mmHg) | 124.53 ± 7.54 | 121.46 ± 8.09 | p = 0.03 | 0.87 (0.63/0.95) | 125.00 ± 5.00 | 125.61 ± 4.99 | p = 0.45 | 0.91 (0.70/0.97) | p = 0.31 | 0.27 (−1.37/0.77) | p = 0.04 | 0.75 (0.06/0.93) |
| DBPrest (mmHg) | 73.66 ± 8.12 | 71.66 ± 6.45 | p = 0.06 | 0.93 (0.80/0.97) | 74.23 ± 4.93 | 74.23 ± 4.93 | p = 0.98 | 0.95 (0.85/0.98) | p = 0.25 | −0.21 (−2.98/0.62) | p = 0.64 | 0.08 (−2.00/0.72) |
| HRmax (bpm) | 132.86 ± 15.58 | 139.46 ± 17.95 | p < 0.05 | 0.97 (0.91/0.99) | 131.46 ± 10.19 | 131.15 ± 8.90 | p = 0.64 | 0.88 (0.75/0.97) | p = 0.84 | 0.77 (0.27/0.93) | p = 0.04 | 0.65 (−0.14/0.89) |
| SBPmax (mmHg) | 163.33 ± 8.79 | 155.53 ± 12.18 | p < 0.05 | 0.78 (0.34/0.92) | 164.38 ± 8.89 | 164.23 ± 8.61 | p = 0.93 | 0.96 (0.89/0.99) | p = 0.42 | 0.68 (−2.05/0.71) | p = 0.03 | 0.11 (−1.89/0.73) |
| DBPmax (mmHg) | 73.66 ± 8.12 | 71.00 ± 8.28 | p = 0.01 | 0.94 (0.83/0.98) | 74.23 ± 6.72 | 74.23 ± 5.71 | p = 0.98 | 0.95 (0.87/0.97) | p = 0.93 | −0.09 (−2.59/0.66) | p = 0.98 | −1.07 (−5.78/0.36) |
| EX Group | CO Group | EX vs. CO Group | ||||||||||
|---|---|---|---|---|---|---|---|---|---|---|---|---|
| Baseline | After 6-Months | p-Value | Intra-Observer Variability ICC (95% CI) | Baseline | After 6-Months | p-Value | Intra-Observer Variability ICC (95% CI) | Pre | Inter-Observer Variability ICC (95% CI) | Post | Inter-Observer Variability ICC (95% CI) | |
| HRV | ||||||||||||
| HR (bpm) | 74.33 ± 12.31 | 73.13 ± 10.80 | p = 0.62 | 0.81 (0.43/0.93) | 73.30 ± 6.79 | 73.46 ± 5.99 | p = 0.67 | 0.99 (0.96/0.99) | p = 0.79 | −0.56 (−4.12/0.52) | p = 0.92 | −0.17 (−0.64/0.39) |
| TP (ms2) | 978.33 ± 388.51 | 1118.84 ± 446.64 | p = 0.04 | 0.90 (0.70/0.96) | 934.10 ± 403.79 | 935.48 ± 404.48 | p = 0.70 | 0.97 (0.89/0.99) | p = 0.77 | −0.22 (−0.67/0.35) | p = 0.27 | −0.71 (−4.62/0.47) |
| Mean 24-RR intervals (ms) | 842.74 ± 128.65 | 870.76 ± 118.27 | p = 0.19 | 0.91 (0.73/0.97) | 846.07 ± 83.94 | 847.30 ± 92.49 | p = 0.71 | 0.96 (0.92/0.99) | p = 0.93 | 0.04 (−0.50/0.56) | p = 0.56 | −0.42 (−3.65/0.56) |
| Time domain variables | ||||||||||||
| SDNN (ms) | 95.46 ± 15.02 | 126.40 ± 21.95 | p < 0.05 | 0.51 (−0.44/0.83) | 93.92 ± 37.99 | 94.11 ± 33.99 | p = 0.91 | 0.98 (0.95/0.99) | p = 0.88 | 0.08 (−2.00/0.72) | p = 0.03 | 0.78 (0.55/0.98) |
| SDANN (ms) | 73.60 ± 22.76 | 90.86 ± 27.05 | p = 0.02 | 0.78 (0.36/0.92) | 75.30 ± 20.54 | 74.61 ± 20.03 | p = 0.70 | 0.97 (0.91/0.99) | p = 0.83 | 0.11 (−1.91/0.72) | p = 0.17 | 0.26 (−1.39/0.77) |
| rMSSD (ms) | 55.06 ± 25.92 | 70.53 ± 23.73 | p < 0.05 | 0.88 (0.66/0.96) | 55.76 ± 13.26 | 55.30 ± 10.16 | p = 0.72 | 0.97 (0.90/0.98) | p = 0.93 | 0.05 (−0.48/0.57) | p = 0.02 | 0.61 (−1.58/0.75) |
| pNN50 (%) | 8.66 ± 7.20 | 12.20 ± 11.16 | p = 0.04 | 0.91 (0.75/0.97) | 8.07 ± 7.52 | 8.07 ± 7.87 | p = 0.99 | 0.99 (0.97/0.99) | p = 0.86 | 0.45 (−0.80/0.83) | p = 0.02 | 0.65 (0.11/0.78) |
| Frequency domain variables | ||||||||||||
| VLF (ms2) | 1460.84 ± 950.48 | 1550.40 ± 1331.76 | p = 0.87 | −0.02 (−1.97/0.78) | 1501.31 ± 1152.81 | 1526.73 ± 1148.43 | p = 0.67 | 0.92 (0.76/0.97) | p = 0.86 | 0.29 (−0.28/0.71) | p = 0.39 | 0.11 (−0.44/0.61) |
| LF (ms2) | 155.53 ± 53.91 | 108.28 ± 48.04 | p = 0.03 | 0.91 (0.74/0.97) | 154.65 ± 69.24 | 154.08 ± 67.20 | p = 0.75 | 0.99 (0.89/0.99) | p = 0.98 | −0.03 (−2.39/0.68) | p = 0.01 | 0.58 (−1.78/0.69) |
| HF (ms2) | 305.04 ± 169.63 | 430.33 ± 259.49 | p = 0.01 | 0.92 (0.71/0.98) | 304.90 ± 108.38 | 304.45 ± 109.54 | p = 0.49 | 0.88 (0.33/0.98) | p = 0.69 | 0.24 (−1.47/0.76) | p = 0.18 | 0.42 (0.20/0.78) |
| LF (n.u.) | 16.34 ± 15.70 | 12.63 ± 8.28 | p = 0.02 | 0.65 (−0.04/0.88) | 11.21 ± 5.77 | 11.30 ± 5.90 | p = 0.37 | 0.98 (0.94/0.99) | p = 0.61 | 0.13 (−0.42/0.62) | p = 0.18 | 0.56 (0.11/0.89) |
| HF (n.u.) | 62.89 ± 17.49 | 81.07 ± 42.81 | p = 0.12 | 0.42 (−0.70/0.80) | 62.47 ± 21.76 | 62.66 ± 21.69 | p = 0.09 | 0.83 (0.56/0.98) | p = 0.95 | 0.39 (−0.99/0.81) | p = 0.72 | 0.08 (−2.01/0.72) |
| LF/HF | 2.08 ± 1.42 | 1.91 ± 1.28 | p = 0.26 | 0.26 (−1.18/0.72) | 2.12 ± 2.03 | 2.10 ± 1.90 | p = 0.71 | 0.95 (0.90/0.97) | p = 0.96 | −0.11 (−2.66/0.65) | p = 0.08 | −0.006 (−2.48/0.67) |
| HRT | ||||||||||||
| TO (%) | 0.02 ± 0.01 | 0.00 ± 0.00 | p = 0.17 | 0.001 (−1.98/0.66) | 0.00 ± 0.00 | 0.00 ± 0.00 | p = 0.33 | 0.99 (0.99/1.00) | p = 0.22 | −0.003 (−2.28/0.69) | p = 0.12 | 0.11 (−0.44/0.60) |
| TS (ms/RR) | 6.54 ± 4.17 | 8.02 ± 4.65 | p = 0.01 | 0.94 (0.82/0.98) | 6.69 ± 5.11 | 6.50 ± 4.77 | p = 0.35 | 0.95 (0.84/0.98) | p = 0.88 | −0.001 (−0.53/0.53) | p = 0.40 | −0.001 (−2.27/0.69) |
| Mean 24-RR intervals (ms) | 1641.49 ± 154.43 | 2343.42 ± 151.25 | p = 0.11 | 0.47 (0.11/0.96) | 1639.72 ± 104.26 | 1641.11 ± 105.13 | p = 0.64 | 0.98 (0.96/0.99) | p = 0.50 | 0.03 (−2.16/0.70) | p = 0.52 | 0.19 (−1.62/0.75) |
| Model | B | β | t-Test | p |
|---|---|---|---|---|
| Participation to exercise | −6.142 | −0.076 | p = 0.94 | |
| Age | 0.641 | 0.185 | 0.968 | p = 0.36 |
| HD vintage | −0.265 | −0.069 | −0.305 | p = 0.76 |
| Hb | 0.201 | 0.012 | 0.065 | p = 0.94 |
| FPG | 0.250 | 0.414 | 2.098 | p = 0.06 |
| HbA1c | −19.621 | −0.652 | −2.855 | p = 0.02 |
| VO2peak | 8.346 | 0.666 | 3.433 | p < 0.05 |
| R2 = 0.724 | ||||
| F = 3.505 |
| Model | B | β | t-Test | p |
|---|---|---|---|---|
| Participation to exercise | 20.670 | 4373 | p < 0.05 | |
| Age | 0.017 | 0.063 | 0.261 | p = 0.80 |
| HD vintage | 0.158 | 0.514 | 2.051 | p = 0.08 |
| SDNN | 0.044 | 0.549 | 2.366 | p = 0.03 |
| pNN50 | 0.017 | 0.126 | 0.665 | p = 0.53 |
| SDANN | −0.008 | −0.124 | −0.401 | p = 0.70 |
| rMSSD | −0.043 | −0.582 | −2.833 | p = 0.03 |
| HF (ms2) | 0.005 | 0.729 | 3.842 | p < 0.05 |
| LF (ms2) | −0.013 | −0.344 | −0.962 | p = 0.37 |
| R2 = 0.863F = 4.706 |
Disclaimer/Publisher’s Note: The statements, opinions and data contained in all publications are solely those of the individual author(s) and contributor(s) and not of MDPI and/or the editor(s). MDPI and/or the editor(s) disclaim responsibility for any injury to people or property resulting from any ideas, methods, instructions or products referred to in the content. |
© 2023 by the authors. Licensee MDPI, Basel, Switzerland. This article is an open access article distributed under the terms and conditions of the Creative Commons Attribution (CC BY) license (https://creativecommons.org/licenses/by/4.0/).
Share and Cite
Michou, V.; Liakopoulos, V.; Roumeliotis, S.; Roumeliotis, A.; Anifanti, M.; Tsamos, G.; Papagianni, A.; Zempekakis, P.; Deligiannis, A.; Kouidi, E. Effects of Home-Based Exercise Training on Cardiac Autonomic Neuropathy and Metabolic Profile in Diabetic Hemodialysis Patients. Life 2023, 13, 232. https://doi.org/10.3390/life13010232
Michou V, Liakopoulos V, Roumeliotis S, Roumeliotis A, Anifanti M, Tsamos G, Papagianni A, Zempekakis P, Deligiannis A, Kouidi E. Effects of Home-Based Exercise Training on Cardiac Autonomic Neuropathy and Metabolic Profile in Diabetic Hemodialysis Patients. Life. 2023; 13(1):232. https://doi.org/10.3390/life13010232
Chicago/Turabian StyleMichou, Vassiliki, Vassilios Liakopoulos, Stefanos Roumeliotis, Athanasios Roumeliotis, Maria Anifanti, Georgios Tsamos, Aikaterini Papagianni, Pantelis Zempekakis, Asterios Deligiannis, and Evangelia Kouidi. 2023. "Effects of Home-Based Exercise Training on Cardiac Autonomic Neuropathy and Metabolic Profile in Diabetic Hemodialysis Patients" Life 13, no. 1: 232. https://doi.org/10.3390/life13010232
APA StyleMichou, V., Liakopoulos, V., Roumeliotis, S., Roumeliotis, A., Anifanti, M., Tsamos, G., Papagianni, A., Zempekakis, P., Deligiannis, A., & Kouidi, E. (2023). Effects of Home-Based Exercise Training on Cardiac Autonomic Neuropathy and Metabolic Profile in Diabetic Hemodialysis Patients. Life, 13(1), 232. https://doi.org/10.3390/life13010232