Abstract
Asians are known to be more likely than Westerners to develop fatty liver and lifestyle-related diseases in spite of their weight. However, the relationship between fat accumulation and lifestyle-related diseases in non-obese Asians is unknown. Therefore, this study aimed to analyze visceral fat and hepatic fat in participants with a normal body mass index (BMI) and examine their characteristics during a medical checkup. This cross-sectional study was conducted on 663 of 1142 patients who underwent abdominal ultrasonography and who had an alcohol intake (converted to ethanol) of <30 g/day for males and <20 g/day for females and a BMI of <25 kg/m2 during a health checkup. Participants were classified into four groups: group A, visceral fat accumulation (VFA) (−) and fatty liver (FL) (−) (n = 549); group B, VFA (+) and FL (−) (n = 32); group C, VFA (−) and FL (+) (n = 58); and group D, VFA (+) and FL (+) (n = 24). The frequencies of lifestyle-related disease complications, liver function tests, and liver fibrosis were evaluated among the four groups. Compared with group A (control), groups B, C, and D had a higher number of males, BMI, abdominal circumference, ALT, AST, γ-GTP, triglyceride, uric acid, fasting blood sugar levels, and incidence of hyperlipidemia. Groups C and D had higher ALT, HbA1c, cholinesterase, and triglyceride levels, FIB4 index, and the number of patients with diabetes mellitus (DM) than groups A and B; however, there was no difference between groups A and B. FL is a risk factor of DM and liver fibrosis in non-obese Japanese individuals; however, VFA only is not a risk factor of DM and liver fibrosis.
1. Introduction
Nonalcoholic fatty liver disease (NAFLD) is a common chronic liver disease worldwide [1]. The development of fatty liver disease has been known to be associated with weight gain, hypertension, hypertriglyceridemia, and obesity [2,3,4]. NAFLD was diagnosed by excluding other chronic liver diseases, including “excessive” alcohol consumption. Recently, a positive criterion has been proposed for metabolic dysfunction-associated fatty liver disease (MAFLD). The criteria are based on evidence of hepatic steatosis in addition to one of these criteria: overweight/obesity, type 2 diabetes mellitus (DM), or evidence of metabolic dysregulation [5].
In NAFLD, the body mass index (BMI; kg/m2) of Asians is not very high as compared with that of Westerners with NAFLD. The so-called lean NAFLD (BMI, Caucasians ≤ 25 kg/m2; Asian ≤ 23 kg/m2) has been diagnosed in 10–20% of non-obese Asians with NAFLD [6,7] Asians are known to be more susceptible to BMI-related metabolic disorders compared with Westerners. In non-obese Asians, as in other ethnic groups, visceral fat accumulation (VFA) and fatty liver (FL) are reported to be associated with insulin resistance and metabolic abnormalities [8,9,10,11,12,13]. Metabolically obese, normal-weight Asians have 20–30% lesser insulin sensitivity and 30–40% higher fasting and postprandial insulin secretion than metabolically healthy, lean controls [14] Among Japanese men with BMI of 23–25 kg/m2, those with hypertension, hyperglycemia, or dyslipidemia have insulin resistance in the liver but less insulin resistance in the muscle. On the other hand, overweight men with metabolic syndrome have impaired insulin resistance in both the muscle and liver [4]. However, the mechanisms of insulin resistance in non-obese Asians have not yet been fully elucidated. A recent report compared the degree of insulin sensitivity among four groups defined by the presence or absence of VFA and FL in non-obese diabetic middle-aged Japanese men. FL was associated with adipose tissue and muscle insulin resistance; however, VFA alone were not associated with insulin resistance. Subjects with both VFA and FL were as resistant to insulin as those with FL alone [14].
Based on these studies [14], we divided our study patients into four groups based on the accumulation of FL and visceral fat and with normal BMI (<25 kg/m2) at the time of a medical checkup. We investigated clinically whether there was a difference in lifestyle-related diseases, blood test values, and liver fibrosis progression depending on the FL and VFA sites. This examined the importance of the fat accumulation site.
2. Materials and Methods
2.1. Patients
This cross-sectional study was conducted from January to December 2018 at Kawasaki Medical School General Medical Center. In total, 1142 patients underwent abdominal ultrasonography at an annual general medical checkup at Kawasaki Medical Center, Kawasaki Medical School. Annual general medical checkups and abdominal ultrasonography are requested by individuals who desire comprehensive examinations that permit early diagnosis of illness. Of these, 663 patients had a BMI of <25 kg/m2 and alcohol intake (converted to ethanol) of <30 g/day for males and <20 g/day for females. Alcohol consumption was determined based on the NASH/NAFLD guidelines of the Japanese Society of Hepatology and those of MAFLD [5,15]. In this study, individuals with a BMI of <25 kg/m2 were considered as non-obese, and NAFLD was defined as an alcohol intake (converted to ethanol) of <30 g/day for males and <20 g/day for females. Patients with hepatitis B virus (HBV), hepatitis C virus (HCV), and hepatocellular carcinoma (HCC) were excluded from the study (Table 1). Patients were classified into four groups: group A (control group), VFA (−) and FL (−); group B, VFA (+) and FL (−); group C, VFA (−) and FL (+); and group D, VFA (+) and FL (+) (Figure 1) (Table 1).

Table 1.
Clinical characteristics of all eligible patients.
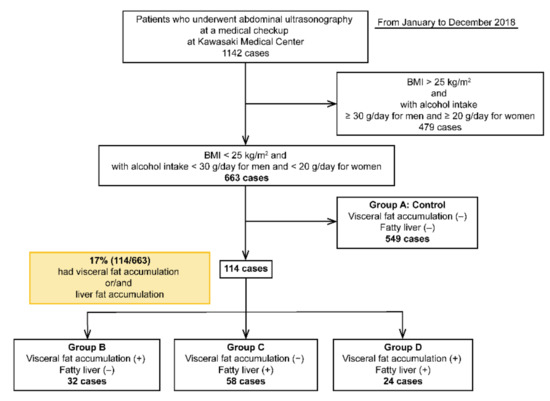
Figure 1.
Flowchart of the four groups of patients included in this study.
2.2. Methods
Age, gender, BMI, body fat percentage, abdominal circumference, alanine aminotransferase (ALT), aspartate transaminase (AST), γ-glutamyl transferase (γ-GTP), total bilirubin, albumin, platelets, cholinesterase, total cholesterol, triglyceride, LDL-C, fasting blood glucose, uric acid, and HbA1c levels were compared among the four groups. The presence or absence of FL was diagnosed via abdominal ultrasound using hepatorenal contrast, vascular obscureness, and deep attenuation.
VFA was observed via computed tomography (CT) cross-sectional scans at the umbilical level using a previously reported method [16]. VFA is defined as a cross-sectional area of ≥100 m2. The abdominal circumference corresponding to the cross-sectional area is >85 cm in men and >90 cm in women. The amount of VFA is >85 cm in men and >90 cm in women, with an abdominal girth corresponding to >100 m2 of the visceral fat area on CT [16]. The body fat percentage was assessed using the SYNAPSE VINCENT system (FJI, Japan). The FIB4 index was calculated as described previously: age (years) × AST (U/L)/platelet count (109/L) × √ALT (U/L) [7,17,18]. Liver fibrosis was classified into FIB4 indices of <1.3, 1.3–2.66, and ≥2.67, where an FIB4 index of <1.3 relates to no fibrosis progression, whereas an index of ≥2.67 relates to possible advanced fibrosis.
The study protocol conformed to the 1975 Helsinki Declaration and was approved by the Institutional Research Ethics Committee (Admission No: 3027).
2.3. Statistical Analysis
Statistical analyses were performed using the JMP software (JMP Pro version 13.2 for Windows, SAS, USA), and a p-value of <0.05 was considered significant. Baseline continuous variables were expressed as mean ± standard deviation (SD). Between-group comparisons were performed using the chi-squared test for categorical variables and the Shapiro–Wilk test for continuous variables.
3. Results
Among the 663 patients without a drinking history and a BMI of <25 kg/m2, 114 (17%) had VFA and/or FL. Among the four groups, group A comprised 549 (control), group B comprised 32, group C comprised 58, and group D comprised 24 patients (Figure 1). The cohort had a slightly higher number of women [299 males (45%) and 364 females (55%)].
3.1. Characteristics
Among the four groups, the group A comprised 212 males (38.6%) and 337 females (61.4%), group B comprised 28 males (87.5%) and 4 females (12.5%), group C comprised 36 males (62%) and 22 females (38%), and group D comprised 23 males (95.8%) and 1 female (4.2%). The average ages for groups A, B, C, and D were 48.5 ± 10.9, 48.8 ± 10.9, 52.7 ± 11.1, and 55.1 ± 12.4 years, respectively. Compared with groups A and B, groups C and D had a higher age. BMI and abdominal circumference were significantly higher in groups B, C, and D than in group A. In particular, group D had the highest abdominal circumference among males and females, followed by groups B, C, and A (p < 0.05). The body fat percentage did not differ between the four groups (Table 2).
Table 2.
Characteristics of the four patient groups in this study.
3.2. Complications
Diabetic complications were observed in 8 (1.5%), 0 (0%), 11 (19%), and 6 (25%) patients in groups A, B, C, and D, respectively. They were significantly higher in groups C and D than in groups A and B (p < 0.05). The number of patients with DM was similar between groups A and B. Dyslipidemia complications were observed in 152 (38%), 17 (53%), 31 (53%), and 12 (50%) patients in groups A, B, C, and D, respectively. The number of patients with dyslipidemia was significantly higher in groups B, C, and D than in group A (p < 0.05). However, no differences in combined dyslipidemia were observed in groups B, C, and D. A total of 61 patients (12%) in group A, 6 (18%) in group B, 15 (25%) in group C, and 6 (25%) in group D had hypertension. The number of patients with hypertension was higher in groups C and D than in group A (control) (p < 0.05), whereas it was the same between groups A and B (Table 3).
Table 3.
Complications of the four patient groups in this study.
3.3. Blood Biochemical Examination
ALT levels were 17 ± 10, 22 ± 9, 28 ± 14, and 36 ± 21 IU/L in groups A, B, C, and D, respectively. ALT levels were higher in groups B, C, D than in group A, particularly in patients with FL (groups C and D) than in those without FL (groups A and B) (p < 0.05). AST levels were 20 ± 7, 22 ± 9, 24 ± 6.2, and 26 ± 11 IU/L in groups A, B, C, and D, respectively. γ-GTP levels were 25 ± 24, 50 ± 43, 35 ± 20, and 64 ± 79 IU/L in groups A, B, C, and D, respectively. AST and γ-GTP levels were significantly higher in groups B, C, and D than in group A (p < 0.05).
Cholinesterase levels were higher in groups C and D than in groups A and B (p < 0.05). Triglyceride levels were higher in groups C and D than in group A and B. Hyperuricemia and fasting blood sugar levels were higher in the patients in groups B, C, and D than in those in group A (control) (p < 0.05). HbA1c levels were 5.6% ± 0.4%, 5.6% ± 0.2%, 6.05 ± 0.6%, and 6.0% ± 0.6% in groups A, B, C, and D, respectively, and were significantly higher in groups C and D than in groups A and B (p < 0.05). HbA1c levels were similar between groups A and B (Figure 2). Total bilirubin, total cholesterol, and LDL-C levels and platelet count were not significantly different among the four groups (Table 4).
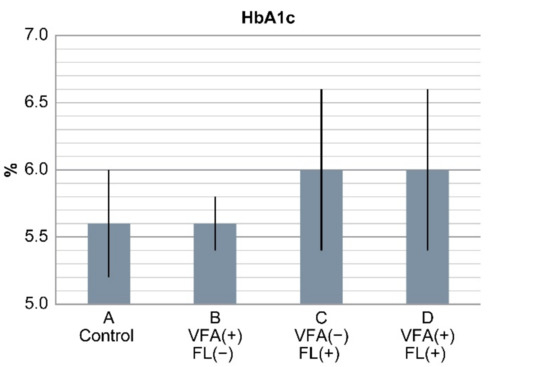
Figure 2.
Results of HbA1c levels in the four groups. HbA1c levels were significantly higher in groups C and D with fatty liver than in groups A and B (p < 0.0001). HbA1c levels between groups A and B with VFA (+) only were similar. In non-obese Japanese individuals, fatty liver is a risk factor of diabetes, but VFA alone is not a risk factor.
Table 4.
Blood biochemical examination of the four patient groups in this study.
3.4. FIB4 Index
The FIB4 index was 0.9 ± 0.05, 1.0 ± 0.3, 1.4 ± 0.7, and 1.8 ± 0.8 in groups A, B, C, and D, respectively. It was significantly higher in groups C and D than in groups A and B (p < 0.05). Furthermore, the FIB4 index was divided into the following three groups: <1.3, 1.3–2.66, and ≥2.67.
Group A had 452, 93 and 4 patients; group B had 27, 5 and 0 patients; group C had 33, 20 and 5 patients; and group D had 5, 16 and 3 patients with FIB4 indices of <1.3, 1.3–2.66, and ≥2.67, respectively.
There were five patients in group C and three patients in group D with FL and an FIB4 index of ≥2.67, which is a marker of liver fibrosis. On the other hand, those in groups A (n = 452) and B (n = 27) without FL had an FIB4 index of <1.3, accounting for the majority of cases (Figure 3) (Table 5).
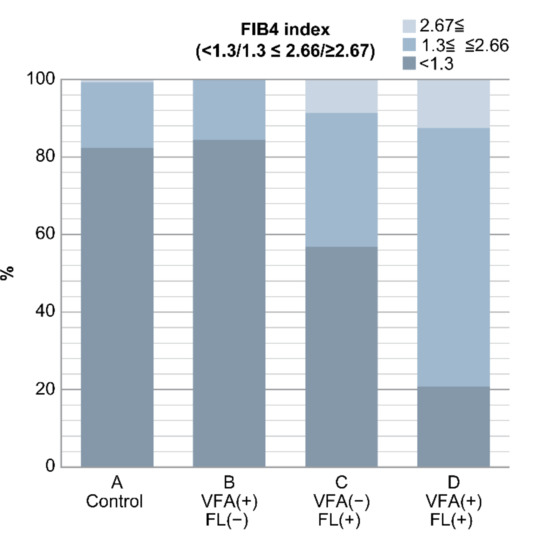
Figure 3.
Result of FIB4 index in the four groups. In groups C and D with fatty liver, there were many cases with FIB4 index ≥ 2.67, which is suspicious of liver fibrosis. Conversely, cases with FIB4 index < 1.3 were found in groups A and B without fatty liver (p < 0.0001). In non-obese Japanese individuals, fatty liver is a risk factor of liver fibrosis, but VFA alone is not a risk factor.
Table 5.
FIB4 index of the four patient groups in this study.
4. Discussion
In recent years, approximately 1 billion patients worldwide have been diagnosed with NAFLD. Obesity is highly associated with NAFLD, and FL increases the degree of obesity [1]. A total of 15–30% Asians, including the Japanese, with a BMI of 23–24 kg/m2 have FL. Conversely, in Westerners, a study has shown that 20–30% of patients with a BMI of 27–32 kg/m2 have FL, indicating that Asians have FL with lower BMI values than Westerners [6]. As Asians do not have enough fat cells in their subcutaneous adipose tissues, fat cells become overloaded and begin to overflow as free fatty acids, resulting in lipid accumulation in the visceral adipose tissue, muscle, and liver [18,19]. Therefore, the mechanisms leading to insulin resistance have been studied.
Recently, the subset of individuals with “lean NAFLD” or “non-obese NAFLD,” has become increasingly prevalent. In a meta-analysis using 84 studies (n = 10 530 308) for prevalence analysis and 5 studies (n = 9121) for incidence analysis from 24 countries or regions, the prevalence of lean NAFLD was 40.8% [20]. NAFLD in lean patients appears to be more common in Asians [21,22,23]. Lean NAFLD is known to cause severe organ damage as the degree of obesity increases [23,24]. In fact, individuals with lean NAFLD have a lower prevalence of metabolic syndrome than those with obese NAFLD; however, they have a higher prevalence of hypertension, dyslipidemia, and type 2 DM complications and higher insulin resistance than healthy people [9,10,21]. A multi-ethnic lean NAFLD cohort from Asia and Italy revealed a slower progression of liver disease in individuals with lean NAFLD [9,10,11,23,24,25,26,27]. Conversely, lean NAFLD accounted for approximately one-third of the individuals with NAFLD (and even higher in older, male, and foreign-born individuals) in a retrospective US study and had higher mortality rates than those with obese NAFLD [28]. Although the pathophysiological mechanisms underlying lean NAFLD have not been elucidated completely, it is reportedly caused by differences in visceral obesity and adipocyte differentiation, changes in lipid turnover, loss of muscle mass, genetic background such as patatin-like phospholipase domain-containing protein 3 (PNPLA3) C > G polymorphism, and different patterns of gut microflora [9].
A BMI of 23–25 kg/m2 is also important because it causes metabolic disorders in Asians. There are certain reports of normal BMI in Asian patients with visceral obesity but there are no clinical reports. This is the first report to examine the problem of fat accumulation sites in normal BMI cases in a general screening. We examined the relationship between groups A, B, C, and D and blood tests, metabolic syndrome, and liver fibrosis and verified their effects on the body of non-obese patients who underwent the medical checkup. Among the 663 patients without a drinking history and with a BMI of <25 kg/m2 who underwent abdominal ultrasound in this study, VFA or FL or both were observed in as many as 114 patients (17%). Conversely, a total of 549 patients had neither VFA nor FL (83%). Surprisingly, groups C and D had DM complications, higher HbA1c levels, and a higher FIB4 index than groups A and B. The FIB4 index is widely used as an indicator of liver fibrosis in patients with NASH and chronic hepatitis C [7,17,18], indicating that the presence of FL is associated with liver fibrosis. The progression of liver fibrosis in patients with NAFLD is associated with diabetes, hepatocarcinogenesis, and cardiovascular events and is important for determining prognosis [28,29,30,31,32]. Therefore, the presence of FL is extremely important. Conversely, in patients with a BMI of <25 kg/m2, the presence of VFA only was not a problem.
There are other papers regarding the importance of FL. In a prospective cohort analysis of 1647 Japanese individuals, the presence of NAFLD was associated with cardiovascular disease (CVD) incidence of 0.6% in non-overweight without NAFLD, 8.8% in non-overweight with NAFLD, in 1.8% in overweight without NAFLD, and 3.3% in overweight with NAFLD. This study concluded that even non-overweight individuals need to be aware of NAFLD to prevent CVD events [33].
Kadowaki et al. [14] reported that in non-obese Japanese men without diabetes, FL without VFA caused insulin resistance in the adipose tissue and muscle as well as a lower hepatic insulin sensitivity; in contrast, patients with VFA but without FL (controls) showed similar insulin sensitivity in the muscle, liver, and adipose tissue. Patients with both VFA and FL had more body fat than the other groups but had similar insulin resistance as those with FL only. Therefore, they reported that the presence of FL was important because it causes insulin resistance in the adipose tissue and muscle and that VFA alone does not cause insulin resistance. Taken together, it is speculated that FL but not VFA alone is a good marker to predict insulin resistance. The results of the report will be considered to support our report. In non-obese people, FL is more likely to cause liver fibrosis and result in a higher frequency of patients with diabetes, according to our study. In addition, it may increase the frequency of the occurrence of CVD [33]. Therefore, the presence of FL can be an important factor for patient prognosis.
Although many obese people often have FL, non-obese patients often have no FL; in fact, the presence or absence of FL cannot be diagnosed without performing imaging examinations, such as abdominal ultrasonography. Therefore, in patients with high cholinesterase, HbA1c levels > 6.0, and DM and particularly in those with an FIB4 index of >2.67, imaging examinations should be performed to check for the presence of FL, even in non-obese individuals.
The current study has some limitations. First, this is a survey at the time of a health checkup and increased visceral fat was judged using abdominal circumference. Increased visceral fat should be judged using imaging examinations, such as CT, in the future. Second, there were few females with high VFA. This may also be because young individuals, including premenopausal females, were included in the medical checkup. In the future, results based on gender should also be considered. Third, this study targeted non-obese patients with a BMI of <25 kg/m2 and did not include lean NAFLD individuals with a BMI of <23 kg/m2. We hope that future studies use a higher number of patients and perform more expanded studies.
5. Conclusions
There is a possibility of visceral obesity even in patients with a BMI of <25 kg/m2; among them, FL deposition rather than visceral fat deposition is associated with DM complications and liver fibrosis progression and may be important because it may be related to prognosis. These data suggest that FL, but not VFA alone, is a risk factor of DM and liver fibrosis in non-obese Japanese subjects.
Author Contributions
Conceptualization: M.K., data curation: M.K., formal analysis: M.K. and N.U., investigation: T.T., K.I., J.N. and N.U., methodology: M.S. and K.N., project administration: T.S., K.H., N.M., T.K. and H.K., resources: T.K. and M.K., software: M.K., supervision: M.K., validation: M.K., visualization: M.K. and N.U., roles/writing—original draft: N.U. and M.K., writing—review & editing: N.U. and M.K. All authors have read and agreed to the published version of the manuscript.
Funding
This research received no external funding.
Conflicts of Interest
The authors declare no conflict of interest.
References
- Younossi, Z.; Tacke, F.; Arrese, M.; Chander Sharma, B.; Mostafa, I.; Bugianesi, E.; Wong, V.W.; Yilmaz, Y.; George, J.; Fan, J.; et al. Global perspectives on nonalcoholic fatty liver disease and nonalcoholic steatohepatitis. Hepatology 2019, 69, 2672–2682. [Google Scholar] [CrossRef]
- Sung, K.C.; Wild, S.H.; Byrne, C.D. Development of new fatty liver, or resolution of existing fatty liver, over five years of follow-up, and risk of incident hypertension. J. Hepatol. 2014, 60, 1040–1045. [Google Scholar] [CrossRef] [PubMed]
- Tsuneto, A.; Hida, A.; Sera, N.; Imaizumi, M.; Ichimaru, S.; Nakashima, E.; Seto, S.; Maemura, K.; Alkahoshi, M. Fatty liver incidence and predictive variables. Hypertens. Res. 2010, 33, 638–643. [Google Scholar] [CrossRef]
- Chang, Y.; Jung, H.S.; Cho, J.; Zhang, Y.; Yun, K.E.; Lazo, M.; Pastor-Barriuso, R.; Ahn, J.; Kim, C.-W.; Rampal, S.; et al. Metabolically healthy obesity and the development of nonalcoholic fatty liver disease. Am. J. Gastroenterol. 2016, 111, 1133–1140. [Google Scholar] [CrossRef]
- Eslam, M.; Newsome, P.N.; Sarin, S.K.; Anstee, Q.M.; Targher, G.; Romero-Gomez, M.; Zelber-Sagi, S.; Wong, V.W.-S.; Dufour, J.-F.; Schattenberg, J.M.; et al. A new definition for metabolic dysfunction-associated fatty liver disease: An international expert consensus statement. J. Hepatol. 2020, 73, 202–209. [Google Scholar] [CrossRef]
- Everhart, J.E.; Bambha, K.M. Fatty liver: Think globally. Hepatology 2010, 51, 1491–1493. [Google Scholar] [CrossRef]
- Shah, A.G.; Lydecker, A.; Murray, K.; Tetri, B.N.; Contos, M.J.; Sanyal, A.J.; NASH Clinical Research Net work. Comparison of noninvasive markers of fibrosis in patients with nonalcoholic fatty liver disease. Clin. Gastroenterol. Hepatol. 2009, 7, 1104–1112. [Google Scholar] [CrossRef]
- Katsuki, A.; Sumida, Y.; Urakawa, H.; Gabazza, E.C.; Murashima, S.; Maruyama, N.; Morioka, K.; Nakatani, K.; Yano, Y.; Adachi, Y. Increased visceral fat and serum levels of triglyceride are associated with insulin resistance in Japanese metabolically obese, normal weight subjects with normal glucose tolerance. Diabetes Care 2003, 26, 2341–2344. [Google Scholar] [CrossRef]
- Takeno, K.; Tamura, Y.; Kawaguchi, M.; Kakehi, S.; Watanabe, T.; Funayama, T.; Furukawa, Y.; Kaga, H.; Yamamoto, R.; Kim, M.; et al. Relation Between Insulin Sensitivity and Metabolic Abnormalities in Japanese Men With BMI of 23–25 kg/m2. J. Clin. Endocrinol. Metab. 2016, 101, 3676–3684. [Google Scholar] [CrossRef]
- Chooi, Y.C.; Ding, C.; Chan, Z.; Choo, J.; Sadananthan, S.A.; Michael, N.; Lee, Y.; Velan, S.S.; Magkos, F. Moderate Weight Loss Improves Body Composition and Metabolic Function in Metabolically Unhealthy Lean Subjects. Obesity (Silver Spring, MD) 2018, 26, 1000–1007. [Google Scholar] [CrossRef]
- Ding, C.; Chan, Z.; Chooi, Y.C.; Choo, J.; Sadananthan, SA.; Chang, A.; Sasikala, S.; Michael, N.; Velan, S.S.; Magkos, F. Regulation of glucose metabolism in nondiabetic, metabolically obese normal-weight Asians. Am. J. Physiol. Endocrinol. Metab. 2018, 314, E494–E502. [Google Scholar] [CrossRef]
- Rattarasarn, C. Dysregulated lipid storage and its relationship with insulin resistance and cardiovascular risk factors in non-obese Asian patients with type 2 diabetes. Adipocyte 2018, 7, 71–80. [Google Scholar] [CrossRef] [PubMed]
- Furukawa, Y.; Tamura, Y.; Takeno, K.; Funayama, T.; Kaga, H.; Suzuki, R.; Watanabe, T.; Kakehi, S.; Kanazawa, A.; Kawamori, R.; et al. Impaired peripheral insulin sensitivity in non-obese Japanese patients with type 2 diabetes mellitus and fatty liver. J. Diabetes Investig. 2017, 9, 529–535. [Google Scholar] [CrossRef] [PubMed]
- Kadowaki, S.; Tamura, Y.; Someya, Y.; Takeno, K.; Kaga, H.; Sugimoto, D.; Kakehi, S.; Funayama, T.; Furukawa, Y.; Suzuki, R.; et al. Fatty liver has stronger association with insulin resistance than visceral fat accumulation in nonobese Japanese men. J. Endocr. Soc. 2019, 3, 1409–1416. [Google Scholar] [CrossRef]
- The Japan Society of Hepatology. Medical Treatment Guideline for NASH · NAFLD, 1st ed.; Bunkodo: Tokyo, Japan, 2015; pp. 2–7. ISBN 978-4-8306-1888-8. [Google Scholar]
- Examination Committee of Criteria for ‘Obesity Disease’ in Japan. New criteria for ‘obesity disease’ in Japan. Circ. J. 2002, 66, 987–992.
- Sterling, R.K.; Lissen, E.; Clumeck, N.; Sola, R.; Correa, M.C.; Montaner, J.; Sulkowski, M.S.; Torriani, F.J.; Dieterich, D.T.; Thomas, D.L.; et al. Development of a simple noninvasive index to predict significant fibrosis in patients with HIV/HCV coinfection. Hepatology 2006, 43, 1317–1325. [Google Scholar] [CrossRef]
- Sumida, Y.; Yoneda, M.; Hyogo, H.; Itoh, Y.; Ono, M.; Fujii, H.; Eguchi, Y.; Suzuki, Y.; Aoki, N.; Kanemasa, K.; et al. Validation of the FIB4 index in a Japanese nonalcoholic fatty liver disease population. BMC Gastroenterol. 2012, 12, 2. [Google Scholar] [CrossRef]
- Nazare, J.A.; Smith, J.D.; Borel, A.L.; Haffner, S.M.; Balkau, B.; Ross, R.; Massien, C.; Alméras, N.; Després, J.-P. Ethnic influences on the relations between abdominal subcutaneous and visceral adiposity, liver fat, and cardiometabolic risk profile: The international study of prediction of intra-abdominal adiposity and its relationship with cardiometabolic risk/intra-abdominal adiposity. Am. J. Clin. Nutr. 2012, 96, 714–726. [Google Scholar]
- Tobari, M.; Hashimoto, E.; Taniai, M.; Ikarashi, Y.; Kodama, K.; Kogiso, T.; Tokushige, K.; Takayoshi, N.; Hashimoto, N. Characteristics of non-alcoholic steatohepatitis among lean patients in Japan: Not uncommon and not always benign. J. Gastroenterol. Hepatol. 2019, 34, 1404–1410. [Google Scholar] [CrossRef]
- Tobari, M.; Hashimoto, E. Characteristic features of nonalcoholic fatty liver disease in Japan with a focus on the roles of age, sex and body mass index. Gut Liver 2020. [Google Scholar] [CrossRef]
- Eguchi, Y.; Hyogo, H.; Ono, M.; Mizuta, T.; Ono, N.; Fujimoto, K.; Chayama, K.; Saibara, T. Prevalence and associated metabolic factors of nonalcoholic fatty liver disease in the general population from 2009 to 2010 in Japan: A multicenter large retrospective study. J. Gastroenterol. 2012, 47, 586–595. [Google Scholar] [CrossRef] [PubMed]
- Ye, Q.; Zou, B.; Yeo, Y.H.; Li, J.; Huang, D.Q.; Wu, Y.; Yang, H.; Liu, C.; Kam, L.Y.; Tan, X.X.E.; et al. Global prevalence, incidence, and outcomes of non-obese or lean non-alcoholic fatty liver disease: A systematic review and meta-analysis. Lancet Gastroenterol. Hepatol. 2020. [Google Scholar] [CrossRef]
- Younes, R.; Bugianesi, E. NASH in lean individuals. Semin. Liver Dis. 2019, 39, 86–95. [Google Scholar] [CrossRef] [PubMed]
- Cusi, K. Nonalcoholic steatohepatitis in nonobese patients: Not so different after all. Hepatology 2017, 65, 4–7. [Google Scholar] [CrossRef] [PubMed]
- Albhaisi, S.; Chowdhury, A.; Sanyal, A.J. Non-alcoholic fatty liver disease in lean individuals. JHEP Rep. 2019, 1, 329–341. [Google Scholar] [CrossRef]
- Leung, J.C.; Loong, T.C.; Wei, J.L.; Wong, G.L.; Chan, A.W.; Choi, P.C.; Shu, S.S.-T.; Chim, A.M.; Chan, H.L.-Y.; Wong, V.W. Histological severity and clinical outcomes of nonalcoholic fatty liver disease in nonobese patients. Hepatology 2017, 65, 54–64. [Google Scholar] [CrossRef]
- Zou, B.; Yeo, Y.H.; Nguyen, V.H.; Cheung, R.; Ingelsson, E.; Nguyen, M.H. Prevalence, characteristics and mortality outcomes of obese, nonobese and lean NAFLD in the United States, 1999–2016. J. Intern. Med. 2020, 288, 139–151. [Google Scholar] [CrossRef]
- Angulo, P.; Kleiner, D.E.; Dam-Larsen, S.; Adams, L.A.; Bjornsson, E.S.; Charatcharoenwitthaya, P.; Mills, P.R.; Keach, J.C.; Lafferty, H.D.; Stahler, A.; et al. Liver fibrosis, but no other histologic features, is associated with long-term outcomes of patients with nonalcoholic fatty liver disease. Gastroenterology 2015, 149, 389–397.e10. [Google Scholar] [CrossRef]
- Younossi, Z.M.; Koenig, A.B.; Abdelatif, D.; Fazel, Y.; Henry, L.; Wymer, M. Global epidemiology of nonalcoholic fatty liver disease-Meta-analytic assessment of prevalence, incidence, and outcomes. Hepatology 2016, 64, 73–84. [Google Scholar] [CrossRef]
- Dulai, P.S.; Singh, S.; Patel, J.; Soni, M.; Prokop, L.J.; Younossi, Z.; Sebastiani, G.; Ekstedt, M.; Hagstrom, H.; Nasr, P.; et al. Increased risk of mortality by fibrosis stage in nonalcoholic fatty liver disease: Systematic review and meta-analysis. Hepatology 2017, 65, 1557–1565. [Google Scholar] [CrossRef]
- Hagström, H.; Nasr, P.; Ekstedt, M.; Hammar, U.; Stål, P.; Hultcrantz, R.; Kechagias, S. Fibrosis stage but not NASH predicts mortality and time to development of severe liver disease in biopsy-proven NAFLD. J. Hepatol. 2017, 67, 1265–1273. [Google Scholar] [CrossRef] [PubMed]
- Yoshitaka, H.; Hamaguchi, M.; Kojima, T.; Fukuda, T.; Ohbora, A.; Fukui, M. Nonoverweight nonalcoholic fatty liver disease and incident cardiovascular disease: A post hoc analysis of a cohort study. Medicine (Baltimore) 2017, 96, e6712. [Google Scholar] [CrossRef] [PubMed]


© 2020 by the authors. Licensee MDPI, Basel, Switzerland. This article is an open access article distributed under the terms and conditions of the Creative Commons Attribution (CC BY) license (http://creativecommons.org/licenses/by/4.0/).