Kinematics and Kinetics of Bulgarian-Bag-Overloaded Sprints in Young Athletes


Abstract
1. Introduction
2. Materials and Methods
2.1. Participants
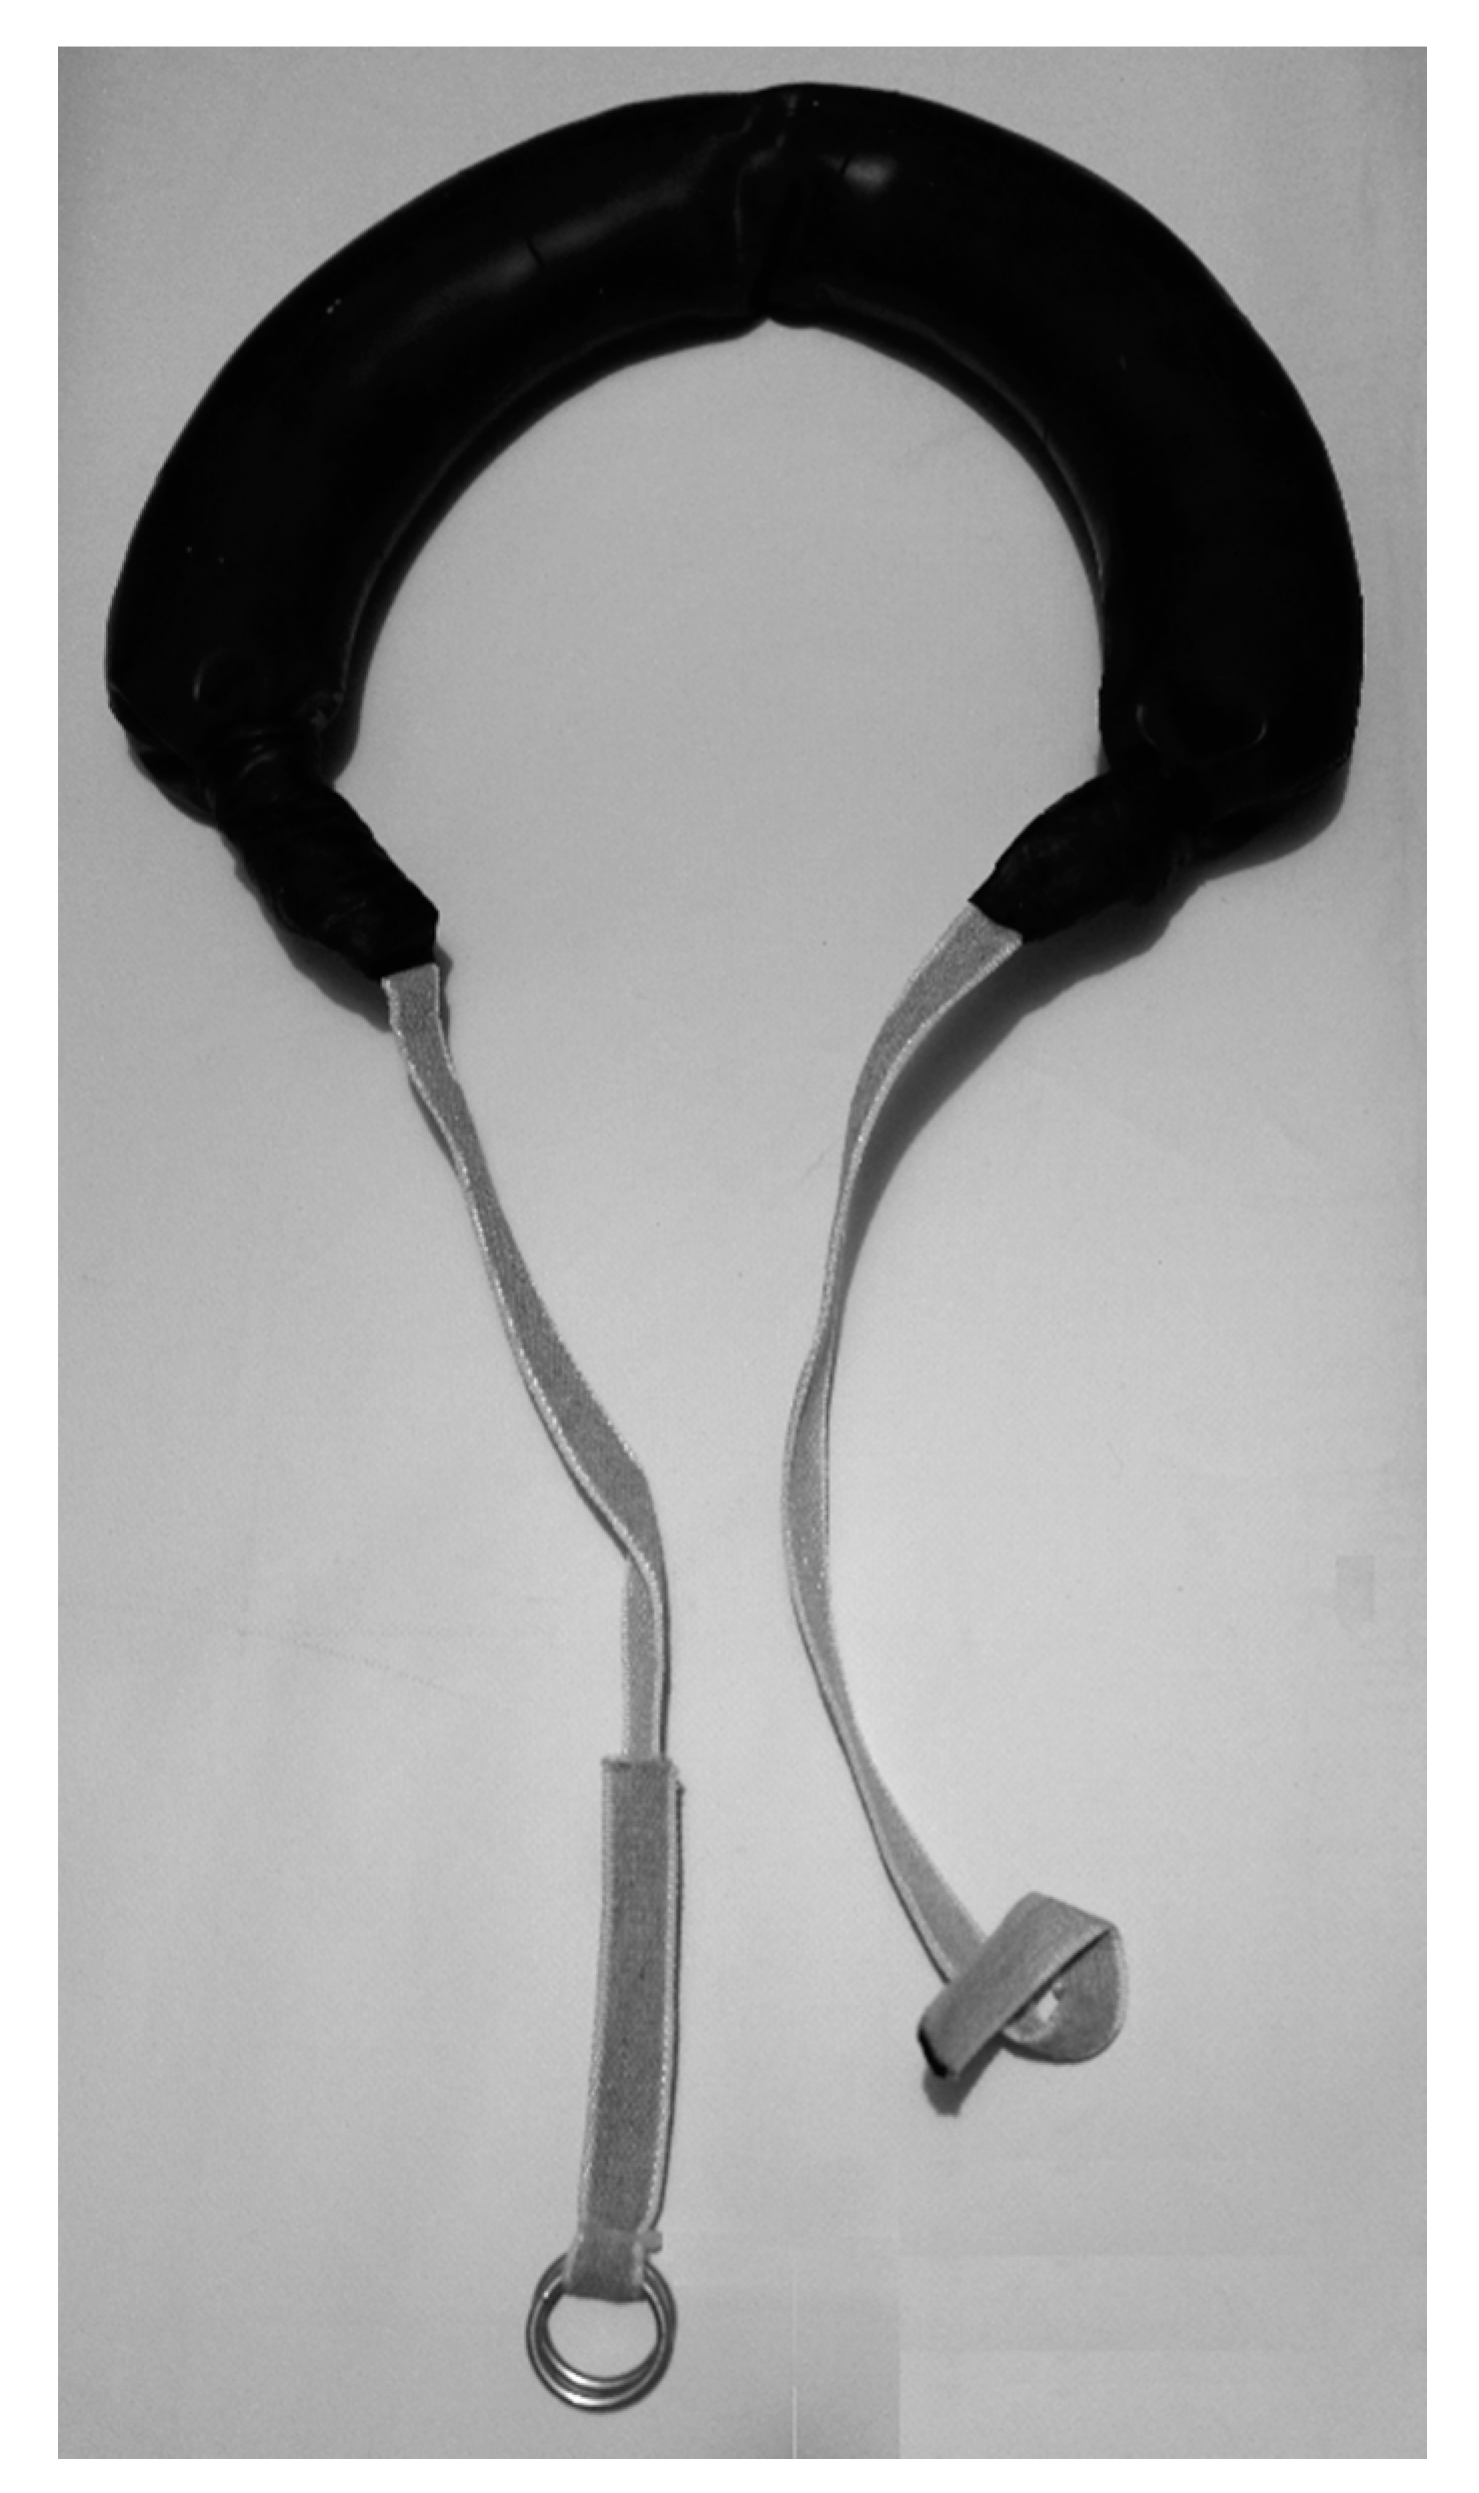
2.2. Procedures
2.3. Data Analysis
2.4. Statistical Analysis
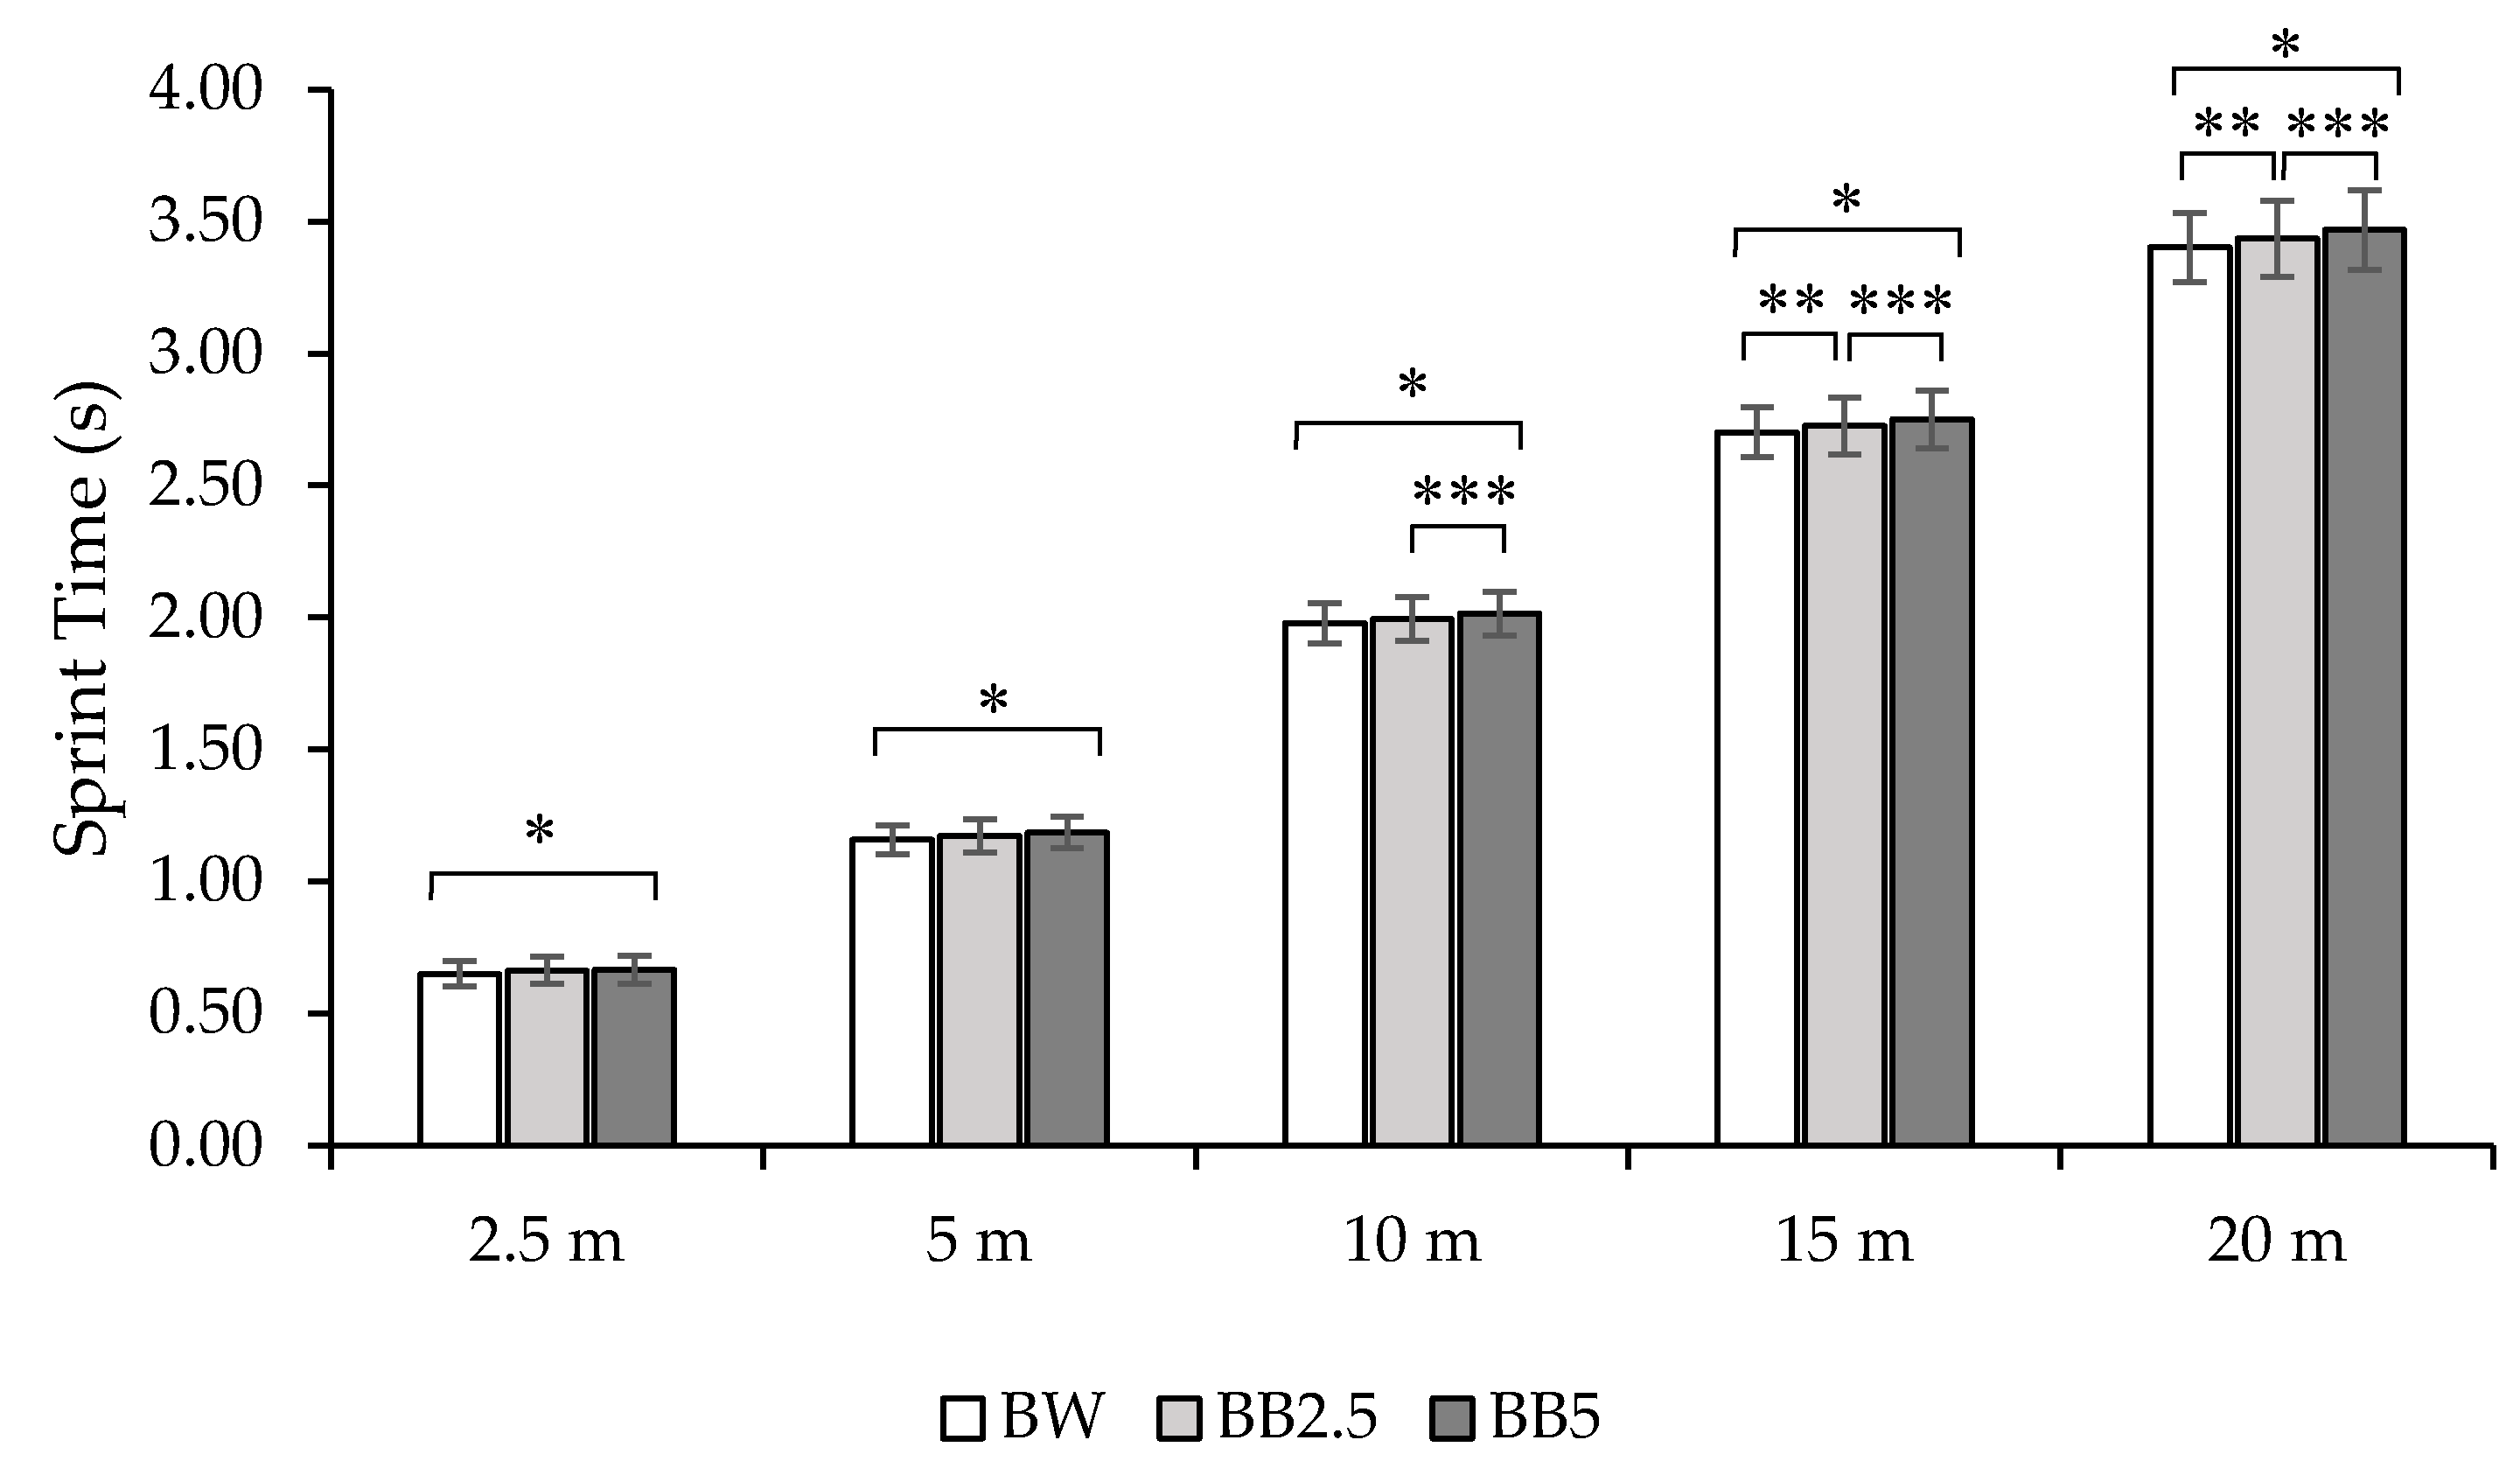
3. Results
4. Discussion
Author Contributions
Funding
Acknowledgments
Conflicts of Interest
References
- Morin, J.B.; Edouard, P.; Samozino, P. Technical ability of force application as a determinant factor of sprint performance. Med. Sci. Sport. Exerc. 2011, 43, 1680–1688. [Google Scholar] [CrossRef] [PubMed]
- Ishida, A.; Rochau, K.; Findlay, K.P.; Devero, B.; Duca, M.; Stone, M.H. Effects of an Initial Muscle Strength Level on Sports Performance Changes in Collegiate Soccer Players. Sports 2020, 8, 127. [Google Scholar] [CrossRef] [PubMed]
- Rabita, G.; Dorel, S.; Slawinski, J.; Sàez-de-Villarreal, E.; Couturier, A.; Samozino, P.; Morin, J.B. Sprint mechanics in world-class athletes: A new insight into the limits of human locomotion. Scand. J. Med. Sci. Sport. 2015, 25, 583–594. [Google Scholar] [CrossRef] [PubMed]
- Morin, J.B.; Bourdin, M.; Edouard, P.; Peyrot, N.; Samozino, P.; Lacour, J.R. Mechanical determinants of 100-m sprint running performance. Eur. J. Appl. Physiol. 2012, 112, 3921–3930. [Google Scholar] [CrossRef]
- Yamauchi, J.; Ishii, N. Relations between force-velocity characteristics of the knee-hip extension movement and vertical jump performance. J. Strength Cond. Res. 2007, 21, 703. [Google Scholar]
- Bobbert, M.F. Why is the force-velocity relationship in leg press tasks quasi-linear rather than hyperbolic? J. Appl. Physiol. 2012, 112, 1975–1983. [Google Scholar] [CrossRef]
- Samozino, P.; Rabita, G.; Dorel, S.; Slawinski, J.; Peyrot, N.; Saez de Villarreal, E.; Morin, J.B. A simple method for measuring power, force, velocity properties, and mechanical effectiveness in sprint running. Scand. J. Med. Sci. Sport. 2016, 26, 648–658. [Google Scholar] [CrossRef]
- Clark, K.P.; Stearne, D.J.; Walts, C.T.; Miller, A.D. The Longitudinal Effects of Resisted Sprint Training Using Weighted Sleds vs. Weighted Vests. J. Strength Cond. Res. 2010, 24, 3287–3295. [Google Scholar] [CrossRef]
- Petrakos, G.; Morin, J.B.; Egan, B. Resisted Sled Sprint Training to Improve Sprint Performance: A Systematic Review. Sport. Med. 2016, 46, 381–400. [Google Scholar] [CrossRef]
- Morin, J.-B.; Petrakos, G.; Jimenez-Reyes, P.; Brown, S.R.; Samozino, P.; Cross, M.R. Very-Heavy Sled Training for Improving Horizontal Force Output in Soccer Players. Int. J. Sports Physiol. Perform. 2016, 12, 1–13. [Google Scholar] [CrossRef]
- Cahill, M.J.; Cronin, J.B.; Oliver, J.L.P.; Clark, K.; Lloyd, R.S.; Cross, M.R. Sled Pushing and Pulling to Enhance Speed Capability. Strength Cond. J. 2019, 41, 94–104. [Google Scholar] [CrossRef]
- Cronin, J.; Hansen, K.; Kawamori, N.; Mcnair, P. Effects of weighted vests and sled towing on sprint kinematics. Sport. Biomech. 2008, 7, 160–172. [Google Scholar] [CrossRef] [PubMed]
- Monte, A.; Nardello, F.; Zamparo, P. Sled Towing: The Optimal Overload for Peak Power Production. Int. J. Sports Physiol. Perform. 2016, 12, 1–24. [Google Scholar] [CrossRef] [PubMed]
- Cross, M.R.; Brughelli, M.; Samozino, P.; Brown, S.R.; Morin, J.-B. Optimal Loading for Maximising Power During Sled-resisted Sprinting. Int. J. Sports Physiol. Perform. 2017. [Google Scholar] [CrossRef] [PubMed]
- Bentley, I.; Atkins, S.J.; Edmundson, C.J.; Metcalfe, J.; Sinclair, J.K. Impact of Harness Attachment Point on Kinetics and Kinematics During Sled Towing. J. Strength Cond. Res. 2016, 30, 768–776. [Google Scholar] [CrossRef]
- Mirwald, R.L.; Baxter-Jones, A.D.G.; Bailey, D.A.; Beunen, G.P. An assessment of maturity from anthropometric measurements. Med. Sci. Sports Exerc. 2002, 34, 689–694. [Google Scholar]
- Bianco, A.; Jemni, M.; Thomas, E.; Patti, A.; Paoli, A.; Ramos Roque, J.; Palma, A.; Mammina, C.; Tabacchi, G. A systematic review to determine reliability and usefulness of the field-based test batteries for the assessment of physical fitness in adolescents—The ASSO Project. Int. J. Occup. Med. Environ. Health 2015, 28, 445–478. [Google Scholar] [CrossRef]
- Trecroci, A.; Duca, M.; Formenti, D.; Alberti, G.; Iaia, F.M.; Longo, S. Short-Term Compound Training on Physical Performance in Young Soccer Players. Sports 2020, 8, 108. [Google Scholar] [CrossRef]
- Healy, R.; Comyns, T.M. The application of postactivation potentiation methods to improve sprint speed. Strength Cond. J. 2017, 39, 1–9. [Google Scholar] [CrossRef]
- Bond, C.; Willaert, E.M.; Noonan, B.C. Comparison of Three Timing Systems: Reliability and Best Practice Recommendations in Timing Short Duration Sprints. J. Strength Cond. Res. 2017, 31, 1062–1071. [Google Scholar] [CrossRef]
- Morin, J.B.; Samozino, P. Interpreting power-force-velocity profiles for individualized and specific training. Int. J. Sports Physiol. Perform. 2016, 11, 267–272. [Google Scholar] [CrossRef] [PubMed]
- Di Prampero, P.E. Sprint running: A new energetic approach. J. Exp. Biol. 2005, 208, 2809–2816. [Google Scholar] [CrossRef] [PubMed]
- Chelly, S.M.; Denis, C. Leg power and hopping stiffness: Relationship with sprint running performance. Med. Sci. Sports Exerc. 2001, 33, 326–333. [Google Scholar] [CrossRef] [PubMed]
- Morin, J.B.; Jeannin, T.; Chevallier, B.; Belli, A. Spring-mass model characteristics during sprint running: Correlation with performance and fatigue-induced changes. Int. J. Sports Med. 2006, 27, 158–165. [Google Scholar] [CrossRef] [PubMed]
- Arsac, L.M.; Locatelli, E. Modeling the energetics of 100-m running by using speed curves of world champions. J. Appl. Physiol. 2002, 92, 1781–1788. [Google Scholar] [CrossRef]
- Van Ingen Schenau, G.J.; Jacobs, R.; De Koning, J.J. Can cycle power predict sprint running performance? Eur. J. Appl. Physiol. Occup. Physiol. 1991, 63, 255–260. [Google Scholar] [CrossRef]
- Slawinski, J.; Bonnefoy, A.; Ontanon, G.; Leveque, J.M.; Miller, C.; Riquet, A.; Chéze, L.; Dumas, R. Segment-interaction in sprint start: Analysis of 3D angular velocity and kinetic energy in elite sprinters. J. Biomech. 2010, 43, 1494–1502. [Google Scholar] [CrossRef]
- Di Prampero, P.E.; Botter, A.; Osgnach, C. The energy cost of sprint running and the role of metabolic power in setting top performances. Eur. J. Appl. Physiol. 2014, 115, 451–469. [Google Scholar] [CrossRef]
- Morin, J.B.; Samozino, P.; Bonnefoy, R.; Edouard, P.; Belli, A. Direct measurement of power during one single sprint on treadmill. J. Biomech. 2010, 43, 1970–1975. [Google Scholar] [CrossRef]
- Samozino, P.; Rejc, E.; Di Prampero, P.E.; Belli, A.; Morin, J.B. Optimal force-velocity profile in ballistic movements-Altius: Citius or Fortius? Med. Sci. Sports Exerc. 2012, 44, 313–322. [Google Scholar] [CrossRef]
- Cicchetti, D.V.; Sparrow, S.A. Developing criteria for establishing interrater reliability of specific items: Applications to assessment of adaptive behavior. Am. J. Ment. Defic. 1981, 86, 127–137. [Google Scholar] [PubMed]
- Martínez-Valencia, M.A.; Romero-Arenas, S.; Elvira, J.L.L.; González-Ravé, J.M.; Navarro-Valdivielso, F.; Alcaraz, P.E. Effects of Sled Towing on Peak Force, the Rate of Force Development and Sprint Performance during the Acceleration Phase. J. Hum. Kinet. 2015, 46, 139–148. [Google Scholar] [CrossRef] [PubMed]
- Macadam, P.; Cronin, J.B.; Feser, E.H. Acute and longitudinal effects of weighted vest training on sprint-running performance: A systematic review. Sport. Biomech. 2019, 1–16. [Google Scholar] [CrossRef] [PubMed]
- Kawamori, N.; Newton, R.; Nosaka, K. Effects of weighted sled towing on ground reaction force during the acceleration phase of sprint running. J. Sports Sci. 2014, 32, 1139–1145. [Google Scholar] [CrossRef] [PubMed]


| Mean ± SD | |
|---|---|
| Stature (m) | 1.60 ± 0.06 |
| Body mass (kg) | 53.6 ± 8.9 |
| Maturity Offset (years) | 1.1 ± 1.2 |
| BW–BB2.5 | BW–BB5 | BB2.5–BB5 | ||||
|---|---|---|---|---|---|---|
| T | p | T | p | T | p | |
| T2.5 (s) | −2.09 | 0.051 | −2.97 | 0.008 * | −0.75 | 0.466 |
| T5 (s) | −2.07 | 0.053 | −4.85 | 0.0001 * | −1.37 | 0.188 |
| T10 (s) | −1.66 | 0.115 | −5.59 | 0.00003 * | −2.13 | 0.047 * |
| T15 (s) | −2.14 | 0.046 * | −5.83 | 0.00002 * | −2.52 | 0.021 * |
| T20 (s) | −2.47 | 0.024 * | −5.31 | 0.00005 * | −2.64 | 0.017 * |
| BW | BB2.5 | BB5 | ANOVA RM | ||
|---|---|---|---|---|---|
| mean ± SD | mean ± SD | mean ± SD | F2,36 | p | |
| V0 (m·s−1) | 7.33 ± 0.44 | 7.26 ± 0.46 | 7.19 ± 0.51 | 3.95 | 0.028 * |
| F0 (N) | 525.3 ± 96.2 | 541.8 ± 94.4 | 551.1 ± 130.5 | 1.65 | 0.21 |
| F0rel (N·kg−1) | 9.92 ± 0.91 | 10.28 ± 1.16 | 10.37 ± 1.54 | 1.55 | 0.23 |
| PP (W) | 966.1 ± 206.1 | 984.3 ± 193 | 990.9 ± 237.8 | 0.71 | 0.50 |
| PPrel (W·kg−1) | 18.18 ± 2.08 | 18.61 ± 2.14 | 18.6 ± 2.54 | 0.72 | 0.50 |
| DRF | −0.078 ± 0.009 | −0.079 ± 0.01 | −0.079 ± 0.012 | 0.18 | 0.83 |
| BW–BB2.5 | BW–BB5 | BB2.5–BB5 | ||||||
|---|---|---|---|---|---|---|---|---|
| Cohen’s f | Inference | Cohen’s d | Inference | Cohen’s d | Inference | Cohen’s d | Inference | |
| T2.5 (s) | 0.48 | large | 0.25 | small | 0.08 | null | 0.33 | small |
| T5 (s) | 0.64 | large | 0.25 | small | 0.20 | null | 0.45 | small |
| T10 (s) | 0.70 | large | 0.20 | small | 0.26 | small | 0.47 | small |
| T15 (s) | 0.83 | large | 0.23 | small | 0.25 | small | 0.48 | small |
| T20 (s) | 0.86 | large | 0.23 | small | 0.23 | small | 0.46 | small |
| V0 (m·s−1) | 0.47 | medium | −0.17 | null | −0.13 | null | −0.30 | small |
| F0 (N) | 0.3 | medium | 0.15 | null | 0.09 | null | 0.24 | small |
| F0rel (N·kg−1) | 0.29 | medium | 0.29 | small | 0.08 | null | 0.37 | small |
| PP (W) | 0.2 | small | 0.09 | null | 0.03 | null | 0.12 | null |
| PPrel (W·kg−1) | 0.2 | small | 0.19 | null | 0.00 | null | 0.19 | null |
| DRF | 0.1 | small | −0.1 | null | 0.05 | null | −0.05 | null |
Publisher’s Note: MDPI stays neutral with regard to jurisdictional claims in published maps and institutional affiliations. |
© 2020 by the authors. Licensee MDPI, Basel, Switzerland. This article is an open access article distributed under the terms and conditions of the Creative Commons Attribution (CC BY) license (http://creativecommons.org/licenses/by/4.0/).
Share and Cite
Duca, M.; Trecroci, A.; Perri, E.; Formenti, D.; Alberti, G. Kinematics and Kinetics of Bulgarian-Bag-Overloaded Sprints in Young Athletes. Life 2020, 10, 282. https://doi.org/10.3390/life10110282
Duca M, Trecroci A, Perri E, Formenti D, Alberti G. Kinematics and Kinetics of Bulgarian-Bag-Overloaded Sprints in Young Athletes. Life. 2020; 10(11):282. https://doi.org/10.3390/life10110282
Chicago/Turabian StyleDuca, Marco, Athos Trecroci, Enrico Perri, Damiano Formenti, and Giampietro Alberti. 2020. "Kinematics and Kinetics of Bulgarian-Bag-Overloaded Sprints in Young Athletes" Life 10, no. 11: 282. https://doi.org/10.3390/life10110282
APA StyleDuca, M., Trecroci, A., Perri, E., Formenti, D., & Alberti, G. (2020). Kinematics and Kinetics of Bulgarian-Bag-Overloaded Sprints in Young Athletes. Life, 10(11), 282. https://doi.org/10.3390/life10110282