ITRAQ Proteomic Analysis of Yellow and Black Skin in Jinbian Carp (Cyprinus carpio)


Abstract
1. Introduction
2. Materials and Methods
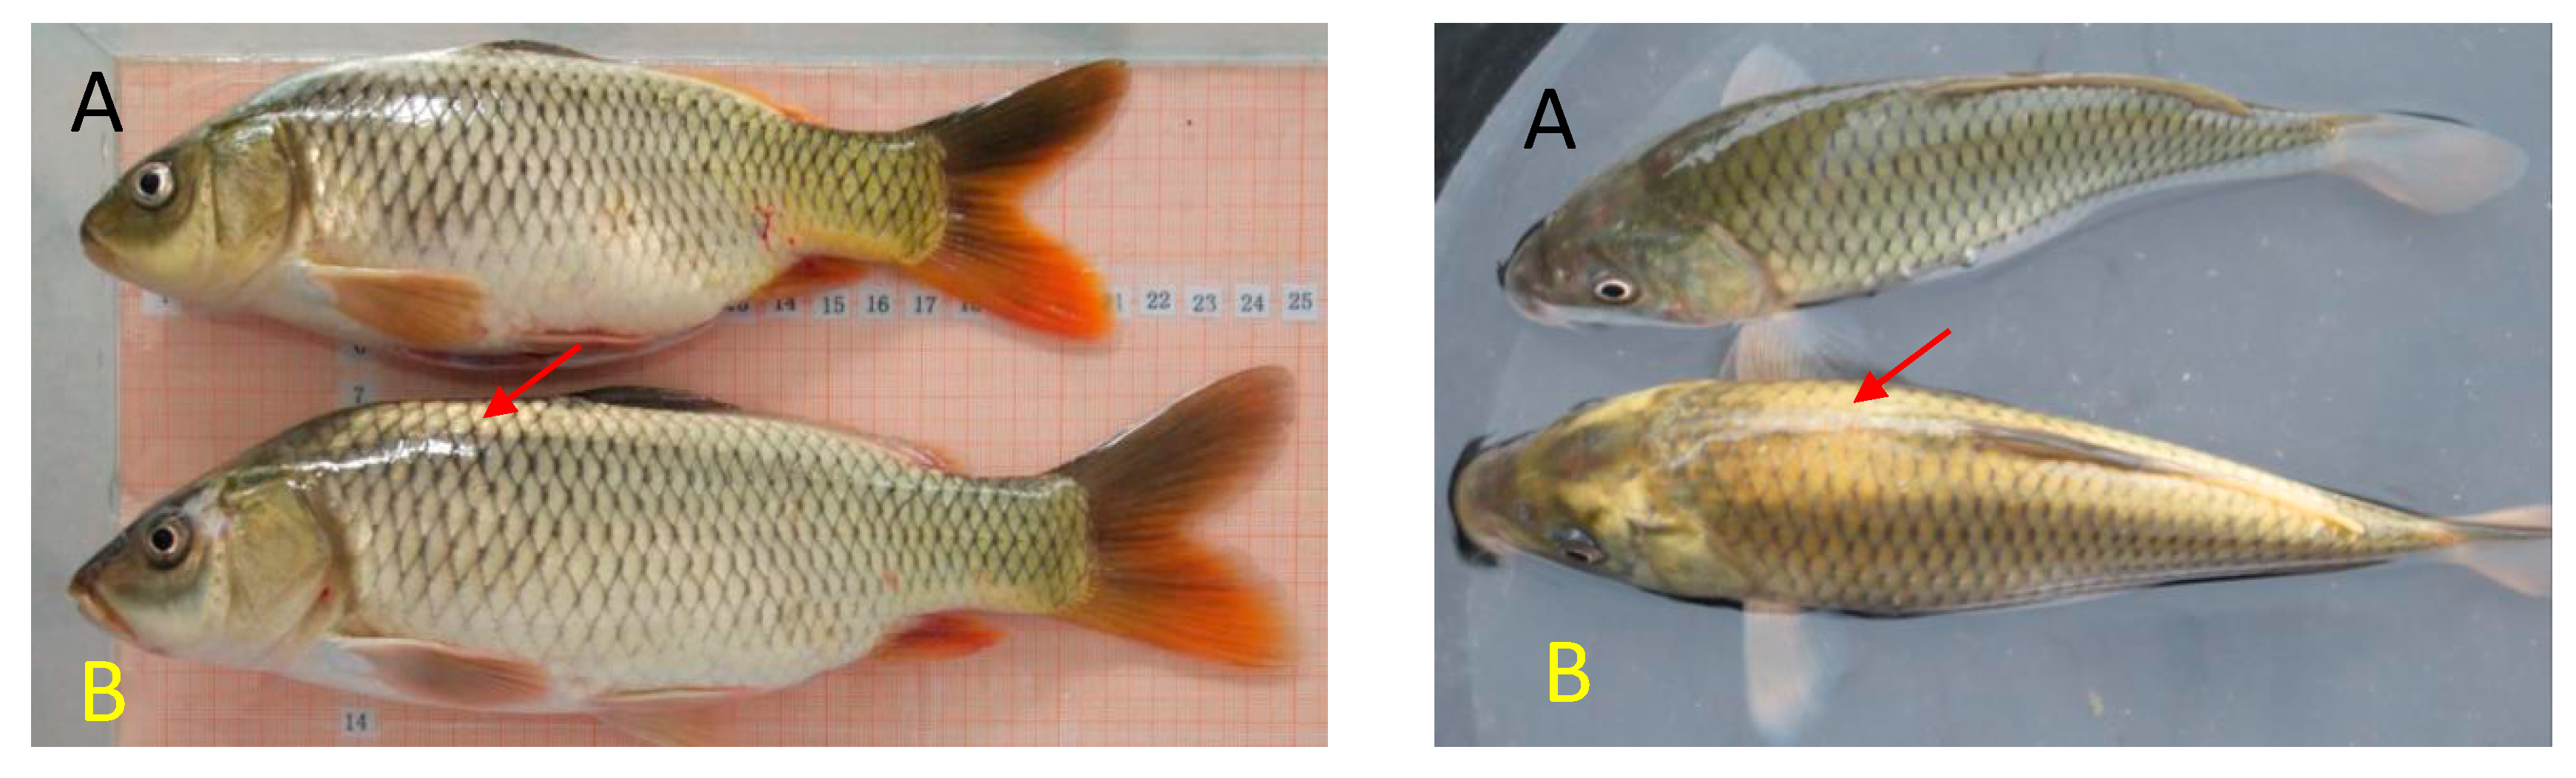
2.1. Sample Preparation
2.2. Protein Preparation and iTRAQ Labeling
2.3. Liquid Chromatography Tandem Mass Spectrometry (LC/LC-MS/MS) Analysis
2.4. Analysis of the Identified Proteins
3. Results
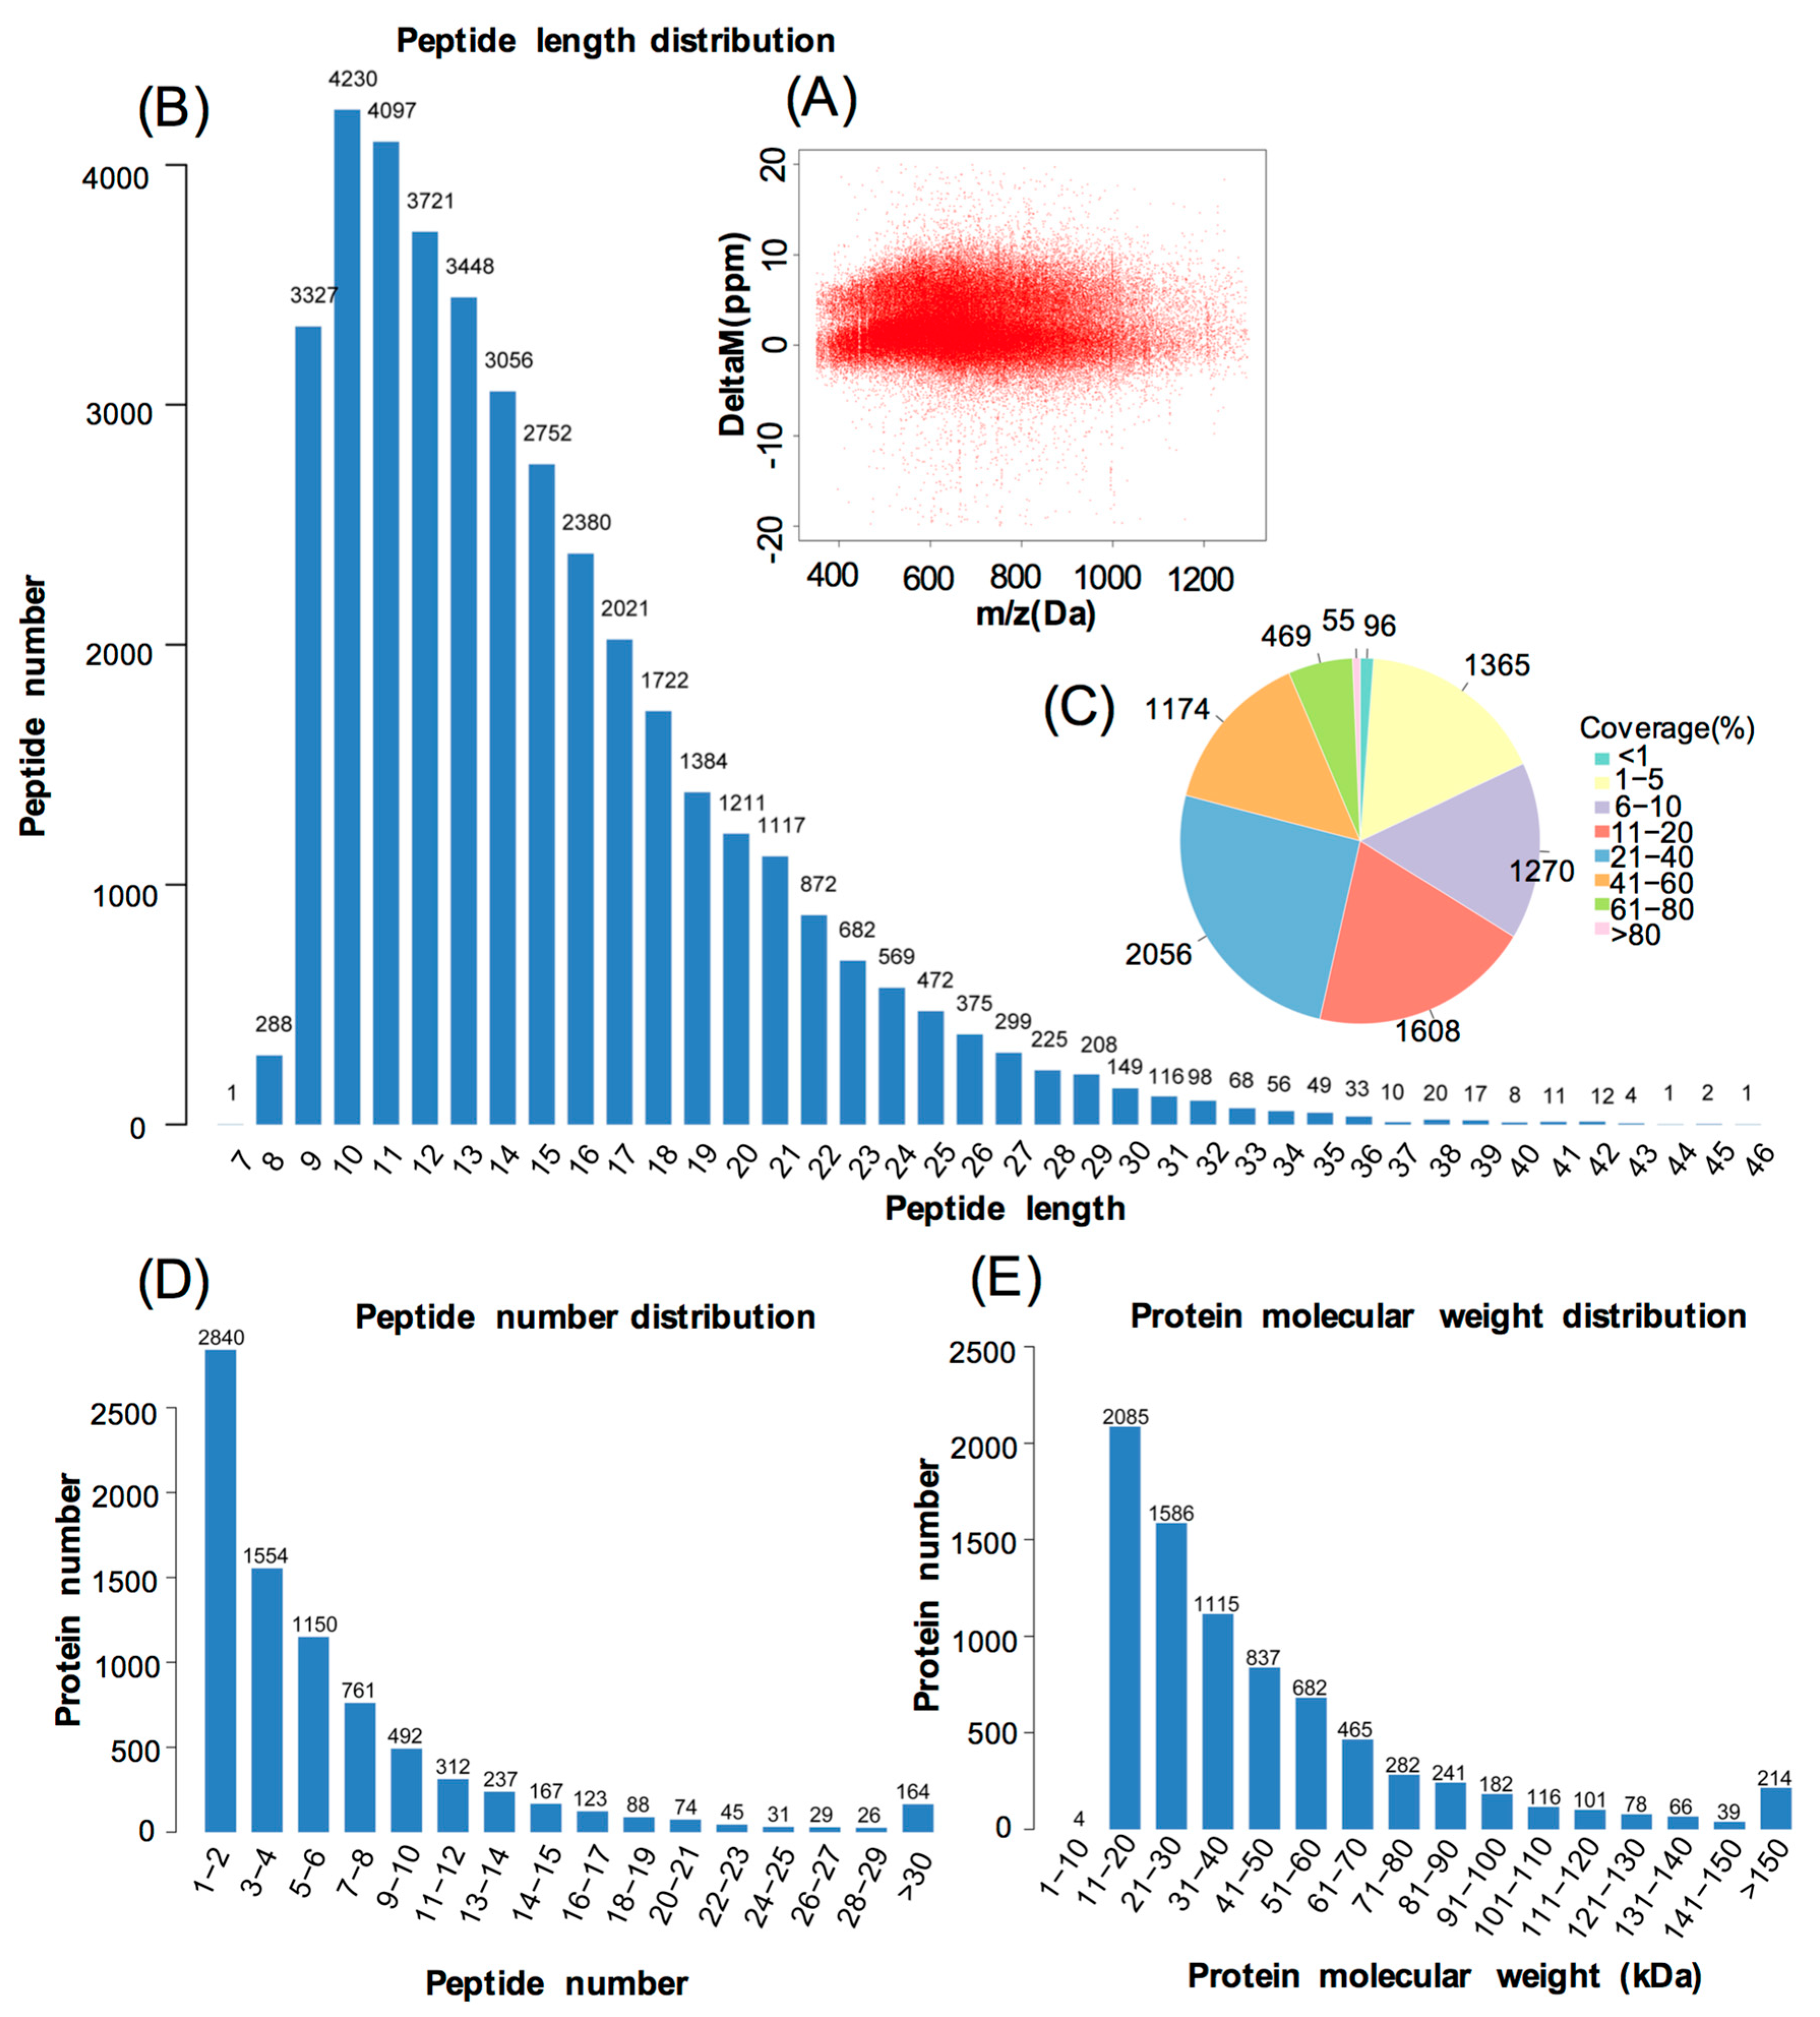
3.1. Protein Identification and Quantitation
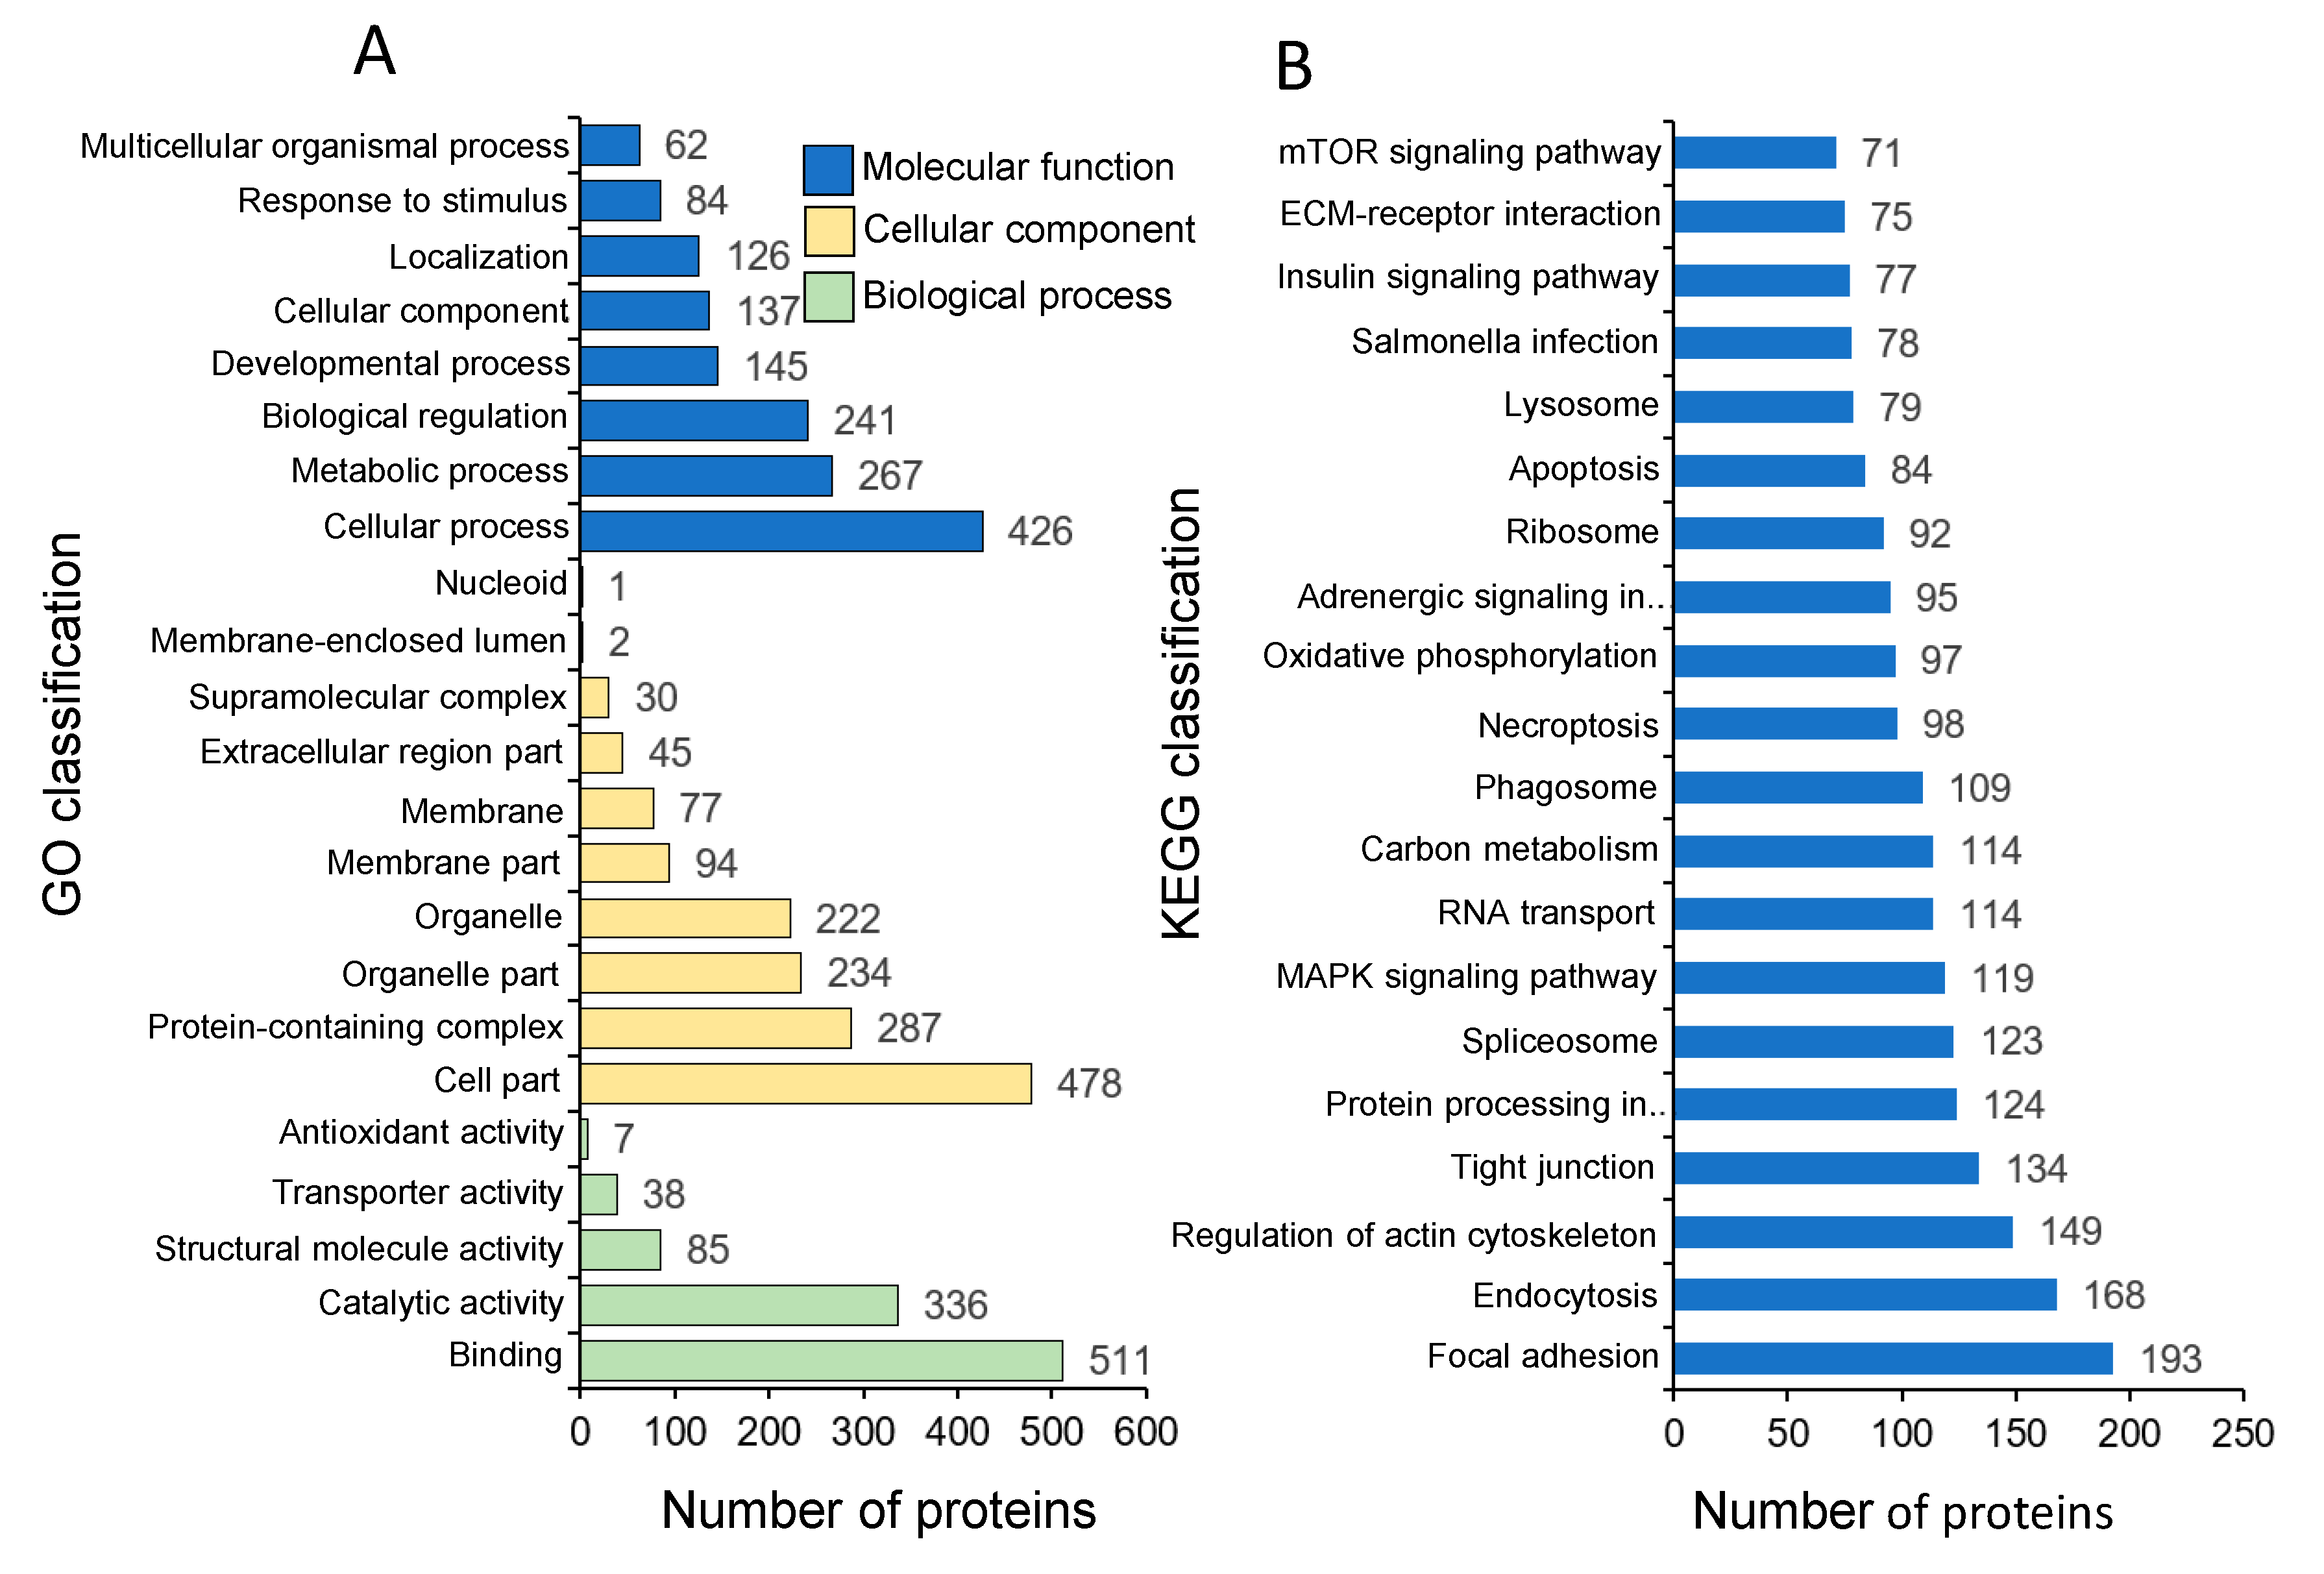
3.2. Identification and GO Classification of the Proteins in Common Carp Skin
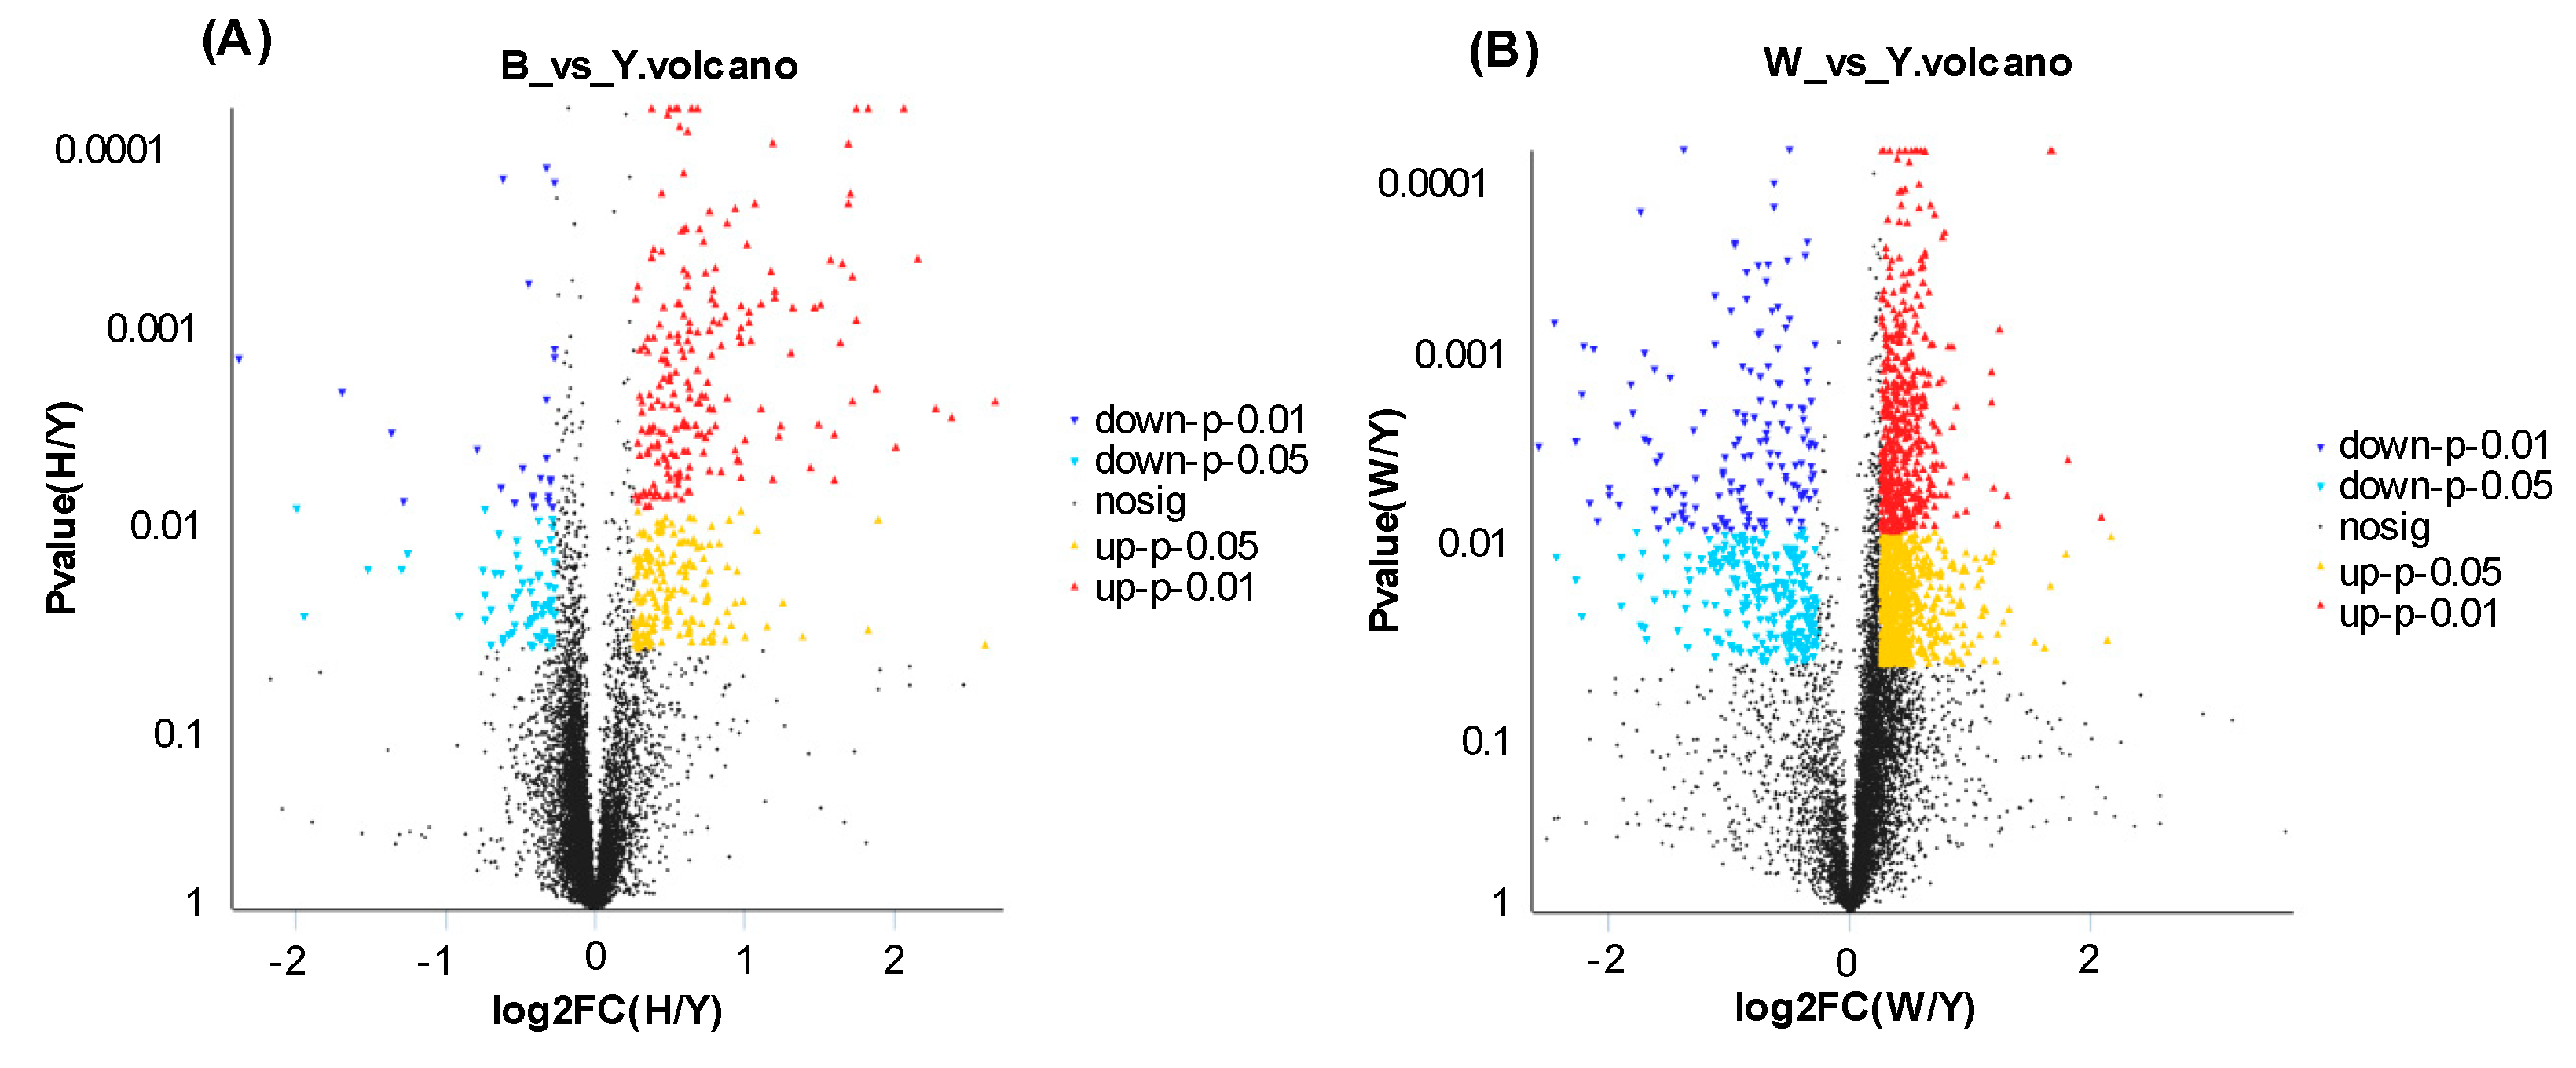
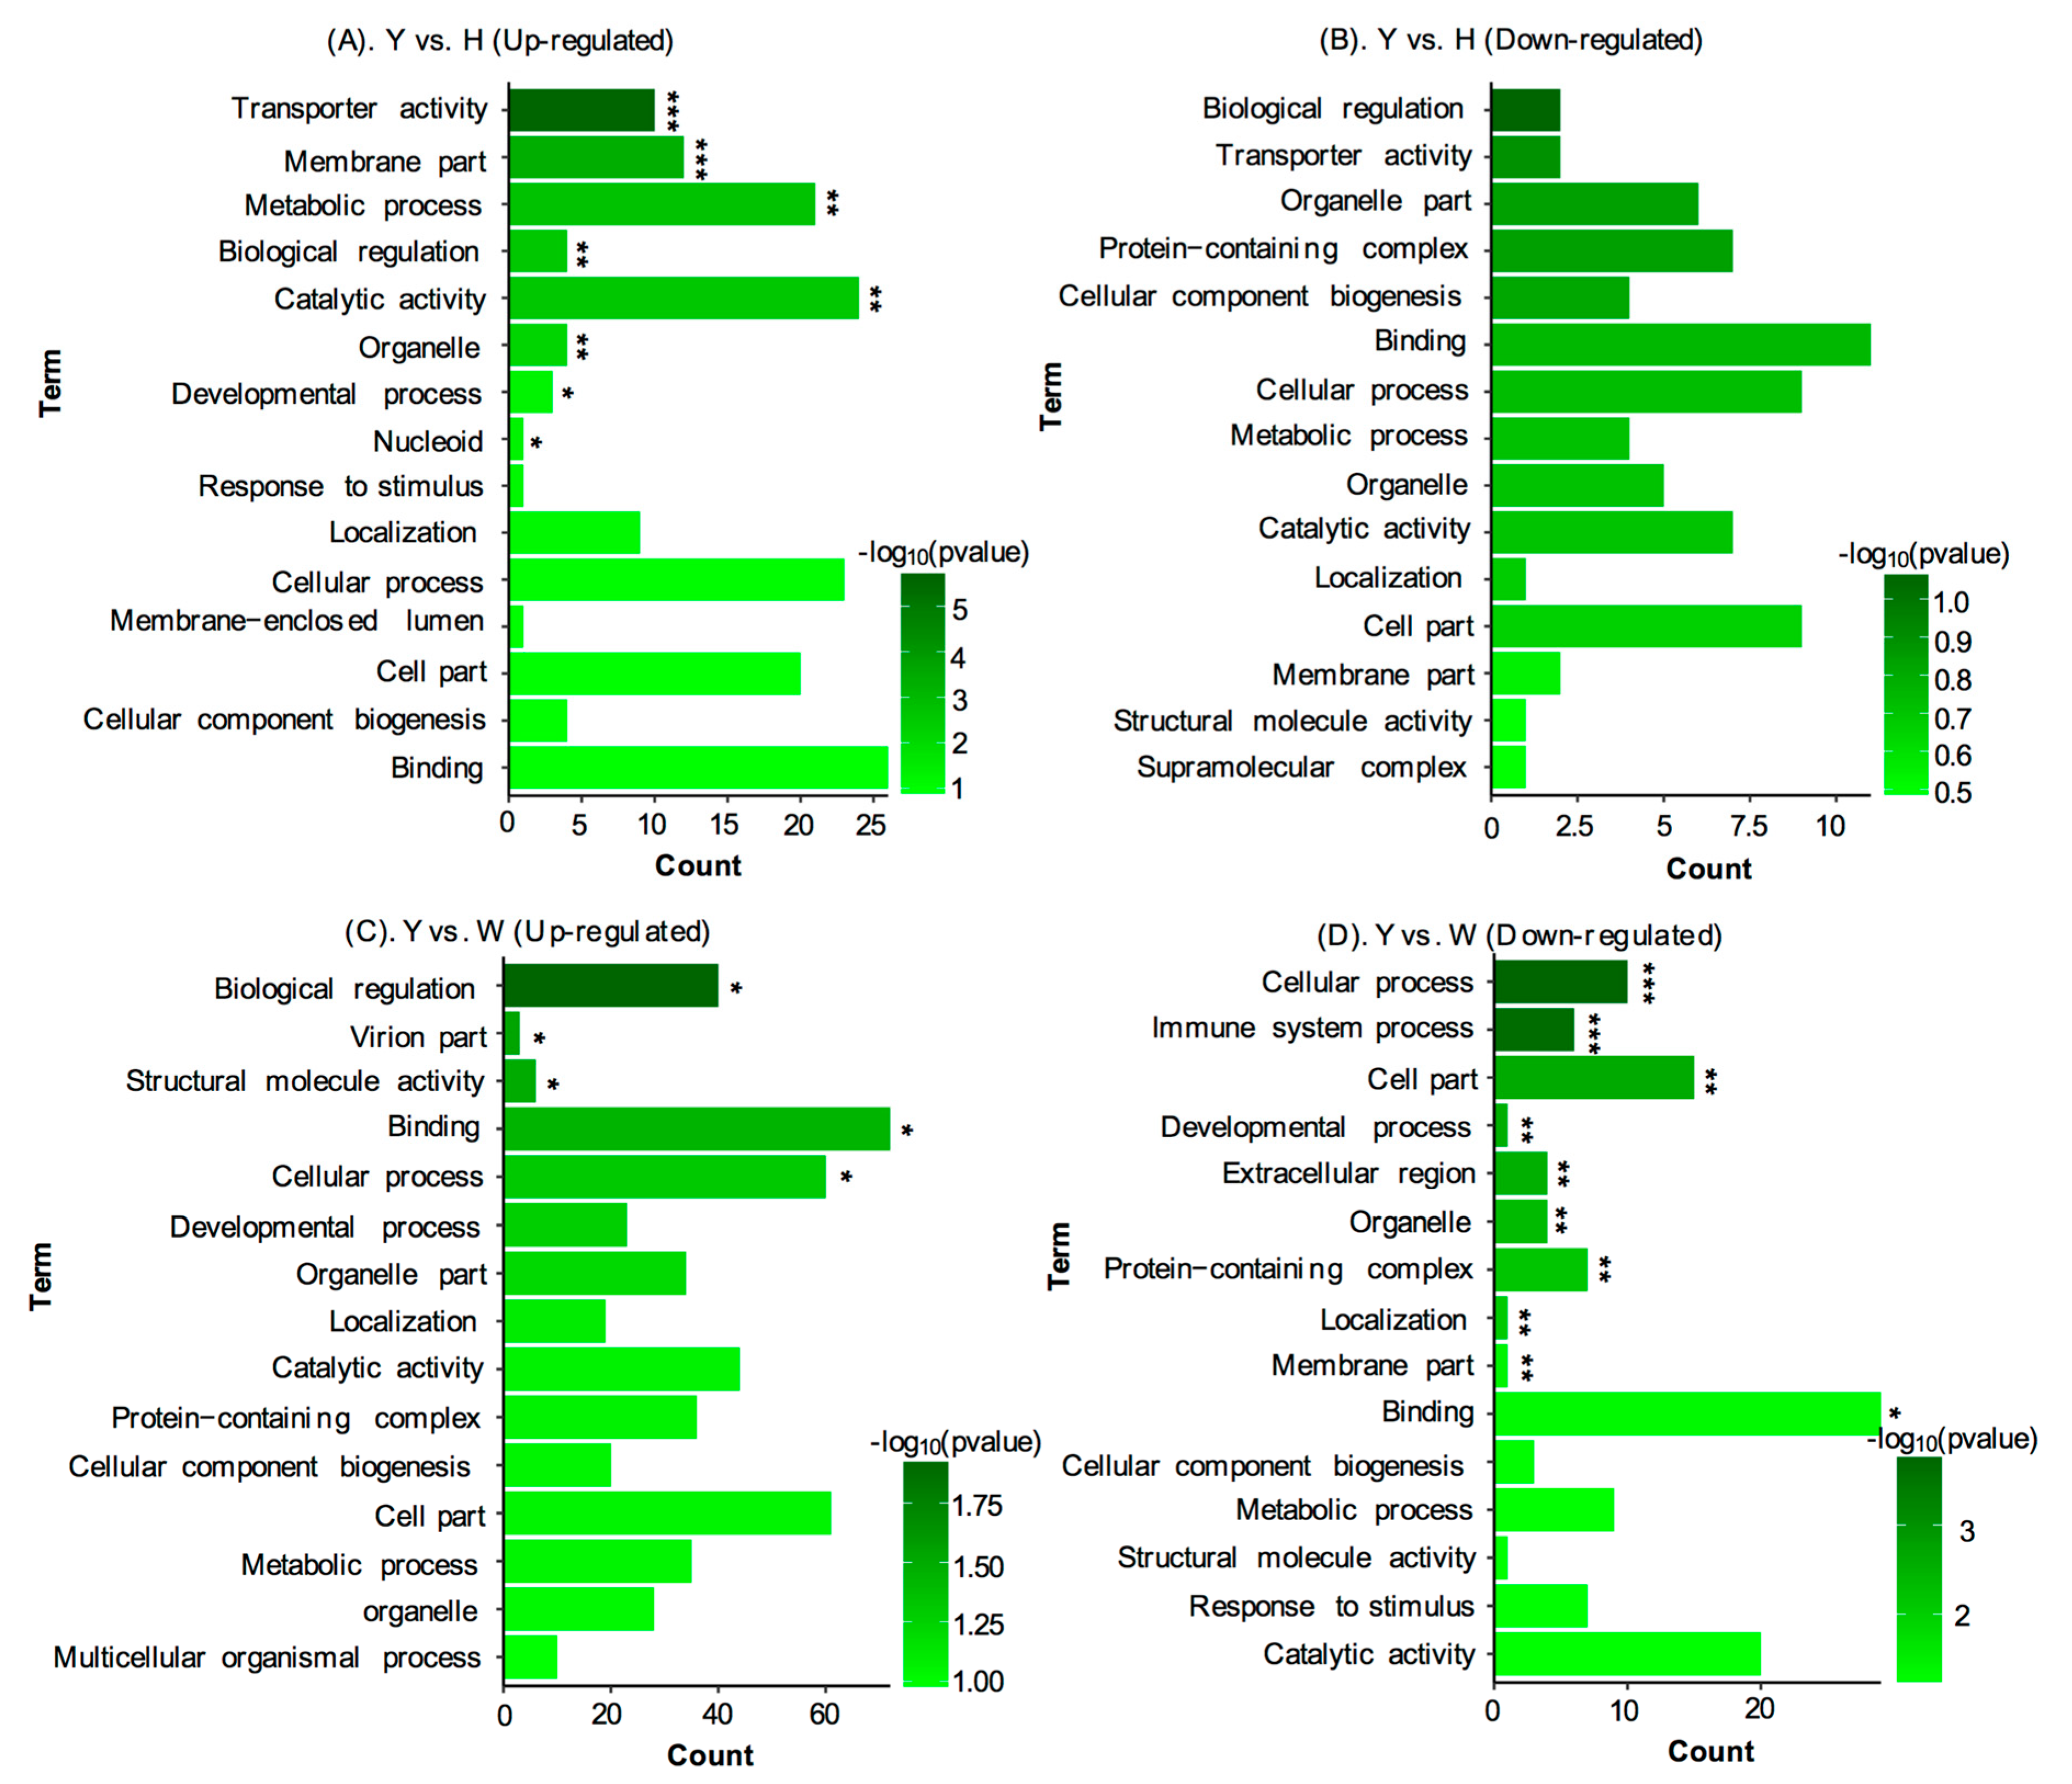
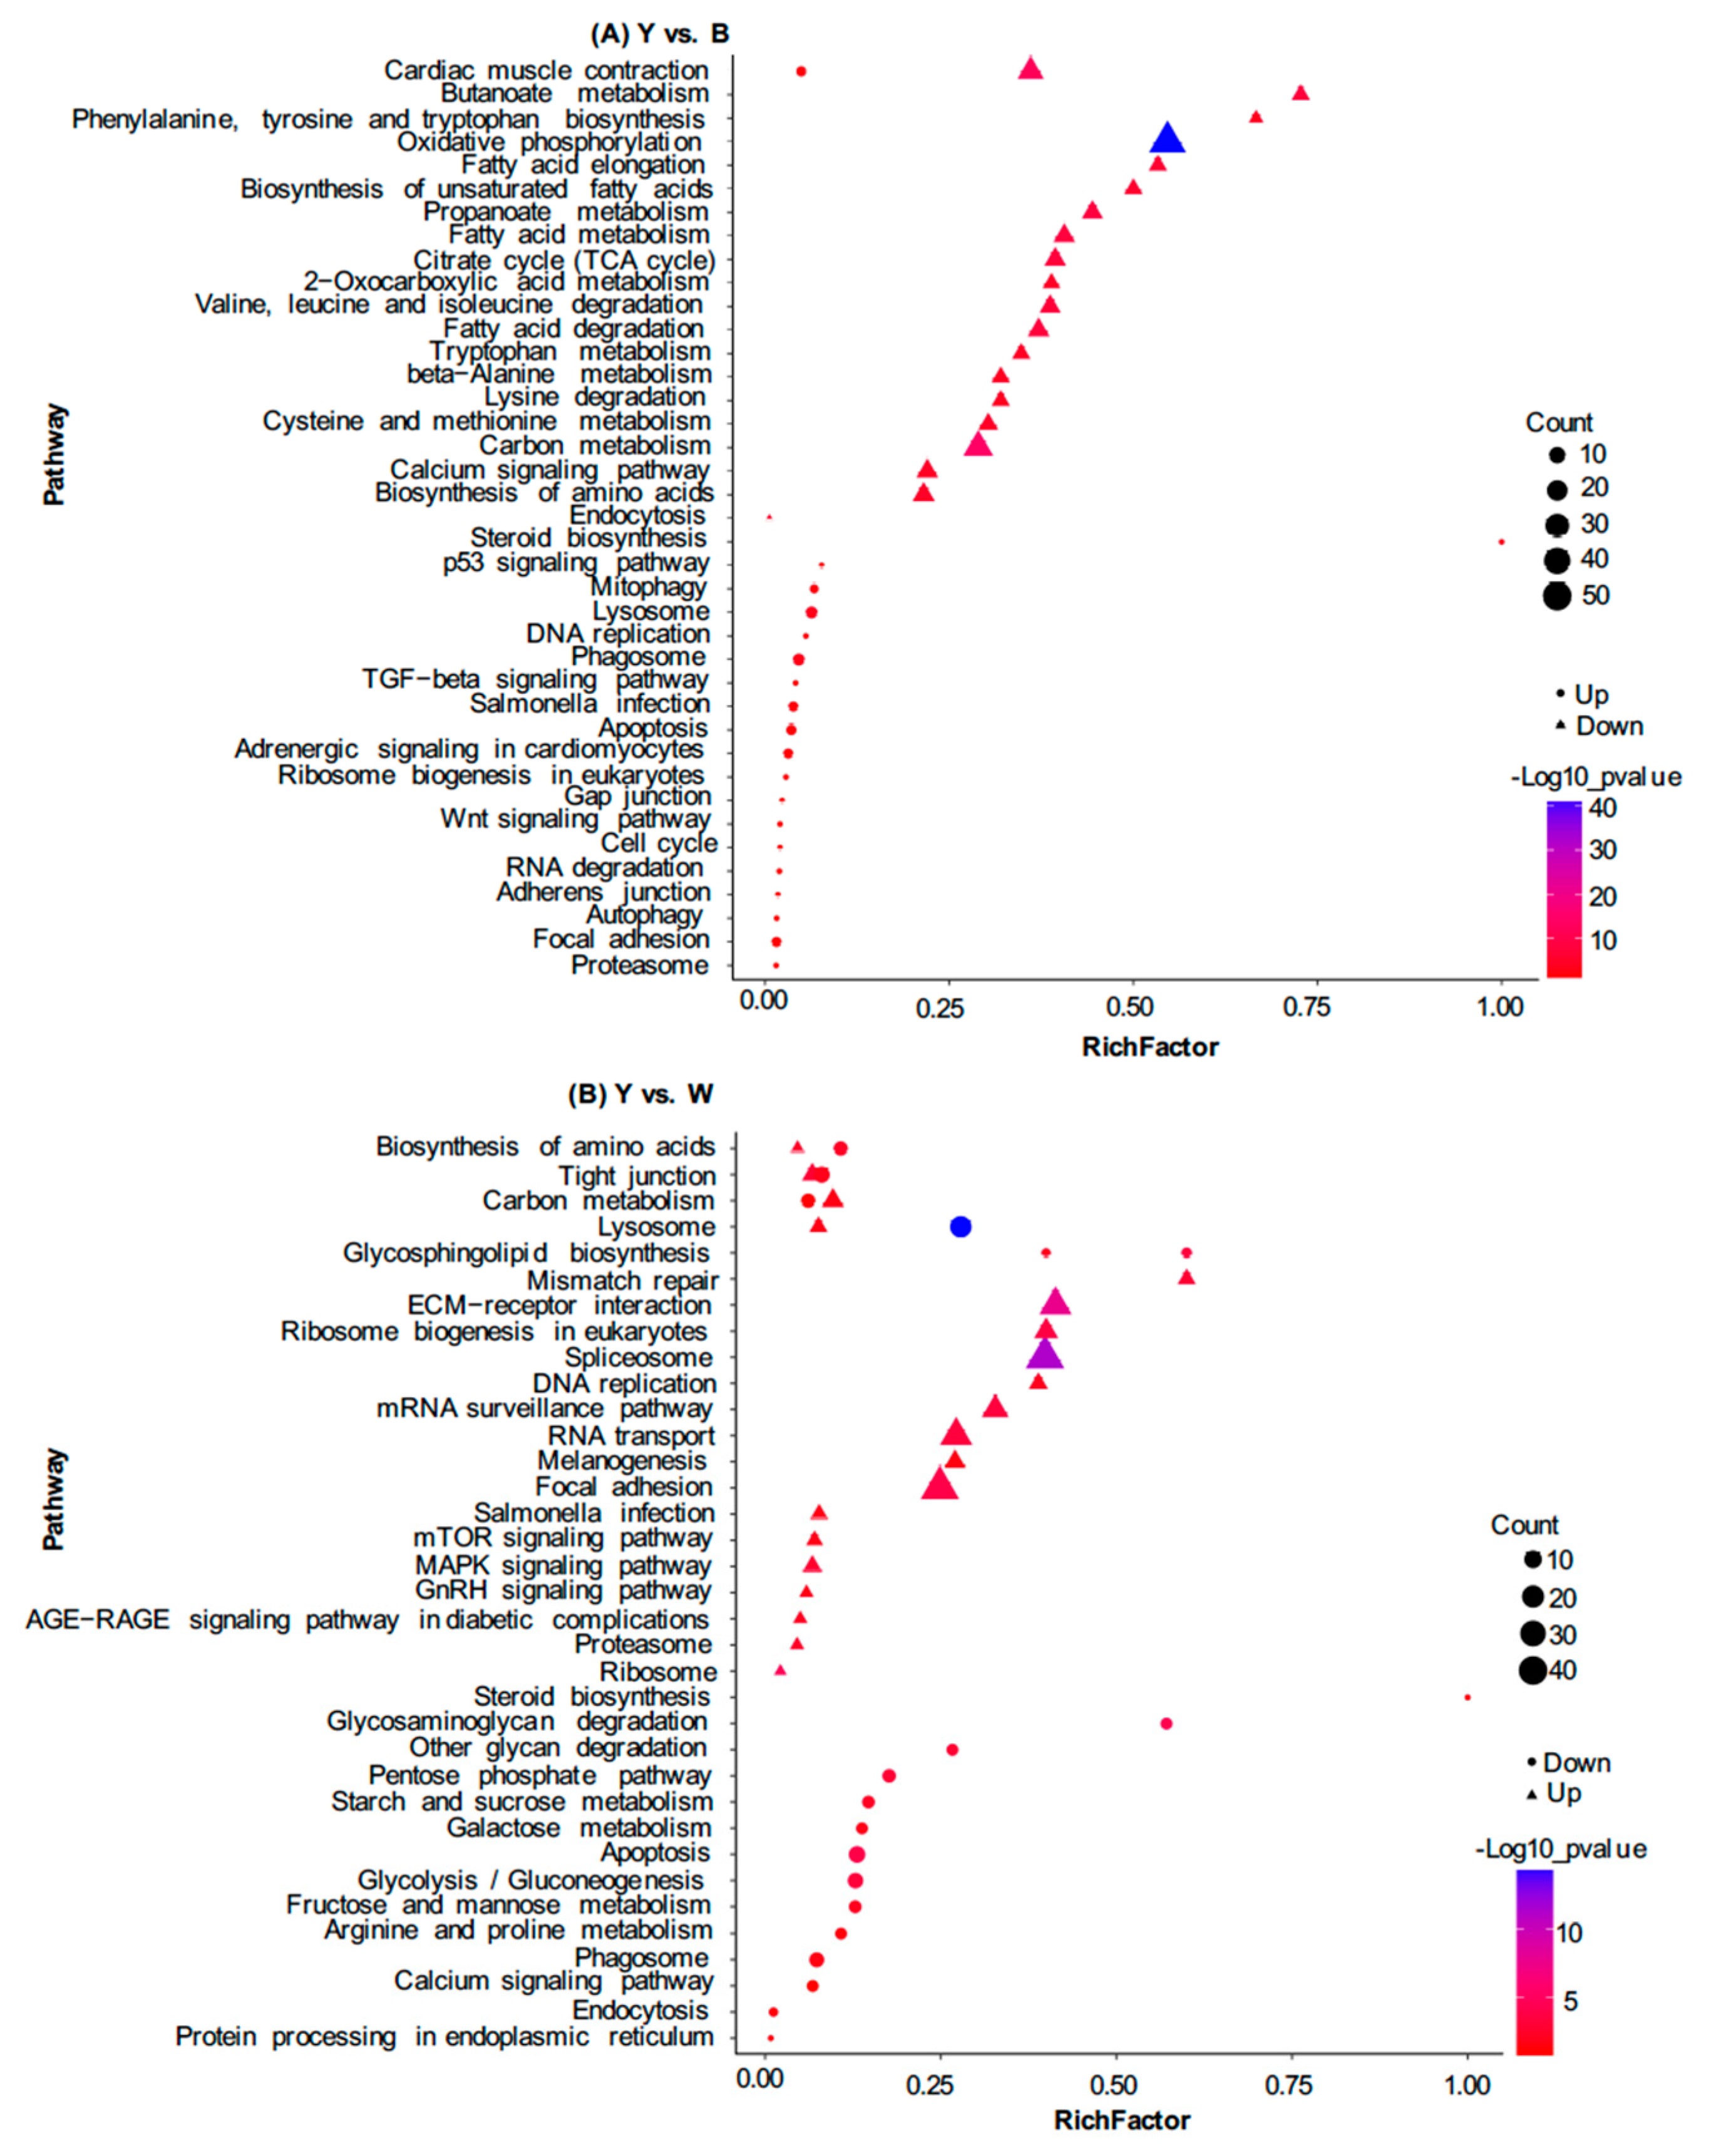
3.3. Identification of Differentially Expressed Proteins (DEPs) between Yellow and Black Skin in Jinbian Carp
3.4. DEP Analysis between Yellow Skin in Jinbian Carp (Y) and Black Skin in Wild Common Carp (W)
4. Discussion
4.1. Skin Proteome Analysis
4.2. Up-Regulated Proteins in Black Skin Indicated the Molecular Mechanism of the Melanin Synthesis Pathway
4.3. Up-Regulated Proteins in Yellow Skin Indicated the Molecular Mechanism of the Pteridine Synthesis Pathways
Supplementary Materials
Author Contributions
Funding
Acknowledgments
Conflicts of Interest
References
- Hubbard, J.K.; Uy, J.A.; Hauber, M.E.; Hoekstra, H.E.; Safran, R.J. Vertebrate pigmentation: From underlying genes to adaptive function. Trends Genet. 2010, 26, 231–239. [Google Scholar] [CrossRef] [PubMed]
- Braasch, I.; Schartl, M.; Volff, J.N. Evolution of pigment synthesis pathways by gene and genome duplication in fish. BMC Evol. Biol. 2007, 7, 74. [Google Scholar] [CrossRef] [PubMed]
- Parichy, D.M. Pigment patterns: Fish in stripes and spots. Curr. Biol. 2003, 13, 947–950. [Google Scholar] [CrossRef] [PubMed]
- Guo, H.; Huang, B.; Qi, F.; Zhang, S. Distribution and ultrastructure of pigment cells in the skins of normal and albino adult turbot, Scophthalmus maximus. Chin. J. Oceanol. Limnol. 2007, 25, 199–208. [Google Scholar] [CrossRef]
- Zarnescu, O. Ultrastructure of the skin melanophores and iridophores in paddlefish, Polyodon spathula. Micron 2007, 38, 81–84. [Google Scholar] [CrossRef]
- Failde, L.D.; Bermudez, R.; Vigliano, F.; Coscelli, G.A.; Quiroga, M.I. Morphological, immunohistochemical and ultrastructural characterization of the skin of turbot (Psetta maxima L.). Tissue Cell 2014, 46, 334–342. [Google Scholar] [CrossRef]
- Haffter, P.; Odenthal, J.; Mullins, M.C.; Lin, S.; Farrell, M.J.; Vogelsang, E.; Haas, F.; Brand, M.; van Eeden, F.J.; Furutani-Seiki, M.; et al. Mutations affecting pigmentation and shape of the adult zebrafish. Dev. Genes Evol. 1996, 206, 260–276. [Google Scholar] [CrossRef]
- Wohlfarth, G.W. Common carp. In Evolution of Domesticated Animals; Mason, J.L., Ed.; Longman: London, UK; New York, NY, USA, 1984; pp. 375–380. [Google Scholar]
- Balon, E.K. The common carp, Cyrpinus carpio: Its wild origin, domestication in aquaculture, and selection as colored nishigoi. Guelph Ichthyol. Rev. 1995, 3, 1–54. [Google Scholar]
- Hulata, G. A review of genetic improvement of the common carp (Cyprinus carpio L.) and other cyprinids by crossbreeding, hybridization and selection. Aquaculture 1995, 129, 143–155. [Google Scholar] [CrossRef]
- Ye, X.; Lv, Y.J.; Wei, L.J.; Huang, J.; Wen, Y.H.; Zhang, G.J.; Zhang, S.; Yang, Z.S.; Liu, K. The complete mitochondrial genome of Jinbian carp Cyprinus carpio (Cypriniformes: Cyprinidae). Mitochondrial DNA Part B 2018, 3, 1096–1097. [Google Scholar] [CrossRef]
- Jia, J.Y.; Liu, X.J.; Li, L.; Lei, C.Q.; Dong, Y.; Wu, G.Q. Transcriptional and translational relationship in environmental stress: RNAseq and ITRAQ proteomic analysis between sexually reproducing and parthenogenetic females in Monia micrura. Front. Physiol. 2018, 9, 812. [Google Scholar] [CrossRef] [PubMed]
- Jiang, Y.L.; Zhang, S.H.; Xu, J.; Feng, J.X.; Mahboob, S.; AI-Ghanim, K.A.; Sun, X.W.; Xu, P. Comparative transcriptome analysis reveals the genetic basis of skin color variation in common carp. PLoS ONE 2014, 9, e108200. [Google Scholar] [CrossRef] [PubMed]
- Ziegler, I. The pteridine pathway in zebrafish: Regulation and specification during the determination of neural crest cell-fate. Pigment Cell Res. 2003, 16, 172–182. [Google Scholar] [CrossRef] [PubMed]
- Harris, J.E.; Hunt, S. The fine structure of the epidermis of two species of salmonid fish, the Atlantic salmon (Salmo salar L.) and the brown trout (Salmo trutta L.): II. mucous cells. Cell Tissue Res. 1975, 163, 535–543. [Google Scholar] [CrossRef]
- Perez-Sanchez, J.; Terova, G.; Simo-Mirabet, P.; Rimoldi, S.; folkedal, O.; Calduch-Giner, J.A.; Olsen, R.E.; Sitja-Bobadilla, A. Skin mucus of gilthead sea bream (Sparus aurata L.). Protein mapping and regulation in chronically stressed fish. Front. Physiol. 2017, 8, 34. [Google Scholar] [CrossRef]
- Phillipson, M.; Johansson, M.E.; Henriksnas, J.; Petersson, J.; Gendler, S.J.; Sandler, S.; Persson, A.E.; Hansson, G.C.; Holm, L. The gastric mucus layers: Constituents and regulation of accumulation. Am. J Physiol. Gastrointest. Liver Physiol. 2008, 29, G806–G812. [Google Scholar] [CrossRef]
- Thornton, D.J.; Rousseau, K.; McGuckin, M.A. Structure and function of the polymeric mucins in airways mucus. Annu. Rev. Physiol. 2008, 70, 459–486. [Google Scholar] [CrossRef]
- Glover, C.N.; Bucking, C.; Wood, C.M. The skin of fish as a transport epithelium: A review. J. Comp. Physiol. B 2013, 183, 877–891. [Google Scholar] [CrossRef]
- Hearing, V.J.; Tsukamoto, K. Enzymatic control of pigmentation in mammals. FASEB J. 1991, 5, 2902–2909. [Google Scholar] [CrossRef]
- del Marmol, V.; Beermann, F. Tyrosinase and related proteins in mammalian pigmentation. FEBS Lett. 1996, 381, 165–168. [Google Scholar] [CrossRef]
- Fujii, R. Coloration and chromatophores. In The Physiology of Fishes; Evans, D.H., Ed.; CRC Press: Boca Raton, FL, USA, 1993; pp. 535–562. [Google Scholar]
- Fukamachi, S.; Asakawa, S.; Wakamatsu, Y.; Shimizu, N.; Mitani, H.; Shima, A. Conserved function of medaka pink-eyed dilution in melanin synthesis and its divergent transcriptional regulation in gonads among vertebrates. Genetics 2004, 168, 1519–1527. [Google Scholar] [CrossRef] [PubMed][Green Version]
- Fukamachi, S.; Shimada, A.; Shima, A. Mutations in the gene encoding B, a novel transporter protein, reduce melanin content in medaka. Nat. Genet. 2001, 28, 381–385. [Google Scholar] [CrossRef] [PubMed]
- Protas, M.E.; Hersey, C.; Kochanek, D.; Zhou, Y.; Wilkens, H.; Jeffery, W.R.; Zon, L.I.; Borowsky, R.; Tabin, C.J. Genetic analysis of cavefish reveals molecular convergence in the evolution of albinism. Nat. Genet. 2006, 38, 107–111. [Google Scholar] [CrossRef] [PubMed]
- Schonthaler, H.B.; Lampert, J.M.; von Lintig, J.; Schwarz, H.; Geisler, R.; Neuhauss, S.C. A mutation in the silver gene leads to defects in melanosome biogenesis and alterations in the visual system in the zebrafish mutant fading vision. Dev. Biol. 2005, 284, 421–436. [Google Scholar] [CrossRef]
- Lamason, R.L.; Mohideen, M.A.; Mest, J.R.; Wong, A.C.; Norton, H.L.; Aros, M.C.; Jurynec, M.J.; Mao, X.; Humphreville, V.R.; Humbert, J.E.; et al. SLC24A5, a putative cation exchanger, affects pigmentation in zebrafish and humans. Science 2005, 310, 1782–1786. [Google Scholar] [CrossRef]
- Dooley, C.M.; Schwarz, H.; Mueller, K.P.; Mongera, A.; Konantz, M.; Neuhauss, S.C.F.; Nüsslein-Volhard, C.; Geisler, R. Slc45a2 and V-ATPase are regulators of melanosomal pH homeostasis in zebrafish, providing a mechanism for human pigment evolution and disease. Pigment Cell Melanoma Res. 2013, 26, 205–217. [Google Scholar] [CrossRef]
- Yan, X.; Wie, L.; Huang, J.; Wang, J.; Yang, Z.; Gan, B.; Liu, K.; Teng, Z.; Zhang, S.; Ye, X. Comparative skin transcriptome between common carp and the variety Jinbian carp (Cyprinus carpio v. jinbian). Aquac. Res. 2020, 51, 187–196. [Google Scholar] [CrossRef]
- Le Guyader, S.; Maier, J.; Jesuthasan, S. Esrom, an ortholog of PAM (protein associated with c-myc), regulates pteridine synthesis in the zebrafish. Dev. Biol. 2005, 277, 378–386. [Google Scholar] [CrossRef]


| Uniprot_ID | Gene | Description | FC(B/Y) | p Value |
|---|---|---|---|---|
| MLRB_CHICK | N/A | Myosin regulatory light chain 2B | 6.34 | 0.0029041 |
| MYL4_HUMAN | MYL4 | Myosin light chain 4 | 5.22 | 0.0035055 |
| TNNT2_CHICK | TNNT2 | Troponin T | 4.44 | 0.0005641 |
| MYPC3_CHICK | MYBPC3 | Myosin-binding protein C | 4.16 | 7.544 × 10⁻⁵ |
| TNNT3_HUMAN | TNNT3 | Troponin T | 4.01 | 0.0049163 |
| TNNI1_HUMAN | TNNI1 | Troponin I | 3.53 | 2.086 × 10⁻⁵ |
| MYH7_HUMAN | MYH7 | Myosin-7 | 3.53 | 0.0402934 |
| AT2A1_MAKNI | atp2a1 | Sarcoplasmic/endoplasmic reticulum calcium ATPase 1 | 3.28 | 0.0028990 |
| TPM1_LIZAU | N/A | Tropomyosin alpha-1 chain | 3.27 | 0.0002662 |
| TNNI3_XENLA | tnni3 | Troponin I | 3.22 | 0.0001500 |
| COX42_THUOB | N/A | Cytochrome c oxidase subunit 4 isoform 2 | 3.11 | 0.0014771 |
| TNNI1_MOUSE | Tnni1 | Troponin I | 3.03 | 0.0042539 |
| ACTN4_CHICK | ACTN4 | Alpha-actinin-4 | 2.82 | 0.0037840 |
| ACTN2_CHICK | ACTN2 | Alpha-actinin-2 | 2.75 | 0.0009886 |
| HHATL_HUMAN | HHATL | Protein-cysteine N-palmitoyltransferase HHAT-like protein | 2.71 | 0.0062292 |
| MYPC1_HUMAN | MYBPC1 | Myosin-binding protein C | 2.61 | 0.0433731 |
| NNTM_HUMAN | NNT | NAD(P) transhydrogenase | 2.50 | 0.0009916 |
| KCRB_CHICK | CKB | Creatine kinase B-type | 2.48 | 0.0016669 |
| PYGM_MACFA | PYGM | Glycogen phosphorylase | 2.36 | 0.0038506 |
| IDHP_MACFA | IDH2 | Isocitrate dehydrogenase [NADP] | 2.34 | 0.0043346 |
| AT2A2_CHICK | ATP2A2 | Sarcoplasmic/endoplasmic reticulum calcium ATPase 2 | 2.30 | 0.0008799 |
| ACTC_RAT | Actc1 | Actin | 2.27 | 0.0071161 |
| AATM_RAT | Got2 | Aspartate aminotransferase | 2.25 | 0.0006509 |
| MYH7_PIG | MYH7 | Myosin-7 | 2.22 | 0.0386928 |
| UCRI_AOTAZ | UQCRFS1 | Cytochrome b-c1 complex subunit Rieske | 2.15 | 0.0031625 |
| SRCA_MOUSE | Srl | Sarcalumenin | 2.09 | 0.0002984 |
| NEBU_HUMAN | NEB | Nebulin | 1.96 | 0.0014726 |
| ECHA_MOUSE | Hadha | Trifunctional enzyme subunit alpha | 1.96 | 0.0102789 |
| NDUA4_DANRE | ndufa4 | Cytochrome c oxidase subunit NDUFA4 | 1.96 | 0.0069833 |
| MYH6_MOUSE | Myh6 | Myosin-6 | 1.93 | 0.0204875 |
| MYH7_MOUSE | Myh7 | Myosin-7 | 1.91 | 0.0294791 |
| COX5A_MOUSE | Cox5a | Cytochrome c oxidase subunit 5A | 1.90 | 0.0003158 |
| MYH7_HORSE | MYH7 | Myosin-7 | 1.84 | 0.0194304 |
| MDHM_FRAAN | MMDHI | Malate dehydrogenase | 1.82 | 0.0010926 |
| GLYM_RABIT | SHMT2 | Serine hydroxymethyltransferase | 1.82 | 0.0453498 |
| DESM_PIG | DES | Desmin | 1.79 | 0.0065272 |
| ATPA_PIG | ATP5F1A | ATP synthase subunit alpha | 1.78 | 0.0011789 |
| ATP5J_PONAB | ATP5J | ATP synthase-coupling factor 6 | 1.77 | 0.0148907 |
| ACSL1_CAVPO | ACSL1 | Long-chain-fatty-acid--CoA ligase 1 | 1.75 | 0.0038413 |
| MYO6_CHICK | MYO6 | Unconventional myosin-VI | 1.75 | 0.0009482 |
| CISY_DANRE | cs | Citrate synthase | 1.73 | 0.0008091 |
| KPYM_CHICK | PKM | Pyruvate kinase PKM | 1.71 | 0.0122511 |
| UCRI_MOUSE | Uqcrfs1 | Cytochrome b-c1 complex subunit Rieske | 1.70 | 0.0031496 |
| ACADM_RAT | Acadm | Medium-chain specific acyl-CoA dehydrogenase | 1.70 | 0.0438522 |
| SYPH_MOUSE | Syp | Synaptophysin | 1.70 | 0.0041077 |
| AT5F1_PONAB | ATP5F1 | ATP synthase F(0) complex subunit B1 | 1.69 | 0.0064455 |
| ADT3_BOVIN | SLC25A6 | ADP/ATP translocase 3 | 1.69 | 0.0150770 |
| NLS1B_DANRE | mfsd2ab | Sodium-dependent lysophosphatidylcholine symporter 1-B | 1.68 | 0.0272424 |
| ECHA_RAT | Hadha | Trifunctional enzyme subunit alpha | 1.67 | 0.0027369 |
| ADT2_BOVIN | SLC25A5 | ADP/ATP translocase 2 | 1.66 | 0.0289562 |
| ACON_BOVIN | ACO2 | Aconitate hydratase | 1.66 | 0.0006630 |
| KCNV1_BOVIN | KCNV1 | Potassium voltage-gated channel subfamily V member 1 | 1.65 | 0.0236049 |
| PGAM2_HUMAN | PGAM2 | Phosphoglycerate mutase 2 | 1.64 | 0.0458743 |
| ECHB_MACFA | HADHB | Trifunctional enzyme subunit beta | 1.64 | 0.0153694 |
| NDUAA_HUMAN | NDUFA10 | NADH dehydrogenase [ubiquinone] 1 alpha subcomplex subunit 10 | 1.64 | 0.0027091 |
| ADT1_BOVIN | SLC25A4 | ADP/ATP translocase 1 | 1.64 | 0.0373976 |
| NDUS4_HUMAN | NDUFS4 | NADH dehydrogenase [ubiquinone] iron-sulfur protein 4 | 1.61 | 1.724 × 10⁻⁵ |
| MYOZ2_PONAB | MYOZ2 | Myozenin-2 | 1.60 | 0.0020216 |
| Uniprot_ID | Gene | Description | FC(Y/B) | p Value |
|---|---|---|---|---|
| FXR2_HUMAN | FXR2 | Fragile X mental retardation syndrome-related protein 2 | 5.18 | 0.0018055 |
| MYPC2_MOUSE | Mybpc2 | Myosin-binding protein C | 3.99 | 0.0101018 |
| TPM1_LIZAU | N/A | Tropomyosin alpha-1 chain | 3.21 | 0.0026475 |
| PRV7_DANRE | pvalb7 | Parvalbumin-7 | 2.86 | 0.0203993 |
| TPM1_XENLA | tpm1 | Tropomyosin alpha-1 chain | 2.57 | 0.0042248 |
| CP110_HUMAN | CCP110 | Centriolar coiled-coil protein of 110 kDa | 2.45 | 0.0203727 |
| LEG12_HUMAN | LGALS12 | Galectin-12 | 1.73 | 0.0051317 |
| H11_HUMAN | HIST1H1A | Histone H1.1 | 1.68 | 0.0206282 |
| COCA1_MOUSE | Col12a1 | Collagen alpha-1(XII) chain | 1.67 | 0.0363538 |
| LEG4_BOVIN | LGALS4 | Galectin-4 | 1.66 | 0.0101980 |
| TITIN_MOUSE | Ttn | Titin | 1.62 | 0.0323899 |
| TITIN_HUMAN | TTN | Titin | 1.62 | 0.0486235 |
| RHOG_HUMAN | RHOG | Rho-related GTP-binding protein RhoG | 1.59 | 0.0213023 |
| COCA1_HUMAN | COL12A1 | Collagen alpha-1(XII) chain | 1.56 | 0.0135574 |
| CAHZ_DANRE | cahz | Carbonic anhydrase | 1.45 | 0.0387359 |
| C2D1B_XENLA | cc2d1b | Coiled-coil and C2 domain-containing protein 1B | 1.43 | 0.0146113 |
| PLPP1_CAVPO | PLPP1 | Phospholipid phosphatase 1 | 1.42 | 0.0265325 |
| EIF1B_HUMAN | EIF1B | Eukaryotic translation initiation factor 1b | 1.42 | 0.0201610 |
| BRE1A_HUMAN | RNF20 | E3 ubiquitin-protein ligase BRE1A | 1.40 | 0.0237980 |
| HCE1_ORYLA | hcea | High choriolytic enzyme 1 | 1.35 | 0.0377692 |
| SPTB2_MOUSE | Sptbn1 | Spectrin beta chain | 1.34 | 0.0234210 |
| HBB1_DANRE | ba1 | Hemoglobin subunit beta-1 | 1.34 | 0.0356035 |
| B3AT_ONCMY | slc4a1 | Band 3 anion exchange protein | 1.33 | 0.0495074 |
| DMD_PIG | DMD | Dystrophin | 1.33 | 0.0089534 |
| AQP3_MOUSE | Aqp3 | Aquaporin-3 | 1.32 | 0.0099533 |
| H3_DROME | His3 | Histone H3.2 | 1.32 | 0.0314604 |
| MCM7_XENTR | mcm7 | DNA replication licensing factor mcm7 | 1.32 | 0.0348232 |
| H2B12_XENLA | N/A | Histone H2B 1.2 | 1.31 | 0.0439092 |
| NLRC3_HUMAN | NLRC3 | Protein NLRC3 | 1.31 | 0.0217364 |
| GOLP3_MOUSE | Golph3 | Golgi phosphoprotein 3 | 1.30 | 0.0116354 |
| TSP1_XENLA | thbs1 | Thrombospondin-1 | 1.30 | 0.0151795 |
| PSA2_CARAU | psma2 | Proteasome subunit alpha type-2 | 1.29 | 0.0222874 |
| FKBP5_HUMAN | FKBP5 | Peptidyl-prolyl cis-trans isomerase FKBP5 | 1.29 | 0.0071276 |
| FLNC_RAT | Flnc | Filamin-C | 1.29 | 0.0458236 |
| RALB_MACFA | RALB | Ras-related protein Ral-B | 1.26 | 0.0165614 |
| CP3AA_MESAU | CYP3A10 | Lithocholate 6-beta-hydroxylase | 1.26 | 0.0305838 |
| CD63_MOUSE | Cd63 | CD63 antigen | 1.25 | 0.0002011 |
| ZYX_CHICK | ZYX | Zyxin | 1.24 | 0.0092652 |
| CATL_SARPE | N/A | Cathepsin L | 1.24 | 0.0087340 |
| PTX3_MOUSE | Ptx3 | Pentraxin-related protein PTX3 | 1.23 | 0.0302834 |
| CATZ_RAT | Ctsz | Cathepsin Z | 1.23 | 0.0072279 |
| DYHC1_MOUSE | Dync1h1 | Cytoplasmic dynein 1 heavy chain 1 | 1.23 | 0.0327325 |
| AR6P6_BOVIN | ARL6IP6 | ADP-ribosylation factor-like protein 6-interacting protein 6 | 1.23 | 0.0445232 |
| TPM3_MOUSE | Tpm3 | Tropomyosin alpha-3 chain | 1.23 | 0.0293024 |
| TBD2B_MOUSE | Tbc1d2b | TBC1 domain family member 2B | 1.22 | 0.0450312 |
| NEBU_HUMAN | NEB | Nebulin | 1.22 | 0.0288621 |
| LSM3_MOUSE | Lsm3 | U6 snRNA-associated Sm-like protein LSm3 | 1.21 | 0.0099663 |
| TXB1B_DANRE | tax1bp1b | Tax1-binding protein 1 homolog B | 1.21 | 0.0473674 |
| HEPH_MOUSE | Heph | Hephaestin | 1.21 | 0.0252919 |
| CAD26_HUMAN | CDH26 | Cadherin-like protein 26 | 1.21 | 0.0214089 |
| NIBL1_HUMAN | FAM129B | Niban-like protein 1 | 1.21 | 0.0188033 |
| CNN1_MUSPF | CNN1 | Calponin-1 | 1.21 | 0.0017860 |
| Uniprot_ID | Gene | Description | FC(W/Y) | p Value |
|---|---|---|---|---|
| HIBCH_DANRE | hibch | 3-hydroxyisobutyryl-CoA hydrolase | 4.52 | 0.0106552 |
| RD23A_MOUSE | Rad23a | UV excision repair protein RAD23 homolog A | 3.47 | 0.0130752 |
| MREG_DANRE | mreg | Melanoregulin | 3.20 | 3.6735 × 10⁻⁵ |
| LAMB1_HUMAN | LAMB1 | Laminin subunit beta-1 | 3.18 | 0.0192734 |
| FBXL7_MOUSE | Fbxl7 | F-box/LRR-repeat protein 7 | 2.48 | 0.0064965 |
| MX2_ONCMY | mx2 | Interferon-induced GTP-binding protein Mx2 | 2.43 | 0.0299254 |
| K1C1_CARAU | N/A | Keratin | 2.36 | 0.0008656 |
| ST2B1_MOUSE | Sult2b1 | Sulfotransferase family cytosolic 2B member 1 | 2.27 | 0.0020935 |
| TBCB_BOVIN | TBCB | Tubulin-folding cofactor B | 2.26 | 0.0141326 |
| CMYA5_HUMAN | CMYA5 | Cardiomyopathy-associated protein 5 | 2.17 | 0.0476189 |
| NFL_COTJA | NEFL | Neurofilament light polypeptide | 2.14 | 0.0275144 |
| ETFA_HUMAN | ETFA | Electron transfer flavoprotein subunit alpha | 1.97 | 0.0429857 |
| MYPC3_CHICK | MYBPC3 | Myosin-binding protein C | 1.92 | 0.0243995 |
| RDH12_HUMAN | RDH12 | Retinol dehydrogenase 12 | 1.92 | 0.0340642 |
| CWC22_DANRE | cwc22 | Pre-mRNA-splicing factor CWC22 homolog | 1.89 | 0.0230742 |
| AT2A1_MAKNI | atp2a1 | Sarcoplasmic/endoplasmic reticulum calcium ATPase 1 | 1.85 | 0.0471695 |
| PLEC_MOUSE | Plec | Plectin | 1.84 | 0.0021985 |
| GSE1_DANRE | gse1 | Genetic suppressor element 1 | 1.83 | 0.0457959 |
| PLEC_HUMAN | PLEC | Plectin | 1.81 | 0.0268665 |
| OPA1_DANRE | opa1 | Dynamin-like 120 kDa protein | 1.81 | 0.0430209 |
| LAMA4_HUMAN | LAMA4 | Laminin subunit alpha-4 | 1.81 | 0.0229941 |
| DCXR_MESAU | DCXR | L-xylulose reductase | 1.81 | 0.0028180 |
| A2MP_MOUSE | A2m | Alpha-2-macroglobulin-P | 1.80 | 0.0145305 |
| MF2NB_DANRE | borcs8 | Protein MEF2BNB | 1.80 | 0.0487061 |
| SYK_HUMAN | KARS | Lysine—tRNA ligase | 1.80 | 0.0010683 |
| SPAG7_DANRE | spag7 | Sperm-associated antigen 7 homolog | 1.76 | 0.0268045 |
| COX42_THUOB | N/A | Cytochrome c oxidase subunit 4 isoform 2 | 1.76 | 0.0198968 |
| AT2A1_RABIT | ATP2A1 | Sarcoplasmic/endoplasmic reticulum calcium ATPase 1 | 1.75 | 0.0471735 |
| NUP98_RAT | Nup98 | Nuclear pore complex protein Nup98-Nup96 | 1.75 | 0.0376341 |
| ALKB5_DANRE | alkbh5 | RNA demethylase ALKBH5 | 1.73 | 0.0135027 |
| CLIC2_HUMAN | CLIC2 | Chloride intracellular channel protein 2 | 1.72 | 0.0347927 |
| TYRP1_CARAU | tyrp1 | 5,6-dihydroxyindole-2-carboxylic acid oxidase5 | 1.72 | 0.0002676 |
| RRBP1_HUMAN | RRBP1 | Ribosome-binding protein 1 | 1.71 | 0.0366481 |
| SRSF5_HUMAN | SRSF5 | Serine/arginine-rich splicing factor 5 | 1.70 | 0.0002839 |
| COCA1_CHICK | COL12A1 | Collagen alpha-1(XII) chain | 1.70 | 0.0262727 |
| AGRB2_MOUSE | Adgrb2 | Adhesion G protein-coupled receptor B2 | 1.70 | 0.0044674 |
| LPIN1_HUMAN | LPIN1 | Phosphatidate phosphatase LPIN1 | 1.69 | 0.0197062 |
| PLIN5_RAT | Plin5 | Perilipin-5 | 1.69 | 0.0165470 |
| CALD1_MELGA | CALD1 | Caldesmon | 1.67 | 0.0016593 |
| PMEL_CHICK | PMEL | Melanocyte protein PMEL | 1.67 | 0.0316520 |
| RM43_BOVIN | MRPL43 | 39S ribosomal protein L43 | 1.67 | 0.0311367 |
| AIP_RAT | Aip | AH receptor-interacting protein | 1.66 | 0.0455057 |
| MRP_BOVIN | MARCKSL1 | MARCKS-related protein | 1.65 | 0.0044254 |
| PSMF1_PONAB | PSMF1 | Proteasome inhibitor PI31 subunit | 1.65 | 0.0351891 |
| PTX3_HUMAN | PTX3 | Pentraxin-related protein PTX3 | 1.64 | 0.0357322 |
| HSP7E_DANRE | hspa14 | Heat shock 70 kDa protein 14 | 1.64 | 0.0100857 |
| K2C8_HUMAN | KRT8 | Keratin | 1.64 | 0.0073882 |
| TPD54_HUMAN | TPD52L2 | Tumor protein D54 | 1.63 | 0.0281041 |
| PGS2_BOVIN | DCN | Decorin | 1.63 | 0.0046897 |
| TRI11_RAT | Trim11 | E3 ubiquitin-protein ligase TRIM11 | 1.63 | 0.0092775 |
| RPF2_BOVIN | RPF2 | Ribosome production factor 2 homolog | 1.63 | 0.0380427 |
| ECHD1_DANRE | echdc1 | Ethylmalonyl-CoA decarboxylase | 1.63 | 0.0064541 |
| SNAB_HUMAN | NAPB | Beta-soluble NSF attachment protein | 1.62 | 0.0255251 |
| PKP3_MOUSE | Pkp3 | Plakophilin-3 | 1.61 | 0.0044704 |
| SSF1_MOUSE | Ppan | Suppressor of SWI4 1 homolog | 1.61 | 0.0288496 |
| ADDG_HUMAN | ADD3 | Gamma-adducin | 1.61 | 0.0010349 |
| PBX1_HUMAN | PBX1 | Pre-B-cell leukemia transcription factor 1 | 1.60 | 0.0001923 |
| RTN1_PANTR | RTN1 | Reticulon-1 | 1.60 | 0.0389269 |
| Uniprot_ID | Gene | Description | FC(Y/W) | p Value (W/Y) |
|---|---|---|---|---|
| MYOM2_HUMAN | MYOM2 | Myomesin-2 | 4.87 | 0.0034066 |
| DDR2_MOUSE | Ddr2 | Discoidin domain-containing receptor 2 | 4.68 | 0.0283762 |
| TNNC2_ANGAN | N/A | Troponin C | 4.50 | 0.0072123 |
| MYOZ1_HUMAN | MYOZ1 | Myozenin-1 | 4.01 | 0.0065529 |
| MYSS_CYPCA | N/A | Myosin heavy chain | 3.53 | 0.0017226 |
| PRV2_DANRE | pvalb2 | Parvalbumin-2 | 3.34 | 0.0176125 |
| MYOZ1_BOVIN | MYOZ1 | Myozenin-1 | 3.25 | 0.0011707 |
| ACTN3_BOVIN | ACTN3 | Alpha-actinin-3 | 3.09 | 0.0014259 |
| PDLI7_BOVIN | PDLIM7 | PDZ and LIM domain protein 7 | 3.05 | 0.0062208 |
| SAHHB_XENLA | ahcy-b | Adenosylhomocysteinase B | 3.01 | 0.0097743 |
| TITIN_HUMAN | TTN | Titin | 2.97 | 0.0040666 |
| DYST_HUMAN | DST | Dystonin | 2.90 | 0.0213198 |
| MYBPH_CHICK | MYBPH | Myosin-binding protein H | 2.83 | 0.0015750 |
| CASR_BOVIN | CASR | Extracellular calcium-sensing receptor | 2.81 | 0.0064296 |
| NRG_DROME | Nrg | Neuroglian | 2.75 | 0.0083956 |
| MTUS2_HUMAN | MTUS2 | Microtubule-associated tumor suppressor candidate 2 | 2.74 | 0.0214764 |
| MYPC2_MOUSE | Mybpc2 | Myosin-binding protein C | 2.72 | 0.0059417 |
| AMPD1_HUMAN | AMPD1 | AMP deaminase 1 | 2.61 | 0.0074214 |
| MAP7_CHICK | MAP7 | Ensconsin | 2.61 | 0.0064867 |
| TNNT3_COTJA | TNNT3 | Troponin T | 2.60 | 8.4696 × 10⁻⁵ |
| GIMA5_HUMAN | GIMAP5 | GTPase IMAP family member 5 | 2.29 | 0.0243491 |
| AOXC_MOUSE | Aox3 | Aldehyde oxidase 3 | 2.22 | 0.0150366 |
| K1C14_MOUSE | Krt14 | Keratin | 2.17 | 0.0462584 |
| TNNI2_RABIT | TNNI2 | Troponin I | 2.16 | 0.0005866 |
| KPYM_CHICK | PKM | Pyruvate kinase PKM | 2.16 | 0.0370822 |
| MPSF_CHICK | N/A | M-protein | 2.13 | 0.0065892 |
| KCRM_CANFA | CKM | Creatine kinase M-type | 2.11 | 0.0154615 |
| LDB3_HUMAN | LDB3 | LIM domain-binding protein 3 | 2.10 | 0.0389130 |
| FUCO_HUMAN | FUCA1 | Tissue alpha-L-fucosidase | 2.06 | 0.0105965 |
| MYO1F_HUMAN | MYO1F | Unconventional myosin-If | 2.04 | 0.0272882 |
| KPCD_HUMAN | PRKCD | Protein kinase C delta type | 2.01 | 0.0146456 |
| FLNC_RAT | Flnc | Filamin-C | 2.01 | 0.0345344 |
| TPM3_HUMAN | TPM3 | Tropomyosin alpha-3 chain | 1.99 | 0.0062754 |
| RNT2_DANRE | rnaset2 | Ribonuclease T2 | 1.99 | 0.0007026 |
| CHP3_XENLA | tesc | Calcineurin B homologous protein 3 | 1.98 | 0.0098880 |
| VTNC_RABIT | VTN | Vitronectin | 1.97 | 0.0419940 |
| ACTSA_TAKRU | acta1a | Actin | 1.94 | 0.0035608 |
| FUCO_MOUSE | Fuca1 | Tissue alpha-L-fucosidase | 1.91 | 0.0197286 |
| MYH4_HUMAN | MYH4 | Myosin-4 | 1.86 | 0.0243060 |
| IF44L_MOUSE | Ifi44l | Interferon-induced protein 44-like | 1.86 | 0.0264745 |
| BAX_BOVIN | BAX | Apoptosis regulator BAX | 1.84 | 0.0027166 |
| NEBU_HUMAN | NEB | Nebulin | 1.84 | 0.0041143 |
| AKA12_HUMAN | AKAP12 | A-kinase anchor protein 12 | 1.82 | 0.0224758 |
| EF1A1_HORSE | EEF1A1 | Elongation factor 1-alpha 1 | 1.81 | 0.0125514 |
| K1C13_ONCMY | krt13 | Keratin | 1.80 | 0.0162506 |
| FUCM_DANRE | fuom | Fucose mutarotase | 1.77 | 0.0014529 |
| TIMP3_XENLA | timp3 | Metalloproteinase inhibitor 3 | 1.74 | 0.0209090 |
| CNIH4_BOVIN | CNIH4 | Protein cornichon homolog 4 | 1.72 | 0.0420714 |
| PDLI7_MOUSE | Pdlim7 | PDZ and LIM domain protein 7 | 1.70 | 0.0173236 |
| CATB_CHICK | CTSB | Cathepsin B | 1.69 | 0.0004048 |
| OBSCN_MOUSE | Obscn | Obscurin | 1.68 | 0.0015550 |
| MYOZ2_PONAB | MYOZ2 | Myozenin-2 | 1.66 | 0.0485948 |
| SAP_CHICK | PSAP | Prosaposin | 1.66 | 0.0389310 |
| PUA1A_SALSA | adssl1a | Adenylosuccinate synthetase isozyme 1 A | 1.65 | 0.0115606 |
| CFAB_BOVIN | CFB | Complement factor B | 1.64 | 0.0096244 |
| LEG12_HUMAN | LGALS12 | Galectin-12 | 1.63 | 0.0231777 |
| WDR47_MOUSE | Wdr47 | WD repeat-containing protein 47 | 1.62 | 0.0030872 |
| ALDOA_MOUSE | Aldoa | Fructose-bisphosphate aldolase A | 1.62 | 0.0033610 |
| CFAB_MOUSE | Cfb | Complement factor B | 1.60 | 0.0027860 |
| G3P_CHICK | GAPDH | Glyceraldehyde-3-phosphate dehydrogenase | 1.58 | 0.0436886 |
| DMD_CHICK | DMD | Dystrophin | 1.56 | 0.0007040 |
| PPGB_MOUSE | Ctsa | Lysosomal protective protein | 1.55 | 0.0207043 |
| DPP2_MOUSE | Dpp7 | Dipeptidyl peptidase 2 | 1.54 | 0.0001501 |
| TITIN_MOUSE | Ttn | Titin | 1.54 | 0.0002004 |
| NUPR2_HUMAN | NUPR2 | Nuclear protein 2 | 1.53 | 0.0135287 |
| LGMN_BOVIN | LGMN | Legumain | 1.53 | 0.0159403 |
| BGLR_MOUSE | Gusb | Beta-glucuronidase | 1.53 | 0.0195223 |
| CATH_PIG | CTSH | Pro-cathepsin H | 1.52 | 0.0364061 |
| ING5_HUMAN | ING5 | Inhibitor of growth protein 5 | 1.52 | 0.0011046 |
| ALDOA_SALSA | N/A | Fructose-bisphosphate aldolase A | 1.51 | 0.0039936 |
| CAPZB_CHICK | CAPZB | F-actin-capping protein subunit beta isoforms 1 and 2 | 1.51 | 0.0220029 |
© 2020 by the authors. Licensee MDPI, Basel, Switzerland. This article is an open access article distributed under the terms and conditions of the Creative Commons Attribution (CC BY) license (http://creativecommons.org/licenses/by/4.0/).
Share and Cite
Ye, X.; Zhou, L.; Jia, J.; Wei, L.; Wen, Y.; Yan, X.; Huang, J.; Gan, B.; Liu, K.; Lv, Y.; et al. ITRAQ Proteomic Analysis of Yellow and Black Skin in Jinbian Carp (Cyprinus carpio). Life 2020, 10, 226. https://doi.org/10.3390/life10100226
Ye X, Zhou L, Jia J, Wei L, Wen Y, Yan X, Huang J, Gan B, Liu K, Lv Y, et al. ITRAQ Proteomic Analysis of Yellow and Black Skin in Jinbian Carp (Cyprinus carpio). Life. 2020; 10(10):226. https://doi.org/10.3390/life10100226
Chicago/Turabian StyleYe, Xiangchen, Lingling Zhou, Jingyi Jia, Lingjing Wei, Yanhong Wen, Xueyu Yan, Jie Huang, Baojiang Gan, Kang Liu, Yejian Lv, and et al. 2020. "ITRAQ Proteomic Analysis of Yellow and Black Skin in Jinbian Carp (Cyprinus carpio)" Life 10, no. 10: 226. https://doi.org/10.3390/life10100226
APA StyleYe, X., Zhou, L., Jia, J., Wei, L., Wen, Y., Yan, X., Huang, J., Gan, B., Liu, K., Lv, Y., & Hu, G. (2020). ITRAQ Proteomic Analysis of Yellow and Black Skin in Jinbian Carp (Cyprinus carpio). Life, 10(10), 226. https://doi.org/10.3390/life10100226