1. Introduction
The technological aspect of a smart city is reflected by IBM, the leading promoter of the smart city concept. The smart city is an instrumented, interconnected, and intellectual environment [
1]. The term instrumented means an ability to receive various data on city life and digital infrastructure in real-time mode through the connected devices, measuring sensors, and personal systems. The term interconnected indicates an ability to integrate data on digital platforms, sharing them with various digital city services. The term intellectual refers to data processing by advanced analytics, modeling, optimization, and visualization services in order to make the best decision.
By 2024, the number of smart infrastructures for digital urban services is estimated to be around 1.3 billion. At the same time, security researchers and experts claim the need to pay notable attention to the issue of smart city cybersecurity (e.g., [
2,
3,
4]). In fact, 135 billion USD will be spent on the cybersecurity of smart cities [
5]. Smart cities are increasingly being exposed to various cybersecurity impacts: complex cyberattacks on critical infrastructures by interrupting the automated control systems, hacking communications between the smart IoT/IIoT devices, blocking the VANET nodes (autonomous cars, off-road infrastructure), and other connected systems using ransomware, changing the sensing data (for example, in alarm and emergency systems) [
5]. The concept of a smart city involves a merger of digital and physical infrastructures into a single global cyberphysical system. Hacking or infecting one network-connected device opens up the possibility of infecting many other devices, which leads to cascading damage, causing a massive “theft of data from citizens, patients, and consumers, personally identifiable information, etc.,” as stated by Dimitrios Pavlakis, the analyst of ABI Research [
5,
6]. For example, in hacking a road-side VANET node, the intruder may gain unauthorized access to a driverless car and then penetrate the smart home network and disrupt the operation of the smart house gateway, breaking the water, power, and heat supply. The high risk of an attacker obtaining financial information, business plans, and private data as a result of hacking sensitive assets is highlighted in the research [
7]. For such a serious problem, it becomes important to choose an effective protection strategy.
Building a large-scale infrastructure for the smart city with the application of modern IoT/IIoT-, MANET-, VANET-, and WSN-based cyberspaces requires a thorough approach to monitor, measure, maintain, and improve its cybersecurity. A specific characteristic of self-organizing network infrastructure is an entire complex of processes and assets of the smart city, the main purpose of which is to enhance the efficiency of the digital urban services. Therefore, the resulting set of protective measures should be rationalized by the costs–benefits ratio. To achieve this, cybersecurity standards (e.g., 27,000 and 13,335 families) propose the concept of risk-driven security management [
8,
9,
10].
There are many methods for assessing the cybersecurity risks that are applicable to an information system. As the BS 7799-3 and NIST 800-30 standards state, a large amount of security monitoring data about the cyberattacks and the protected assets is required, which is not always possible to implement due to the large scale of the uncontrolled environment, the limited time available for the risk analysis and measurement, and the limited financial, knowledge, and computing resources. In addition, there are specific issues for the cybersecurity risk assessment in a mobile inter-device network of the smart city:
A huge amount of data for knowledge processing;
An undefined number of assets: users, connected nodes, communications, etc.;
Insufficient formalization of the risk calculus and the requirement for the regular risk expertise;
The inability of the detailed risk analysis in the case of the limited awareness of the smart network hosts about the current state of the cyberattacks;
Incomplete and inaccurate rules for statistical data calculations to obtain a probability of the cybersecurity risk events.
For the smart city, these issues make the calculated risk estimation difficult, and it cannot be applied to substantiate a rational set of protective measures and acts. The goal of our research is to propose a new method corresponding to the dynamic assessment of cybersecurity risk in the abovementioned conditions of the smart city. This work is a continuation of our research described in a previous conference paper [
11]. The novelty lies in the fact that, for the first time, we propose to use an artificial neural network that allows us to reasonably assess cybersecurity risks by processing big security datasets. It allows for faster response time in critical situations and makes the decision-making more effective due to deeper insights and visibility of the cybersecurity risks.
The paper is organized as follows:
Section 2 reviews the current types of cyber threats specific to the dynamic smart city infrastructure;
Section 3 provides an overview of the related works for cybersecurity risk assessment applicable to the smart city;
Section 4 proposes an artificial neural network method for the assessment of cyber risks for the smart city;
Section 5 discusses the outputs of the experimental study of our method; and, finally, the last section concludes our work and sets further plans.
2. The Cybersecurity Threats Typical to the Smart City Network Infrastructure
The smart city concept implies the interaction of information and communication technologies for the management of modern urban services: transportation, medical care, power planting and supplying, etc. Data processing and analysis of dataflow received from a variety of smart sensors allow it to monitor and predict the occurrence of cyber threats of different types [
12]. Currently, intruders using network infrastructure and wireless data transmission channels can remotely invade a target device (group of the connected devices), intercept network traffic, launch the denial of service (DoS) attacks (including the distributed ones), and capture IoT devices to construct a botnet of smart devices [
13,
14]. The security issue for the smart city is the variety of horizontal connections, the heterogeneous nature of the network infrastructure, and a huge number of entities at a constantly changing topology. Making risk-based security management in real-time requires the availability of a powerful operating center that aggregates data from many different sources with different characteristics.
Software vulnerabilities also pose a serious problem for ensuring a high level of security for smart city systems [
15]. Connected devices implement different functions, they have various capabilities and features, they are produced by different manufacturers, and with different versions of hardware and software, they meet different security standards. All of these form fertile soil for an intruder to exploit the software vulnerabilities and applied protocols. The main problem is that attacker can make a successful attack on a poorly protected device that can directly or through a device-to-device chain interact with the target device (or digital service) of the attack. Software vulnerabilities can vary from developer’s errors to backdoors, as well as from the hardware level to the city-specific application level.
A complete enumeration of different reasons causing most of the security alerts in the self-organizing network of the smart city includes:
The absence of fixed network topology and central nodes makes it impossible to organize a centralized security policy;
There are no protective tools on each network node;
This type of the smart networks is public, which makes it possible to spoof a message, signal, or even a network node;
There is a wide range of possibilities to compromise the poorly protected nodes;
There is a huge number of connected nodes, and, correspondently, there is a requirement to process large data of cybersecurity;
There is a set of channel vulnerabilities;
The network has a limited computing power of the connected devices.
There is a large amount of research devoted to the analysis of cyber threats and the creation of methods of protection against them in smart cities. In [
16], the authors point out that the main threats to medical applications in a smart city are threats aimed at breaching privacy and security, including a DoS attack, MitM attack, and password sniffing. The authors argue that when developing cybersecurity systems, it is necessary to take into account the characteristics of the IoT, creating lightweight solutions. The work of [
17,
18,
19,
20] highlights the danger of network threats, while two types of intruders can be distinguished: internal and external. The work of [
21] formulates security requirements, which smart city systems must meet: authentication and confidentiality, availability and integrity, lightweight intrusion detection and prediction, as well as privacy protection. The authors have developed a classification of possible approaches to ensuring the cybersecurity of the smart city infrastructures: cryptography, blockchain, biometrics, machine learning and data mining, game theory, ontology, and non-technical supplements.
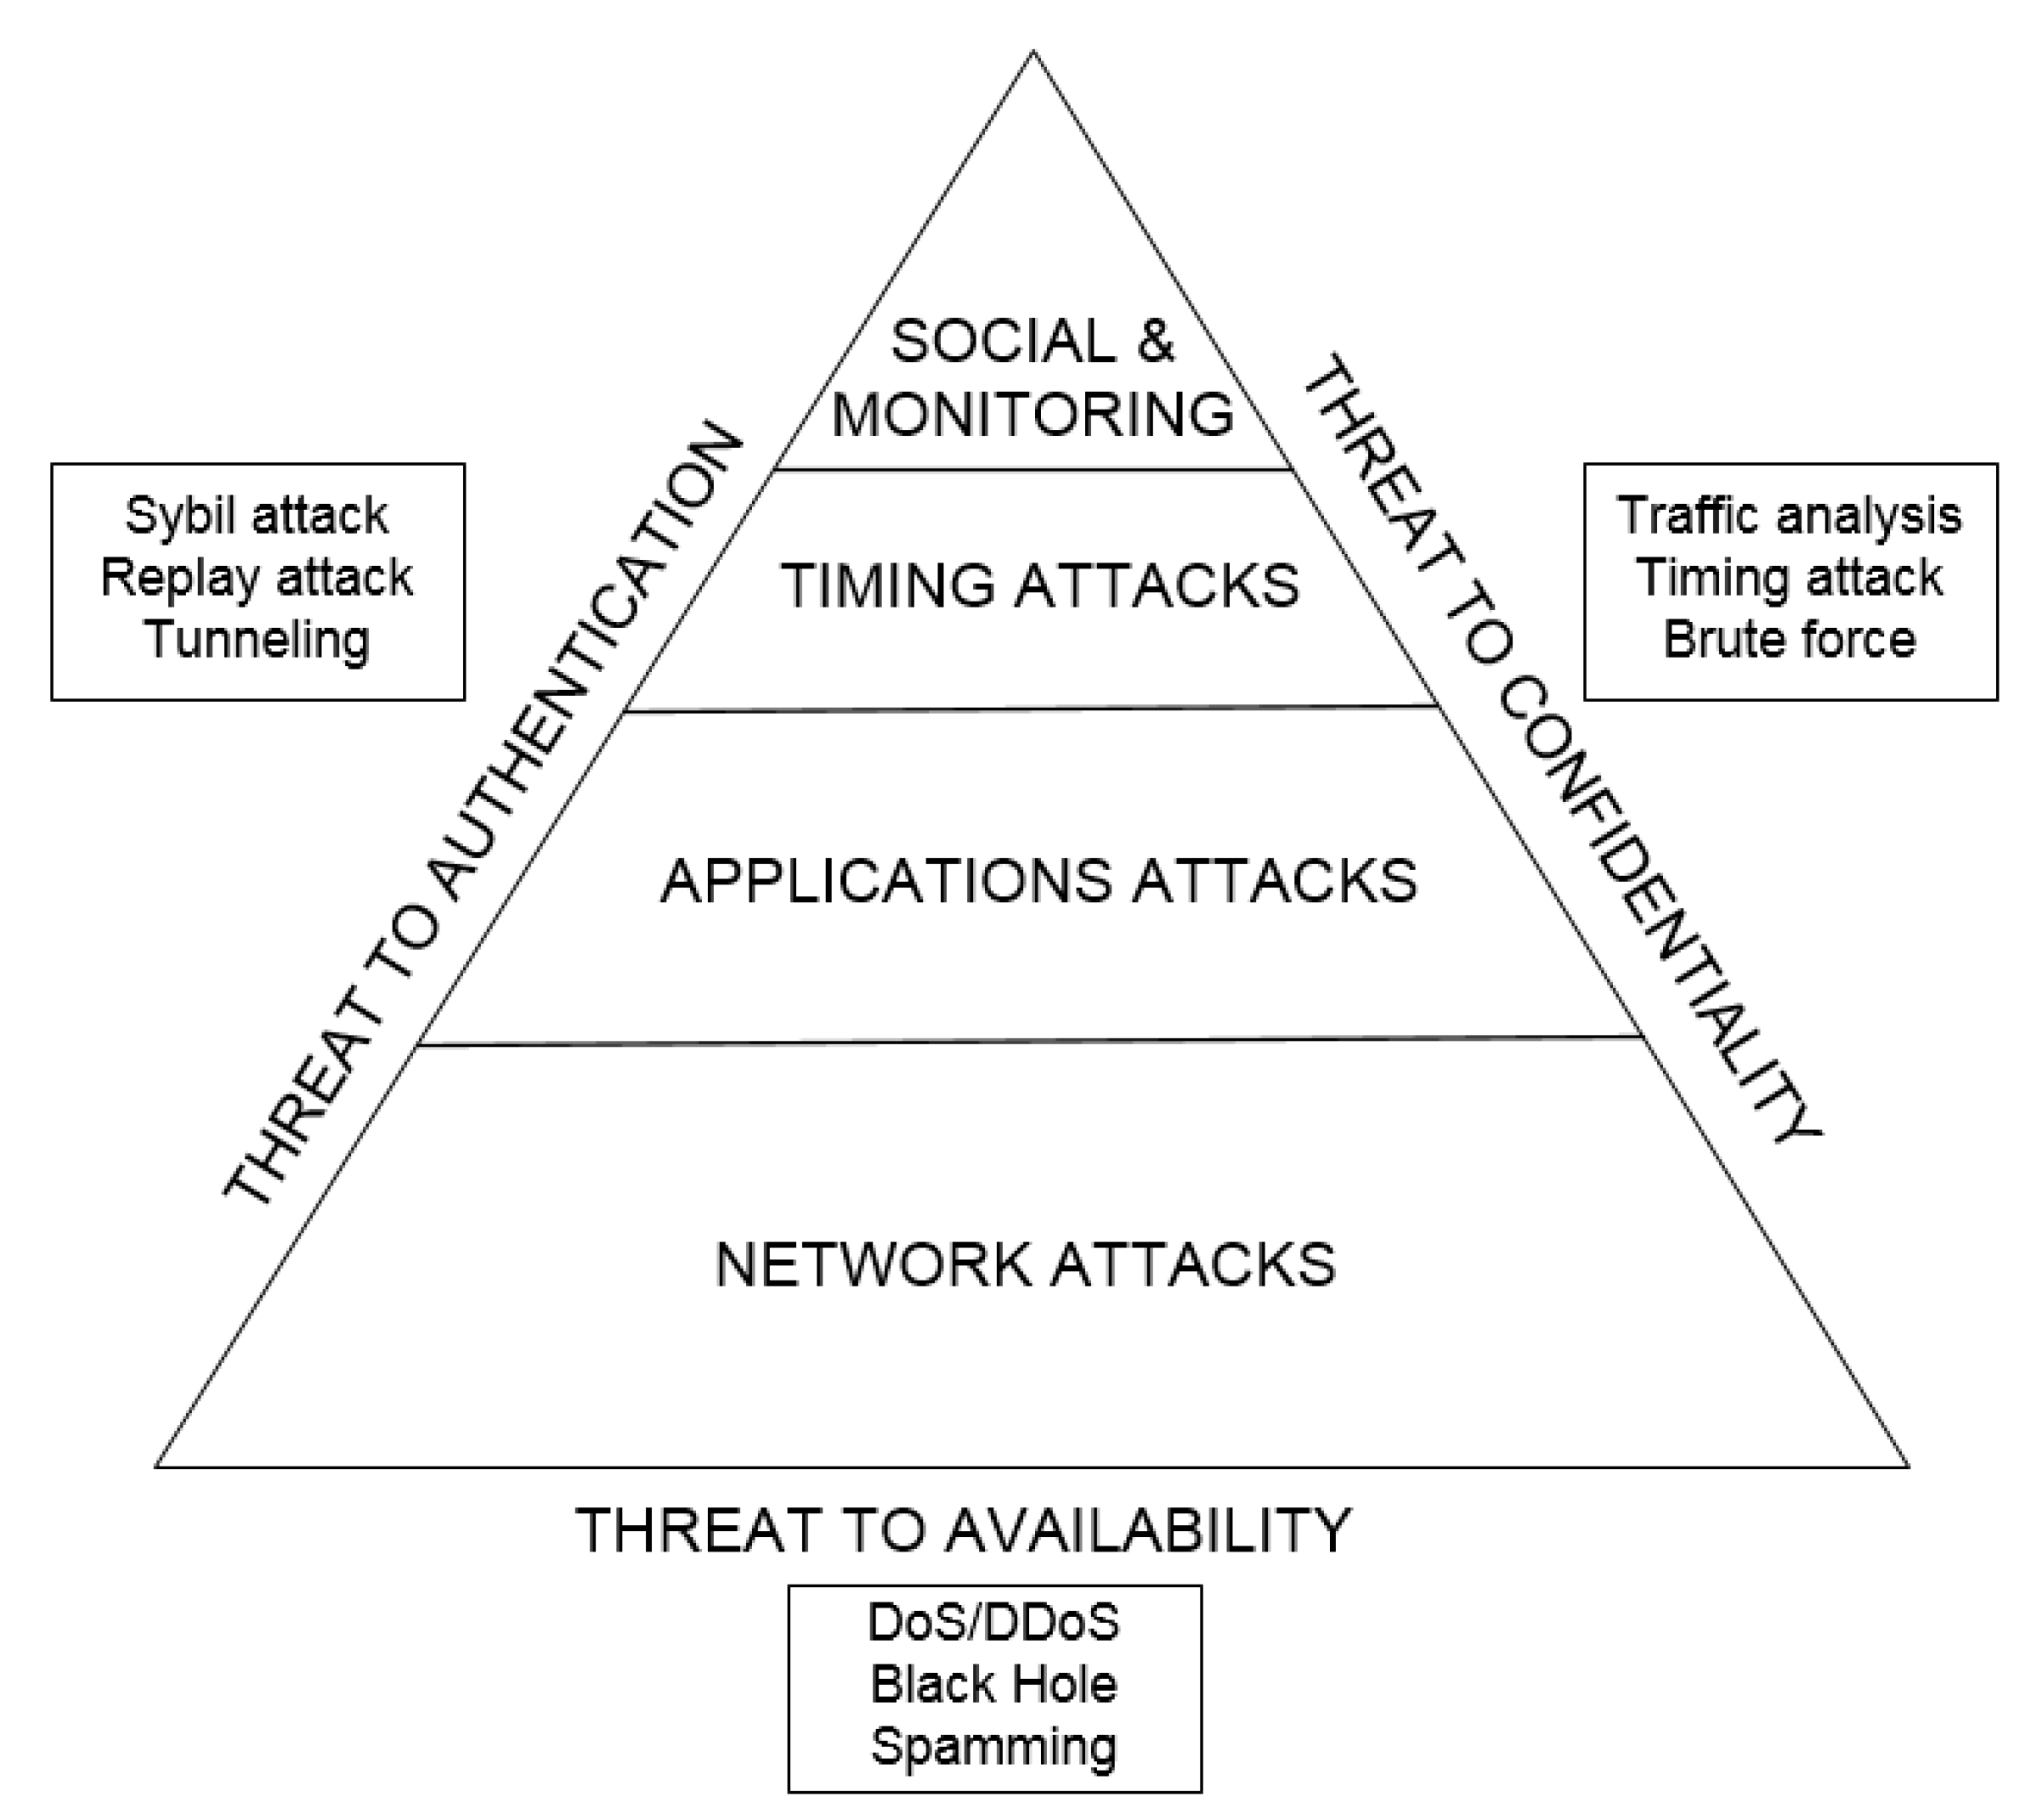
Cyberattacks on the dynamic self-organizing networks of the smart city can be divided into passive and active ones. The passive cyberattack usually violates confidentiality. The intruder eavesdrops on and intercepts information being transmitted over the network without performing any destructive acts, which makes it extremely difficult to detect. The active attack is targeted at interacting with the information flow, violating the integrity and availability. The active intruder changes or hides/drops the data packets, violating the logic of the network work. They can be organized either by an external or internal attacker. Another possible classification of attacks is classification by violation of one of the traditional security requirements: confidentiality, integrity, and availability, as well as authentication and responsibility (
Figure 1).
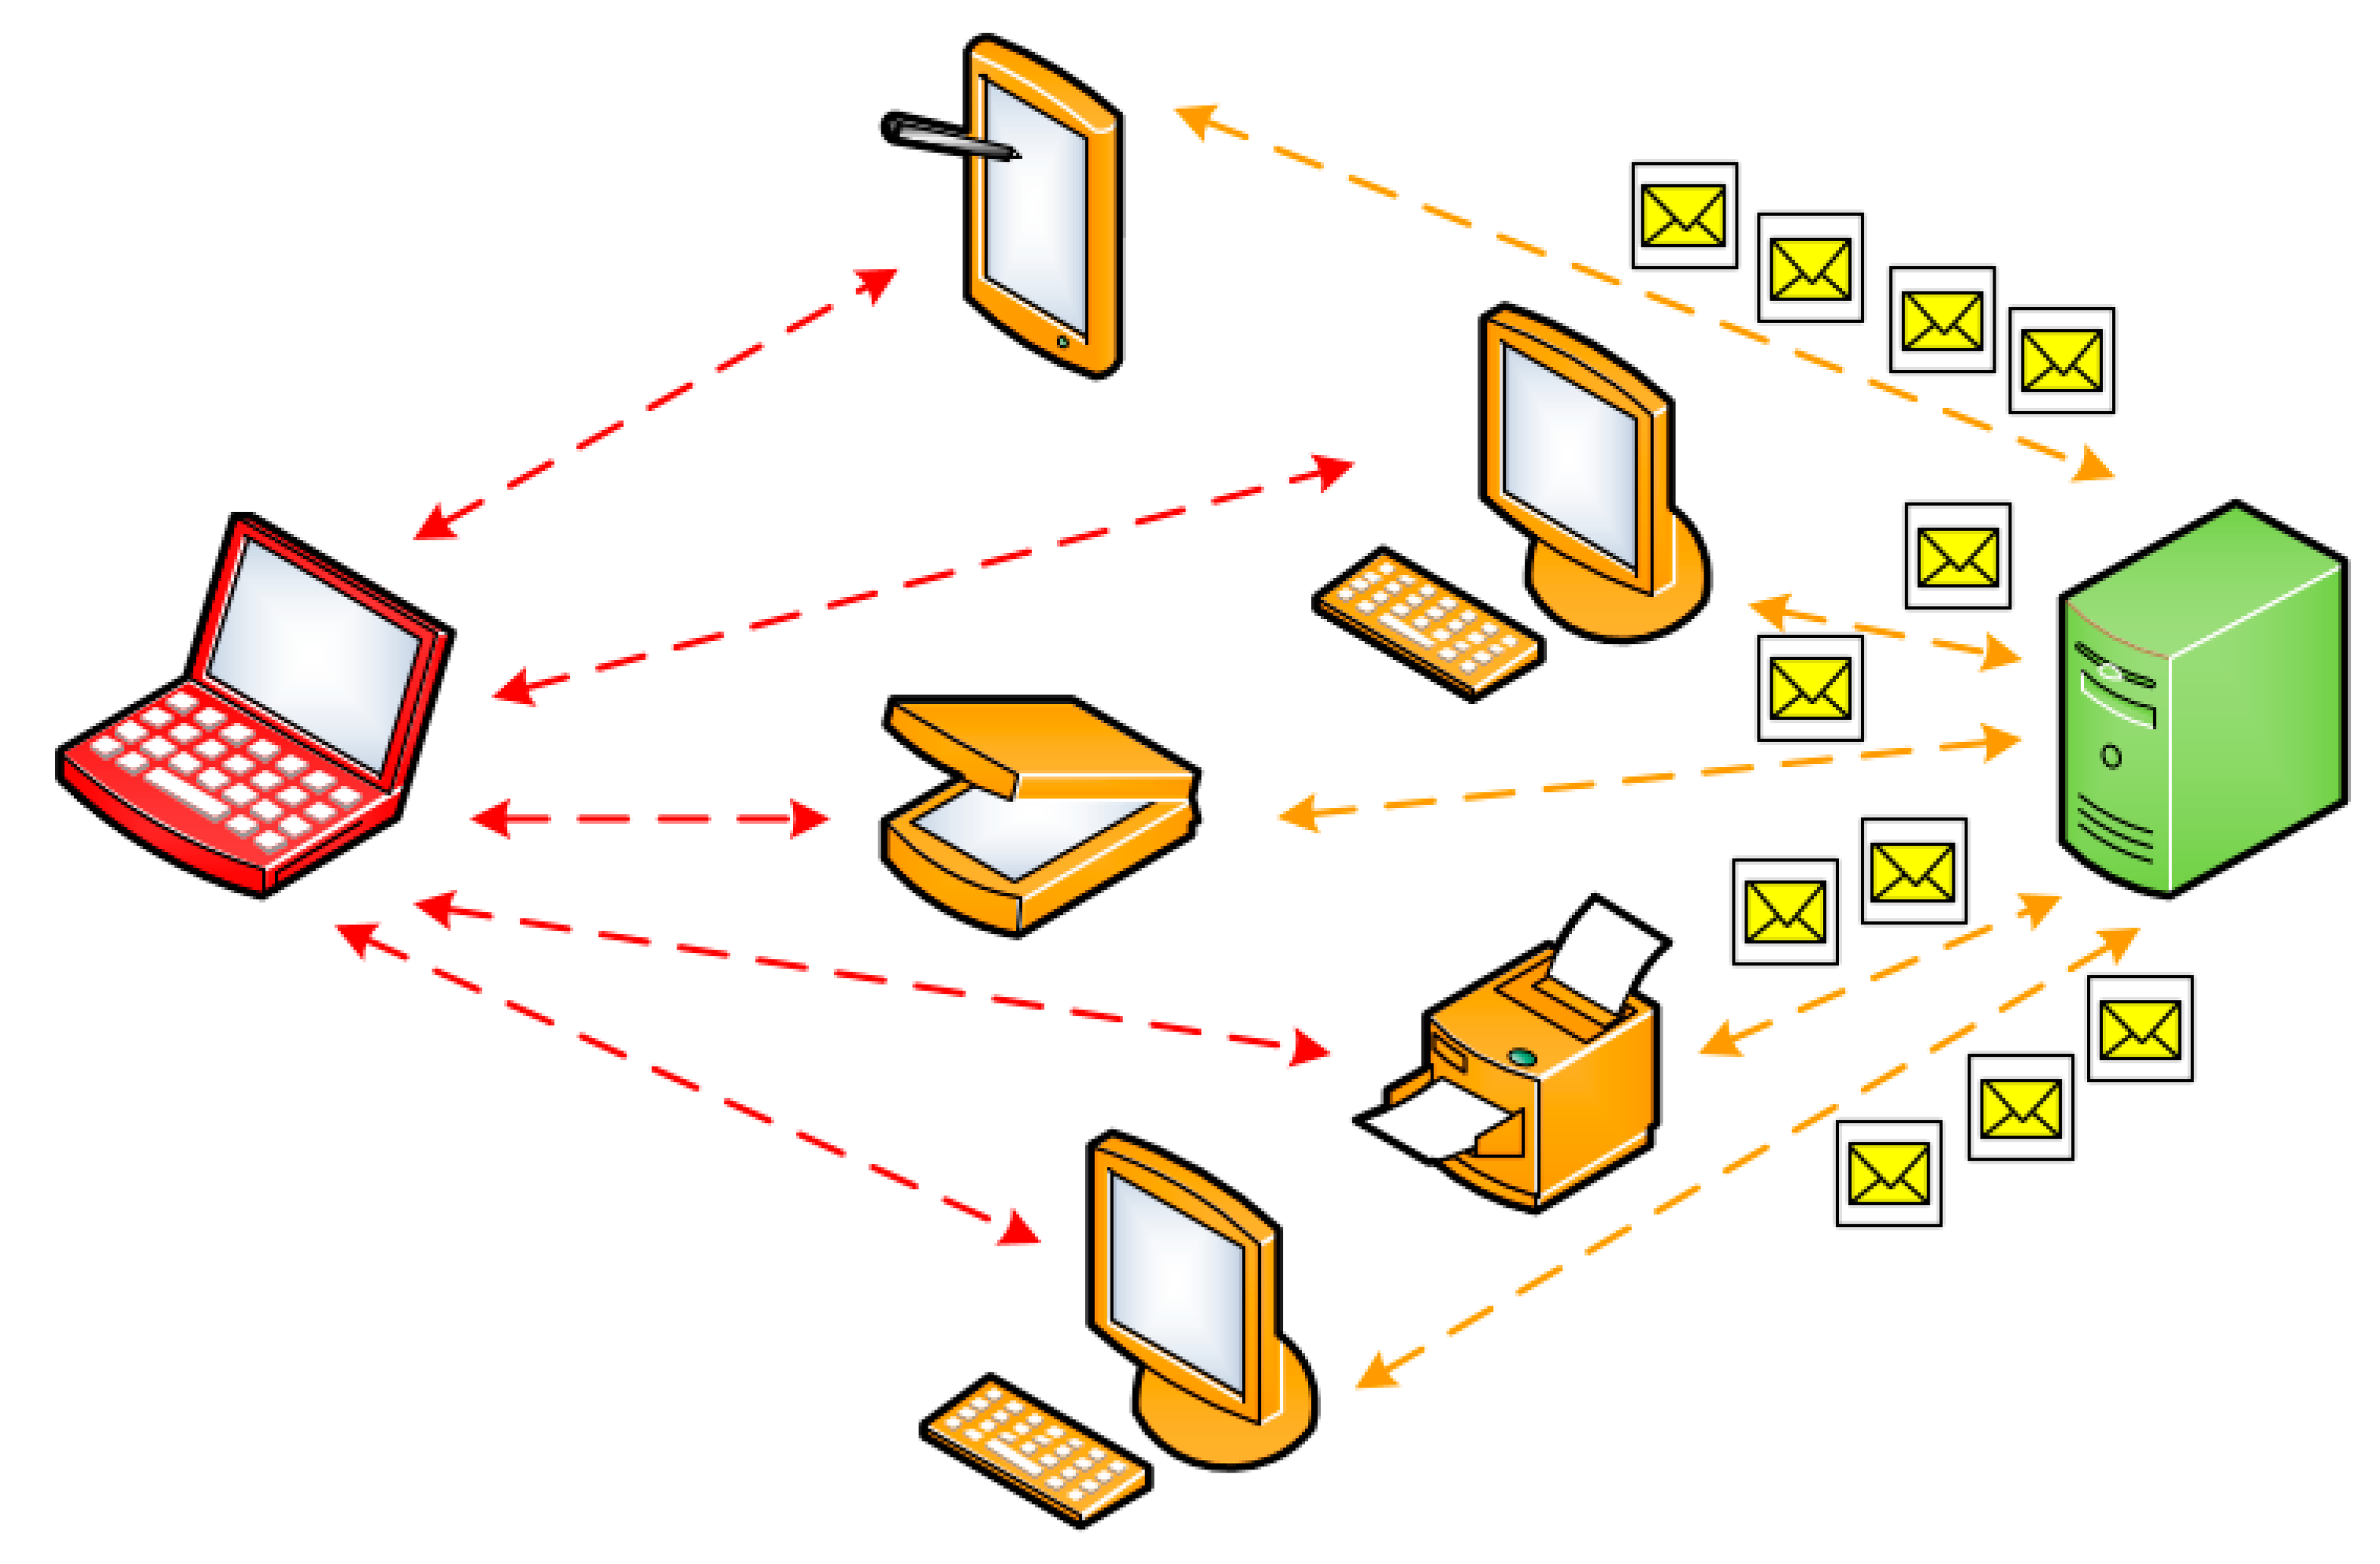
The greatest damage is caused by network attacks since they disturb the work of the entire smart infrastructure [
22]. The larger the area occupied by the attack, the more damage it brings to the system. Therefore, in further research, we pay our attention to the availability aspect of smart city security, i.e., the class of the cyberattacks targeted at disrupting a dynamic network routing (
Figure 2).
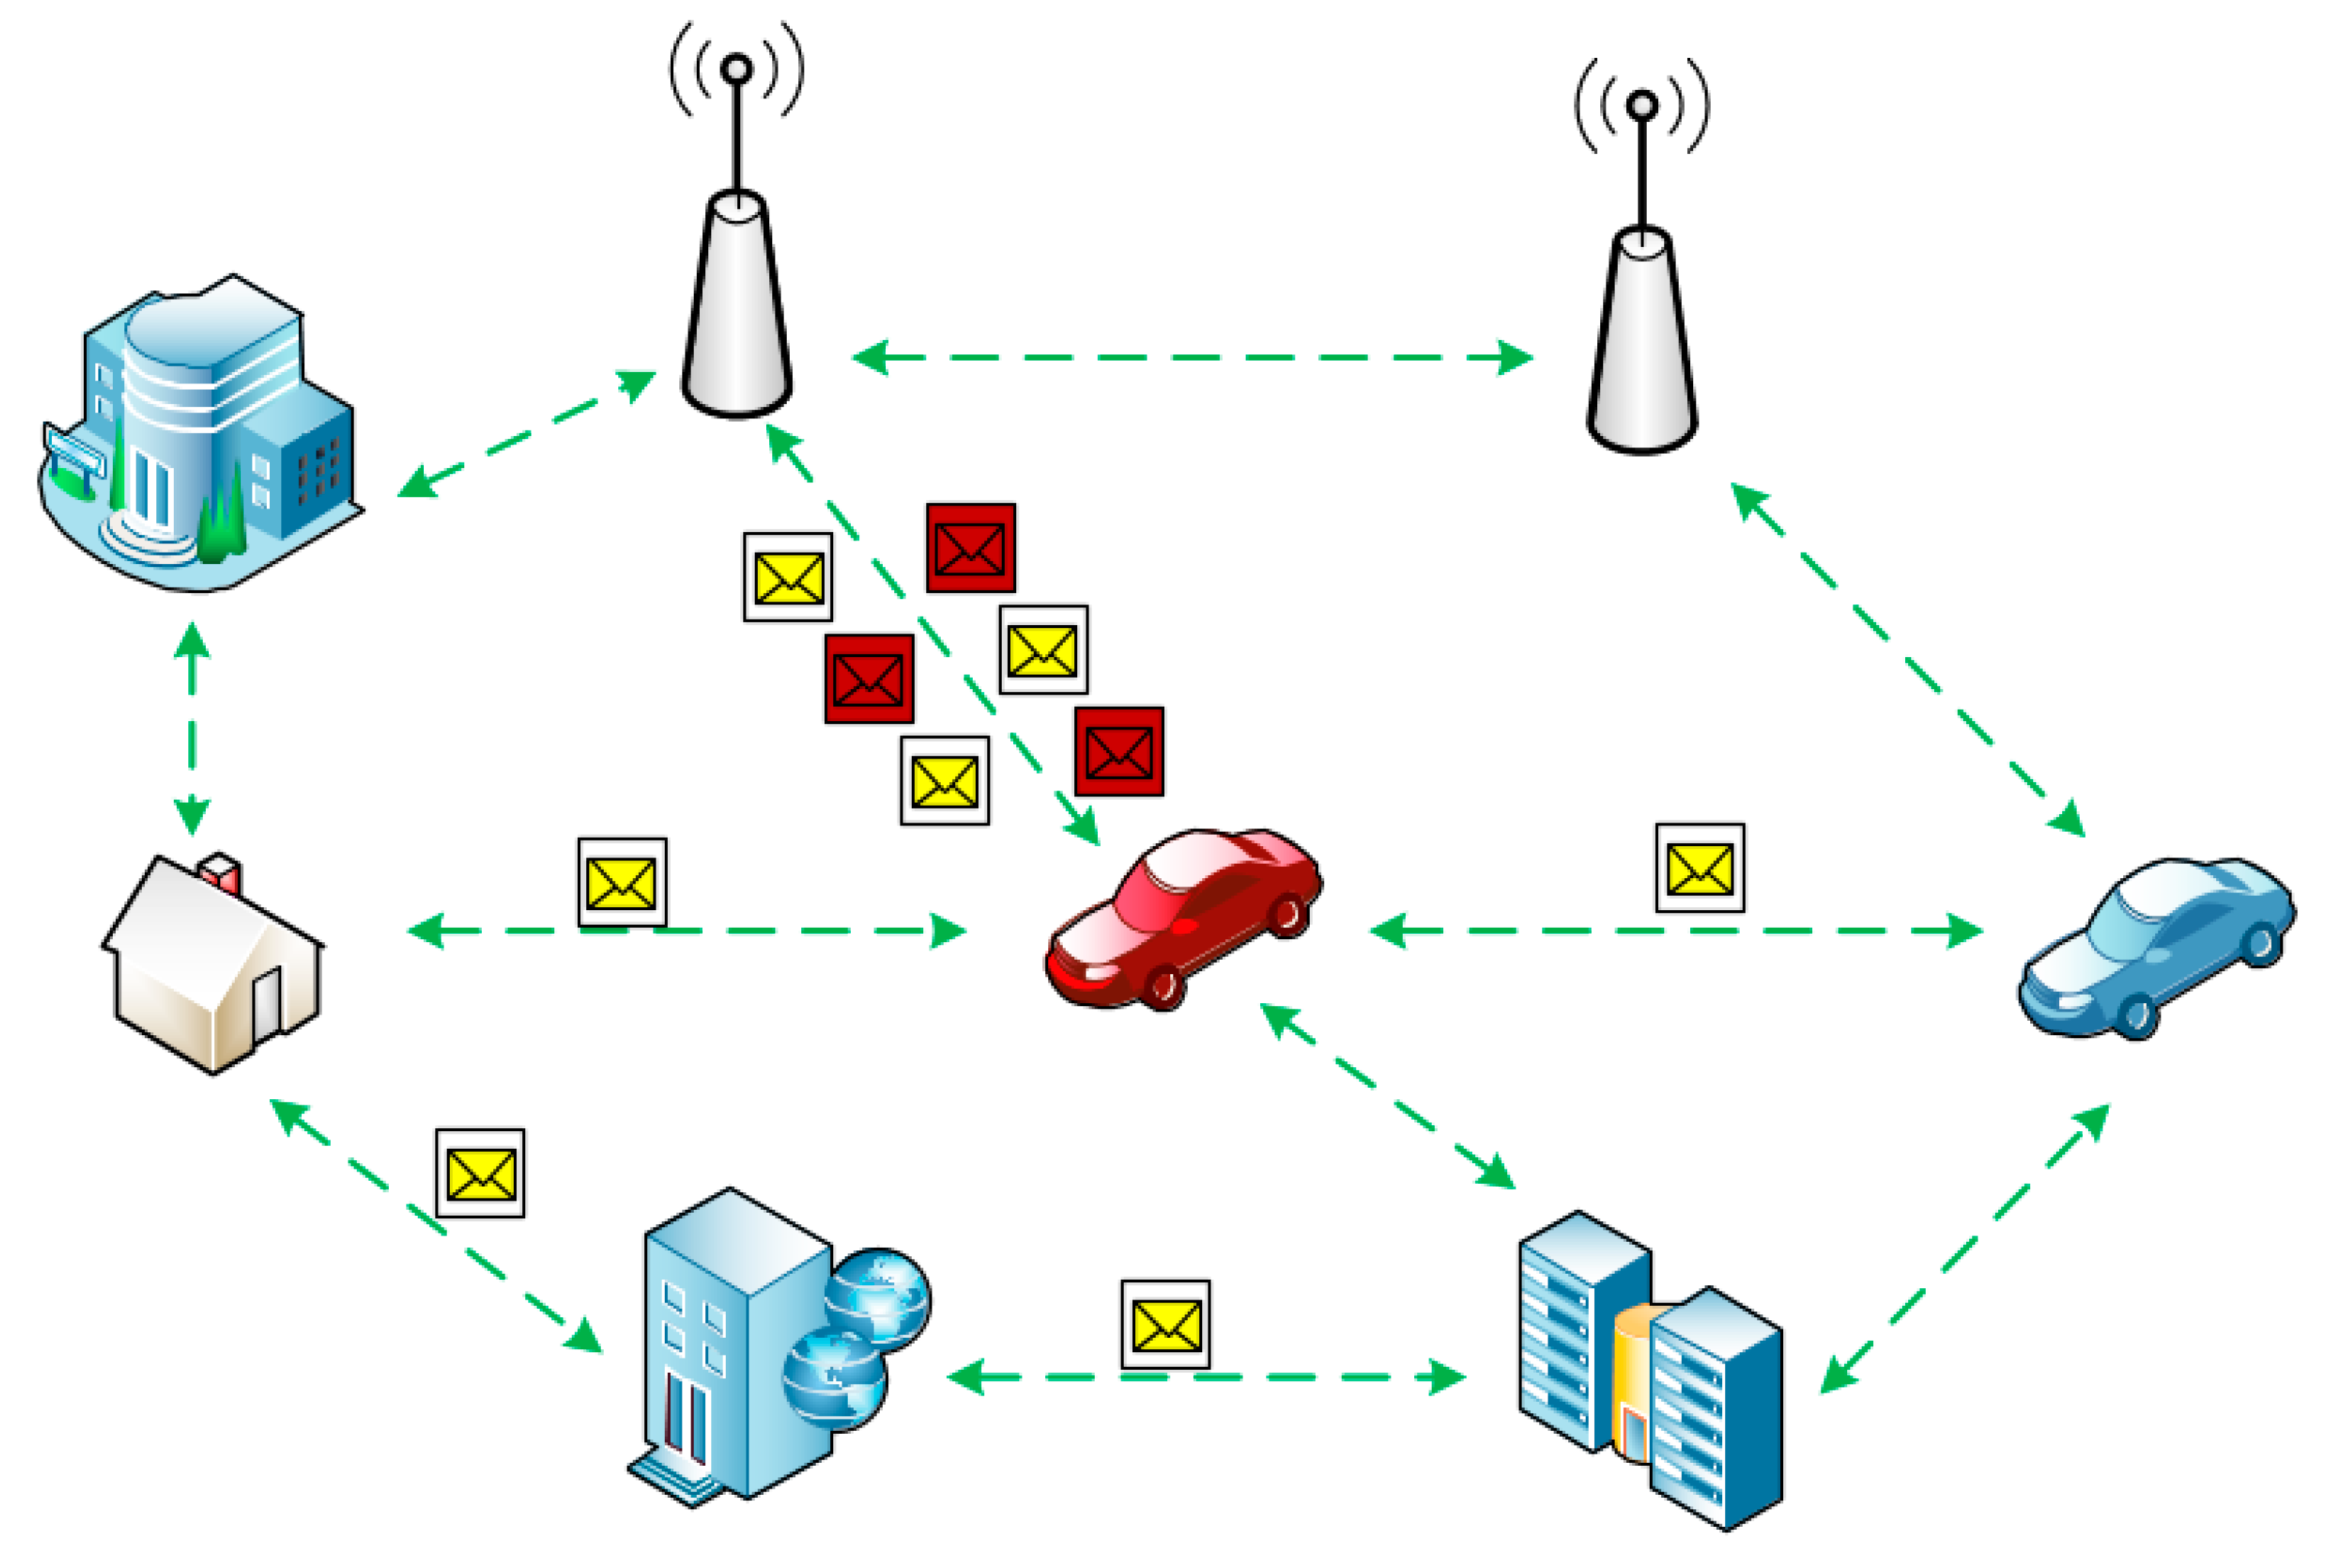
2.1. The Denial of Service (DoS) Attacks
The intruder’s node creates a large number of messages, which can be multiplied as a result of the broadcasting, and this leads to an overload in the data transmission channel and degradation of the computing resources of the network nodes to process all of the messages created by the intruder [
23]. The intruder is thus able to break communication in a smart city network (
Figure 3).
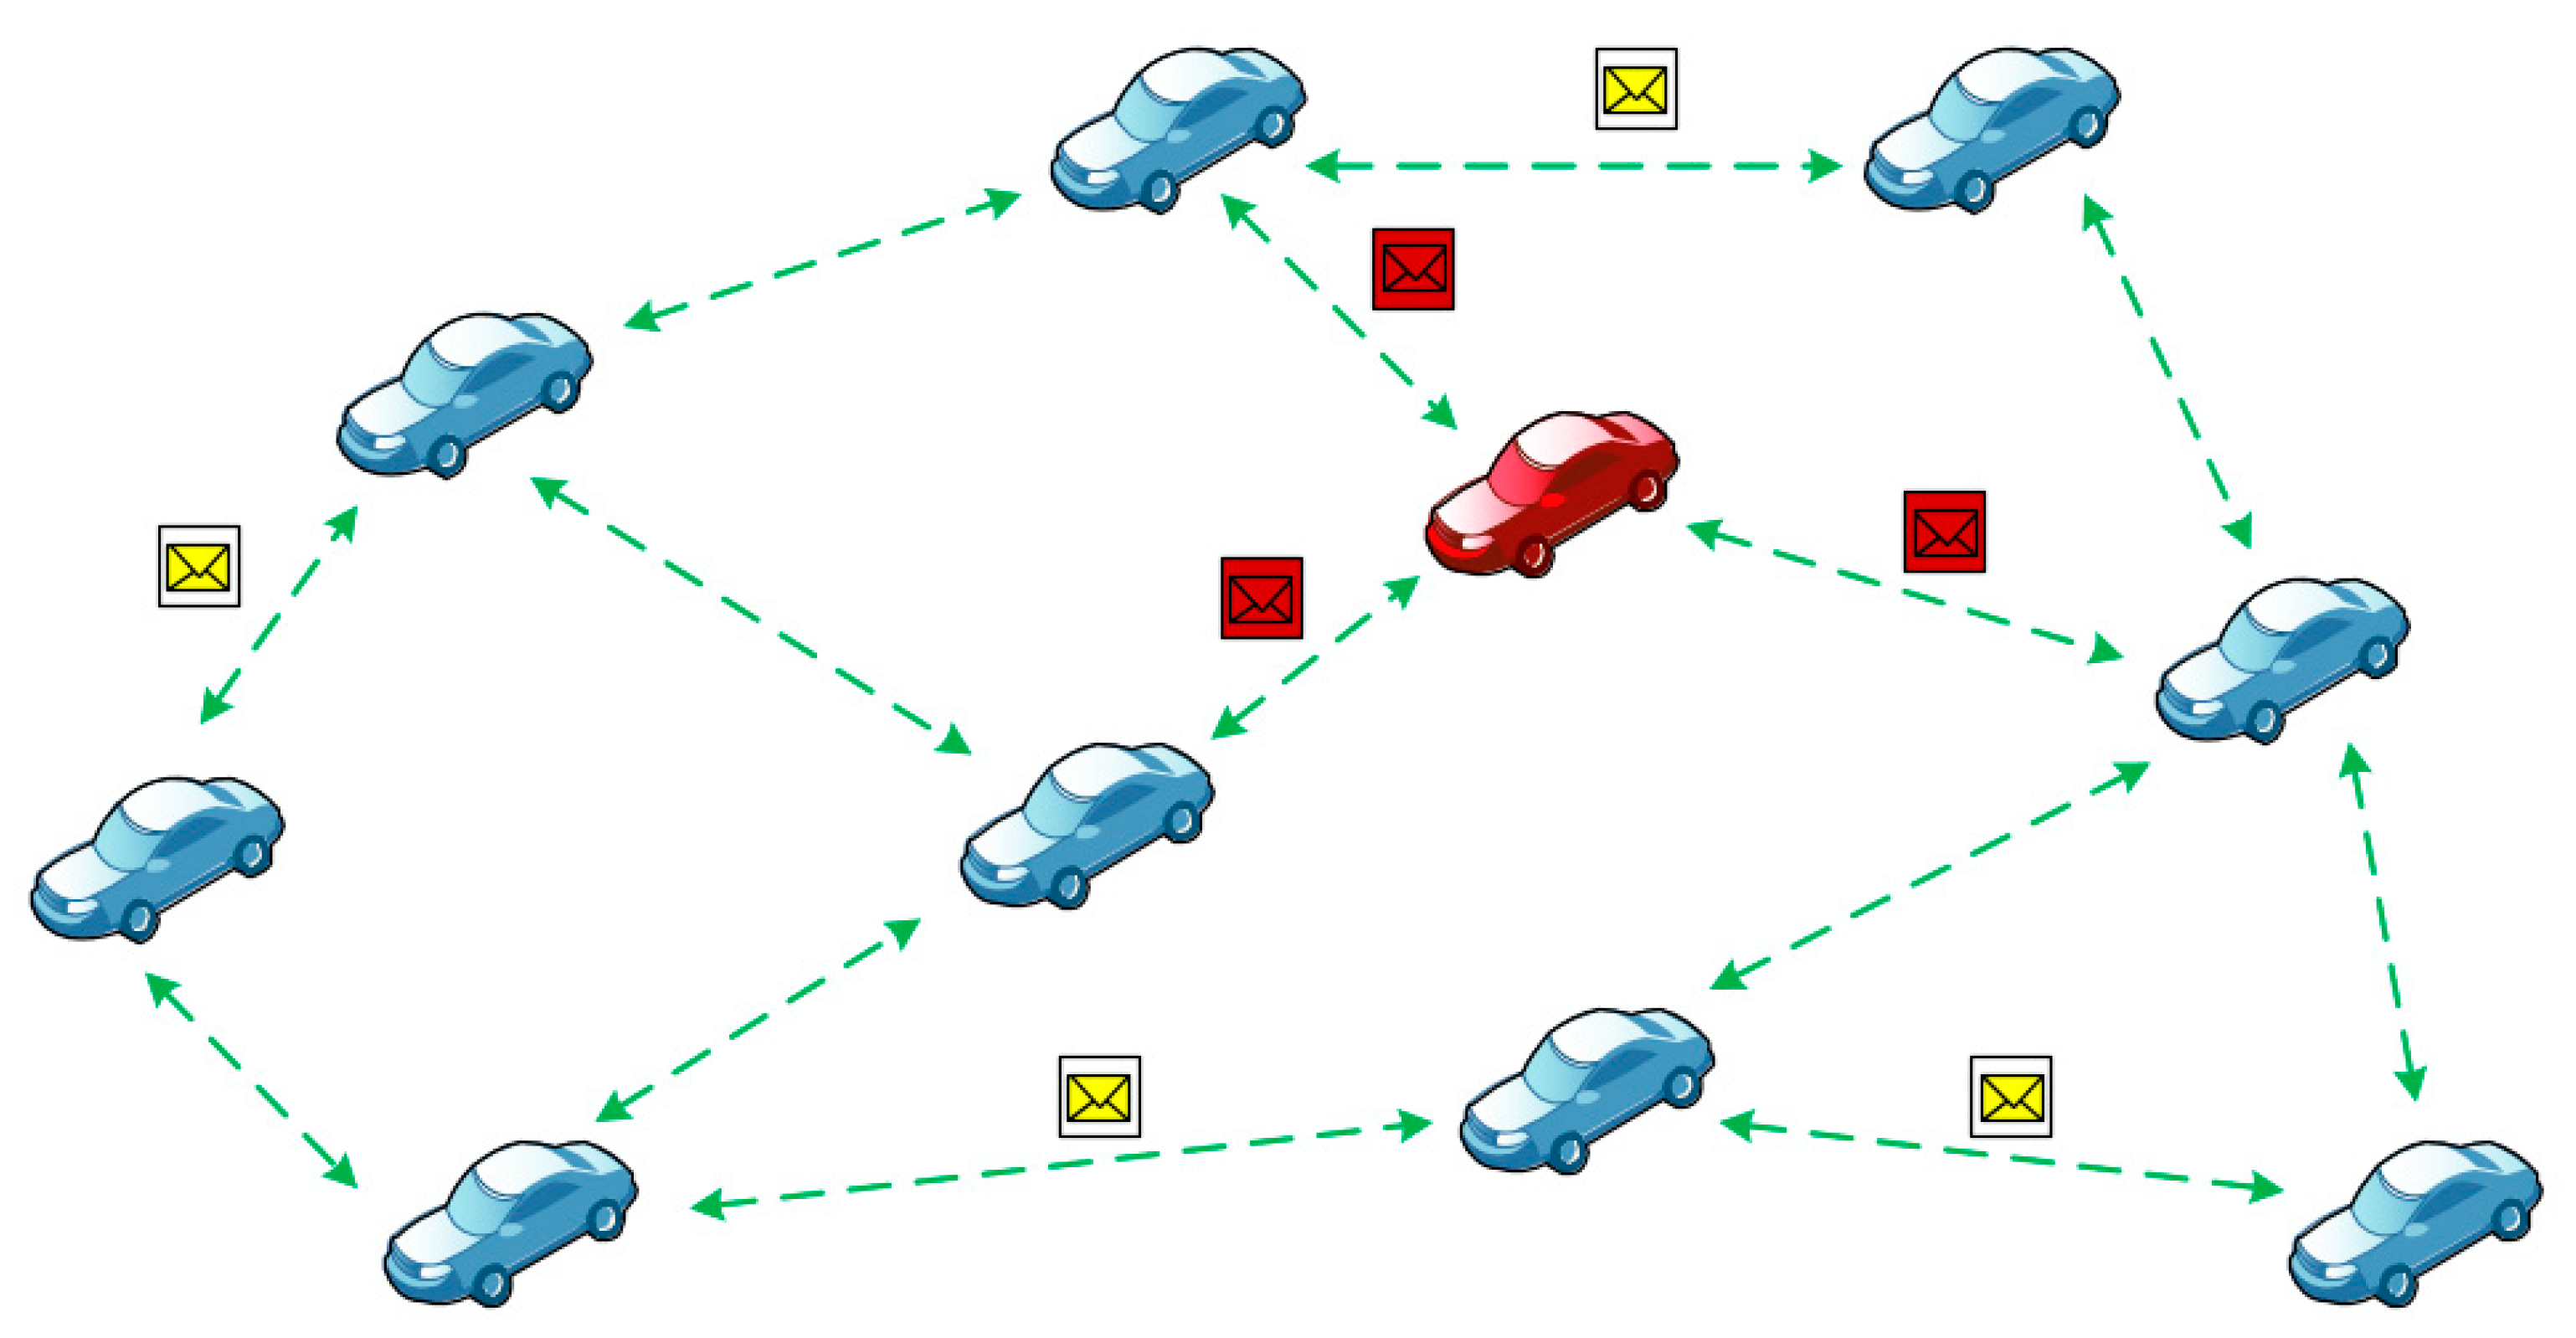
2.2. The Distributed DoS (DDoS) Attack
The intruders’ nodes start their attacks from rather locations at different times. For example, malicious nodes situated next to the target node can send a stream of messages to it at the same time and thereby isolate it from other networks (
Figure 4).
2.3. The Black Hole Attack
The intruder’s node catches and drops off the received packets that have to be transmitted to other nodes. This sort of attack is especially effective when the trust policy is compromised in the dynamic network (
Figure 5).
2.4. The Gray Hole Attack
If the intruder’s node drops off all of the received packets, it can be detected by neighbor nodes. Therefore, the intruder can partially drop the packets (
Figure 6).
2.5. The Sinkhole Attack
The intruder’s node can be the most preferred one for the neighbor nodes to arrange an optimal route [
24]. In a dynamic network, a node can send out the routing messages, informing its neighbors that it is the best node for the packet sending to the base station. This allows the intruder to become a network hub and collect all the packets addressed to the base station (
Figure 7).
2.6. The Wormhole Attack
The intruder catches the data packets and replays them to another malicious node by using a wormhole link (a tunnel). This attack is harmful to the avoidance of valid routes and leakage of the data packets (
Figure 8).
2.7. The Sybil Attack
The intruder represents several network nodes at once for other nodes [
25], which becomes a security issue for the dynamic routing protocols, as it can affect the vote-based routing and load balancing algorithms (
Figure 9).
2.8. The Illusion Attack
The intruder’s node tries to purposely manipulate the sensing data to produce falsified information about the moving node [
26]. The impact of this attack is that the human decision and reaction is dependent on the falsified data that can cause accidents, traffic jams, and reduce transportation efficiency. The message authentication and integrity control cannot protect the networks against this type of attack as the intruder’s node directly manipulates the sensors to broadcast the wrong traffic (
Figure 10).
The implementation of just one attack from the above list may lead to system faults, which can cause negative consequences: a threat to human health, ecological disaster, or industrial blackout.
3. The Security Risk Assessment Methods
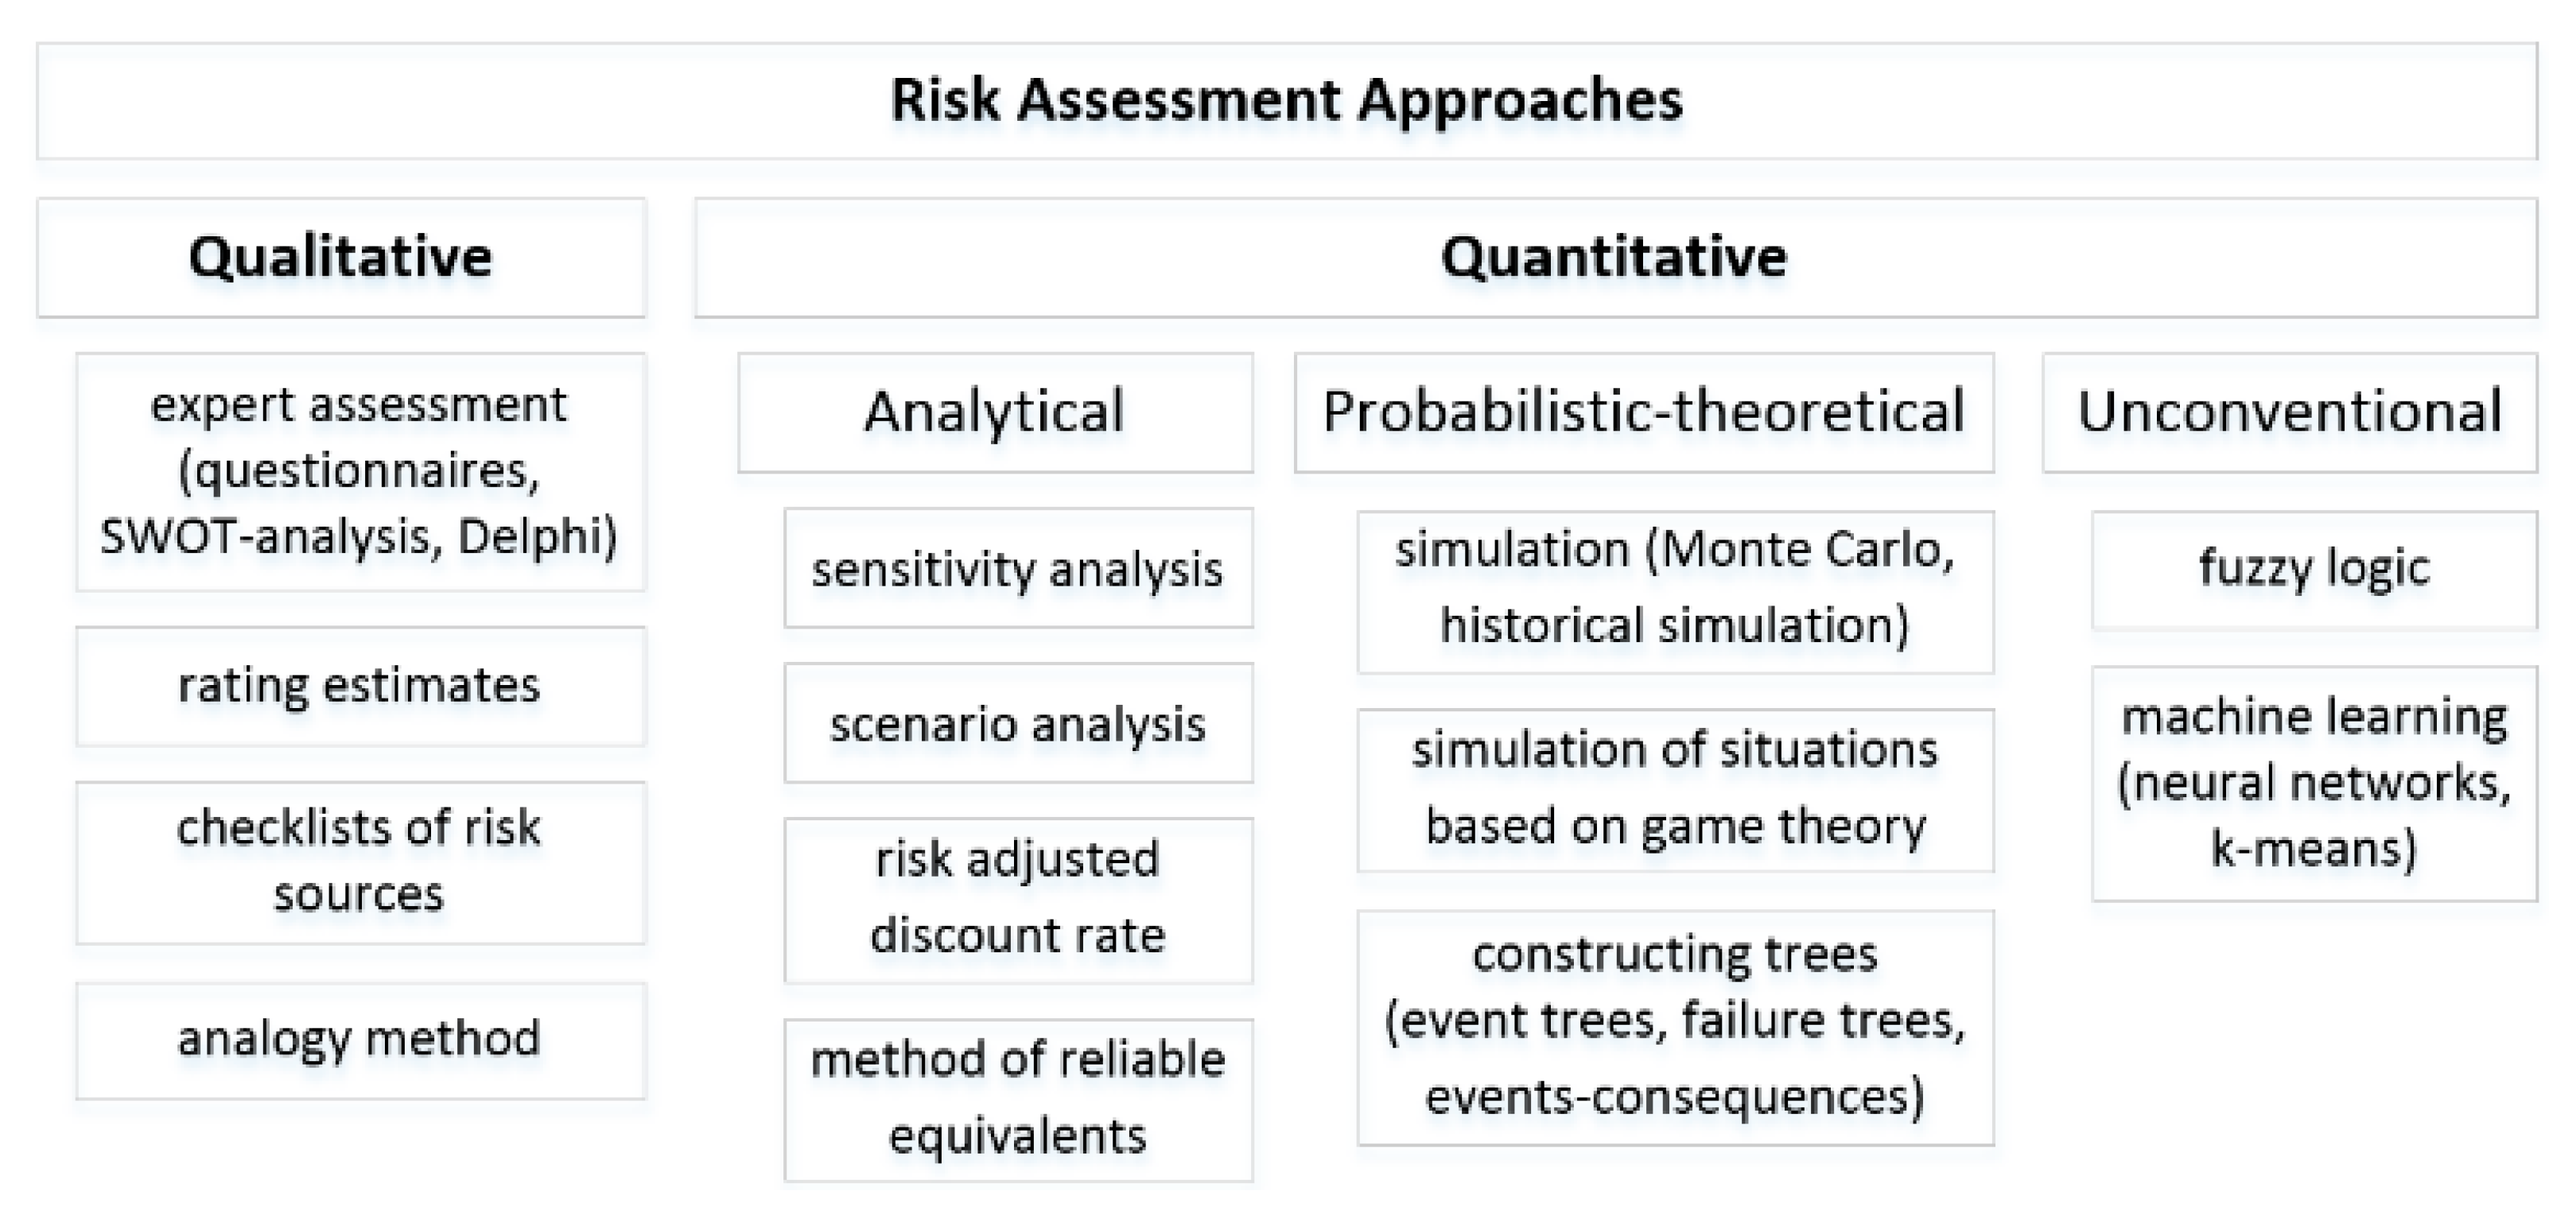
The security analysis of the smart city infrastructure is the process of identifying vulnerabilities, cybersecurity threats and security risks associated with the assets, and counter-measures that mitigate these threats. There are three basic approaches to cyber risk assessment: qualitative, quantitative, and mixed approaches [
27].
The following methods of qualitative risk analysis are distinguished:
The expert assessment is a combination of logical and mathematical procedures to elaborate the expert’s opinion on a certain range of security issues in an inspected system [
28]. The key to this method is the ability to use the experience and intuition of a field specialist to make the optimal decisions. There is no need for accurate data and expensive software toolkits. However, the main drawbacks of this method are the subjective estimations and the difficulty to attract independent and highly skilled experts. The samples of the expert estimation technique are questionnaires, brainstorm, SWOT analysis, SWIFT, and the Delphi method.
The rating method is based on the formalization of the ratings obtained. If specialists are involved in this, then this method is considered a type of expert assessment. However, recently semi-formalized procedures are often applied, and thereby this method is considered the independent one. The simplest way of rating is ranking. In this case, they use a scoring system. The most commonly used is a five-point scale (as well as a scale of 10 or 100 points). An expert assigns a certain score to each risk depending on the influence on the system’s security. When building a rating, the competence of each expert is taken into account. The result of this method is a completed risk rating table.
The checklists of risk sources form a method of which the essence is to use retrospective information of the system. It is based on the fact that risk lists compiled earlier for previous activities are used. The security incidents in the past, risk factors, and last security attacks are explored. This trace is constantly expanded by adding a current history of the system. However, in time, this endless log of the system security events can lead to the loss of control. In addition, some events may not be added to the checklist, and correspondently they will not be explored at risk analysis. This method is useful for risk identification. The use of a checklist of risk sources allows negative cases to be identified. This approach may accompany other methods.
The essence of the analogy method is to look for similarities in a phenomenon, objects, and systems. The method of analogies is widely used in assessing the risk for the typical systems. This method is used in the case when other methods of risk assessment are unacceptable.
For quantitative risk analysis, the following methods are applied:
Analytical methods: sensitivity analysis, scenario analysis, method of the risk-adjusted discount rate, and method of reliable equivalents;
Probabilistic theoretical models: simulation (Monte Carlo method, historical simulation method), simulation of situations based on the game theory, and tree constructing methods (event trees, failure trees, events-consequences);
Group of unconventional methods: modeling with fuzzy logic and machine learning (neural networks, k-means, support vector machine).
The sensitivity analysis takes place with a sequentially single change in each variable: only one of the variables changes its value, for instance, by 10%, on the basis of which the new value of the criterion used (e.g., Net Present Value or Internal Rate of Return) is recalculated. After that, the percentage change in the criterion is estimated in relation to the basic case. The sensitivity indicator is calculated, which is the ratio of the percentage change in the criterion to the change in the value of the variable by one percent. The elasticity of the change in the indicator. In the same way, the sensitivity indicators are calculated for every variable. After calculating the results, an expert ranking of the variables is carried out according to the degree of importance and an expert assessment of the predictability of the variable values (e.g., high, medium, low). Then, the expert can build a sensitivity matrix, which allows us to identify the least and most risky indicators.
The scenario analysis is a method for building a forecast for the system. The prognosis includes several possible ways for the progress of the security situation and the relative dynamics for the key indicators of the system’s security. The pessimistic scenario of the possible change of the indicators, the optimistic one and the most likely one, are calculated. According to the built scenarios, new values of the performance criteria are determined. These indicators are compared with the baseline values, and the necessary recommendations are made. The basis of each scenario is the expert’s hypotheses about the direction and magnitude of changes in factors for the forecasting period.
The method of risk-adjusted discount rate is the basic and most frequent method of assessing risks. Its peculiarity is a change in the basic discount rate, assessed as minimally risky. Regulation takes place by adding the amount of the required risk premium. The method of reliable equivalents corrects the estimated values of cash flows by multiplying them by special decreasing coefficients (reliability or certainty factors).
The simulation is the most accurate, complex, and expensive method of quantitative risk analysis and is based on mathematical statistics. Some authors propose measuring the level of risk in economic decision-making on the basis of special tools based on the concept of the measurement theory, which includes system analysis, choosing a risk measurement scale depending on the measurement goals and the amount of information available, and then choosing the method for determining the values of a risk measurement indicator. They propose to separately address issues of measuring the probabilities and socio-economic assessment of the case situation. The scales for measuring the probabilities and magnitude of deviations depending on the purpose of the measurement and the amount of available data can be ordinal, nominal, scale of relations, or absolute. One of the most famous methods of simulation is the Monte Carlo statistical test method, which allows to build a mathematical model for a system with uncertain parameter values and, knowing the probability distributions of the system parameters, as well as the relationship between parameter changes, obtain the distribution of the project or transaction profitability [
29].
One of the most common modeling methods for choosing a solution is game theory [
30]. Traditionally, choosing a solution in the face of security risks is a game with nature. This technique begins with a construction of a payment matrix (performance matrix or game matrix), which includes all possible outcome values. In the absence of information about the probabilities of the state of the medium, the theory does not provide unambiguous and mathematically rigorous recommendations for choosing the decision criteria. This is explained to a greater extent not by the weakness of the theory but by the uncertainty of the situation itself and the difficulty of obtaining quantitative estimates of goals and outcomes.
However, most of the tasks require the analysis of a whole sequence of decisions and environmental conditions when complex multi-stage decisions have to be made. If there are two or more consecutive sets of solutions, and subsequent decisions are based on the results of the previous and two or more sets of environmental conditions, a decision tree is applied [
31]. The decision tree is a schematic representation of a decision problem. The branches of the decision tree represent various events (decisions), and its vertices are the key states in which the choice has to be made. Most often, the decision tree is downward. The basis of the simplest structure of the decision tree is the answers to the questions, yes and no. For each arc of the tree structure, the numerical characteristics can be determined, for example, the amount of profit for a particular system and the probability of its receipt. In this case, it helps to take into account all possible options for action and to correlate financial results with them. Then they go on to compare alternatives. The disadvantage of this method is the limited number of solutions for the problem. In the process of building the decision tree, you have to pay attention to the tree size. It should not be too big to limit your ability to generalize the analysis and provide the correct answers.
In recent years, unconventional methods for risk assessment based on artificial intelligence systems and models have become increasingly popular [
32]. A feature of the mathematical apparatus of fuzzy logic is that it uses fuzzy sets with incomplete, missing, or probabilistic data [
33]. For example, the authors of [
34] have proposed fuzzy logic to reduce the subjectivity of the qualitative method of the risk analysis. Fuzzy logic works not so much with concepts that have clear semantic-quantitative boundaries but with a lot of probabilistic data within the boundaries. The fuzzy logic does not set up the logical relationships with specific values but with data areas with the possible updating of any value within the boundaries of this area.
Correlations between certain risks can be evaluated by the machine learning models, identifying connections that are not easily observable [
35]. The work [
36] also discusses the important role and significance of big data and machine learning as the emerging data analysis methods for insurance risk estimation and introduces the random forest algorithm for the risk assessment. According to [
37], artificial neural networks (ANN) are to be the most applied machine learning method to aid in engineering risk assessment. The use of neural network technology is appropriate in cases where the formalization of the decision process is difficult or even impossible [
38]. The ANN is a very powerful modeling tool because it is a nonlinear calculating apparatus by nature. Linear modeling has been so far a fundamental one in most areas of the assessment since there are a large number of optimization methods for it. However, in the problems of the risk analysis, the linear modeling methods in the vast majority of use cases are not applicable. In [
39], it is proposed to use artificial intelligence to analyze cyber risks during the colonization of Mars. The authors apply the adapted version of the aggregate loss method to compound a poisson discrete probability distribution. The following metrics are used: expected present value of the loss, shortfall probability, shortfall of the expected present value of the loss, value at risk (VaR), and conditional tail expectation (CTE). The mathematical formulas present a better understanding of the cost and risk evaluation with multiple risk calculation metrics for different cyber risk levels and tail risk under different assumptions. However, the metrics used in this work require serious mathematical methods, which lead to a slowdown in the risk analysis system. In the rapidly changing and moving environment of a smart city, finding a balance is an important task; mathematical calculations should not require a huge amount of input data and take too long.
Figure 11 denotes the taxonomy of the existing risk assessment approaches.
After analyzing the methods considered, it was concluded that risk assessment methods (Delphi method, brainstorming, SWIFT, etc.) based on an expert’s assessment and requiring the active participation of a human cannot be applied for the dynamic infrastructures of the smart city. Methods that use scenario analysis (root cause analysis, fault tree analysis, event tree analysis, etc.) and functional analysis (protection level analysis, hidden defects analysis, types and consequences of failures, etc.) are industry-specific and poorly adaptable to address cybersecurity challenges. The use of statistical models (Monte Carlo method, Bayesian networks, etc.) is hampered by the complexity of collecting statistical data for the calculations of the resulting indicators in networks with a peer-to-peer architecture, as well as the dependence of the accuracy of the decisions made on the number of iterations.
Therefore, the modern methods based on artificial intelligence, due to their adaptability and predictability, are the most suitable approaches for assessing the cybersecurity risks in the dynamic networks of the smart city. The ability to work with big data, fast classification speed, discovering hidden patterns, and higher accuracy—all these advantages of machine learning are especially important in the application field under consideration in the conditions of a large number of connected devices, the interaction and influence of the devices on each other, as well as the hierarchy of the systems of different levels and scales. The quantitative approach used in the neural networks sets the exact values of the probability of the security threats and possible consequences, as well as the risk itself for each type of asset. Numerical values are convenient for the analysis and the results comparison.
4. The Neural Network Model for the Cybersecurity Risk Assessment
It is proposed to reduce the task of assessing the cybersecurity risks to the task of classification. Let be the set of the considered states (modes of operation) of a large-scale dynamic network, among which there are both safe and unsafe states. Each state is characterized by a certain value of the cybersecurity risk. It is required, with a minimum time for accumulating statistical information , to identify the risks of the cybersecurity violations of the dynamic network with sufficient accuracy.
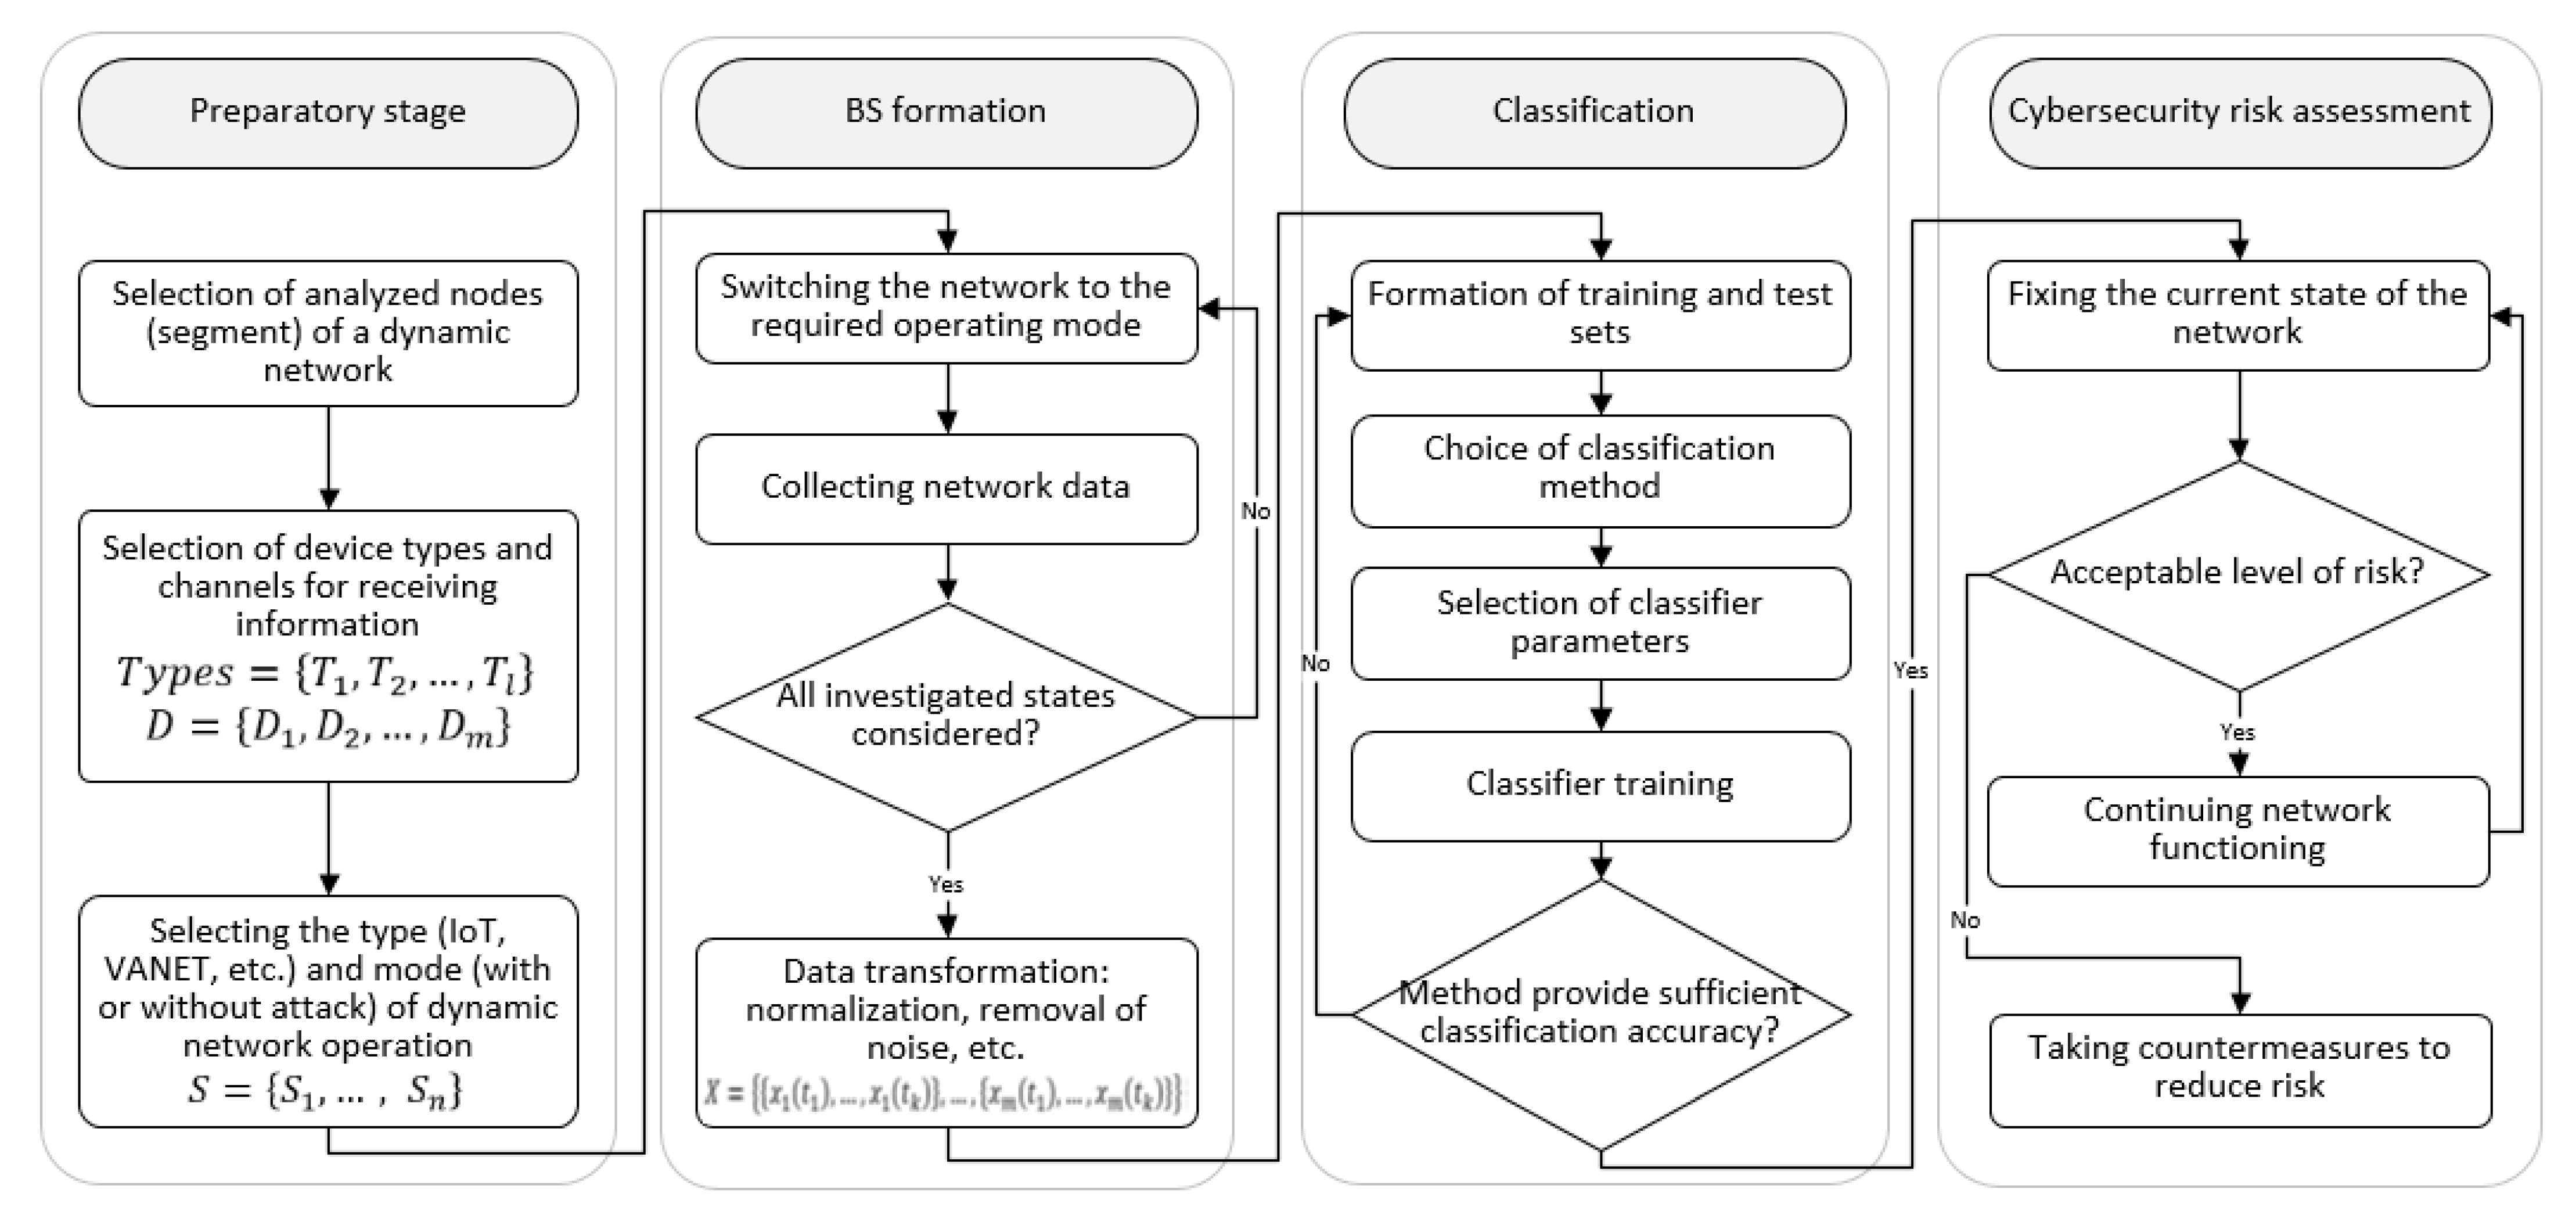
As part of the task, a methodology for identifying the risks of cybersecurity violations has been developed (
Figure 12). The technique consists of four stages:
Preparatory stage;
Formation of training samples, the base of scenarios (BS) of the dynamic networks operation modes;
Classification;
The cybersecurity risk assessment.
The set of types of the network nodes , selected for the specific dynamic network, forms a time series , which are the time-synchronized network characteristics (interaction and influence coefficients, probability of cyberattacks, etc.) from various devices located on the controlled node of the dynamic network.
The key indicators in assessing cybersecurity risks are the likelihood of a cyberattack occurring and the damage caused, usually expressed in monetary terms. However, when assessing risks in the smart city networks, it is important to understand that not only the integrity, confidentiality, and availability of data but also the life and health of people are at risk. Typically, the cybersecurity risk assessment is a classification problem and a regression tree that either classifies the current cybersecurity risk level as acceptable or unacceptable or predicts classes based on past data. Although traditional statistical analysis and mathematical models are widely used in various cybersecurity risk assessment analysis scenarios, the artificial neural network models are more flexible and capable of modeling more complex nonlinear functions than classical statistical models such as linear discriminant analysis and logistic regression. For example, for a neural network model using a logistic function, its more hidden layers allow the study of complex nonlinear relationships. In addition, the advantage of the ANNs is that they do not require an explicit indication of the functional relationship between the dependent and independent variables. The ANN weighing process simply assigns less weight to variables that it predicts will be less important.
Based on the analysis of the problem, it has been decided to use the perceptron model and the backpropagation algorithm as a training one. This type of ANN is pretty well researched and described in scientific reports [
40]. The advantage of a multilayer perceptron is the ability to solve the linearly inseparable problems, high classification accuracy with a small dimension of the input data [
41]. Each ANN’s element builds a weighted sum of its inputs, adjusted in the form of a term, and then passes this activation value through the transfer function, thus obtaining the output value of this element. Elements are organized in a layered topology with direct signal transmission. Such an ANN can easily be interpreted as an input-output model, in which weights and threshold values (offsets) are the free parameters of the model.
A typical backpropagation neural network consists of a three-layer structure: input nodes, output nodes, and hidden nodes. To solve the problem of assessing cybersecurity risks, the network parameters of the smart city nodes (such as the interaction with other nodes) and economic indicators (for example, the value of an asset) are used as input variables, and the assessment result (acceptable or unacceptable) is used as output variables. The unacceptable level of risk suggests that measures need to be taken to improve the security of the large-scale smart city network. The input layer is used to enter the training data, the hidden layers transform the raw data into multidimensional nonlinear objects, and the output layer classifies the data. The input layer consists of neurons that take cybersecurity risk measurement indicators as the input vector. Low-level elements from the original input are abstracted into the high-level elements through multiple hidden layers. There is only one neuron in the output layer, representing the level of the cybersecurity risk (acceptable—0 and unacceptable—1).
One of the most important steps in training a neural network is preparing datasets. To solve the problem of assessing cybersecurity risks, datasets collected in smart city networks and containing various types of assets, network traffic, and the level of cybersecurity risks are needed. The analysis showed that today there are no datasets that meet such requirements, so it was decided to build our datasets in a synthetic manner applying the network simulator NS-3. In the NS-3 environment, a large-scale dynamic network was built, and such smart city systems as VANET, MANET, IoT, and IIoT were simulated in a single complex. During the simulation, the following network attacks were implemented in the NS-3 network model: black hole (BH), gray hole (GH), DoS, DDoS, and wormhole (WH). This choice is due to the fact that in dynamic networks with peer-to-peer architecture, the problem of attacks aimed at disrupting the dynamic routing is acute [
42]. All of these intrusion test cases are related to the types of devices that they can affect.
Table 1 shows the features that were extracted during the modeling and included in the datasets.
The device types were identified, and this allows us to avoid the exact enumeration of the ever-growing number of connected devices. Types of devices accumulate devices that perform the same functions in the system, as well as interact and exchange messages with the same number of devices of another type. For a risk assessment, the types T = {Ti} of the smart devices were obtained, where 1 ≤ i ≤ n, n is a number of the allocated types of devices. |Ti| = nTi is a number of devices of type Ti. For each device, its cost was determined. The parameter QTk shows the size of the possible damage during the implementation of the threat. The amount of damage is expressed in monetary units.
The cybersecurity threats for the smart network environment U = {Uj}, 1 ≤ j ≤ m, also were denoted, where m is a number of the identified security threats. It is also necessary to determine the correspondence of Uj ∊ U threats with the types of Ti ∊ T devices that are the subject of these threats.
To correspond to the specific features of the dynamic networks, the special coefficients
ITiTk and
CTiTk are used.
ITiTk is the coefficient of influence of the devices of the type
Ti ∊
T on the devices of the type
Tk ∊
T. To calculate it, the communications are analyzed between the device of the type
Ti ∊
T and the device of the type
Tk ∊
T. Based on this, the formula is derived to calculate the coefficient of Influence (1):
where
is a number of the significant messages exchanged between the device of the type
Ti ∊
T and the device of the type
Tk ∊
T;
is a number of all messages sent from the device of the type
Ti ∊
T to the device of the type
Tk ∊
T. Significant messages are the large volume messages via the TCP/UDP protocols when a node purposefully sends information to another node. The influence coefficient can take a value from [0; 1]. If
I = 0, the devices are not connected. If C = 1, the devices affect themselves.
CTiTk is the coefficient showing the number of the devices of the type Tk ∊ T with which the device of type Ti ∊ T interacts, i.e., the nodes exchanged the messages at least once. This coefficient can take the values [0; nTi]. nTi is a number of the devices of the type Ti.
Thus, as a result of modeling, a vector is formed containing 38 parameters. The developed ANN was trained on the marked dataset.
Table 2 presents the thresholds for the unacceptable risk.
The thresholds were set by the author independently according to the following principle: assets, the failure of the functioning of which can directly refuse to affect the life and health of people, have the least probability of acceptable risk (vehicles, medical sensors, etc.). Assets that can indirectly cause harm to human health (traffic lights, smart robots, etc.) have an average risk tolerance level of around 0.1%. In case of a cyberattack on a smartphone, laptop, etc., if there is no threat to human life, and the cost of the assets is usually small, these assets have a threshold of 1% and 0.5%, correspondently. In the future, it is planned to develop an approach to calculate the permissible probability thresholds of the unaccepted risks.
For instance, the following vector was obtained for node 1 (vehicle). The values of the vector parameters are presented in
Table 3. This script was run 10,000 times to determine the level of the risk how often this node will fail. As a result of the study, it was determined that this node fails five times, the probability of such an event is 0.05%, which exceeds the established threshold of acceptable risk set in
Table 2. The risk for such a vector is marked as unacceptable—1.
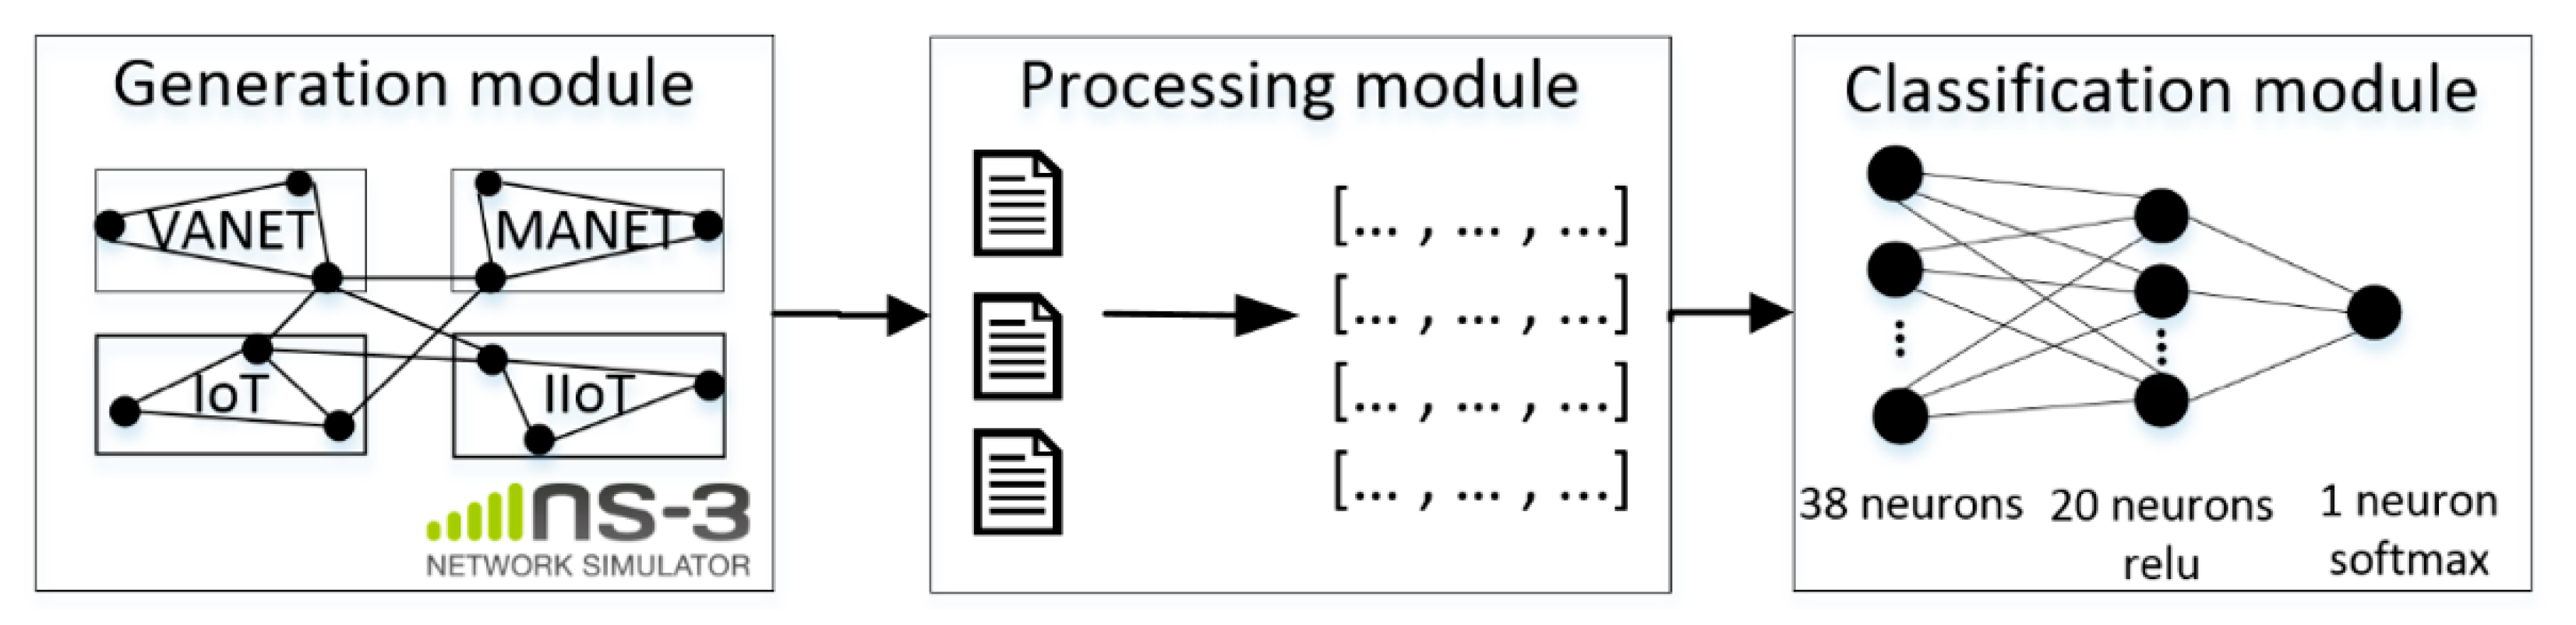
Figure 13 shows the scheme of the experimental setup configuration. Using the NS-3 simulator, we simulate the environment of a smart city, during which files with network information are logged, which are subsequently converted into vectors and fed to the input of the developed neural network risk assessment system.
6. Discussion and Future Perspectives
An analysis of the security and risk management research for the dynamic networks of the smart city has shown that the current works actively propose new approaches to risk assessment, as the traditional methods are unable to operate with the specifics of the rapidly changing network assets.
The machine learning methods have already shown their effectiveness in tasks that require working with big data and hidden dependencies. Our work presents a neural network approach to assessing cybersecurity risks. Using the network simulator, it was possible to recreate the dynamic network infrastructure of a smart city. Modeling scenarios were developed, and five types of network attacks were implemented. From the data obtained in the course of modeling, a dataset was prepared, including network characteristics and economic characteristics. All assets were typed, and a threshold of the acceptable level of risk was determined for each asset type. A neural network model was developed, namely a three-layer perceptron, which was trained on labeled data, and then the classification quality was assessed on unlabeled data. The test results showed an accuracy of 98–99%, which speaks of the promise of the proposed approach. The main advantages of the proposed approach are the ability to work in rapidly changing conditions, high classification accuracy when working with big data, the possibility of dynamic risk assessment, as well as the ability to work in conditions of limited awareness of the state of the entire smart city network.
In practice, to ensure high accuracy, the central node calculating the cyber risks has to collect data on the controlled network in real-time, constantly update the probabilities of network attacks, the interaction coefficients, and the influence of nodes on each other. In addition, the operation of a neural network requires significant computing power: the more nodes are in the controlled network, the more computing resources are required. Nevertheless, despite the mentioned limitations, the proposed approach is more flexible than the existing approaches discussed in
Section 3. The ability to constantly supplement the training set, dynamically monitor the level of cyber threats in the smart city network, and update the parameters of nodes all favorably distinguish the proposed method from existing analogs.
In the future, it is planned to continue our research in these areas:
Add new features to datasets (for example, various network indicators: the ratio of sent and lost packets, throughput, number of hops, etc., as well as economic indicators: ROI, ROA, and ROE);
Compare the proposed neural network approach with other existing cybersecurity risk assessment methods.


