Article

A Novel Load-Dependent Multimodal Vibration Signal Enhancement and Fusion Framework (LD-MVSEFF) for Load-Specific Condition Monitoring

by
Shahd Ziad Hejazi
1,* and
Michael Packianather
2
1
Department of Industrial Engineering, Faculty of Engineering, King Abdulaziz University, P.O. Box 80204, Jeddah 21589, Saudi Arabia
2
School of Engineering, Cardiff University, Queen’s Buildings, 14–17 The Parade, Cardiff CF24 3AA, UK
*
Author to whom correspondence should be addressed.
Machines 2026, 14(4), 372; https://doi.org/10.3390/machines14040372
Submission received: 10 January 2026 / Revised: 16 March 2026 / Accepted: 23 March 2026 / Published: 27 March 2026

Abstract

This paper presents a Load-Dependent Multimodal Vibration Signal Enhancement and Fusion Framework (LD-MVSEFF) for load-specific condition monitoring, building on the Customised Load Adaptive Framework (CLAF). The proposed approach enhances the classification of CLAF load-dependent subclasses, namely, Healthy, Mild, Moderate, and Severe, by integrating complementary information from raw vibration signals and encoded signal representations. Three input channels are employed, combining time–frequency domain features with Continuous Wavelet Transform (CWT) and Gramian Angular Difference Field (GADF) image encodings, with each channel independently trained and evaluated to identify its most effective classifiers. To address the reduced separability of the Mild and Moderate fault subclasses under varying load conditions, a weighted decision-fusion strategy is introduced, assigning classifier contributions according to their class-specific strengths. Experimental evaluation over five runs demonstrates high and stable performance, with the best configuration achieving an overall accuracy of 99.04% ± 0.22% and an average training time of 18 min and 30 s. The results confirm the effectiveness of LD-MVSEFF as a robust multimodal methodology for load-specific condition monitoring.

1. Introduction

Rotating machinery has been widely studied in the context of condition monitoring and fault classification due to its critical role in industrial systems. As such, failures in these systems carry significant operational and economic implications. Among their components, bearings are particularly susceptible to degradation due to prolonged operational stress, often resulting in suboptimal conditions and reduced system efficiency [1]. Bearing failures are widely reported as the most frequent source of induction motor malfunction. The recent literature and industry reliability surveys indicate that rolling bearing defects account for approximately 40–50% of induction motor failures, with IEEE reports attributing 42% of faults to bearing defects and Electric Power Research Institute (EPRI) statistics estimating approximately 41% [2,3]. Various diagnostic techniques have been developed to detect bearing faults, including temperature monitoring, acoustic emission analysis, vibration signal analysis, and more recently, data-driven methods such as neural networks [4]. Detecting these faults early is essential for maintaining reliability and avoiding costly downtime. Traditional approaches rely on time-domain, frequency-domain, or time–frequency analysis of vibration signals [5], but often overlook the complementary nature of these domains [6].
Recent advances in machine learning (ML) and deep learning (DL) have improved fault classification performance [4,7,8]. Convolutional Neural Networks (CNNs) are widely used for fault diagnosis using both 1D vibration signals [9] and 2D signal encodings such as Continuous Wavelet Transform (CWT) images [10,11,12] or thermal images [1]. Pre-trained CNNs and transfer learning (TL) have further enhanced diagnostic performance across domains [13,14,15,16,17]. However, most studies assume access to multiple sensor modalities or use single-view representations, limiting their generalization under varying load conditions.
A key challenge remains: how to effectively capture rich, discriminative features from a single signal source (vibration) to improve fault-subclass classification under different loads. While data fusion techniques have been explored [1,18,19,20,21,22], their application has largely focused on multi-sensor setups or generic fault types. Meanwhile, emerging 2D signal encoding techniques such as Gramian Angular Fields (GAF), including Gramian Angular Summation Field (GASF) and Gramian Angular Difference Field (GADF), and CWT have shown potential for improving feature extraction from vibration signals [1,12,23,24,25,26]. Although GADF has demonstrated strong potential, it is still less commonly utilized than CWT in the context of vibration signal encoding in vibration-based condition monitoring frameworks.
This study builds on these findings by proposing a deep learning-based fusion framework aligned with the Customised Load Adaptive Framework (CLAF) [8], which enables more granular load-dependent subclassification (Healthy, Mild, Moderate, Severe). Unlike conventional binary classification (“Normal” vs. “Faulty”), CLAF provides a structured way to analyze fault severity under different load conditions represented in the dataset. The previously published CLAF framework primarily focused on defining and structuring load-dependent fault-severity subclasses derived from vibration data. In that framework, load variation was introduced through the MFPT bearing test-rig dataset, where radial load levels are intentionally varied in a controlled experimental environment to evaluate vibration-based fault classification methods. It provided systematic dataset organization and subclass formulation methodology but did not investigate multimodal feature integration or decision-fusion classification strategies.
In contrast, the present study introduces the Load-Dependent Multimodal Vibration Signal Enhancement and Fusion Framework (LD-MVSEFF), which extends the CLAF structure by integrating three complementary feature domains—time and frequency domain (TFD) features, Continuous Wavelet Transform (CWT) representations, and Gramian Angular Difference Field (GADF) encodings—within a parallel multichannel architecture. The proposed framework further incorporates optimized classifier selection for each channel and performance-weighted decision fusion, together with systematic evaluation of single-channel and multichannel fusion configurations. This enables quantitative assessment of the complementary contribution of each representation and demonstrates how multimodal fusion improves robustness and classification accuracy across CLAF fault-severity subclasses. Accordingly, this study does not model or estimate operating load but utilizes the predefined CLAF subclasses as structured classification categories for evaluating the proposed decision-fusion framework.
To the best of the authors’ knowledge, no existing work systematically integrates multi-view representations derived from vibration signals within a unified fusion architecture explicitly tailored for CLAF-based subclass classification. This paper addresses that gap through a multichannel architecture that combines statistical, time–frequency, and 2D image-based features using performance-weighted decision fusion. In this study, Inner Race Fault (IRF) and Outer Race Fault (ORF) conditions from the MFPT dataset are used as representative benchmark fault scenarios to evaluate the proposed fusion framework within the established CLAF subclass structure.
LD-MVSEFF is evaluated for CLAF-based fault-subclass classification using the MFPT benchmark dataset, enabling systematic assessment of the impact of multimodal feature representation and performance-weighted decision fusion on classification robustness under load variation. LD-MVSEFF is evaluated for CLAF-based fault-subclass classification using the MFPT benchmark dataset across the load range represented in the data, enabling systematic assessment of the impact of multimodal feature representation and decision fusion on classification performance.
The contributions of this paper are summarized as follows:
(a)
Multimodal fusion and decision fusion: The proposed framework LD-MVSEFF combines features from GADF, CWT, and TFD features to enhance the load-dependent fault classification within the established CLAF structure. By integrating these complementary patterns and using a weighted decision-fusion approach, the framework assigns classifier weights based on performance, helping to improve accuracy, particularly in the more challenging Mild and Moderate fault subclasses.
(b)
Comprehensive data integration: Insights from both 1D vibration signals and 2D RGB images (CWT and GADF) were combined to capture complementary patterns, enhancing the classification accuracy.
The paper’s structure is as follows: Section 2 covers the theoretical background and state-of-the-art research. Section 3 details the proposed framework and the dataset. Section 4 discusses the experimental results and evaluation. Lastly, Section 5 concludes the paper with suggestions for future research directions.

2. Background and Related Work

2.1. Feature Extraction Domains in Signal Processing

Feature extraction operates within three primary domains: temporal, spectral, and time–frequency. These distinct domains serve as tools to capture distinctive aspects of signal behavior. The section starts with time–frequency domain (TFD) feature extraction and moves to the 2D TFD features.
The feature extraction from vibration signals in the time domain is a crucial component of machinery fault diagnosis, enabling the early detection and continuous monitoring of machinery faults. This method entails computing diverse statistical parameters from the original vibration signal, which can subsequently be employed to assess the machinery’s condition and detect potential problems. Various key parameters are utilized in vibration signal analysis to extract vital information. These parameters include the Peak or Max value, which denotes the highest observed amplitude in the signal, and the Root Mean Square (RMS), which provides insights into signal magnitude. Skewness assesses distribution asymmetry, whereas standard deviation (std) quantifies average deviation from the mean. Kurtosis indicates distribution “tailedness,” potentially identifying outliers or impulses. The Crest Factor, calculated as the peak amplitude-to-RMS ratio, reflects peak sharpness. Peak-to-peak measures the range between maximum and minimum values, whereas the Impulse Factor accentuates impulsive behaviors often linked to machinery faults. These parameters contribute to a comprehensive understanding of vibration signal characteristics, facilitating effective fault diagnosis and condition monitoring [27,28,29,30].
On the other hand, extracting features from the frequency domain can provide insights into the data’s periodic components and harmonic structures. The frequency domain analysis of vibration signals involves examining the amplitude changes for different frequencies [31]. These features capture frequency-specific aspects of the signal and contribute to a better understanding of the vibration behavior [32]. Analyzing the frequency domain of vibration signals is crucial for understanding periodic components and harmonic structures. Key features include Root Mean Square Frequency (RMSF), Centre Frequency (CF), Mean Square Frequency (MSF), Frequency Variance (FV), and Root Frequency Variance (RVF), providing insights into signal characteristics and power distribution [32]. Standard harmonic features, such as Total Harmonic Distortion (THD), quantify frequency content [33,34]. Signal-to-Noise Ratio (S/N) and Signal-to-Noise and Distortion Ratio (SINAD) assess signal quality, particularly in gearbox fault analysis [35]. Spectral analysis transforms signals from the time domain to the frequency domain, with the AR model being a popular choice. Various methods, like Yule–Walker and Burg’s, compute AR coefficients, whereas the forward–backwards approach enhances classification, especially in machinery fault diagnosis [36,37]. Spectral features like peak amplitude, peak frequency, and band power offer comprehensive insights into frequency characteristics [31,32,33,34,36,38].

2.2. Two-Dimensional (2D) Signal Encoding Techniques

(a)
Gramian Angular Field (GAF) Signal Encoding
Wang and Oates introduced the concept of GAF encoding, a method that transforms time series data into images. GAF’s distinctive matrix construction maintains the integrity of the original data while capturing relationships between neighboring elements. This methodology proves beneficial for CNN models, enabling automatic feature extraction and enhancing classification performance [39]. The core concept behind converting time series data into images using GAF involves creating a matrix based on polar coordinates. This matrix preserves the temporal relationships within the one-dimensional (1D) time series signal, maintaining accurate temporal correlations compared to Cartesian coordinates. The process yields two types of GAF images: Gramian Angular Summation Field (GASF) and Gramian Angular Difference Field (GADF) [23].
Given a time series X = { x 1 , x 2 , …, x n } , the signal is first normalized and rescaled to the interval [−1, 1] to ensure a bijective mapping during polar coordinate transformation, as in (1) [23,40]:
x ¯ i = ( x i max X ) + ( x i min X ) max X min X
The time series is then mapped into polar coordinates by computing the angular component ϕ , defined as the inverse cosine of the normalized signal x ¯ i , while the polar coordinate r encodes the temporal position of each sample. The transformation is given in (2) [23,40]:
ϕ = a r c c o s x ¯ i ,     1 x ¯ i   1 ,   x ¯ i   X ¯   r   =   t i N ,                                           t i     N
where t i denotes the timestamp (sample index), N is a scaling constant, and r represents the polar coordinate used to encode the temporal progression in the polar coordinate space. Restricting ϕ to the interval [0, π] ensures a bijective angular mapping, preserving unique temporal relationships.
Unlike Cartesian representations, GAF preserves temporal structure by encoding time progression along the main diagonal of the resulting matrix. Temporal correlations between samples are quantified through angular relationships, using either the summation term cos ϕ i + ϕ j for GASF or the difference cos ϕ i ϕ j for the GADF [1].
(b)
Continuous Wavelet Transform (CWT)
The Wavelet Transform (WT) provides an alternative to the Short-Time Fourier Transform (STFT) for analyzing nonstationary signals, as it can represent both temporal and spectral characteristics with variable time–frequency resolution [10,25]. The CWT maps a time-domain signal into a time–frequency representation via convolution with a scaled and translated mother wavelet, producing correlation coefficients between the wavelet function and the original signal [11]. By adjusting the scale and translation parameters, CWT enables precise correlation measurement and energy-distribution mapping of the waveform, typically visualized as a scalogram [1]. In machine fault diagnosis, the Morlet wavelet is commonly combined with CWT to analyze vibration signals and generate time–frequency images that can be used as inputs to CNN-based classifiers for fault identification [41].

2.3. Physical Background of Load-Dependent Bearing Vibration

Bearing faults generate vibration because defects such as spalls, pits, cracks, and surface irregularities disturb the rolling contact between rolling elements and raceways. When a loaded rolling element passes over a defect, an impulsive force is produced that excites the natural modes of the bearing and housing, resulting in damped high-frequency oscillations repeating approximately at characteristic fault frequencies associated with inner race, outer race, rolling element, and cage motions [42]. In practice, these repetition frequencies may exhibit small stochastic variations due to rolling-element slip and cage dynamics, meaning that the impulse sequence is not perfectly periodic but fluctuates around nominal kinematic frequencies [43].
The vibration process is inherently nonlinear and nonstationary. Nonlinearity arises from Hertzian contact mechanics, where contact stiffness increases with load, while nonstationary behavior arises from variable load distribution among rolling elements, time-varying lubrication conditions, rolling-element slip, and thermal effects. Rolling-element slip refers to deviations from ideal no-slip rolling kinematics caused by variations in contact forces, friction torque, and cage dynamics, which may introduce small fluctuations in the instantaneous fault repetition frequency. Variations in external load alter internal load distribution, local contact stiffness, friction, and damping, so the same fault can produce significantly different vibration responses under different load conditions. Under higher load, impact forces and resonance excitation generally intensify, whereas under lower load, fault-related impulses may become weak, intermittent, or masked by background noise [42,44,45]. In controlled test-rig environments such as the MFPT dataset used in this study, the shaft speed is maintained constant at 1500 rpm (25 Hz) [46,47]; therefore, the nominal kinematic frequencies remain practical reference indicators for interpreting vibration spectra in condition monitoring.
Furthermore, because only a subset of rolling elements carries significant load at any instant, the effective bearing stiffness varies periodically with rotation, giving rise to variable-compliance excitation and load-dependent modulation of vibration signals. As the mean load changes, the resonance characteristics of the coupled rotor–bearing–housing system shift, leading to variations in impulse amplitudes, ringing patterns, sideband structures, and spectral distributions even for identical fault geometries. These physical mechanisms manifest in measured signals as load-dependent variations in time-domain indicators (e.g., RMS and kurtosis), frequency-domain features (e.g., fault-frequency amplitudes and sidebands), and time–frequency representations [42,44]. This behavior is also observable in the MFPT dataset used in this study, where vibration amplitudes and spectral characteristics vary across the different radial load conditions. These load-dependent variations motivated the subclass formulation adopted in the previously published Customised Load Adaptive Framework (CLAF) and are subsequently exploited by the proposed LD-MVSEFF classification strategy presented in this paper.

2.4. Customised Load Adaptive Framework (CLAF)

The CLAF is a two-phase methodology developed to support load-dependent fault classification in rotating machinery under varying radial load conditions and is evaluated in this study using the MFPT benchmark bearing dataset. It is tailored specifically for the MFPT bearing dataset. Phase 1 involves load-dependent pattern analysis in the time and frequency domains, including data preprocessing, segmentation, feature extraction, and validation using one-way ANOVA. Phase 2 customizes the methodology for the dataset by using Wavelet Singular Entropy and the CWT to classify faults into load-dependent subclasses: Normal (fault-free) or Healthy, Mild, Moderate, and Severe. This approach provides a detailed understanding of how load variations affect MFPT bearing dataset defects and introduces a new dimension to traditional fault classification by focusing on load variation and dataset customization. The CLAF is validated through classifier training and classification accuracy analysis for the proposed subclasses [8].

2.5. State-of-the-Art and Research Gaps

The field of fault detection in manufacturing systems has seen significant advances, particularly in the use of vibration signals for condition monitoring and bearing health assessment. A wide range of techniques has been developed to extract informative features from vibration signals, including time-domain, frequency-domain, and spectral analyses, as well as autoregressive (AR) models. More recently, machine learning (ML) and deep learning (DL), especially Convolutional Neural Networks (CNNs), together with fusion strategies and advanced signal encoding methods such as Gramian Angular Fields (GAF) and Continuous Wavelet Transform (CWT), have further improved fault classification capabilities.
Traditional vibration signal analysis methods often employ time-domain statistical features such as RMS, variance, and kurtosis, together with frequency-domain spectral features, for bearing fault detection [30]. However, it is widely recognized that vibration signals acquired from complex industrial rotating machinery often represent a superposition of responses from multiple mechanical components, including gears, shafts, and fluid interactions, which can mask bearing-related signatures. Consequently, in practical industrial environments, reliable extraction of bearing fault features generally requires prior signal separation, denoising, or advanced preprocessing techniques before time- or frequency-domain indicators can be interpreted with confidence [42,48].
Time-domain features have proven effective for early fault detection, but real-world signals often exhibit strong non-stationarity, making consistent feature extraction challenging [49]. Moreover, identifying informative features can be labor-intensive and sometimes infeasible, particularly in the case of complex machinery or rare fault types [50]. To improve fault characterization under noisy conditions, Lai et al. (2025) presents an implementation that combines established techniques, including spectral kurtosis analysis, Hilbert envelope demodulation, and Support Vector Machine (SVM) classification, applied to the MFPT bearing dataset for bearing fault diagnosis [4]. AR models have also been explored for spectral feature extraction [8,51,52]. In response to these challenges, statistical feature selection techniques have been employed to isolate the most discriminative indicators for classification. For example, independent t-tests have identified kurtosis, skewness, and maximum value as key features [7], while one-way ANOVA has been used to rank feature significance [8].
ML advancements have significantly improved fault classification performance. A variety of algorithms has been applied, including Support Vector Machines (SVM), Multilayer Neural Networks (MNN), Random Forest (RF) [7], and Least-Squares Support Vector Machine (LS-SVM) [4], as well as CubicSVM and WNN [8]. Building on these developments, deep learning (DL), particularly CNNs, has demonstrated strong potential in fault diagnosis. When the extracted features fail to capture fault-relevant patterns, DL models may misclassify subtle faults or background noise, compromising classification accuracy [40].
To address this, transfer learning (TL) using pre-trained CNNs has been widely adopted. Some studies fine-tune shallow layers while reusing deeper layers from large-scale datasets [14]. Notably, AlexNet [14,17] and ResNet [15,16] have shown strong performance in vibration-based diagnostics. AlexNet, due to its simplicity and lower computational cost, suits lightweight classification tasks [53], while ResNet, with its deeper architecture and residual connections, provides more powerful feature extraction but requires higher computational resources [54,55]. CNNs have been implemented in both 1D and 2D architectures, depending on the data representation. 1D CNNs are typically trained on raw vibration signals, whereas 2D CNNs are applied to signal encodings such as CWT images [10,11,12] or thermal images [1]. One notable 1D approach is the One-Dimensional Ternary Pattern (1D-TP) method, which extracts statistical features across time and frequency domains and achieves strong diagnostic performance when used with classifiers like RF, k-NN, SVM, BayesNet, and ANN [56].
Signal encoding techniques such as GAF, including GASF and GADF, and CWT have shown great potential for feature extraction. GAF has achieved high precision in fault classification [12] and has been found to be more discriminative than CWT in low signal-to-noise conditions [1]. Its effectiveness in bearing diagnostics has been validated [23], while CWT has been further improved through multiscale feature fusion and channel attention mechanisms [24]. Recent work has combined GASF with CWT for fault detection in wind turbine gearboxes [25], and in 2025, combining GASF and GADF as input images significantly improved diagnostic accuracy [26,30]. Nonetheless, GADF remains underutilized compared to more established methods like CWT—particularly in load-dependent subclassification—indicating potential for further exploration of 2D signal encoding for vibration signal analysis.
Hence, a key challenge in fault diagnosis is identifying which sensor signals or data modalities provide the most relevant information for accurate pattern recognition. In multi-sensor systems, suboptimal input selection can hinder classification performance. To address this, recent studies have focused on multi-sensor data fusion, which combines complementary information from different sources to improve diagnostic accuracy and reduce reliance on manual sensor selection [18]. Multi-domain fusion and advanced deep learning models have also been explored to further enhance accuracy [40]. Common fusion strategies include sensor-level [18,20,21], feature-level [1,9,22,26,57], and decision-level fusion [58,59,60]. These strategies reduce dependence on any single sensor or representation and provide a more comprehensive view of system health. Closely related to decision-level fusion is ensemble learning, which aggregates outputs from multiple classifiers to improve robustness, typically using the same input representation [61].
In 2025, a study further highlighted the importance of operating load in fault analysis by introducing a model bank-based approach in which independent classifiers are trained for each load condition, improving accuracy and efficiency compared with a single global model [7]. Despite such advances, most existing work still focuses on binary or generic multi-class classification and does not address load-dependent fault subclass separation, which is essential for practical fault classification.
To the best of the authors’ knowledge, no load-dependent fault classification framework that extracts features independently from multiple data representations within a single source has yet combined statistical, time–frequency, and 2D signal encodings within a unified decision-fusion architecture explicitly aligned with the CLAF approach for fault-severity classification under varying loads. Although GADF and GASF have shown strong potential, they remain underutilized in vibration-based diagnostic systems, and decision-fusion strategies that combine classical ML models with pre-trained CNNs, conditioned on load-dependent severity levels, are still underexplored in the current literature.
Several recent deep-learning and fusion-based diagnostic studies have been validated using a single well-characterized benchmark dataset or experimental platform (e.g., CWRU) to isolate methodological contributions under controlled conditions. This approach enables systematic evaluation of feature representations and fusion strategies before extending validation to cross-dataset or industrial scenarios. For example, a deep neural network-based multi-sensor fusion framework validated on the CWRU dataset demonstrated improved diagnostic performance through integrated feature fusion within the network architecture [62]. Similarly, a multi-sensor fusion and transfer-learning framework tested on a Spectra Quest Machinery Fault Simulator test rig achieved robust fault detection under varying operating conditions [63]. Another study proposed a multimodal 1D CNN approach validated using the Paderborn University (PU) Bearing Dataset [9].
Following this established research practice, the present study focuses on the methodological development and evaluation of a multimodal decision-fusion framework using the MFPT benchmark dataset to assess its effectiveness for CLAF-based fault-subclass classification. The study does not redefine fault categories but extends the previously published CLAF framework by integrating multimodal feature representations and decision-fusion classification. The MFPT dataset was acquired under controlled test-rig conditions with vibration signals recorded from a fixed sensor location, enabling consistent and systematic evaluation of diagnostic features across load and fault conditions.

3. Proposed Framework

This section outlines the systematic approach of the proposed Load-Dependent Multimodal Vibration Signal Enhancement and Fusion Framework (LD-MVSEFF) for Load-Specific Condition Monitoring, building upon the CLAF load-dependent subclasses introduced in [8]. The framework focuses on evaluating how multimodal signal representations and decision-fusion strategies enhance classification robustness across varying operating conditions within a structured benchmark dataset.
The proposed framework was applied to the MFPT bearing dataset, a controlled benchmark dataset widely used for evaluating vibration-based fault classification methods under defined operating conditions. The use of this dataset enables systematic assessment of the proposed multimodal decision-fusion framework across load-dependent fault subclasses. The objective of this study is to evaluate the effectiveness of multimodal representations and decision-fusion strategies for fault-severity classification within a structured experimental dataset.
The LD-MVSEFF integrates three complementary analysis channels derived from the same vibration signal source. Channel 1 extracts time- and frequency-domain (TFD) features, including spectral features obtained through autoregressive modelling. Channel 2 converts vibration signals into Continuous Wavelet Transform (CWT) images, while Channel 3 encodes the signals into two-dimensional Gramian Angular Difference Field (GADF) representations. These parallel channels provide diverse yet complementary representations of the same underlying vibration behavior.
All available load conditions in the dataset are incorporated jointly during training within each channel. Rather than forming separate models for individual load levels, the classifiers are trained using vibration signals representing the full range of operating loads contained in the dataset. This allows the framework to learn fault-severity characteristics reflected in vibration signatures across varying operating conditions and to perform classification directly from the measured signals without requiring explicit load input.
Following feature extraction, each channel is processed by its respective classification model. The resulting classification outputs are subsequently combined through a decision-level fusion module, which integrates the strengths of the individual representations to produce a unified classification outcome. This multimodal fusion strategy provides a holistic interpretation of vibration behavior and improves classification robustness, particularly for subtle fault-severity distinctions. The complete processing workflow of the proposed methodology was implemented in MATLAB R2023a. The following subsections describe the methodology and data processing steps in detail.

3.1. Methodology

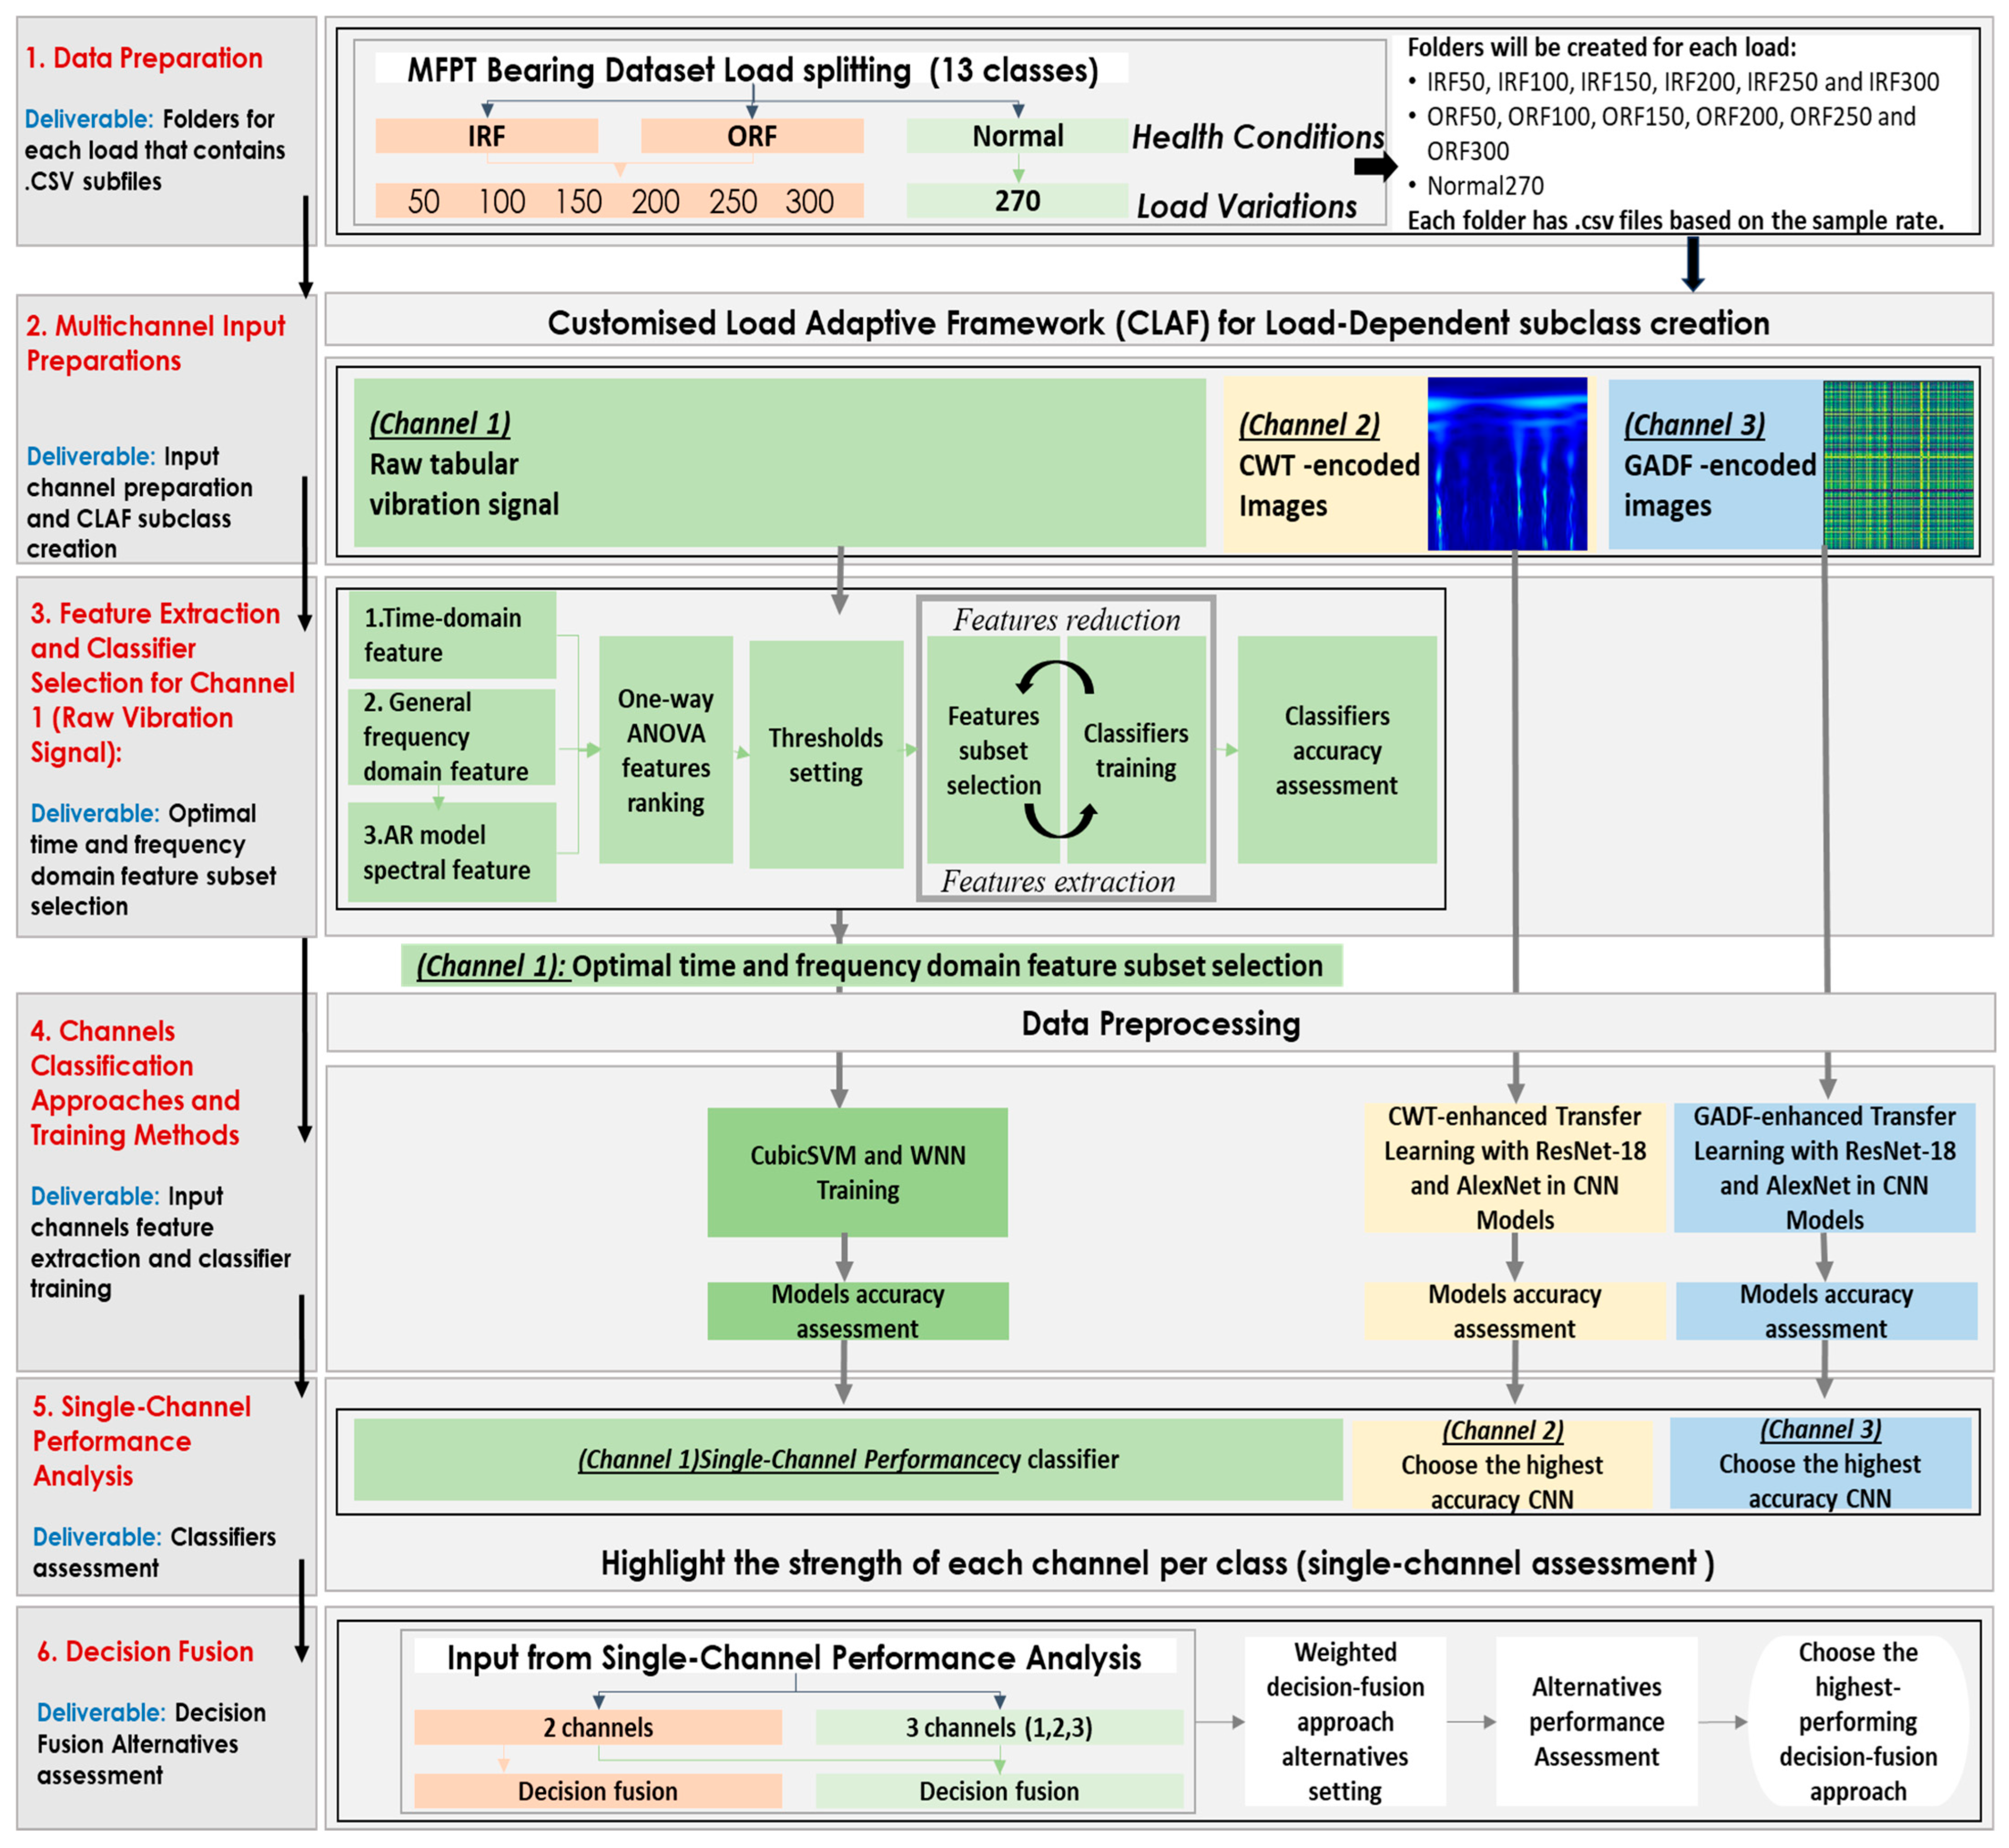
The proposed LD-MVSEFF incorporates multiple data channels and decision-fusion approaches, complemented by the CLAF for creating load-dependent fault subclasses. Various data sources are integrated, including GADF images, CWT images, and features from the time and frequency domains. These inputs enhance the efficacy of condition monitoring by leveraging complementary patterns across different modalities for improved fault classification. The outputs from multiple classifiers are consolidated using decision-fusion techniques, ensuring robust and accurate classification. The methodology includes six detailed steps, as presented in Figure 1.
  • Data Preprocessing with CLAF:
In this stage, the MFPT bearing vibration signals are segmented and prepared using the CLAF. The raw vibration data are first divided according to fault conditions—Normal (fault-free) or Healthy, Inner Race Fault (IRF), and Outer Race Fault (ORF)—and further organized based on load factors. This process enables the formation of load-dependent fault subclasses corresponding to different operating conditions. The structured segmentation ensures that the data are consistently prepared for subsequent feature extraction, graph construction, and classification.
2.
Multichannel Input Preparations:
In this stage, the first phase establishes three distinct data channels for comprehensive analysis. In Channel 1, raw vibration signals are processed. Channel 2 generates two-dimensional (2D) CWT images from these signals, and Channel 3 produces 2D encoded GADF images. After splitting, the raw vibration signals are encoded into equivalent image formats:
  • Channel 1: Raw vibration signal.
  • Channel 2: The class-specific raw vibration signals are encoded into CWT images using the Amor technique.
  • Channel 3: The class-specific raw vibration signals are encoded into 2D GADF images.
  • Applying the CLAF to create load-dependent fault subclasses— Normal (fault-free) or Healthy, Mild, Moderate, and Severe—tailored to specific datasets, forming the foundation for subsequent analysis.
3.
Feature Extraction and Classifier Selection for Channel 1 (Raw Vibration Signal):
For Channel 1, time- and frequency-domain (TFD) features, including spectral features derived from AR modelling, are extracted from the raw vibration signals. Feature relevance is assessed using one-way Analysis of Variance (ANOVA), and an optimal feature subset is selected. To address class imbalance, oversampling is applied to ensure that all fault subclasses contain an equal number of samples. The selected TFD features are then aligned with their corresponding CWT and GADF representations to maintain consistency across channels.
4.
Channel Classification Approaches and Training Methods:
Training and Selection of Classifiers for TFD features, including spectral features using Autoregression (Channel 1) and CNN Architectures for Channels 2 and 3 (CWT and GADF images):
  • For Channel 1 (TFD features, including spectral features using Autoregression), classifiers such as Cubic Support Vector Machine (CubicSVM) and Wide Neural Network (WNN) are trained on the extracted features. The best performing model is selected for further analysis.
  • For Channels 2 and 3 (CWT and GADF images), pre-trained Convolutional Neural Networks (CNNs), such as AlexNet and ResNet-18, originally trained on the ImageNet dataset, are fine-tuned on the 2D encoded images. The final fully connected layer of each network is replaced with a new layer containing four output neurons, where each neuron corresponds to one of the four CLAF load-dependent subclasses: Normal (fault-free) or Healthy, Mild, Moderate, and Severe. The images, including CWT spectrograms and 2D GADF-encoded images, are resized to match the input dimensions of the CNN architectures: 227 × 227 × 3 for AlexNet, and 224 × 224 × 3 for ResNet-18.
5.
Single-Channel Performance Analysis:
The classification performance of each channel is evaluated independently in terms of its ability to distinguish between CLAF load-dependent subclasses. For each channel, the classifier achieving the highest overall accuracy is selected for use in the subsequent fusion stage. This step provides insight into the strengths and limitations of individual signal representations.
6.
Weighted Decision Fusion:
In the final stage, decision-level fusion is applied to combine the outputs of the selected classifiers. Two weighting strategies are investigated: (a) adaptive weighting, where classifier weights are assigned based on class-specific performance; and (b) equal weighting, where all channels contribute equally. Both two-channel and three-channel fusion configurations are evaluated to identify the most effective combination for improving classification accuracy and robustness.

3.2. Dataset

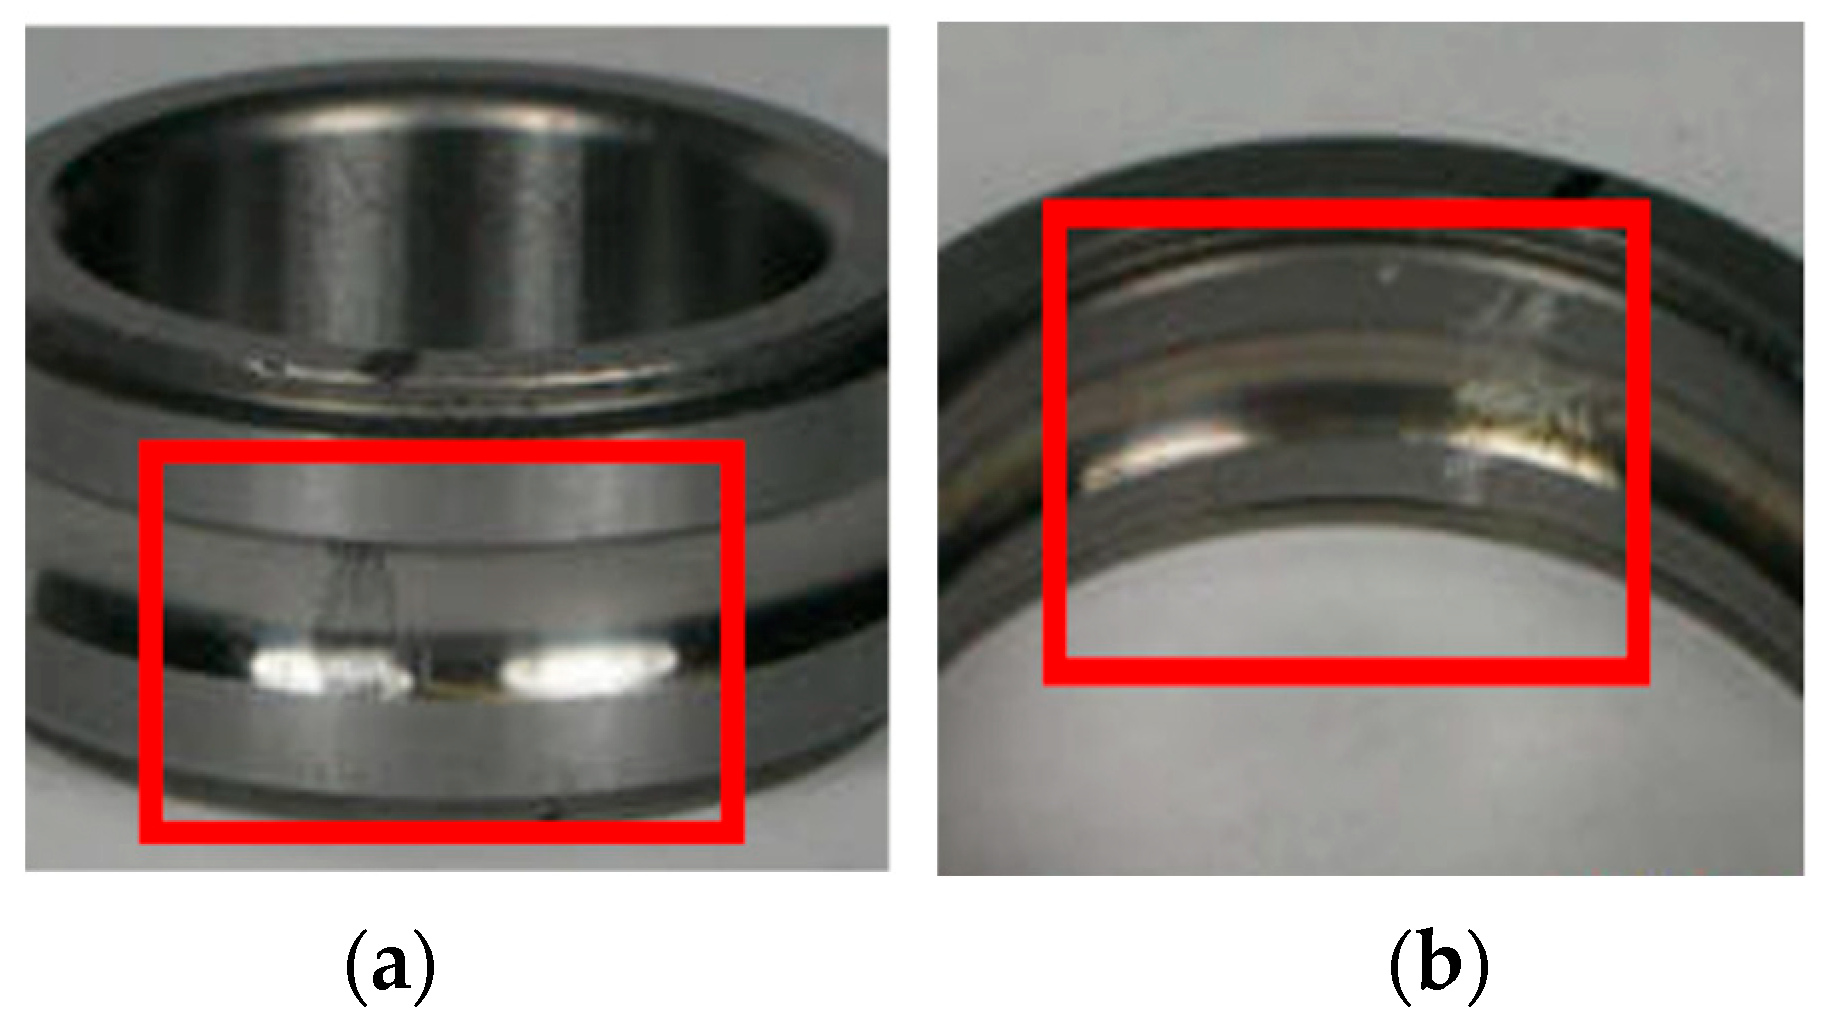
This study is divided into two phases, focusing on the radial impacts of loads under various operational conditions using the Machinery Fault Prevention Technology (MFPT) Bearings Dataset. The setup included a test rig with a NICE bearing featuring a roller diameter of 5.969 mm (0.235 inches), a pitch diameter of 31.623 mm (1.245 inches), and eight rolling elements at a contact angle of zero degrees. The dataset includes three operating conditions: Normal (fault-free) or Healthy data, Inner Race Defect (IRD) or Inner Race Fault (IRF), and Outer Race Defect (ORD) or Outer Race Fault (ORF). The faults are shown in Figure 2 [64,65].
The MFPT bearing dataset is obtained from a controlled bearing test rig rather than directly from an operating induction motor. All vibration signals were acquired from a single radial accelerometer mounted on the bearing housing at a fixed location, ensuring consistent measurement conditions across all recordings. Such benchmark datasets are commonly used to isolate the influence of radial load on vibration characteristics under controlled conditions before extending diagnostic insights to practical rotating machinery. It is widely recognized as a benchmark dataset for validating classification and condition monitoring algorithms and provides key operating information such as radial load levels, shaft speed, and vibration signal characteristics. All signals were acquired at a constant shaft speed of 1500 rpm (25 Hz) [46,47], allowing the present study to isolate the influence of load variation on vibration characteristics without introducing additional variability due to speed changes. Maintaining a constant rotational speed ensures that variations in vibration signatures are primarily influenced by load-induced changes in contact forces and fault-related modulation effects rather than speed-dependent frequency shifts.
In the Normal (fault-free) condition, vibration signals were recorded under a radial load of approximately 270 pounds, with a sampling frequency of 97,656 Hz and a signal duration of 6 s. For the faulty conditions, multiple signal records were acquired under varying radial load levels. The Inner Race Fault condition includes vibration signals collected under loads ranging from 0 to 300 pounds, sampled at 48,828 Hz for 3 s. Similarly, the Outer Race Fault condition comprises vibration signals recorded under radial loads ranging from 25 to 300 pounds, also sampled at 48,828 Hz for 3 s [64,66].
It should be noted that the MFPT bearing dataset provides vibration signals for faulty bearings under multiple load levels, whereas healthy bearing signals are available under only a single load condition. This reflects the structure of the publicly available dataset rather than an experimental design choice of the present study. The primary objective of this work is to analyze load-dependent variations in bearing fault signatures using load-dependent subclasses (Mild, Moderate, and Severe) defined through the previously proposed Customised Load Adaptive Framework (CLAF) [8], which was developed for load-dependent fault classification in the MFPT bearing dataset. While additional healthy data under varying loads would provide further insight into baseline load-induced variations, such data are not available within the current dataset. Accordingly, the reported results are interpreted within the scope of the data and operating conditions provided by the MFPT bearing dataset.

4. Results and Discussion

This section presents a comprehensive analysis and interpretation of the outcomes obtained from the experimental study. The focal point of the analysis revolves around the performance evaluation of various fusion techniques utilized for the classification of CLAF load-dependent subclasses. These techniques encompass diverse feature representations and models. The objective of this experimental analysis is to evaluate the effectiveness of the proposed multimodal decision-fusion classification framework in distinguishing CLAF on load-dependent subclasses (Normal (fault-free) or Healthy, Mild, Moderate, and Severe) using the MFPT bearing dataset. The analysis focuses on how different signal representations and fusion strategies influence classification robustness and accuracy within this structured evaluation setting. Steps 3 and 4 show the three approaches used in the single channel, starting with TFD extraction features on the original vibration signal, then with pre-trained CNNs (AlexNet and Residual Network-18 (ResNet-18)) on vibration signals encoded into two forms: CWT-encoded, and GADF-encoded images.

4.1. Data Preparation

This section describes the preprocessing applied to the MFPT bearing dataset and the procedure used to divide the data according to load factor (LF) conditions. This load-based structuring enables the application of the Customised Load Adaptive Framework (CLAF) to identify load-dependent vibration patterns that differ from conventional fault classification approaches for bearings in rotating machinery. The dataset was organized into six radial load conditions (50, 100, 150, 200, 250, and 300 lbs) in addition to a Normal (fault-free) baseline condition recorded at 270 lbs. These loads levels originate from a controlled experimental test rig used in the MFPT dataset, where radial load is deliberately varied to enable controlled evaluation of vibration-based fault classification approaches. Such variation does not necessarily represent typical operating conditions of rotating machinery bearings but provides a structured benchmark for algorithm development and validation. This resulted in 13 dataset categories, consisting of six load conditions for Inner Race Faults (IRFs) (Table 1), six load conditions for Outer Race Faults (ORFs) (Table 2), and one Normal baseline condition. The Normal baseline corresponds to the MFPT file baseline_2, recorded at a radial load of 270 lbs, with a sampling rate of 97,656 Hz and a signal duration of 6 s [8].
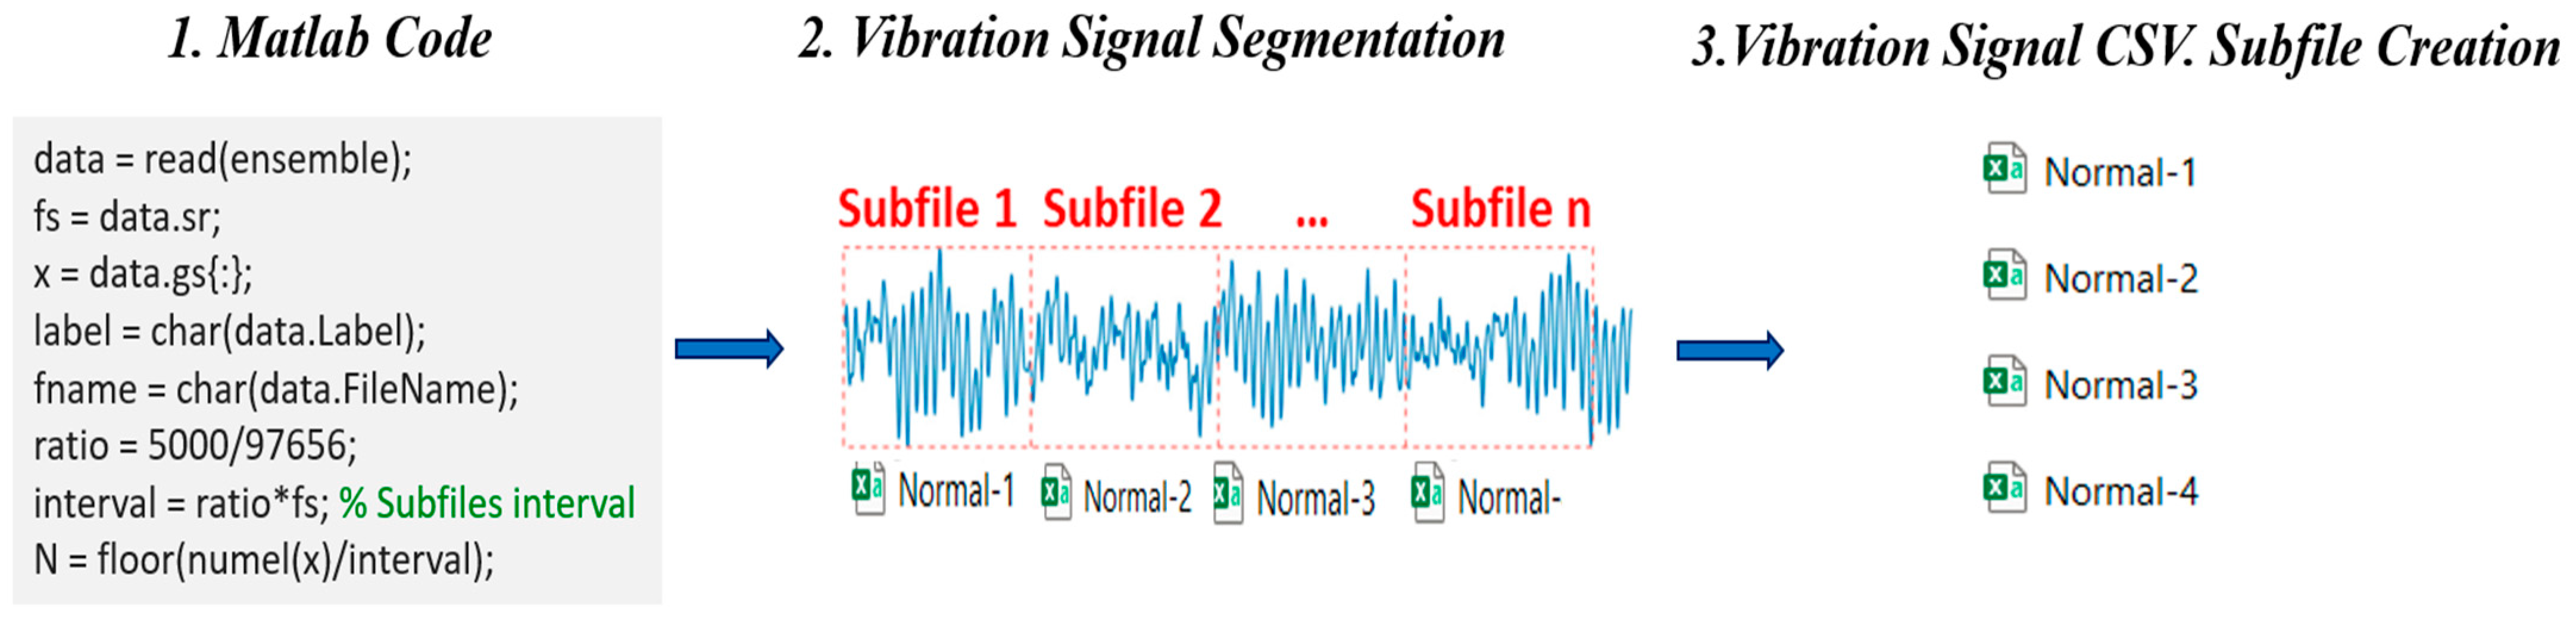
As illustrated in Figure 3, the segmentation process produced 117 subfiles for the Normal baseline condition and 58 subfiles for each fault dataset, resulting in a total of 813 subfiles. This segmentation step ensures sufficient sample size and consistent signal representation for the subsequent CLAF load-dependent subclass analysis.
The fault-severity categories used in this study do not correspond to predefined geometric defect sizes. This is because the publicly available MFPT dataset does not provide physical fault dimensions or photographic documentation of the bearing defects. Instead, fault-severity levels are derived from vibration signal characteristics using the CLAF framework, where severity is determined by the magnitude of deviation in wavelet energy relative to the Healthy baseline condition. Specifically, CLAF load-dependent subclasses were defined based on deviations in wavelet energy relative to the baseline condition, with ≤20% increase classified as Mild, 20–50% as Moderate, and >50% as Severe. This signal-based categorization enables consistent severity assessment across varying load conditions within the MFPT dataset [8].

4.2. Multichannel Input Preparations

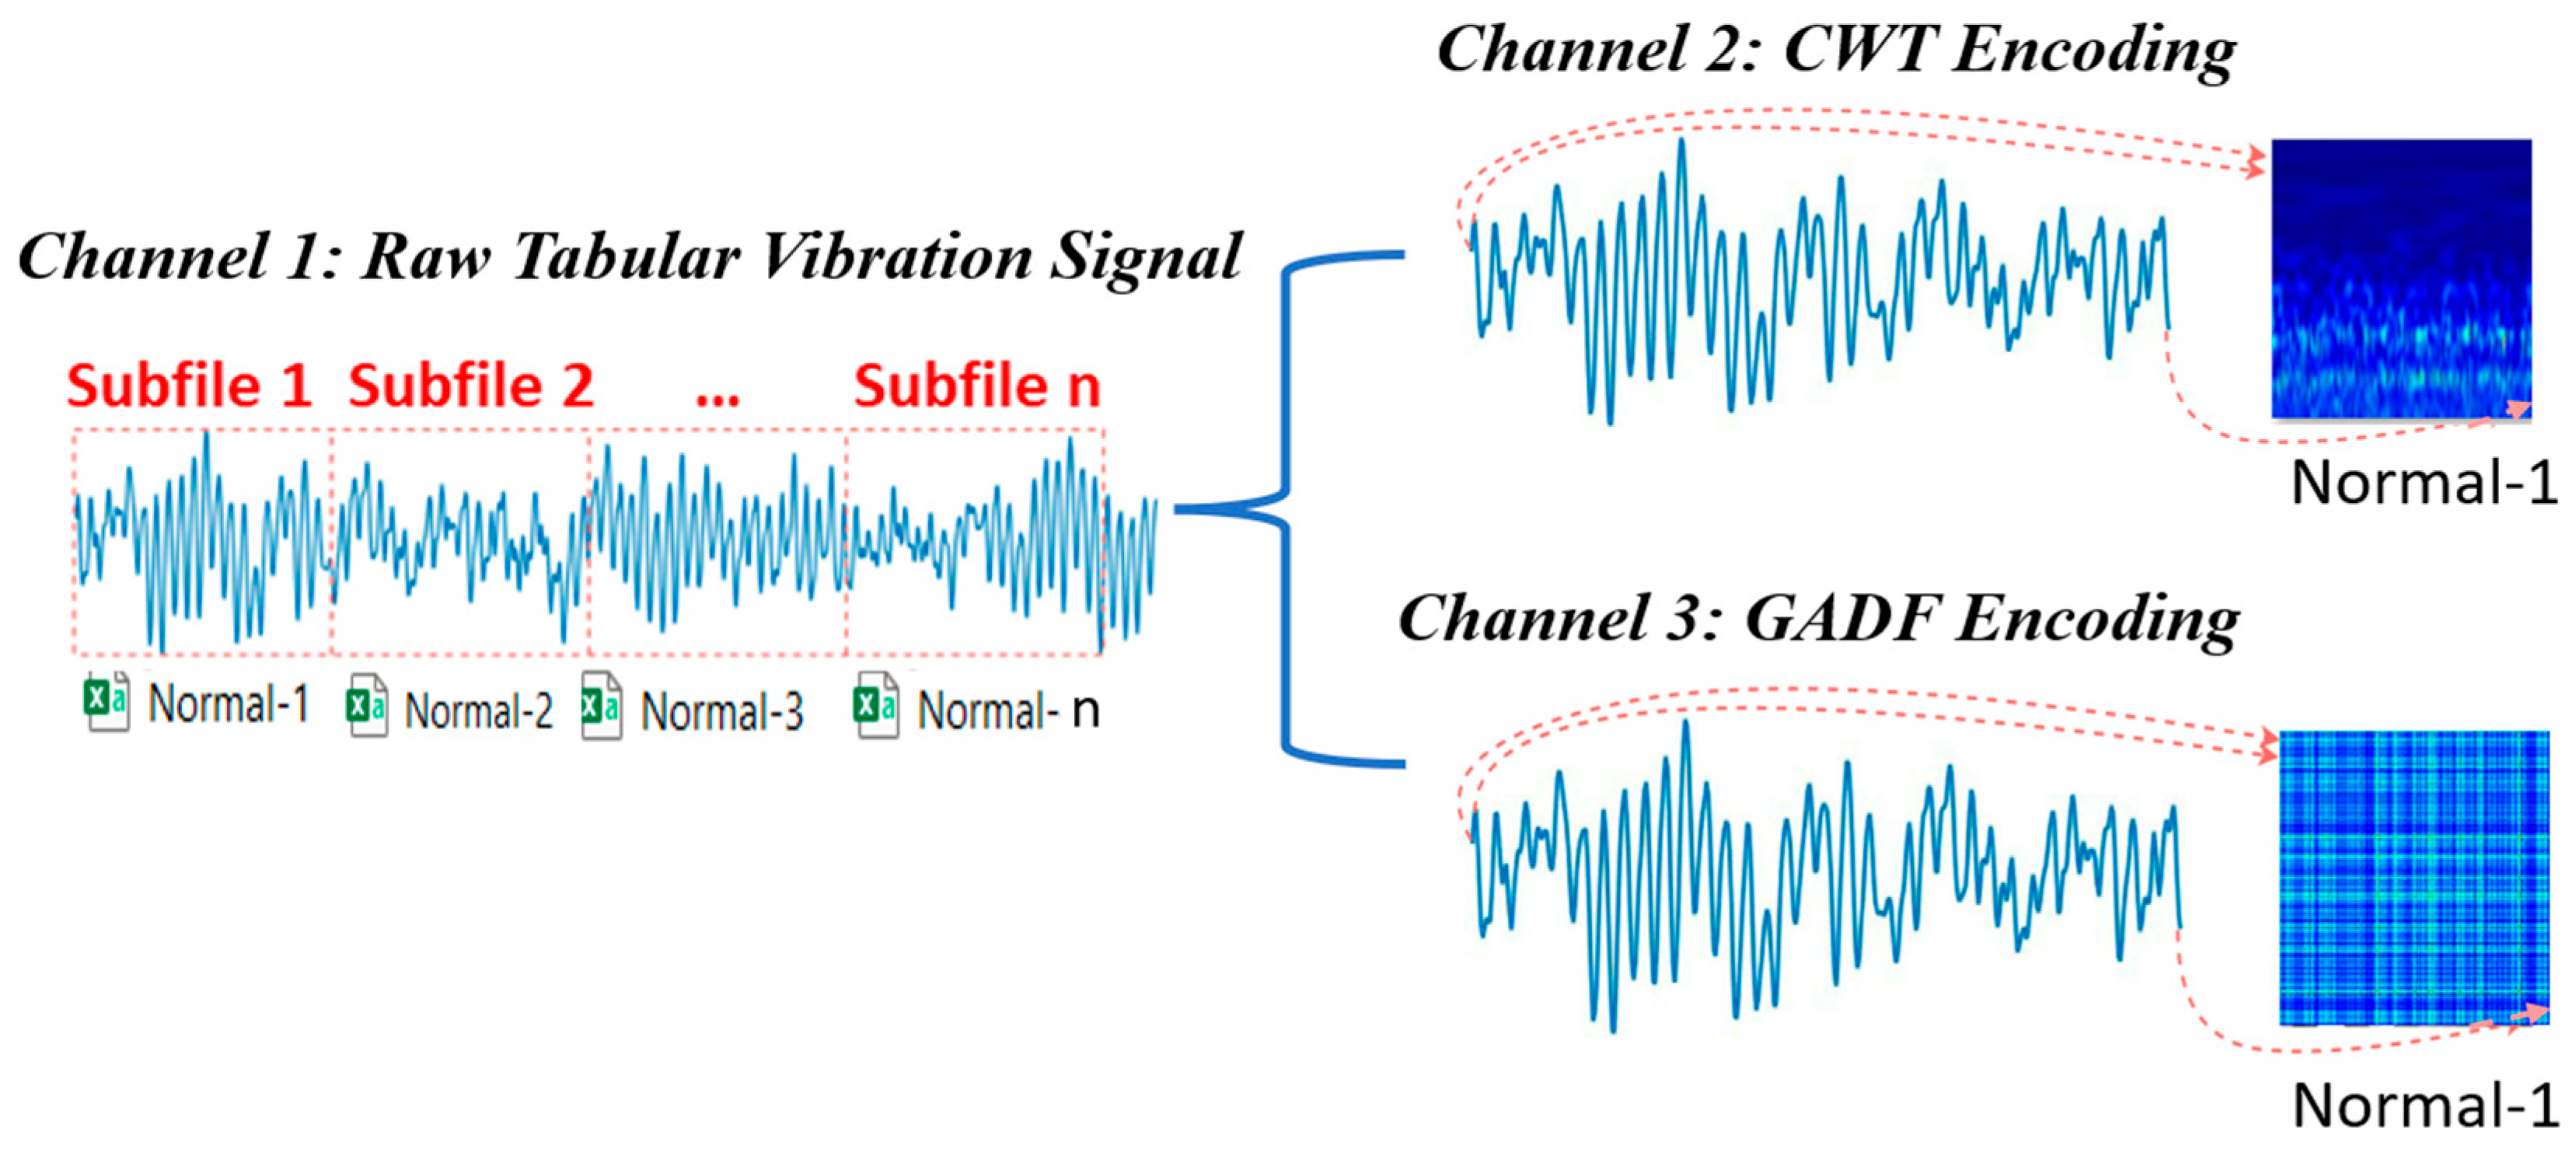
This section outlines the creation of three distinct data channels from the raw vibration signal for analysis. Channel 1 contains the raw segmented vibration signals, Channel 2 encodes the signals into CWT images, and Channel 3 encodes them into GADF images. The dataset was analyzed using the CLAF, focusing on load-dependent subclasses: Normal (fault-free) or Healthy, Mild, Moderate, and Severe.
To ensure consistency and fairness in classifier performance evaluation, the datasets for Channels 1, 2, and 3—derived from the same pool of 813 subfiles—were divided in a uniform manner. Table 3 shows the structure of the MATLAB datastore. In this datastore, the Index column, as shown in the image below, represents the unique subfolder name used to encode both the CWT images (stored in ImagePath_cwt) and the GADF images (stored in ImagePath_GADF). This ensures that the files corresponding to each load condition (e.g., IRF_50) are consistently linked across all three channels.
As shown in Table 4, this uniform approach is critical for a thorough and unbiased evaluation across all three channels. It ensures that the performance of the CNN models, which are trained on various types of encoded image data such as CWT and GADF in Channels 2 and 3, and tabular features extracted for each segment in Channel 1, is evaluated under similar conditions.

4.2.1. Channel 1: Raw Tabular Vibration Signal

For Channels 2 and 3, the dimensions of each encoded vibration image are set to 227 × 227 × 3 and 224 × 224 × 3, respectively. These size specifications align with the input requirements of the AlexNet and ResNet-18 architectures, respectively. Figure 4 visually displays the connection between each channel and outlines the process of creating each channel, starting with the raw vibration signal. For Channel 1, Time and Frequency Domain (TFD) features, including spectral features using Autoregression (AR), are extracted from the segmented vibration signal and used as the input in the proposed methodology. The extracted features are detailed in Section 4.3, as shown in Table 5.

4.2.2. Channel 2: Continuous Wavelet Transform

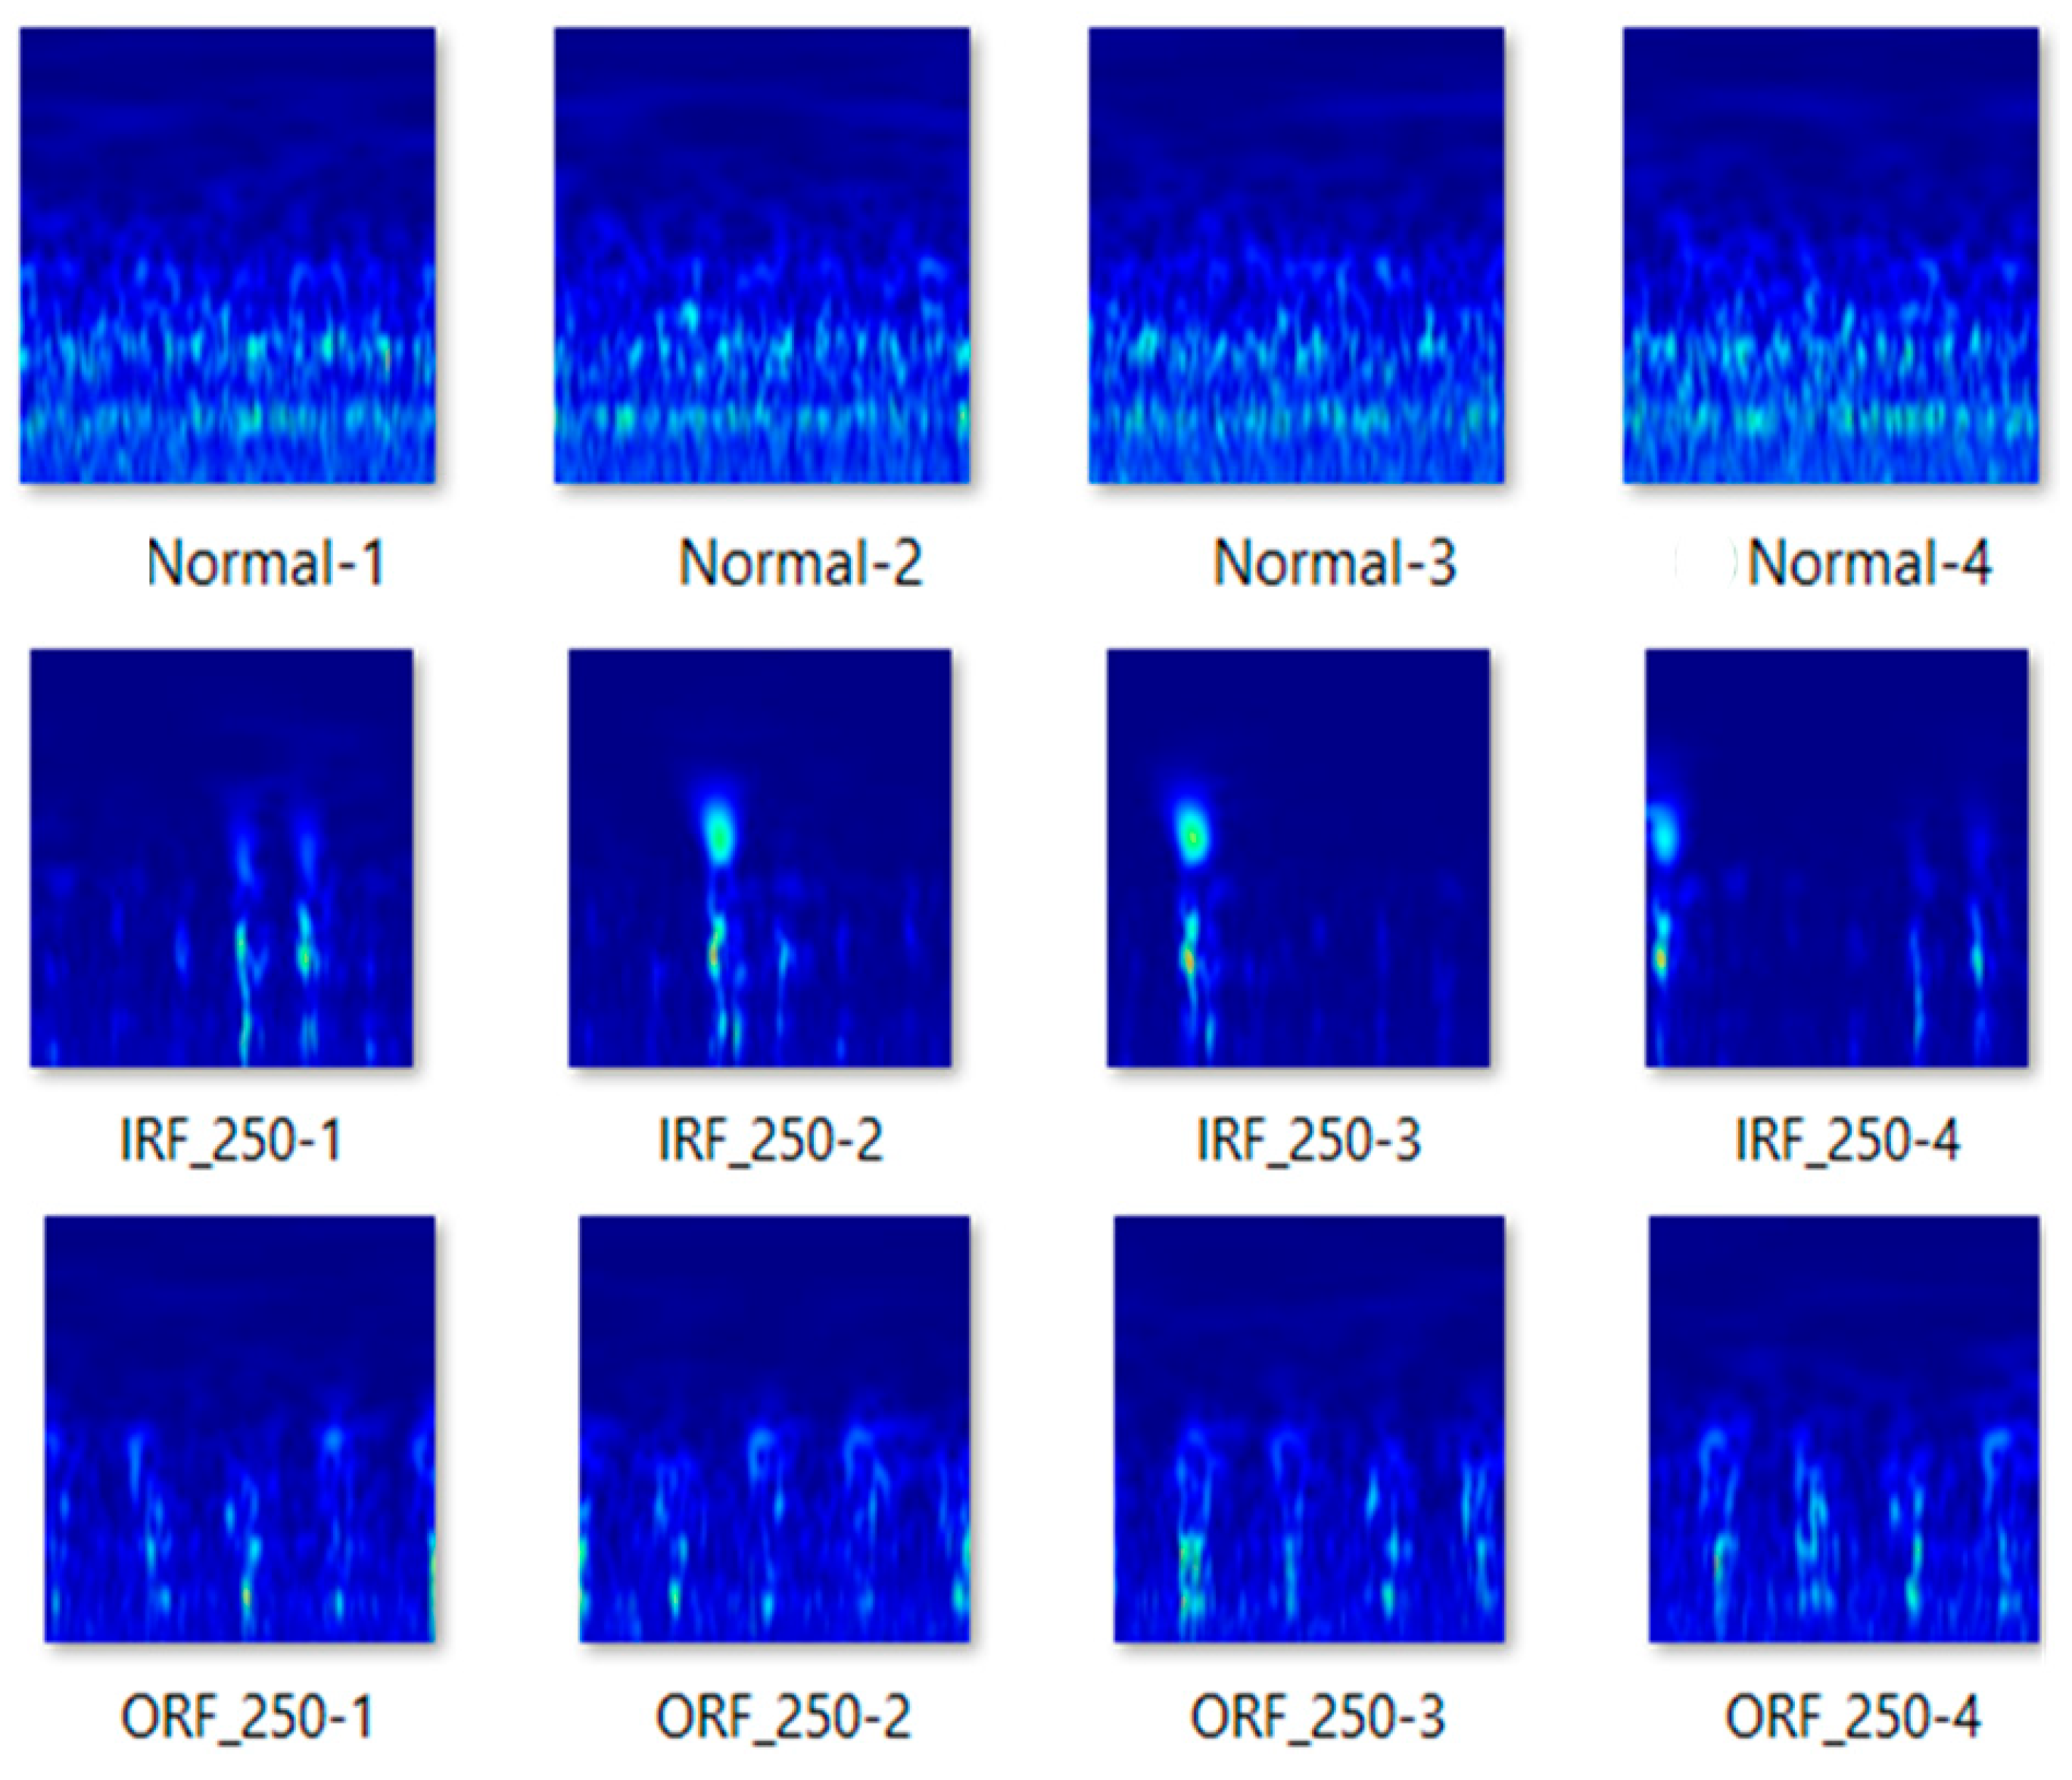
Converting vibration signals to scalogram images in MATLAB involves several systematic steps. The dataset comprises Normal (fault-free) or Healthy condition and IRF and ORF types and is first partitioned based on distinct LF conditions. Each signal subset is then processed through a Wavelet Transform (WT) using the CWT method with the ‘Amor’ wavelet. The transformed signals are converted into scalogram images by taking the absolute values of the CWT coefficients, flipping and scaling them. These images are then colour-mapped using the ‘jet’ colour map and resized to a uniform size of 224 × 224 pixels for consistency. Some generated sample images are shown in Figure 5. The Normal (healthy) condition exhibits smooth, uniformly distributed energy patterns, indicating stable behaviour without impulsive components. In contrast, IRF shows localized high-energy regions associated with fault-induced impulses, while ORF displays more distributed energy patterns, reflecting less localized fault characteristics.
Each processed signal subset and its corresponding scalogram image are saved as an image file and a CSV file, which are categorically organised in folders named after the ensemble types and indices. This meticulous process is repeated for each subset of the signal, ensuring that every part of the signal is represented as a distinct image. This approach visualises the time–frequency information of vibration signals and prepares the data for further analysis, such as fault detection or ML applications.

4.2.3. Channel 3: Gramian Angular Difference Field (GADF)

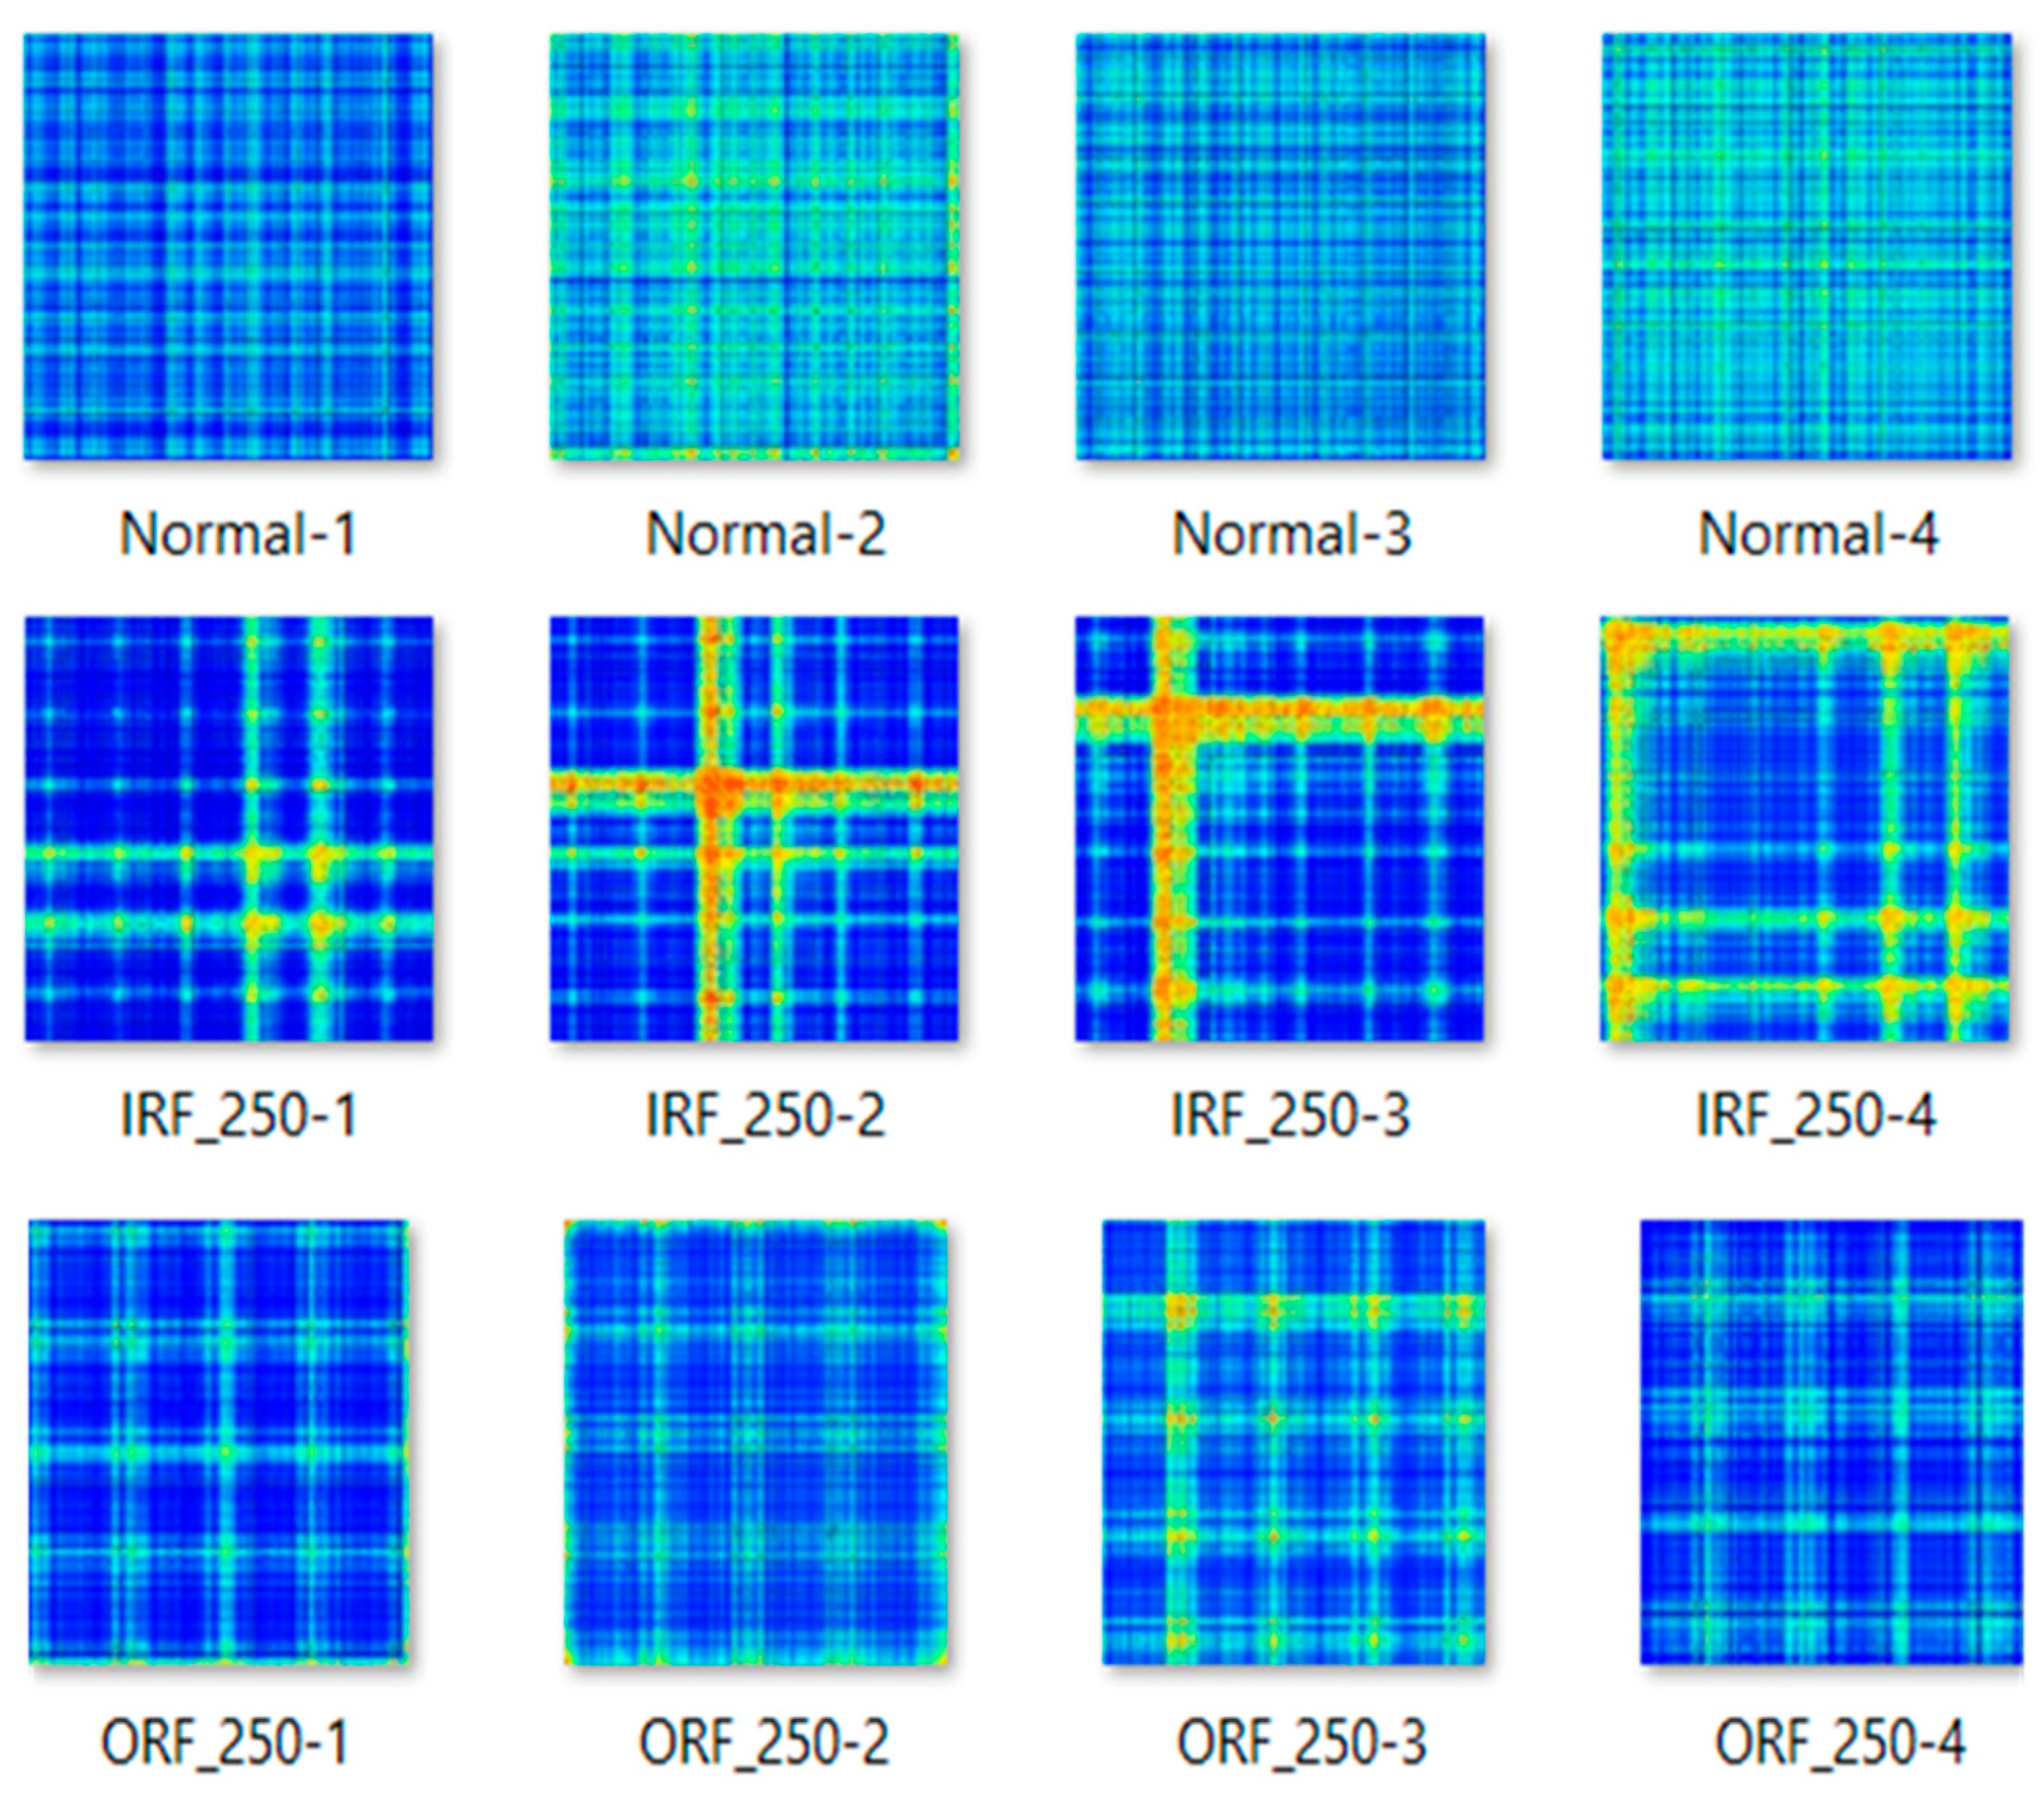
Creating GADF images from vibration signals involves several key steps. Initially, the time series signal is segmented into smaller subsets. For each subset, a Gramian matrix is computed using the GADF algorithm, which involves calculating the pairwise dot product of the signal and then manipulating the resulting sine and cosine matrices. The Gramian matrix is then transformed into a GADF image. This transformation includes scaling the matrix values to a range between 0 and 1, inverting this scaled matrix and resizing the image to a specified size. This process is iteratively applied to the entire signal, converting each segment into a GADF image representing the underlying time series data. This method offers an alternative way to analyse and interpret vibration signals, facilitating more profound insights into their characteristics. In the resulting images, the colour mapping reflects these relationships, where red indicates higher values and blue indicates lower values. GADF encoding produces distinct patterns for various health conditions, which need further analysis to validate their ability to differentiate between health conditions. As shown in Figure 6, the Normal condition shows uniform patterns, while IRF exhibits strong bright intersecting patterns due to impulsive faults. In contrast, ORF shows more spread and less concentrated patterns.

4.3. Feature Extraction and Classifier Selection for Channel 1 (Raw Vibration Signal)

This section conducts a one-way ANOVA test to rank the extracted general TFD features. Additionally, spectral features are extracted using an AR model of order 15 and a maximum of five peaks, creating 24 features. The AR model configuration used in this study follows the previously validated CLAF framework, where multiple AR orders were evaluated. The AR model of order 15 with five peaks demonstrated superior classification performance and richer spectral representation; therefore, it was adopted to ensure consistent and discriminative feature extraction [8]. In this channel, the objective was to identify a compact and informative subset of vibration features capable of achieving high classification performance while avoiding unnecessary feature redundancy. Choosing the most relevant features is essential to ensure the model effectively captures the critical information related to the fault. On the other hand, including irrelevant features can sometimes result in overfitting or decreased performance [67]. One-way ANOVA feature selection involves comparing the means of each feature across different target classes to determine if there is a statistically significant difference. Features are ranked based on their p-values from the ANOVA test; the lower the p-value, the more likely the feature is to be influential in distinguishing between classes. These p-values are often transformed into scores by taking the negative logarithm, with higher scores indicating more significant features for classification. In Table 3, the first column represents the extracted features, and the second column represents the one-way ANOVA scores, ranked from highest to lowest significance. Features that scored less than 26 (Peak frequency 4, Peak frequency 2, Peak frequency 5), and Total Harmonic Distortion (THD) were not included in the current study due to their low scores, which could lead to confused training.
A critical analysis of classifier performance, based on the top 20 feature sets ranked by the one-way ANOVA score, provides diverse insights, as presented in Table 5. Various classifiers, including Support Vector Machines (SVMs), neural networks (NN), and ensembles, were employed using MATLAB 2023a [68]. The efficacy of SVM hinges on how effectively the input data are represented in this new space, a determination often made through the utilisation of diverse kernels like linear, polynomial (including quadratic and cubic), Gaussian, and others [69]. The CubicSVM is a classifier that falls under the umbrella of supervised learning. SVMs are effective for high-dimensional data and are versatile in handling various structured datasets. Hence, they are widely used for classification and regression tasks [68].
The objective was to identify the classifier with the highest accuracy, making it a strong candidate for the proposed LD-MVSEFF load-dependent fault classification framework. The training dataset, comprising 813 subfolders, was divided as follows: 60% for training, 20% for validation, and 20% for testing. Five-fold cross-validation was implemented to ensure a robust performance assessment (see Table 6), divided by the load-dependent fault subclasses.
The Ensemble: Boosted Trees classifier recorded a notable 94.40% accuracy, demonstrating its ability to effectively harness a larger feature set. Reducing the feature set to the top 17 had a minimal effect on accuracy, which consistently remained above 90.00%, demonstrating the classifiers’ robustness and efficiency with a minor feature set. A further reduction in the feature set to the top ten, seven, and five revealed a nuanced interplay between feature count and accuracy. The WNN, using the top 10 features, outperformed its counterparts with a peak accuracy of 92.02%, suggesting its superior capability in working with a more compact yet pertinent feature set.
Classifier performance exhibited considerable variation in the Mild class as follows. The Ensemble: Boosted Trees classifier’s accuracy ranged from 89.20% with the top 17 features to 95.40% with the top 20 features. The CubicSVM classifier recorded the lowest accuracy in the Moderate class, scoring 85.70% and 91.40% with the top seven and five feature subsets, respectively. In contrast, WNN achieved 91.40% with the top 10 feature subset. Remarkably, the Normal (fault-free) or Healthy condition class maintained a stable 100% accuracy across all classifiers and feature subsets, underscoring the classifiers’ consistent ability to identify the Normal (fault-free) or Healthy condition accurately. This consistency indicates a shared strength among the classifiers. At the same time, the variability in the load-dependent fault subclasses (Mild and Moderate classes) underscores the critical importance of appropriate feature subset selection for optimal classifier performance.
In a direct comparison, the accuracy of the CubicSVM and the WNN was closely matched. However, the selection of the top 10 features by one-way ANOVA demonstrated a well-calibrated compromise between training feature quantity and test dataset accuracy. CubicSVM and WNN achieved 94.60% and 93.40% overall testing accuracies, respectively. Breaking this down further, CubicSVM recorded 92.50% in the Mild class, 85.70% in the Moderate class, and 100% in the Severe class. Meanwhile, WNN scored 90.3% in the Mild, 91.40% in the Moderate, and 91.70% in the Severe class. Notably, CubicSVM outperformed WNN in the Severe class by 8.30% and the Mild class by 2.20%. Conversely, WNN outperformed CubicSVM in the Moderate class by 5.70%. As a result, these two classifiers were selected as the top performers for Channel 1. CubicSVM is designated as Channel 1a, while WNN is designated as Channel 1b.

4.4. Channel Classification Approaches and Training Methods

The classification performance across the CLAF load-dependent subclasses (Normal (fault-free) or Healthy condition, Mild, Moderate, and Severe) was evaluated. The dataset was first balanced and then systematically partitioned into training (60%), validation (20%), and testing (20%) sets using a fixed random seed to ensure reproducibility. No subfile used in training or validation was included in the testing set. Since the dataset was generated by segmenting longer MFPT vibration recordings into multiple subfiles, the resulting partitions are independent at the subfile level within the benchmark dataset. All channels were derived from the same pool of vibration segments but maintained identical data partitions to ensure fair and consistent evaluation across representations.
All load conditions available in the MFPT bearing dataset were incorporated jointly during training within each channel. The CLAF structure was used only to organise the data into CLAF load-dependent subclasses, while the classifiers themselves were trained using vibration signals representing the full range of load conditions simultaneously.

4.4.1. Channel 1: CubicSVM and WNN

As shown in Table 7, CubicSVM achieved a higher overall accuracy (96.28%) than WNN (94.95%), while also requiring substantially less training time (26.71 s compared to 48.63 s). In addition, CubicSVM demonstrated improved performance in the Mild and Moderate fault subclasses, and was therefore selected for Channel 1.

4.4.2. Channels 2 and 3: Pre-Trained CNN Selection

For Channels 2 and 3, transfer learning was applied using pre-trained AlexNet and ResNet-18 architectures to classify vibration signals encoded as Continuous Wavelet Transform (CWT) and Gramian Angular Difference Field (GADF) images, respectively. Both networks were fine-tuned to classify the four CLAF load-dependent subclasses: Normal (fault-free) or Healthy condition, Mild, Moderate, and Severe. The comparative performance of the CNN models for both channels is summarised in Table 8.
For Channel 2 (CWT images), ResNet-18 achieved a slightly higher overall accuracy (98.94%) compared to AlexNet (98.40%); however, AlexNet required substantially less training time (7.20 min versus 17.35 min). Given the marginal accuracy difference and the significantly lower computational cost, AlexNet was selected for Channel 2.
For Channel 3 (GADF images), AlexNet outperformed ResNet-18 in overall test accuracy (98.67% versus 95.21%) and demonstrated improved class-wise performance, particularly in the Mild (96.81% versus 89.36%) and Moderate (97.87% versus 92.55%) subclasses. In addition, AlexNet reduced training time from 18.50 min to 7.53 min. Based on both accuracy and efficiency considerations, AlexNet was selected as the preferred model for Channel 3.

4.5. Single-Channel Performance Analysis

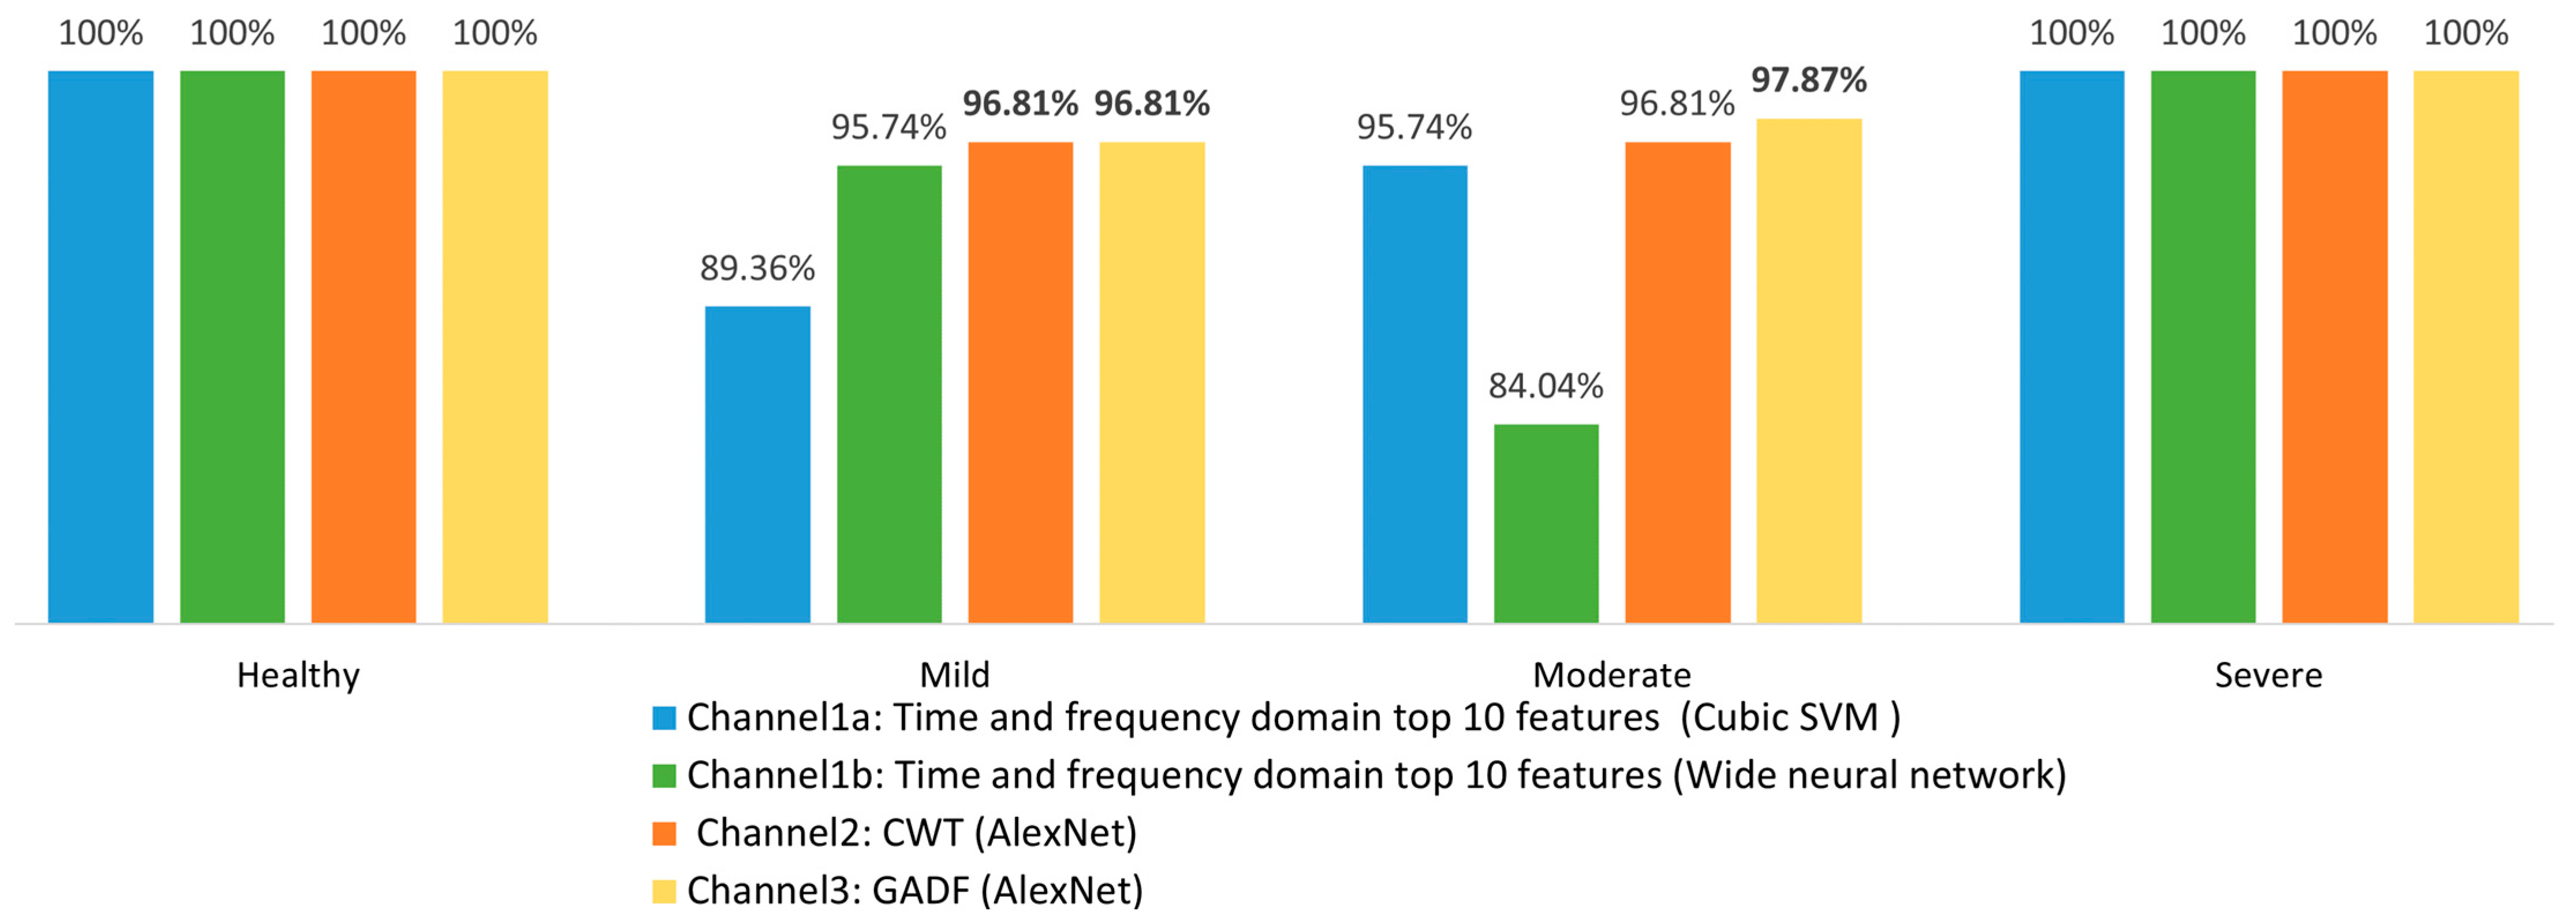
Figure 7 presents the load-dependent subclass accuracy assessment for each channel. All classifiers performed well for the Normal (fault-free) or Healthy and Severe condition classes, with each achieving 100% accuracy. This high performance, while expected for these extreme conditions where the patterns are more distinct and more straightforward to differentiate, could be attributed to the more apparent fault or non-fault signals in the data. The clear distinction between the Healthy and Severe conditions allowed the classifiers to identify them without error consistently.
In the Mild condition class, Channel 2, using CWT (AlexNet), showed the best performance with an accuracy of 96.81%, followed closely by Channel 3 (GADF with AlexNet) at 95.74%. However, Channels 1a and 1b, which utilize CubicSVM and WNN classifiers, struggled more in detecting Mild conditions, with accuracies of 89.36% and 84.04%, respectively. This suggests that the Mild class presents more challenges for accurate classification, likely due to the less distinct signal patterns associated with early or mild faults.
While performance remained strong for the Moderate condition class, there were noticeable differences between the channels. Channel 3 (GADF with AlexNet) showed the highest accuracy at 97.87%, followed by Channel 2 (CWT with AlexNet) at 96.81% and Channel 1b (WNN) at 95.74%. Channel 1a (CubicSVM) exhibited the lowest performance in this category, with an accuracy of 84.04%. This indicates that Moderate conditions are more difficult to classify than extremes as the signal patterns become less clear.

4.6. Decision Fusion

4.6.1. Weighted Decision-Fusion Approach (Alternatives Setting)

This section investigates two weighted decision-fusion schemes across three alternatives, each using a different combination of channels within the LD-MVSEFF. In all cases, the weights assigned to the channels for a given CLAF load-dependent subclass (Healthy, Mild, Moderate, Severe) sum to 1, ensuring a balanced contribution in the final decision.
Weighting System 1 (adaptive weighting) assigns channel weights according to the classification accuracy achieved for each fault subclass and load condition. Channels that perform better for a given subclass receive higher weights, allowing the fusion mechanism to emphasize the most reliable sources of information in a load- and severity-dependent manner. Weighting System 2 (equal weighting) assigns the same weight to all channels for all subclasses, providing a baseline in which no classifier dominates the decision process. The decision-fusion weights are guided by per-channel accuracy for each CLAF subclass, as shown in Figure 6. Here, TFDa denotes the CubicSVM classifier trained on the top 10 TFD features, and TFDb denotes WNN trained on the same feature set; the corresponding alternatives and weighting schemes are summarized in Table 9.
  • For Alternative 1, the fusion combines Channel 1b (TFD features with WNN) and Channel 2 (CWT-AlexNet). Under Weighting System 1, Channel 1b receives higher weights for the Healthy and Severe subclasses, where it achieves perfect accuracy, while Channel 2 is emphasized for Mild and Moderate subclasses, where it outperforms Channel 1b. Under Weighting System 2, both channels receive equal weights across all subclasses.
  • Alternative 2 fuses Channel 1a (TFD features with CubicSVM) with Channel 2 (CWT-AlexNet). In Weighting System 1, Channel 1a is favored for Healthy and Severe subclasses due to its perfect accuracy, whereas Channel 2 receives higher weights in Mild and Moderate subclasses, where it attains superior performance. Under Weighting System 2, both channels contribute equally for all subclasses.
  • Alternative 3 extends the fusion to three channels: Channel 1a (TFD-CubicSVM), Channel 2 (CWT-AlexNet), and Channel 3 (GADF–AlexNet). With Weighting System 1, Channel 1a is down-weighted for Mild and Moderate subclasses, where its accuracy is lower, while Channels 2 and 3 receive higher weights reflecting their stronger performance. For Healthy and Severe subclasses, all three channels achieve perfect accuracy and are therefore assigned equal weights. Under Weighting System 2, all three channels receive equal weights for every subclass.

4.6.2. Choosing the Highest Performing Weighted Decision-Fusion Approach

To ensure robustness and reproducibility, each fusion alternative (Alternatives 1–3) was evaluated over five repeated runs using different random seeds, with regenerated training, validation, and testing splits for each run. All reported results therefore correspond to mean test accuracy with the associated standard deviation.
Across all alternatives, classification performance was consistently high for the Normal (fault-free) or Healthy and Severe subclasses. However, differences were more pronounced for the Mild and Moderate subclasses, where fault signatures are less distinct. Among the evaluated configurations, Alternative 3.1, which corresponds to the three-channel fusion (TFDa-CWT-GADF) under Adaptive Weighting, delivered the most balanced and reliable performance. This configuration achieved an overall accuracy of 99.04% ± 0.22%, with strong subclass performance in the Mild (97.20% ± 1.75%) and Moderate (99.15% ± 0.89%) classes, while maintaining an average training time of 18 min 30 s. Table 10 summarises the overall test accuracy across the five runs for all decision-fusion alternatives.
Based on these results, Alternative 3.1 (TFDa-CWT-GADF) was selected as the final decision-fusion configuration and forms the basis of the proposed LD-MVSEFF. The comparison between single-channel and fusion results confirms the necessity of combining complementary feature representations. The use of multiple representations is not intended to increase the number of arbitrary features but to capture complementary signal characteristics from different domains of the same vibration signal. While individual channels achieved strong performance, their accuracy varied across CLAF subclasses, particularly for Mild and Moderate conditions. The fusion of TFD, CWT, and GADF channels consistently improved classification stability and overall accuracy, demonstrating that each channel contributes distinct diagnostic information. These findings verify that the performance gain of LD-MVSEFF is driven by the complementary strengths of the individual channels and the weighted decision-fusion strategy. These results confirm that combining complementary signal representations through decision-level fusion provides a more comprehensive representation of vibration behaviour, leading to improved classification consistency across fault-severity subclasses compared with single-channel approaches.

5. Conclusions

This paper introduces the novel Load-Dependent Multimodal Vibration Signal Enhancement and Fusion Framework (LD-MVSEFF), designed to learn fault patterns across varying load conditions rather than operate as load-specific models, using the MFPT bearing dataset. It should be noted that the proposed decision-fusion framework itself is not limited to the MFPT dataset. The framework leverages complementary information extracted from multiple representations of a single vibration signal for condition monitoring and fault classification. In this study, the MFPT dataset was used primarily for methodological evaluation within the predefined CLAF load-dependent subclasses introduced in earlier work. The purpose of the present study is to establish and validate a multimodal decision-fusion classification methodology within a controlled benchmark environment before extending the framework to cross-dataset and industrial validation scenarios. The use of a standardized benchmark dataset enables controlled and reproducible evaluation of multimodal fusion strategies before introducing additional variability such as industrial noise and environmental disturbances. It integrates three distinct channels for analysis: Channel 1 extracts TFD features, including spectral features, using autoregression; Channel 2 converts vibration signals into CWT images; and Channel 3 encodes the signals into GADF 2D images. These channels are designed to capture complementary information from different signal representations of the same vibration source rather than to increase the number of arbitrary features.
Each channel was trained over five separate runs, and the best performing classifiers were selected based on their accuracy in classifying four load-dependent fault subclasses: Healthy, Mild, Moderate, and Severe. In Channel 1, the CubicSVM and WNN classifiers achieved average accuracies of 96.43% ± 0.76% and 97.50% ± 1.60%, respectively. For Channels 2 and 3, pre-trained AlexNet and ResNet-18 models were used, with AlexNet performing the best, achieving accuracies of 97.76% ± 1.33% on Channel 2 (CWT images) and 95.95% ± 2.05% on Channel 3 (GADF images).
One of the main challenges observed was the classification of the Mild and Moderate fault subclasses, which presented subtler signal variations compared to the Healthy and Severe conditions. The proposed LD-MVSEFF addressed these challenges by employing a weighted decision-fusion approach, where decisions were tailored according to the strengths of each channel for specific fault subclasses. For instance, Channel 2 (CWT with AlexNet) performed well in classifying the Moderate class, while Channel 3 (GADF with AlexNet) showed high accuracy in both the Mild and Moderate conditions. By assigning dynamic weights to each classifier based on their strengths, the LD-MVSEFF improved the classification of these more challenging subclasses.
The proposed weighted decision-fusion approach demonstrated excellent performance across all fault conditions. Alternative 3.1 in Table 8 (TFDa-CWT-GADF) achieved the highest overall accuracy of 99.04% ± 0.22% across five runs, with an average training time of 18 min and 30 s. This approach minimized the limitations of individual classifiers and effectively handled load-specific fault classification. Although the training phase involves computational cost associated with feature extraction and model optimization, the inference stage consists primarily of forward evaluation of trained classifiers and weighted decision fusion, making it computationally lightweight and suitable for real-time or near-real-time condition-monitoring applications.
A limitation of this study is related to the structure of the MFPT bearing dataset used for evaluation. The dataset provides faulty bearing signals under multiple load conditions, whereas healthy bearing signals are available under only a single load level. In addition, the dataset used in this study was segmented into multiple subfiles derived from longer continuous vibration recordings. As a result, the dataset does not allow direct analysis of how load variations influence vibration responses in healthy bearings. Since many load-related effects described in Section 2.3 can influence both healthy and faulty bearing signals, the absence of multiple load levels for the healthy condition limits a comprehensive comparison of load-induced baseline variations. Consequently, the reported results should be interpreted within the scope of the available dataset. Future studies will consider additional bearing datasets and experimental measurements incorporating healthy bearings under varying operating loads, enabling a more comprehensive investigation of load-dependent vibration behavior and further strengthening the generalization of the proposed framework.
Furthermore, future work will explore advanced graph-based and deep-learning feature representations to further enhance fault discrimination under varying operating conditions. Future investigations will also evaluate the robustness of the proposed framework under realistic industrial environments, including the presence of noise measurement and environmental interference in vibration signals. The present study focuses on methodological validation within a controlled benchmark setting. Future studies will further evaluate the proposed framework across additional datasets and industrial environments to assess its robustness and generalization capability. A detailed real-time latency analysis and embedded implementation evaluation will be considered in future work to assess deployment feasibility in online condition-monitoring systems. In addition, the proposed multimodal decision-fusion framework will be evaluated using additional bearing datasets and rotating machinery operating under real industrial environments. This includes assessing robustness across different fault geometries, machine configurations, and broader operating scenarios. Such investigations will provide further validation of the general applicability of the proposed methodology and support its transition from controlled benchmark evaluation toward practical condition-monitoring applications.

Author Contributions

Conceptualisation, S.Z.H. and M.P.; methodology, S.Z.H. and M.P.; software, S.Z.H.; validation, S.Z.H. and M.P.; formal analysis, S.Z.H. and M.P.; investigation, M.P.; resources, S.Z.H.; data curation, S.Z.H.; writing—original draft preparation, S.Z.H.; writing—review and editing, S.Z.H. and M.P.; visualisation, S.Z.H.; supervision, M.P.; project administration, S.Z.H. and M.P.; funding acquisition, S.Z.H. All authors have read and agreed to the published version of the manuscript.

Funding

This research received no external funding.

Institutional Review Board Statement

Not applicable.

Informed Consent Statement

Not applicable.

Data Availability Statement

The bearing vibration data used in this study originate from the bearing fault dataset provided by Data-Acoustics LLC (Eric Bechhoefer), commonly referred to in the literature as the MFPT bearing dataset. The dataset is publicly documented and available through the MathWorks repository: https://github.com/mathworks/RollingElementBearingFaultDiagnosis-Data (accessed on 30 January 2026) [47].

Acknowledgments

Special thanks to the Society for Machinery Failure Prevention Technology for providing the publicly available dataset used in this study.

Conflicts of Interest

The authors declare no conflicts of interest.

References

  1. Hejazi, S.; Packianather, M.; Liu, Y. Novel Preprocessing of Multimodal Condition Monitoring Data for Classifying Induction Motor Faults Using Deep Learning Methods. In Proceedings of the 2022 IEEE 2nd International Symposium on Sustainable Energy, Signal Processing and Cyber Security (iSSSC), Gunupur, India, 15–17 December 2022; IEEE: New York, NY, USA, 2022; pp. 1–6. [Google Scholar]
  2. Hejazi, S.; Packianather, M.; Liu, Y. A Novel Approach Using WGAN-GP and Conditional WGAN-GP for Generating Artificial Thermal Images of Induction Motor Faults. Procedia Comput. Sci. 2023, 225, 3681–3691. [Google Scholar] [CrossRef] [Scilit]
  3. Hamani, K.; Kuchar, M.; Kubatko, M.; Kirschner, S. Advancements in Induction Motor Fault Diagnosis and Condition Monitoring: A Comprehensive Review. Sensors 2025, 25, 5942. [Google Scholar] [CrossRef] [Scilit]
  4. Lai, L.; Xu, W.; Song, Z. A Novel Fault Diagnosis Method for Rolling Bearings Based on Spectral Kurtosis and LS-SVM. Electronics 2025, 14, 2790. [Google Scholar] [CrossRef] [Scilit]
  5. Jang, J.G.; Noh, C.M.; Kim, S.S.; Shin, S.C.; Lee, S.S.; Lee, J.C. Vibration Data Feature Extraction and Deep Learning-Based Preprocessing Method for Highly Accurate Motor Fault Diagnosis. J. Comput. Des. Eng. 2023, 10, 204–220. [Google Scholar] [CrossRef] [Scilit]
  6. Xie, F.; Li, G.; Fan, Q.; Xiao, Q.; Zhou, S. Optimizing and Analyzing Performance of Motor Fault Diagnosis Algorithms for Autonomous Vehicles via Cross-Domain Data Fusion. Processes 2023, 11, 2862. [Google Scholar] [CrossRef] [Scilit]
  7. Lee, H.G.; Yoo, S.M.; Hao, W.K.; Lee, I.S. Time-Domain and Neural Network-Based Diagnosis of Bearing Faults in Induction Motors Under Variable Loads. Machines 2025, 13, 1055. [Google Scholar] [CrossRef] [Scilit]
  8. Hejazi, S.Z.; Packianather, M.; Liu, Y. A Novel Customised Load Adaptive Framework for Induction Motor Fault Classification Utilising MFPT Bearing Dataset. Machines 2024, 12, 44. [Google Scholar] [CrossRef] [Scilit]
  9. Alam, T.E.; Ahsan, M.M.; Raman, S. Multimodal Bearing Fault Classification under Variable Conditions: A 1D CNN with Transfer Learning. Mach. Learn. Appl. 2025, 21, 100682. [Google Scholar] [CrossRef] [Scilit]
  10. Nishat Toma, R.; Kim, C.-H.; Kim, J.-M. Bearing Fault Classification Using Ensemble Empirical Mode Decomposition and Convolutional Neural Network. Electronics 2021, 10, 1248. [Google Scholar] [CrossRef] [Scilit]
  11. Kaji, M.; Parvizian, J.; van de Venn, H.W. Constructing a Reliable Health Indicator for Bearings Using Convolutional Autoencoder and Continuous Wavelet Transform. Appl. Sci. 2020, 10, 8948. [Google Scholar] [CrossRef] [Scilit]
  12. Zhang, J.; Kong, X.; Cheng, L.; Qi, H.; Yu, M. Intelligent fault diagnosis of rolling bearings based on continuous wavelet transform-multiscale feature fusion and improved channel attention mechanism. Eksploat. I Niezawodn. Maint. Reliab. 2023, 25, 163. [Google Scholar] [CrossRef] [Scilit]
  13. Zhong, H.; Lv, Y.; Yuan, R.; Yang, D. Bearing Fault Diagnosis Using Transfer Learning and Self-Attention Ensemble Lightweight Convolutional Neural Network. Neurocomputing 2022, 501, 765–777. [Google Scholar] [CrossRef] [Scilit]
  14. Asutkar, S.; Tallur, S. Deep Transfer Learning Strategy for Efficient Domain Generalisation in Machine Fault Diagnosis. Sci. Rep. 2023, 13, 6607. [Google Scholar] [CrossRef] [Scilit]
  15. Wu, G.; Ji, X.; Yang, G.; Jia, Y.; Cao, C. Signal-to-Image: Rolling Bearing Fault Diagnosis Using ResNet Family Deep-Learning Models. Processes 2023, 11, 1527. [Google Scholar] [CrossRef] [Scilit]
  16. Chang, M.; Yao, D.; Yang, J. Intelligent Fault Diagnosis of Rolling Bearings Using Efficient and Lightweight ResNet Networks Based on an Attention Mechanism. IEEE Sens. J. 2023, 23, 9136–9145. [Google Scholar] [CrossRef] [Scilit]
  17. Lu, T.; Yu, F.; Han, B.; Wang, J. A Generic Intelligent Bearing Fault Diagnosis System Using Convolutional Neural Networks with Transfer Learning. IEEE Access 2020, 8, 164807–164814. [Google Scholar] [CrossRef] [Scilit]
  18. Cinar, E. A Sensor Fusion Method Using Deep Transfer Learning for Fault Detection in Equipment Condition Monitoring. In Proceedings of the 2022 International Conference on INnovations in Intelligent SysTems and Applications (INISTA), Biarritz, France, 8–12 August 2022; IEEE: New York, NY, USA, 2022; pp. 1–6. [Google Scholar]
  19. Cui, D.; Zhang, T.; Zhang, M.; Liu, X. Feature Extraction and Severity Identification for Autonomous Underwater Vehicle with Weak Thruster Fault. J. Mar. Sci. Technol. 2022, 27, 1105–1115. [Google Scholar] [CrossRef] [Scilit]
  20. Kullu, O.; Cinar, E. A Deep-Learning-Based Multi-Modal Sensor Fusion Approach for Detection of Equipment Faults. Machines 2022, 10, 1105. [Google Scholar] [CrossRef] [Scilit]
  21. Pan, Z.; Zhang, Z.; Meng, Z.; Wang, Y. A Novel Fault Classification Feature Extraction Method for Rolling Bearing Based on Multi-Sensor Fusion Technology and EB-1D-TP Encoding Algorithm. ISA Trans. 2023, 142, 427–444. [Google Scholar] [CrossRef] [Scilit]
  22. Ye, Z.; Yu, J. Multi-Level Features Fusion Network-Based Feature Learning for Machinery Fault Diagnosis. Appl. Soft Comput. 2022, 122, 108900. [Google Scholar] [CrossRef] [Scilit]
  23. Toma, R.N.; Piltan, F.; Im, K.; Shon, D.; Yoon, T.H.; Yoo, D.; Kim, J. A Bearing Fault Classification Framework Based on Image Encoding Techniques and a Convolutional Neural Network under Different Operating Conditions. Sensors 2022, 22, 4881. [Google Scholar] [CrossRef] [Scilit]
  24. Xiao, R.; Zhang, Z.; Wu, Y.; Jiang, P.; Deng, J. Multi-Scale Information Fusion Model for Feature Extraction of Converter Transformer Vibration Signal. Measurement 2021, 180, 109555. [Google Scholar] [CrossRef] [Scilit]
  25. Yang, Q.; Tang, B.; Shen, Y.; Li, Q. Self-Attention Parallel Fusion Network for Wind Turbine Gearboxes Fault Diagnosis. IEEE Sens. J. 2023, 23, 23210–23220. [Google Scholar] [CrossRef] [Scilit]
  26. Guo, Q.; Yao, H.; Xu, Y.; Lu, B.; Ma, Z.; Huang, Y.; Shi, M. Transformer Fault Diagnosis Method Based on Gramian Angular Field and Optimized Parallel ShuffleNetV2. Sci. Rep. 2025, 15, 23829. [Google Scholar] [CrossRef] [Scilit]
  27. Narayan, Y. Hb VsEMG Signal Classification with Time Domain and Frequency Domain Features Using LDA and ANN Classifier Materials Today: Proceedings Hb VsEMG Signal Classification with Time Domain and Frequency Domain Features Using LDA and ANN Classifier. Mater. Today Proc. 2021, 37, 3226–3230. [Google Scholar] [CrossRef] [Scilit]
  28. Liu, M.K.; Weng, P.Y. Fault Diagnosis of Ball Bearing Elements: A Generic Procedure Based on Time-Frequency Analysis. Meas. Sci. Rev. 2019, 19, 185–194. [Google Scholar] [CrossRef] [Scilit]
  29. Jain, P.H.; Bhosle, S.P. Study of Effects of Radial Load on Vibration of Bearing Using Time-Domain Statistical Parameters. IOP Conf. Ser. Mater. Sci. Eng. 2021, 1070, 012130. [Google Scholar] [CrossRef] [Scilit]
  30. Pinedo-Sánchez, L.A.; Mercado-Ravell, D.A.; Carballo-Monsivais, C.A. Vibration Analysis in Bearings for Failure Prevention Using CNN. J. Braz. Soc. Mech. Sci. Eng. 2020, 42, 628. [Google Scholar] [CrossRef] [Scilit]
  31. Ahmed, H.; Nandi, A.K. Compressive Sampling and Feature Ranking Framework for Bearing Fault Classification with Vibration Signals. IEEE Access 2018, 6, 44731–44746. [Google Scholar] [CrossRef] [Scilit]
  32. Shi, Z.; Li, Y.; Liu, S. A Review of Fault Diagnosis Methods for Rotating Machinery. In Proceedings of the 2020 IEEE 16th International Conference on Control & Automation (ICCA), Singapore, 9–11 October 2020; IEEE: New York, NY, USA, 2020; pp. 1618–1623. [Google Scholar]
  33. Granados-Lieberman, D.; Huerta-Rosales, J.R.; Gonzalez-Cordoba, J.L.; Amezquita-Sanchez, J.P.; Valtierra-Rodriguez, M.; Camarena-Martinez, D. Time-Frequency Analysis and Neural Networks for Detecting Short-Circuited Turns in Transformers in Both Transient and Steady-State Regimes Using Vibration Signals. Appl. Sci. 2023, 13, 12218. [Google Scholar] [CrossRef] [Scilit]
  34. Tian, B.; Fan, X.; Xu, Z.; Wang, Z.; Du, H. Finite Element Simulation on Transformer Vibration Characteristics under Typical Mechanical Faults. In Proceedings of the 9th International Conference on Power Electronics Systems and Applications, (PESA 2022), Hong Kong, China, 20–22 September 2022; IEEE: New York, NY, USA, 2022; pp. 1–4. [Google Scholar]
  35. Kumar, V.; Mukherjee, S.; Verma, A.K.; Sarangi, S. An AI-Based Nonparametric Filter Approach for Gearbox Fault Diagnosis. IEEE Trans. Instrum. Meas. 2022, 71, 351661. [Google Scholar] [CrossRef] [Scilit]
  36. Hu, L.; Zhang, Z. EEG Signal Processing and Feature Extraction; Hu, L., Zhang, Z., Eds.; Springer: Singapore, 2019. [Google Scholar]
  37. Metwally, M.; Hassan, M.M.; Hassaan, G. Diagnosis of Rotating Machines Faults Using Artificial Intelligence Based on Preprocessing for Input Data. In Proceedings of the 26th IEEE Conference of Open Innovations Association FRUCT (FRUCT26), Yaroslavl, Russia, 23–25 April 2020. [Google Scholar]
  38. Djemili, I.; Medoued, A.; Soufi, Y. A Wind Turbine Bearing Fault Detection Method Based on Improved CEEMDAN and AR-MEDA. J. Vib. Eng. Technol. 2023, 12, 4225–4246. [Google Scholar] [CrossRef] [Scilit]
  39. Wang, Z.; Oates, T. Imaging Time-Series to Improve Classification and Imputation. In Proceedings of the Twenty-Fourth International Joint Conference on Artificial Intelligence (IJCAI 2015), Buenos Aires, Argentina, 25–31 July 2015; pp. 3939–3945. [Google Scholar]
  40. Cui, J.; Zhong, Q.; Zheng, S.; Peng, L.; Wen, J. A Lightweight Model for Bearing Fault Diagnosis Based on Gramian Angular Field and Coordinate Attention. Machines 2022, 10, 282. [Google Scholar] [CrossRef] [Scilit]
  41. Łuczak, D. Machine Fault Diagnosis through Vibration Analysis: Continuous Wavelet Transform with Complex Morlet Wavelet and Time–Frequency RGB Image Recognition via Convolutional Neural Network. Electronics 2024, 13, 452. [Google Scholar] [CrossRef] [Scilit]
  42. Wu, G.; Yan, T.; Yang, G.; Chai, H.; Cao, C. A Review on Rolling Bearing Fault Signal Detection Methods Based on Different Sensors. Sensors 2022, 22, 8330. [Google Scholar] [CrossRef] [Scilit]
  43. Luo, Y.; Tu, W.; Fan, C.; Zhang, L.; Zhang, Y.; Yu, W. A Study on the Modeling Method of Cage Slip and Its Effects on the Vibration Response of Rolling-Element Bearing. Energies 2022, 15, 2396. [Google Scholar] [CrossRef] [Scilit]
  44. Qin, B.; Luo, Q.; Zhang, J.; Li, Z.; Qin, Y. Fault Frequency Identification of Rolling Bearing Using Reinforced Ensemble Local Mean Decomposition. J. Control. Sci. Eng. 2021, 2021, 2744193. [Google Scholar] [CrossRef] [Scilit]
  45. Liu, Y.; Zhang, H.; Hu, P.; Wang, Y.; Shi, Y. Research on the Vibration Characteristics of the Ball Bearing Considering the Uncertain Bearing-Shaft Interference Fit. Proc. Inst. Mech. Eng. C J. Mech. Eng. Sci. 2024, 238, 48–63. [Google Scholar] [CrossRef] [Scilit]
  46. Chen, Z.; Xia, J.; Li, J.; Chen, J.; Huang, R.; Jin, G.; Li, W. Generalized Open-Set Domain Adaptation in Mechanical Fault Diagnosis Using Multiple Metric Weighting Learning Network. Adv. Eng. Inform. 2023, 57, 102033. [Google Scholar] [CrossRef] [Scilit]
  47. MathWorks Rolling Element Bearing Fault Diagnosis Data. Available online: https://github.com/mathworks/RollingElementBearingFaultDiagnosis-Data (accessed on 30 January 2026).
  48. Kang, J.; Wang, T.; Wei, Y.; Garba, U.H.; Tian, Y. A Rolling-Bearing-Fault Diagnosis Method Based on a Dual Multi-Scale Mechanism Applicable to Noisy-Variable Operating Conditions. Sensors 2025, 25, 4649. [Google Scholar] [CrossRef] [Scilit]
  49. Sayyad, S.; Kumar, S.; Bongale, A.; Kamat, P.; Patil, S.; Kotecha, K. Data-Driven Remaining Useful Life Estimation for Milling Process: Sensors, Algorithms, Datasets, and Future Directions. IEEE Access 2021, 9, 110255–110286. [Google Scholar] [CrossRef] [Scilit]
  50. Resendiz-Ochoa, E.; Osornio-Rios, R.A.; Benitez-Rangel, J.P.; Romero-Troncoso, R.D.J.; Morales-Hernandez, L.A. Induction Motor Failure Analysis: An Automatic Methodology Based on Infrared Imaging. IEEE Access 2018, 6, 76993–77003. [Google Scholar] [CrossRef] [Scilit]
  51. Ganapathy, S.; Mallidi, S.H.; Hermansky, H. Robust Feature Extraction Using Modulation Filtering of Autoregressive Models. IEEE Trans. Audio Speech Lang. Process. 2014, 22, 1285–1295. [Google Scholar] [CrossRef] [Scilit]
  52. Vaibhaw; Sarraf, J.; Pattnaik, P.K. Brain–Computer Interfaces and Their Applications. In An Industrial IoT Approach for Pharmaceutical Industry Growth; Elsevier: Amsterdam, The Netherlands, 2020; pp. 31–54. [Google Scholar]
  53. Ramzan, F.; Khan, M.U.G.; Rehmat, A.; Iqbal, S.; Saba, T.; Rehman, A.; Mehmood, Z. A Deep Learning Approach for Automated Diagnosis and Multi-Class Classification of Alzheimer’s Disease Stages Using Resting-State FMRI and Residual Neural Networks. J. Med. Syst. 2020, 44, 37. [Google Scholar] [CrossRef] [Scilit]
  54. Thalagala, S.; Walgampaya, C. Application of AlexNet Convolutional Neural Network Architecture-Based Transfer Learning for Automated Recognition of Casting Surface Defects. In Proceedings of the 2021 International Research Conference on Smart Computing and Systems Engineering (SCSE), Colombo, Sri Lanka, 16 September 2021; IEEE: New York, NY, USA, 2021; Volume 4, pp. 129–136. [Google Scholar]
  55. Kadam, V.; Kumar, S.; Bongale, A.; Wazarkar, S.; Kamat, P.; Patil, S. Enhancing Surface Fault Detection Using Machine Learning for 3D Printed Products. Appl. Syst. Innov. 2021, 4, 34. [Google Scholar] [CrossRef] [Scilit]
  56. Kuncan, M.; Kaplan, K.; Mínaz, M.R.; Kaya, Y.; Ertunç, H.M. A Novel Feature Extraction Method for Bearing Fault Classification with One Dimensional Ternary Patterns. ISA Trans. 2020, 100, 346–357. [Google Scholar] [CrossRef] [Scilit]
  57. Ye, L.; Ma, X.; Wen, C. Rotating Machinery Fault Diagnosis Method by Combining Time-Frequency Domain Features and Cnn Knowledge Transfer. Sensors 2021, 21, 8168. [Google Scholar] [CrossRef] [Scilit]
  58. Li, J.; Ying, Y.; Ren, Y.; Xu, S.; Bi, D.; Chen, X.; Xu, Y. Research on Rolling Bearing Fault Diagnosis Based on Multi-Dimensional Feature Extraction and Evidence Fusion Theory. R. Soc. Open Sci. 2019, 6, 181488. [Google Scholar] [CrossRef] [Scilit]
  59. Yang, D.; Karimi, H.R.; Gelman, L. A Fuzzy Fusion Rotating Machinery Fault Diagnosis Framework Based on the Enhancement Deep Convolutional Neural Networks. Sensors 2022, 22, 671. [Google Scholar] [CrossRef] [Scilit]
  60. Wang, X.; Li, A.; Han, G. Applied Sciences A Deep-Learning-Based Fault Diagnosis Method of Industrial Bearings Using Multi-Source Information. Appl. Sci. 2023, 13, 933. [Google Scholar] [CrossRef] [Scilit]
  61. Jose, J.P.; Ananthan, T.; Prakash, N.K. Ensemble Learning Methods for Machine Fault Diagnosis. In Proceedings of the 2022 Third International Conference on Intelligent Computing Instrumentation and Control Technologies (ICICICT), Kannur, India, 11 August 2022; IEEE: New York, NY, USA, 2022; pp. 1127–1134. [Google Scholar]
  62. Hoang, D.T.; Tran, X.T.; Van, M.; Kang, H.J. A Deep Neural Network-Based Feature Fusion for Bearing Fault Diagnosis. Sensors 2021, 21, 244. [Google Scholar] [CrossRef] [Scilit]
  63. Makrouf, I.; Zegrari, M.; Dahi, K.; Ouachtouk, I. A Novel Framework for Multi-Sensor Data Fusion in Bearing Fault Diagnosis Using Continuous Wavelet Transform and Transfer Learning. E-Prime—Adv. Electr. Eng. Electron. Energy 2025, 13, 101025. [Google Scholar] [CrossRef] [Scilit]
  64. Yuan, L.; Lian, D.; Kang, X.; Chen, Y.; Zhai, K. Rolling Bearing Fault Diagnosis Based on Convolutional Neural Network and Support Vector Machine. IEEE Access 2020, 8, 137395–137406. [Google Scholar] [CrossRef] [Scilit]
  65. Bechhoefer, E. Condition Based Maintenance Fault Database for Testing Diagnostics and Prognostic Algorithms. MFPT Data 2013. Available online: https://github.com/mathworks/RollingElementBearingFaultDiagnosis-Data (accessed on 30 January 2026).
  66. Sun, J.; Liu, Z.; Wen, J. An Efficient Lightweight Network with Improved Heterogeneous Convolution for Bearing Fault Diagnosis. IEEE Access 2025, 13, 185759–185770. [Google Scholar] [CrossRef] [Scilit]
  67. Kareem, A.B.; Hur, J.-W. Towards Data-Driven Fault Diagnostics Framework for SMPS-AEC Using Supervised Learning Algorithms. Electronics 2022, 11, 2492. [Google Scholar] [CrossRef] [Scilit]
  68. MathWorks-3 Choose Classifier Options. Available online: https://www.mathworks.com/help/stats/choose-a-classifier.html (accessed on 23 January 2024).
  69. Khanjani, M.; Ezoji, M. Electrical Fault Detection in Three-Phase Induction Motor Using Deep Network-Based Features of Thermograms. Measurement 2021, 173, 108622. [Google Scholar] [CrossRef] [Scilit]
Figure 1. The proposed Load-Dependent Multimodal Vibration Signal Enhancement and Fusion Framework (LD-MVSEFF).
Machines 14 00372 g001
Figure 2. Bearing faults: (a) ORF; (b) IRF [65].
Machines 14 00372 g002
Figure 3. Dataset segmentation example on the Normal (fault-free) or Healthy condition.
Machines 14 00372 g003
Figure 4. Input channels general overview. Arrows indicate the direction of signal encoding from top-left to bottom-right.
Machines 14 00372 g004
Figure 5. 2D CWT-encoded image examples showing the Normal (fault-free) or Healthy condition, and the faults IRF and ORF. The color intensity represents the magnitude of the wavelet coefficients, where warmer colors indicate higher energy regions and cooler colors indicate lower energy regions.
Machines 14 00372 g005
Figure 6. 2D GADF-encoded image examples showing the Normal (fault-free) or Healthy condition, and the faults IRF and ORF. The color mapping represents the GADF matrix values, where red indicates higher values and blue indicates lower values, reflecting relationships between signal values over time.
Machines 14 00372 g006
Figure 7. CLAF load-dependent subclass accuracy assessment per channel using different approaches.
Machines 14 00372 g007
Table 1. IRF dataset splitting per LF.
Inner Fault DatasetCodeLF (lbs)Sampling Rate (Hz)Duration (s)
InnerRaceFault_vload_2IRF_505048,8283
InnerRaceFault_vload_3IRF_10010048,8283
InnerRaceFault_vload_4IRF_15015048,8283
InnerRaceFault_vload_5IRF_20020048,8283
InnerRaceFault_vload_6IRF_25025048,8283
InnerRaceFault_vload_7IRF_30030048,8283
Table 2. ORF dataset splitting per LF.
Outer Fault Dataset CodeLF (lbs)Sampling Rate (Hz)Duration (s)
OuterRaceFault_vload_2ORF_505048,8283
OuterRaceFault_vload_3ORF_10010048,8283
OuterRaceFault_vload_4ORF_15015048,8283
OuterRaceFault_vload_5ORF_20020048,8283
OuterRaceFault_vload_6ORF_25025048,8283
OuterRaceFault_vload_7 ORF_30030048,8283
Table 3. Datastore structure linking raw vibration signals with CWT and GADF images.
SubfilesLoadFactorCLAFIndexImagePath_CWTImagePath_GADF
2500x1 timetableIRF_50Mild154C:\Users\Shahd\Docu…C:\Users\Shahd\Docu…
2500x1 timetableIRF_50Mild155C:\Users\Shahd\Docu…C:\Users\Shahd\Docu…
2500x1 timetableIRF_50Mild156C:\Users\Shahd\Docu…C:\Users\Shahd\Docu…
2500x1 timetableIRF_50Mild157C:\Users\Shahd\Docu…C:\Users\Shahd\Docu…
Table 4. Multichannel input data structure across the three channels.
SubfilesChannel 1
Tabular Features Extracted from the Raw Vibration Signal
Channel 2
CWT
2D Encoded Image
Channel 3
GADF
2D Encoded Image
CLAF
Load-Dependent Fault Subclasses
Machines 14 00372 i001The time and frequency
domain features.
Machines 14 00372 i002Machines 14 00372 i003Normal (fault-free) or Healthy condition.
Table 5. One-way ANOVA ranking including spectral features extracted by autoregressive (AR) model.
Feature RankOne-Way ANOVA ScoreFeature RankOne-Way ANOVA Score
1. Mean316.4413. PeakAmplitude 584.33
2. ShapeFactor288.4214. Skewness73.13
3. PeakValue245.4315. PeakAmplitude 270.50
4. RMS240.9316. PeakFreq169.14
5. Std240.2717. SINAD58.72
6. ClearanceFactor235.2318. SNR58.61
7. ImpulseFactor225.2619. PeakAmplitude 451.39
8. Kurtosis211.9420. PeakAmplitude 338.77
9. CrestFactor198.2621. PeakFreq425.18
10. PeakAmplitude161.2222. PeakFreq217.64
11. BandPower126.8523. PeakFreq513.9307
12. PeakFrequency 3116.8024. THD0
Table 6. Classifier performance on Channel 1 across distinct feature sets ranked by one-way ANOVA feature significance.
ClassifierANOVA
Ranking
TTime 1 Testing Dataset
(s)VA 2NA 3MA 4MoA 5SA 6Overall
Accuracy
Ensemble: Boosted TreesTop 20 >26114.494.50%100%95.40%88.50%93.50%94.40%
Ensemble: Boosted TreesTop 17 >58.616.895.10%100%89.20%85.70%91.70%91.70%
Cubic SVMTop 10 (a) >1615.994.30%100%92.50%85.70%100%94.60%
WNNTop 10 (b) >16115.792.20%100%90.30%91.40%91.70%93.40%
Cubic SVMTop 7 >2157.193.20%100%90.30%85.70%100%94.00%
Cubic SVMTop 5 >2409.493.70%100%90.30%85.70%100%94.00%
1 TTime—training time, 2 VA—validation accuracy, 3 NA—Normal (fault-free) or Healthy condition accuracy, 4 MA—Mild state accuracy, 5 MoA—Moderate state accuracy, 6 SA—Severe state accuracy.
Table 7. Channel 1 classifiers training.
ClassifierTTime 1Test Dataset
(s)VA 2NA 3MA 4MoA 5SA 6Overall
Accuracy
a. CubicSVM26.7196.80%100%89.36%95.74%100%96.28%
b. WNN48.6396.70%100%95.74%84.04%100%94.95%
1 TTime—training time, 2 VA—validation accuracy, 3 NA—Normal (fault-free) or Healthy condition accuracy, 4 MA—Mild state accuracy, 5 MoA—Moderate state accuracy, 6 SA—Severe state accuracy.
Table 8. Pre-trained CNNs performance on Channel 2 (CWT-encoded signal images) and Channel 3 (GADF-encoded signal images).
ChannelPre-Trained CNNTTime 1 Testing Dataset
(min)VA 2NA 3MA 4MoA 5SA 6Overall Accuracy
Channel 21. ResNet-1817.3597.55%100%95.74%100%100%98.94%
2. AlexNet7.2097.28%100%96.81%96.81%100%98.40%
Channel 31. ResNet-1818.596.47%100%89.36%92.55%98.94%95.21%
2. AlexNet7.5396.47%100%96.81%97.87%100%98.67%
1 TTime—training time, 2 VA—validation accuracy, 3 NA—Normal (fault-free) or Healthy condition accuracy, 4 MA—Mild state accuracy, 5 MoA—Moderate state accuracy, 6 SA—Severe state accuracy.
Table 9. Alternatives setting and decision-fusion weighting system.
Channel
No.
Input Classifier Weighting System 1Weighting System 2
Healthy MA 2MoA 3SA 4HealthyMAMoA SA
Alternative No.1.1 (TFDb-CWT) 1.2 (TFDb-CWT)
Alternative 11bTFD 1 WNN0.50.40.30.50.50.50.50.5
2CWT AlexNet0.50.60.70.50.50.50.50.5
Alternative No.2.1 (TFDa-CWT) 2.2 (TFDa-CWT)
Alternative 21aTFDCubicSVM 0.50.30.40.50.50.50.50.5
2CWT AlexNet0.50.70.60.50.50.50.50.5
Alternative No.3.1 (TFDa-CWT-GADF)3.2 (TFDa-CWT-GADF)
Alternative 31aTFDCubicSVM 0.330.20.20.330.330.330.330.33
2CWTAlexNet0.330.40.40.330.330.330.330.33
3GADFAlexNet0.330.40.40.330.330.330.330.33
1 TFD—time and frequency domain extracted features, 2 MA—Mild state accuracy, 3 MoA—Moderate state accuracy, 4 SA—Severe state accuracy.
Table 10. Decision fusion overall test accuracy over the five runs.
Alternatives12345Avg.
1.1 (TFDb-CWT)98.67%98.94%98.94%98.67%99.07%98.86%
1.2 (TFDb-CWT)98.94%97.08%98.67%98.67%98.67%98.40%
2.1 (TFDa-CWT)98.40%98.67%96.54%98.67%98.54%98.16%
2.2 (TFDa-CWT)98.67%98.94%97.07%98.67%98.94%98.46%
3.1 (TFDa-CWT-GADF)98.67%98.94%99.47%98.94%99.20%99.04%
3.2 (TFDa-CWT-GADF)98.40%97.51%98.94%98.94%99.20%98.60%
Disclaimer/Publisher’s Note: The statements, opinions and data contained in all publications are solely those of the individual author(s) and contributor(s) and not of MDPI and/or the editor(s). MDPI and/or the editor(s) disclaim responsibility for any injury to people or property resulting from any ideas, methods, instructions or products referred to in the content.