Next Article in Journal
Linear Algebra-Based Multivariable Controller Design for Gas Turbine Machines with State-Derivative Feedback
Previous Article in Journal
Numerical Validation of a New Nonlinear Partially Averaged Navier–Stokes Model for Simulating Curved Flows
 
 
Correction published on 9 June 2026, see Machines 2026, 14(6), 673.
Article

Simulation Analysis of Non-Pneumatic Tire Wear Based on Temperature-Corrected Archard Model

1
School of Automotive and Traffic Engineering, Jiangsu University, Zhenjiang 212013, China
2
Ji Hua Laboratory, Foshan 528200, China
*
Author to whom correspondence should be addressed.
Machines 2026, 14(2), 168; https://doi.org/10.3390/machines14020168
Submission received: 24 December 2025 / Revised: 22 January 2026 / Accepted: 22 January 2026 / Published: 2 February 2026 / Corrected: 9 June 2026
(This article belongs to the Section Vehicle Engineering)

Abstract

Non-Pneumatic Tires (NPTs) have been recognized for their advantages, such as low rolling resistance, burst resistance, and lightweight design, which make them highly suitable for application in electric vehicles under complex conditions, including high-frequency starts and stops and high torque. However, the discontinuous spoke support structure has resulted in a significantly higher ground contact pressure distribution compared to traditional pneumatic tires, leading to more severe wear, especially in the contact area where complex stress concentrations have occurred. Currently, the wear behavior mechanisms of NPTs have not been fully clarified, and wear simulation methods that take temperature effects into account are lacking. In this study, a temperature-modified Archard wear equation was integrated into the UMESHMOTION subroutine to achieve real-time updates of the tire surface geometry and simulate the evolution of wear. The modeling approach was validated through experimental testing. The simulation results showed that as the load increased from 100 N to 700 N, the peak ground contact pressure significantly increased, and the contact area gradually expanded, resulting in a notable increase in wear. Additionally, as the slip ratio increased from 2% to 5%, the contact stress and wear area were significantly amplified, leading to an increase in surface roughness and evident local damage. Comparative results indicated that the slip ratio had a more significant impact on wear volume than the load. The study has been conducted from a physical mechanism perspective to verify the dominant role of the slip ratio in the short-term rolling distance of tires, providing a theoretical basis for the structural optimization and wear-resistant design of non-pneumatic tires under complex operating conditions.

1. Introduction

With the rapid development of the new energy vehicle industry, the operational characteristics of vehicles are undergoing profound changes. Compared to traditional internal combustion engine vehicles, new energy vehicles have a larger overall mass and quicker driving torque response. This results in tires experiencing more complex slip and load conditions during operation, which leads to increased wear [1]. In this context, as the only point of contact between the vehicle and the ground, the friction and wear characteristics of tires directly affect the vehicle’s safety, energy efficiency, and lifespan, placing more stringent demands on tire wear resistance and structural reliability.
However, two major structural bottlenecks exposed in the long-term use of traditional pneumatic tires have further exacerbated these challenges. The first is safety defects: their reliance on internal air pressure to maintain load-bearing characteristics makes tires highly vulnerable to deflation or even instantaneous blowouts when encountering punctures or extreme conditions. Statistics show that up to 46% of highway accidents are directly related to tire safety hazards, with blowout accidents accounting for over 70%, posing a significant threat to driving safety. The second is the performance adaptation challenge: electric vehicles place multiple demands on tires, such as low rolling resistance, lightweight design, and high wear resistance, which conflict with the air pressure-dependent structure of traditional pneumatic tires [2,3]. Since pneumatic tires essentially rely on air pressure to maintain load-bearing capacity, when faced with emerging performance demands such as increased vehicle weight and rapid changes in power output, their air pressure-dependent structure is often limited and cannot be fully optimized to meet these needs [4,5].
Therefore, a systematic revolution in tire technology has become urgent. Non-Pneumatic Tires (NPT), which replace the traditional air cavity with a solid supporting structure optimized through biomimicry or topology (such as flexible spokes or honeycomb cells), fundamentally eliminate the risk of blowouts, while offering significant advantages such as low rolling resistance and high design flexibility. NPT is seen as an important technological direction to address the tire performance and safety challenges of the new energy vehicle era.
However, the unique spoke support structure of NPTs, while providing performance advantages, also introduces new scientific challenges. Under complex dynamic loads, the force transfer mechanism between the discrete spoke structure and the continuous tread is not yet fully understood, leading to fundamentally different ground pressure distributions and wear behavior mechanisms compared to traditional pneumatic tires. Studies have shown that optimizing the spoke or shear band structure can significantly improve ground pressure distribution. For example, Wei et al. [6] decoupled the compression stiffness and shear modulus through shear band design, effectively reducing the peak ground contact pressure and making its distribution more uniform; Deng et al. [7] found that spoke damage significantly affects the radial stiffness and ground pressure distribution of the tire. These studies reveal that the wear of non-pneumatic tires is closely coupled with their ground pressure characteristics. However, existing studies mostly focus on the mechanical properties and pressure distribution under static or quasi-static conditions and have not systematically revealed the transient evolution of ground pressure and the resulting wear mechanisms under dynamic rolling conditions, particularly those involving slip and temperature rise. The lack of such mechanism studies has become a key theoretical bottleneck restricting the widespread application of NPTs in new energy vehicles.
Current research on tire wear performance mainly uses experimental testing and finite element simulation methods. Although experimental testing can directly reflect tire wear behavior under real road conditions, it has limitations such as long testing periods and high costs [8]. More importantly, experimental results are often influenced by various variables such as vehicle speed, driving routes, driving habits, and environmental factors (e.g., temperature and humidity), leading to large data scatter, which makes it difficult to meet the high efficiency and accuracy requirements of modern tire development. With the rapid development of computer technology and numerical simulation methods, finite element simulation has become an important technical tool for tire wear research. For example, Zhang et al. [9] proposed an intelligent tire information system based on three-axis accelerometer and strain gauge signals, which analyzes the dynamic response characteristics of the tire during operation to identify changes in tread wear status. Wang Guolin et al. [10] constructed a tire wear state model by setting different tread thicknesses and using Gaussian Process Regression (GPR) algorithms to extract strain signal features, achieving reverse estimation of wear volume. However, these “indirect wear state identification methods” or “equivalent thickness reduction methods” do not consider the dynamic evolution of tire geometry during the wear process and thus fail to accurately reflect the uneven distribution and local development mechanisms of wear under multiple working conditions. This has become a major bottleneck in the current numerical simulation of tire wear. Therefore, developing a numerical simulation method based on geometric dynamic updates is an important direction to improve simulation prediction accuracy [11].
In addition, in the study of rubber friction and wear mechanisms, scholars such as Jian Wu et al. [12,13,14] have conducted systematic research on the wear behavior of aircraft tires under high-speed and high-temperature conditions. From both theoretical and experimental perspectives, they revealed the influence of slip speed on frictional temperature rise and wear rate, confirming the key role of frictional heat effects in the wear process. Zuo et al. [15], based on the Archard wear theory and ABAQUS 2020 software, established a simulation framework for the high-speed rolling wear of pneumatic tires and proposed a polygonal wear prediction model, further advancing tire wear research. However, the existing wear simulations and methods based on the Archard model are mainly focused on traditional pneumatic tires, with significant gaps in wear simulation research for non-pneumatic tires. Specifically, due to differences in the ground load transfer mechanisms between non-pneumatic and pneumatic tires, existing wear simulation methods for pneumatic tires are not directly applicable to non-pneumatic tires. Additionally, current simulation methods generally treat wear and frictional heat generation processes independently, ignoring the dynamic coupling relationship between them in actual rolling contact, which limits the accuracy of wear prediction.
To address the limitations of conventional wear simulation methods, which struggle to adapt to the unique load-transfer mechanisms of non-pneumatic tires and often neglect the dynamic coupling between frictional heat generation and wear processes, this study develops a wear simulation model for non-pneumatic tires that incorporates the frictional heat generation mechanism of the tread. By integrating a temperature-corrected Archard wear model with dynamic Arbitrary Lagrangian-Eulerian (ALE) mesh update techniques, numerical simulation of the evolution of tread geometry under transient thermo-mechanical coupling is achieved. Based on the established model, this study systematically reveals the evolution characteristics of the contact behavior, slip amount, and wear amount of non-pneumatic tires under thermo-mechanical coupling, and provides an in-depth analysis of their friction performance and wear morphology. Consequently, this work helps to bridge the gap in research on thermo-mechanical coupled wear simulation for non-pneumatic tires.

2. Rubber Thermal-Mechanical Coupled Wear Simulation Method Based on Wear Testing

2.1. Rubber Wear Experiment

The classical Archard wear model relates wear volume to contact pressure, slip distance, and material hardness, with its basic form shown in Equation (1):
V = K H F N L
In Equation (1), V represents the wear volume; K is the material wear coefficient, which is experimentally determined; FN denotes the normal load acting on the contact surfaces; L is the relative sliding distance between the contact interfaces; and H is the hardness of the material. It can be seen from Equation (1) that, in the Archard wear model, the wear volume is directly proportional to the normal load, the wear coefficient, and the sliding distance.
In contrast, the energy-based wear model directly relates the frictional energy (which can be simplified as μ F N L ) to the resulting wear volume [16]:
V E = K E F τ L
F τ = μ F N
In this model, KE denotes the wear coefficient per unit energy dissipation rate, μ is the coefficient of friction, and Fτ represents the tangential friction force between the contact surfaces. If the ratio K/H n Equation (1) is equivalently replaced by the wear coefficient KA; the wear coefficients for the two models can be, respectively, expressed as
K A = V H F N L
K E = V F τ L
In traditional studies, the wear coefficient is often determined empirically [17,18]. However, this approach has limitations, particularly under varying temperature conditions, where empirical values may fail to accurately reflect actual wear behavior. To address this issue, the research group previously conducted experiments to measure the wear coefficients of rubber in the temperature range of 20 °C to 70 °C and established their functional relationship with temperature. This enabled the modification of the wear model to more accurately account for the influence of temperature on rubber wear behavior.
In addition, during the wear tests, the volume V of the worn rubber material is typically small and irregular. Therefore, by using the material density and the mass loss before and after wear (m = ρV), Equations (4) and (5) can be further transformed accordingly:
K A = m H F N L ρ
K E = m F τ L ρ
To determine the temperature-dependent wear coefficients, a series of experiments were conducted (the experimental setup is shown in Figure 1). Tread rubber from a 295/80R22.5 all-steel radial truck tire was selected as the test material and processed into standardized rubber disc specimens with a diameter of 60 mm and a thickness of 9 mm. Three 4 mm-diameter positioning holes were designed on the surface of each specimen to ensure stable fixation during testing using bolts. The experiments were carried out using an MVF-1A friction and wear testing machine, equipped with a high-precision modular integrated control system. During testing, the rubber specimen was secured to a steel base via the positioning holes, and a steel pin rotated against it at a speed of 100 r/min under a constant load of 42 N, simulating the actual frictional wear process. Key parameters such as friction torque, vertical load, and friction coefficient were recorded in real time. Based on typical tire service temperature conditions [19,20], six temperature gradients were set: 20 °C, 30 °C, 40 °C, 50 °C, 60 °C, and 70 °C. For each temperature, two parallel sets of tests were performed, with five repeated trials per set. The average of these repetitions was taken as the final result at each temperature. Temperature control was achieved via a thermostatic chamber: specimens and base were preheated to the desired temperature and then quickly transferred to the test apparatus. A UNI-T infrared thermal imager was used to continuously monitor temperature variation in the contact area during testing. The wear amount was measured using the mass loss method, following a standardized testing procedure [15]. A precision electronic balance (accuracy: 0.001 g, model: JJG1036-2008D) was used to weigh each specimen before and after the test. To reduce error, five measurements were taken before and after testing for each specimen, and the average was used as the final result. This mass-based approach effectively avoids errors associated with directly measuring irregular wear volumes and significantly improves the reliability of the experimental data

2.2. Establishment of the Modified Archard Wear Model

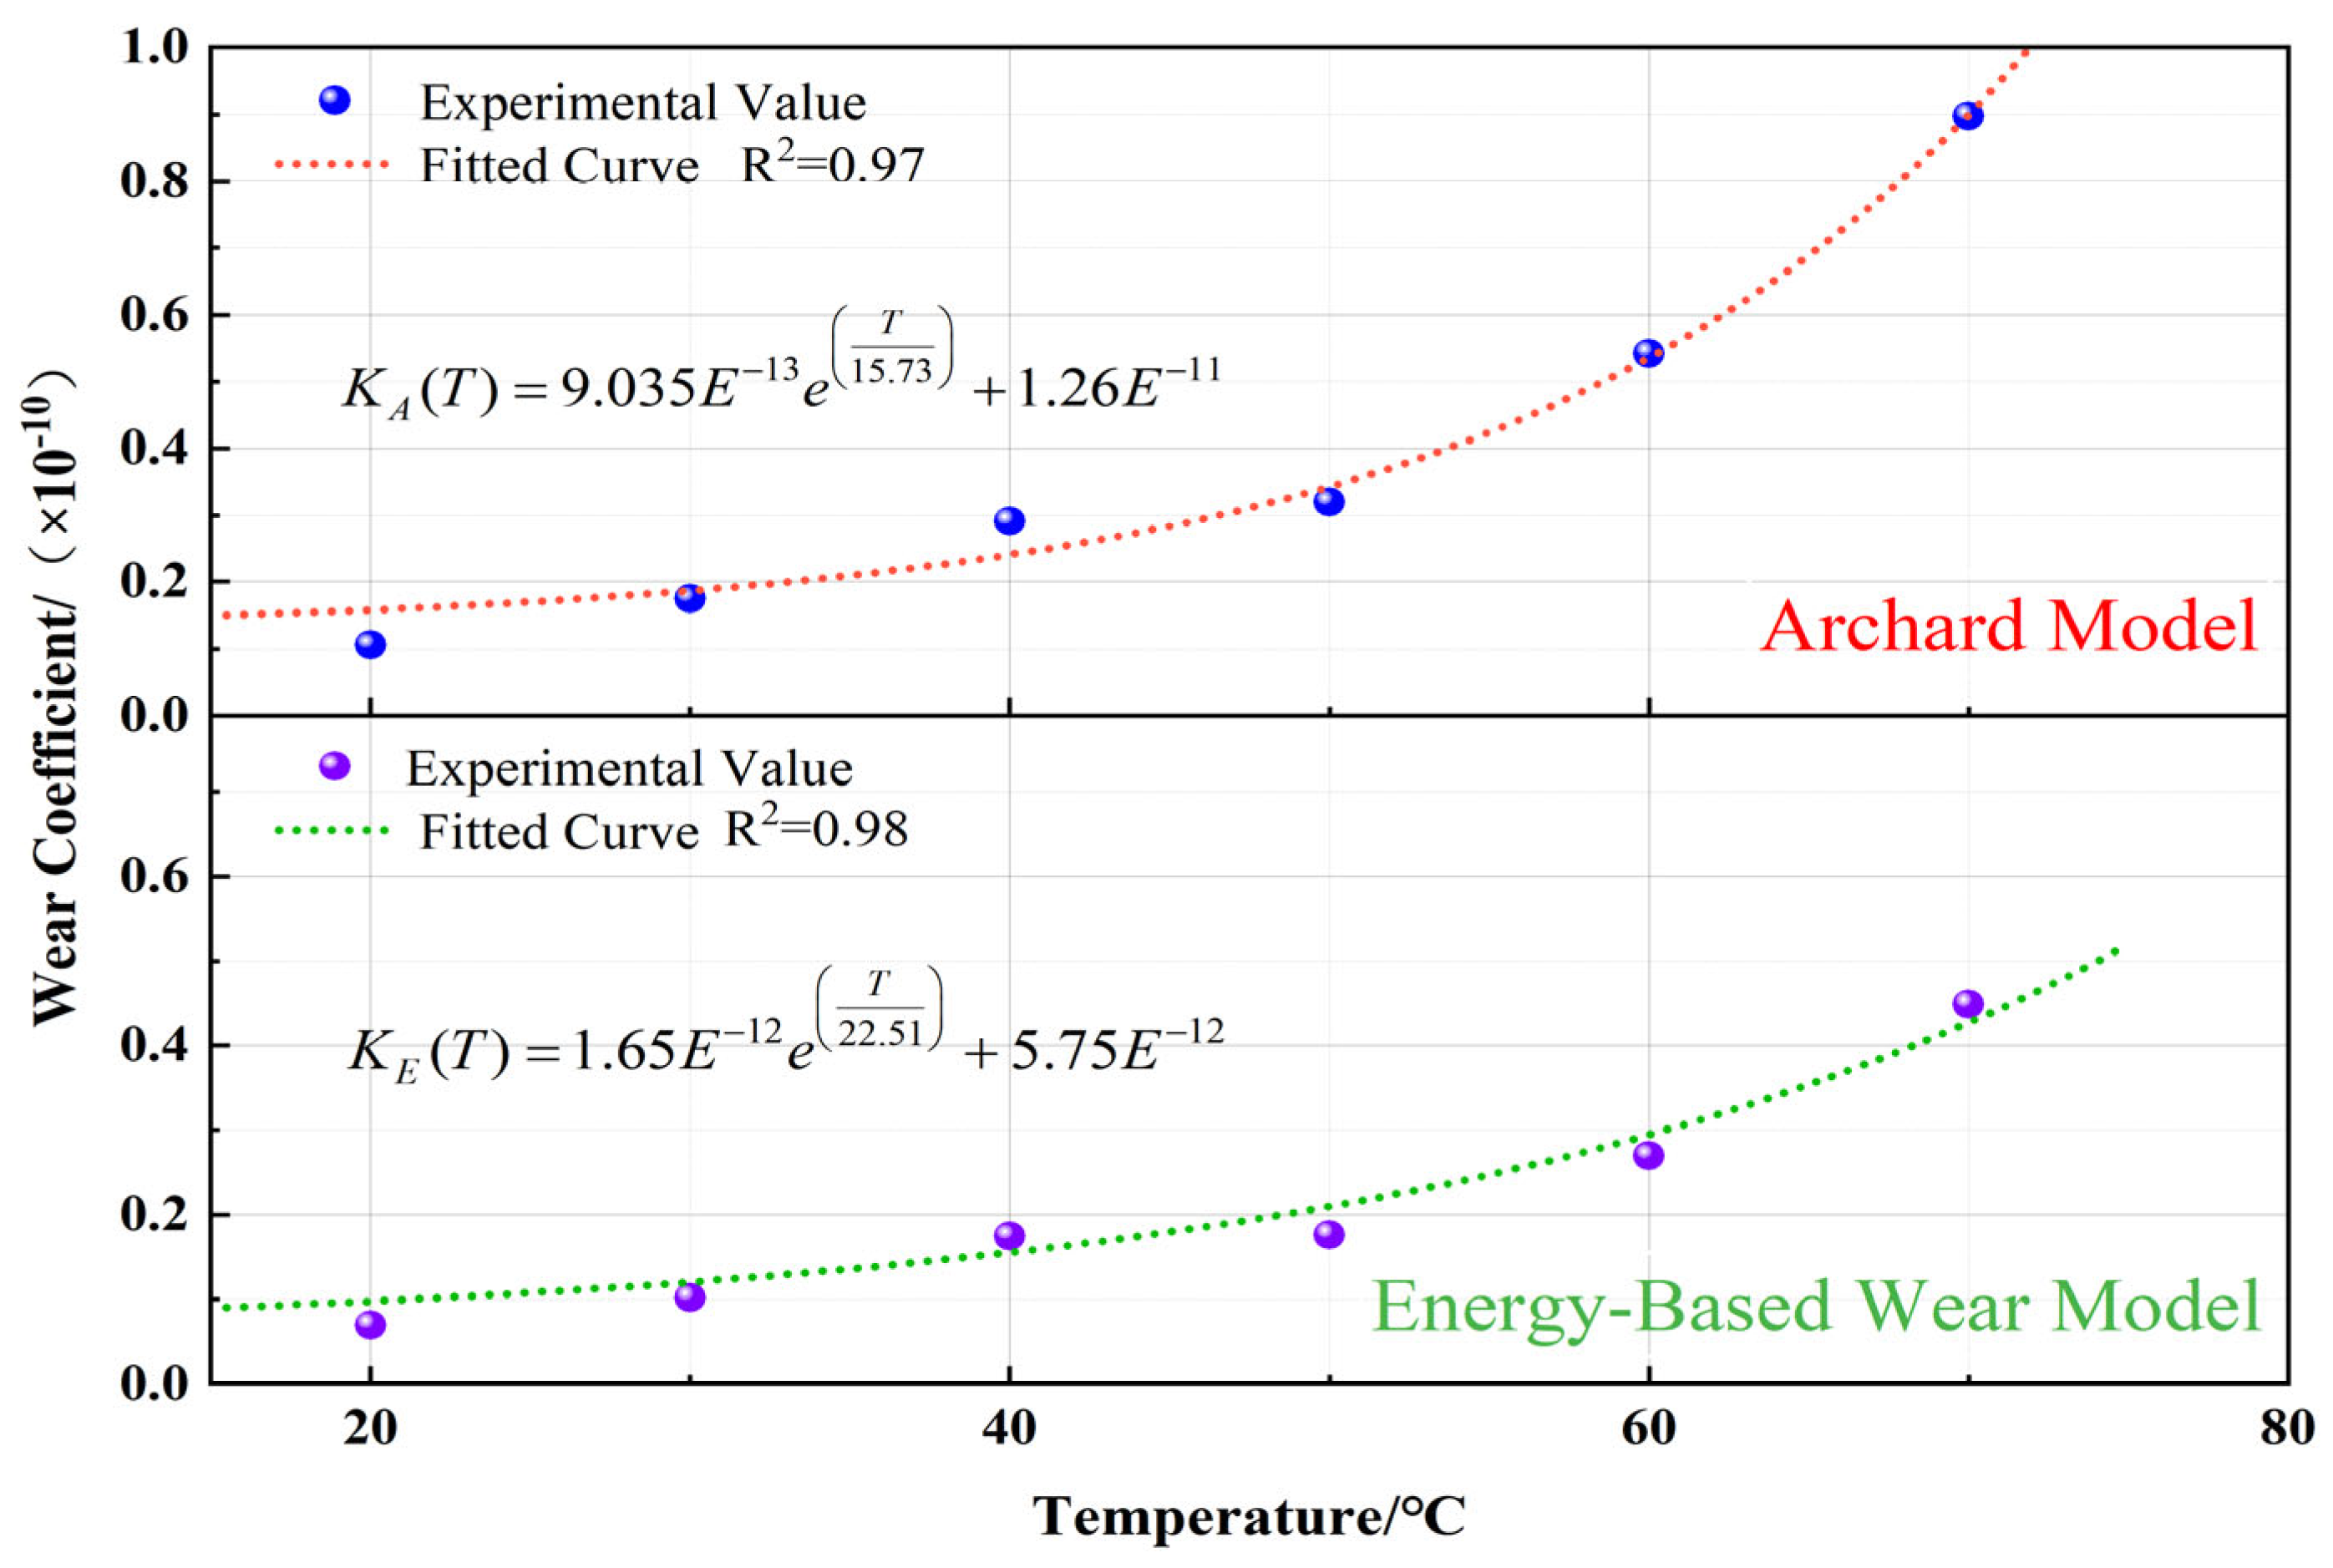
Taking the test results at 20 °C as an example, the surface morphology of the rubber specimen before and after wear is shown in Figure 1, and the corresponding hardness and mass measurements are listed in Table 1. Based on Equations (6) and (7), the Archard wear coefficient KA and the energy-based wear coefficient KE under the 20 °C condition were calculated to be 1.57 × 10⁻¹¹, 9.7610−12, respectively. It should be noted that this study incorporates the influence of material hardness variation with temperature into the fitting process of the wear coefficient, thereby indirectly coupling the effect of hardness into the temperature-dependent wear model. By repeating the aforementioned experimental procedures at different temperatures, functional relationships for the Archard model wear coefficient KA (T) and the energy model wear coefficient KE (T) as functions of temperature were established, as shown in Figure 2 and Equations (8) and (9). The fitting results show that the coefficients of determination (R2) for the two models are 0.97 and 0.98, respectively, indicating that the chosen exponential function form can effectively represent the variation trend of the wear coefficient with temperature. Based on this, the study has developed a modified wear model that accounts for the temperature effect, providing a reliable basis for the accurate prediction of rubber material wear.
The fitted equations for the Archard wear coefficient and the energy-based wear coefficient are given as follows:
K A ( T ) = 9.035 E 13 e T 15.73 + 1.26 E 11
K E ( T ) = 1.65 E 12 e T 22.51 + 5.75 E 12
KA(T) represents the Archard wear coefficient as a function of temperature, KE(T) denotes the energy-based wear coefficient as a function of temperature, and T stands for temperature.

2.3. Rubber Thermal-Mechanical Coupled Wear Simulation Method and Validation

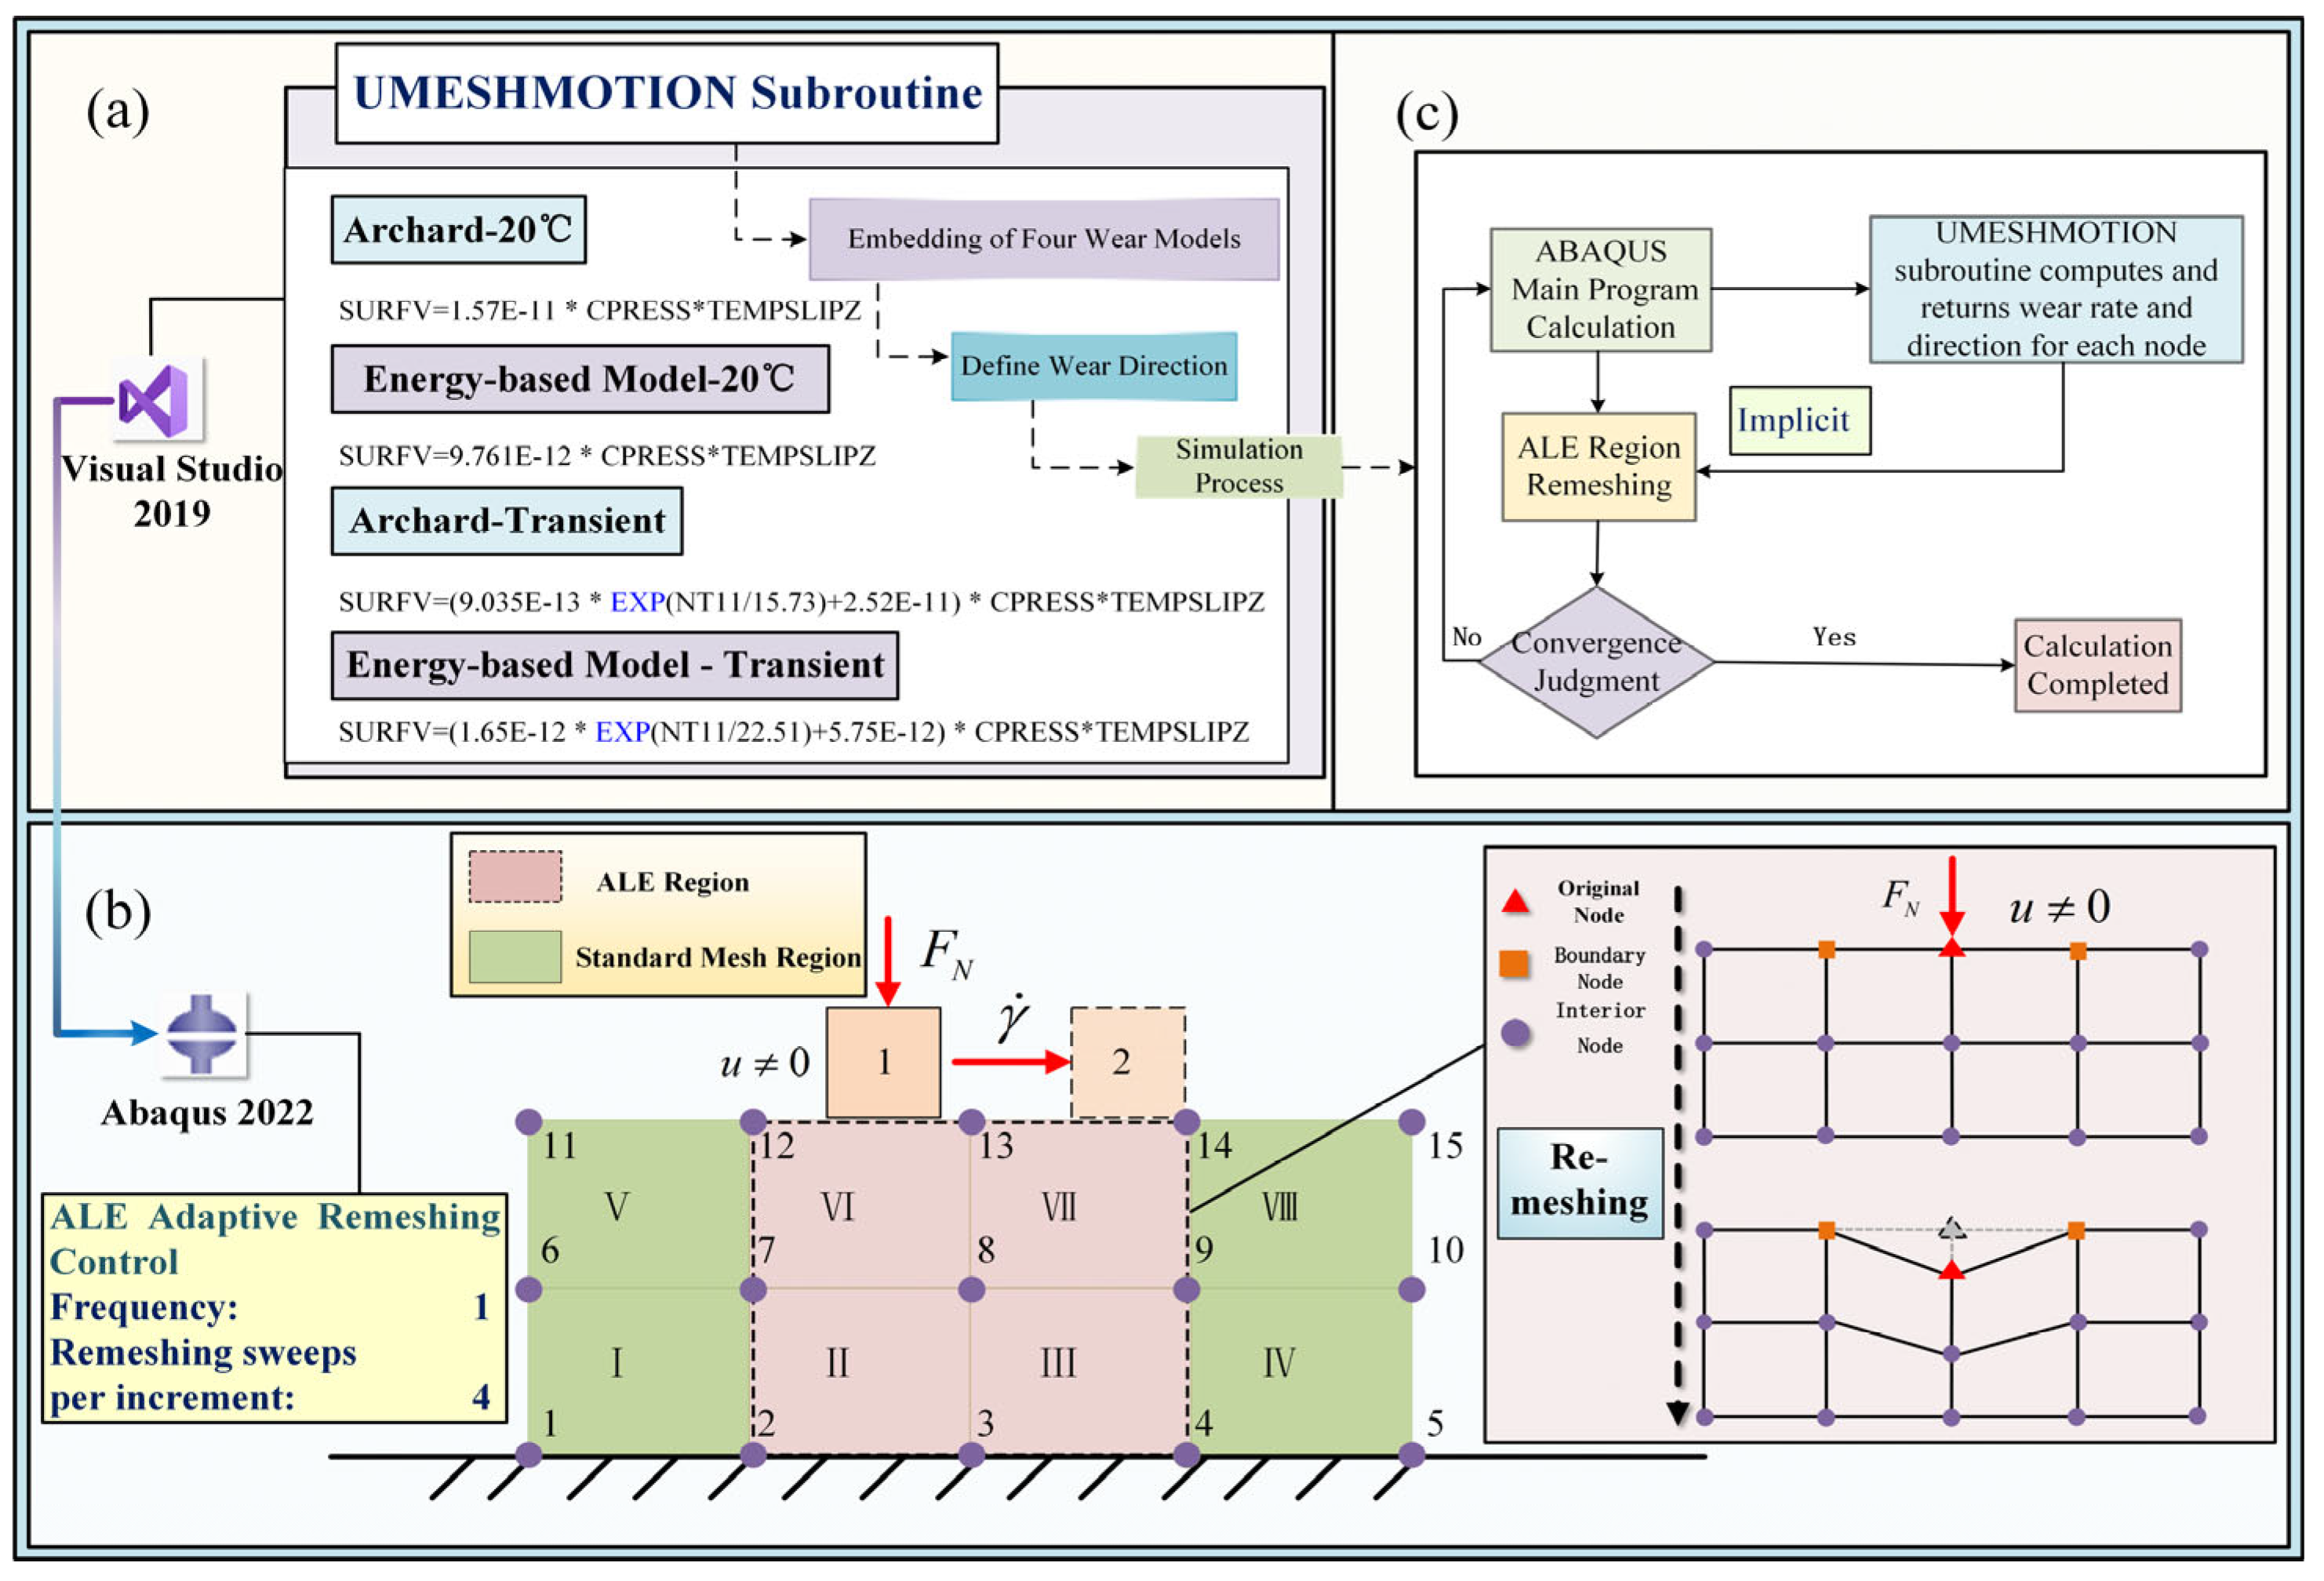
Abaqus is one of the most powerful and widely used finite element analysis (FEA) software packages, particularly recognized for its leading capabilities in nonlinear mechanical analysis [21,22,23]. To accurately simulate the wear behavior of tread rubber materials during frictional processes, this study adopts a numerical simulation approach that integrates the UMESHMOTION user subroutine within the Abaqus/Standard module with the Arbitrary Lagrangian–Eulerian (ALE) adaptive meshing technique. In the simulation model, all nodes involved in surface interaction (including internal and edge nodes) are defined as wear nodes (detailed classification criteria are provided in Section 2.3). The UMESHMOTION subroutine is developed in FORTRAN and requires Intel Visual FORTRAN and Visual Studio environments for proper execution. As shown in Figure 3a, two types of wear models—one using the steady-state wear coefficient at 20 °C and the other employing a fitted temperature-dependent coefficient ranging from 20 °C to 70 °C—were implemented into four subroutines to conduct numerical wear simulations under both steady and transient thermal conditions. The core function of the UMESHMOTION subroutine is to compute the wear rate and direction for each wear node based on the wear equation and to update the position of the surface nodes accordingly. The ALE technique is used in tandem to regenerate the interior mesh. Figure 3b illustrates the ALE-based mesh redefinition process. Nodes 1–5 are fixed on a plane, and elements VI and VII represent the ALE region. When a loaded square element slides from position 1 to position 2 via node 13, contact stress and other information are passed in real time to the UMESHMOTION subroutine, which calculates the wear at node 13 and updates the finite element mesh using the redefined geometry. The overall wear simulation process in Abaqus is outlined in Figure 3c. Considering the stability requirements of the implicit algorithm and the convergence characteristics of the ALE mesh adaptation method, the rubber material is simplified as a linear elastic model in the simulation to ensure numerical stability throughout the wear computation.
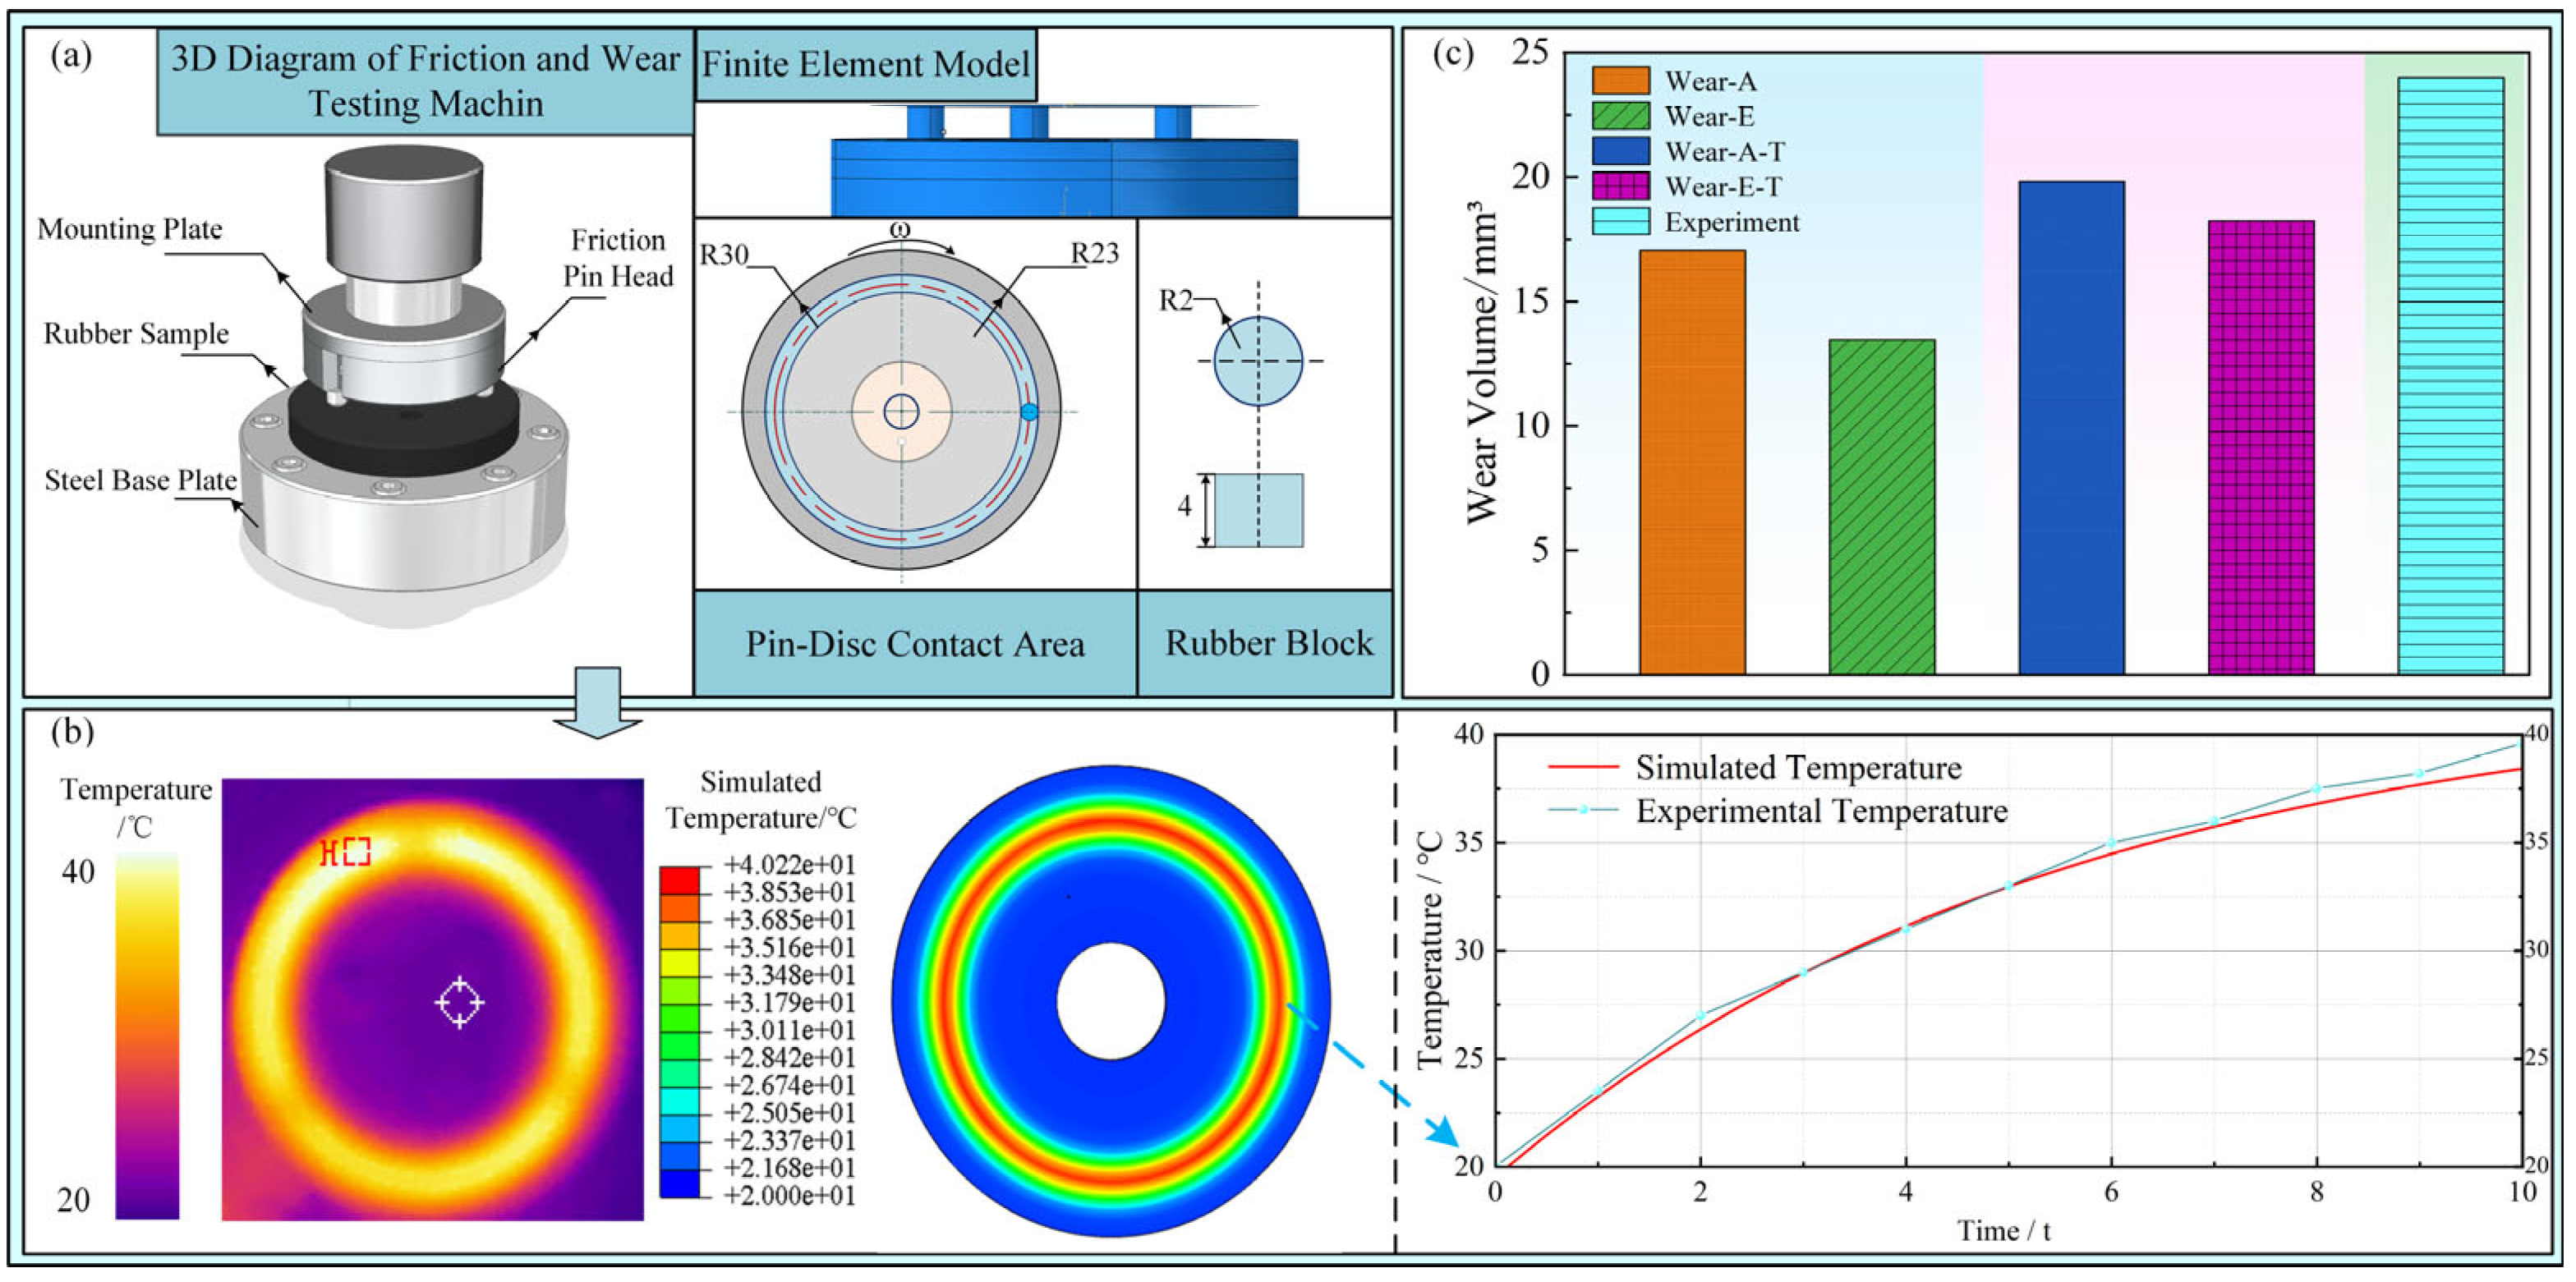
Previous studies [15] have conducted pin-on-disc friction and wear finite element simulations under the same conditions of load, speed, and counter face material, as shown in Figure 4a. In the numerical simulation, two types of analyses were performed: steady-state thermal conditions and transient thermal conditions. For the steady-state condition, a general static analysis step was used. Subroutines incorporating the wear coefficients of the Archard model (A) and the energy-based wear model (E) at 20 °C were applied, denoted as A-20 °C and E-20 °C, respectively. For the transient condition, a fully coupled thermal–mechanical analysis step was adopted. The temperature-dependent wear coefficient functions fitted from the two models were embedded into separate subroutines, and the simulation also incorporated the temperature-dependent rubber material parameters obtained from previous experiments (see Table 2), along with the measured temperature-dependent friction coefficients. The simulation results for the transient condition are referred to as A-T and E-T. In the transient analysis, an initial predefined temperature field was applied to simulate the test temperature of the rubber during the experiment. A comparison between the simulation results (e.g., at 10 s in the A-T simulation) and the experimentally measured temperature field and surface peak temperature of the rubber specimen demonstrated high consistency, thereby validating the effectiveness of the frictional wear simulation. Additionally, Figure 4c presents the simulated wear volumes under different operating conditions using different subroutines. The comparison of the four simulation schemes shows that predictions based on the Archard wear model were generally higher than those from the energy-based model. Moreover, the results from the transient A-T model were found to be more consistent with the experimental data. Therefore, the Archard model was selected for subsequent numerical simulations in this study. It is worth noting that the discrepancies between the simulation and experimental results can be mainly attributed to two factors: (1) the simplification of rubber as a linear elastic material in the simulation and (2) the idealized representation of the test machine’s working mechanism, which did not account for the influence of the irregular shape of the pin head on the actual friction process.

3. Establishment and Validation of the Non-Pneumatic Tire Model

3.1. Geometric and Material Parameters

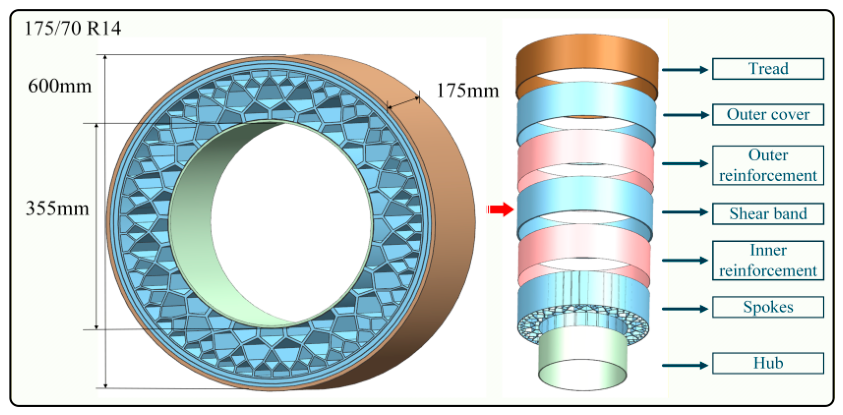
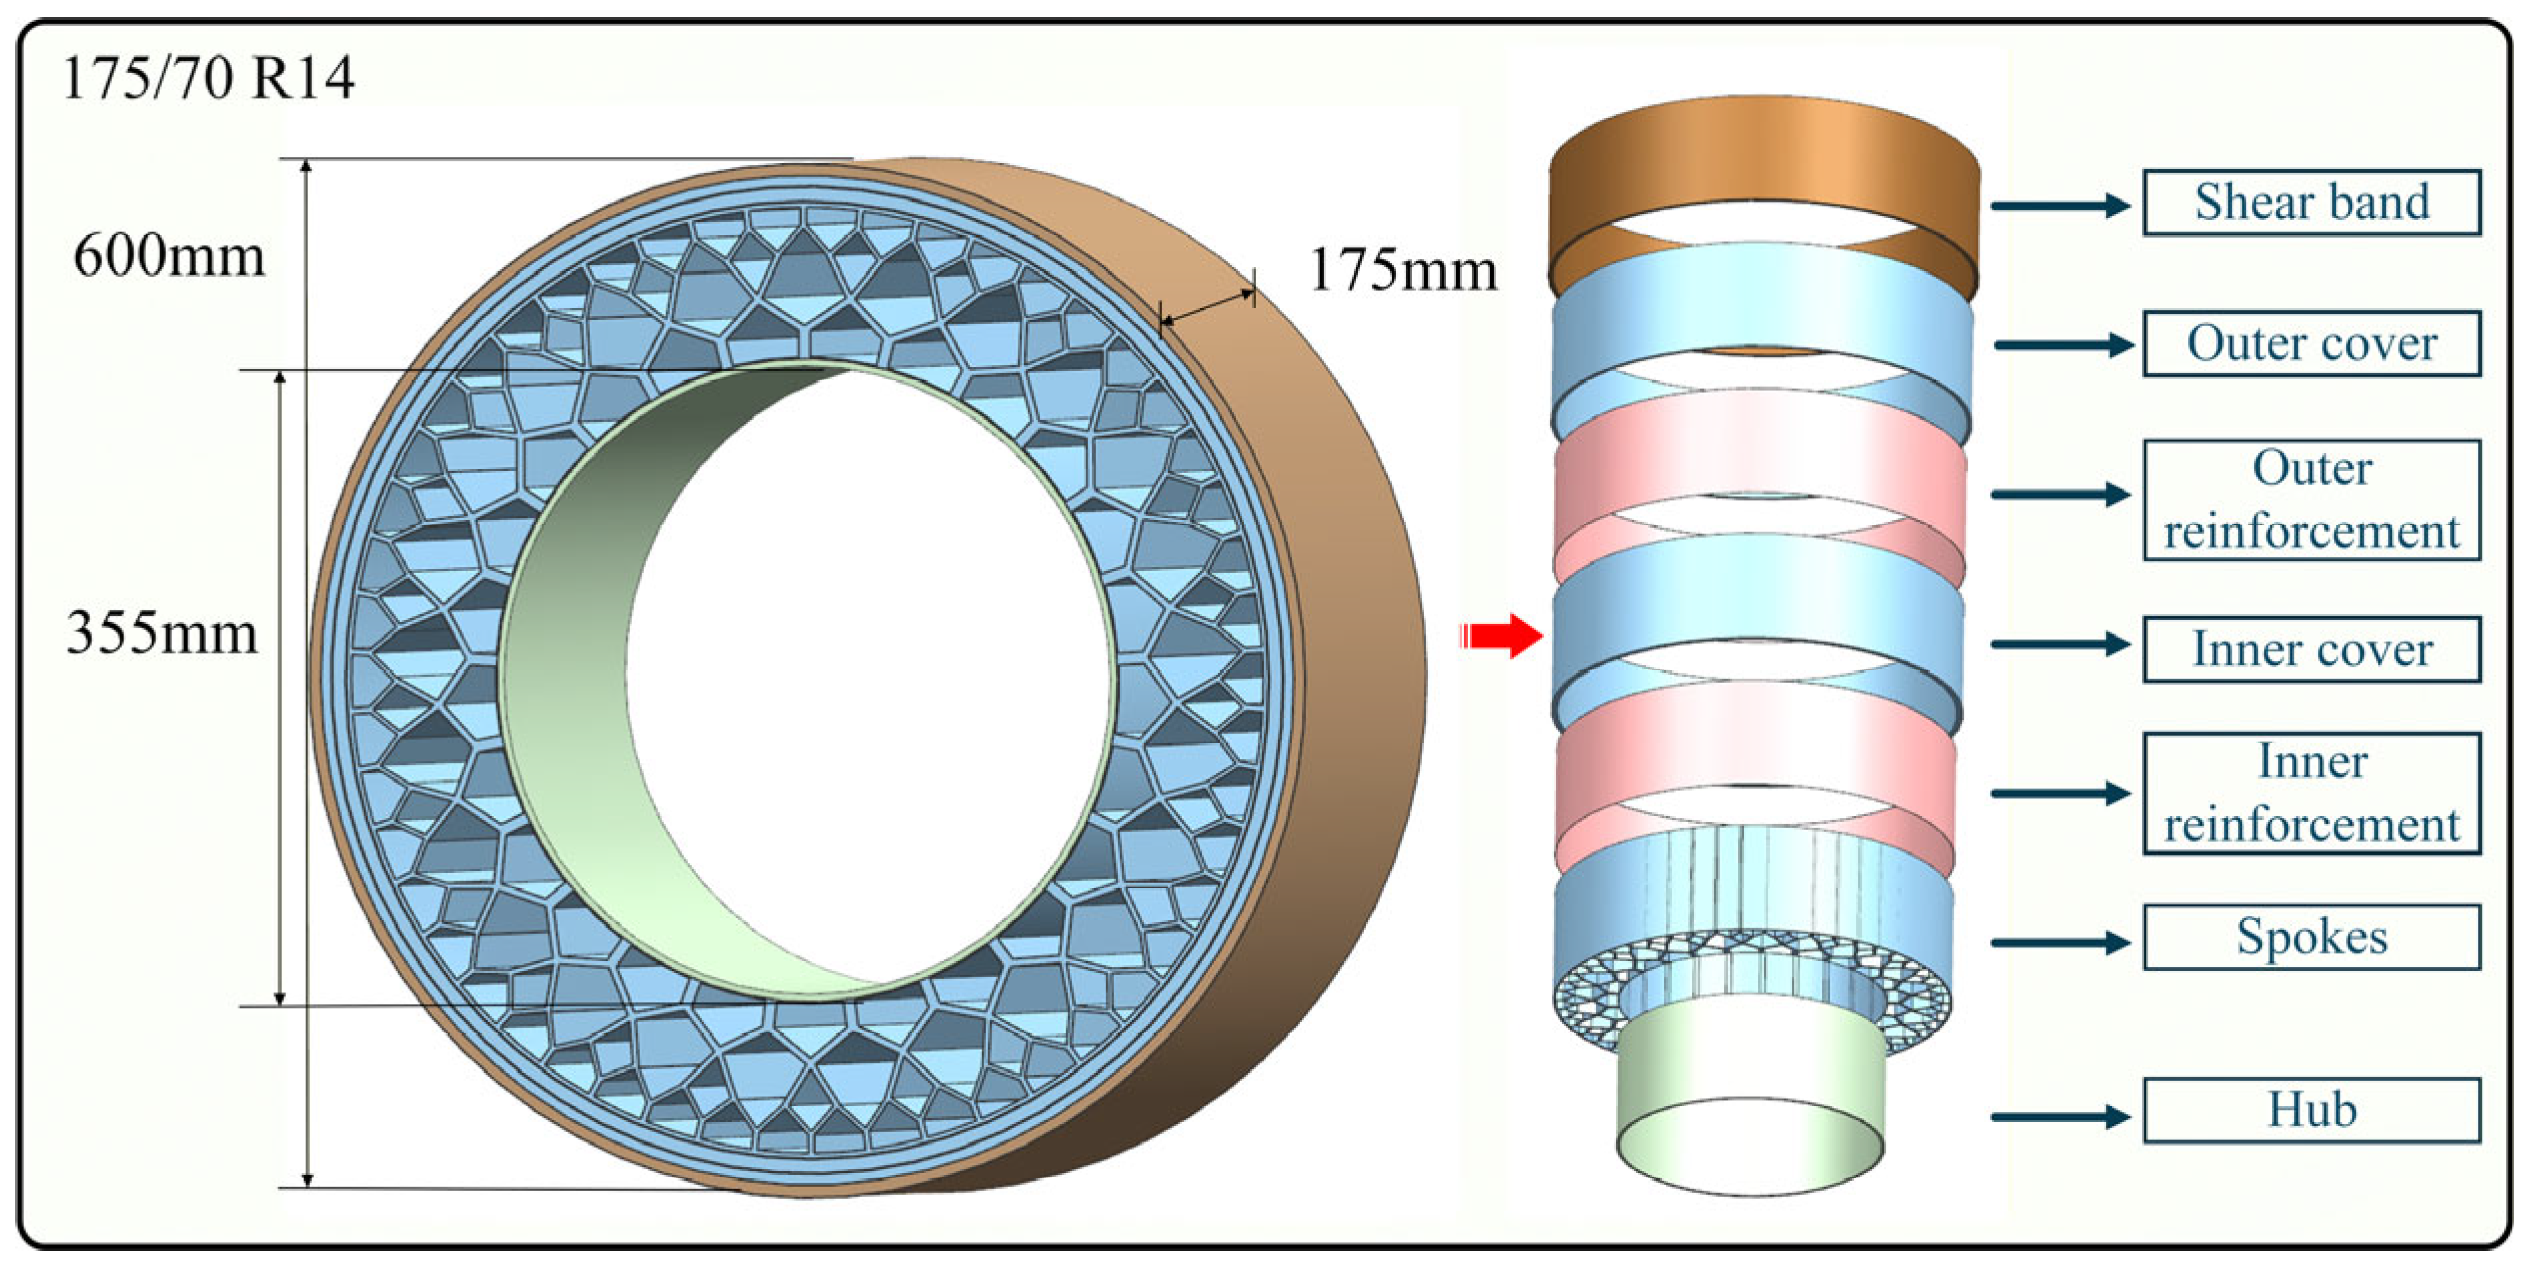
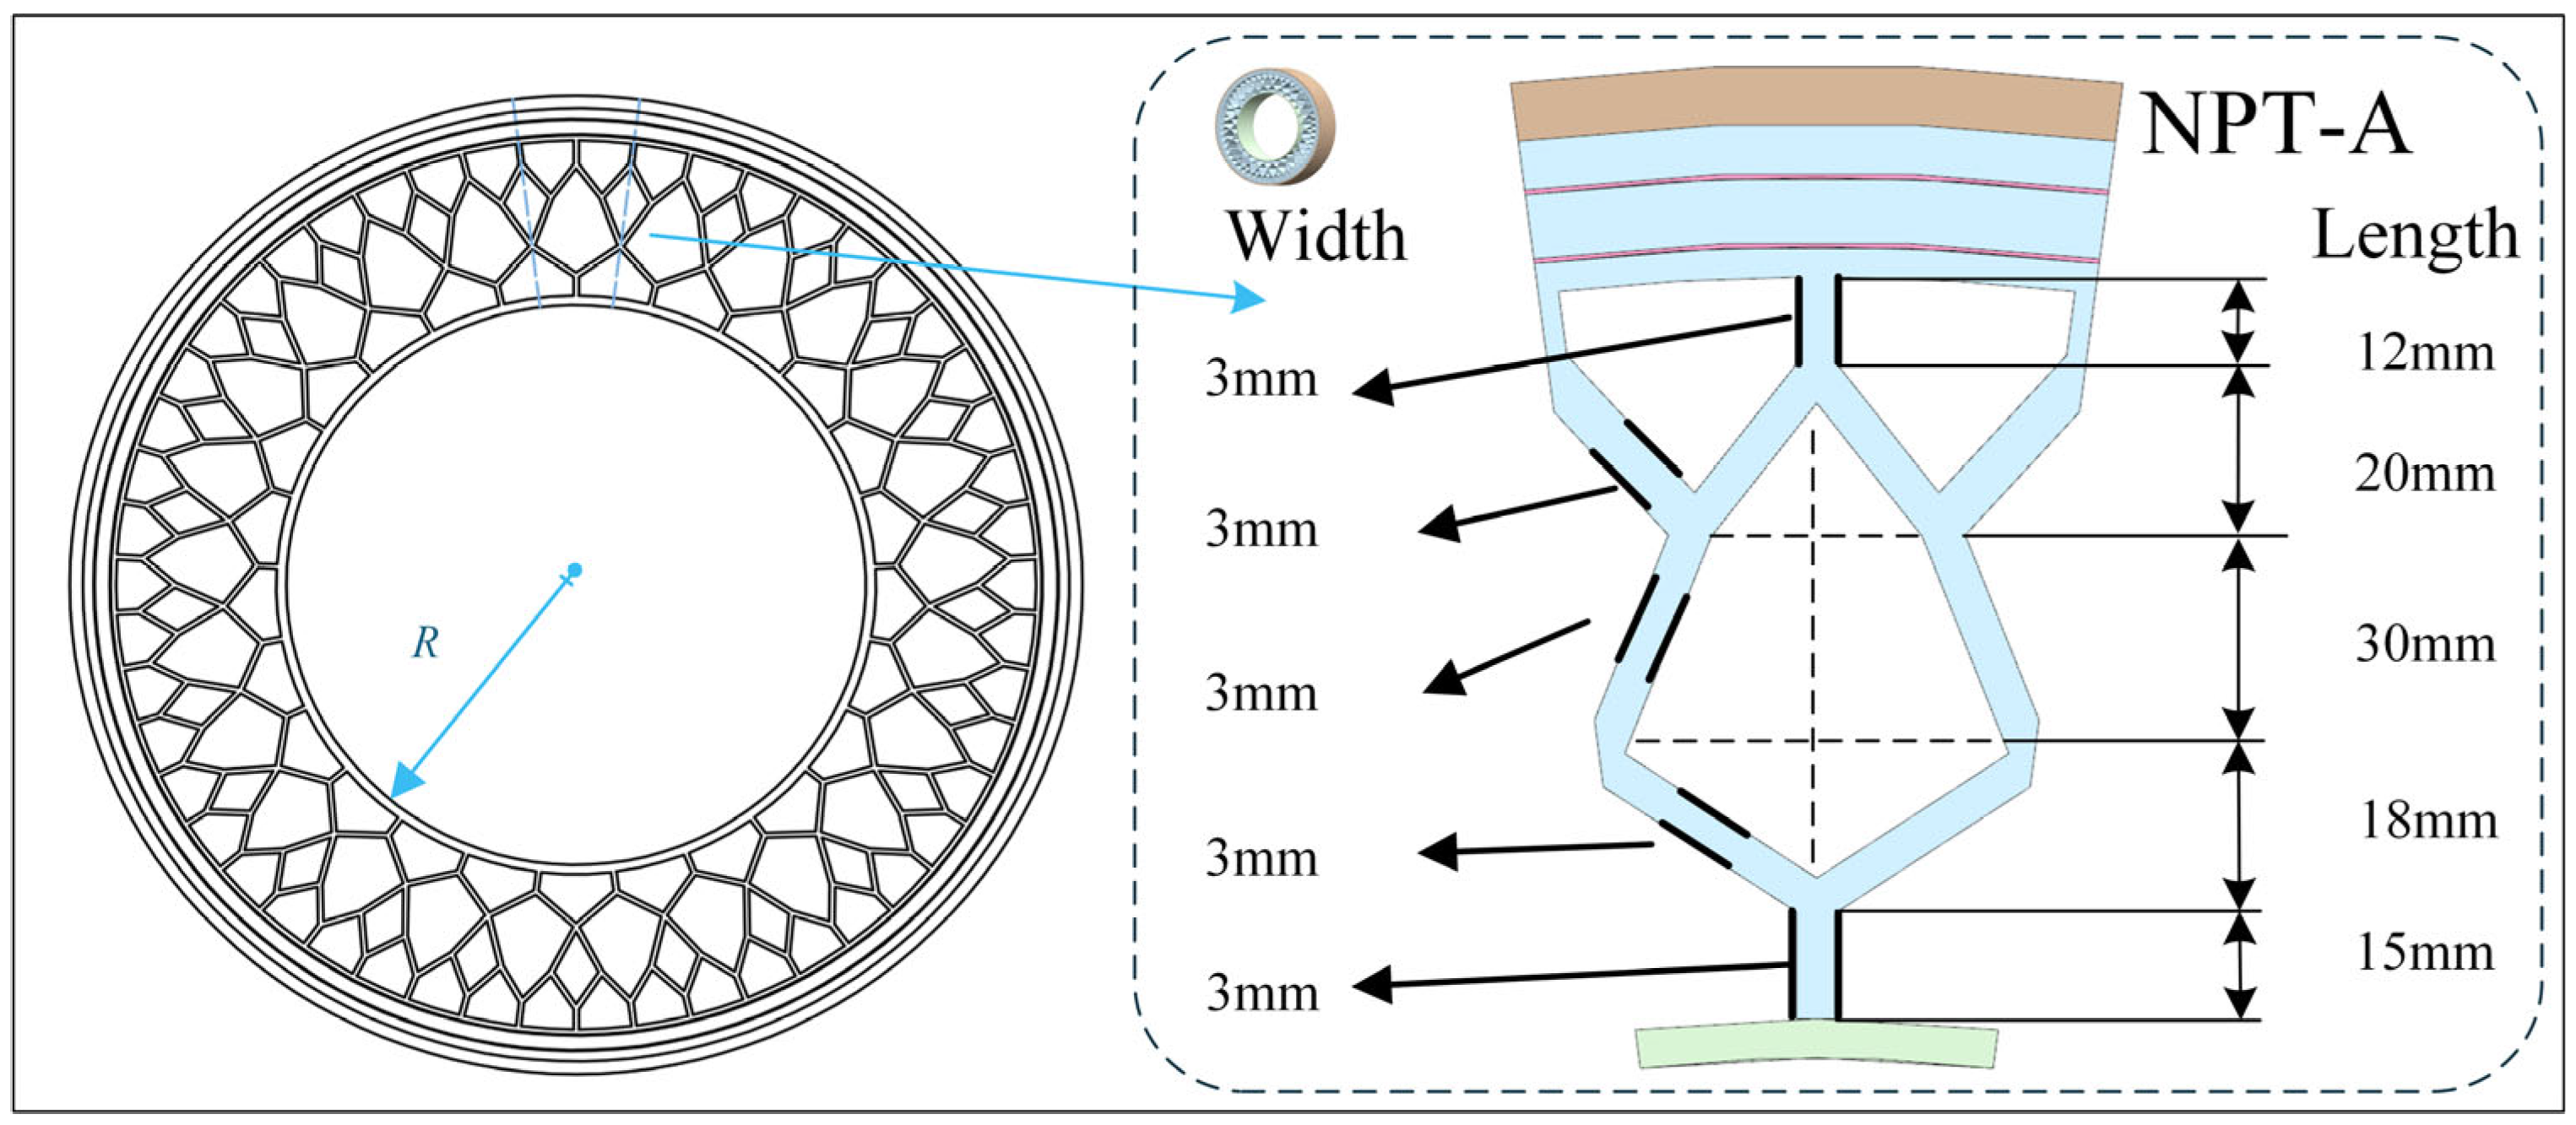
Based on the research group’s previously developed innovative honeycomb-spoke non-pneumatic tire (NPT) design [24,25], this study conducts a systematic comparative structural design and simulation analysis targeting the application requirements of 175/70 R14 specification tires. First, a three-dimensional parametric model of the tire was constructed using commercial software UG 10.0 (Unigraphics). Then, refined meshing was carried out with HyperMesh 2020 software, and the final model was imported into Abaqus for finite element analysis. Figure 5 and Table 3 illustrate the basic components and structural parameters of the honeycomb NPT, which primarily include the tread layer, outer cover layer, shear band layer, reinforcement layer, inner cover layer, honeycomb spoke layer, and rim. Among them, the spoke layer—composed of 25 basic honeycomb units—serves as the critical component for load-bearing and energy absorption. The structural design parameters of this layer play a decisive role in the overall mechanical performance of the tire. The initial honeycomb unit of the NPT is shown in Figure 6.
In terms of material parameter settings, based on previous research findings, this study adopted linear elastic material models to characterize the mechanical behavior of the rim (AI 7075-T6, Jiangsu Lichang Metal Products Co., Ltd., Wuxi, China) and the reinforcement layer (ANSI 4340, Shanghai Longji Mould Material Co., Ltd., Shanghai, China), with detailed parameters listed in Table 4 [26]. Taking into account both computational efficiency and convergence requirements for mesh remeshing, the tread layer is also modeled as a linear elastic material for simplification. Within the range of operating conditions addressed in this study, a qualitative analysis of wear mechanisms remains feasible [15]. For key functional components—including the honeycomb spokes, shear band layer, and inner and outer cover layers—the Ogden hyperelastic constitutive model was employed to accurately describe the nonlinear behavior of polyurethane (PU) materials (see Table 5 for material parameters). The use of PU in the spoke structure ensures sufficient load-bearing capacity of the non-pneumatic tire, while its resilient characteristics allow it to functionally substitute for the inflation medium in conventional pneumatic tires.

3.2. Establishment and Validation of the NPT Model

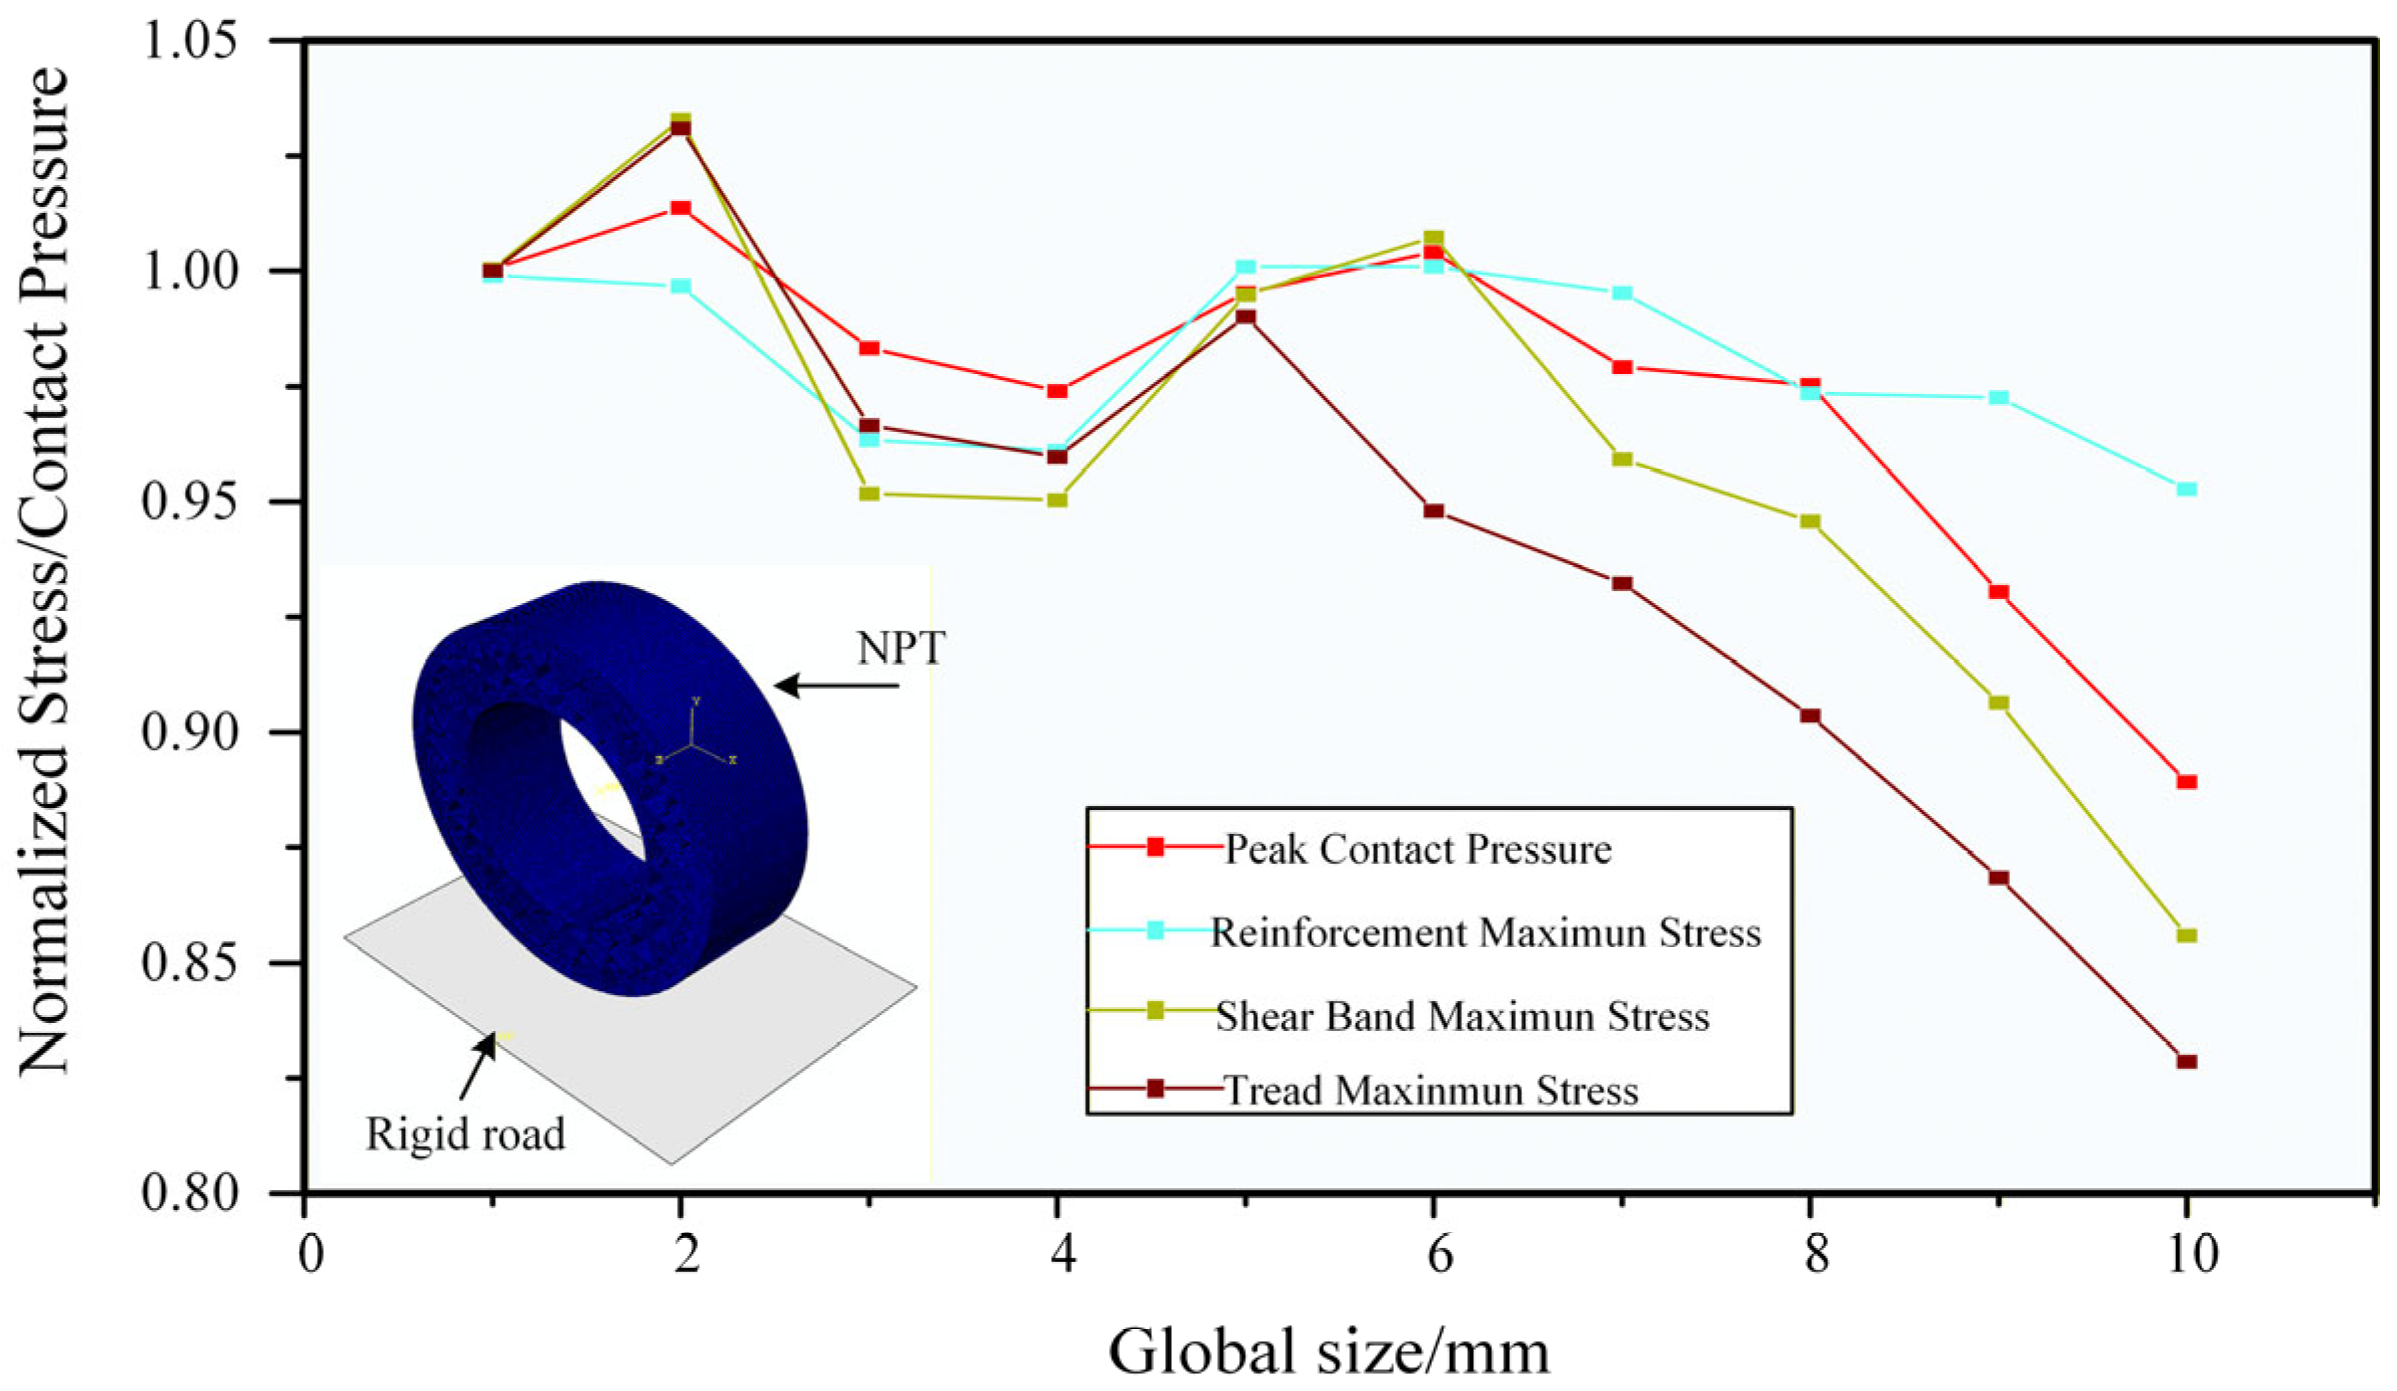
This study focuses on investigating the wear characteristics of non-pneumatic tires (NPTs), with a baseline validation system established through radial stiffness testing. In the finite element modeling process, radial stiffness was selected as the key validation metric, considering that tire wear primarily occurs in the radial contact region. To improve computational efficiency while maintaining accuracy, the NPT model was reasonably simplified based on relevant literature [25]. The simplifications included neglecting the friction between contact components and excluding the influence of tread patterns, as well as the associated local wear modes and edge wear behavior, with the analysis focusing on overall contact pressure and macroscopic stress responses. Figure 7 examines the peak contact pressure and maximum stress in various regions of the NPT under different mesh sizes, ranging from 10 mm down to 1 mm. Normalized analysis revealed that the variation in both contact pressure and maximum stress across different mesh sizes did not exceed 20%, and the error was nearly negligible when using a 5 mm mesh. Considering both computational accuracy and cost, a mesh size of 5 mm was ultimately selected for subsequent simulation analyses.
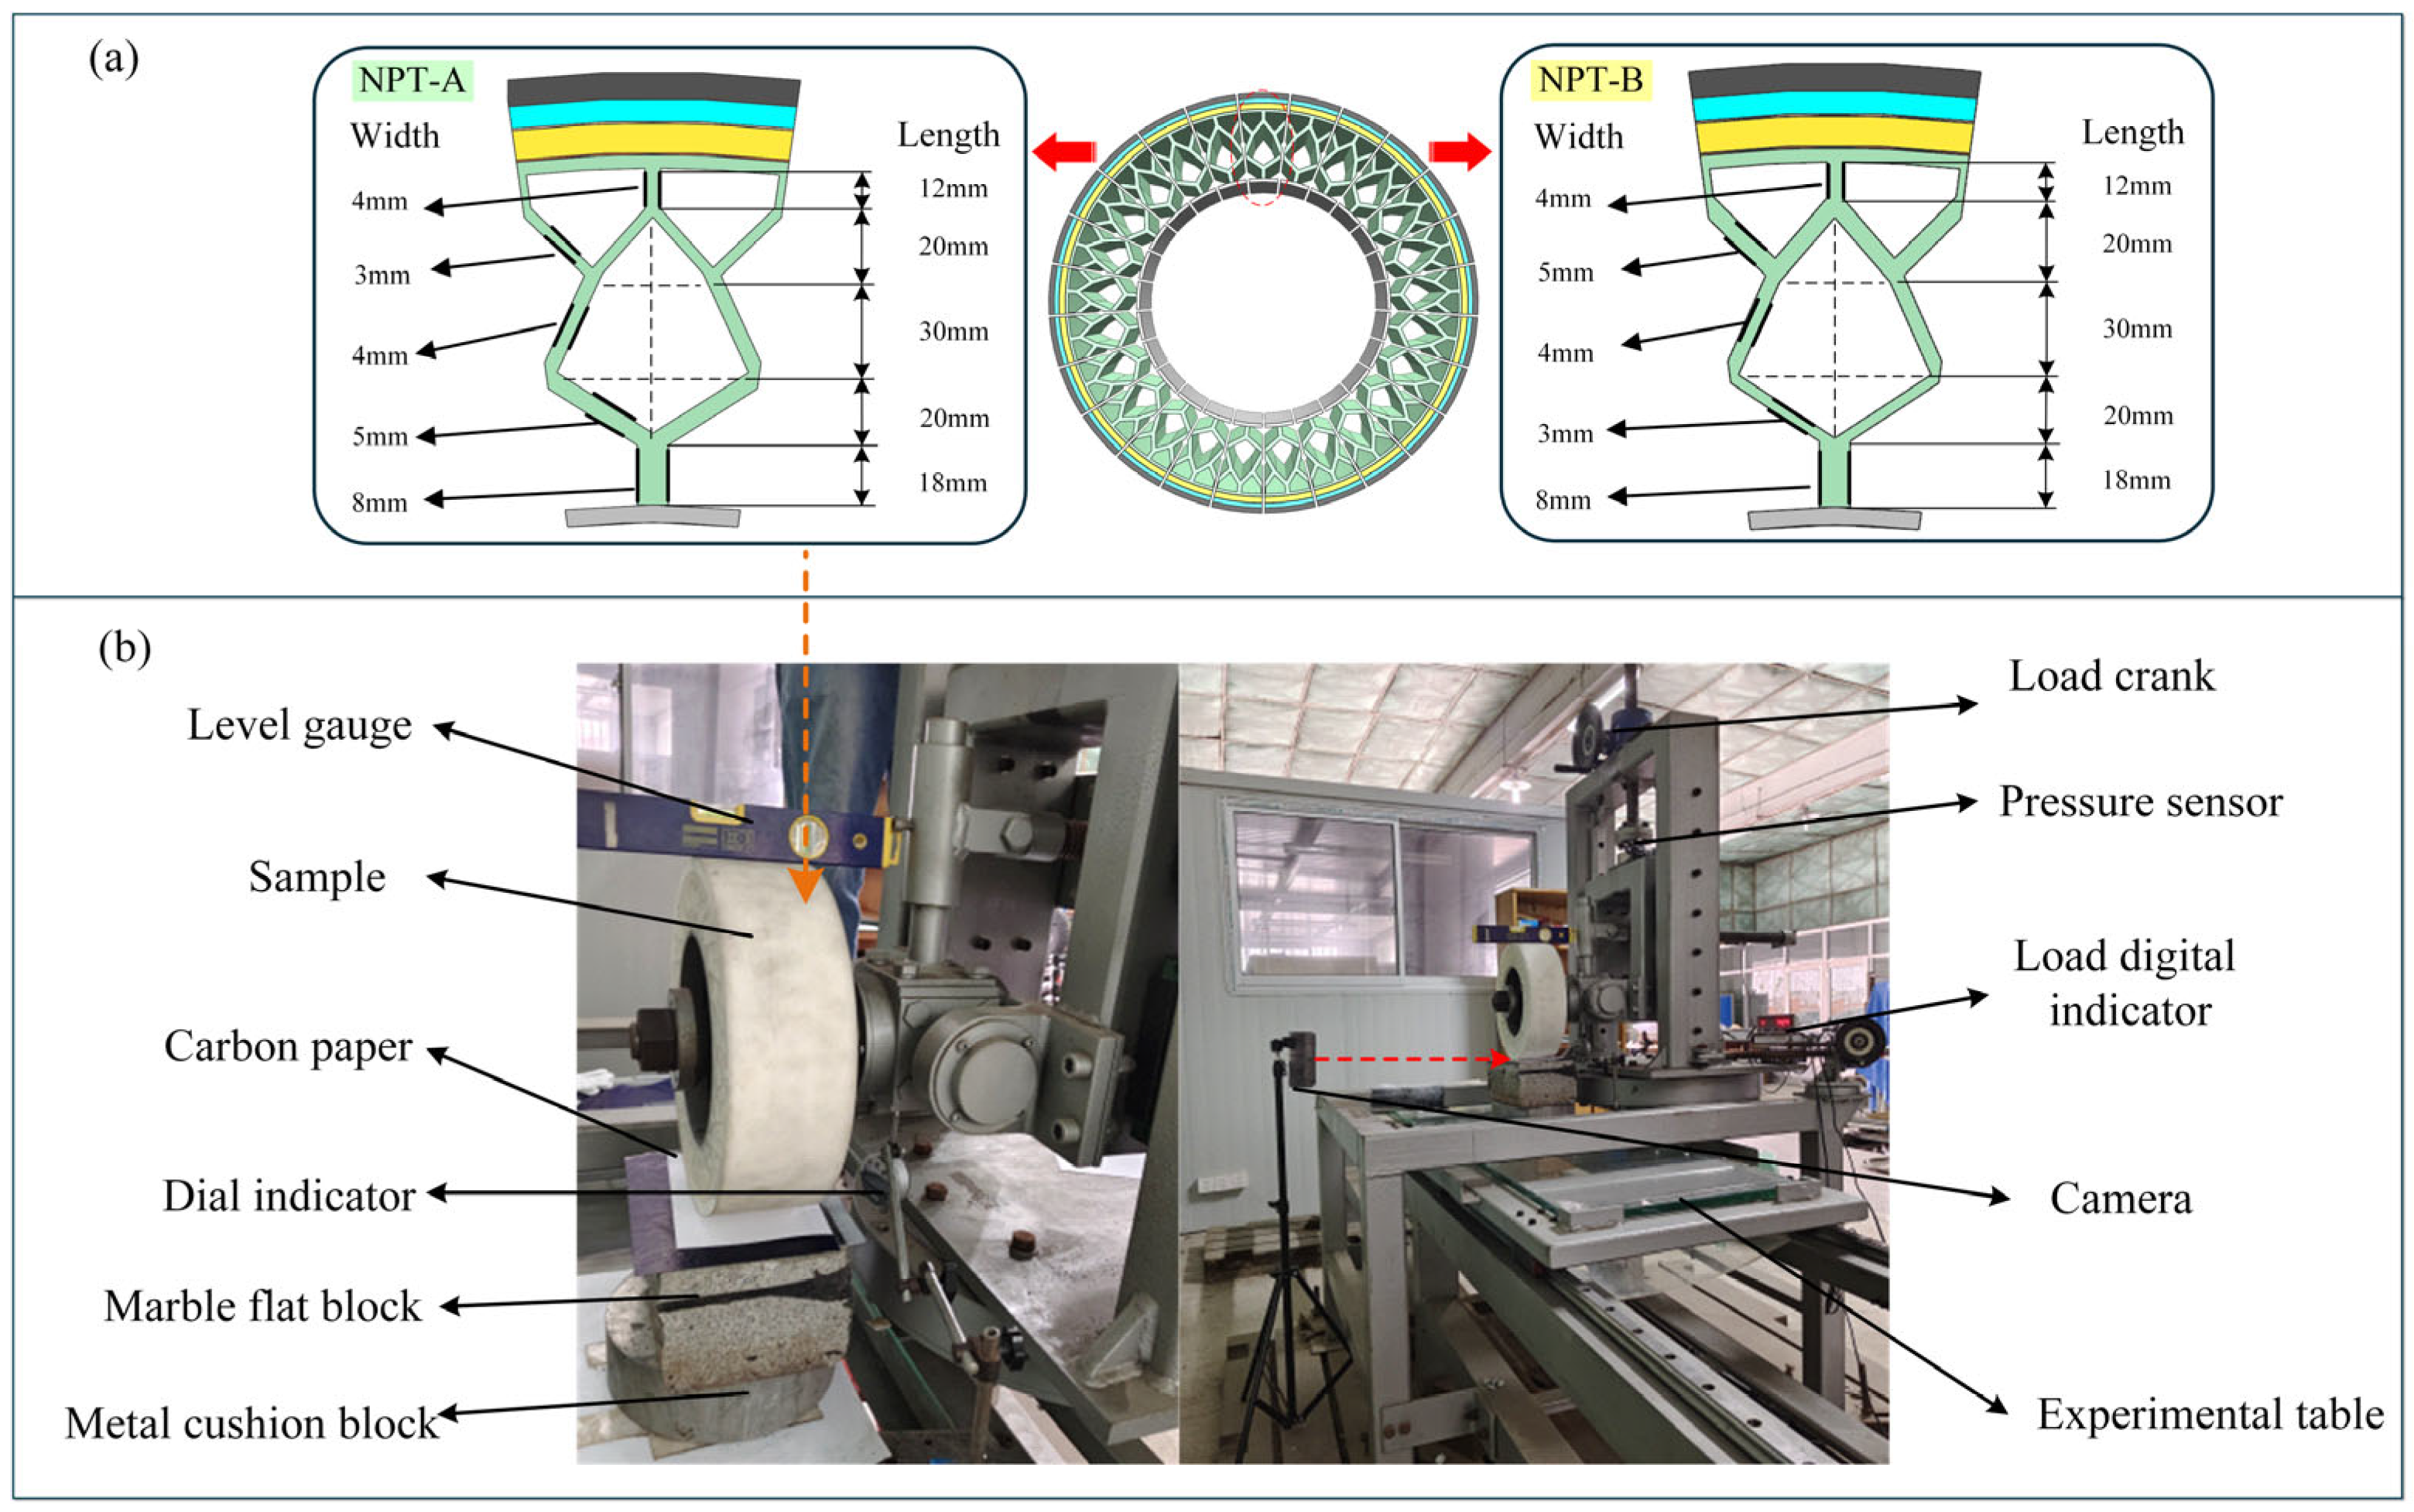
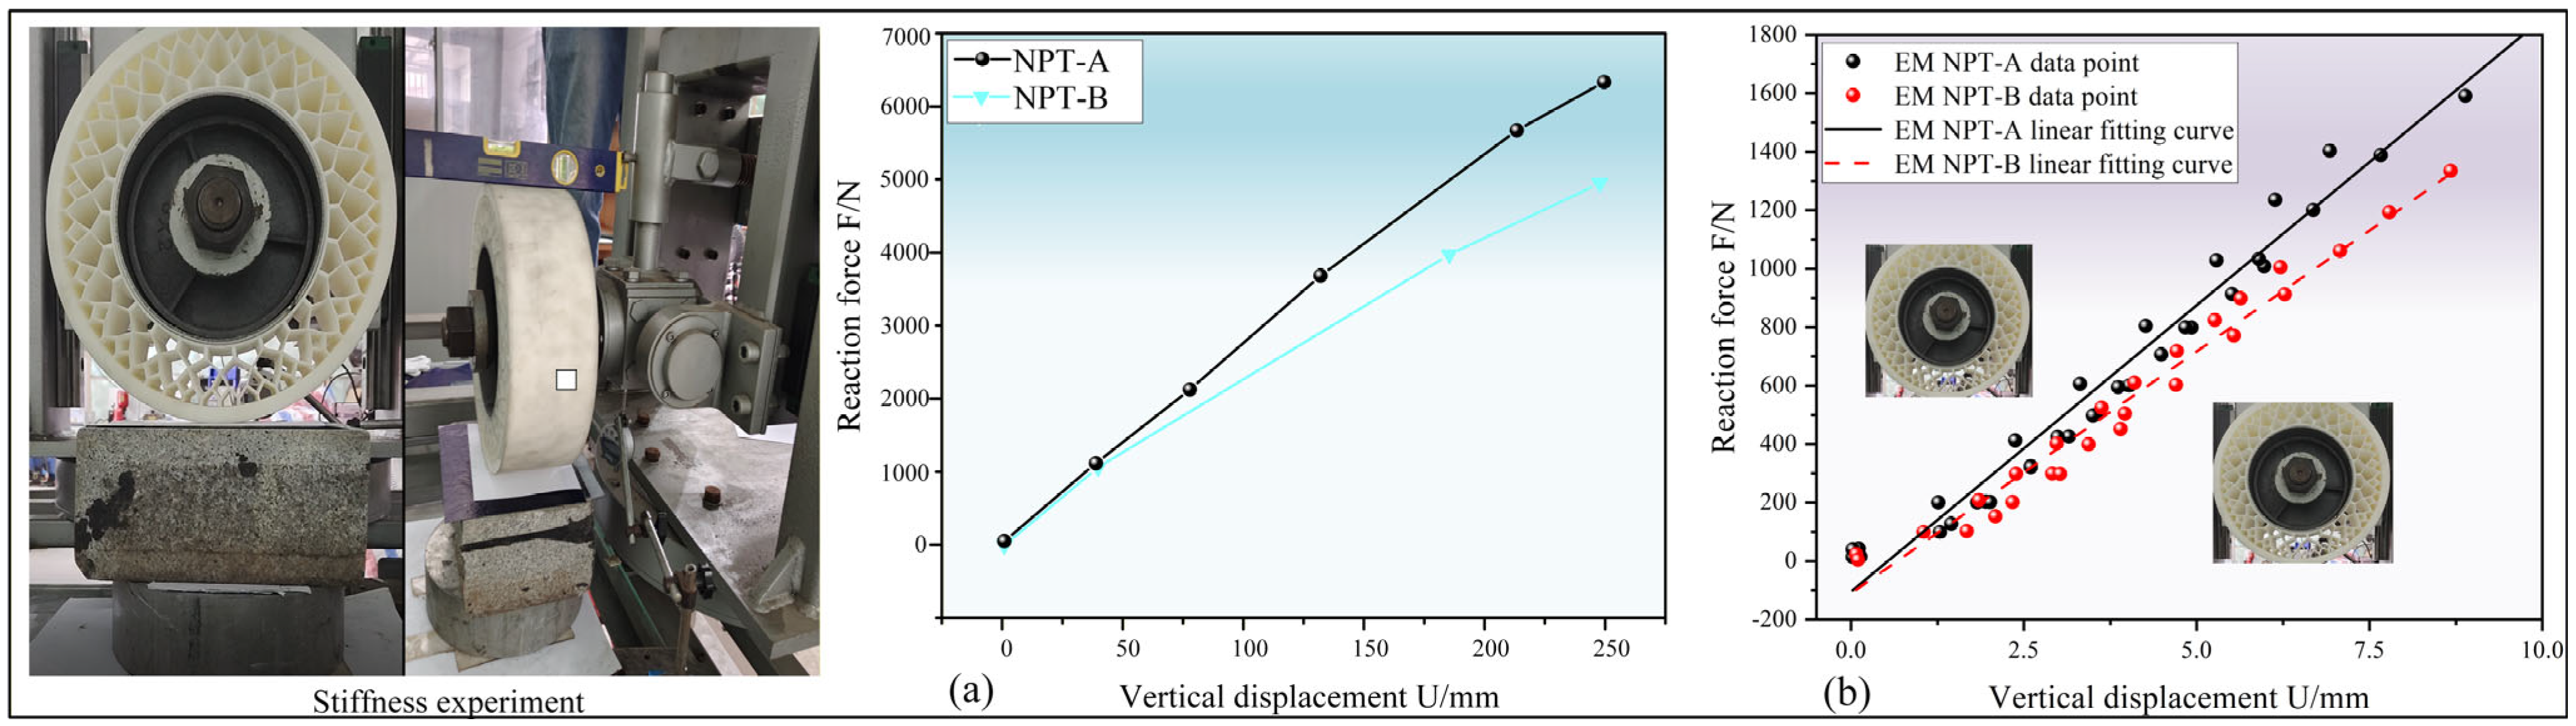
To verify the accuracy of the finite element simulation method, the research team established two NPT finite element models with different spoke thicknesses (NPT-A and NPT-B, with specific parameters shown in Figure 8a). Additionally, 1:2 scale NPT prototypes were fabricated using 3D printing technology. Considering manufacturing costs, the rim was made of cast iron, while the spokes and tread were fabricated using resin materials. A custom-built testing platform developed by the research group (Figure 8b) was used to conduct systematic radial stiffness tests on the two sets of prototypes. Both simulation and experimental results demonstrated that during radial loading, the vertical displacement of NPT-A and NPT-B increased approximately linearly with the applied load (Figure 9). The radial stiffness of NPT-A was consistently higher than that of NPT-B. This finding was confirmed by the experimental results in Figure 9b, where the measurements from the physical samples (EM NPT-A and EM NPT-B) exhibited the same trend—EM NPT-A also showed higher radial stiffness than EM NPT-B throughout the loading range.
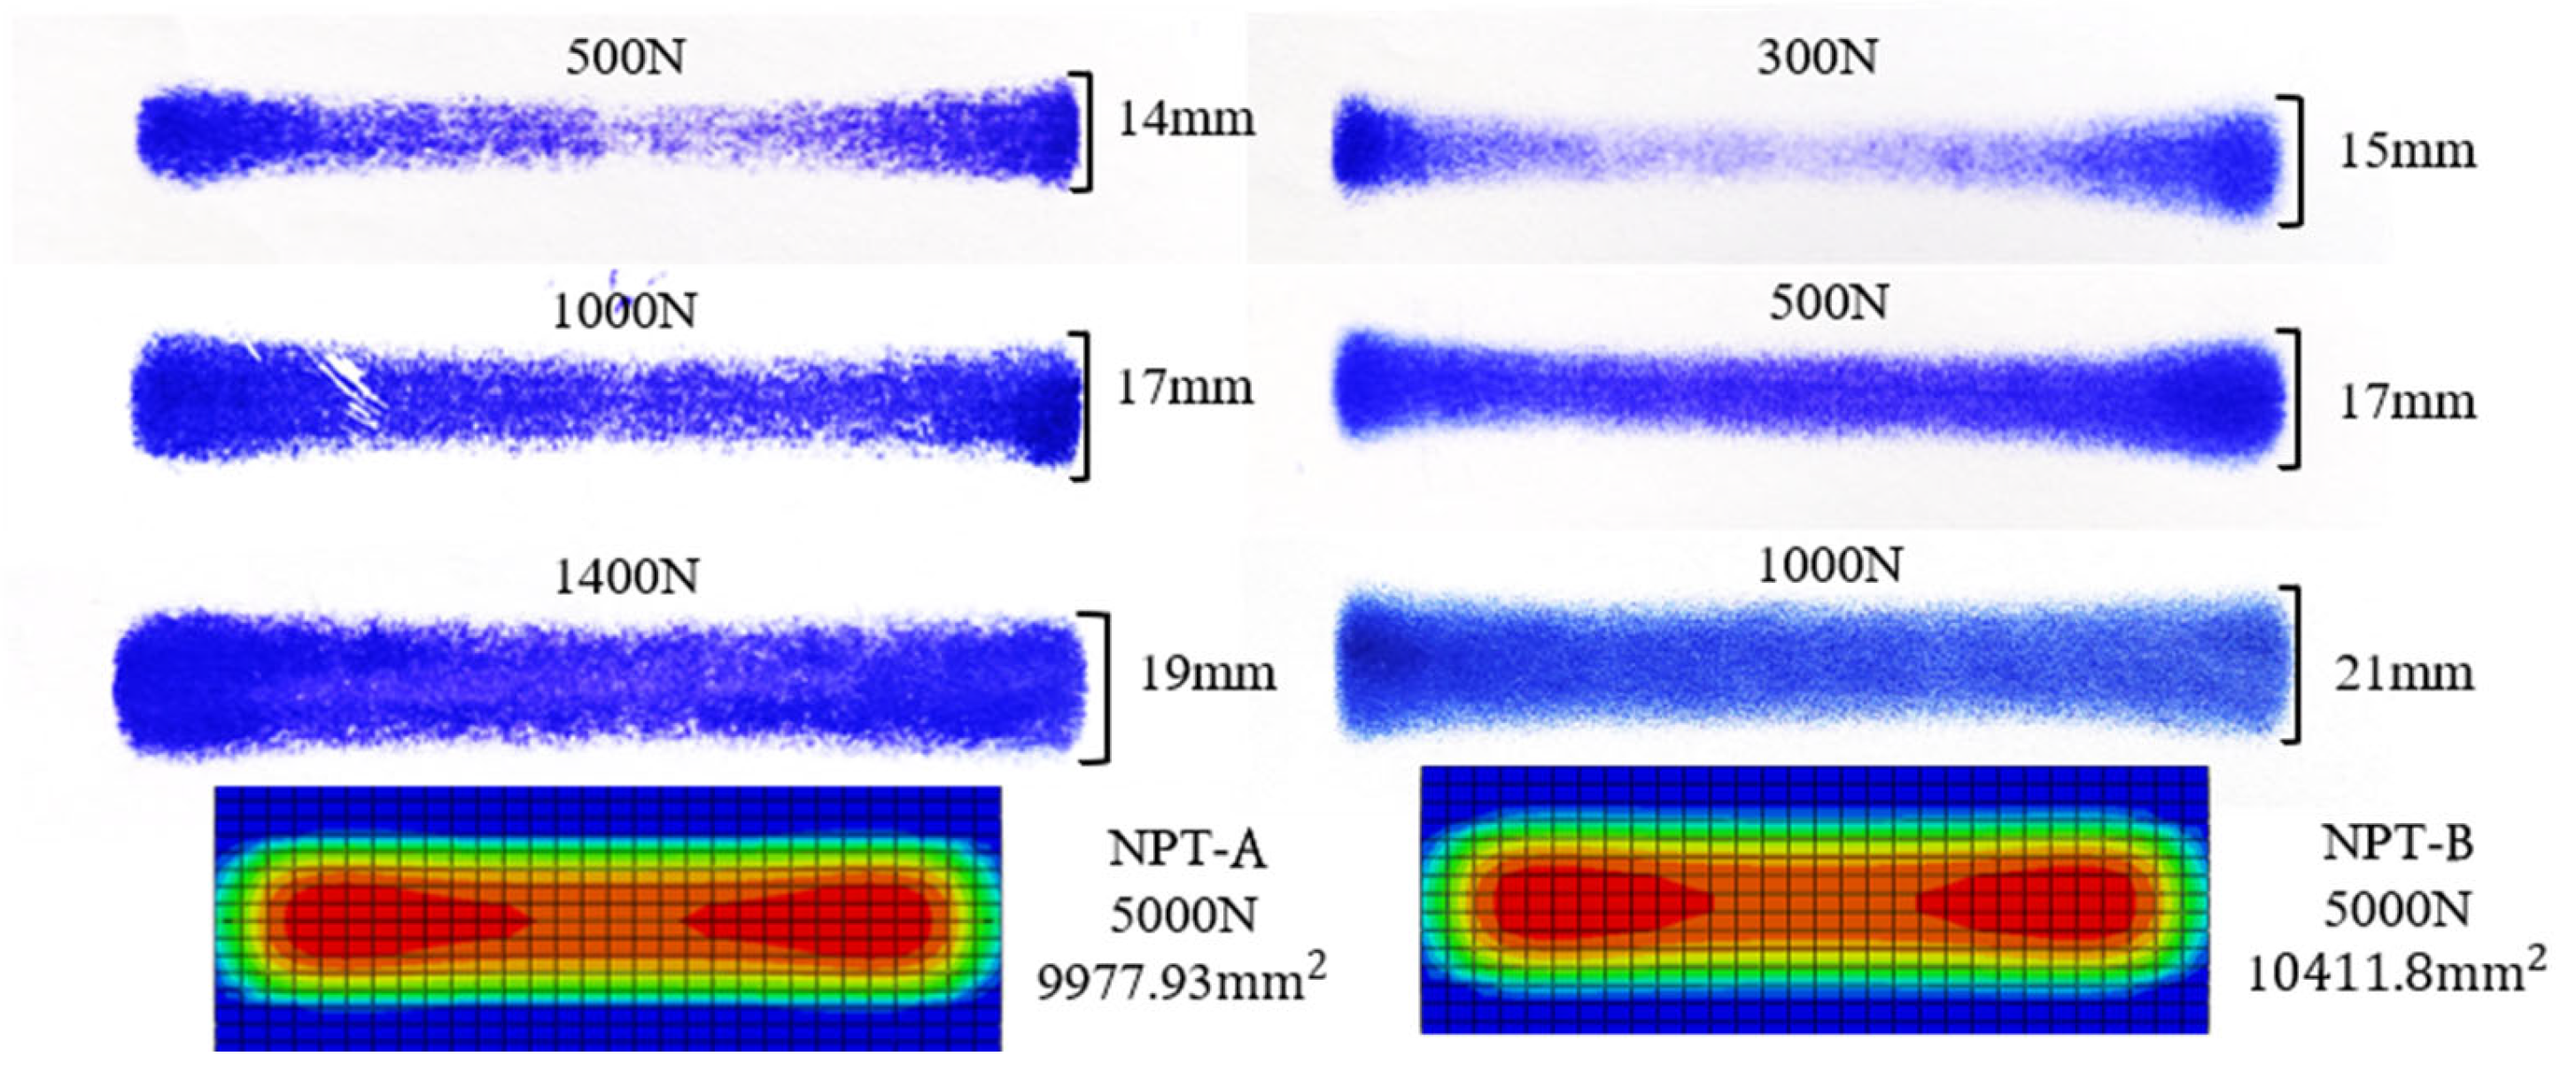
The contact characteristics of tires are critical factors affecting their wear performance. In this study, carbon paper was used to imprint the static contact patches of NPT samples with different spoke thicknesses under various loading conditions, and the results were compared with finite element simulations, as shown in Figure 10. During the static loading process, both the contact width and contact area of the two NPTs increased with the applied load. The experimental and simulated contact patches exhibited a similar “wider-at-shoulders, narrower-in-the-center” pattern, indicating higher pressure at the shoulders and lower pressure at the center. Since the tire width was the same for both samples, the contact patch lengths were also identical. It was observed that under the same load, the contact patch width of NPT-A was smaller than that of NPT-B, suggesting that the contact area of NPT-A was also smaller. This trend was confirmed in the simulation: under a 5000 N load, the contact patch area of NPT-A was 9977.93 mm2, while that of NPT-B was 10,411.8 mm2. These results indicate that NPT-A has a smaller contact area than NPT-B under identical loading conditions. The good agreement between experimental and simulation results validates the accuracy of the simulation method and its predictive capability.
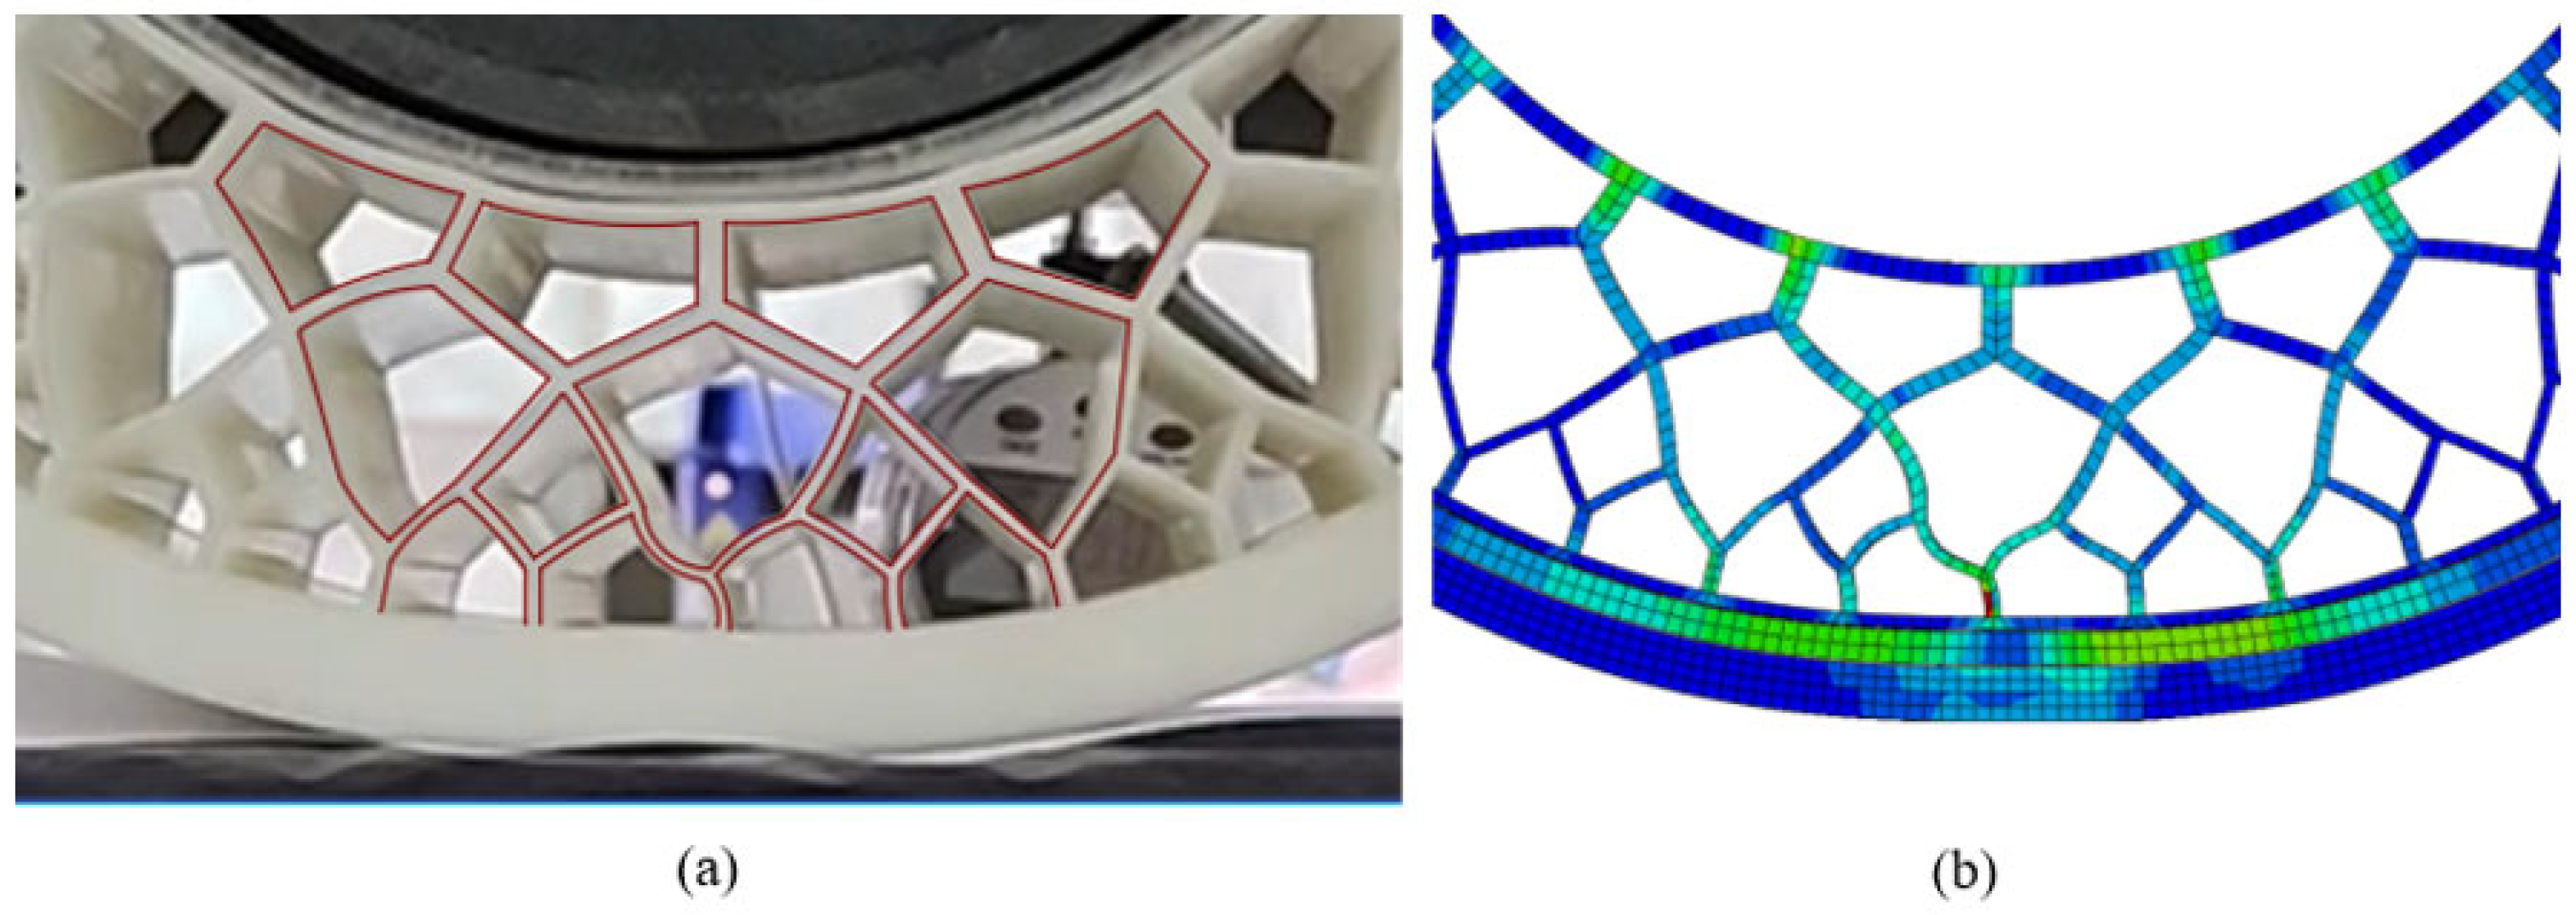
Non-pneumatic tires (NPTs) utilize a spoke structure to replace the inflatable portion of traditional pneumatic tires, making the spoke design a critical component for structural support [27]. In this study, high-definition video recording was employed during the radial stiffness test to capture the deformation behavior of the test samples, which was then compared with the corresponding simulation results (Figure 11). As shown in Figure 11, the spoke structures in the tire–road contact region experienced significant deformation under load due to their support function. In particular, the honeycomb spokes exhibited the greatest deformation near the junction with the tire body (i.e., the spoke root region). The deformation patterns observed in the experimental tests were consistent with those obtained from the simulations, further confirming the accuracy and reliability of the finite element analysis results.

4. NPT Wear Simulation Analysis

4.1. Compilation of the NPT Wear Subroutine

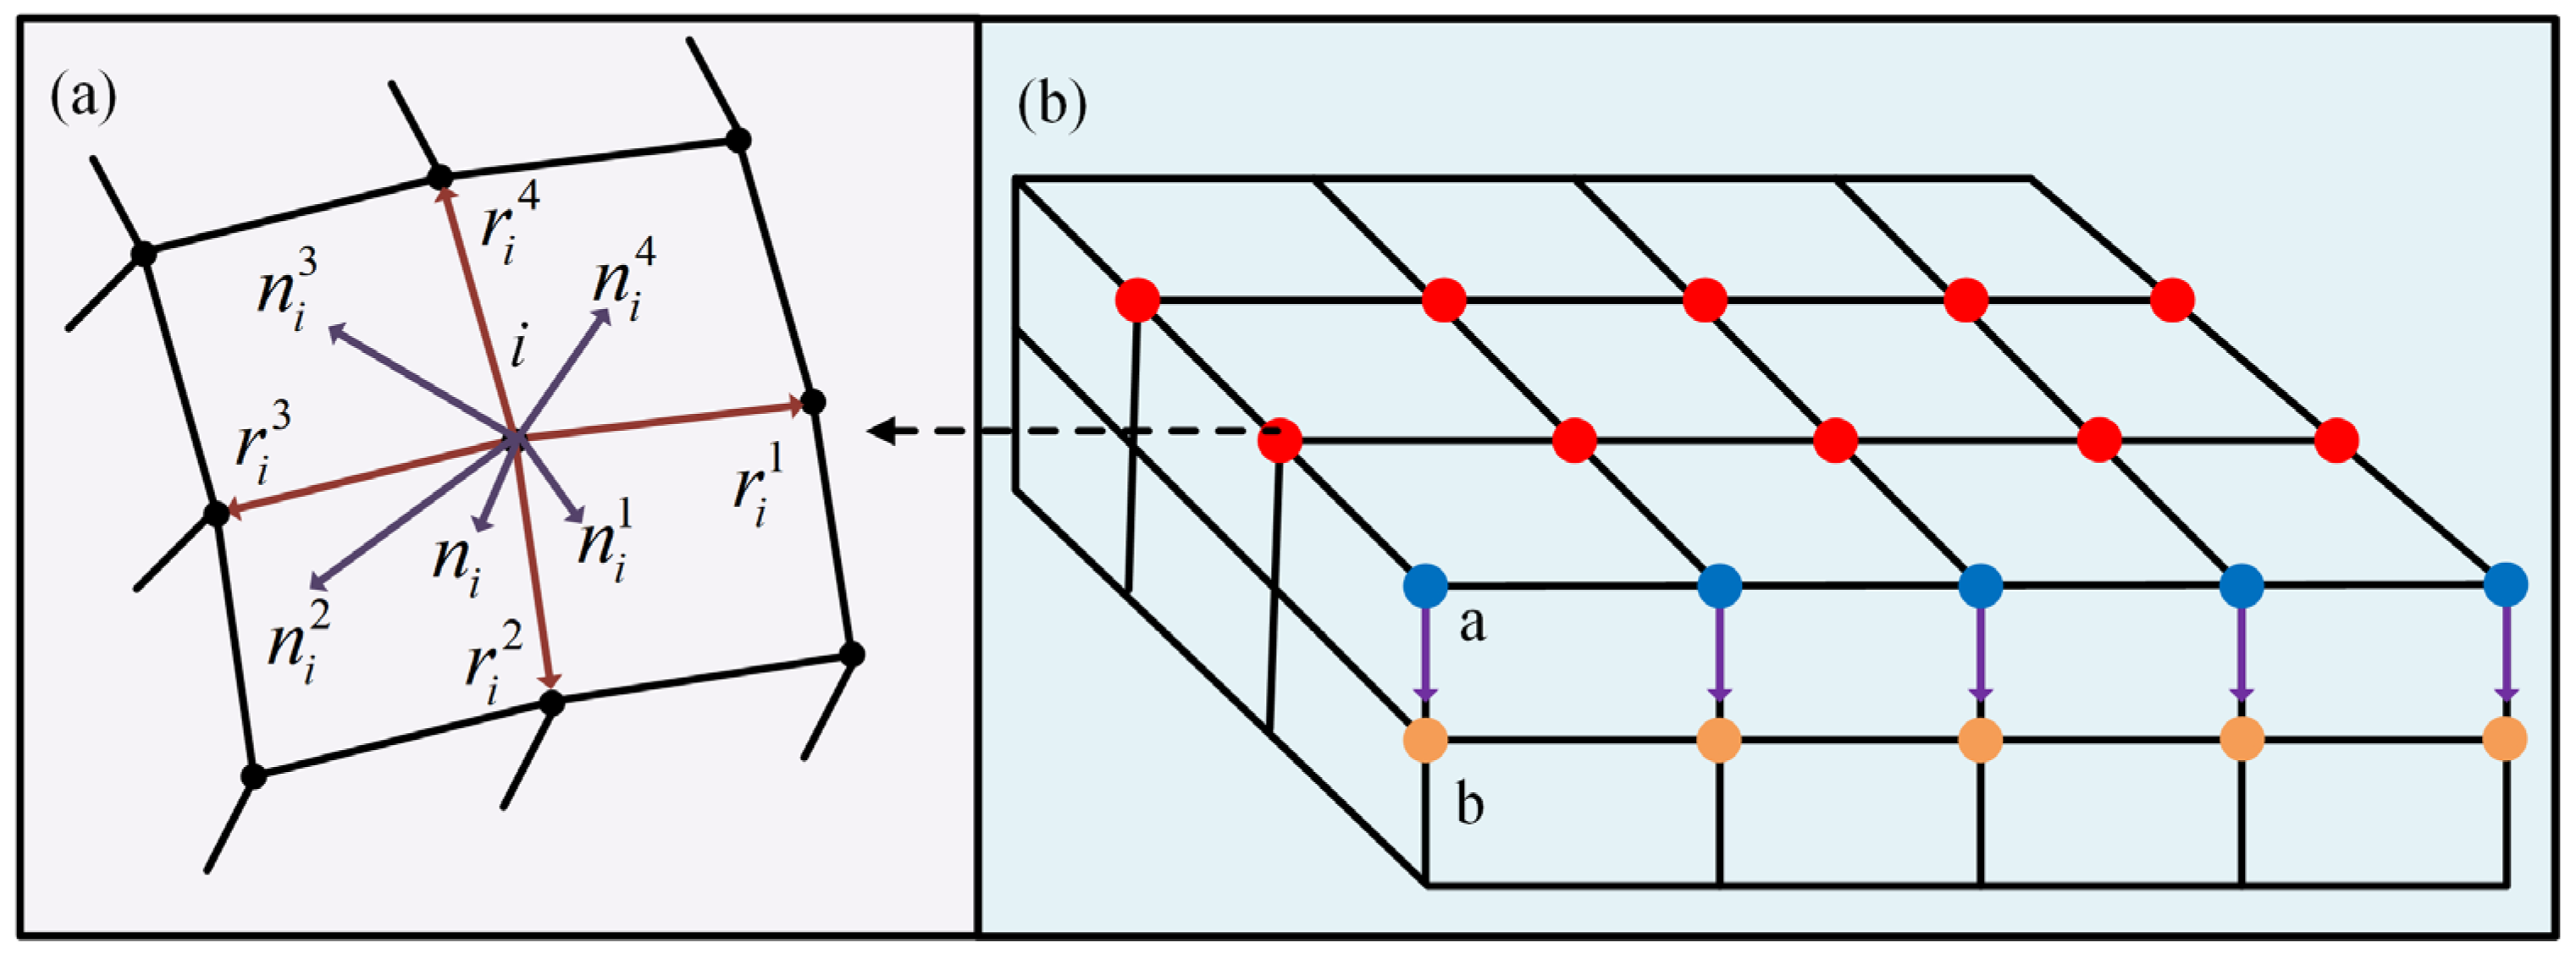
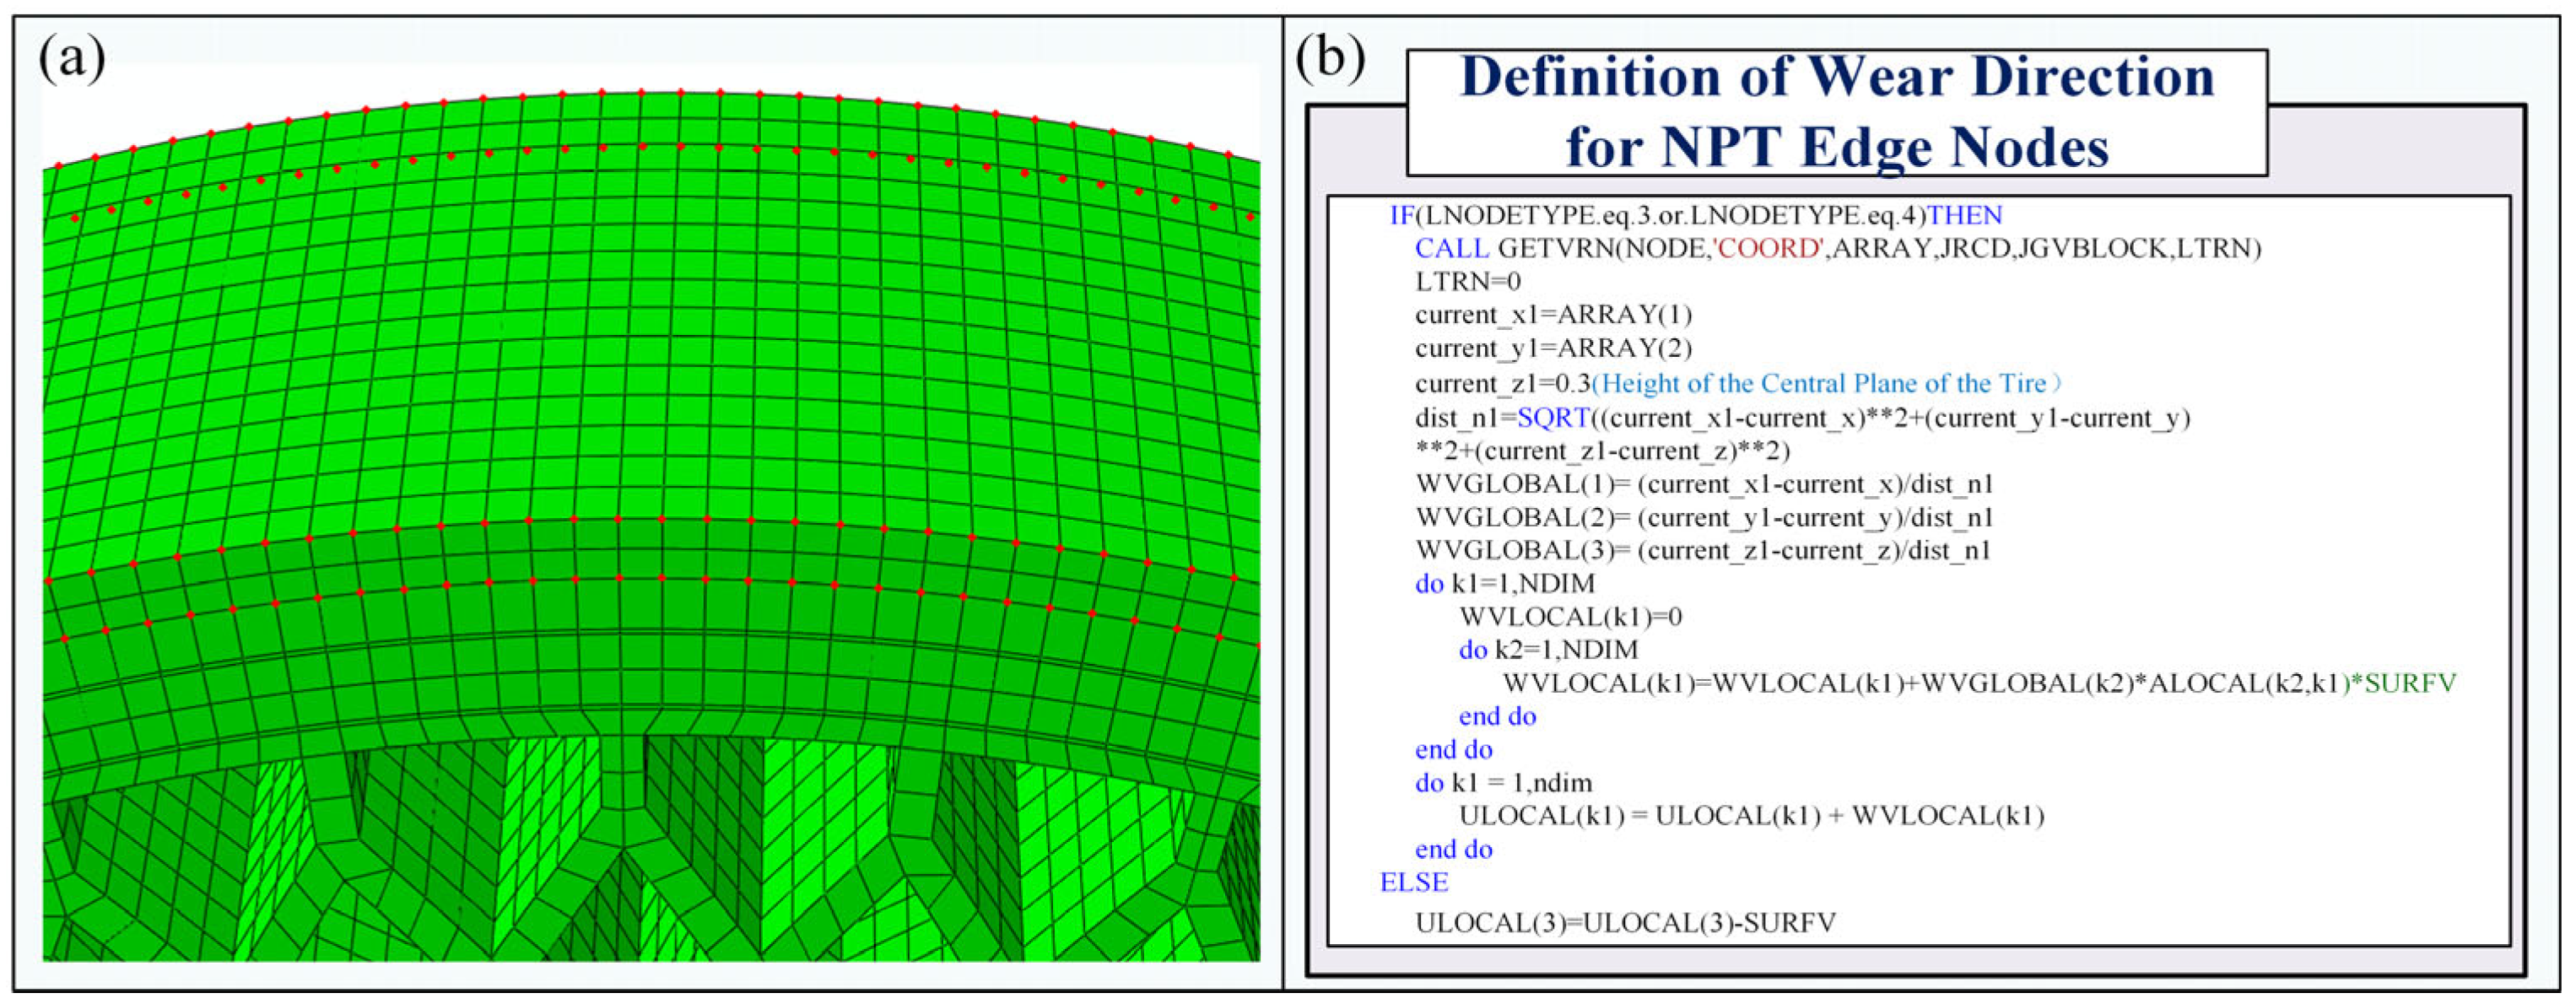
As previously described, the complexity of tire wear analysis lies primarily in the treatment of tread contact nodes, which requires the specification of wear directions through user subroutines. Wear nodes refer to all nodes located at the contact interface between the tire tread and the ground, and they must be classified into internal nodes and edge nodes due to the differing definitions of their respective wear directions. For internal nodes, the wear direction is defined by the average inward normal direction of the adjacent elements, as illustrated in Figure 12a. In contrast, for edge nodes, the wear direction is directly defined within the user subroutine, as shown in Figure 12b, where the vector from point a to point b represents the wear direction assigned to edge node a. For non-pneumatic tires, the identification and handling of edge nodes on the tread surface pose unique challenges. As shown in Figure 13a, edge nodes (marked in red) detected in the Abaqus simulation are distributed along both sides of the tread. With a mesh size of 5 mm, each side contains approximately 700 edge nodes. Traditional methods based on node number assignment are insufficient for efficiently handling such a large number of edge nodes in wear simulations. To address this issue, this study introduces an innovative smart recognition algorithm based on node type identifiers (LNODETYPE). By incorporating conditional statements in the UMESHMOTION subroutine, edge nodes can be automatically identified and subjected to directional wear control, as illustrated in Figure 13b. Specifically, when the UMESHMOTION subroutine detects that the node type identifier LNODETYPE equals 3 or 4, the system automatically recognizes the node as an edge node and activates the projection-based wear direction algorithm. The GETVRN subroutine is first called to obtain the three-dimensional spatial coordinates of the current edge node (ARRAY (1:3)). Then, the projected position of the node on the contact plane is computed. Based on this projection, a unit direction vector from the node to the projection point is constructed, accurately representing the geometric wear direction. To ensure physical consistency, this direction vector in the global coordinate system is transformed into the local contact coordinate system using the transformation matrix ALOCAL, thereby enabling wear to be applied to edge nodes along the projected direction.

4.2. Establishment of the NPT-Road Wear Simulation Model

The focus of this paper is to investigate the wear simulation methods and wear mechanism analysis of Non-Pneumatic Tires (NPT). However, considering the large computational load, numerous wear nodes, and long simulation periods involved in solving thermal-mechanical coupling problems with ABAQUS, the finite element model of the tire has been appropriately simplified in this study: Specifically, the internal heat generation caused by viscoelastic hysteresis was neglected, and only the frictional heat at the treadroad interface was considered as the primary contributor to wear. In addition, the influence of tread pattern geometry was omitted by adopting a smooth tread surface to improve computational stability and efficiency. Following the modeling strategies proposed in relevant literature [28], the tire model was reduced to one-quarter of its original width for qualitative analysis. Furthermore, to accelerate the geometric evolution process and enhance the observability of the wear response, while avoiding the issue of negligible morphological change caused by small wear magnitudes, the wear coefficient was uniformly amplified to 2 × 10⁷ in the simulation. This treatment serves as a wear amplification factor. Although it alters the absolute rate of wear evolution, it does not affect the relative trends of wear distribution, stress concentration, and other related patterns. Therefore, all wear depth, volume, and morphology evolution results obtained using this amplification factor are only intended for qualitative trend comparison and analysis of the dominant mechanisms between different operating conditions and do not have direct quantitative physical significance. This approach remains feasible and effective in parameter studies and mechanism analysis.
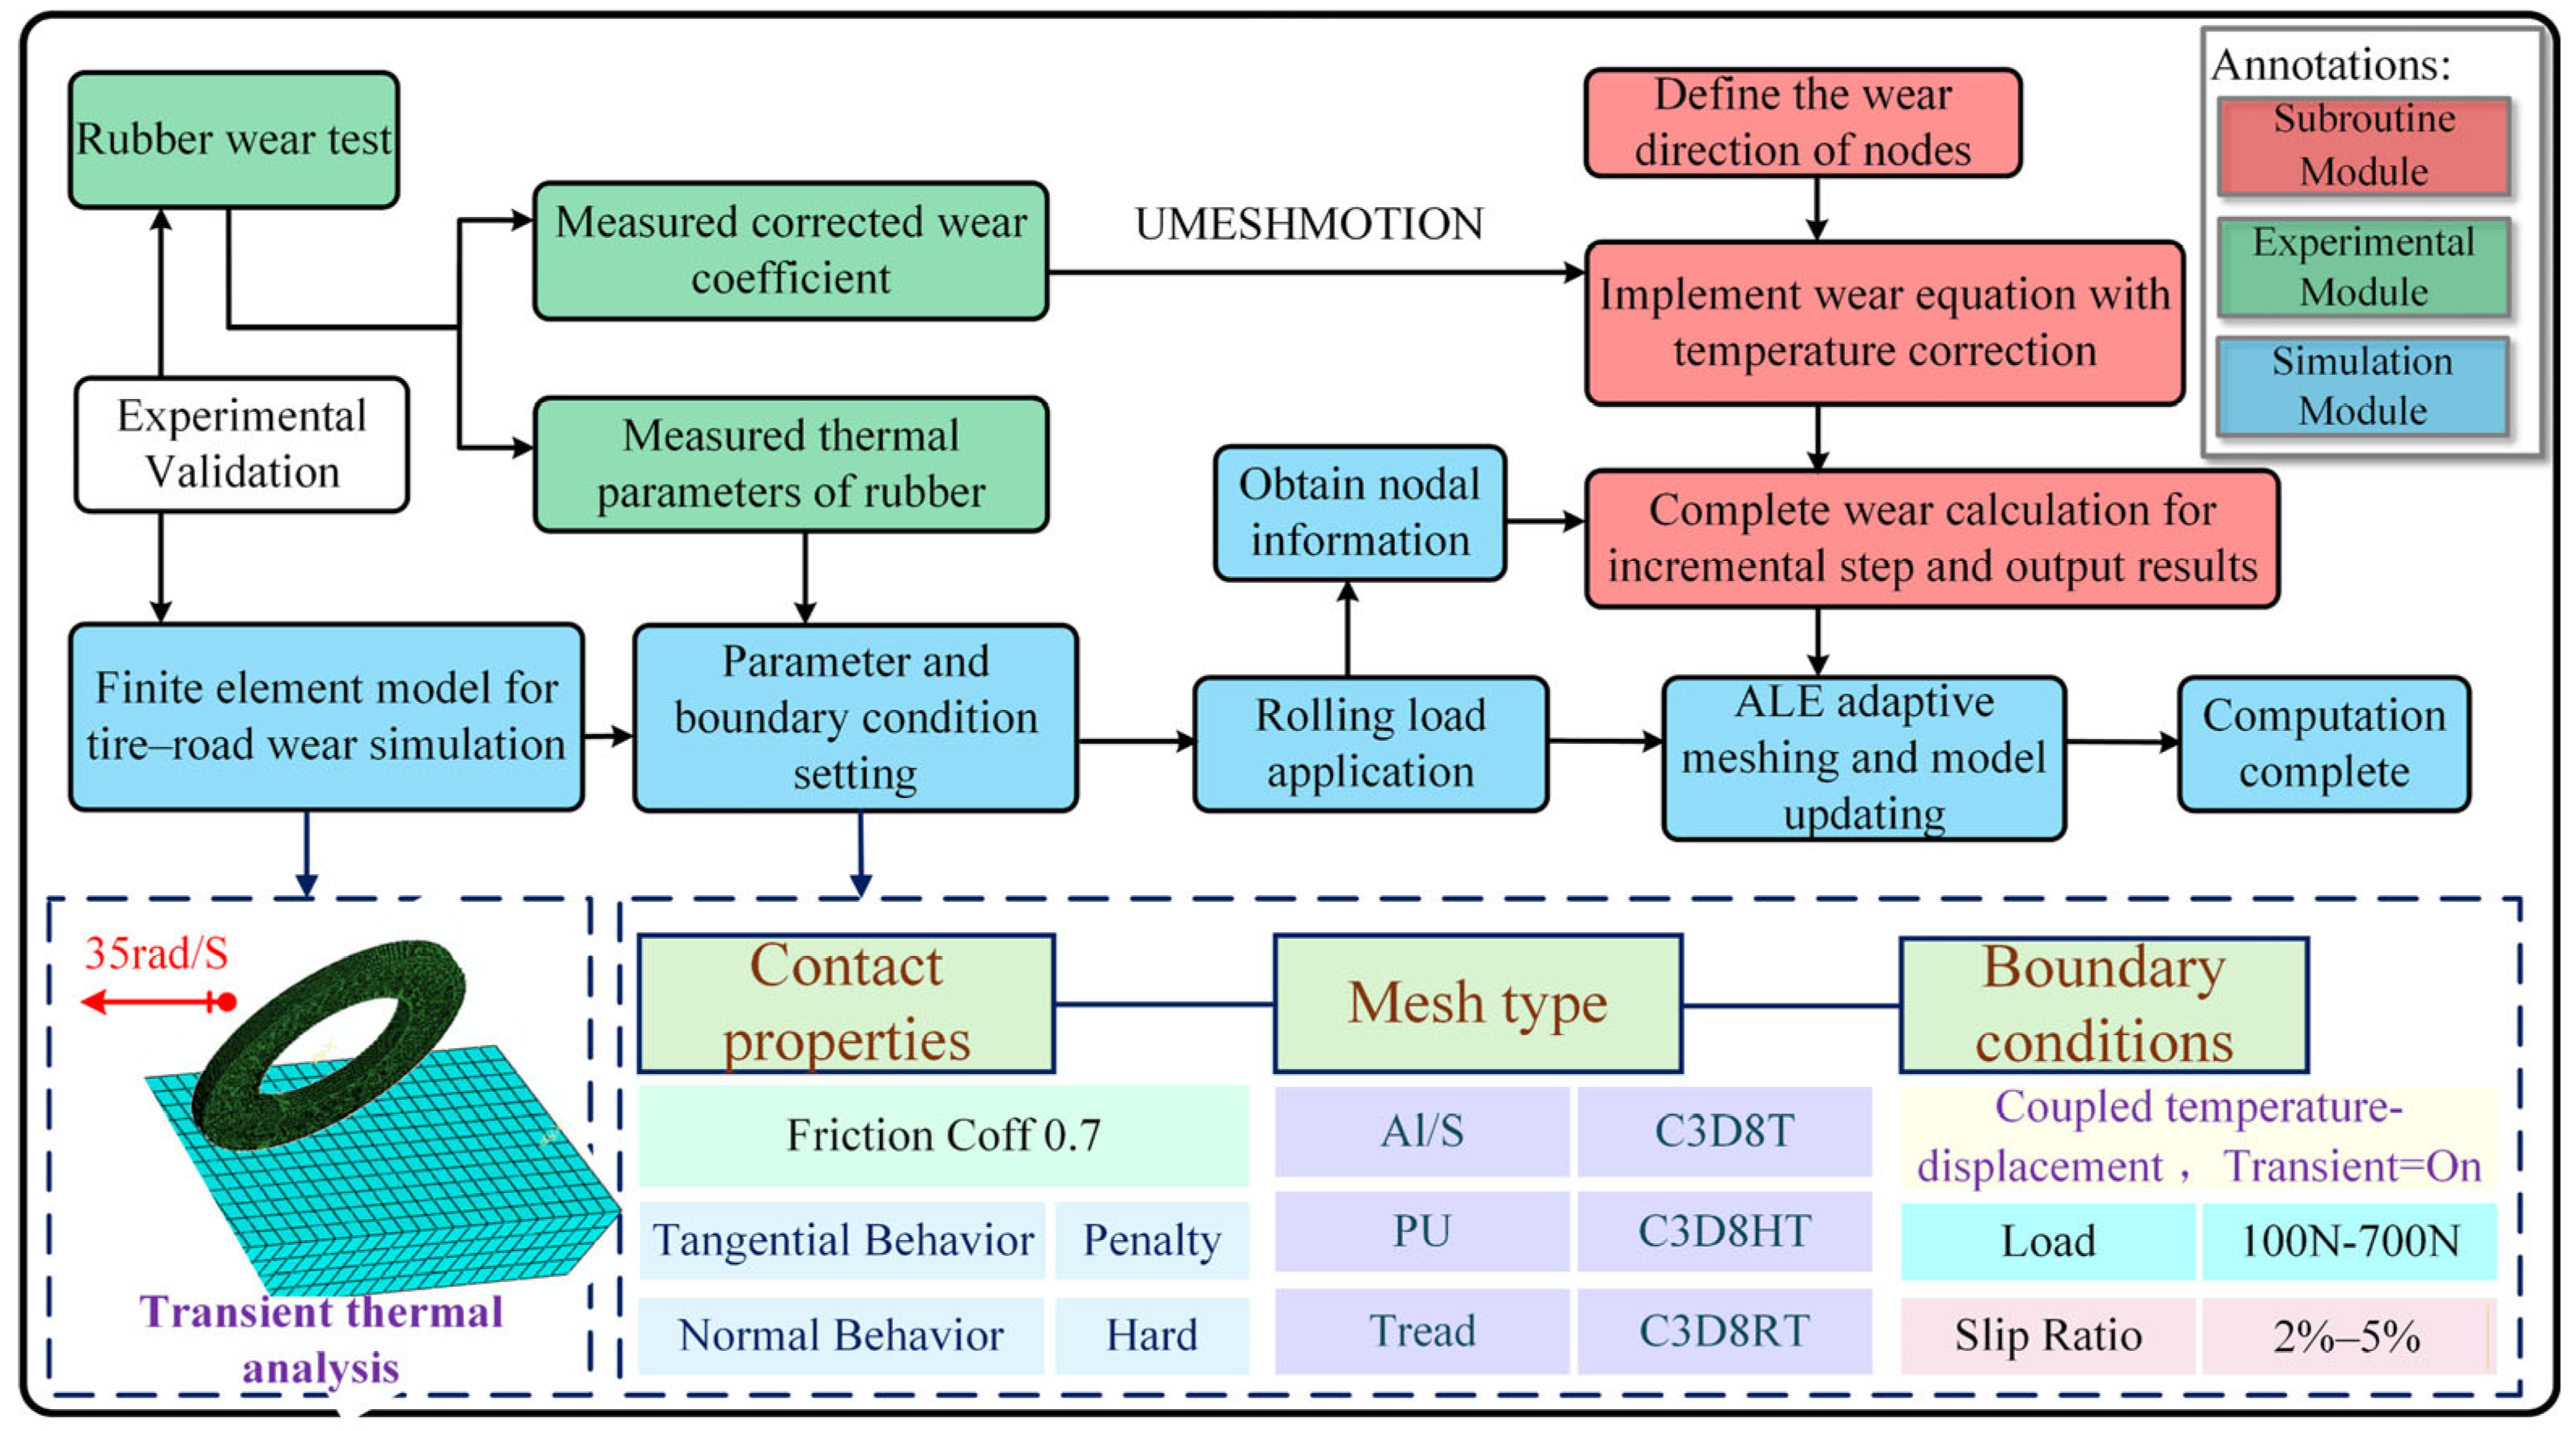
The simplified non-pneumatic tire (NPT) model has an outer diameter of 600 mm and a thickness of 43.75 mm. The road surface dimensions were determined based on the wear distance, with a length of 10 m, a width of 0.3 m, and a height of 0.1 m. Regarding material properties, the rubber parameters were set according to Section 2.2, while the rigid road was modeled using the thermal and mechanical parameters of asphalt concrete at 20 °C, as specified in the literature [29] and listed in Table 6. For mesh generation, eight-node thermally coupled hexahedral elements (C3D8RT) were used for both the tread and the road to ensure computational accuracy and avoid mesh penetration. Considering that the rubber is significantly softer than the road and undergoes large deformations, the road surface was designated as the master surface and meshed with relatively coarse elements, whereas the polyurethane (PU) components were assigned C3D8HT elements to better simulate their nonlinear mechanical behavior. In terms of analysis methodology, a transient thermo-mechanical coupled finite element method was adopted, with three sequential analysis steps: (1) displacement setup, (2) contact between the tire and the road, and (3) application of different boundary conditions (including load and slip ratio). All steps employed a transient temperature–displacement coupled analysis procedure to accurately capture the evolution of temperature and wear at the rubber–road interface. By integrating this simplified model with a refined analysis strategy, the approach ensured computational efficiency while effectively revealing the wear mechanisms of NPTs under different working conditions. The specific model parameters and simulation workflow are illustrated in Figure 14.

4.3. Analysis of the Influence of Different Factors on the Wear Characteristics of Non-Pneumatic Tires

According to the variables defined in the wear Equation (1), the primary factors influencing tread wear are the vertical load and the slip ratio. These two factors affect the contact state between the tire and the road surface, thereby altering both the slip distance and the magnitude of the load during operation. Therefore, this section investigates the variations in contact pressure, slip distance, temperature distribution, and wear volume under different loading conditions and slip ratios.

4.3.1. Analysis of Wear Characteristics of Non-Pneumatic Tires Under Different Vertical Loads

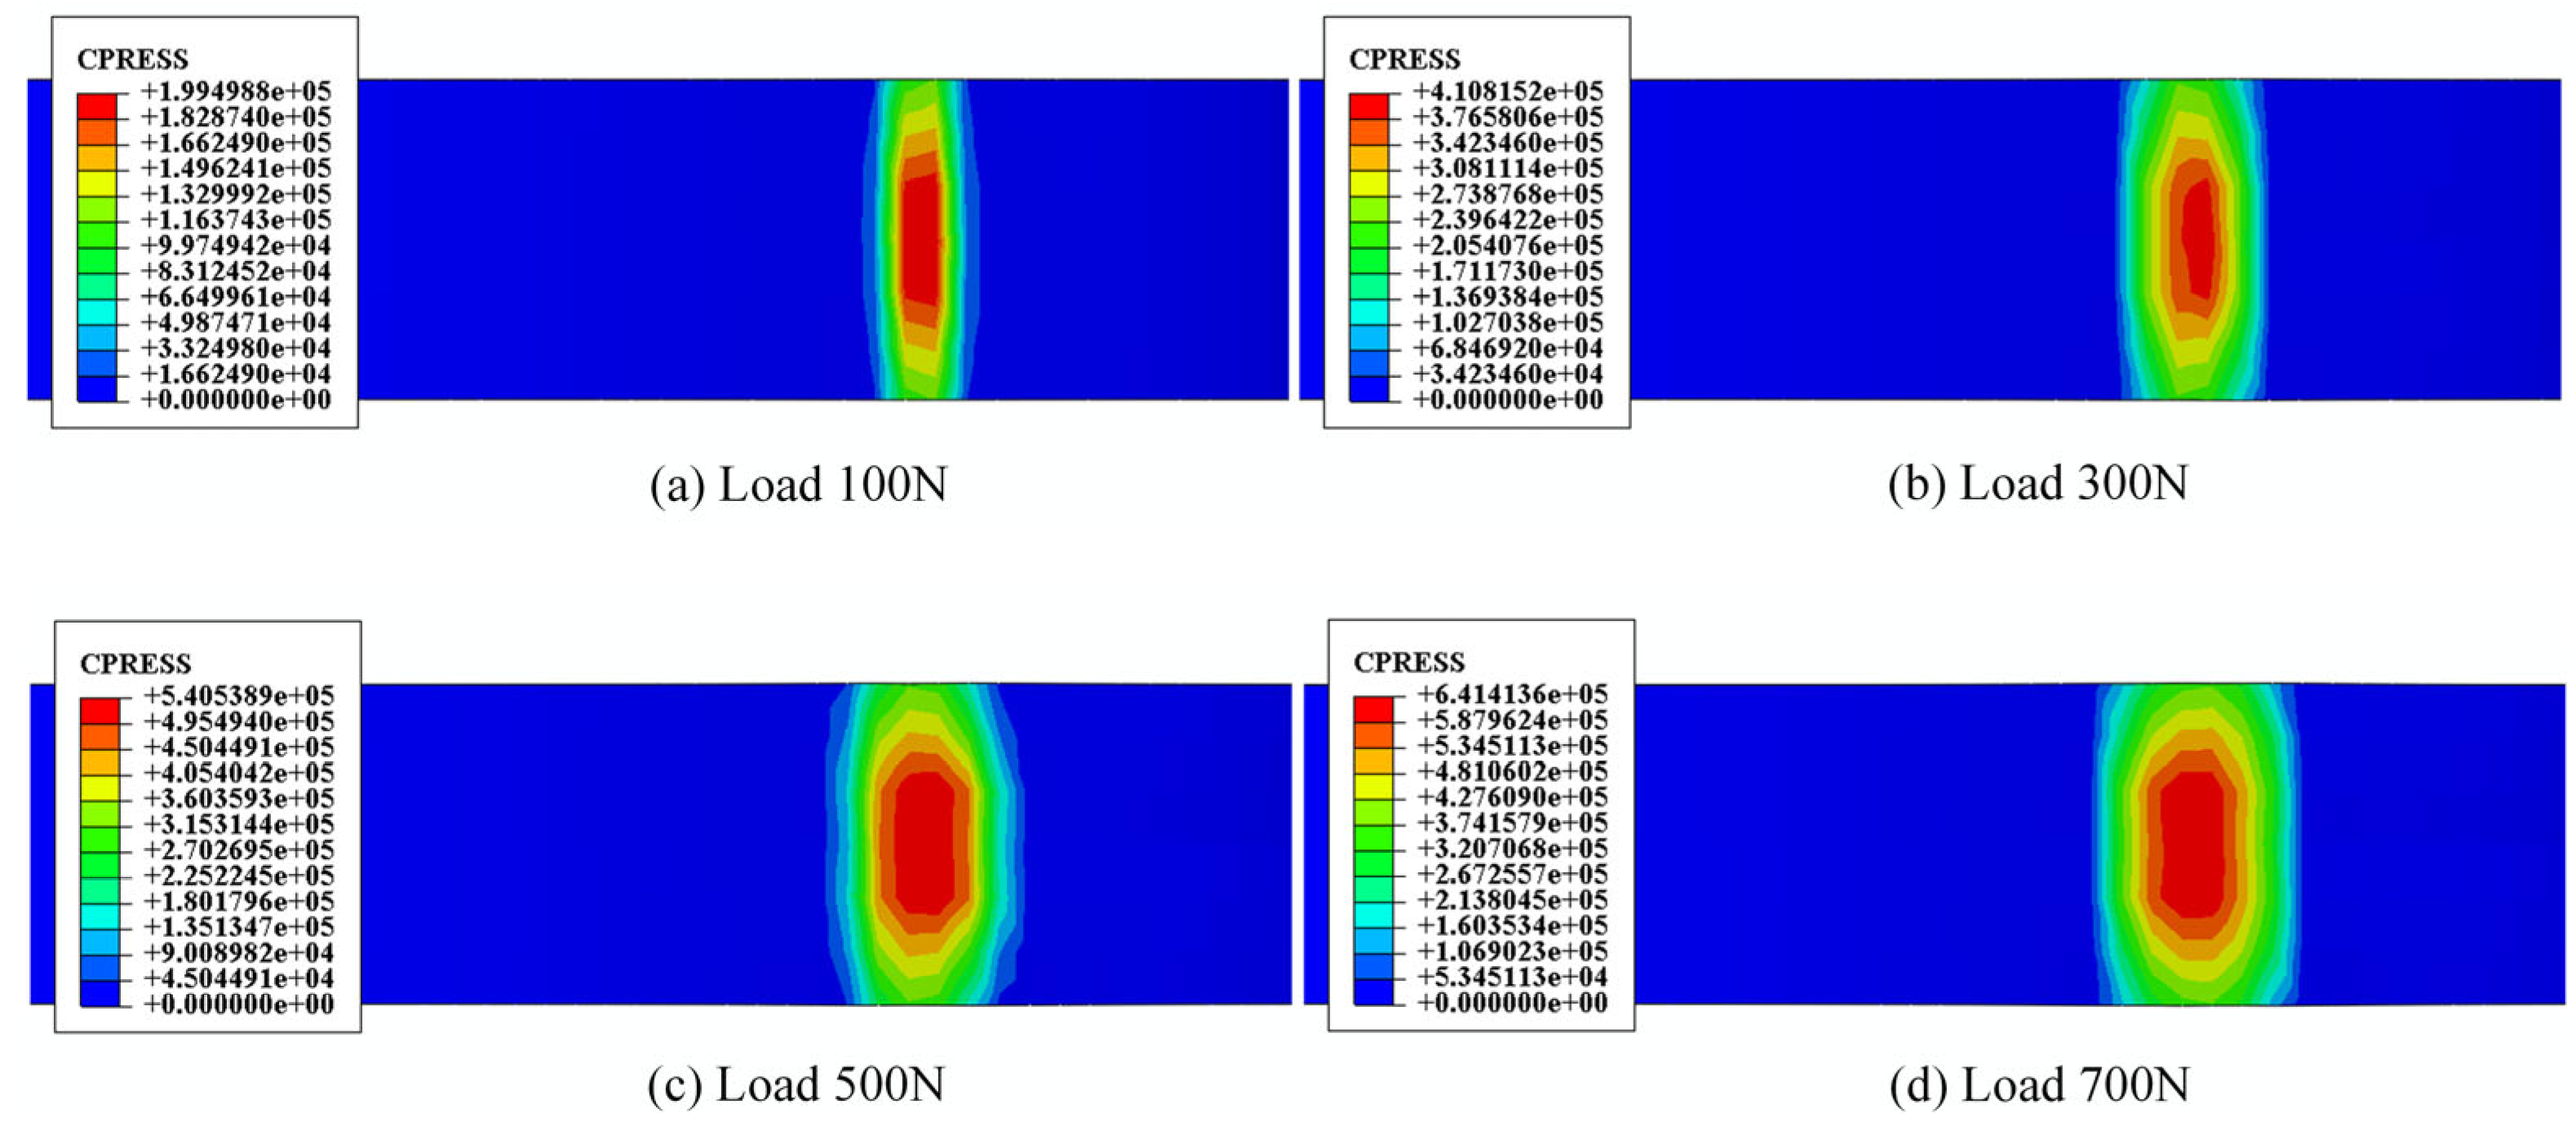
Figure 15 illustrates the contact pressure distribution characteristics of the non-pneumatic tire (NPT) under different vertical loads (100 N, 300 N, 500 N, and 700 N). The results show that the pressure distribution is symmetrical along the tire’s centerline, with the peak pressure consistently concentrated in the central contact area. The pressure gradient decreases progressively from the center toward the edges. As the load increases from 100 N to 700 N, the peak contact pressure rises significantly from 1.99 × 10⁵ Pa to 6.41 × 10⁵ Pa, accompanied by a noticeable expansion in the contact area—factors that are expected to have a substantial impact on wear behavior. This observation aligns well with the findings in the literature [30], which emphasize the strong correlation between wear and contact pressure. It is worth noting that the unique support structure and nonlinear material properties of NPTs enable them to maintain a relatively uniform pressure distribution under varying loads, which is beneficial for improving their wear resistance.
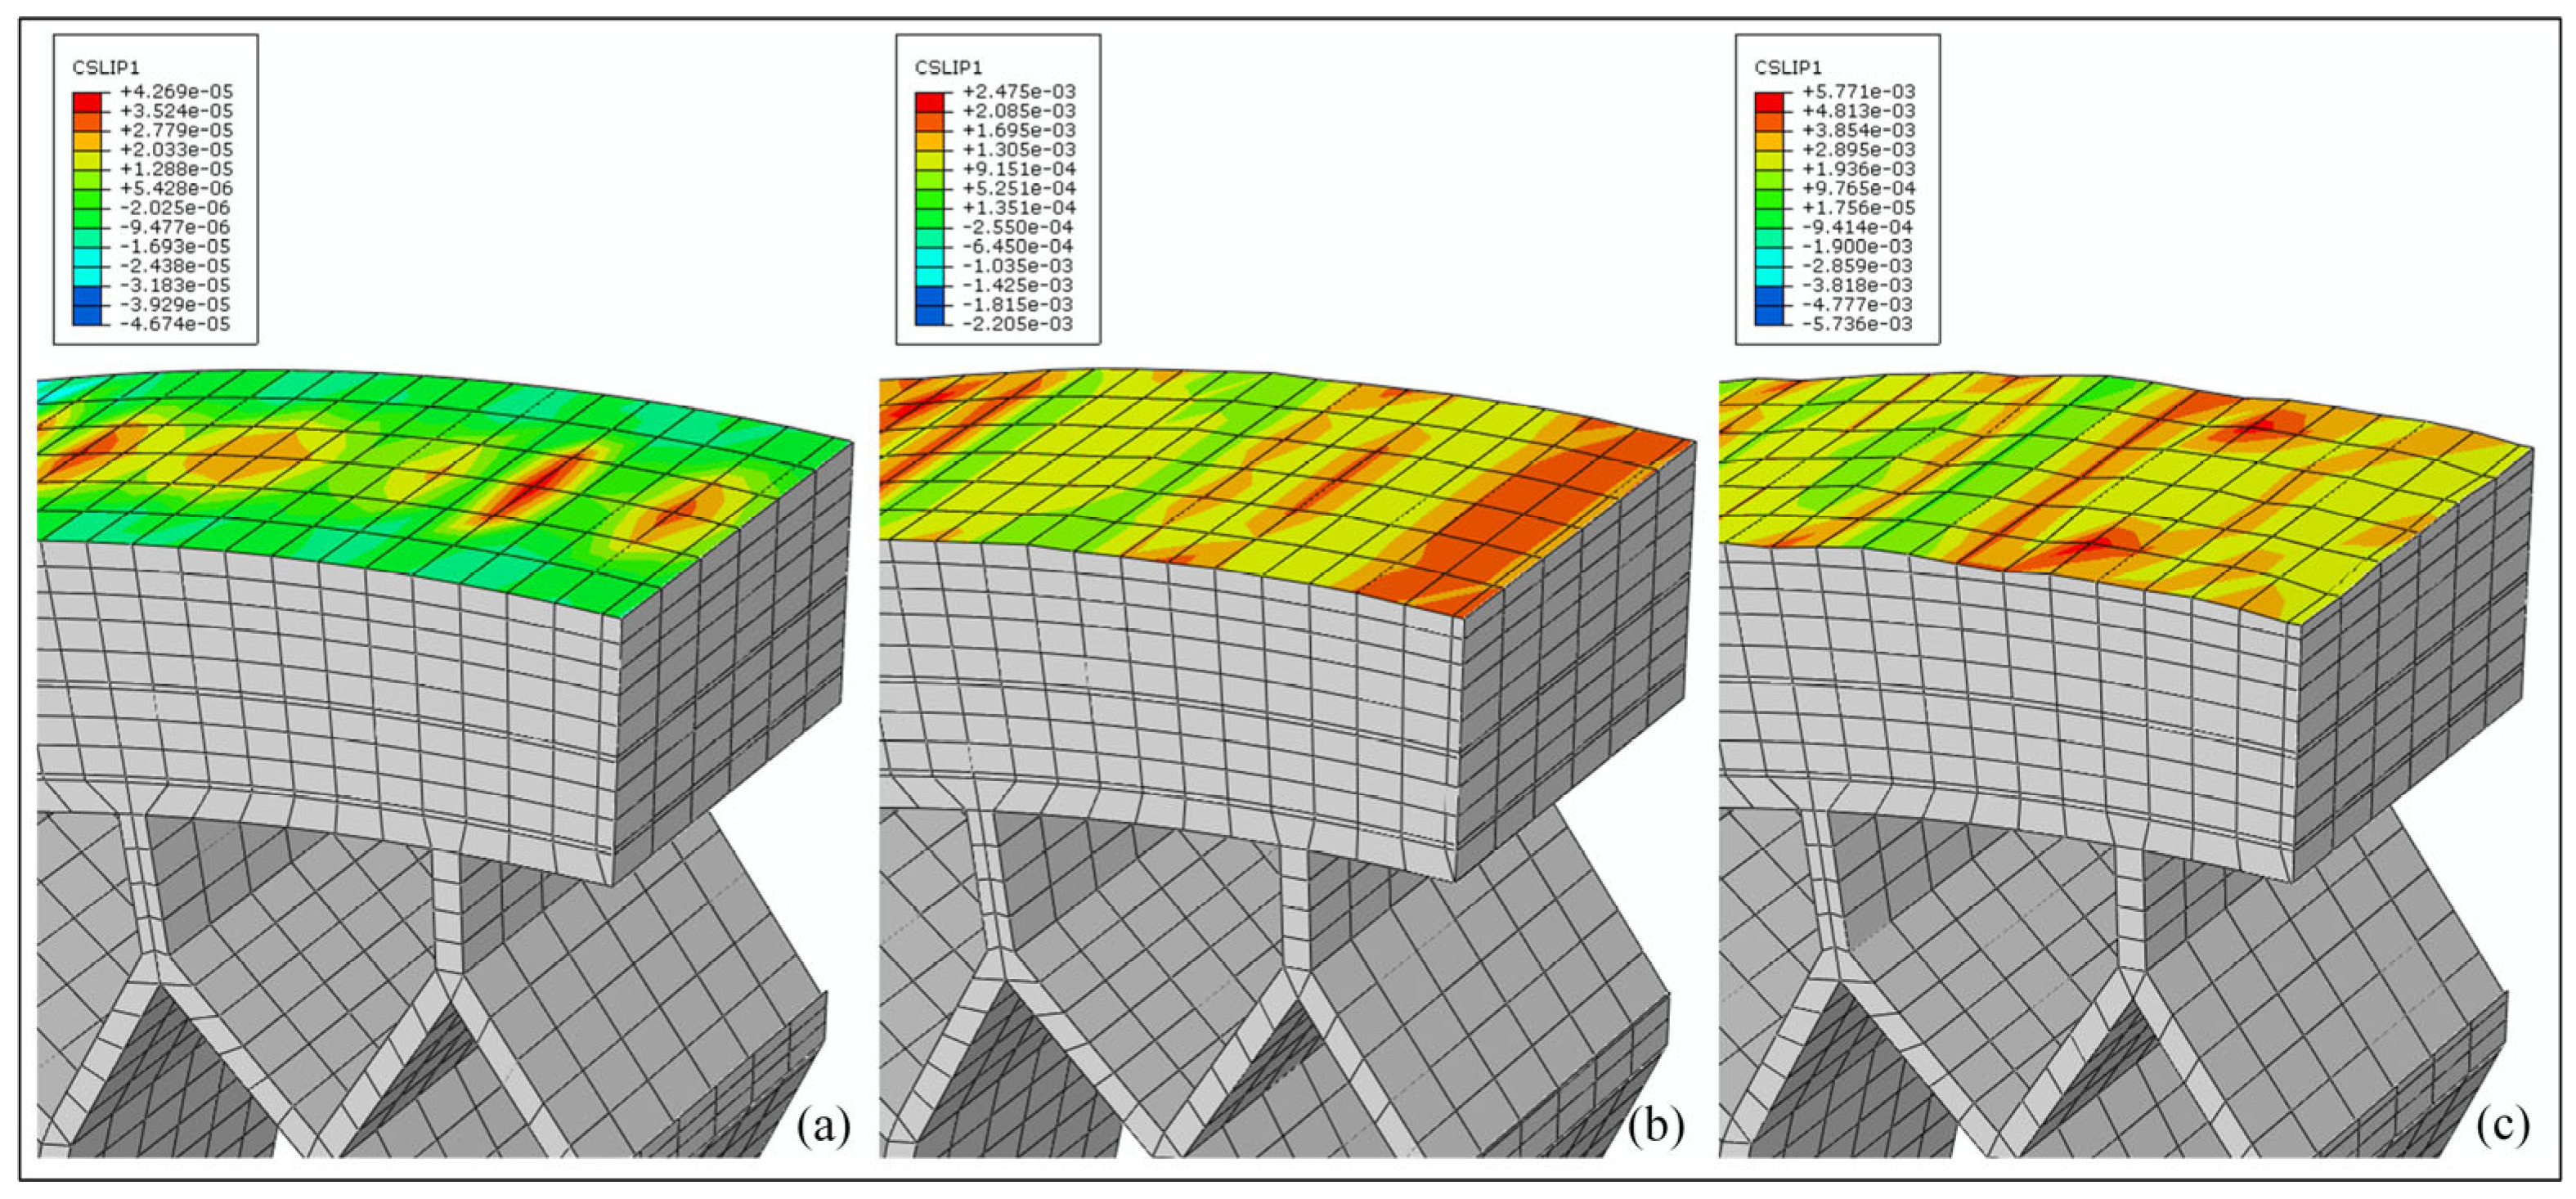
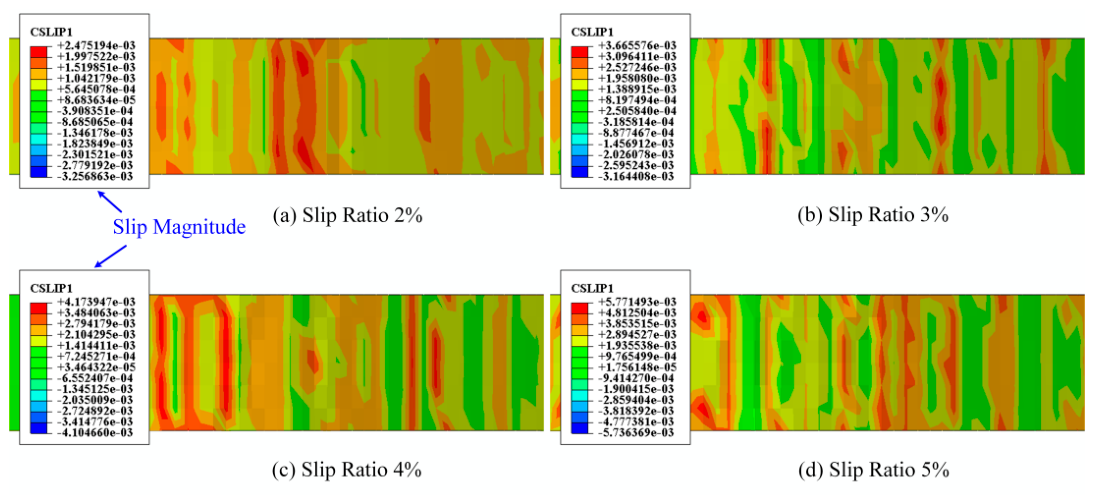
Figure 16 shows the distribution characteristics of the tangential slip (CSLIP1) of the Non-Pneumatic Tire after rolling 10 m under different vertical loads (100 N, 300 N, 500 N, 700 N). In theory, under pure rolling conditions, the dynamic condition of V = ω × R should be satisfied (where V is the translational velocity, V = 12 m/s in this paper, ω is the angular velocity, and R is the tire radius in the free state), at which point the tangential slip of the contact surface should be zero. However, simulation results indicate that during the loaded start-up phase, local slip occurs within the tire–road contact region. This phenomenon primarily arises from radial compression deformation of the tire under load, which reduces the instantaneous rolling radius Rf to a value smaller than the free-state radius R(Rf = R − ΔR, where ΔR is the radial compression amount). As a result, the actual contact line velocity ω × Rf becomes less than the theoretical ω × R. his mismatch leads to positive slip in the front portion of the contact area (indicated in red) and negative slip in the rear portion (indicated in blue), forming a shear behavior characterized by the coexistence of forward and reverse slip. This local slip behavior during the tire’s initial rolling phase inevitably intensifies localized wear. Furthermore, it is observed that with increasing vertical load, the extent of the slip region expands significantly, and the magnitude of local slip increases markedly. This trend aggravates the wear at the contact interface and adversely affects the durability performance of the tire.
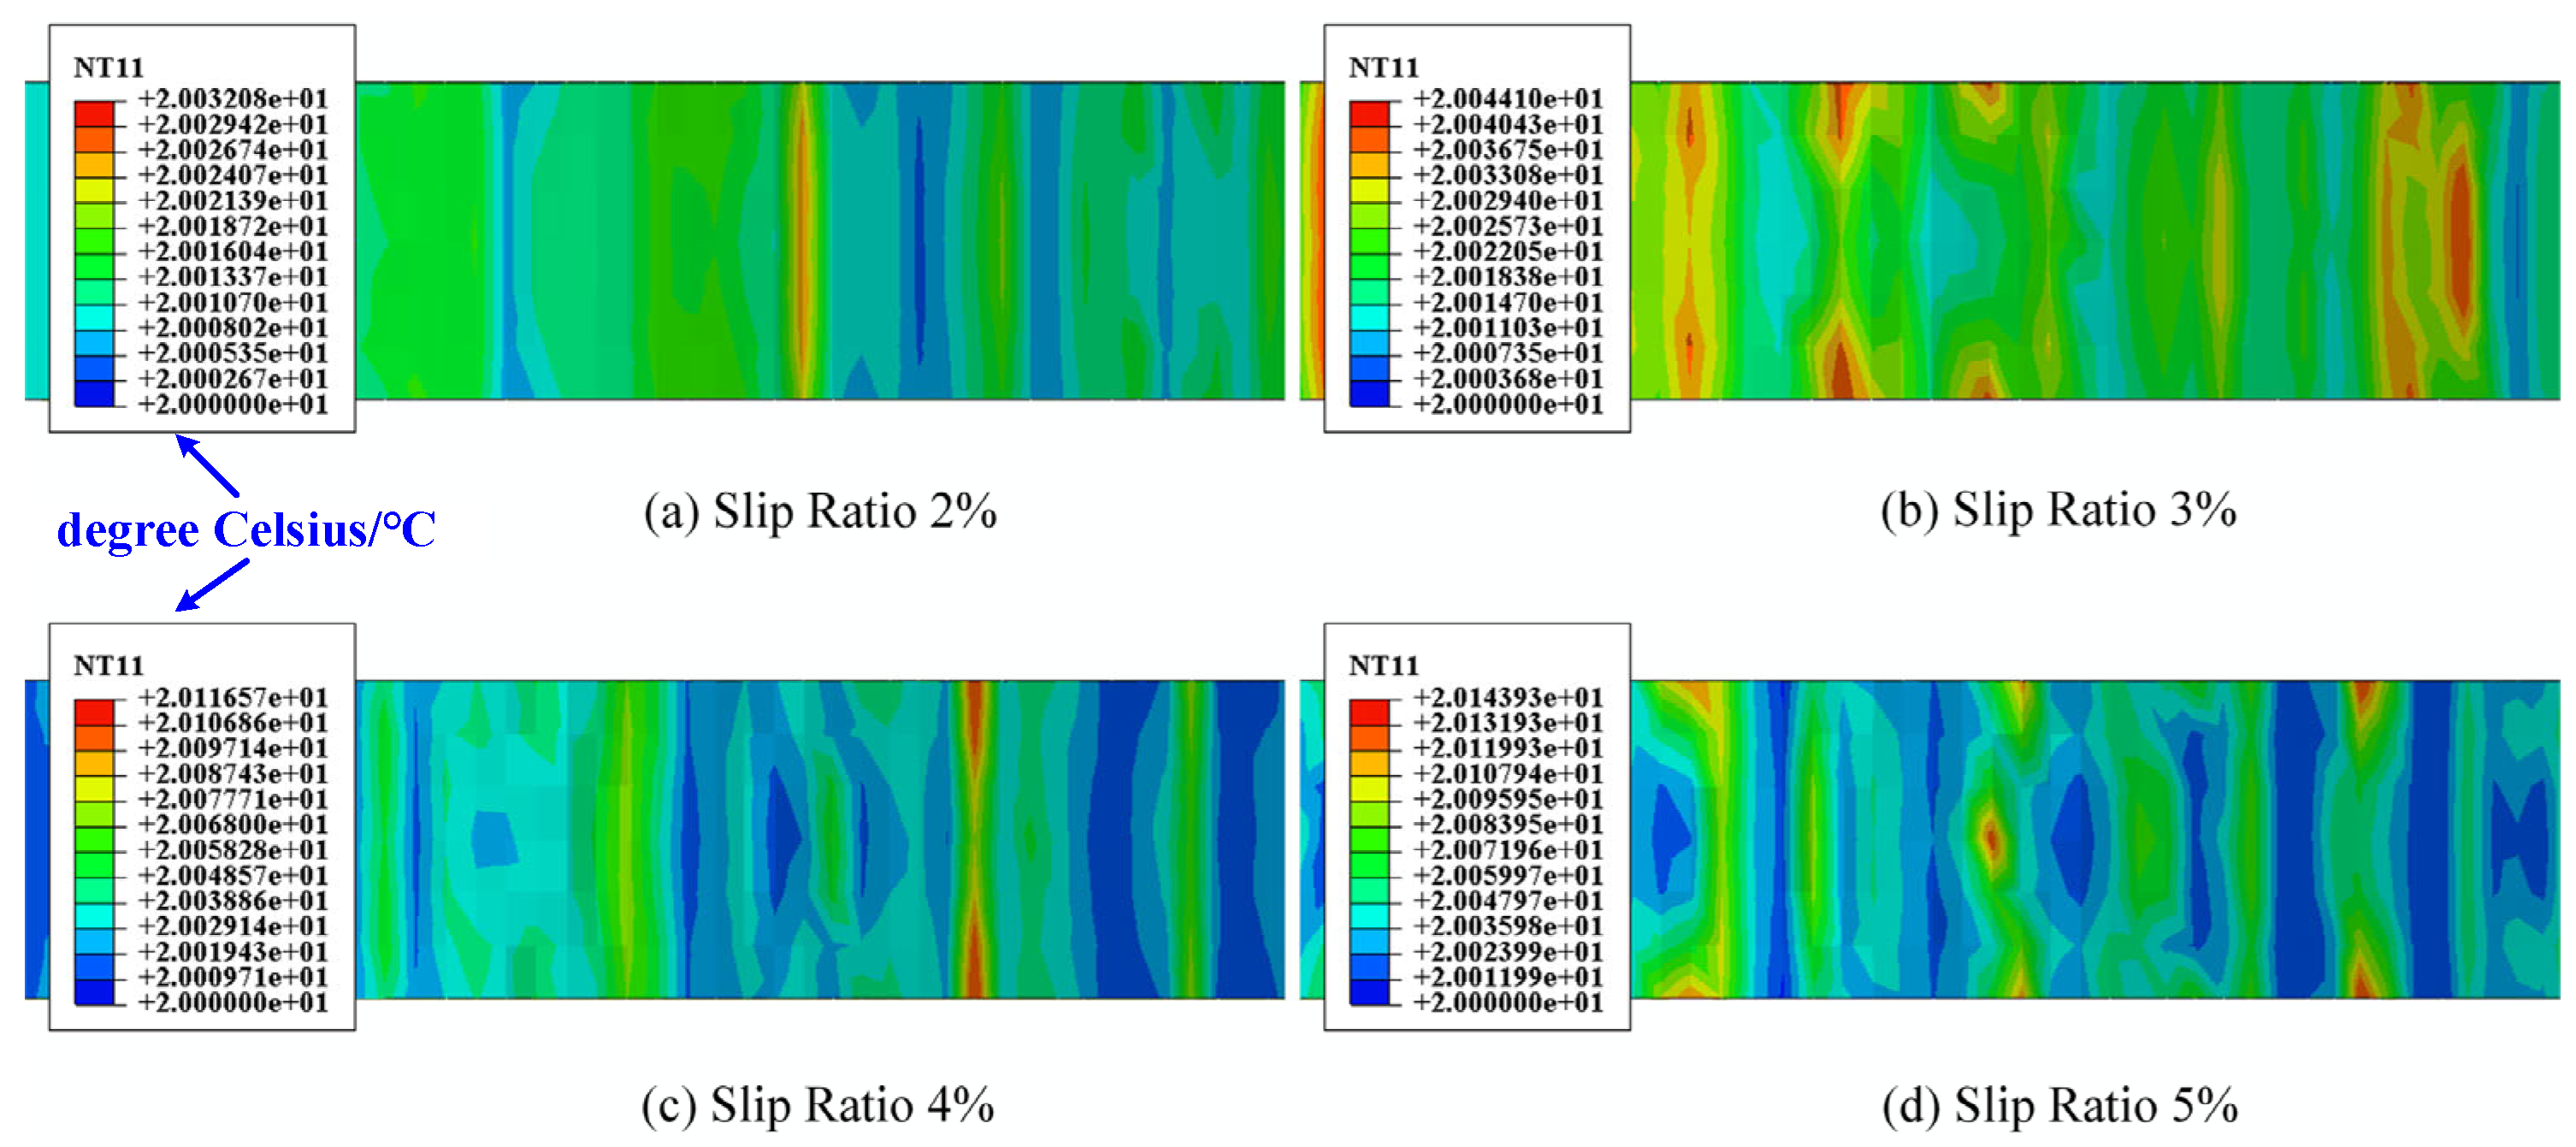
Figure 17 illustrates the temperature distribution in the contact area (NT11 node temperature, in °C) of the non-pneumatic tire (NPT) after rolling 10 m under different vertical loads (100 N, 300 N, 500 N, and 700 N). Even under the boundary condition where 100% of the generated heat is assumed to be absorbed by the tire surface, only slight variations in contact temperature are observed with increasing load. The tread temperature rise remains at a low level across all load cases. The tread frictional temperature rise remains at a relatively low level. As the load increases from 100 N to 700 N, the area with temperatures exceeding 20.005 °C slightly expands, indicating that higher loads do slightly enhance the heat generation effect. However, the overall temperature rise remains constrained due to the limited slip associated with pure rolling. These results suggest that under pure rolling conditions, the observed increase in wear with higher loads is primarily driven by the mechanical effects of increased contact pressure and local slip, while the contribution of friction-induced temperature rise is minimal. This finding provides solid support for subsequent investigations of the wear mechanism of NPTs under steady-state thermal conditions.
As tread wear progresses, under the same load, its outer radius will gradually decrease. Therefore, the vertical displacement of the NPT’s center point was extracted over time, as shown in Figure 18. The results indicate that the initial vertical displacement varies under different loading conditions, reflecting differences in the initial radial compression of the tire. Overall, the displacement curve exhibits a distinct downward trend, with the reduction magnitude corresponding to the change in tread wear depth. As the tire completes each revolution, the tread contact region undergoes continuous wear, leading to a gradual decrease in the overall tire height. Additionally, the periodic fluctuations observed in the curve are closely related to the mechanical characteristics of the NPT and its dynamic contact behavior during rolling. Further analysis reveals that the slope of the displacement curve represents the wear rate of the tire, which increases with higher loads. This confirms a positive correlation between vertical load and the wear rate of the NPT.

4.3.2. Analysis of Wear Characteristics of Non-Pneumatic Tires Under Different Slip Ratios

According to the Archard wear model and the previous analysis, the relative slip distance has a significant influence on tire wear volume, and the slip ratio is a key parameter in controlling the amount of tire slip. During driving conditions such as acceleration and braking, mismatches between the angular velocity and linear velocity of the tire result in a non-zero slip ratio, which in turn affects the wear behavior. To investigate the effect of slip ratio on the wear characteristics of non-pneumatic tires (NPTs), simulation analyses were conducted under a vertical load of 100 N. Based on real vehicle operating conditions reported in the literature [30], four slip ratio scenarios—2%, 3%, 4%, and 5%—were implemented by adjusting the angular and linear velocities accordingly.
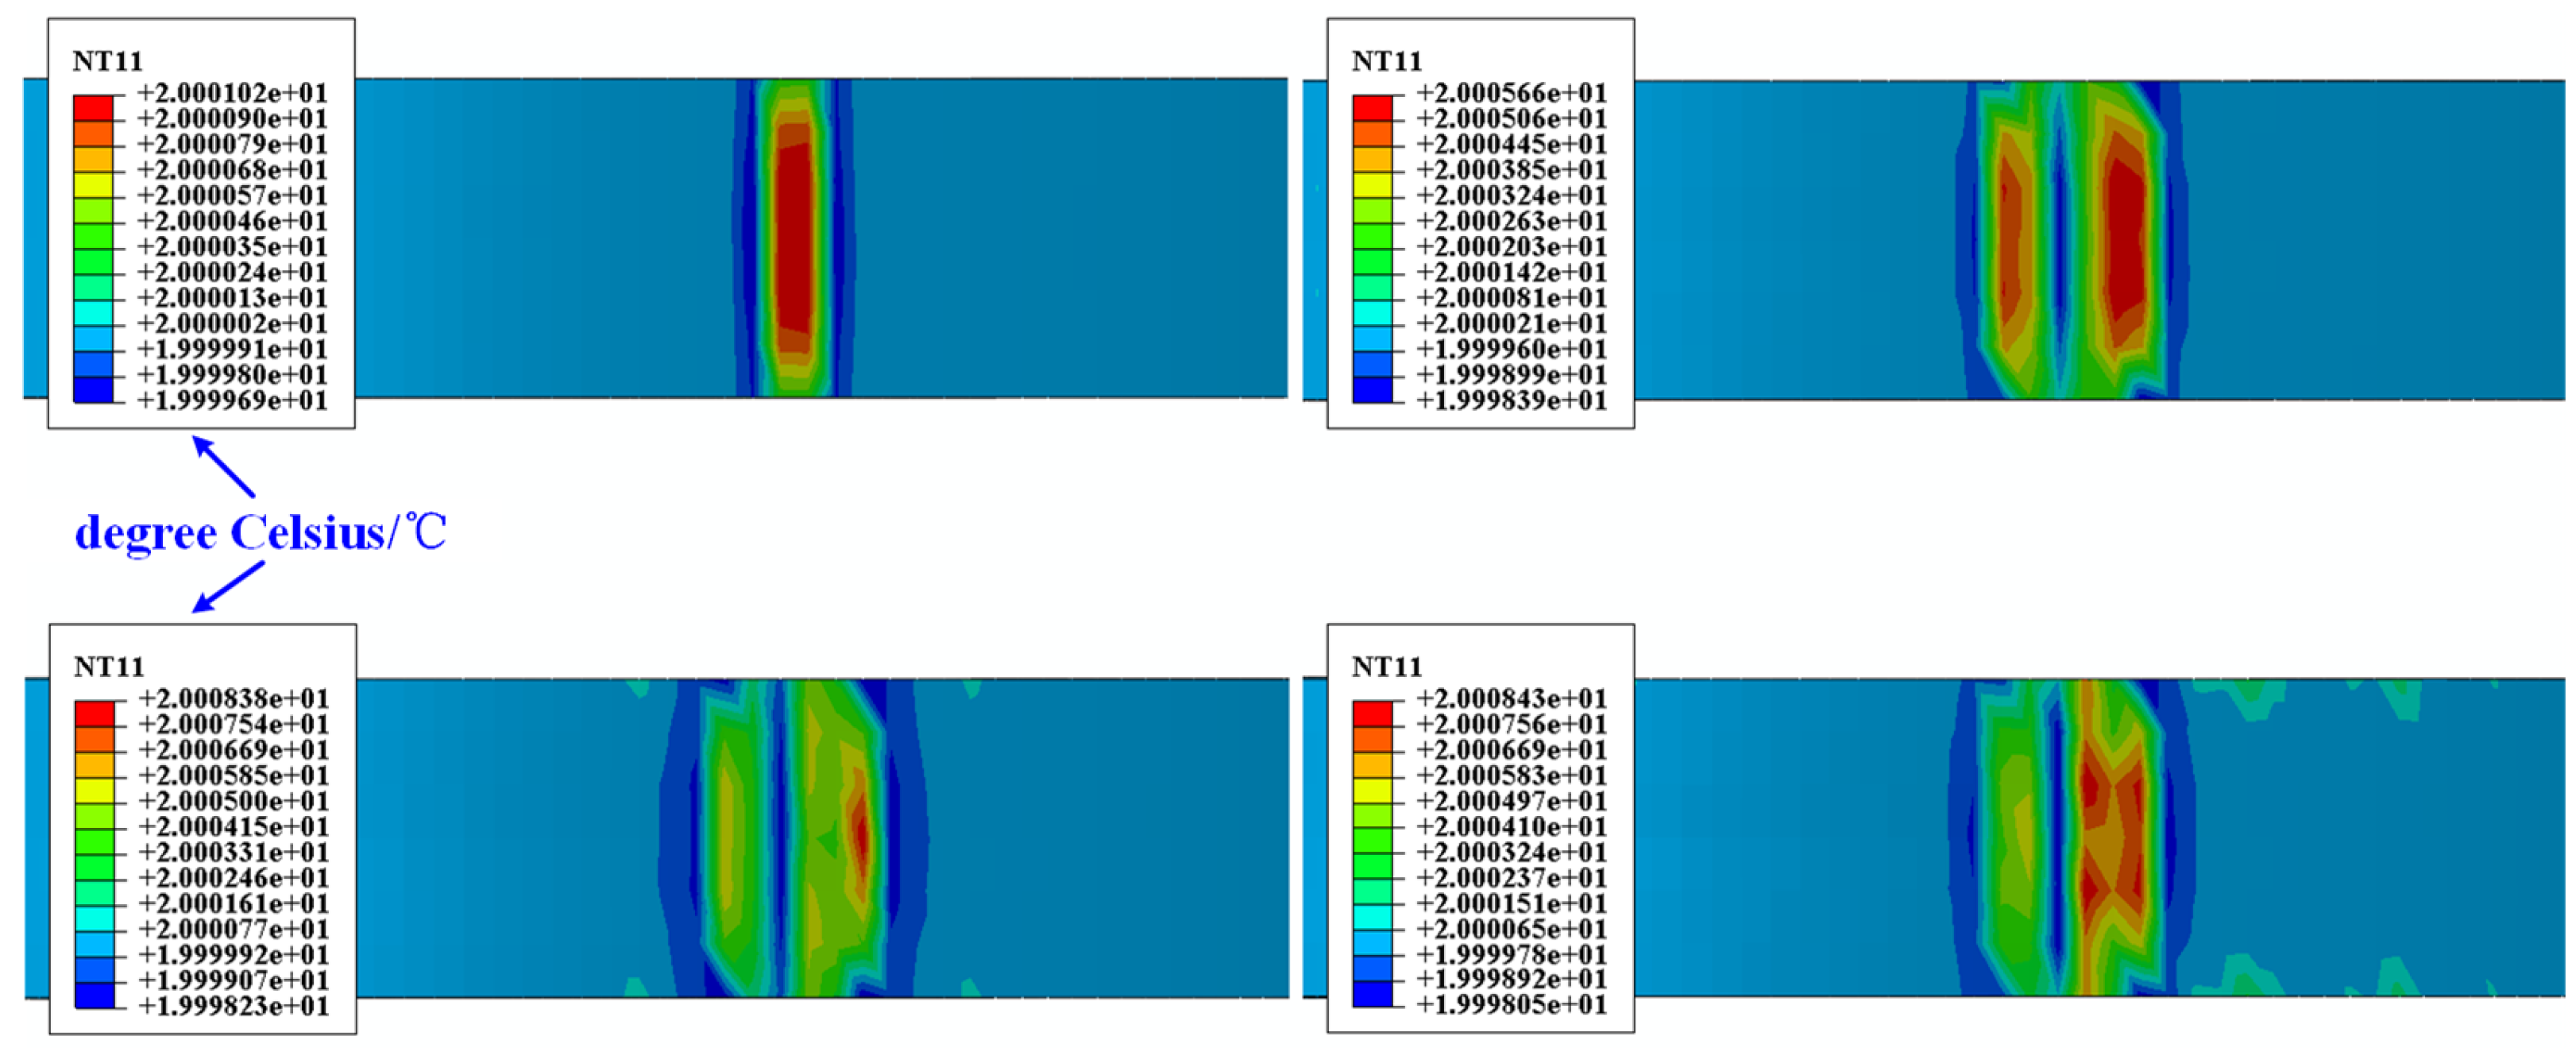
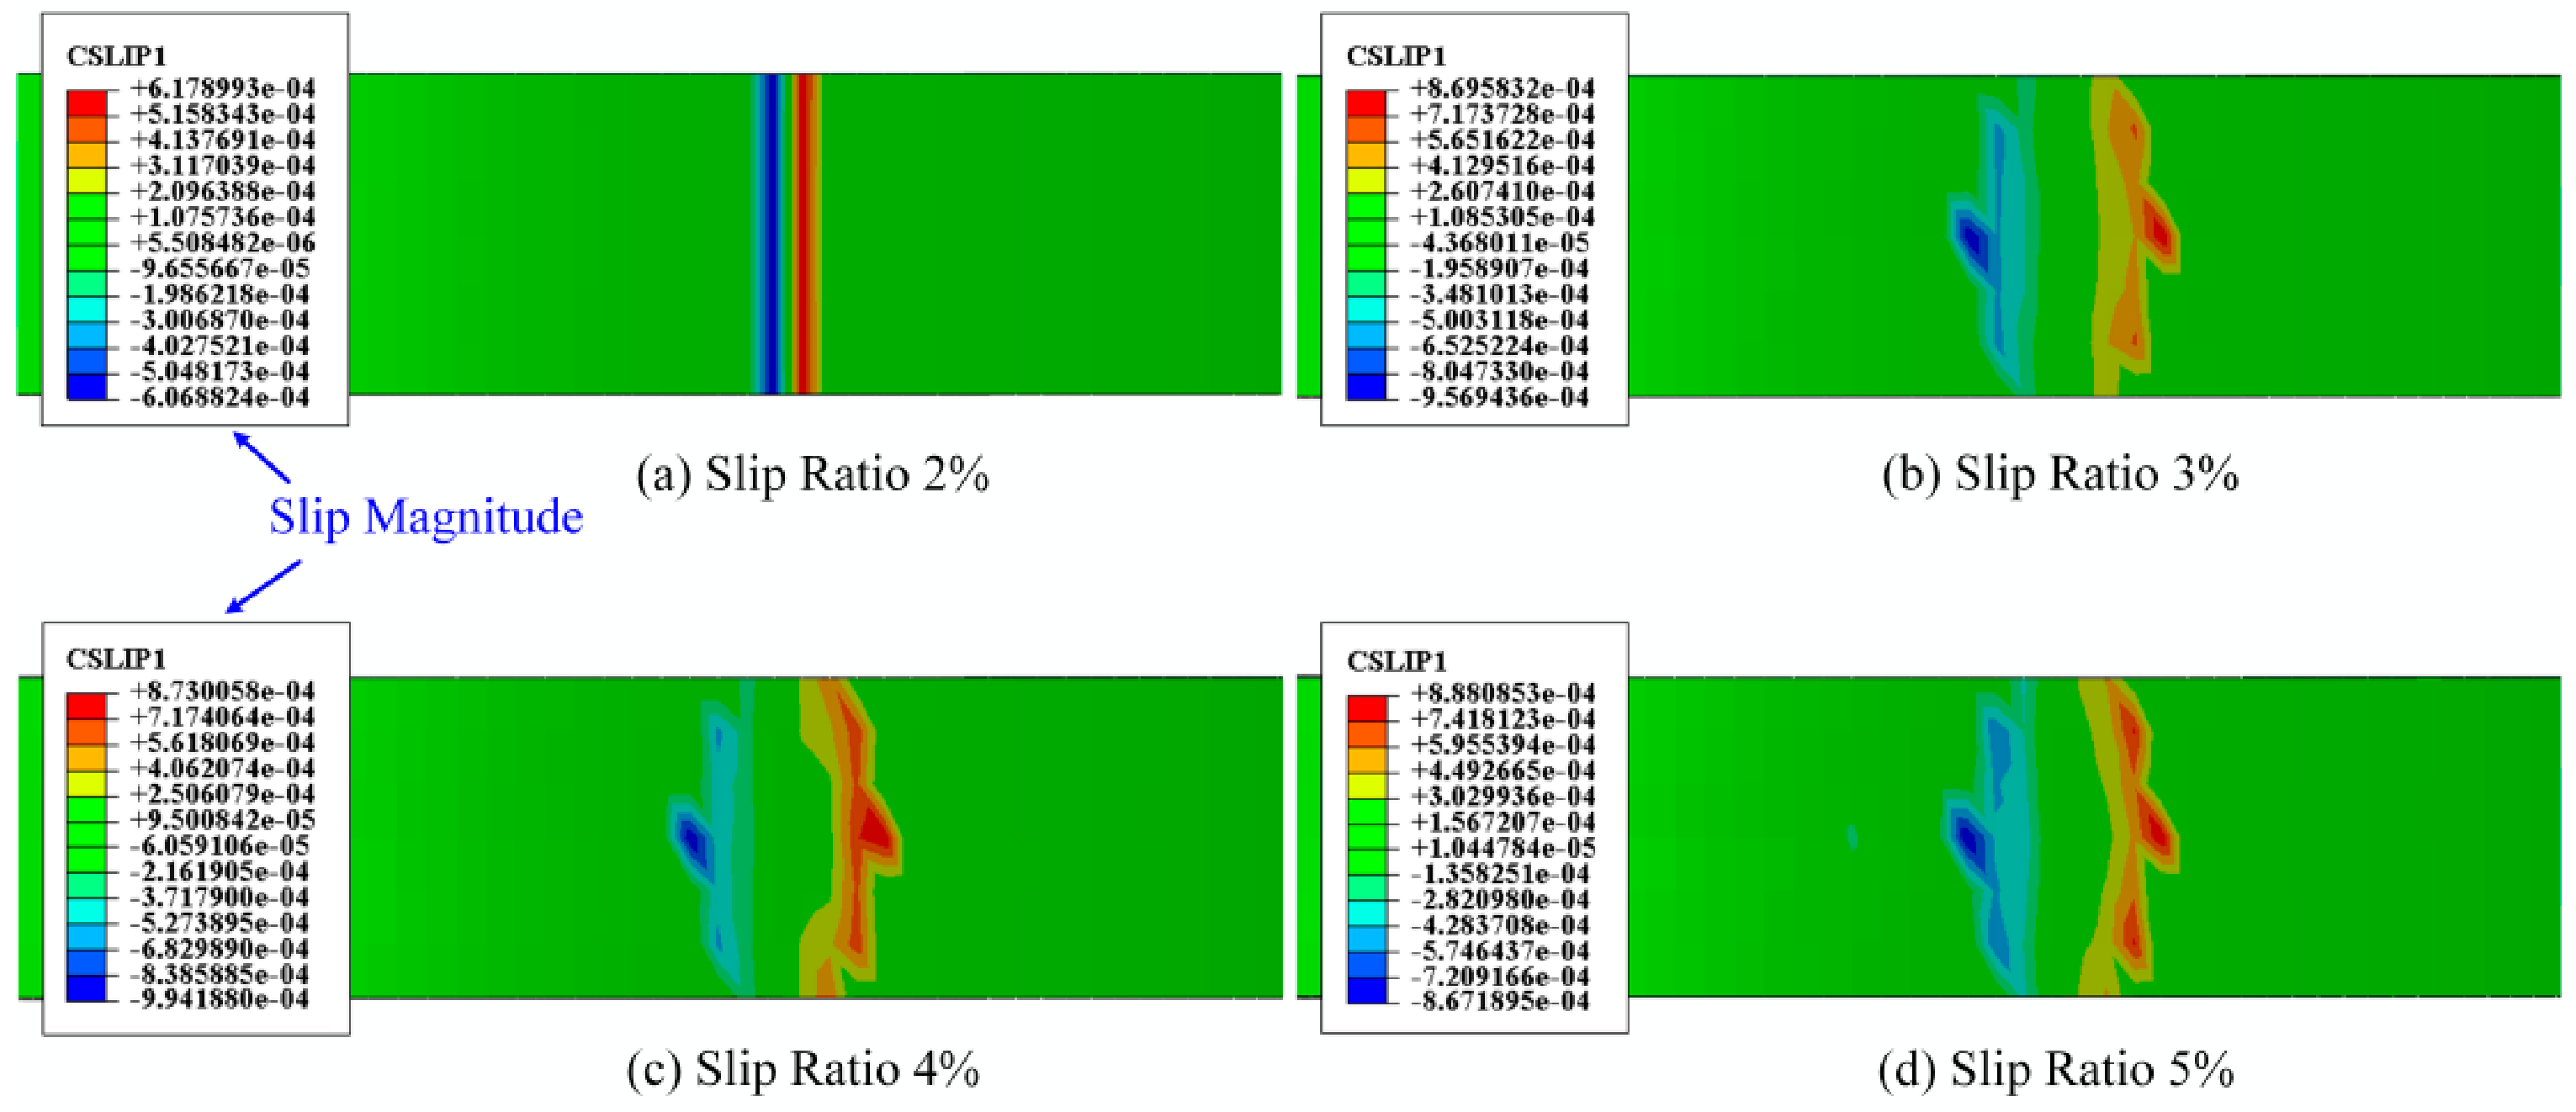
Figure 19 and Figure 20 illustrate the distribution characteristics of the relative slip (CSLIP1) and the surface temperature field of the tread under different slip ratios. As shown in Figure 19, the slip region and the magnitude of slip both increase significantly as the slip ratio rises from 2% to 5%. This increase in slip directly intensifies the wear of the tread rubber. Figure 20 shows the corresponding surface temperature fields. Compared to the previously analyzed pure rolling condition, although the increase in slip ratio does lead to a rise in temperature, the overall temperature elevation remains limited. This is primarily due to the short rolling distance set in the simulation, which restricts the accumulation of frictional heat. Notably, the temperature rise exhibits a clear correlation with the slip ratio: the greater the slip ratio, the more pronounced the relative slip, and hence, the higher the amount of frictional heat generated.
Similarly, the vertical displacement of the NPT center point over time was extracted to reflect tread wear progression, as shown in Figure 21. The results indicate a clear increasing trend in displacement (i.e., sinking depth) as the slip ratio rises from 2% to 5%, suggesting that wear severity intensifies with higher slip ratios. The slope of the displacement curve increases from 0.0004 to 0.0009, directly reflecting the growing wear rate. Moreover, under higher slip ratio conditions, the wear process becomes significantly more severe, characterized by larger fluctuations in the displacement curve and a less stable overall trend. This behavior becomes particularly prominent as the slip ratio increases, which is consistent with the findings reported in the literature [30] regarding the influence of slip ratio on wear behavior. To more intuitively observe the effect of wear on NPT surface morphology, the tread was sectioned and compared under three representative working conditions, as illustrated in Figure 22. Under a vertical load of 100 N, the tread mesh remains relatively smooth, with minimal deformation in mesh height. When the load increases to 700 N, slight undulations appear in localized regions of the tread, with reduced mesh height and the formation of wavy ridges and depressions, indicating intensified wear under higher load. Under the 5% slip ratio condition, wear features become even more pronounced. The mesh height of the tread drops significantly, and the surface profile exhibits marked non-uniform fluctuations. The overall wear morphology becomes rougher, and the wear is especially severe in high-slip regions.
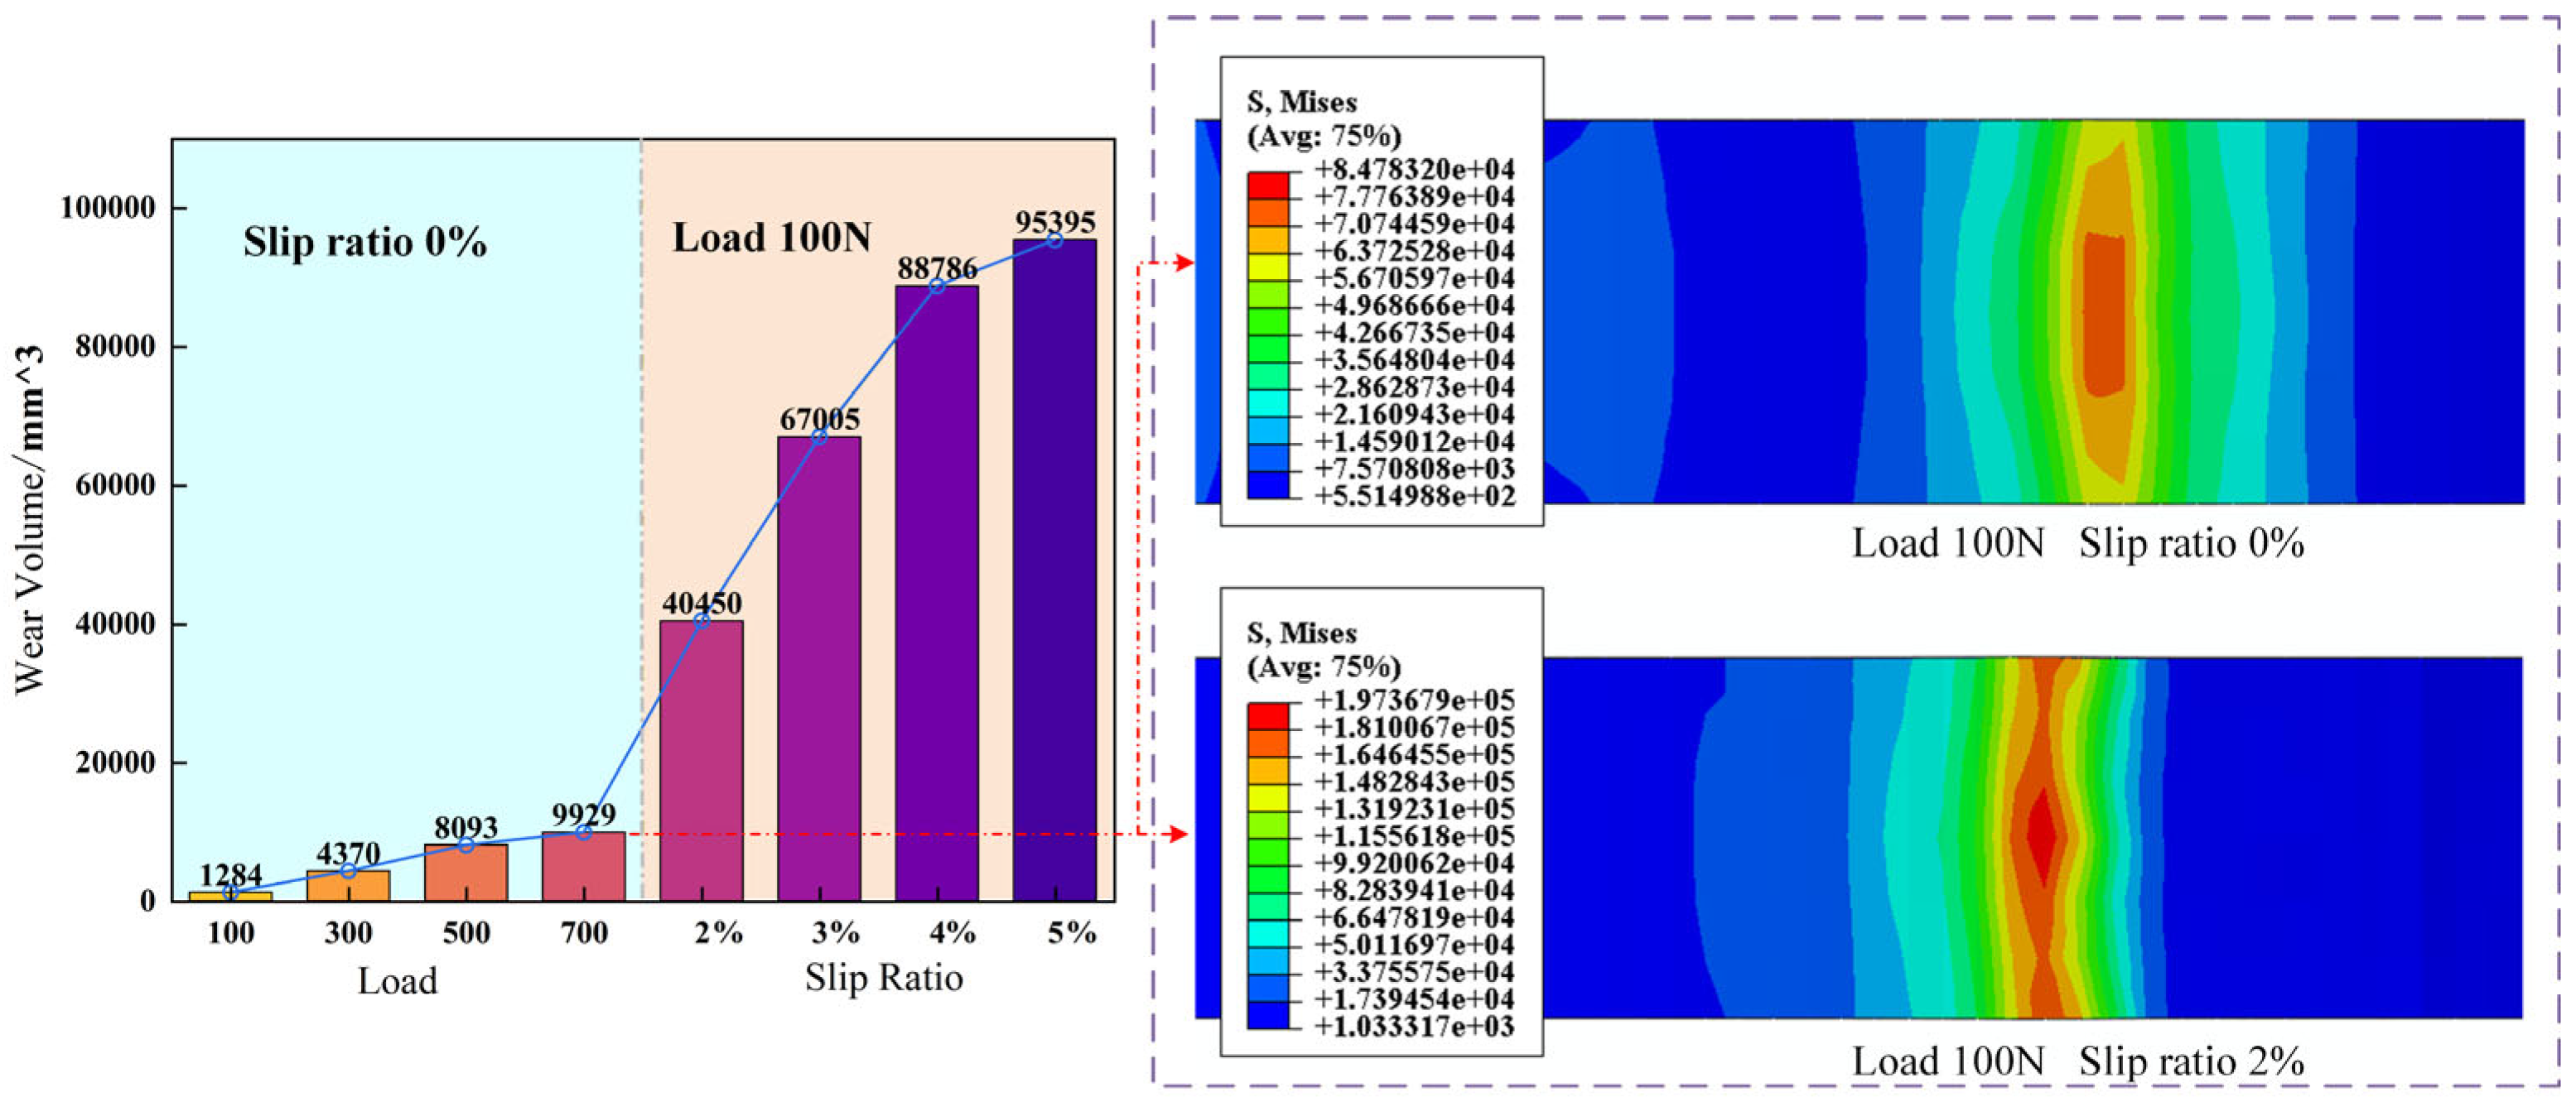
Figure 23 comprehensively presents the tire wear volume results obtained from eight sets of simulations under different load and slip ratio combinations. The data indicate that wear volume increases with both load and slip rate, yet the influence of slip rate is more pronounced under a constant load. When the load is fixed at 100 N, the wear volume rises sharply as the slip rate increases from 0% to 5%, climbing from 1284 mm3 to 95,395 mm3—an increase of approximately 73 times. In contrast, under pure rolling conditions (slip rate 0%), increasing the load from 100 N to 700 N only raises the wear volume from 1284 mm3 to 9929 mm3, representing a growth of about 7.7 times. Moreover, even at a slip rate of 2%, the wear volume remains significantly higher than that under any pure rolling condition across the tested load range, further confirming that the effect of slip rate on wear substantially outweighs that of load variation. As the slip ratio increases from 2% to 5%, the wear volume shows a sharp nonlinear increase. This phenomenon arises because an increase in slip ratio not only directly extends the relative slip distance between the tread and the road but also significantly enhances the stress level in the contact area and intensifies frictional heat accumulation (Figure 23 compares the contact stress distribution on the tread between the pure rolling and 2% slip ratio conditions), thus jointly accelerating the wear process. In contrast, under pure rolling conditions, the increase in load primarily affects wear by altering the ground pressure distribution, and its effect is weaker than that of the slip ratio for the same variation. Therefore, the theoretical mechanism based on the Archard wear model further illustrates that, during the wear process of non-pneumatic tires, the slip ratio is a more sensitive dominant factor than the load.

5. Conclusions

This study combines systematic rubber wear experiments with thermo-mechanical coupled numerical simulations. A temperature-corrected Archard-based finite element wear model is developed. The model captures the wear mechanisms and evolution of non-pneumatic tires under different operating conditions. It also enables dynamic simulation of wear progression and surface morphology evolution. The main conclusions are as follows:
Based on rubber friction and wear test data obtained at different temperatures, a functional relationship between the wear coefficient and temperature was established, and the Archard wear model was modified accordingly. A thermo-mechanically coupled finite element wear calculation method suitable for non-pneumatic tires was thus proposed. Despite limitations imposed by computational conditions, the rolling distance examined in this study is relatively short, and its applicability is primarily focused on wear mechanisms dominated by frictional heat generation. The cumulative temperature rise caused by material hysteresis and its long-term effects on wear have not been considered. However, the core contribution of this model lies in the development and validation of a thermo-mechanical coupled wear calculation methodology, which provides a methodological foundation for future extensions to longer rolling distances and more complex operating conditions. The simulation results show that in pure rolling conditions, wear is primarily driven by the mechanical effects of ground pressure and tangential slip, with limited contribution from tread frictional heating (ΔT < 0.1 °C). By monitoring the change in the tire’s outer radius during wear, it was found that the displacement of the NPT’s center point decreased linearly over time, and the rate of decrease increased with the load (100–700 N), further confirming the positive correlation between load and wear rate.
The impact of the slip ratio on the wear behavior of non-pneumatic tires is significantly greater than that of load. As the slip ratio increases from 2% to 5%, under thermal-mechanical coupling, the tread slip area expands, the slip amount increases, contact stress is enhanced, and frictional heat accumulates, leading to a non-linear and significant increase in wear volume. Although the temperature rise effect caused by an increase in the slip ratio is more pronounced than under load conditions, due to limitations in rolling distance and speed in the simulation, the overall temperature rise caused by tread friction remains at a low level (ΔT < 0.15 °C), indicating that wear is still primarily driven by mechanical mechanisms in short-term acceleration processes. The experimentally validated modified Archard model accurately predicted the wear volume change trend under different slip ratios, clarifying the dominant role of the slip ratio in the wear process from a mechanistic perspective.
Future research can further deepen in the following areas to promote the application of non-pneumatic tires in the new energy vehicle industry: (1) comprehensively considering both tread frictional heating and material hysteresis heating effects, improving the thermal-mechanical coupled wear simulation model to enhance wear prediction accuracy under complex working conditions; (2) combining the typical operating characteristics of new energy vehicles, such as high-frequency starts and stops and high torque output, to conduct multi-objective collaborative optimization design of spoke structures and develop a new generation of non-pneumatic tires with high wear resistance, excellent handling stability, and good dynamic load response characteristics.

Author Contributions

Methodology, H.R.; formal analysis, H.R. and H.Z.; data curation, W.Z.; writing—original draft, H.R.; writing—review and editing, H.Z.; visualization, Z.G.; supervision, T.X.; project administration, H.Z. All authors have read and agreed to the published version of the manuscript.

Funding

This research was funded by the National Natural Science Foundation of China, grant number 52072156, 52272366 and the Postdoctoral Foundation of China, grant number 2020M682269.

Data Availability Statement

The original contributions presented in this study are included in the article. Further inquiries can be directed to the corresponding author.

Conflicts of Interest

The authors declare no conflicts of interest.

References

  1. Wang, W.; Liang, R.; Sun, H. Research on the key influencing factors of road wear for battery electric vehicles tyres. In Proceedings of the 2021 9th International Conference on Traffic and Logistic Engineering (ICTLE), Macau, China, 9–11 August 2021. [Google Scholar]
  2. Zheng, Z.; Rakheja, S.; Sedaghati, R. Multi-axis stiffness and road contact characteristics of honeycomb wheels: A parametric analysis using Taguchi method. Compos. Struct. 2022, 279, 114735. [Google Scholar] [CrossRef] [Scilit]
  3. Zheng, Z.; Rakheja, S.; Sedaghati, R. A comparative study of static and dynamic properties of honeycomb non-pneumatic wheels and a pneumatic wheel. Proc. Inst. Mech. Eng. Part D J. Automob. Eng. 2021, 235, 3631–3646. [Google Scholar] [CrossRef] [Scilit]
  4. Karpenko, M.; Skačkauskas, P.; Prentkovskis, O. Methodology for the composite tire numerical simulation based on the frequency response analysis. Eksploat. I Niezawodn. 2023, 25, 1–11. [Google Scholar] [CrossRef] [Scilit]
  5. Karpenko, M.; Prentkovskis, O.; Skačkauskas, P. Numerical simulation of vehicle tyre under various load conditions and its effect on road traffic safety. Promet-Traffic Transp. 2024, 36, 1–11. [Google Scholar] [CrossRef] [Scilit]
  6. Wei, Y.; Pan, F.; Du, J.; Xiang, J.; Chen, Y. Tensegrity metamaterial-based shear band structure for non-pneumatic tires. Forces Mech. 2025, 100341. [Google Scholar]
  7. Deng, Y.; Wang, Z.; Liu, T.; Liang, W.; Shen, H.; Xiao, Z. Static and dynamic mechanical characteristics of honeycomb non-pneumatic tire under structural damage condition. Eur. J. Mech. A/Solids 2023, 102, 105120. [Google Scholar]
  8. Cho, J.R.; Choi, J.H.; Kim, Y.S. Abrasive wear amount estimate for 3D patterned tire utilizing frictional dynamic rolling analysis. Tribol. Int. 2011, 44, 850–858. [Google Scholar]
  9. Zhang, H.; Zhang, S.; Zhang, Y.; Huang, X.; Dai, Y. Abrasion Status Prediction with BP Neural Network Based on an Intelligent Tire System. In Proceedings of the 2020 4th CAA International Conference on Vehicular Control and Intelligence (CVCI), Hangzhou, China, 18–20 December 2020; pp. 619–622. [Google Scholar]
  10. Wang, G.; Li, X.; Jing, Z.; Wang, X.; Zhang, Y. Improvement in and Validation of the Physical Model of an Intelligent Tire Considering the Wear. Sensors 2025, 25, 2490. [Google Scholar] [CrossRef] [Scilit]
  11. Zhou, T. Simulation Analysis of Tire Tread Wear Behavior Based on the Geometric Update Method. Master’s Thesis, South China University of Technology, Guangzhou, China, 2018. [Google Scholar]
  12. Chen, D.; Wu, J.; Wang, Y.; Su, B.; Liu, Y. High-speed tribology behaviors of aircraft tire tread rubber in contact with pavement. Wear 2021, 486, 204071. [Google Scholar] [CrossRef] [Scilit]
  13. Wu, J.; Chen, L.; Chen, D.; Wang, Y.; Su, B.; Cui, Z. Experiment and simulation research on the fatigue wear of aircraft tire tread rubber. Polymers 2021, 13, 1143. [Google Scholar] [CrossRef] [Scilit]
  14. Wu, J.; Chen, L.; Wang, Y.; Su, B.; Cui, Z.; Wang, D. Effect of temperature on wear performance of aircraft tire tread rubber. Polym. Test. 2019, 79, 106037. [Google Scholar] [CrossRef] [Scilit]
  15. Zuo, S.G.; Ni, T.X.; Wu, X.D.; Wu, K.; Yang, X.W. Prediction procedure for wear distribution of transient rolling tire. Int. J. Automot. Technol. 2014, 15, 505–515. [Google Scholar] [CrossRef] [Scilit]
  16. Zhou, H.; Wang, R.; Liang, C.; Wang, G.; Zhang, L. Research on simulation method of rubber friction and wear considering temperature influence. J. Mech. Eng. 2025, 61, 253–264. [Google Scholar]
  17. Schallamach, A.; Turner, D.M. The wear of slipping wheels. Wear 1960, 3, 1–25. [Google Scholar] [CrossRef] [Scilit]
  18. Dionisio, H.J.; Calhabeu, A.M. Evaluating Tire Tread Wear and Its Dependence on Tire Working Conditions by Using the Finite Element Method and Archard’s Wear Theory. Tire Sci. Technol. 2022, 50, 285–298. [Google Scholar] [CrossRef] [Scilit]
  19. Li, Y.; Zuo, S.; Duan, X.; Guo, X.; Jiang, C. Theory analysis of the steady-state surface temperature on rolling tire. Proc. Inst. Mech. Eng. Part C J. Mech. Eng. Sci. 2012, 226, 1278–1289. [Google Scholar] [CrossRef] [Scilit]
  20. Žuraulis, V.; Garbinčius, G.; Skačkauskas, P.; Prentkovskis, O. Experimental study of winter tyre usage according to tread depth and temperature in vehicle braking performance. Iran. J. Sci. Technol. Trans. Mech. Eng. 2020, 44, 83–91. [Google Scholar] [CrossRef] [Scilit]
  21. Yan, L.; Guan, L.; Wang, D.; Xiang, D. Application and prospect of wear simulation based on ABAQUS: A review. Lubricants 2024, 12, 57. [Google Scholar] [CrossRef] [Scilit]
  22. Bastola, A.; Stewart, D.; Dini, D. Three-dimensional finite element simulation and experimental validation of sliding wear. Wear 2022, 504, 204402. [Google Scholar] [CrossRef] [Scilit]
  23. Wei, A.; Li, Y.; Feng, L.; Feng, Y.; Xie, Z. Frictional study on 30CrNi2MoVA steel based on experiments and finite element simulation: Wear prediction. Coatings 2024, 14, 265. [Google Scholar] [CrossRef] [Scilit]
  24. Yang, J.; Zhou, H.-F.; Zhou, H.-C.; Zheng, Z.; Wang, G.-L. Comparative study of static and dynamic characteristics of non-pneumatic tires with gradient honeycomb structure. J. Braz. Soc. Mech. Sci. Eng. 2024, 46, 366. [Google Scholar] [CrossRef] [Scilit]
  25. Yang, J.; Wang, Y.J.; Zhou, H.C.; Zhou, H.F.; Liu, H.R.; Wang, X.R. Optimizing the Honeycomb Spoke Structure of a Non-Pneumatic Wheel to Reduce Rolling Resistance. Appl. Sci. 2024, 14, 5425. [Google Scholar] [CrossRef] [Scilit]
  26. Zhou, H.C.; Ren, H.Z.; Zhou, H.F.; Xu, T.; Wang, G.L. Investigation of the Spoke Lateral Thickness Effects on Non-pneumatic Tire Radial and Lateral Stiffness. Int. J. Automot. Technol. 2024, 26, 505–523. [Google Scholar] [CrossRef] [Scilit]
  27. Ren, H.Z.; Zhou, H.F.; Xu, T.; Wang, G.L. Parameter analysis and multi-stiffness performance optimization for honeycomb non-pneumatic tires using spoke thickness gradient. J Braz. Soc. Mech. Sci. Eng. 2025, 47, 332. [Google Scholar]
  28. Zang, L.; Peng, X.; Sun, J.; Cui, S.; Bai, Y. Investigation on structural design and grounding characteristics of two dimensional double-U honeycomb non-pneumatic tires. Eur. J. Mech.-A/Solids 2025, 111, 105599. [Google Scholar] [CrossRef] [Scilit]
  29. Li, S.; Sun, Y.; Xu, L. Mechanical response analysis of CRC+AC composite pavement asphalt layer during thermo-mechanical coupling. J. Cent. South Univ. (Sci. Technol.) 2023, 54, 183–196. [Google Scholar]
  30. Wang, J.; Li, Z.; Li, Z. Research on tread wear behavior of tires with different slip rates under braking condition. China Rubber Ind. 2021, 68, 563–568. [Google Scholar]
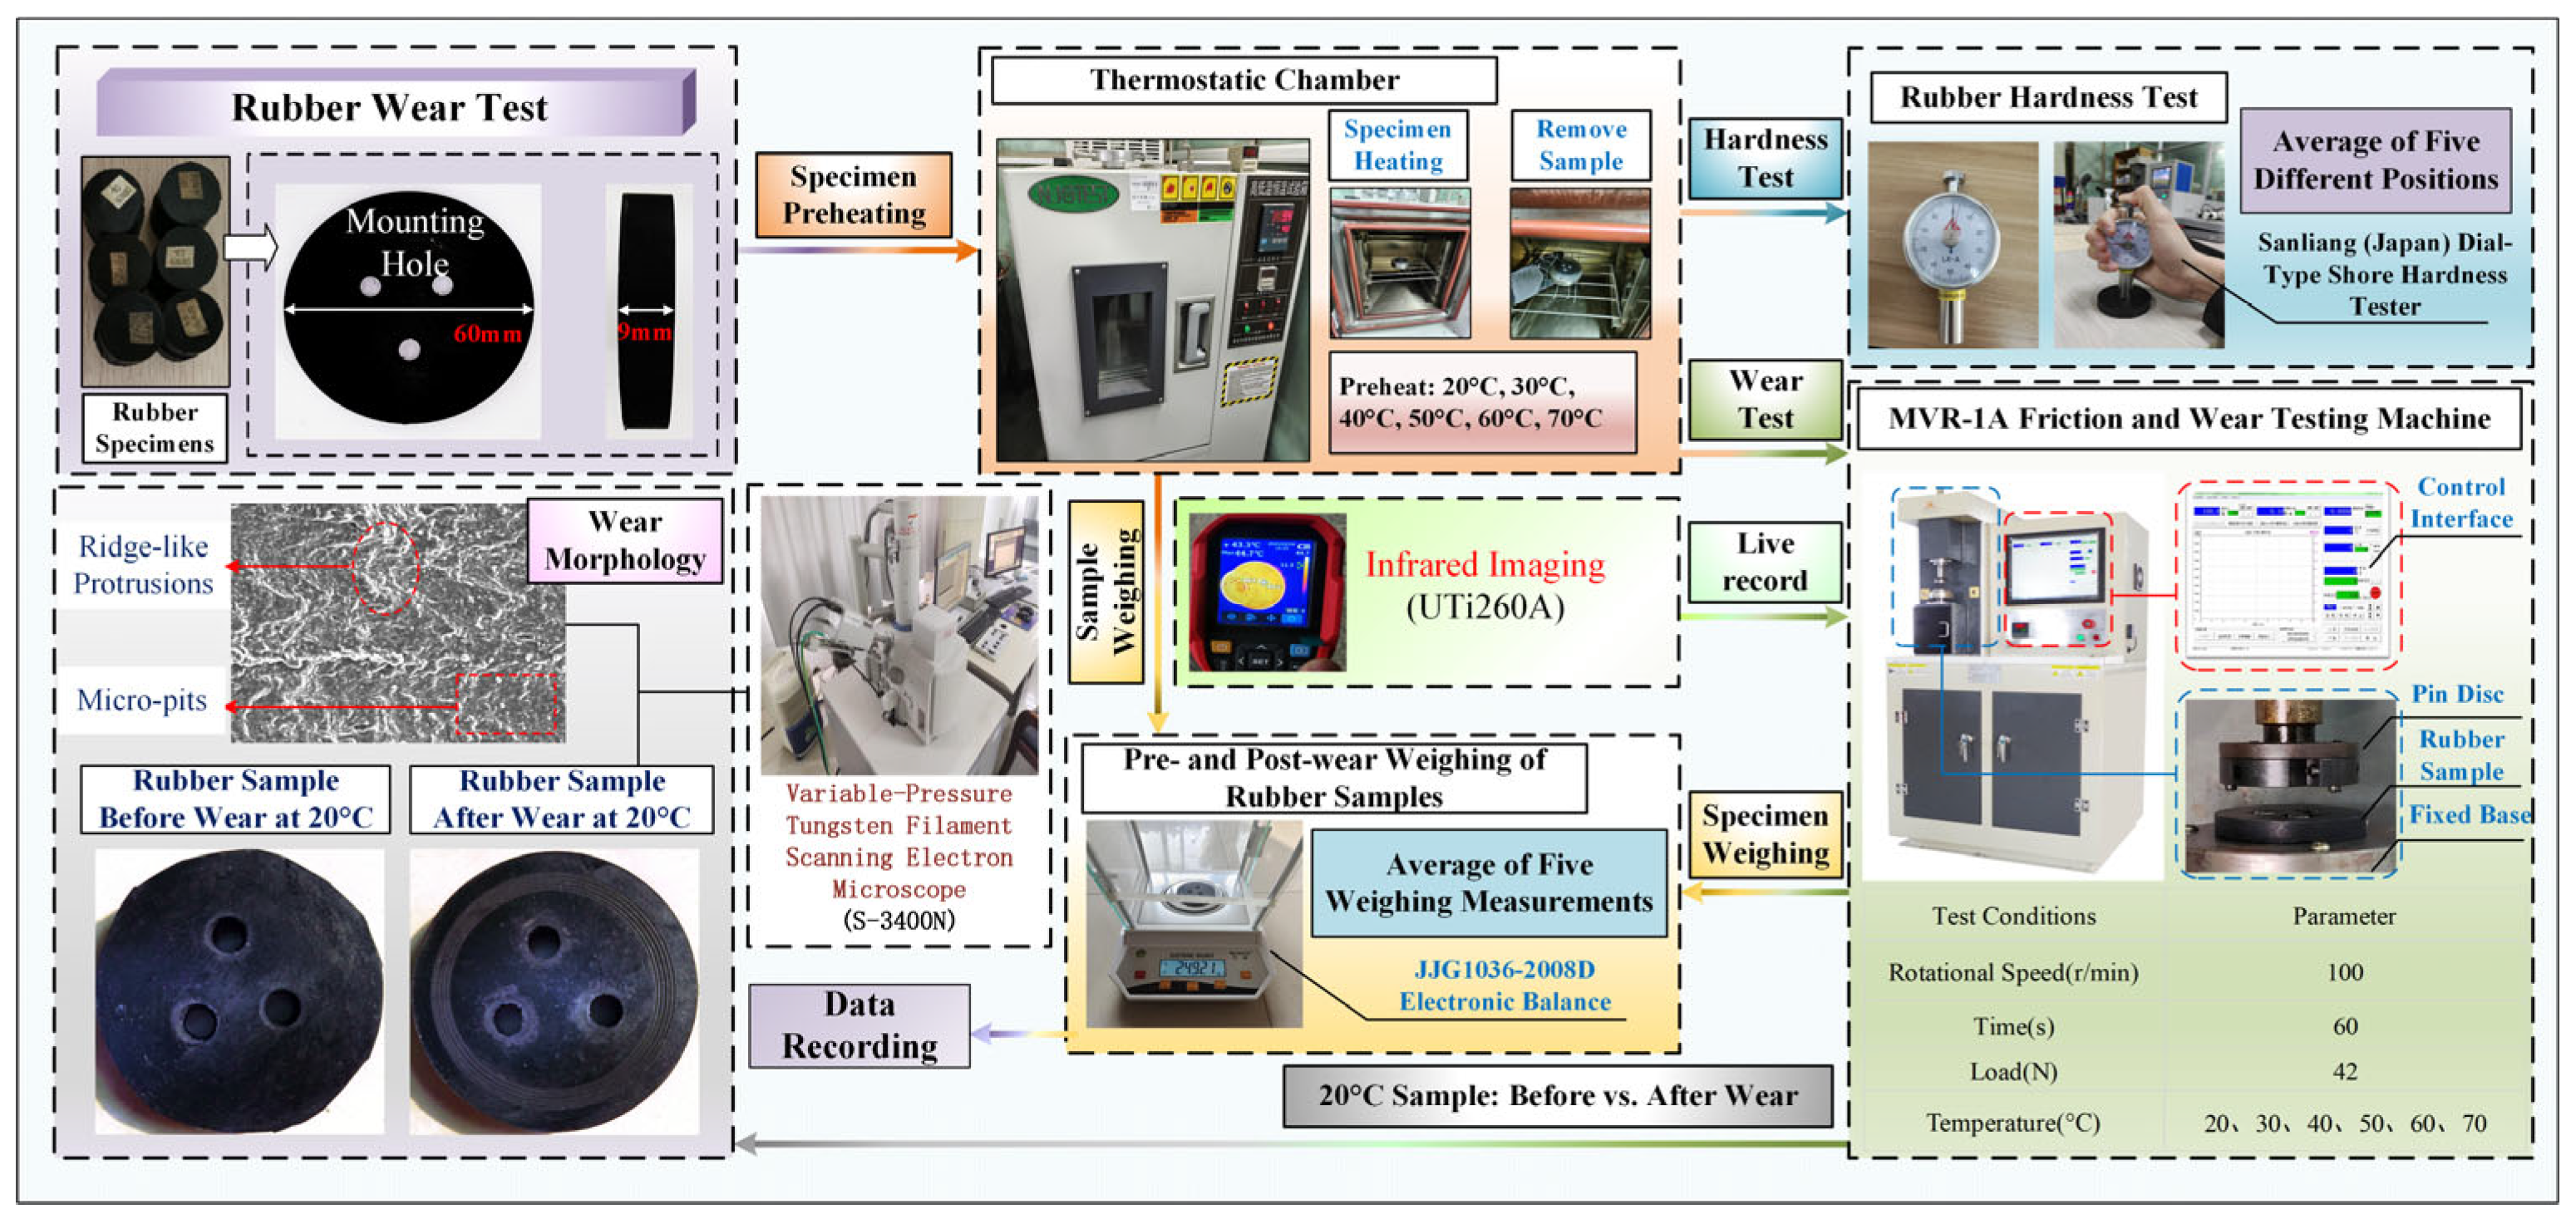
Figure 1. Experimental procedure for rubber friction and wear testing.
Machines 14 00168 g001
Figure 2. Rubber wear coefficient fitting derived from experimental results.
Machines 14 00168 g002
Figure 3. Wear simulation process based on UMESHMOTION subroutine and ALE technique.
Machines 14 00168 g003
Figure 4. Finite Element Simulation and Experimental Comparison of Pin-on-Disc Friction and Wear: (a) Finite Element Model; (b) Temperature Field Validation; and (c) Comparison of Wear Volume.
Machines 14 00168 g004
Figure 5. Structural diagram of the honeycomb non-pneumatic tire.
Machines 14 00168 g005
Figure 6. Initial NPT Honeycomb Unit Structure.
Machines 14 00168 g006
Figure 7. Effect of mesh size on radial stiffness.
Machines 14 00168 g007
Figure 8. Structure and Stiffness Testing of NPTs: (a) NPT-A and NPT-B Honeycomb Unit Structure; (b) Stiffness Test Equipment.
Machines 14 00168 g008
Figure 9. Radial stiffness of honeycomb NPTs: (a) Numerical simulation and (b) Testing.
Machines 14 00168 g009
Figure 10. Simulation and experimental contact pressure comparison of NPT-A and NPT-B.
Machines 14 00168 g010
Figure 11. Comparison of deformation between NPT test sample A and numerical simulation of NPT-A: (a) Experimental Test; (b) Numerical Simulation.
Machines 14 00168 g011
Figure 12. Wear direction of nodes: (a) Internal nodes and (b) Edge nodes.
Machines 14 00168 g012
Figure 13. Edge Node Identification and Wear Direction Control Method for Non-Pneumatic Tires: (a) Distribution of Edge Nodes in the Tread Region and (b) Schematic of Projection-Based Wear Direction Assignment in the UMESHMOTION Subroutine.
Machines 14 00168 g013
Figure 14. Flowchart of model parameter settings and friction–wear simulation.
Machines 14 00168 g014
Figure 15. Ground pressure distribution of NPT under different loads in the Stationary State.
Machines 14 00168 g015
Figure 16. Nephogram of slip rate distribution along the moving direction under different loads.
Machines 14 00168 g016
Figure 17. Cloud diagram of temperature field distribution under different loads.
Machines 14 00168 g017
Figure 18. Variation in wear displacement with time under different loads.: (a) Load 100 N, (b) Load 300 N, (c) Load 500 N, (d) Load 700 N. The color dashed lines represent the fitted slope lines (trend lines) from linear regression.
Machines 14 00168 g018
Figure 19. Nephogram of slip rate distribution along the moving direction under different slip rates.
Machines 14 00168 g019
Figure 20. Cloud diagram of temperature field distribution under different slip rates.
Machines 14 00168 g020
Figure 21. Variation in wear displacement with time at different slip rates:(a) Slip Ratio 2%,(b) Slip Ratio 3%,(c) Slip Ratio 4%,(d) Slip Ratio 5%. The color dashed lines represent the fitted slope lines (trend lines) from linear regression.
Machines 14 00168 g021
Figure 22. Comparison of Tread Geometrical Deformation and Wear Morphology of NPT under Different Loads and Slip Ratios: (a) Load 100 N, (b) Load 700 N, and (c) Slip Ratio 5%.
Machines 14 00168 g022
Figure 23. Wear Volume of NPT under Different Factors and Tread Stress Distribution Comparison under Typical Conditions.
Machines 14 00168 g023
Table 1. Comparison of Hardness and Mass Before and After Wear of Rubber Specimen at 20 °C.
CategoryFirst Group of SpecimensSecond Group of Specimens
Hardness/HA77.37776.2767676.576.8777778
Mass Before Wear/g24.27824.27924.27924.28124.27924.42324.42524.42624.42424.425
Mass After Wear/g24.27424.27424.27624.27724.27424.42124.42124.42224.42124.423
Mass Loss/g0.0040.0050.0030.0040.0050.0020.0040.0040.0030.002
Average Mass Loss per Group/g0.00420.003
Average Mass Loss of Two Groups/g0.0036
Table 2. Mechanical and thermophysical properties of rubber materials.
MaterialElastic Modulus (Pa)Poisson’s RatioThermal Conductivity
(W·m−1·K−1)
Specific Heat Capacity
(J·kg−1·K−1)
Temperature (℃)
Rubber10,500,0000.4850.23110,500,00020
9,580,0000.4850.2519,580,00030
8,940,0000.4850.2678,940,00040
6,970,0000.4850.2676,970,00050
5,870,0000.4850.2855,870,00060
3,850,0000.4850.2933,850,00070
Table 3. Structural diagram of NPT.
TreadOuter CoverOuter ReinforcementShear BandInner ReinforcementInner CoverRim
Radius (mm)292.5286.19285.58276.69276.08272.8177.8
Thickness (mm)7.56.310.618.890.613.285
MaterialSynthetic rubberPolyurethaneHigh-strength steelPolyurethaneHigh-strength steelPolyurethaneAluminum alloy
Table 4. Mechanical of NPT materials.
ComponentDensity
(Kg/m3)
Elastic
Modulus (pa)
Poisson’s Ratio
NPTN280072,000,000,0000.33
PU110032,000,000,000-
S7800210,000,000,0000.29
Rubber108510,500,0000.485
Table 5. Super-elastic Parameters of polyurethane.
iPU
µi (MPa)aigiτiDi
113.5461.5130.1250.0025 × 109
2−2.3382.2120.1250.0200
30.093−2.4710.1250.2000
Table 6. Mechanical and thermal material parameters of rigid pavement.
Model ParameterDensity/
kg·m−3
Elastic Modulus/
Mpa
Poisson’s Ratio/
μ
Specific Heat Capacity/
[J·(kg·k)−1]
Thermal Conductivity/
[J·(m·h·k)−1]
Asphalt Concrete Pavement Layer23006000.27924.94680
Disclaimer/Publisher’s Note: The statements, opinions and data contained in all publications are solely those of the individual author(s) and contributor(s) and not of MDPI and/or the editor(s). MDPI and/or the editor(s) disclaim responsibility for any injury to people or property resulting from any ideas, methods, instructions or products referred to in the content.