Article

The Prediction of Sound Insulation for the Front Wall of Pure Electric Vehicles Based on AFWL-CNN

1
Global R&D Center, China FAW Corporation, Limited, Changchun 130013, China
2
National key Laboratory of Advanced Vehicle Integration and Control, Changchun 130013, China
3
School of Mechanical Engineering, Southwest Jiaotong University, Chengdu 61003l, China
*
Author to whom correspondence should be addressed.
Machines 2025, 13(6), 527; https://doi.org/10.3390/machines13060527
Submission received: 7 May 2025 / Revised: 10 June 2025 / Accepted: 11 June 2025 / Published: 17 June 2025
(This article belongs to the Special Issue Intelligent Applications in Mechanical Engineering)

Abstract

The front wall acoustic package system plays a crucial role in automotive design, and its performance directly affects the quality and comfort of the interior noise. In response to the limitations of traditional experimental and simulation methods in terms of accuracy and efficiency, this paper proposes a convolutional neural network (AFWL-CNN) based on adaptive weighted feature learning. Using a data-driven method, the sound insulation performance of the entire vehicle’s front wall acoustic package system was predicted and analyzed based on the original parameters of the front wall acoustic package components, thereby effectively avoiding the shortcomings of traditional TPA and CAE methods. Compared to the traditional CNN model (RMSE = 0.042, MAE = 3.89 dB, I-TIME = 13.67 s), the RMSE of the proposed AFWL-CNN model was optimized to 0.031 (approximately 26.19% improvement), the mean absolute error (MAE) was reduced to 2.84 dB (approximately 26.99% improvement), and the inference time (I-TIME) increased to 17.16 s (approximately 25.53% increase). Although the inference time of the AFWL-CNN model increased by 25.53% compared to the CNN model, it achieved a more significant improvement in prediction accuracy, demonstrating a reasonable trade-off between efficiency and accuracy. Compared to AFWL-LSTM (RMSE = 0.039, MAE = 3.35 dB, I-TIME = 19.81 s), LSTM (RMSE = 0.044, MAE = 4.07 dB, I-TIME = 16.71 s), and CNN–Transformer (RMSE = 0.040, MAE = 3.74 dB, I-TIME = 19.55 s) models, the AFWL-CNN model demonstrated the highest prediction accuracy among the five models. Furthermore, the proposed method was verified using the front wall acoustic package data of a new car model, and the results showed the effectiveness and reliability of this method in predicting the acoustic package performance of the front wall system. This study provides a powerful tool for fast and accurate performance prediction of automotive front acoustic packages, significantly improving design efficiency and providing a data-driven framework that can be used to solve other vehicle noise problems.

1. Introduction

Noise, vibration, and harshness (NVH) performance is one of the key indicators for evaluating the comfort of a vehicle [1,2]. With improvements in living standards and the diversification of user demands, NVH performance has increasingly become a critical factor in reflecting the quality of a vehicle, with particular emphasis on the control of interior noise. As a structural system used to reduce interior sound pressure levels and improve airborne sound transmission characteristics, acoustic packages have a significant impact on the sound field characteristics of the entire vehicle [3]. Among them, the front wall acoustic package is a key barrier that isolates powertrain noise from the passenger compartment and is the core component of an acoustic package system. Its sound absorption and insulation performance directly determine the NVH level of the entire vehicle [4]. High-performance acoustic packaging not only helps reduce interior noise and improve ride comfort and quality perception but also plays a positive role in promoting vehicle weight reduction and cost control. Therefore, in-depth research and an accurate prediction of the sound insulation performance of the front wall system have important engineering application value and practical significance.
Currently, research on the sound insulation performance of front panels primarily relies on experimental testing and computer-aided engineering (CAE) methods [5]. As a core means of high-frequency noise control, the design of acoustic packages is highly dependent on numerical simulation tools. In the CAE technology system, the statistical energy analysis (SEA) method has become a key tool for solving complex noise control scenarios in acoustic package design due to its specialized ability to handle vibration–acoustic coupling problems in the high-frequency range. With the engineering development of the SEA method, related research has made continuous progress. Chen et al. [6] established a SEA model for domestic vehicle models, analyzed the causes of in-vehicle noise under idle conditions, and verified the simulation accuracy through experiments. Musser [7] integrated SEA with material cost and quality constraints to achieve the synergistic optimization of acoustic performance and resource efficiency. Lee et al. [8] studied the sound transmission loss of the acoustic system in pure electric vehicles (PEVs) based on SEA and used orthogonal testing to optimize sound absorption and insulation performance. Manning [9] introduced a variance prediction model to extend the applicability of SEA in the mid-frequency range. Mistry et al. [10] improved the accuracy of SEA modeling through sensitivity analysis. Tang et al. [11] combined testing and simulation to construct a commercial vehicle NVH performance prediction model, controlling the maximum error within 2 dB(A). Avenati et al. [12] proposed a new acoustic package design and experimentally validated its effectiveness in improving speech intelligibility and sound insulation performance in the mid-frequency range. Noguchi et al. [13] utilized multi-layer structure estimation technology to balance lightweight and high sound insulation performance in the high-frequency range. Dong et al. [14] achieved a reduction of approximately 3 dB(A) in interior noise by adjusting the ratio of rigid and flexible layers in firewall materials.
Although simulation methods such as SEA have achieved good results in front-end sound insulation research, their numerical results still need to be calibrated and verified using experimental data. In recent years, researchers have increasingly focused on establishing standardized, repeatable testing systems to enhance the accuracy and applicability of models. Ameduri Salvatore et al. [15] validated the sound insulation model of door seals under cruising conditions by comparing prototype vehicle data with laboratory data. Zhang et al. [16] studied the effect of floor and ceiling structures on impact sound insulation performance and pointed out that floating structures can effectively improve impact sound insulation. Chen [17] combined gray correlation analysis and experimental optimization to achieve a multi-objective trade-off design of acoustic packages under high-speed conditions. Kronowetter [18] developed a new type of wheel arch liner material that significantly improved the noise performance of the interior. Oettle and Sims [19] proposed a variety of wind noise control strategies that effectively address the complexity of its propagation paths. Doutres and Atalla [20], based on impedance tube experiments, proposed three acoustic measurement methods for evaluating the sound insulation performance of double-wall structure sound-absorbing blankets. Amadasi et al. [21] proposed a method for measuring the sound transmission loss of 2D and 3D automotive body components using acoustic energy ratio and reverberation field control, solving the problem of standardization in sound insulation testing of small components. Accuracy was ensured through steel plate calibration and theoretical model verification, providing a practical tool for acoustic design in the industrial field.
Traditional methods are relatively mature in acoustic package design and optimization and have good engineering applicability, but there are still some limitations in practical applications. On the one hand, simulation-based methods rely on a large number of accurate parameters, and the modeling process is complex, requiring model verification and other difficult tasks. On the other hand, although experimental methods have high fidelity, they have long testing cycles and high costs, and they are easily affected by environmental factors, increasing the uncertainty of results. Compared with traditional methods, data-driven methods do not require the precise physical parameters needed for CAE. Instead, they directly utilize data-driven feature extraction, bypassing the high-fidelity physical modeling process, and are more adaptable to nonlinear or boundary condition-complex acoustic phenomena. Furthermore, they significantly improve efficiency compared with experimental, reduce testing costs and uncertainty, and are easier to integrate into end-to-end optimization processes to shorten optimization cycles, gradually demonstrating broad prospects in automotive acoustic design [4]. These methods leverage large amounts of historical data and computational intelligence algorithms to automatically learn the mapping relationships between variables, and they have been widely applied in engineering modeling.
Existing research indicates that data-driven methods have significant advantages in automotive NVH optimization, mainly in the following aspects: First, they have the ability to extract potential patterns from high-dimensional multi-source data, which can effectively reduce dependence on physical modeling. Second, the modeling process is flexible and suitable for nonlinear systems and high-dimensional parameter scenarios. Third, automatic modeling and optimization functions significantly improve modeling efficiency and economy [22]. Relevant studies have verified its effectiveness in acoustic package prediction and optimization. For example, Schaefer et al. [23] constructed a mapping model of acoustic package material types and cost and weight based on neural networks, combined with a particle swarm optimization scheme, achieving a 15.21% and 9.7% reduction in weight and cost, respectively. Song et al. [24] developed an NVH performance prediction process based on machine learning, shortening the development cycle while improving prediction accuracy. Huang et al. [25] proposed an acoustic quality prediction model combining speed-tracking psychoacoustic indicators with adaptive learning rate convolutional neural networks (ALRT-CNNs), effectively reflecting the subjective characteristics of non-stationary noise inside PEVs. Wang et al. [26] constructed a multi-objective mapping model to predict multiple sound quality metrics and achieve optimized control. Guo et al. [27] designed a variable step size minimum mean square error algorithm to effectively suppress in-vehicle impact noise. Shang et al. [28] utilized a genetic algorithm-reverse propagation neural network to study the influence of structural paths on sound quality. Luo et al. [29] combined a microphone array with graph neural networks to identify noise sources in railway bogies, validating its advantages in array flexibility and cost control. Huang et al. [30] further proposed a regularized deep convolutional neural network (CNN) model combined with neuron visualization technology to perform a quantitative assessment of sound quality.
Based on the above research, it can be seen that the sound insulation performance of front wall systems has highly nonlinear characteristics. Traditional finite element analysis or statistical energy analysis has limited accuracy when dealing with such problems, making it difficult to achieve high-precision predictions of actual performance. At the same time, although experimental testing can provide relatively accurate reference data, factors such as high cost and long cycles limit its application in rapid design iteration processes [31]. Data-driven methods provide new ideas for solving the above problems. The data-driven front wall system sound insulation performance prediction method uses actual measurement data as input. It not only has the characteristics of easy parameter acquisition and high modeling efficiency but also can continuously improve the model performance through a continuous learning mechanism, thereby significantly improving the simulation accuracy while reducing the dependence on traditional experiments. However, existing data-driven methods still face challenges such as limited sample size and insufficient feature extraction in the modeling process, which in turn affect the generalization ability of the model [32].
To further improve the accuracy and robustness of the front wall system sound insulation performance prediction, this paper proposes an adaptive feature weight learning convolutional neural network (AFWL-CNN) method based on adaptive weighted feature learning. This method enhances the ability to extract key acoustic features by introducing an adaptive weighting mechanism and combines the advantages of CNN in handling nonlinear mapping problems to significantly improve prediction accuracy and stability. This study aims to construct an efficient and scalable front surround sound insulation prediction model to provide theoretical support and technical paths for the rapid iterative design of automotive acoustic packages and promote the engineering application of data-driven methods in the field of automotive NVH optimization.
The structure of this paper is as follows: Section 2 introduces CNN-related theories and proposes the AFWL-CNN method. Section 3 introduces the front wall system sound insulation performance test plan based on the reverberation chamber–semi-anechoic chamber method and presents the original parameter table of the front wall system, as well as 60 sets of sample data based on the experimental design. In Section 4, the AFWL-CNN prediction model is established, the prediction results are presented, and error analysis is performed. Section 5 compares and analyzes the AFWL-CNN model with the CNN, Long Short-Term Memory (LSTM), AFWL-LSTM, and CNN–Transformer models; verifies the effectiveness of the proposed method through comparison of the results; and uses the model to predict a new set of front wall system parameters for comparison and verification with the measured values. Section 6 summarizes the content of the entire study and explains the core contributions of this paper. Section 7 discusses the limitations of this study and proposes directions for future research.

2. The Proposed Method

2.1. CNN Introduction

Convolutional neural network (CNN) is a type of deep learning model widely used for processing data with grid structures (such as images, videos, and audio) [33]. Its core idea is to automatically extract representative features from the original input through operations such as convolution and pooling, map the data to a high-dimensional feature space, and then use fully connected layers to complete classification or regression tasks. CNNs have significant structural advantages, particularly in handling image transformations such as rotation, scaling, translation, and skew, demonstrating strong robustness and the ability to automatically identify key features under unsupervised conditions [34]. As a result, CNNs have been widely applied in image recognition, speech processing, and other complex pattern recognition fields, achieving significant results in feature extraction and parameter sharing and gradually becoming one of the core algorithms in intelligent perception systems [35].
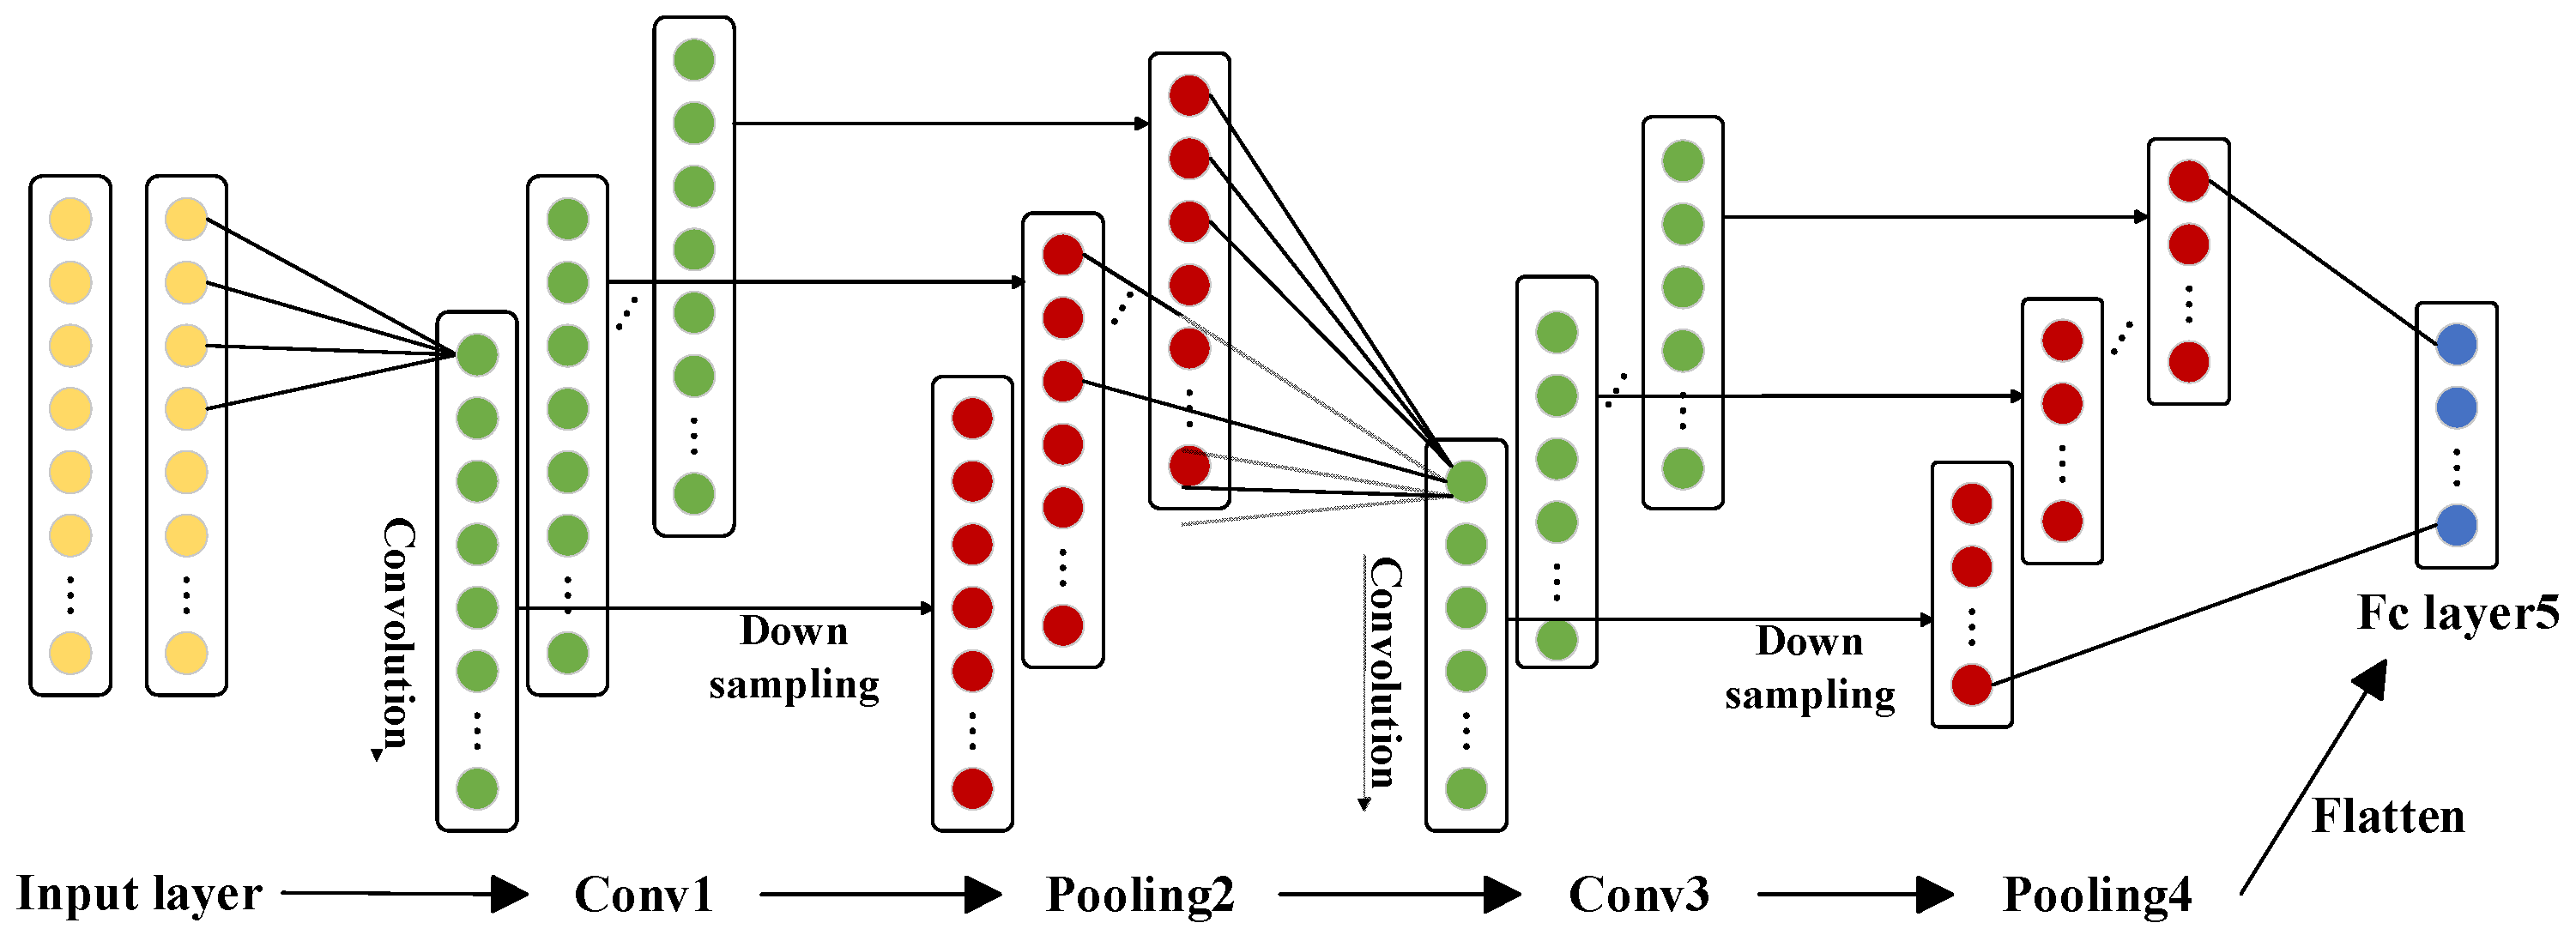
The basic structure of a CNN is shown in Figure 1, which mainly consists of an input layer, convolution layers, activation layers, pooling layers, normalization layers, fully connected layers, and an output layer [36,37]. The input layer receives raw image data and performs preliminary preprocessing. The convolutional layer is the core module of CNNs, primarily responsible for feature extraction. This layer contains multiple trainable convolutional filters (filters), each of which corresponds to a learnable weight parameter and a bias vector (bias vector). Each neuron in the convolutional layer is connected only to a local region in the previous layer, the size of which is determined by the size of the convolutional kernel and is commonly referred to as the “receptive field,” a concept similar to the receptive field of neurons in the biological visual cortex [34]. During feature extraction, the convolution kernel slides across each local region with a specific stride, performing matrix multiplication on the features within the region and accumulating the bias terms to generate a new feature map [38].
x j i = f i M i x i ( l 1 ) * k i j l + b j l
In the above equation, l is the number of convolution layers; f is the activation function; M i is the number of feature maps in layer l 1 ; x i l 1 is the j-th output feature map in layer l ; k i j l is the convolution kernel in layer l ; b j l is the bias in layer l ; and * is the convolution operator.
The pooling layer, also known as the downsampling layer, serves to further refine features, reduce feature map size, and prevent overfitting. The pooling operation is similar to the convolution process, sampling the input feature map by setting the pooling window size, stride, and padding method [39]. Common pooling strategies include max pooling and average pooling. In max pooling, the maximum value within the pooling window is selected as the output. In average pooling, the average value of all elements within the window is used as the output. These operations not only effectively retain the most significant local feature information but also enhance the model’s generalization ability.
After completing spatial feature extraction, the fully connected layer is used to map the extracted high-dimensional feature vectors to the target output space, thereby achieving classification or regression tasks [40]. Its input is the output feature map from the previous layer, which is flattened and then passed into the fully connected neurons. Each input node in this layer is fully connected to each output node in the next layer, and each connection line has a trainable weight parameter. Through the fully connected operation, the network can achieve complex function approximation in a nonlinear feature space, providing a basis for the final output.
Convolutional neural networks not only include forward propagation mechanisms but also possess backward propagation capabilities. During backward propagation, the model calculates the error between the loss function and the actual values and then uses optimization algorithms such as gradient descent to update the network parameters, thereby continuously optimizing the model performance [41]. The loss function is used to measure the deviation between the predicted values and the actual values and is an important indicator for evaluating model performance. Commonly used loss functions include mean squared error loss and root mean squared error loss. In regression problems, RMSE is used to evaluate errors and constrain the training process. It is defined as follows:
L t = i = 1 N f i f ¯ l 2 N
In the above equation, L t represents the loss of the t-th iteration; N is the number of samples; and f i and f l ¯ represent the true labels and predicted labels, respectively.

2.2. The Proposed AFWL-CNN

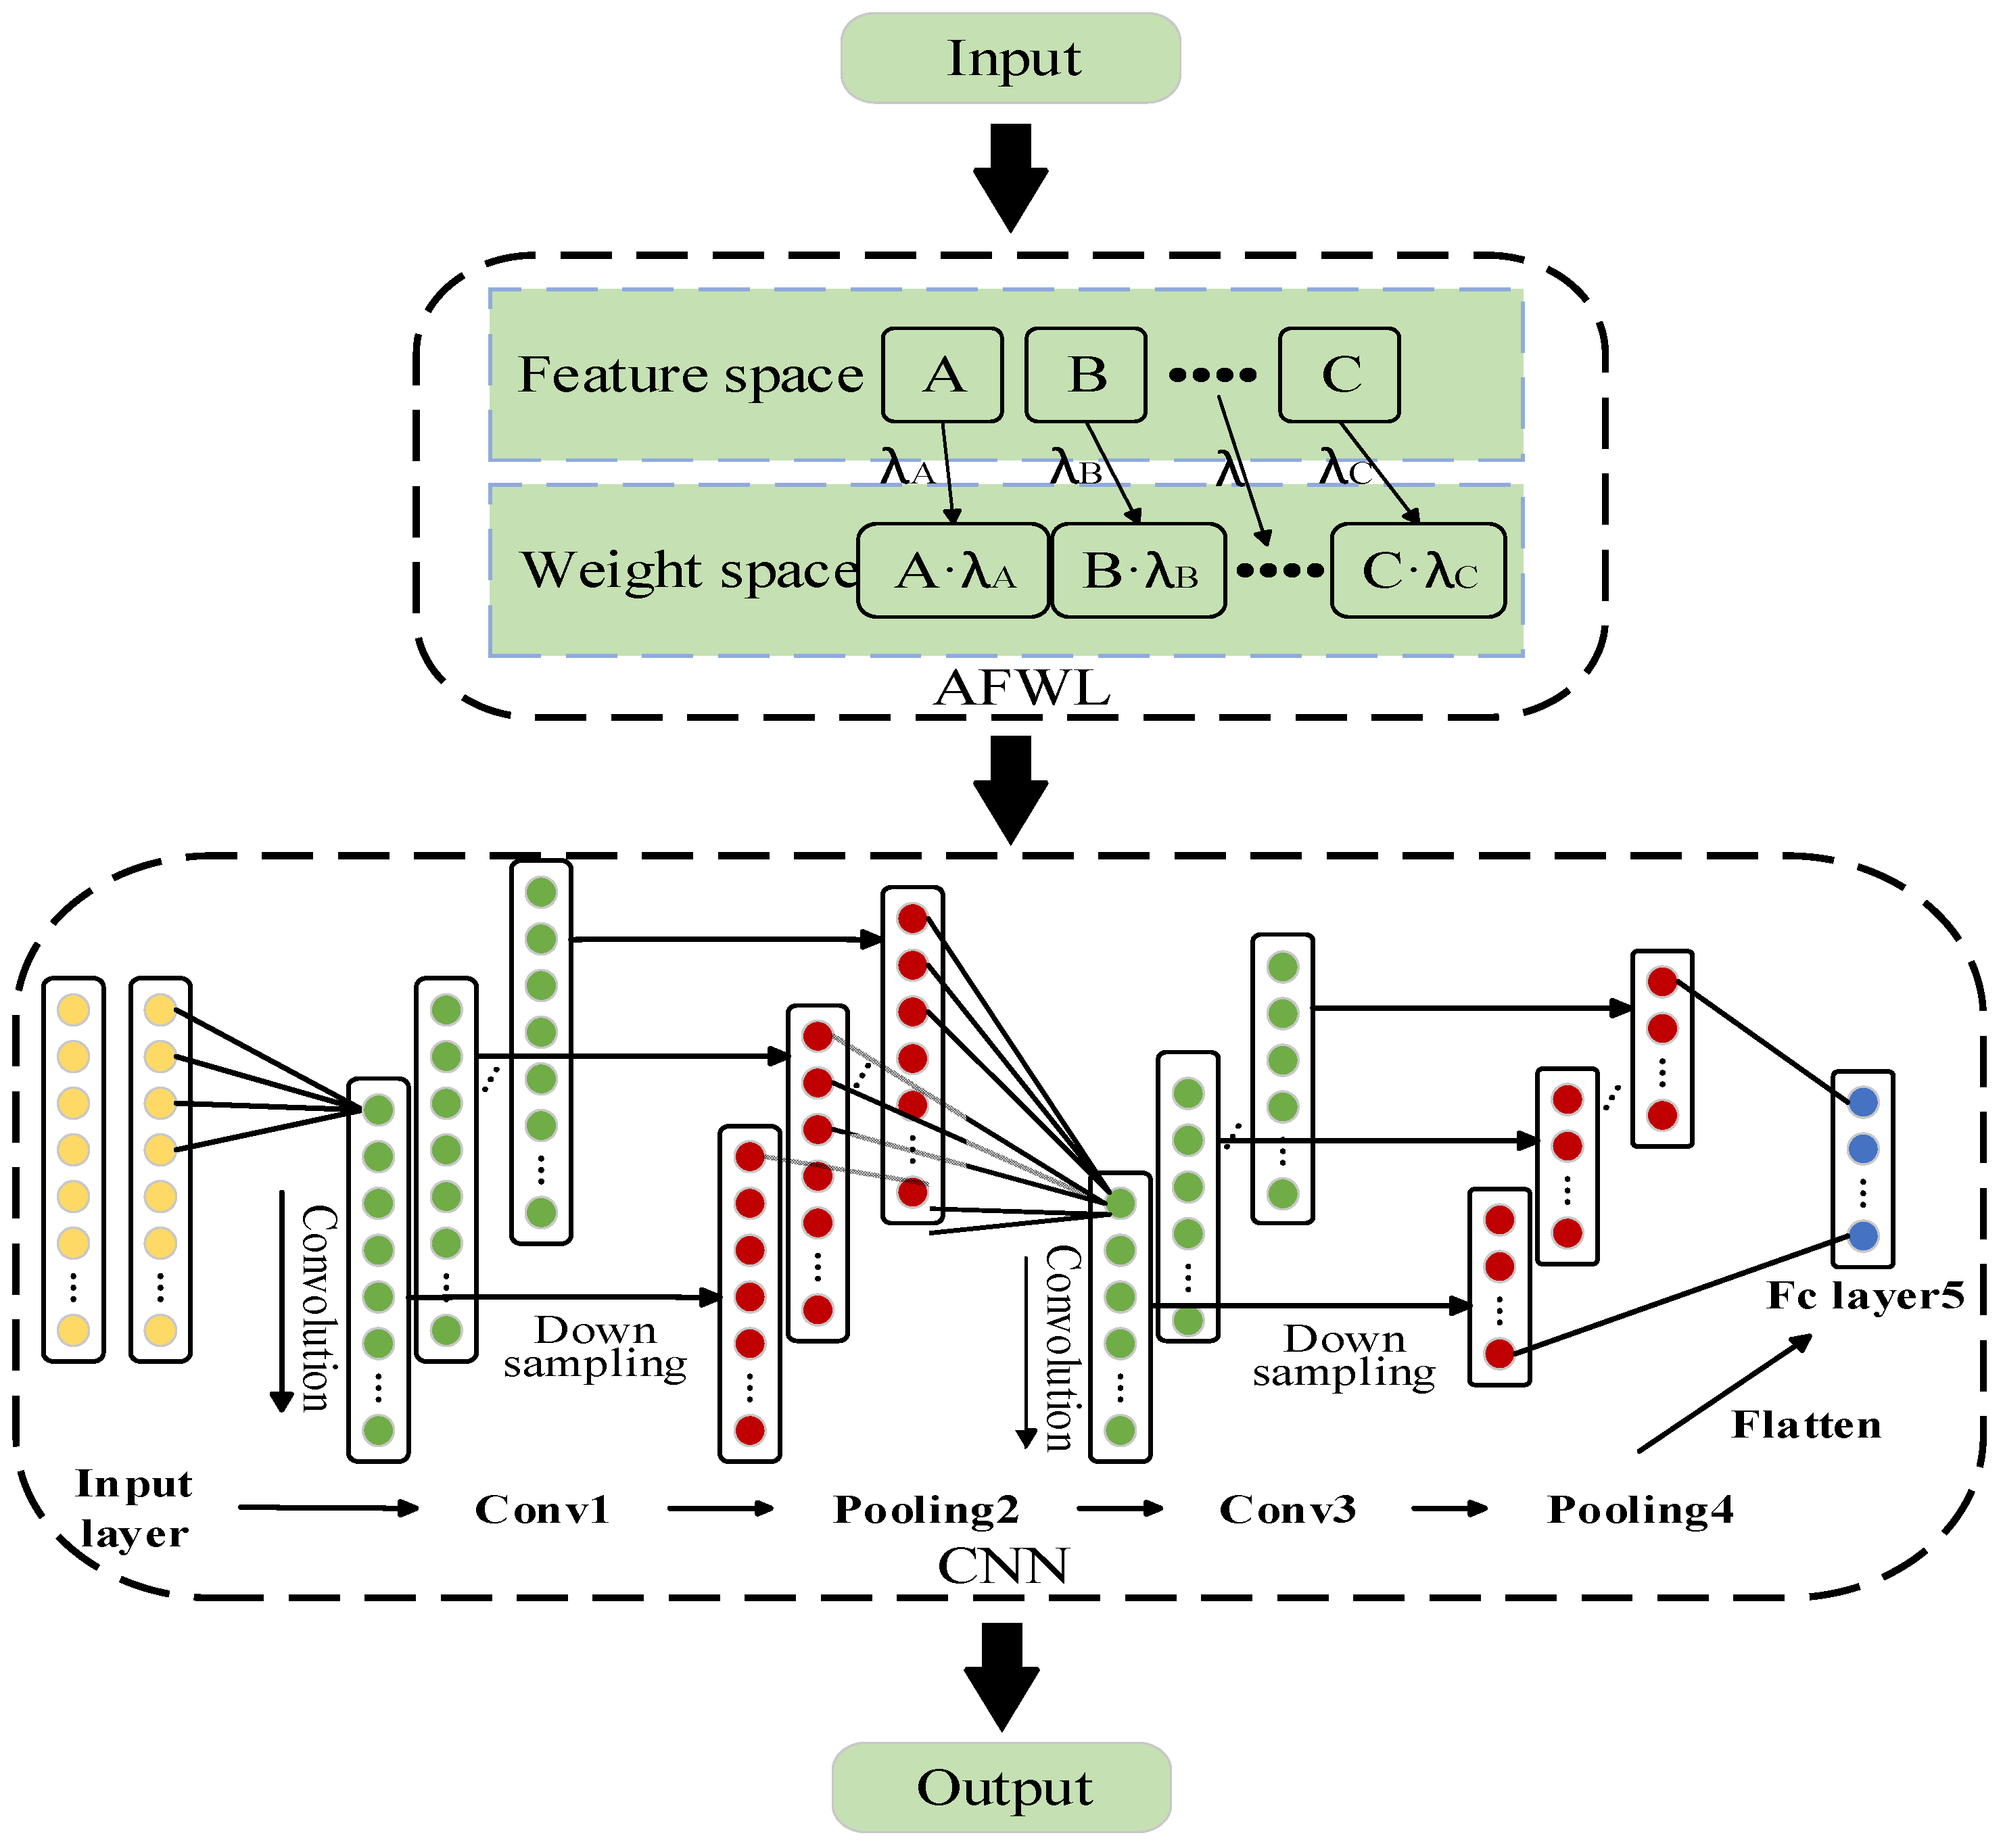
CNN can extract feature information from input images layer by layer through multi-layer convolution operations. However, when processing time series data, especially tasks involving long-range dependency modeling, traditional CNNs have certain limitations in feature expression. To enhance the performance of CNNs in time series modeling, this paper introduces an adaptive feature weighting layer (AFWL) as an improved module.
The design concept of AFWL draws inspiration from the attention mechanism in Transformer networks [42]. Its core idea is to dynamically adjust the weights of each feature channel based on the input data, highlight key features, suppress redundant information, and thereby enhance the model’s sensitivity and adaptability to differences in feature importance [43]. Through this mechanism, the model can more effectively analyze datasets with uneven feature importance distribution and significantly enhance feature extraction and expression capabilities. In AFWL, the feature weight w t i corresponding to the i-th feature at the t-th time step is given by Equation (3):
w t i = σ ( W w x t i + θ )
In the above equation, W w is the weight matrix, θ is the bias term, σ is the Sigmoid activation function used to normalize the weights to the range [0, 1], and x t i represents the i-th feature at the t-th time step.
The input feature representation is typically a vector containing all features at the t-th time step, as shown in Equation (4):
X t = [ x t 1 , x t 2 , , x t n ]
Correspondingly, the weighted feature vector x t w e i g h t e d is obtained by element-wise multiplication, and its expression is expressed in Equation (5):
x t w e i g h t e d = [ w t 1 x t 1 , w t 2 x t 2 , , w t n x t n ]
In a multi-task learning framework, to further improve the model’s adaptability to specific tasks, AFWL can dynamically adjust the normalization weights of each feature according to the degree of dependence of different tasks on the features. At this time, the weight calculation form adopts Softmax function normalization, which is defined in Equation (6):
w t i = exp W w x t i + θ j 1 n exp W w x t i + θ
In the above equation, the numerator is the weight calculation of feature x t i , and the denominator is the sum of all feature weights, which is used for normalization.
The weighted feature vectors x t w e i g h t e d output by the AFWL module are used as input for the CNN, which helps to enhance the network’s focus on key information while suppressing the influence of non-key features, thereby optimizing feature representation quality and improving the learning effectiveness and generalization ability of the entire model [44].
In the improved model proposed in this paper, AFWL is embedded between the original CNN structure and the input features as a pre-weight adjustment layer. The neural network performs backpropagation by calculating the gradient of the loss function with respect to the network parameters (including the weights in the adaptive weight layer), thereby updating all the parameters in the neural network. Throughout the training process, the parameters of the adaptive weight layer (i.e., the feature weights) are continuously updated to better reflect the importance of each feature for the prediction task. The main advantage of this layer is that it enhances the model’s flexibility and adaptability, enabling it to better handle data with complex or non-uniform feature importance while providing the neural network with a flexible and effective way to dynamically adjust its focus on features at different time steps. The overall structure of the AFWL-CNN model is shown in Figure 2.

3. Experiments Using Front Wall STL

In acoustic package systems, sound insulation performance is usually evaluated based on the sound insulation index as a key performance indicator. The sound insulation index is used to measure the degree of attenuation of sound energy before and after passing through a material. It is defined as the ratio of incident sound energy to transmitted sound energy multiplied by 10, usually expressed as R (dB). The mathematical formula is shown in Equation (7):
R = 10 lg E E t = 10 lg 1 τ
In this formula, E is the total sound energy incident on the material, E t is the sound energy transmitted through the material, and τ is the transmission coefficient.
Sound insulation is also commonly referred to as sound transmission loss (STL) [45]. STL is defined as the logarithmic value of the ratio of the incident sound energy on one side of the structure to the transmitted sound energy on the other side, multiplied by 10, with units in decibels (dB). The higher the STL value is, the smaller the transmitted sound energy, indicating better sound insulation performance of the material. The expression for STL is shown in Equation (8):
S T L = 10 log W 1 W 2
In the above equation, W 1 is the incident sound energy, and W 2 is the transmitted sound energy. These values can be calculated using the measurement results, and the expression is shown in Equation (9):
W 1 = L p 2 4 ρ c S
In the above equation, L p is the average sound pressure level in the reverberation chamber, in Pa; S is the area of the measured object, in m2; ρ is the air density, taken as 1.29 kg/m3; and c is the speed of sound in air, taken as 340 m/s.
Given the acoustic characteristics of a reverberation chamber, such as low sound absorption, long reverberation time, and uniform distribution of sound energy, the sound pressure level at various spatial locations within the chamber remains essentially constant. The average sound pressure level within the chamber can be calculated by measuring the sound pressure levels at three locations using three sound sensors [46].
W 2 = L 1 S
In this equation, L 1 is the average sound intensity on the surface of the measured object, with units of W/m3. The average sound intensity of the measured object is obtained by measuring at multiple locations on the measured object using a sound intensity probe. S is the area of the measured object.
Combining the above equations, we obtain the expression for calculating STL:
S T L = 10 log L p 2 4 ρ c L 1
In this study, we used the reverberation chamber–semi-anechoic chamber method to test the sound insulation performance of the front wall system, with STL as the evaluation index. The test process strictly followed the SAE J1400-2700 standard established by the Society of Automotive Engineers (SAE) [47]. In the reverberation chamber–semi-anechoic chamber structure, the reverberation chamber served as the sound source chamber for arranging white noise excitation sources, while the semi-anechoic chamber served as the receiving chamber for obtaining the sound energy data of the test samples. The front wall system samples were installed at the test window between the two chambers. During testing, the excitation source generated a white noise signal with a total sound pressure level of 120 dB. Four sound pressure sensors were installed in the reverberation chamber to measure the sound pressure level under the reverberation field, while two sound intensity probes were used in the semi-anechoic chamber to measure the sound intensity values on the surface of the tested sample. Based on Equation (11), the STL values for each tested sample were further calculated. The experimental setup is shown in Figure 3 and Figure 4.
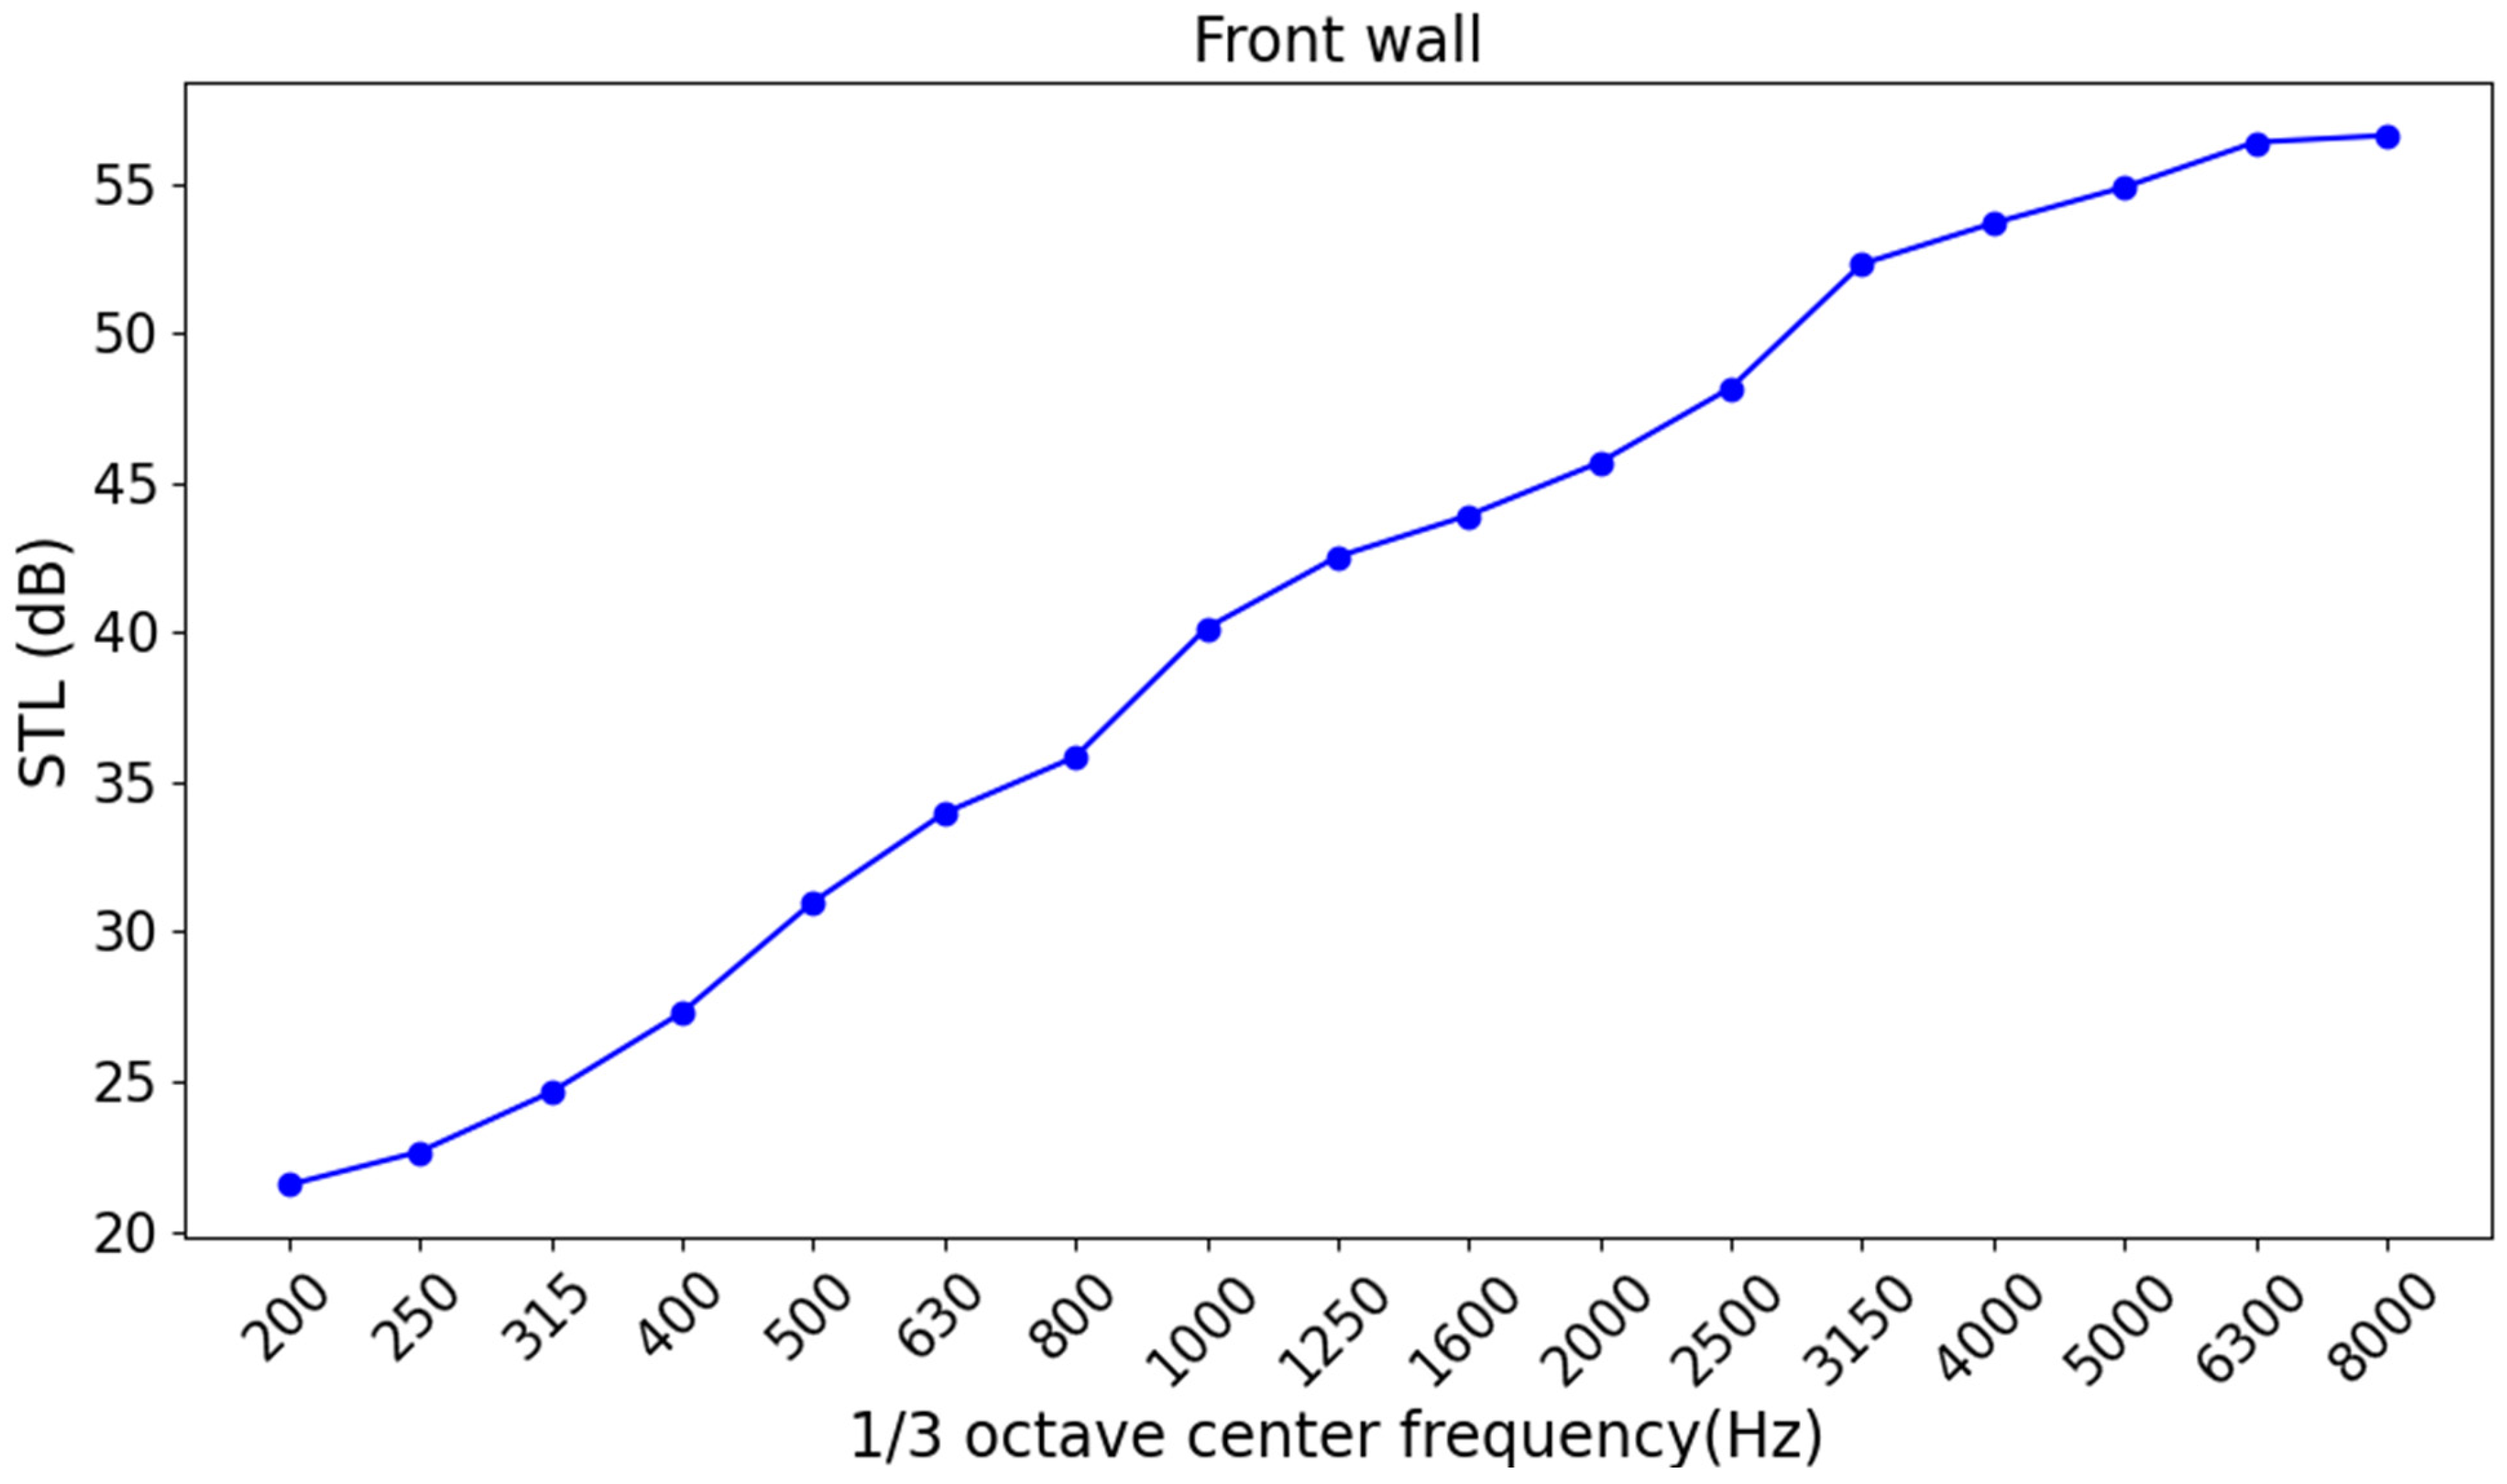
Based on the above test methods, a total of 60 sets of sample data on the sound insulation performance of pure electric vehicle front wall systems were obtained. The 60 sets of data were collected from five different models of pure electric vehicles. Among them, the STL test results of a set of front wall system samples under 17, 1/3 octave bands are shown in Figure 5. The STL values in the low-frequency band (200–500 Hz) were low, indicating that the front wall system had limited ability to block low-frequency noise and a weak sound insulation effect. As the frequency increased, the STL value of the front wall system gradually increased, and the sound insulation performance gradually improved. In the high-frequency range (2000–8000 Hz), the sound insulation performance of the front wall system was excellent, and the sound insulation effect was significant.
The original structural parameters of a typical front wall system component of a pure electric vehicle used in the experiment are shown in Table 1, which includes the total area of the three components of the front wall system and the sound insulation material coverage index. The thickness of the inner and outer front wall sound insulation pads is shown in Table 2. The equivalent thicknesses of the inner and outer front wall sound insulation pads were calculated based on the thickness and area ratio of each acoustic package. The thickness parameters of the front wall sheet metal are listed in Table 3. The equivalent thickness of the front wall sheet metal was calculated based on the thickness and area ratio of each sheet metal.

4. Development of AWFL-CNN

4.1. Establishment of AFWL-CNN Model

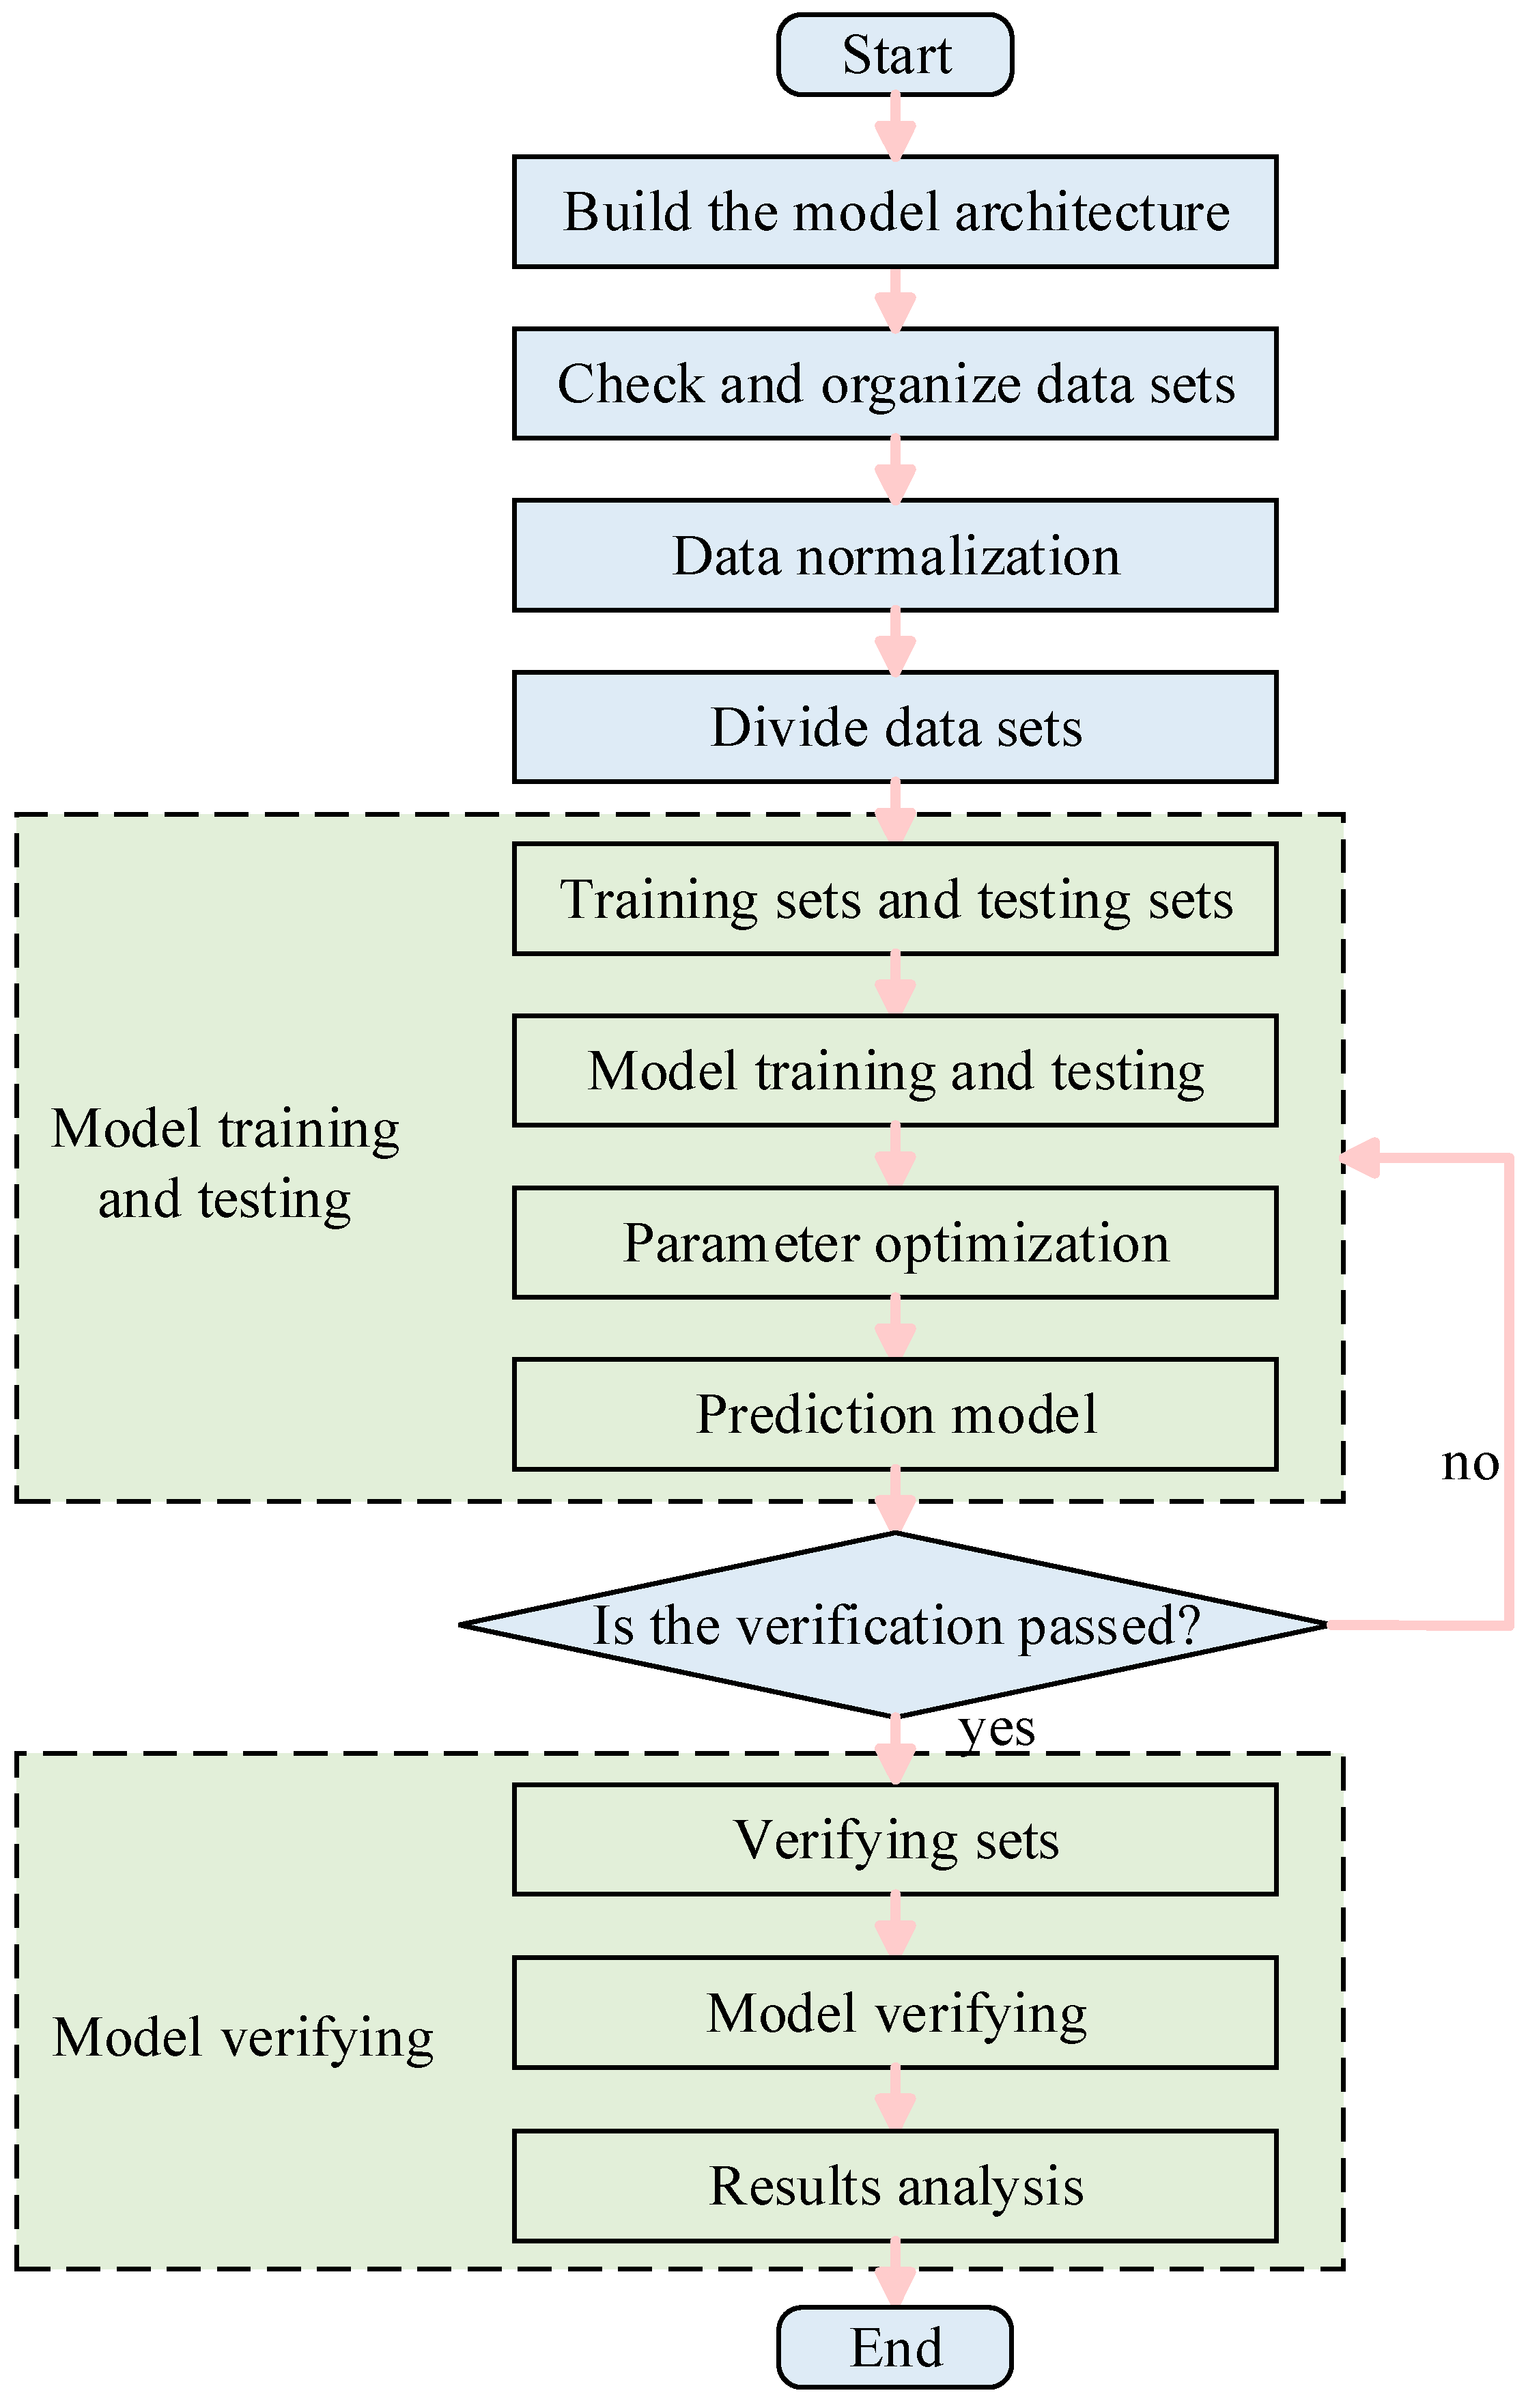
The construction of the acoustic package front wall system’s sound insulation performance prediction model for pure electric vehicles mainly consists of three parts: The first part is data preparation and preprocessing. The second part is algorithm model construction and training, including network architecture design, hyperparameter optimization configuration, and specific implementation of model iteration training. The third part is the verification of the model’s prediction results. The specific construction process of the prediction model is shown in Figure 6. Following this process, we established a sound insulation performance prediction model for the front wall acoustic package system of pure electric vehicles based on the adaptive feature weighting convolutional neural network AFWL-CNN algorithm.
The sample data used for modeling were obtained from the experimental tests described in Section 3, which included 60 sets of sound insulation performance data for front wall systems. The input parameters of the model included the areas and equivalent thicknesses of the front wall sheet metal, inner front wall sound insulation pad, and outer front wall sound insulation pad. The output parameters were the sound transmission loss values of the entire vehicle’s front wall system at 17, 1/3 octave frequency points in the range of 200 Hz to 8000 Hz. Part of the model’s input and output data are shown in Table 4 and Table 5, respectively.
Due to the large differences in the numerical scales of the model input and output parameters, normalization was performed on the data before importing it into the model to improve training accuracy and model stability. The normalization process maps the sample feature values to the [0, 1] interval, effectively eliminating the impact of different feature dimensions on model convergence speed and prediction accuracy while reducing training bias caused by feature scale differences [48]. The 60 normalized samples were randomly divided into a training set (48 groups) and a validation set (12 groups) in a ratio of 8:2. Among them, the training set was used for model training and parameter tuning, while the validation set was used to verify model performance and avoid overfitting. By analyzing the error between the model prediction results and the actual values, the validation set can effectively evaluate the hierarchical prediction ability of the model and provide a basis for subsequent model structure optimization.
The constructed AFWL-CNN model consists of one adaptive feature weight layer, two convolutional layers, and two fully connected layers. The adaptive weight layer defines the ColumnWeightingLayer class to assign initial weights to each input feature and sets them as trainable parameters to be updated during training. Each convolutional layer is followed by a max pooling layer, and a Dropout layer is introduced to enhance the model’s generalization ability and suppress overfitting. Finally, the feature information is output as STL prediction results through a linear fully connected layer. The parameters of each layer are set as follows: the convolution layer calls the torch.nn.Conv1d function, setting the input channel number in_channels, the output channel number out_channels, convolution kernel size kernel_size = 2, and stride = 1. The pooling layer calls the torch.nn.MaxPool1d function. The Dropout layer calls the torch.nn.Dropout function with a dropout rate of 0.5. The fully connected layer uses the torch.nn.Linear function, specifying the input vector length input_size and the output vector length output_size. The model was trained and deployed on the CPU. The loss function was Huber loss, the optimizer was momentum-based stochastic gradient descent, the learning rate was set to 0.1, and the momentum parameter was 0.9. The detailed parameters of the network structure are shown in Table 6.
The hardware configuration used for model development was as follows: the processor was an Intel Core i7-14700KF with a clock speed of 3.40 GHz, 32.0 GB of memory, and an NVIDIA GeForce RTX 4060 Ti graphics card. The programming language used for modeling was Python 3.12, and the integrated development environment was PyCharm 2024.2.1. The deep learning framework was PyTorch 2.3.1. All neural network structures (including CNN and LSTM models) were built and implemented on the PyTorch platform.

4.2. AFWL-CNN Model Predictive Analysis

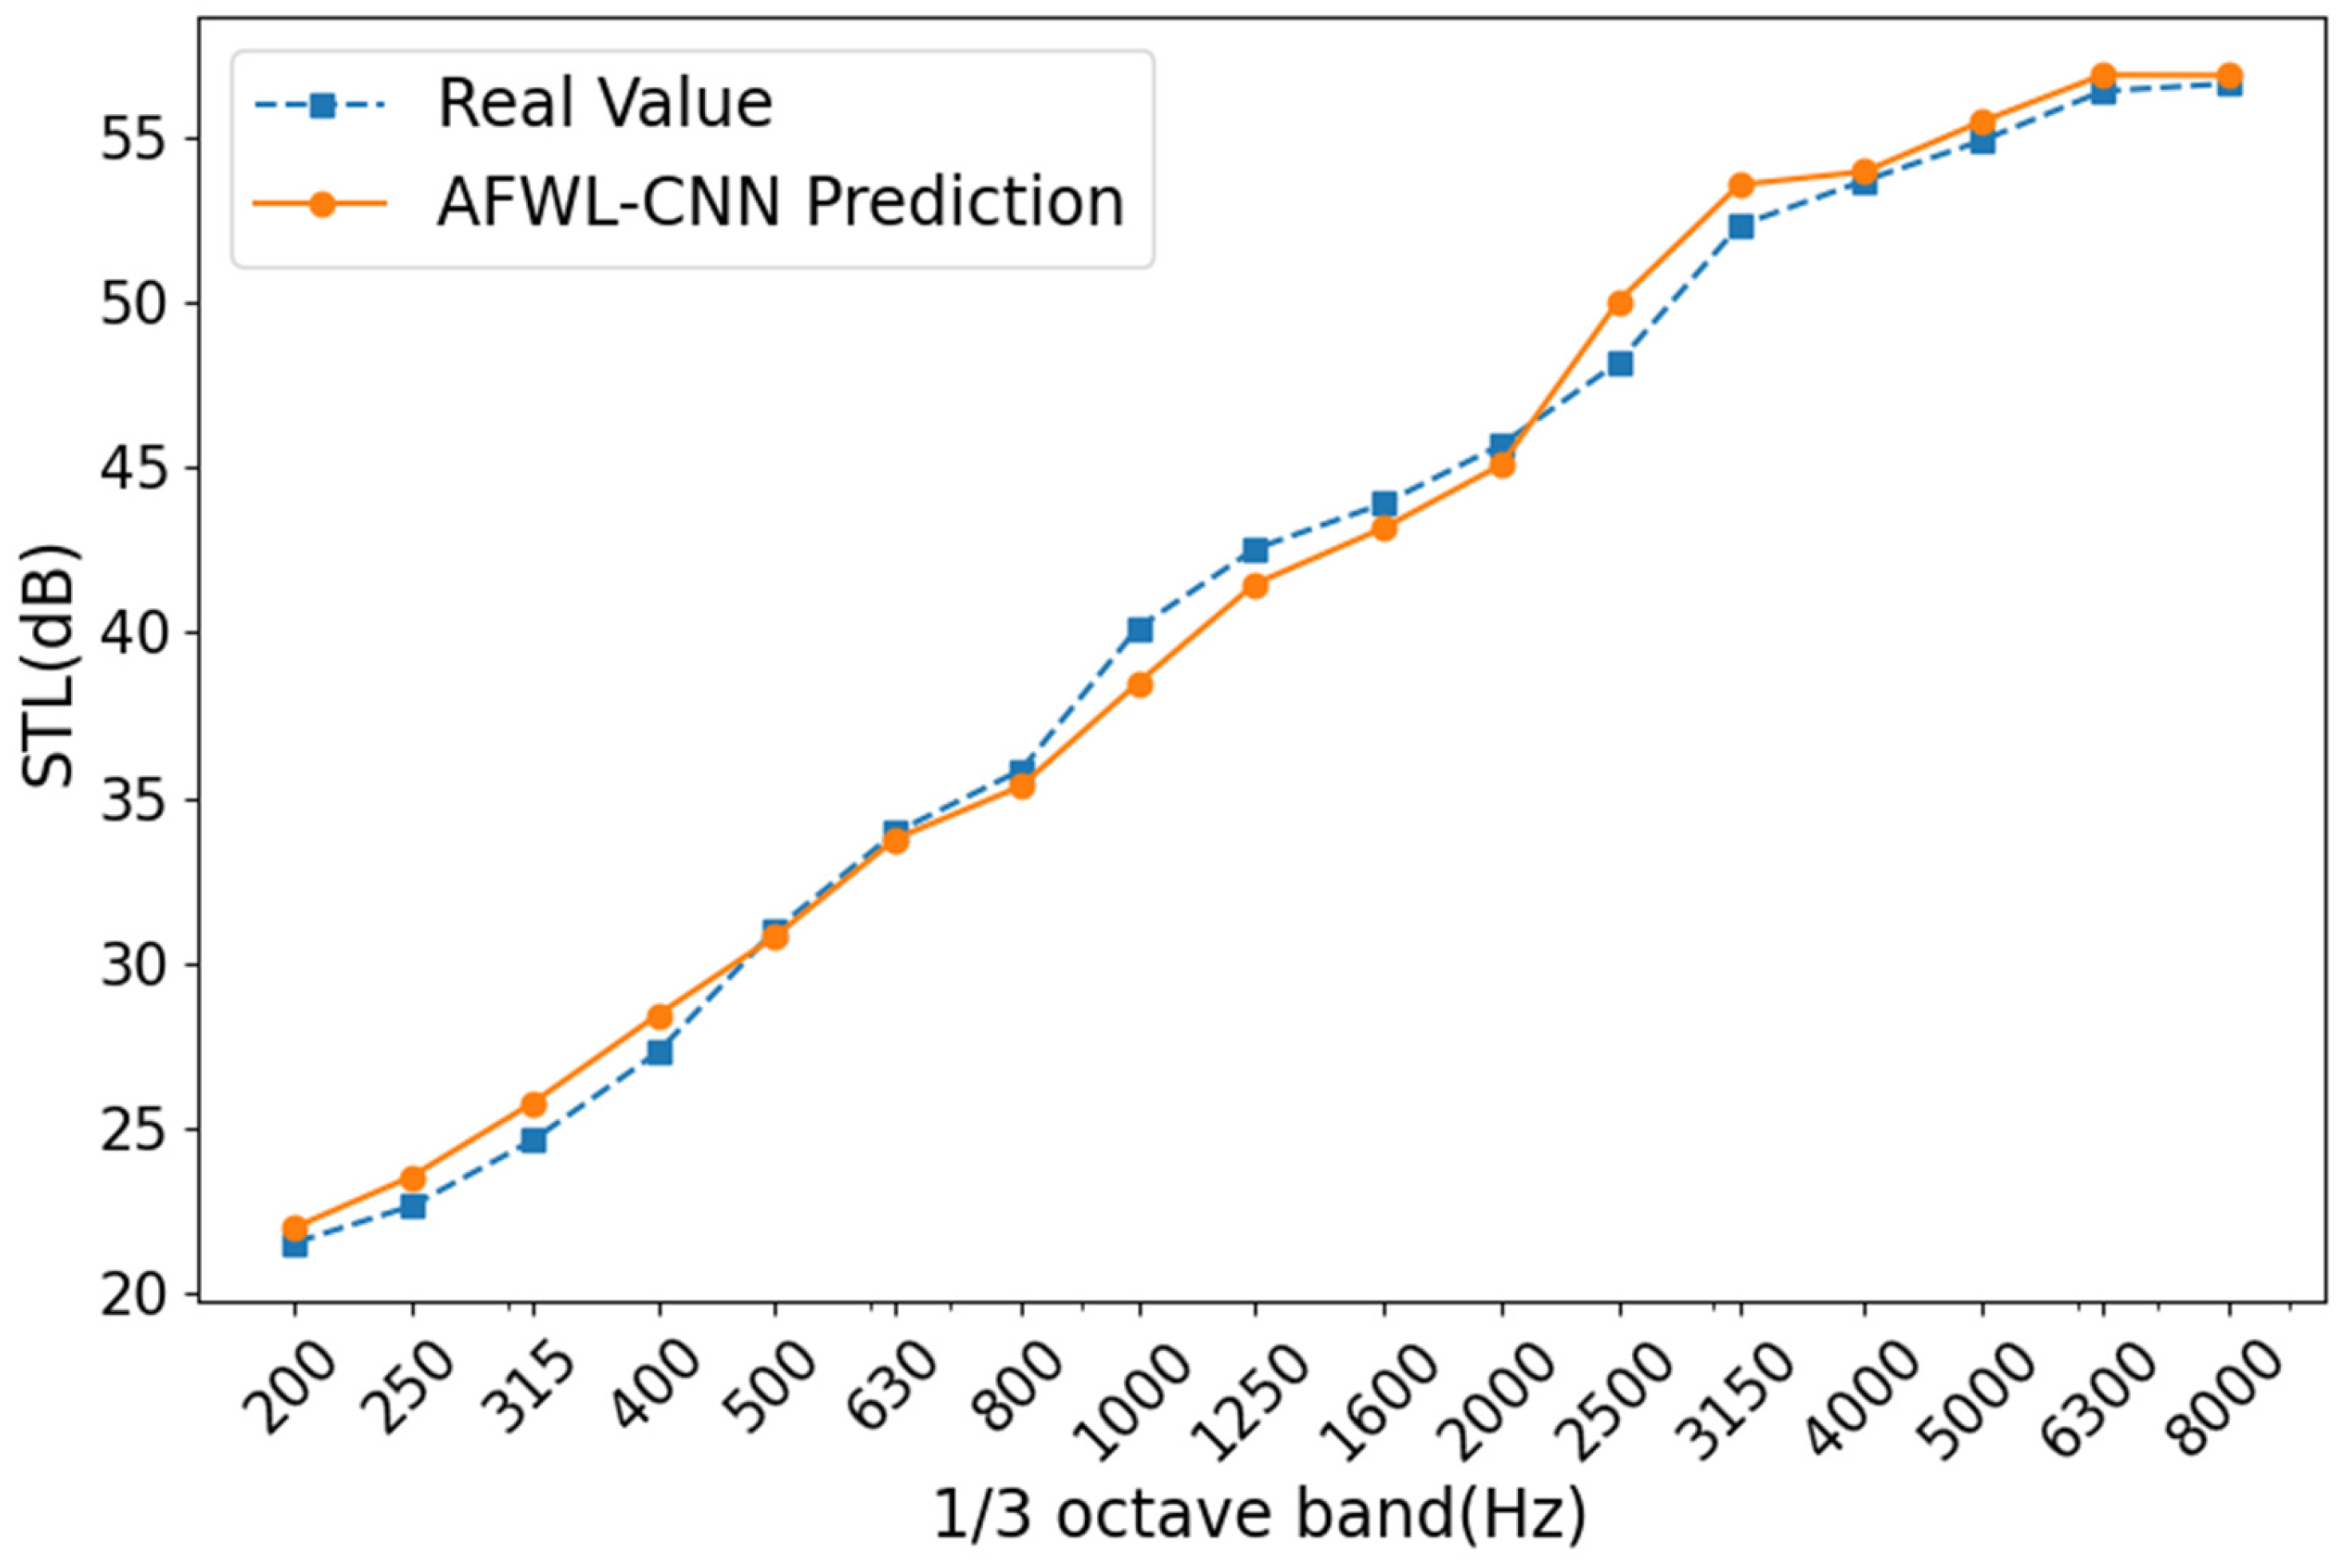
For the prediction of the sound insulation performance of the front wall acoustic package system for pure electric vehicles, based on the AFWL-CNN model constructed above, the model was trained and deployed on the Python platform, and the prediction performance of the model was evaluated using a verification set of samples. To verify its effectiveness, 17, 1/3 octave prediction values in the range of 200–8000 Hz were selected and compared with the actual measured values. The results are shown in Figure 7.
As can be seen from Figure 7, the prediction trend of the AFWL-CNN model is highly consistent with the measured values at most of the 1/3 octave center frequencies, which can reflect the transmission loss characteristics of the front wall system at different frequency bands well. To further quantify the accuracy of the prediction results and validate the model, the relative error at 17 frequency points across all samples was used as the evaluation metric, and the root mean square error (RMSE) and maximum absolute error (MAE) and inference time (I-TIME) were employed for model accuracy analysis. A smaller RMSE value indicates a smaller deviation between the predicted results and the actual values, suggesting that the model exhibits stronger stability and generalization capability across the frequency spectrum. MAE is the absolute value of the largest error in all prediction errors. It is used to evaluate the prediction ability of the model in the worst case and visually display the maximum deviation that the model may appear. I-TIME (inference time) measures the computing time required for a model to complete a full training and prediction cycle. It is used to evaluate the computational efficiency of a model and directly affects its real-time processing requirements and deployment feasibility in actual engineering applications. The formulas for RMSE and MAE are shown in Equations (12) and (13):
R M S E = i = 1 n X t a r g e t , i X p r e , i 2 n
M A E = max X t a r g e t , i X p r e , i
In the above equations, X t a r g e t , i is the true value of the i-th sample, X p r e , i is the predicted value of the i-th sample, and n is the number of samples.
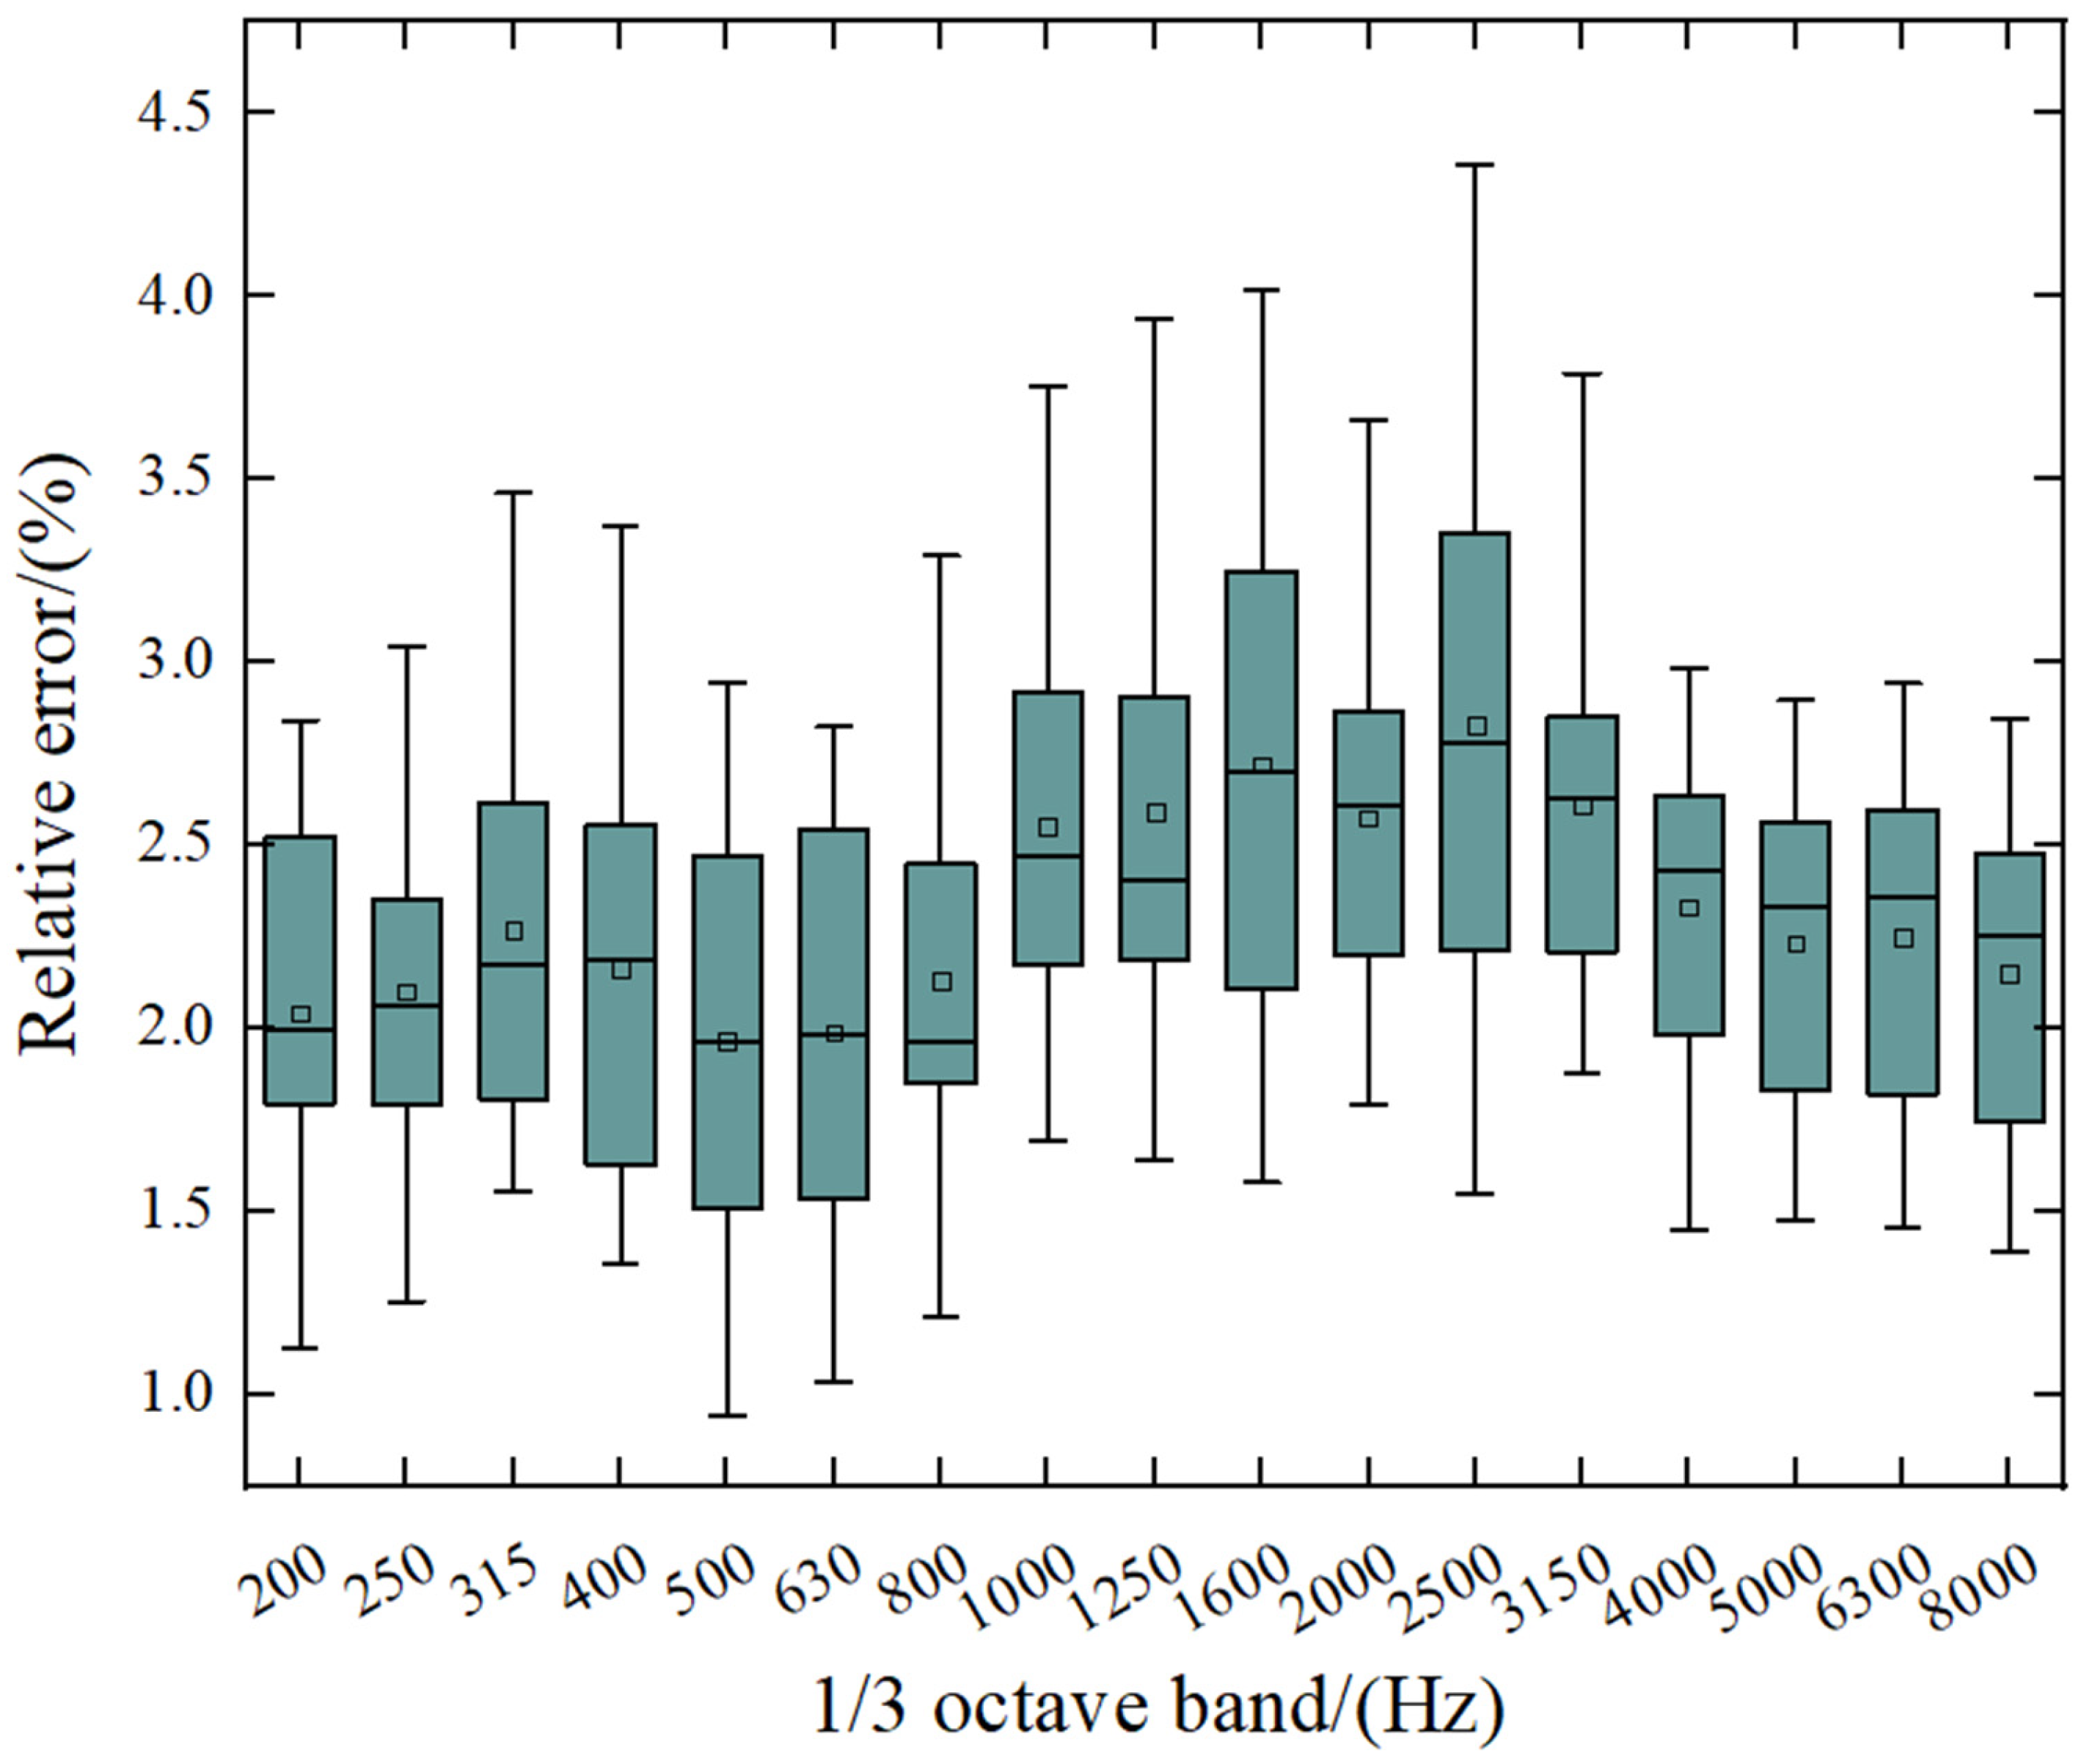
Based on the above method, an error statistical analysis was conducted on the validation set samples containing 12 groups of data, with the results shown in Figure 8. As can be seen from the box plots, the mean relative error of the AFWL-CNN model at 17 frequency points was concentrated between 1.96% and 2.82%, demonstrating good prediction consistency. The maximum relative error occurs at the 2500 Hz frequency point, with a corresponding error of 4.36%. Additionally, Table 7 lists the RMSE and the MAE, which were used to evaluate the accuracy of the validation set, showing that the RMSE of the model on the validation set was 0.031, the MAE was 2.84 dB, and the I-TIME was 17.16 s. Figure 8 and Table 7 indicate that the model demonstrates high prediction accuracy and strong reliability across most frequency ranges, suggesting its potential for practical application in the analysis of acoustic performance in complex structures.

5. Modeling Comparison and Validation

5.1. Model Comparison and Analysis

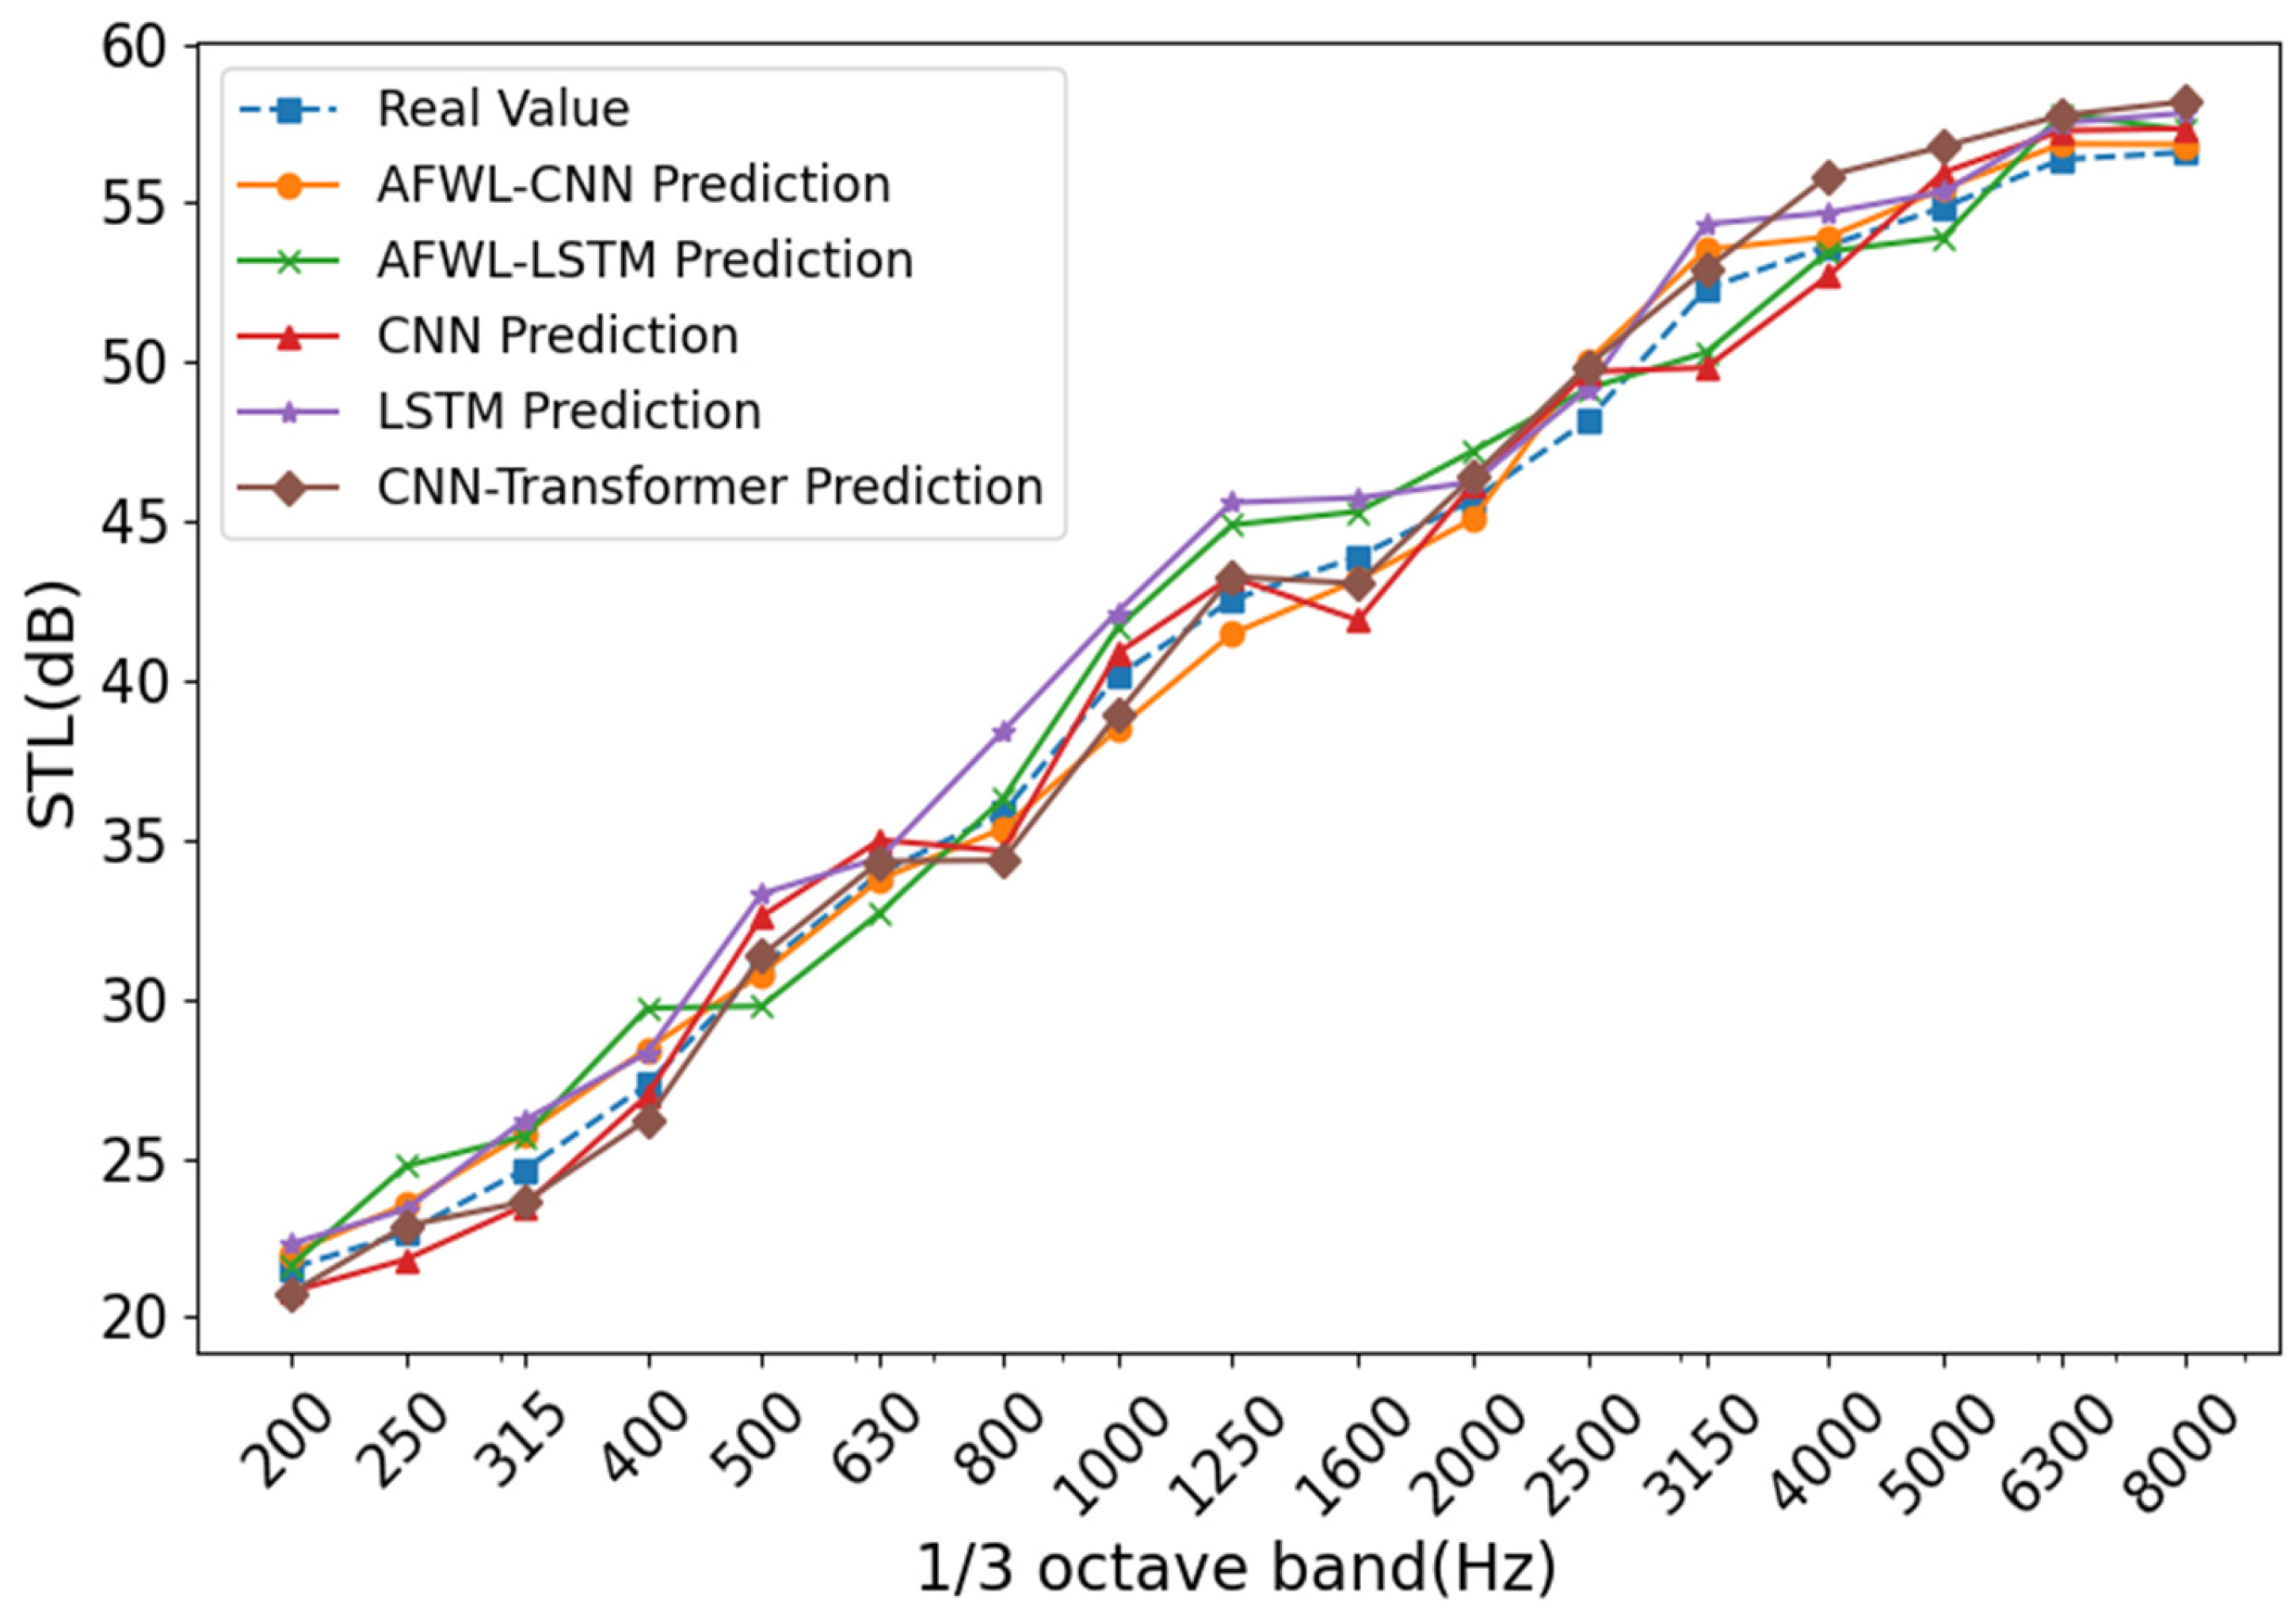
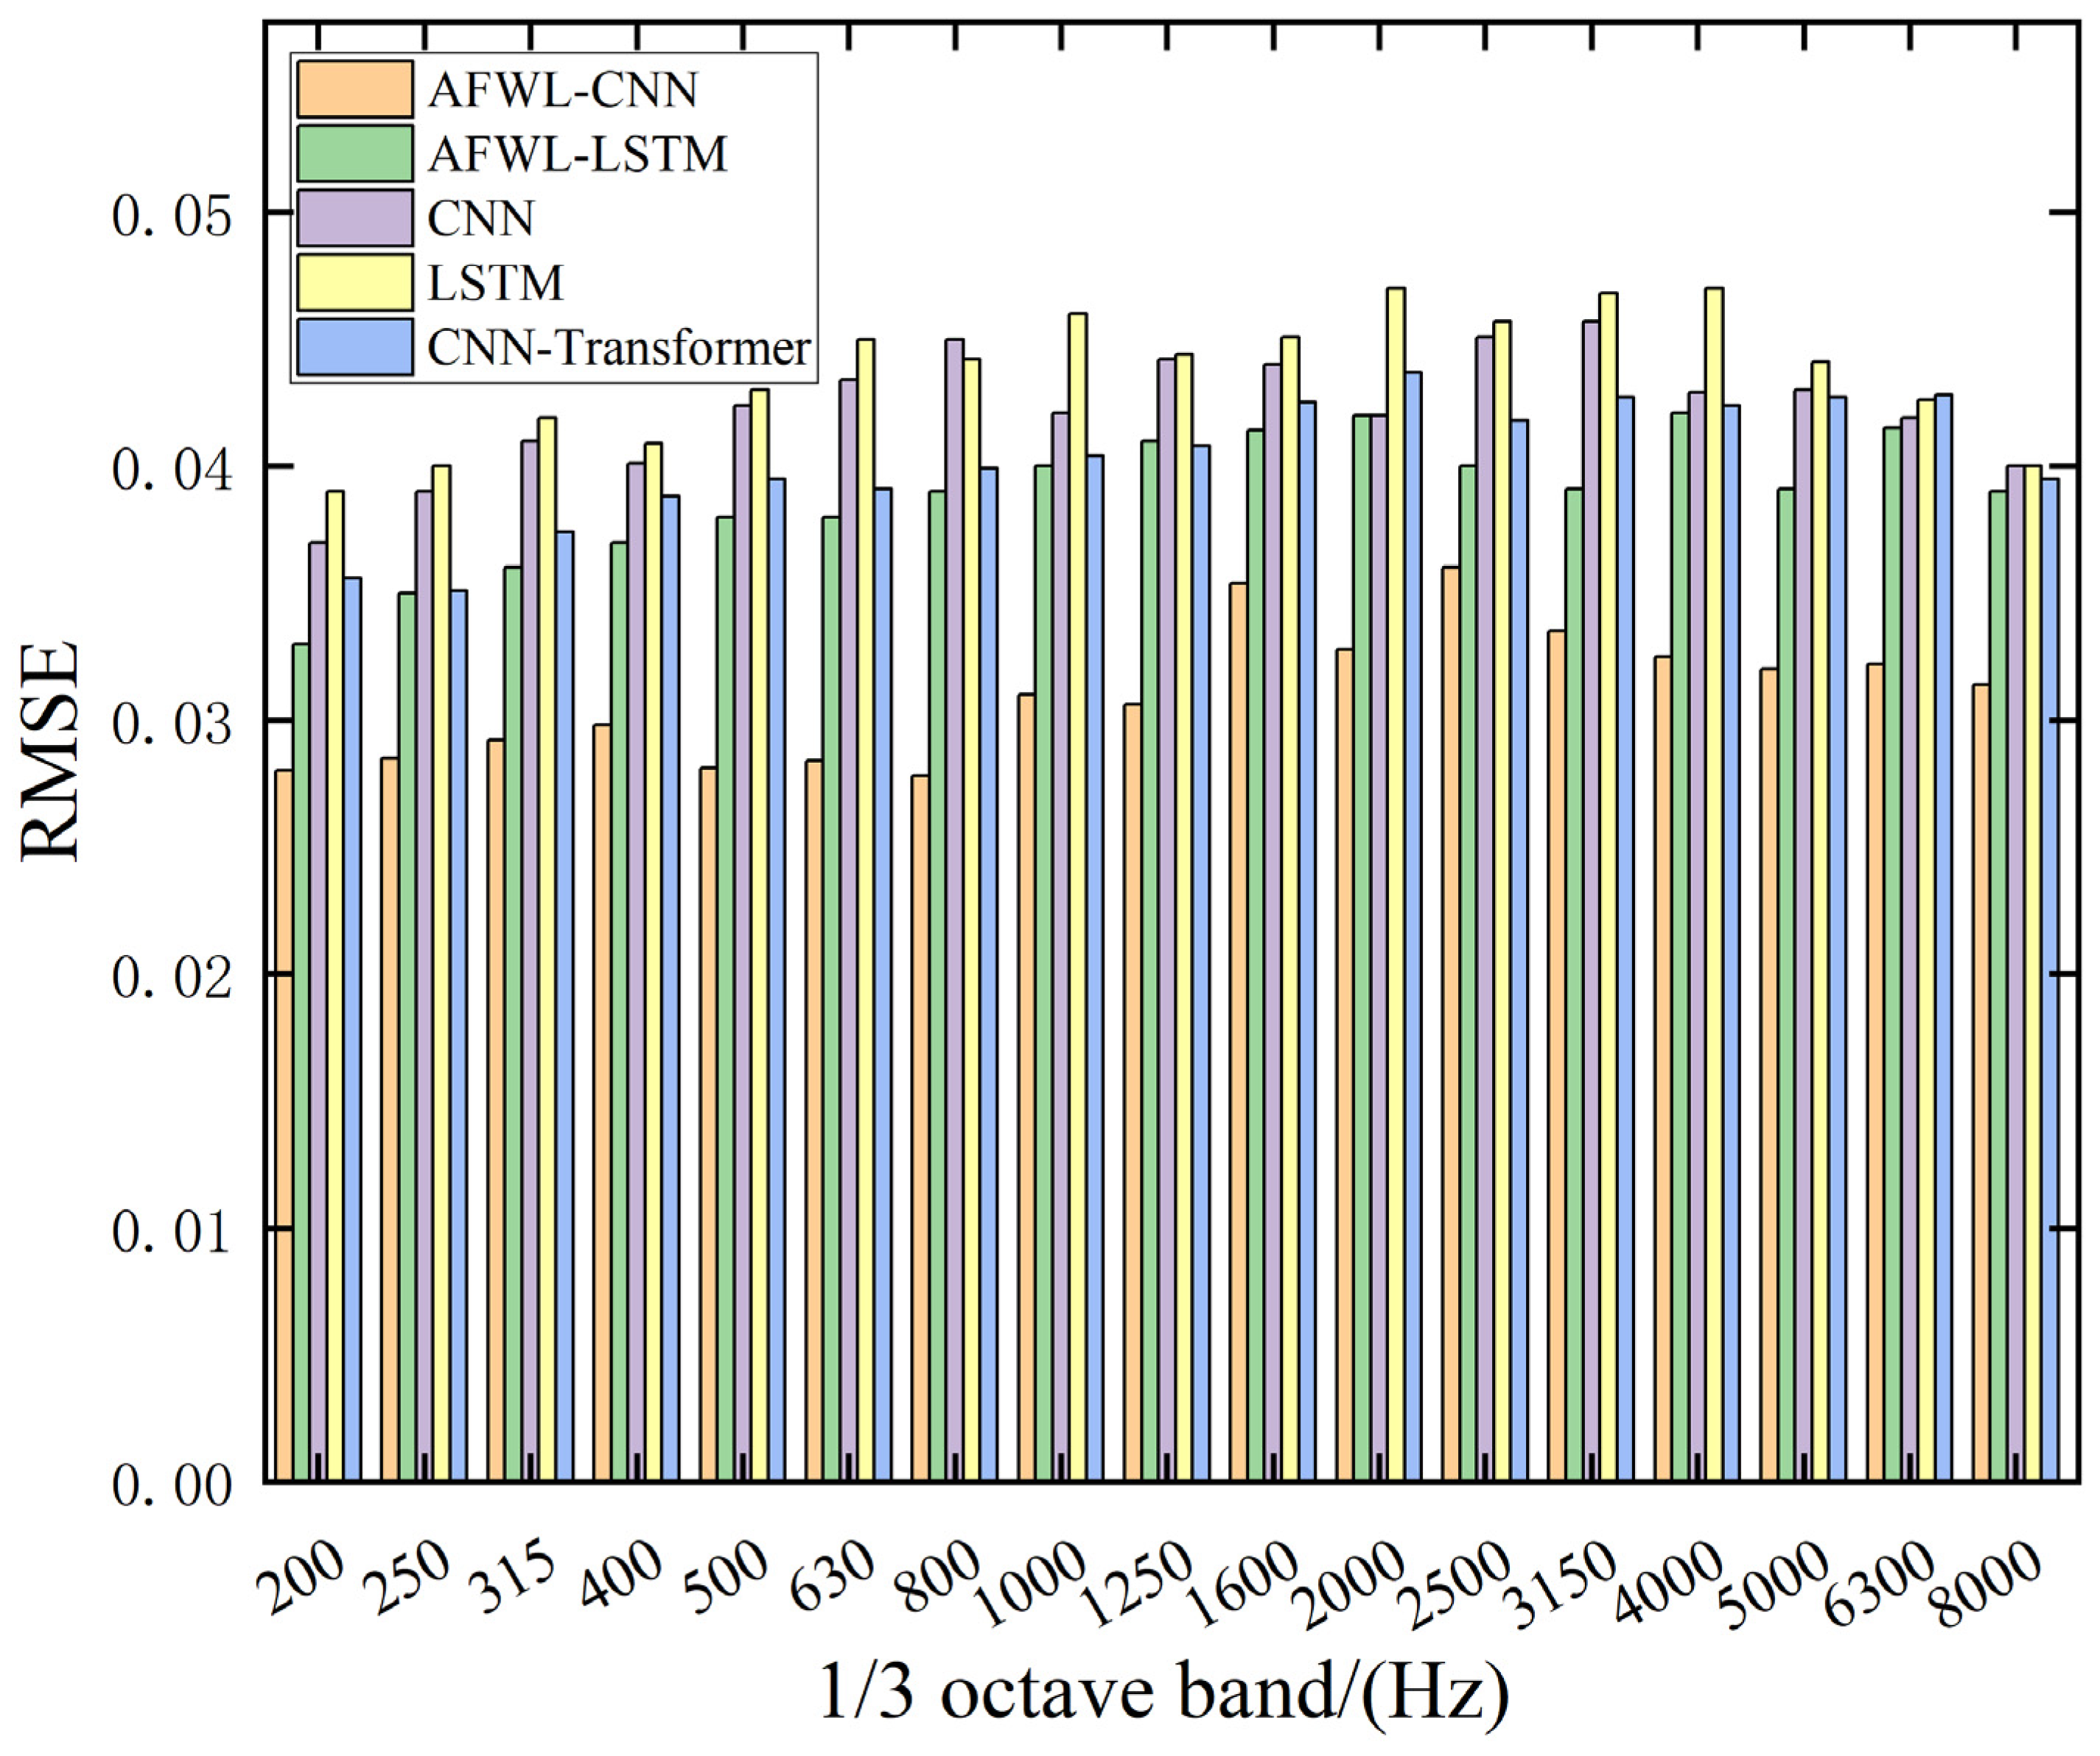
Based on the AFWL-CNN model, four models, namely CNN, LSTM, AFWL-LSTM, and CNN–Transformer, were further constructed to predict the sound insulation performance of the front wall acoustic package system of pure electric vehicles. To verify the effectiveness of each model in predicting sound insulation performance, the prediction results of the five models at some frequency points were compared with the actual test data, and the results are shown in Figure 9. It can be seen from Figure 9 that the prediction trends of the five models are highly consistent with the actual measured values at most 1/3 octave center frequencies, and they can capture the change characteristics of the sound insulation performance of the front wall system to a certain extent. To further quantify the prediction performance, the prediction accuracy of different models on the validation set was compared, and the analysis results are shown in Figure 10 and Table 8.
From the results of RMSE, MAE, and I-Time, it can be seen that the AFWL-CNN model performs the best among the five models, with significantly lower prediction errors than the other models, indicating its higher accuracy and stability in modeling complex acoustic systems. Compared to the traditional CNN model (RMSE = 0.042, MAE = 3.89 dB, and I-TIME = 13.67 s), AFWL-CNN optimized RMSE to 0.031 (approximately 26.19% improvement), reduced MAE to 2.84 dB (approximately 26.99% improvement), and increased I-TIME to 17.16 s (approximately 25.53% increase) by introducing an adaptive feature weighting layer. Although the inference time of AFWL-CNN increased by 25.53% compared to CNN, its innovative design of adaptive feature weighting layers achieved a more significant improvement in prediction accuracy: RMSE was optimized by 26.19%, and MAE was reduced by 26.99%, demonstrating a reasonable trade-off between efficiency and accuracy, with controllable time costs in exchange for better prediction performance. Although the CNN–Transformer model theoretically integrates the advantages of CNN and Transformer architectures, the results indicate that in a small-scale dataset with only 60 samples, its prediction performance (RMSE = 0.040, MAE = 3.74 dB, and I-TIME = 19.55 s) significantly lags behind AFWL-CNN (RMSE = 0.031, MAE = 2.84 dB, and I-TIME = 17.16 s) and AFWL-LSTM (RMSE = 0.039, MAE = 3.35 dB, and I-TIME = 19.81 s) models. This result indicates that, for small-sample scenarios, the lightweight network architecture AFWL, which is optimized for local features, demonstrates stronger practical applicability compared to the data-intensive Transformer architecture. Additionally, the AFWL-LSTM model (RMSE = 0.039, MAE = 3.35 dB, and I-TIME = 19.81 s) outperforms the original LSTM model (RMSE = 0.044, MAE = 4.07 dB, and I-TIME = 16.71 s) in terms of prediction accuracy and efficiency, indicating that the adaptive feature weight mechanism also exhibits good adaptability and generalizability in time series models. Based on the above analysis, the AFWL-CNN model shows excellent performance in the sound insulation performance prediction task of the front wall acoustic package system. This model can significantly improve the prediction accuracy and is expected to realize the rapid inference and evaluation of system-level sound insulation performance based on the parameters of the underlying materials, providing reliable support for the preliminary design and parameter optimization of acoustic package systems.

5.2. Result Verification

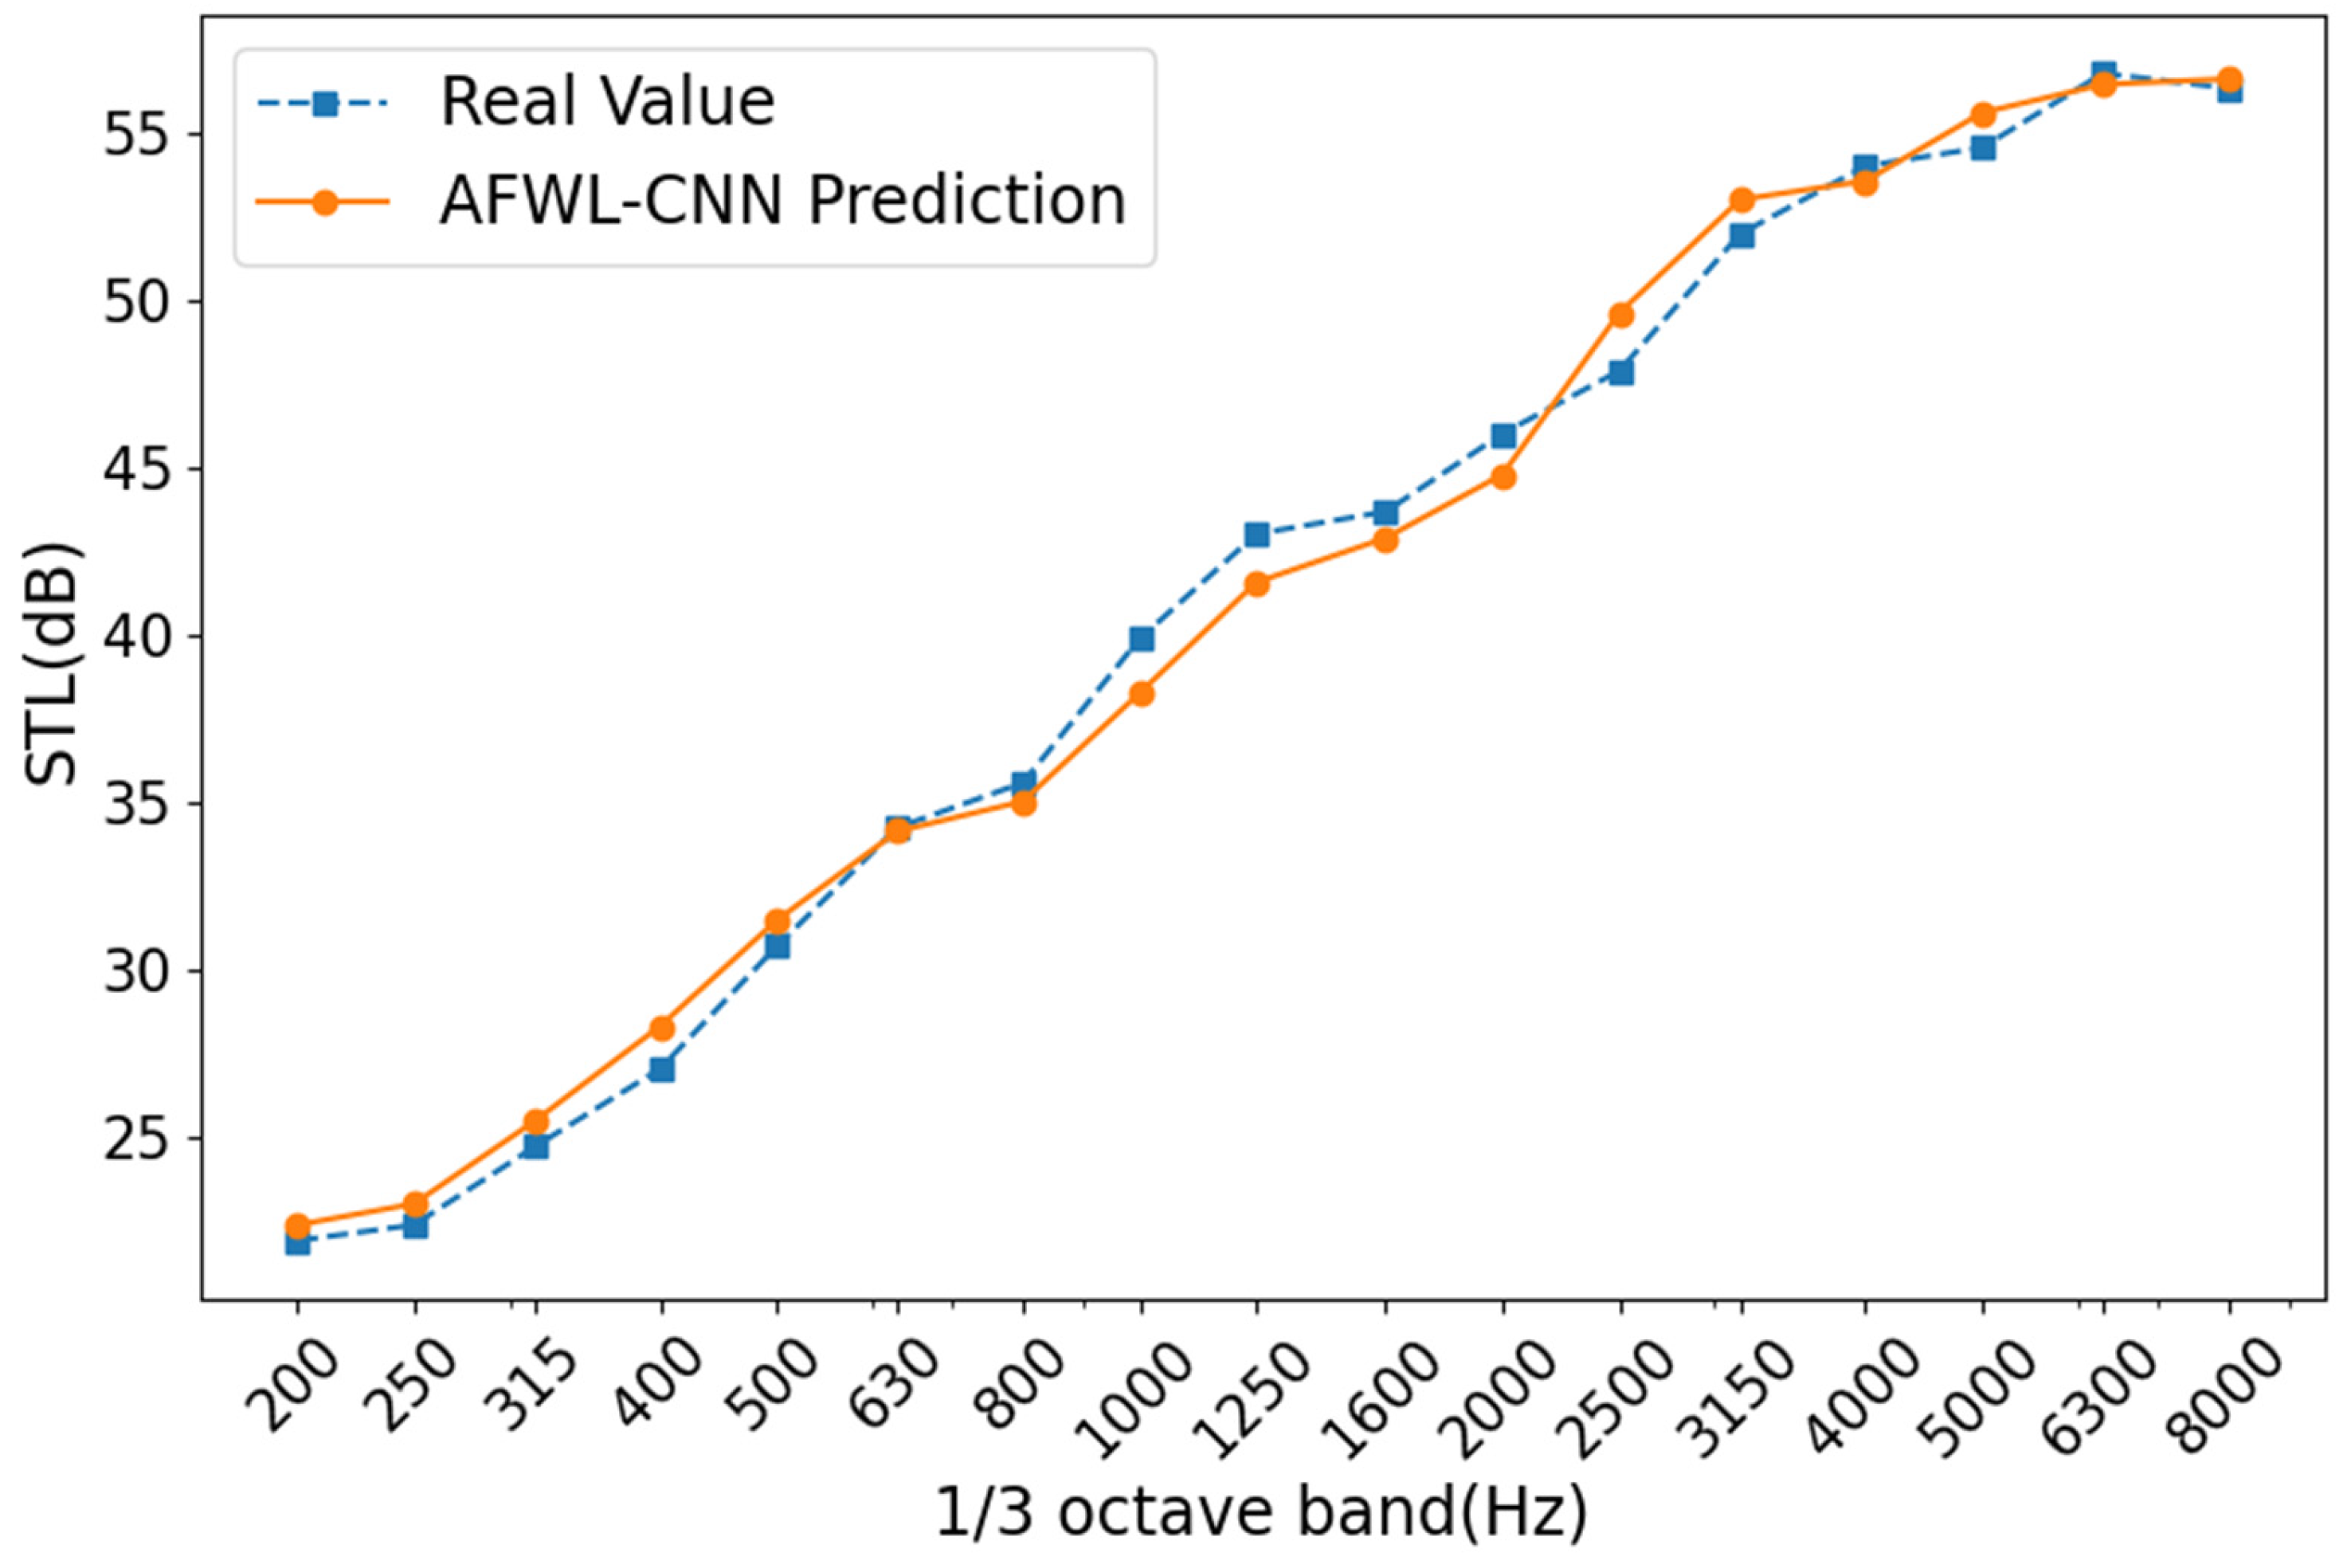
To further verify the generalization ability of the AFWL-CNN model, a set of sound insulation performance data of the front system of a new pure electric vehicle that did not participate in model training and its corresponding original state parameters were selected as an independent verification set. The prediction results of the AFWL-CNN model on this validation set were compared with the actual test data, as shown in Figure 11. From the figure, it can be observed that the sound insulation performance predicted by the AFWL-CNN model is highly consistent with the actual test results at most frequency points, and the prediction trend is basically consistent with the actual changes, indicating that the model still has good prediction ability when processing new sample data. In addition, combined with the error analysis results, the relative error of the sound insulation performance prediction of the front wall system of the whole vehicle in the verification sample was calculated to be 2.27%, the maximum absolute error was 1.83 dB, and the inference time was 17.04 s, further reflecting the high-precision performance of the model on different samples. In summary, the AFWL-CNN model not only demonstrates strong learning and fitting capabilities on the training samples but also exhibits good generalization and robustness when faced with unknown test data, validating its feasibility and effectiveness in engineering applications.

6. Conclusions

This paper proposes an adaptive weighted feature learning-based convolutional neural network (AFWL-CNN) method for predicting the sound insulation performance of the front wall system of pure electric vehicles. The prediction effect of this method was evaluated by comparing it with the AFWL-LSTM, CNN, LSTM, and CNN–Transformer models. Specifically, the sound insulation test of the front wall system was conducted based on the reverberation chamber–semi-anechoic chamber method, and 60 sets of sample data were collected, including 17, 1/3 octave STL values and their corresponding front wall sheet metal, inner front wall sound insulation pad, and outer front wall sound insulation pad areas and average thicknesses. The sound insulation performance of the front wall system was predicted using the AFWL-CNN model. The results showed that the root mean square error (RMSE) of the model was 0.031, the maximum absolute error (MAE) was 2.84 dB, the maximum relative error was 4.36%, and the inference time was 17.16 s, demonstrating the effectiveness of AFWL-CNN in predicting sound insulation performance. Furthermore, the AFWL-CNN model was compared with the AFWL-LSTM, CNN, LSTM, and CNN–Transformer models. The results showed that the CNN model was superior to the LSTM model in terms of prediction accuracy. Although the AFWL-CNN model increased the inference time compared to the CNN and CNN–Transformer models, it achieved a significantly improved prediction accuracy, and its RMSE value was lower than the other four models, demonstrating a reasonable trade-off between efficiency and accuracy and proving the effectiveness of the adaptive feature weight layer. Subsequently, the AFWL-CNN model was verified using a new front wall system sample data, and the prediction results were highly consistent with the actual data, further proving the accuracy and robustness of the model. Based on the comprehensive analysis results, the core contributions of this paper are as follows: (1) We innovatively introduced an adaptive feature weighting layer (AFWL), which can dynamically learn and emphasize the importance differences of input features (such as the area, thickness, and STL values at different frequency bands of sheet metal and sound insulation pads), effectively addressing the challenges of traditional mechanism-based modeling being complex and inefficient. (2) The proposed AFWL-CNN model outperformed AFWL-LSTM, CNN, LSTM, and CNN–Transformer models in terms of prediction accuracy, and its excellent accuracy and robustness were verified by new samples. (3) It provides a powerful new tool for data-driven performance prediction and optimization design of complex automotive acoustic packages.
7. Future Research

The AFWL-CNN model suffers from insufficient stability in its weight distribution mechanism, high sensitivity to training data quality, and significantly reduced generalization ability in small sample scenarios. It is prone to overfitting and struggles to adapt to complex engineering requirements involving multiple vehicle models and operating conditions. Further optimization is necessary. Future research should focus on expanding the dataset to include more key parameter variables of components, thereby enhancing the model’s generalizability. At the same time, network architectures or weight update algorithms with lower computational complexity should be developed, and more stable and interpretable adaptive feature importance assessment methods should be researched and designed to ensure the accuracy of weight allocation. Advanced hybrid models (such as graph neural networks) should be introduced for comparative analysis to achieve the rapid deployment and real-time prediction of AFWL-CNN. Furthermore, research should be conducted on how to effectively integrate acoustic physics prior knowledge into the AFWL-CNN framework and explore data augmentation or transfer learning strategies for small datasets to improve the model’s generalization ability and reliability. Through relevant research, we will promote the development of AFWL-CNN and related methods as a rapid acoustic performance evaluation tool and empower digital twin platforms to achieve a virtual iterative optimization of acoustic packages through real-time prediction and optimization of control strategies. Ultimately, it is expected to be developed into an efficient, robust, and engineering-friendly next-generation core tool for acoustic design.

Author Contributions

Writing—original draft preparation: Y.M. and J.Y.; writing—review and editing, methodology: X.L. and D.P.; funding acquisition: J.D.; experiments and records: J.W.; validation, conceptualization: P.L. All authors have read and agreed to the published version of the manuscript.

Funding

This work was supported by the Major Science and Technology Project of Jilin Province and Changchun City (Grant No. 20240301010ZD).

Data Availability Statement

The authors do not have permission to share data.

Acknowledgments

The authors would like to acknowledge the support provided by the Institute of Energy and Power Research for the experimental research.

Conflicts of Interest

Authors Yan Ma, Jianjiao Deng, Xiaona Liu and Dianlong Pan were employed by the company Global R&D Center, China FAW Corporation, Limited. The remaining authors declare that the research was conducted in the absence of any commercial or financial relationships that could be construed as a potential conflict of interest.

Abbreviations

The following abbreviations are used in this manuscript:
NVHNoise, vibration, and harshness
CAEComputer-aided engineering
SEAStatistical energy analysis
PEVPure electric vehicle
CNNConvolutional neural network
AFWLAdaptive feature weighting layer
LSTMLong Short-Term Memory
STLSound transmission loss
MAEMaximum absolute error
RMSERoot mean square error
I-TIMEInference time

References

  1. Huang, H.; Lim, T.; Wu, J.; Ding, W.; Pang, J. Multitarget prediction and optimization of pure electric vehicle tire/road airborne noise sound quality based on a knowledge-and data-driven method. Mech. Syst. Signal Process. 2023, 197, 110361. [Google Scholar] [CrossRef]
  2. Qatu, M. Recent research on vehicle noise and vibration. Int. J. Veh. Noise Vib. 2012, 8, 289–301. [Google Scholar] [CrossRef]
  3. Pang, J. Noise and Vibration Control in Automotive Bodies; Machine Press: Beijing, China, 2018. [Google Scholar] [CrossRef]
  4. Huang, H.; Huang, X.; Ding, W.; Yang, M.; Yu, X.; Pang, J. Vehicle vibro-acoustical comfort optimization using a mul-ti-objective interval analysis method. Expert Syst. 2022, 213, 119001. [Google Scholar] [CrossRef]
  5. Yang, M.; Dai, P.; Yin, Y.; Wang, D.; Wang, Y.; Huang, H. Predicting and optimizing pure electric vehicle road noise via a locality-sensitive hashing transformer and interval analysis. ISA Trans. 2025, 157, 556–572. [Google Scholar] [CrossRef]
  6. Chen, S.; Wang, D.; Zuo, A.; Chen, Z.; Zan, J.; Sun, Y. Design and optimization of vehicle interior sound package. In Proceedings of the 2010 International Conference On Computer Design and Applications, Qinhuangdao, China, 25–27 June 2010; Volume 4. pp. 4–30. [Google Scholar] [CrossRef]
  7. Musser, C. Sound Package Performance, Weight, and Cost Optimization Using SEA Analysis. SAE Tech. Pap. 2003, 1, 1571. [Google Scholar] [CrossRef]
  8. Lee, H.; Kim, H.; Jeon, J.; Kang, Y. Application of global sensitivity analysis to statistical energy analysis: Vehicle model development and transmission path contribution. Appl. Acoust. 2019, 146, 368–389. [Google Scholar] [CrossRef]
  9. Manning, J. SEA models to predict structureborne noise in vehicles. SAE Trans. 2003, 1, 1839–1845. [Google Scholar] [CrossRef]
  10. Mistry, K.; Badhe, N.; Fisher, S. Vehicle Level Acoustic Sound Pack Sensitivity and Test Correlation by Utilizing Statistical Energy Analysis (SEA) Technique for Premium SUV. SAE Tech. Pap. 2015, 26, 135. [Google Scholar] [CrossRef]
  11. Tang, R.; Tong, Z.; Li, H.; Li, S. Research on Prediction and Control of Heavy Commercial Vehicle Interior High Frequency Noise Based on SEA. In Proceedings of the 2017 International Conference on Computer Technology, Electronics and Communication (ICCTEC), Dalian, China, 19–21 December 2017; Volume 245. pp. 1124–1127. [Google Scholar] [CrossRef]
  12. Avenati-Bassi, F.; Scaffidi, C.; Tinti, F.; Vicari, C.; Casella, M.; Esposto, E. Acoustic Design of an Innovative Sound Package for Heavy-duty Cabin for Future Generation European Trucks. SAE Tech. Pap. 2007, 1, 4227. [Google Scholar] [CrossRef]
  13. Noguchi, Y.; Doi, T.; Tada, H.; Misaji, K. Development of a lightweight Sound Package for 2006 brand-new vehicle categorized as C. SAE Tech. Pap. 2006, 1, 0710. [Google Scholar] [CrossRef]
  14. Dong, J.; Ma, F.; Gu, C.; Hao, Y. Highly Efficient Robust Optimization Design Method for Improving Automotive Acoustic Package Performance. SAE Int. J. Veh. Dyn. Stab. NVH 2020, 4, 291–304. [Google Scholar] [CrossRef]
  15. Ameduri, S.; Brindisi, A.; Ciminello, M.; Concilio, A.; Quaranta, V.; Brandizzi, M. Car Soundproof improvement through an SMA Adaptive system. Actuators 2018, 7, 88. [Google Scholar] [CrossRef]
  16. Zhang, X.; Hu, X.; Gong, H.; Zhang, J.; Lv, Z.; Hong, W. Experimental study on the impact sound insulation of cross laminated timber and timber-concrete composite floors. Appl. Acoust. 2020, 161, 107173. [Google Scholar] [CrossRef]
  17. Chen, S. Research on Prediction and Control Methods of Automobile Middle and High Frequency Noise. Ph.D. Dissertation, Jilin University, Changchun, China, 2011. [Google Scholar]
  18. Kronowetter, F. Application of acoustic metamaterial for tire noise reduction. In Proceedings of the INTER-NOISE and NOISE-CON Congress and Conference Proceedings, Tokyo, Japan, 20–23 August 2023; Volume 267, pp. 318–321. [Google Scholar] [CrossRef]
  19. Oettle, N.; Sims-Williams, D. Automotive aeroacoustics: An overview. Proc. Inst. Mech. Eng. Part D J. Automob. Eng. 2017, 231, 1177–1189. [Google Scholar] [CrossRef]
  20. Doutres, O.; Atalla, N. Experimental estimation of the transmission loss contributions of a sound package placed in a double wall structure. Appl. Acoust. 2011, 72, 372–379. [Google Scholar] [CrossRef]
  21. Amadasi, G.; Bevilacqua, A.; Iannace, G. New Experimental System to Determine Sound Transmission Loss of Sound Packages for 2d and 3d Automotive Body-Parts. SAE MobilityRxiv™ Prepr. 2022. [Google Scholar] [CrossRef]
  22. Wu, Y.; Liu, X.; Huang, H.; Wu, Y.; Ding, W.; Yang, M. Multi-objective prediction and optimization of vehicle acoustic package based on ResNet neural network. Sound Vib. 2023, 57, 73–95. [Google Scholar] [CrossRef]
  23. Schaefer, N.; Bergen, B.; Keppens, T.; Desmet, W. A design space exploration framework for automotive sound packages in the mid-frequency range. SAE Tech. Pap. 2017, 1, 1751. [Google Scholar] [CrossRef]
  24. Song, D.; Hong, S.; Seo, J.; Lee, K.; Song, Y. Correlation analysis of noise, vibration, and harshness in a vehicle using driving data based on big data analysis technique. Sensors 2022, 22, 2226. [Google Scholar] [CrossRef]
  25. Huang, H.; Wu, J.; Lim, T.; Yang, M.; Ding, W. Pure electric vehicle nonstationary interior sound quality prediction based on deep CNNs with an adaptable learning rate tree. Mech. Syst. Signal Process. 2021, 148, 107170. [Google Scholar] [CrossRef]
  26. Wang, Y.; Guo, H.; Yang, C. Vehicle Interior Noise Mechanism and Prediction. In Vehicle Interior Sound Quality: Analysis, Evaluation and Control; Springer: Singapore, 2022; pp. 5–62. [Google Scholar] [CrossRef]
  27. Guo, H.; Wang, Y.; Liu, N.; Yu, R.; Chen, H.; Liu, X. Active interior noise control for rail vehicle using a variable step-size median-LMS algorithm. Mech. Syst. Signal Process. 2018, 109, 15–26. [Google Scholar] [CrossRef]
  28. Shang, Z.; Hu, F.; Zeng, F.; Wei, L.; Xu, Q.; Wang, J. Research of transfer path analysis based on contribution factor of sound quality. Appl. Acoust. 2021, 173, 107693. [Google Scholar] [CrossRef]
  29. Luo, Y.; Chen, S.; Zhou, L.; Ni, Y. Evaluating railway noise sources using distributed microphone array and graph neural networks. Transp. Res. Part D Transp. Environ. 2022, 107, 103315. [Google Scholar] [CrossRef]
  30. Huang, H.; Huang, X.; Ding, W.; Zhang, S.; Pang, J. Optimization of electric vehicle sound package based on LSTM with an adaptive learning rate forest and multiple-level multiple-object method. Mech. Syst. Signal Process. 2023, 187, 109932. [Google Scholar] [CrossRef]
  31. Dai, R.; Zhao, J.; Zhao, W.; Ding, W.; Huang, H. Exploratory study on sound quality evaluation and prediction for engineering machinery cabins. Measurement 2025, 253, 117684. [Google Scholar] [CrossRef]
  32. Santoni, A.; Davy, J.; Fausti, P.; Bonfiglio, P. A review of the different approaches to predict the sound transmission loss of building partitions. Build. Acoust. 2020, 27, 253–279. [Google Scholar] [CrossRef]
  33. Alzubaidi, L.; Zhang, J.; Humaidi, A.; Al-Dujaili, A.; Duan, Y.; Al-Shamma, O.; Farhan, L. Review of deep learning: Concepts, CNN architectures, challenges, applications, future directions. J. Big Data 2021, 8, 1–74. [Google Scholar] [CrossRef]
  34. Gu, J.; Wang, Z.; Kuen, J.; Ma, L.; Shahroudy, A.; Shuai, B.; Liu, T.; Wang, X.; Wang, G.; Cai, J. Recent advances in convolutional neural networks. Pattern Recogn. 2018, 77, 354–377. [Google Scholar] [CrossRef]
  35. Krizhevsky, A.; Sutskever, I.; Hinton, G. ImageNet classification with deep convolutional neural networks. Commun. ACM 2017, 60, 84–90. [Google Scholar] [CrossRef]
  36. Jhong, S.; Tseng, P.; Siriphockpirom, N.; Hsia, C.; Huang, M.; Hua, K.; Chen, Y. An automated biometric identification system using CNN-based palm vein recognition. In Proceedings of the 2020 International Conference on Advanced Robotics and Intelligent Systems (ARIS), Taipei, Taiwan, 19–21 August 2020; pp. 1–6. [Google Scholar] [CrossRef]
  37. Huang, H.; Huang, X.; Ding, W.; Yang, M.; Fan, D.; Pang, J. Uncertainty optimization of pure electric vehicle interior tire/road noise comfort based on data-driven. Mech. Syst. Signal Process. 2022, 165, 108300. [Google Scholar] [CrossRef]
  38. Hao, X.; Zhang, G.; Ma, S. Deep Learning. Int. J. Semant. Comput. 2016, 10, 417. [Google Scholar] [CrossRef]
  39. Xie, L.; Yuille, A. Genetic cnn. In Proceedings of the IEEE International Conference on Computer Vision, Venice, Italy, 22–29 October 2017; pp. 1379–1388. [Google Scholar] [CrossRef]
  40. Purwono, P.; Ma’arif, A.; Rahmaniar, W.; Fathurrahman, H.; Frisky, A.; Haq, Q. Understanding of convolutional neural network (cnn): A review. Int. J. Robot. Control. Syst. 2022, 2, 739–748. [Google Scholar] [CrossRef]
  41. Mostafa, H.; Wang, X. Parameter efficient training of deep convolutional neural networks by dynamic sparse reparameterization. In Proceedings of the International Conference on Machine Learning, Long Beach, CA, USA, 9–15 June 2019; pp. 4646–4655. [Google Scholar] [CrossRef]
  42. Xiao, T.; Luo, X.; Xiang, L.; Chen, Y.; Wang, P. Research on lane line pixel-level recognition algorithm embedded with attention mechanism. Laser J. 2025, 46, 106–114. Available online: http://kns.cnki.net/kcms/detail/50.1085.TN.20240623.1644.004.html/ (accessed on 10 June 2025).
  43. Yu, X.; Dai, R.; Zhang, J.; Yin, Y.; Li, S.; Dai, P.; Huang, H. Vehicle structural road noise prediction based on an improved Long Short-Term Memory method. Sound Vib. 2025, 59, 2022. [Google Scholar] [CrossRef]
  44. Zhu, H.; Zhao, J.; Wang, Y.; Ding, W.; Pang, J.; Huang, H. Improving of pure electric vehicle sound and vibration comfort using a multi-task learning with task-dependent weighting method. Measurement 2024, 233, 114752. [Google Scholar] [CrossRef]
  45. Cunha, B.; Zine, A.; Ichchou, M.; Droz, C.; Foulard, S. On Machine-Learning-Driven Surrogates for Sound Transmission Loss Simulations. Appl. Sci. 2022, 12, 10727. [Google Scholar] [CrossRef]
  46. Fahy, F.; Gardonio, P. Sound and structural vibration. In Radiation, Transmission; Elsevier: Amsterdam, The Netherlands, 2007. [Google Scholar] [CrossRef]
  47. Bader, E.; Vardaxis, N.; Ménard, S.; Bard, H.; Kouyoumji, J. Prediction of Sound Insulation Using Artificial Neural Networks—Part II: Lightweight Wooden Façade Structures. Appl. Sci. 2022, 12, 6983. [Google Scholar] [CrossRef]
  48. Zhao, J.; Yin, Y.; Chen, J.; Zhao, W.; Ding, W.; Huang, H. Evaluation and prediction of vibration comfort in engineering machinery cabs using random forest with genetic algorithm. SAE Int. J. Veh. Dyn. Stab. NVH 2024, 8, 4–27. [Google Scholar] [CrossRef]
Figure 1. Structure of convolutional neural network.
Machines 13 00527 g001
Figure 2. The improved AFWL-CNN neural network prediction model.
Machines 13 00527 g002
Figure 3. The soundproof wall on one side of the reverberation room.
Machines 13 00527 g003
Figure 4. The soundproof wall on one side of the semi-anechoic room.
Machines 13 00527 g004
Figure 5. Sound insulation performance test data of the front wall system.
Machines 13 00527 g005
Figure 6. Prediction model building process.
Machines 13 00527 g006
Figure 7. The prediction results of the AFWL-CNN model on the sound insulation performance of the front wall acoustic package system.
Machines 13 00527 g007
Figure 8. Prediction error analysis of sound insulation performance of the front wall acoustic package system.
Machines 13 00527 g008
Figure 9. The prediction results of the five models on the sound insulation performance of the front wall acoustic package system.
Machines 13 00527 g009
Figure 10. Comparison of prediction accuracy of the five methods.
Machines 13 00527 g010
Figure 11. The AFWL-CNN model predicts the sound insulation performance of the new front wall acoustic package system.
Machines 13 00527 g011
Table 1. The original state parameters of the front wall system components.
ComponentAreaCoverage of Sound Insulation Components
Outer front wall sound insulation pad0.97 m274.2%
Inner front wall sound insulation pad1.99 m292.9%
Front wall sheet metal2.23 m2-
Table 2. Thickness parameters of inner and outer front wall sound insulation pad.
ComponentOuter Front Wall Sound Insulation PadInner Front Wall Sound Insulation Pad
The area ratio of each thickness of the acoustic package2 mmT ≤ 2.5 mm0%0%
5 mm2.5 mm < T ≤ 7.5 mm24%6%
10 mm7.5 mm < T ≤ 12.5 mm15%9%
15 mm12.5 mm < T ≤ 17.5 mm11%23%
20 mm17.5 mm < T ≤ 22.5 mm18%17%
25 mm22.5 mm < T ≤ 27.5 mm23%15%
30 mm27.5 mm < T ≤ 32.5 mm9%18%
35 mm32.5 mm < T ≤ 37.5 mm0%12%
40 mm37.5 mm < T ≤ 42.5 mm0%0%
equivalent thickness16.4 mm21.4 mm
Table 3. Thickness parameters of front wall sheet metal.
ThicknessArea Ratio
0.5 mm4%
0.6 mm0%
0.7 mm32%
0.8 mm26%
0.9 mm0%
1.0 mm24%
1.1 mm0%
1.2 mm0%
1.3 mm0%
1.4 mm0%
1.5 mm0%
1.6 mm0%
1.7 mm0%
1.8 mm8%
1.9 mm0%
2.0 mm6%
equivalent thickness0.96 mm
Table 4. Prediction model input data.
ComponentAreaEquivalent Thickness
Front wall sheet metal2.23 m20.96 mm
Outer front wall sound insulation pad0.97 m216.4 mm
Inner front wall sound insulation pad1.99 m221.4 mm
Table 5. Prediction model output data.
OutputSTL of the Front Wall System in the 1/3 Octave Band
Frequency (Hz)200250315400500630
values (dB)21.7622.4324.9628.1730.6733.96
Frequency (Hz)80010001250160020002500
values (dB)35.6237.3140.8943.9145.6748.16
Frequency (Hz)31504000500063008000
values (dB)52.3053.6654.8756.3756.59
Table 6. Specific parameters of AFWL-CNN network layers.
LayerParameter NameParameter SizeOutput Size
Input layer//Batch_size × 2 × 2
Conv1Kernels10 × 2 × 2Batch_size × 10 × 8
Pooling2Max pooling size2Batch_size × 10 × 4
Conv3Kernels12 × 10 × 2Batch_size × 12 × 2
Pooling4Max pooling size2Batch_size × 12 × 1
Fc layerWeight matrix12 × 17Batch_size × 17
Table 7. The RMSE of the AFWL-CNN model on the validation set.
DatasetRMSEMAEI-TIME
Validation set0.0312.84 dB17.16 s
Table 8. The RMSE of the five methods.
MethodsRMSEMAEI-TIME
AFWL-CNN0.0312.84 dB17.16 s
AFWL-LSTM0.0393.35 dB19.81 s
CNN–Transformer0.0403.74 dB19.55 s
CNN0.0423.89 dB13.67 s
LSTM0.0444.07 dB16.71 s
Disclaimer/Publisher’s Note: The statements, opinions and data contained in all publications are solely those of the individual author(s) and contributor(s) and not of MDPI and/or the editor(s). MDPI and/or the editor(s) disclaim responsibility for any injury to people or property resulting from any ideas, methods, instructions or products referred to in the content.