Article

Prediction of Vehicle Interior Wind Noise Based on Shape Features Using the WOA-Xception Model

1
Global R&D Center, China FAW Corporation, Limited, Changchun 130013, China
2
National Key Laboratory of Advanced Vehicle Integration and Control, Changchun 130013, China
3
Vehicle Measurement Control and Safety Key Laboratory of Sichuan Province, Chengdu 610039, China
4
School of Mechanical Engineering, Southwest Jiaotong University, Chengdu 610031, China
*
Author to whom correspondence should be addressed.
Machines 2025, 13(6), 497; https://doi.org/10.3390/machines13060497
Submission received: 7 May 2025 / Revised: 1 June 2025 / Accepted: 2 June 2025 / Published: 6 June 2025
(This article belongs to the Special Issue Intelligent Applications in Mechanical Engineering)

Abstract

:
In order to confront the challenge of efficiently evaluating interior wind noise levels in passenger vehicles during the early stages of shape design, this paper proposes a methodology for predicting interior wind noise. The methodology integrates vehicle shape features with a whale optimization Xception model (WOA-Xception). A nonlinear mapping model is constructed between the vehicle shape features and the wind noise level at the driver’s right ear. This model is constructed using key exterior parameters, which are extracted from wind tunnel test data under typical operating conditions. The exterior parameters include the front windshield, A-pillar, and roof. The key hyperparameters of the Xception model are adaptively optimized using the whale optimization algorithm to improve the prediction accuracy and generalization ability of the model. The prediction results on the test set demonstrate that the WOA-Xception model attains mean absolute percentage error (MAPE) values of 9.78% and 9.46% and root mean square error (RMSE) values of 3.73 and 4.06, respectively, for sedan and Sports Utility Vehicle (SUV) samples, with prediction trends that align with the measured data. A comparative analysis with traditional Xception, WOA-LSTM, and Long Short-Term Memory (LSTM) models further validates the advantages of this model in terms of accuracy and stability, and it still maintains good generalization ability on an independent validation set (mean absolute percentage error of 9.45% and 9.68%, root mean square error of 3.77 and 4.15, respectively). The research findings provide an efficient and feasible technical approach for the rapid assessment of in-vehicle wind noise performance and offer a theoretical basis and engineering references for noise, vibration, and harshness (NVH) optimization design during the early shape phase of vehicle development.

1. Introduction

With the continuous growth in per capita vehicle ownership and the maturation of consumer purchasing concepts, overall vehicle performance and safety have gradually become an industry consensus, and the technological gaps between different brands in this field are narrowing. Against this backdrop, ride comfort has increasingly become a key factor influencing consumer purchasing decisions and enhancing brand competitiveness [1]. To meet users’ growing expectations for in-vehicle comfort, it is imperative to drive the continuous advancement of noise, vibration, and harshness (NVH) technology [2].
As highly complex multi-system integrated products, vehicles generate various noises during operation, including transmission system noise [3], tire–road noise [4], engine noise [5], electric drive system noise [6], and aerodynamic noise [7]. In recent years, with the continuous optimization of traditional noise control technologies, the contribution of noise sources such as the transmission system and engine has gradually decreased, while aerodynamic noise has become increasingly significant in high-speed conditions [8]. Aerodynamic noise is primarily caused by the interaction between vehicle surface structures and airflow, making it a typical fluid dynamics noise source [9]. When the vehicle speed exceeds 80 km/h, its contribution to overall vehicle noise increases rapidly [10]. As vehicle design trends toward higher speeds and electrification, the proportion of aerodynamic noise in overall vehicle noise is expected to rise further, becoming an important factor affecting ride comfort [11]. Previous studies have indicated that prolonged exposure to strong wind noise may have negative effects on the central nervous system of occupants, inducing physiological discomfort such as headaches, tinnitus, memory impairment, and fatigue [12,13]. For pregnant women, strong noise not only affects their own health but may also interfere with fetal development [14]. Additionally, wind noise may reduce the driver’s attention, thereby increasing the risk of traffic accidents [15,16]. Therefore, wind noise control has become a key technical challenge in current automotive NVH development.
In terms of testing methods, the current approaches primarily combine wind tunnel tests with road tests to enhance the accuracy and adaptability of wind noise testing, thereby meeting the demands of high-precision NVH development [17]. Wind tunnel experiments, due to their controllability and reproducibility, remain the core method for wind noise testing. By utilizing microphone arrays and sound-source localization techniques (such as beamforming), noise sources in critical areas such as the A-pillar and exterior rearview mirrors can be identified, providing support for structural optimization. Mukkera et al. [18] combined wind tunnel and semi-anechoic chamber experiments to identify key leakage paths and propose corresponding improvement measures; James [19] used the DrivAer model to establish a calibration relationship between wind tunnel testing and CFD models; Roditcheva [20] and Chen [21] further improved the identification accuracy of local turbulence and sound radiation. In addition, road tests serve as a supplementary method, enabling the collection of wind noise data under real-world conditions using portable devices and multi-channel systems. Rovedatti [22] revealed the dynamic characteristics of wind noise with vehicle speed, providing a practical basis for wind noise optimization. Overall, the current wind noise testing technology is developing toward high precision, multi-dimensionality, and real-world condition simulation.
Complementing the experimental research are continuous breakthroughs in wind noise simulation methods in multi-physics modeling and aeroacoustic simulation. Becker [23] studied the turbulence characteristics of the A-pillar and exterior rearview mirror using large-eddy simulation (LES) and combined vibration acoustics analysis to reveal the generation mechanism of wind noise. Tajima [24] employed transient CFD and modulated power spectrum methods to accurately predict the influence of unstable airflow on wind noise. Mukkera [25] combined separated vortex simulation (DES) with finite element analysis to evaluate the impact of structural design on wind noise; Blanchet [26] and Moron [27] made significant progress in turbulent sound field decomposition and structural sound transfer function modeling. Powell [28] further investigated the propagation paths of low-frequency aerodynamic noise and validated the accuracy of the simulation results through actual measurements. The above studies indicate that the current wind noise simulation methods are gradually moving toward multi-physics coupling and full-condition simulation, not only improving prediction accuracy but also providing important tools for early aerodynamic design and structural optimization.
In recent years, data-driven methods have emerged as a powerful supplement to traditional experimental and simulation techniques in automotive wind noise prediction and control. These methods primarily rely on existing experimental or simulation data to predict and analyze wind noise characteristics through machine learning models, offering advantages such as rapid modeling, low cost, and strong adaptability [29,30,31]. Wu [32] utilized a ResNet neural network to construct a multi-objective prediction and optimization model for acoustic enclosures, improving prediction accuracy and optimization efficiency; Huang [33] combined CNN and LSTM networks to establish a side window wind noise prediction model based on wind tunnel data; Yang [34] utilized a large-scale airfoil database and a CNN to model the aerodynamic noise of wind turbines, demonstrating strong transfer potential. Additionally, Huang [35], Kužnar [36], Zhao [37], and Musser [38] have explored the application of data-driven methods in aerodynamic acoustics from perspectives such as multi-task learning, statistical regression, ensemble learning, and simulation data fusion, thereby expanding the scope of their application.
Compared with traditional experimental methods, data-driven technology leveraging deep learning models can significantly reduce testing costs and time consumption, making it suitable for the rapid assessment of wind noise characteristics and the optimization of design solutions [39]. For example, pre-trained models can be used in the early stages of design to assess the impact of side mirrors or side window structures on wind noise, greatly improving the development efficiency. Therefore, this paper proposes a wind noise prediction method for vehicle interiors based on the Xception model, using body shape features as the input and the 1/3 octave sound pressure level at the right ear position of the driver as the output, with the aim of achieving efficient prediction of the wind noise characteristics and providing theoretical support and technical pathways for the optimization of the overall vehicle NVH performance.
Based on the above analysis, the main contributions of this study can be summarized as follows:
(1) Taking into consideration the body shape characteristics, an efficient method for predicting wind noise inside the vehicle has been proposed. This method extracts the overall vehicle shape parameters and combines them with the wind tunnel test data of the noise inside the vehicle at the main driver’s position to construct a prediction model with the shape characteristics as the input and the 1/3 octave band wind noise level at the right ear of the main driver as the output, effectively achieving noise estimation at the design stage.
(2) A whale optimization algorithm (WOA)-based Xception deep learning model (WOA-Xception) is proposed, which utilizes the WOA to perform global search and matching of key hyperparameters in the Xception network, significantly improving the accuracy and robustness of the prediction model while shortening the training time.
This article is organized as follows: Section 2 introduces the traditional Xception model and its improved version combined with the whale optimization algorithm—the WOA-Xception model. Section 3 systematically describes the testing methods and experimental procedures for in-vehicle wind noise and analyzes the experimental results. Section 4 proposes a prediction modeling strategy for in-vehicle wind noise, constructs an in-vehicle wind noise prediction model based on WOA-Xception, verifies the model’s prediction performance, and compares it with other typical prediction methods. Section 5 summarizes the research content of the entire paper. The specific research flow chart is shown in Figure 1.

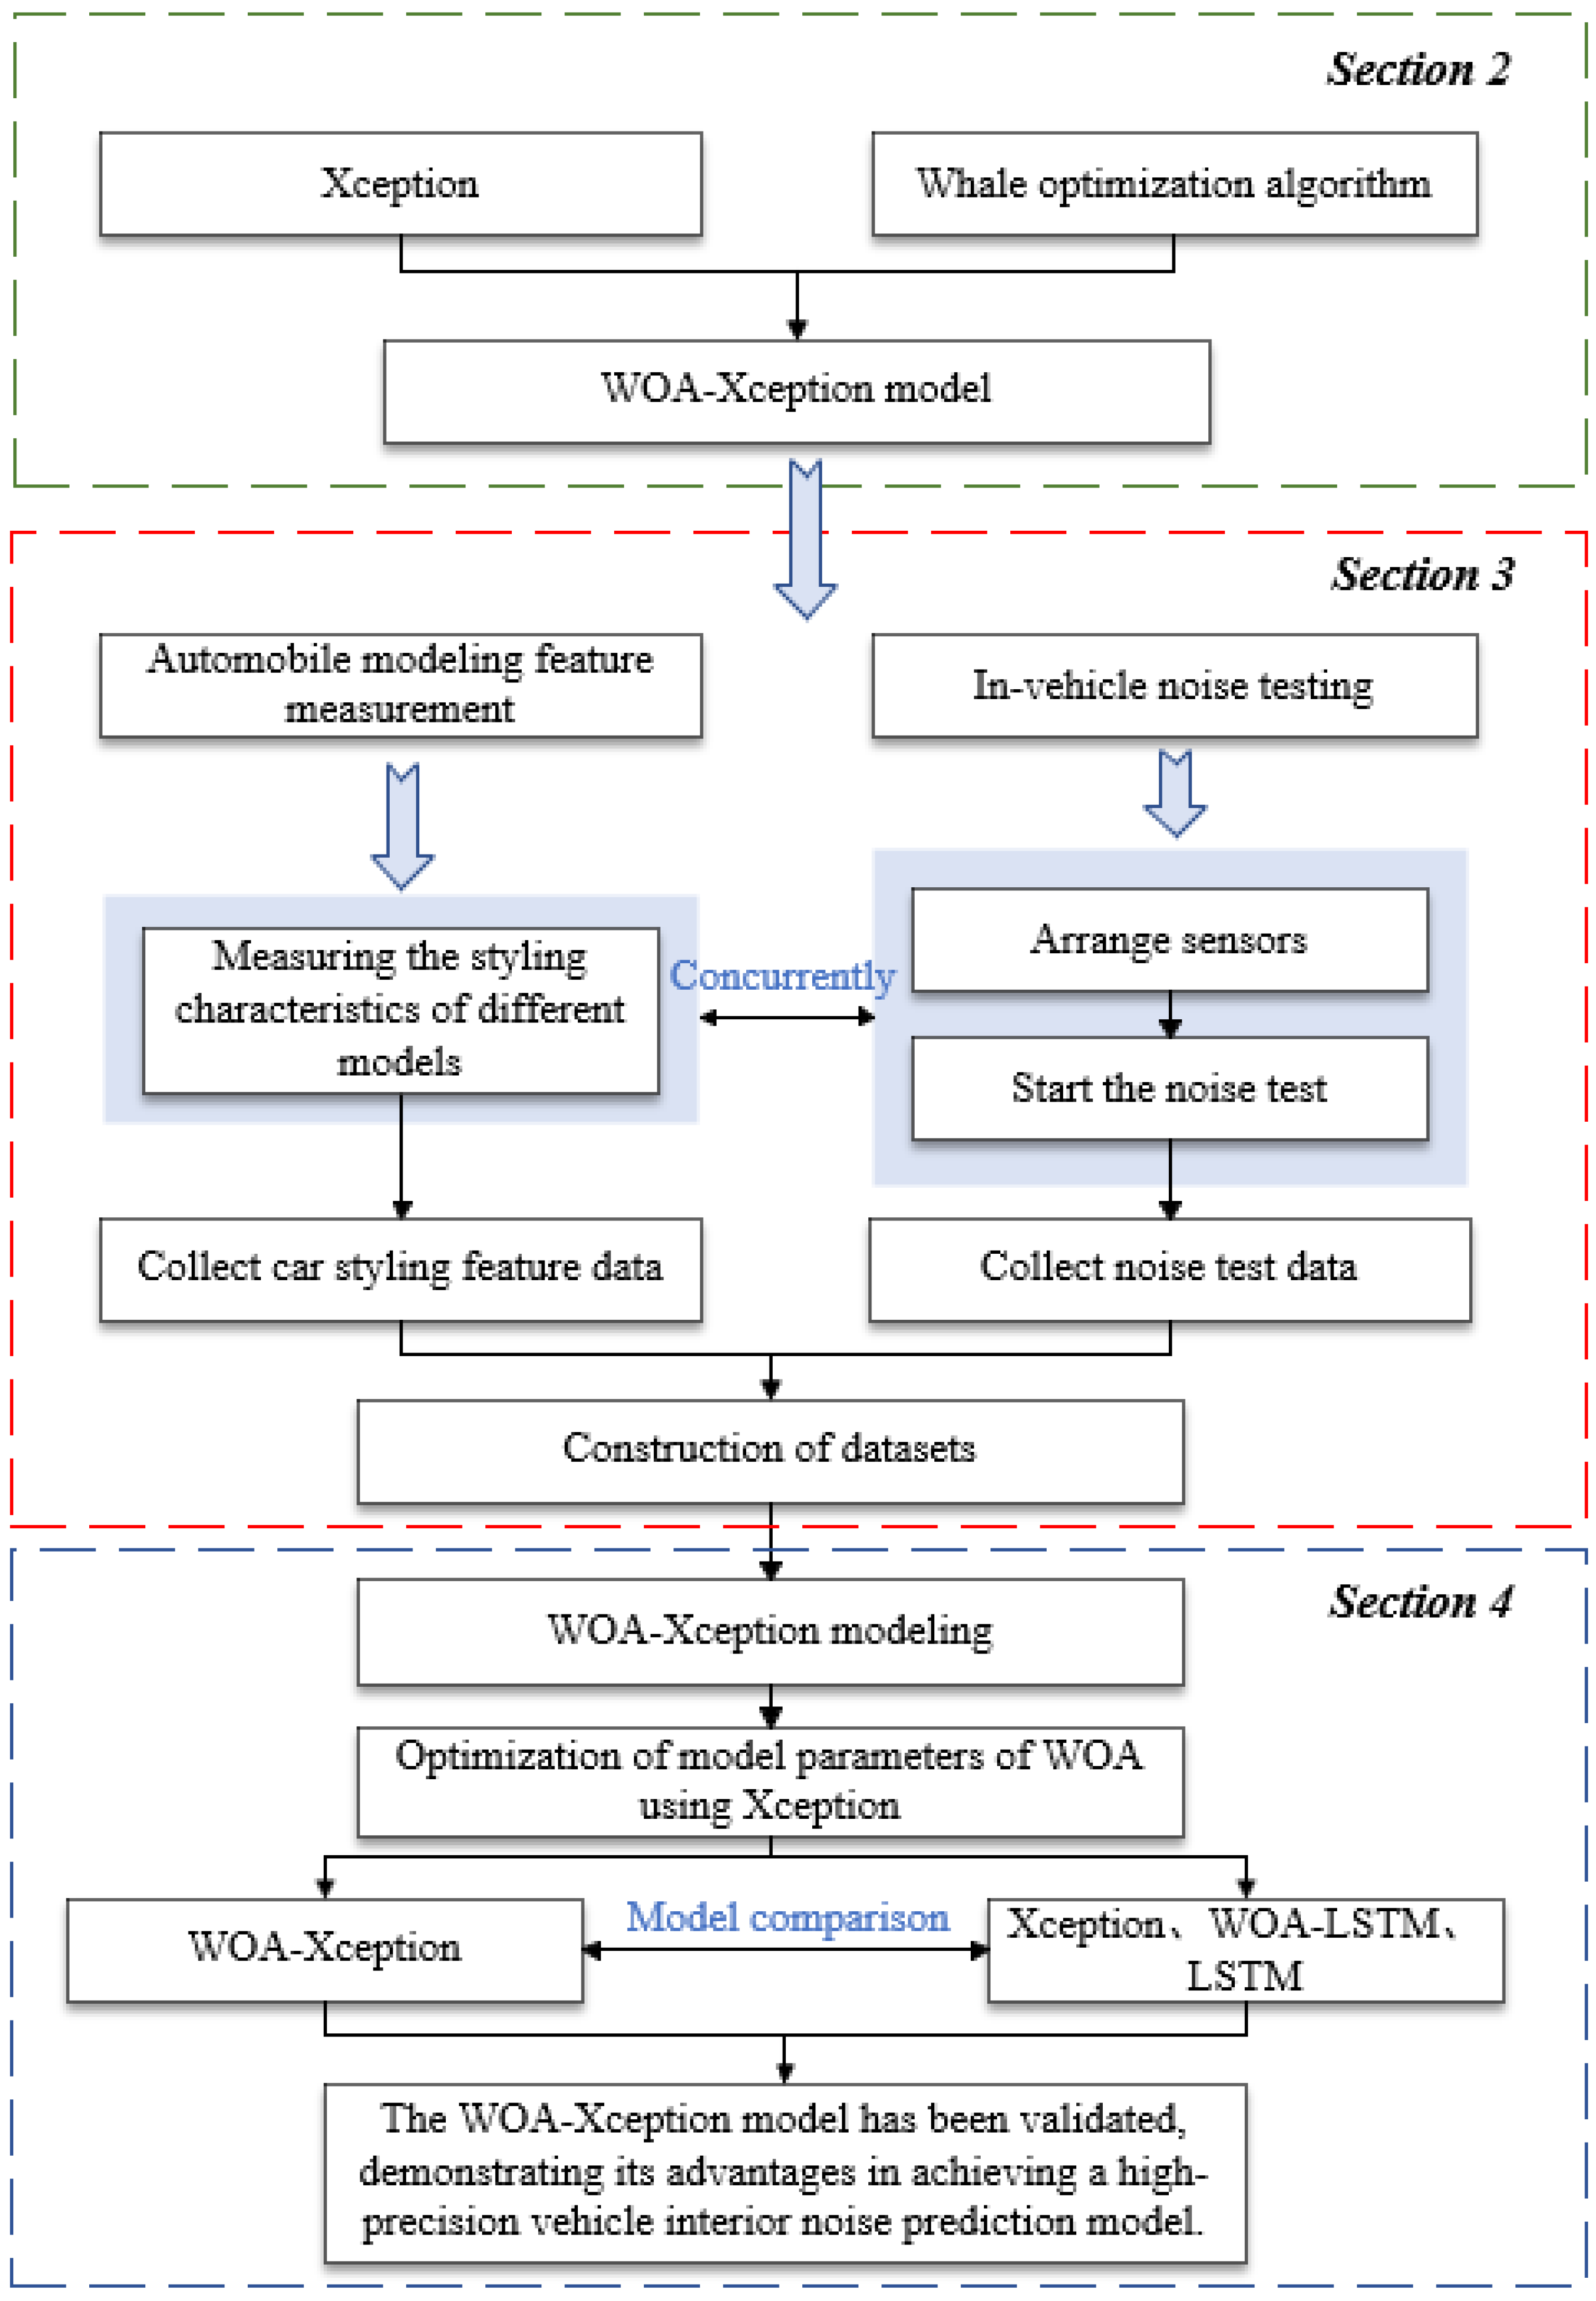
2. Models and Methods

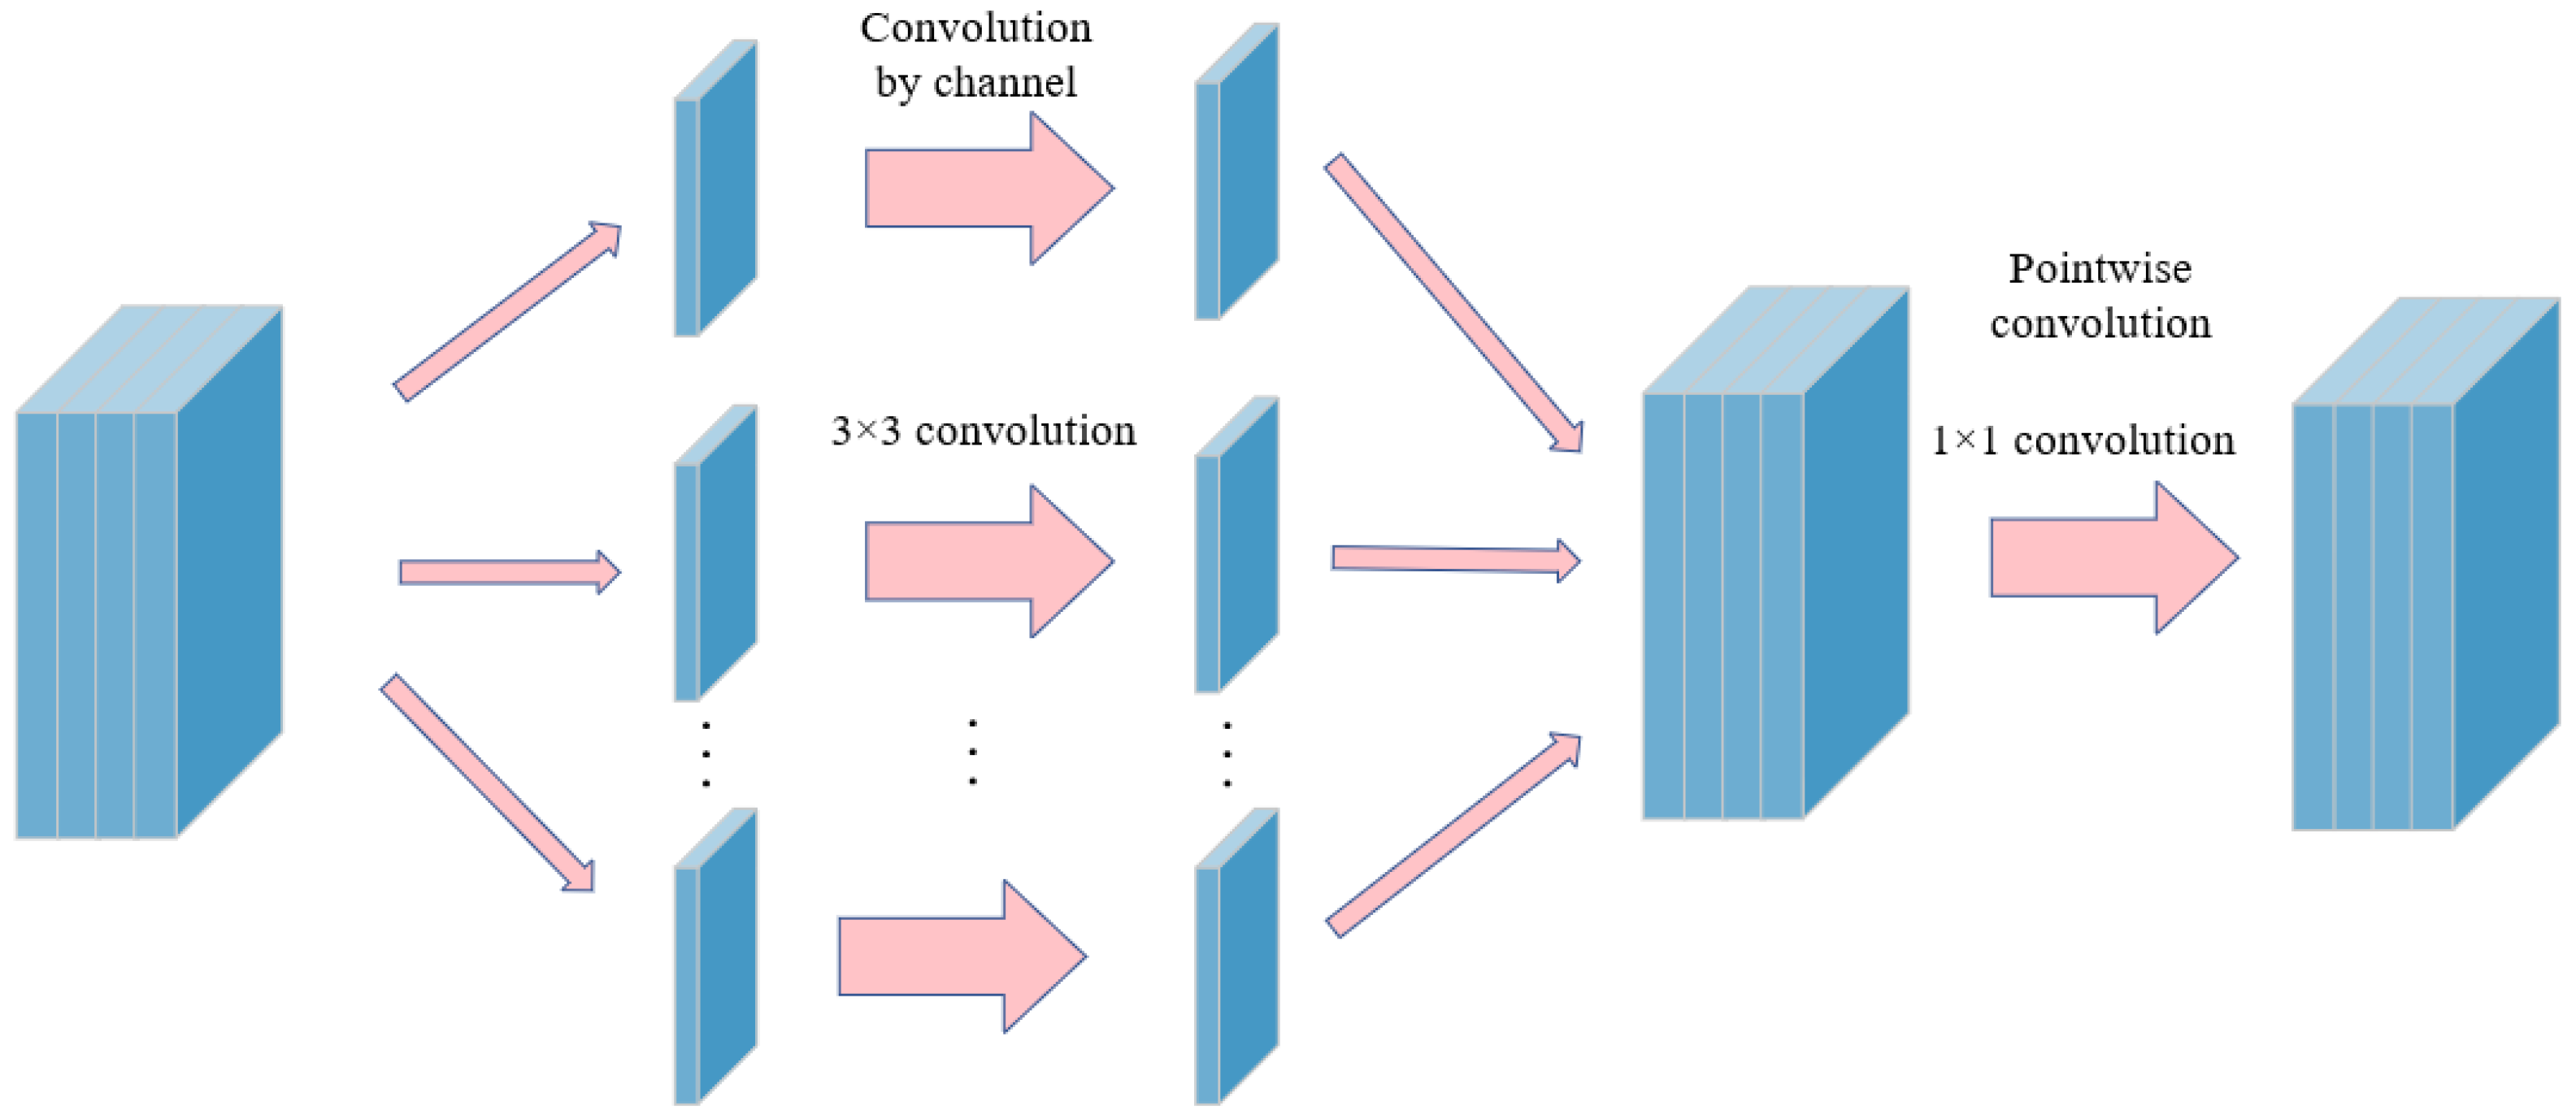
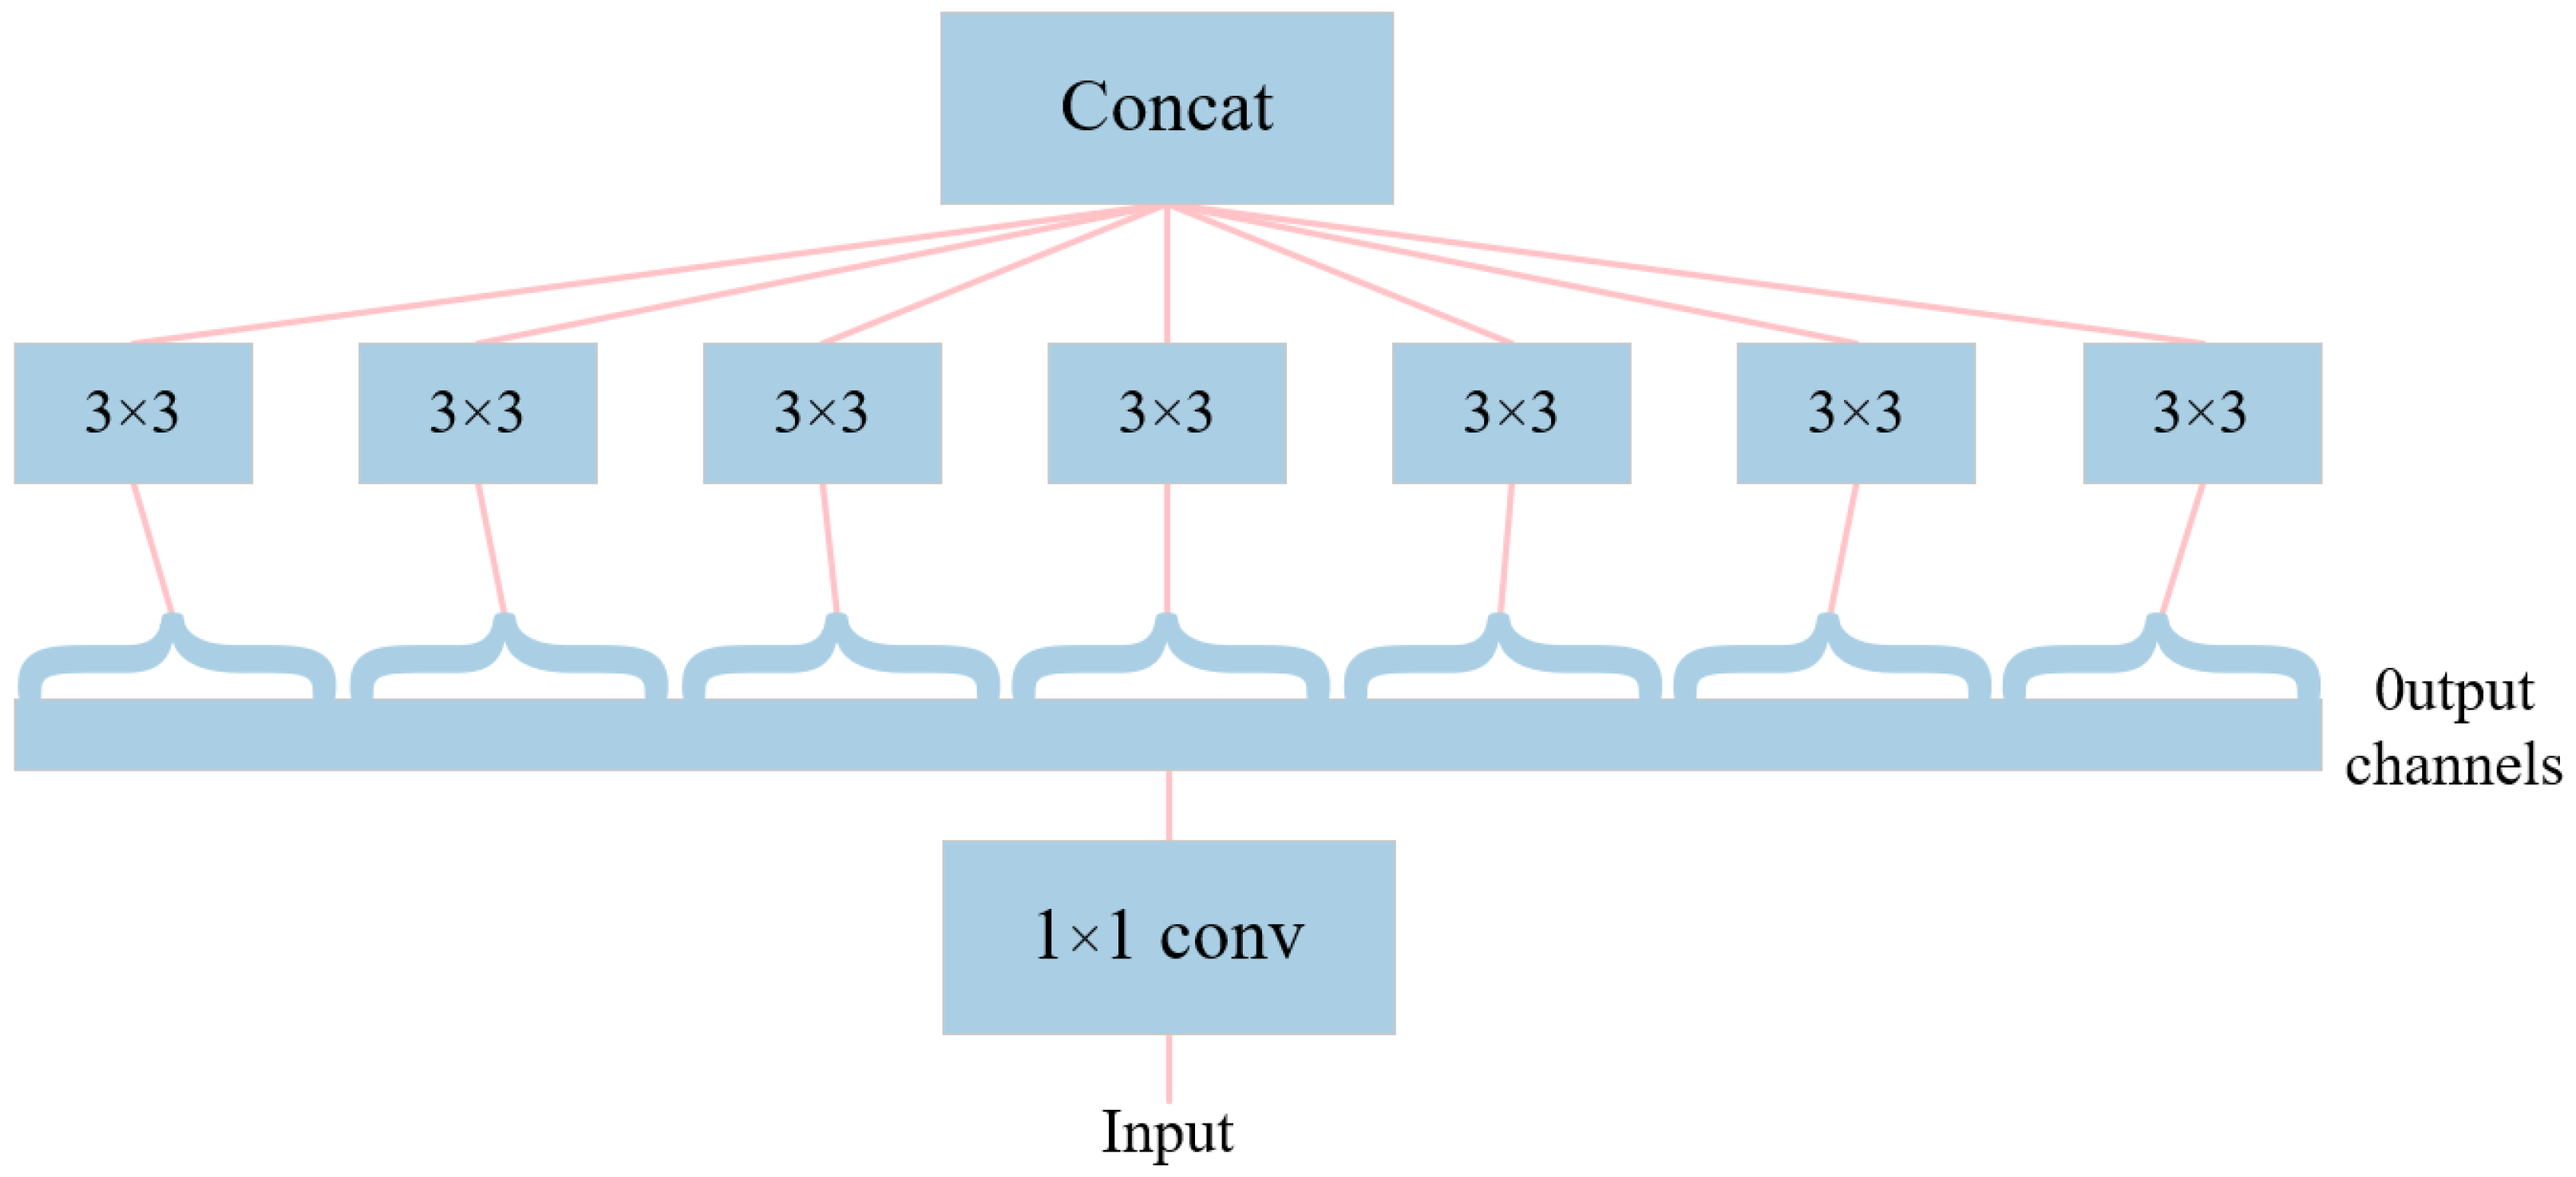
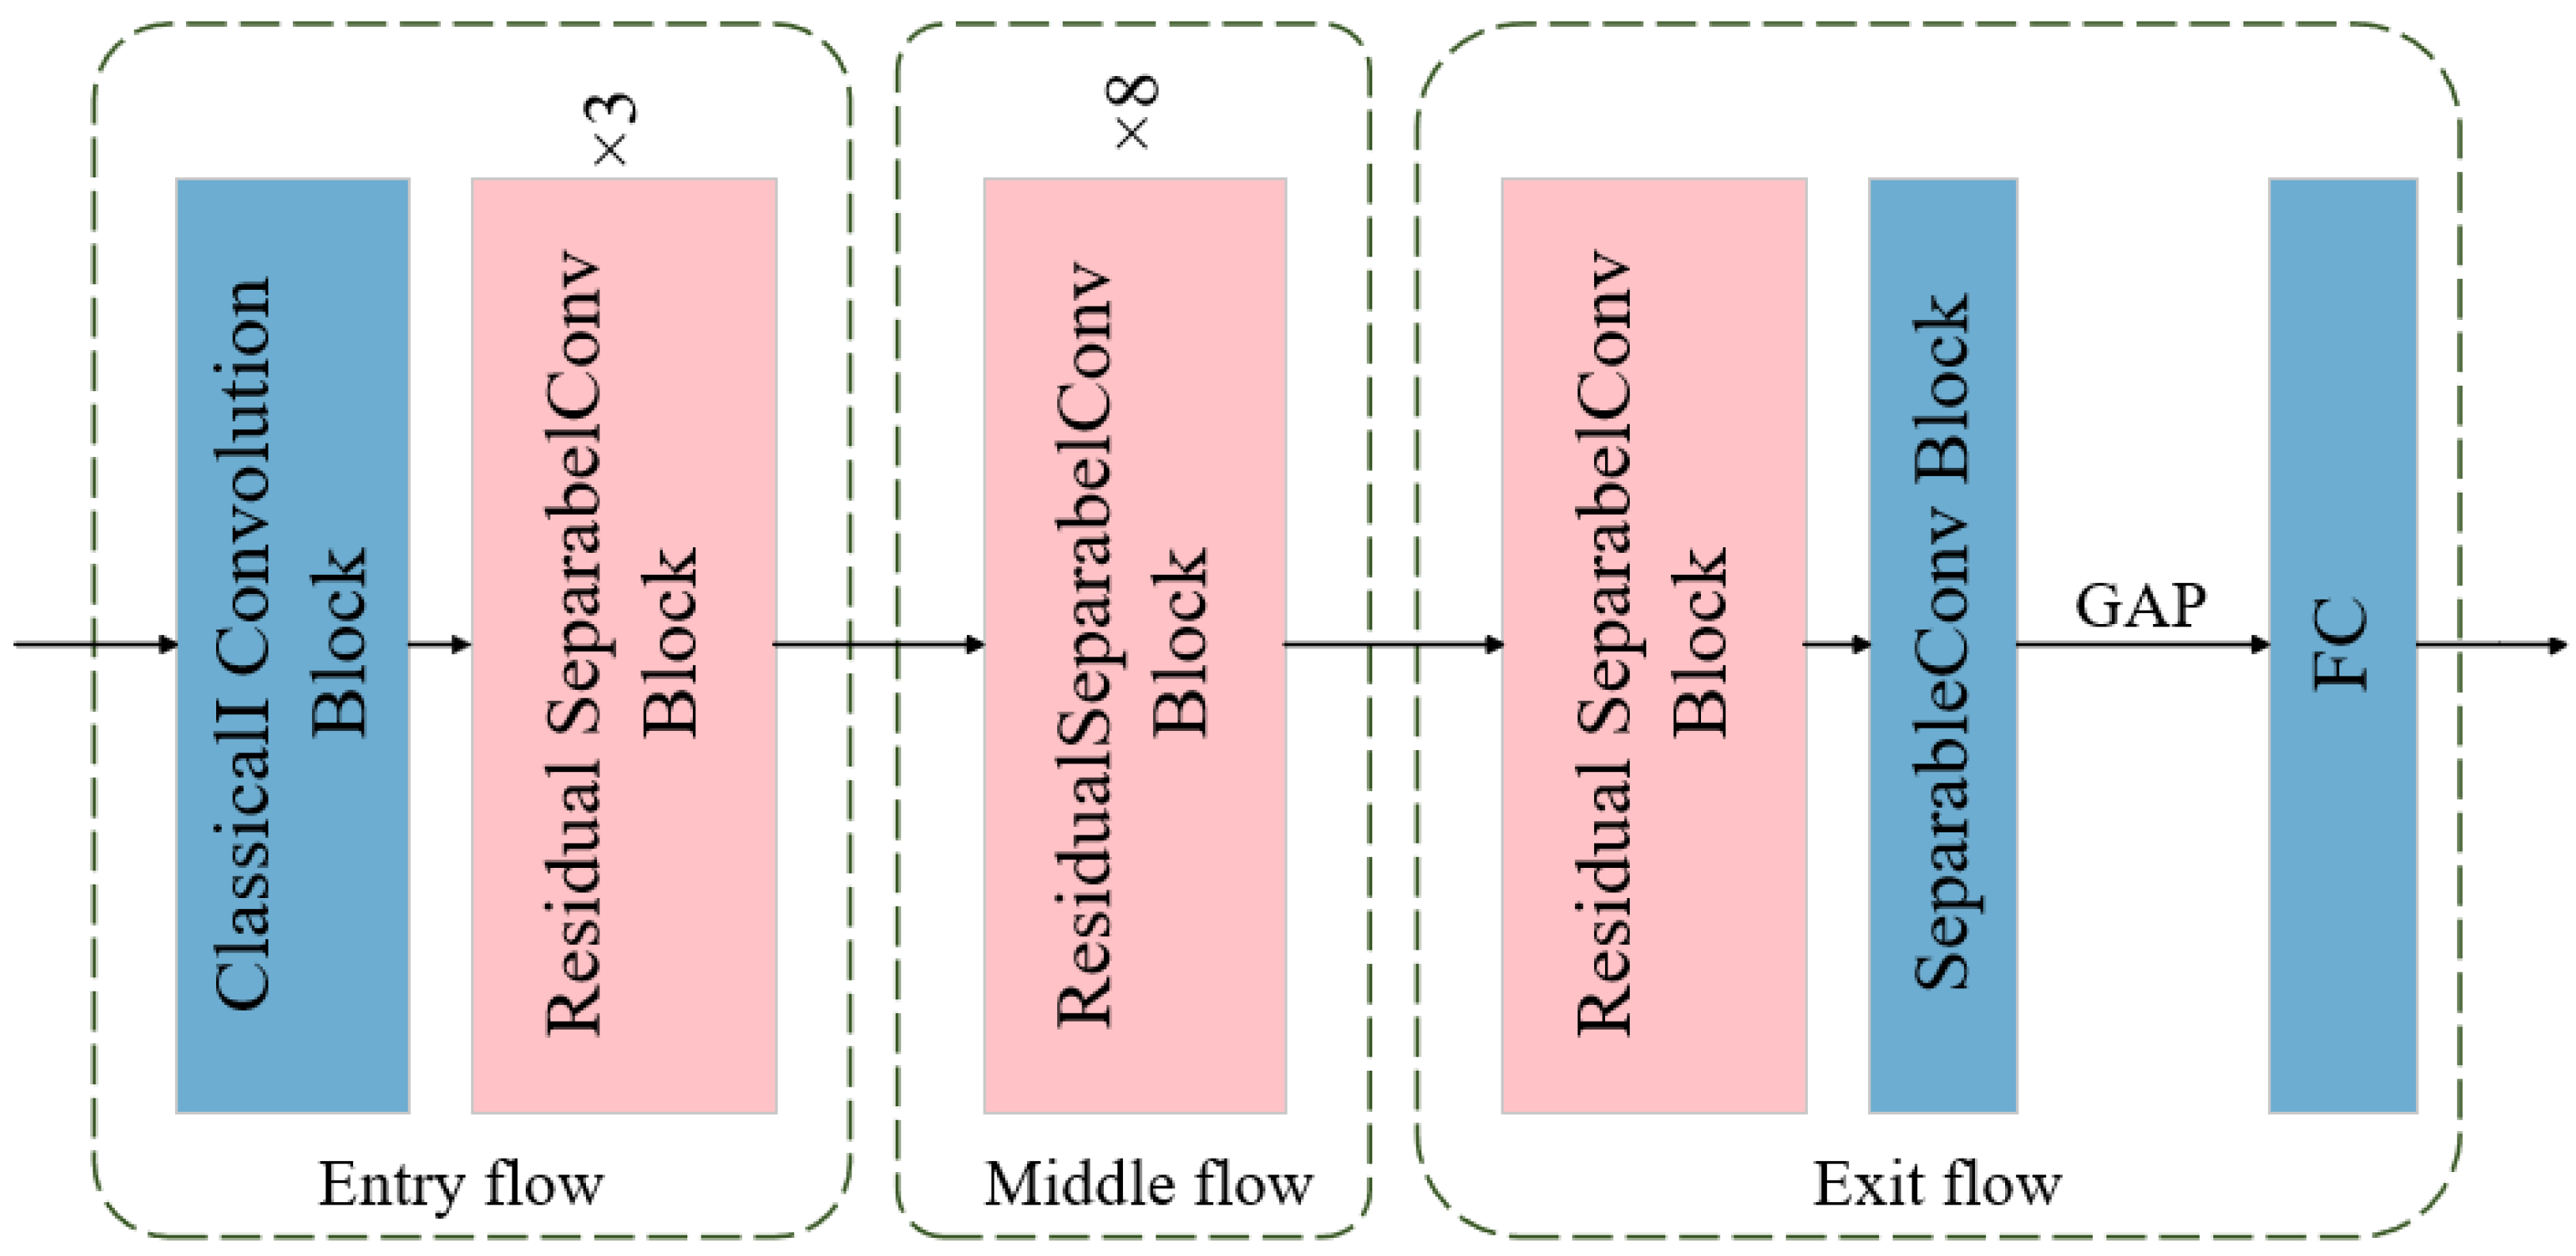
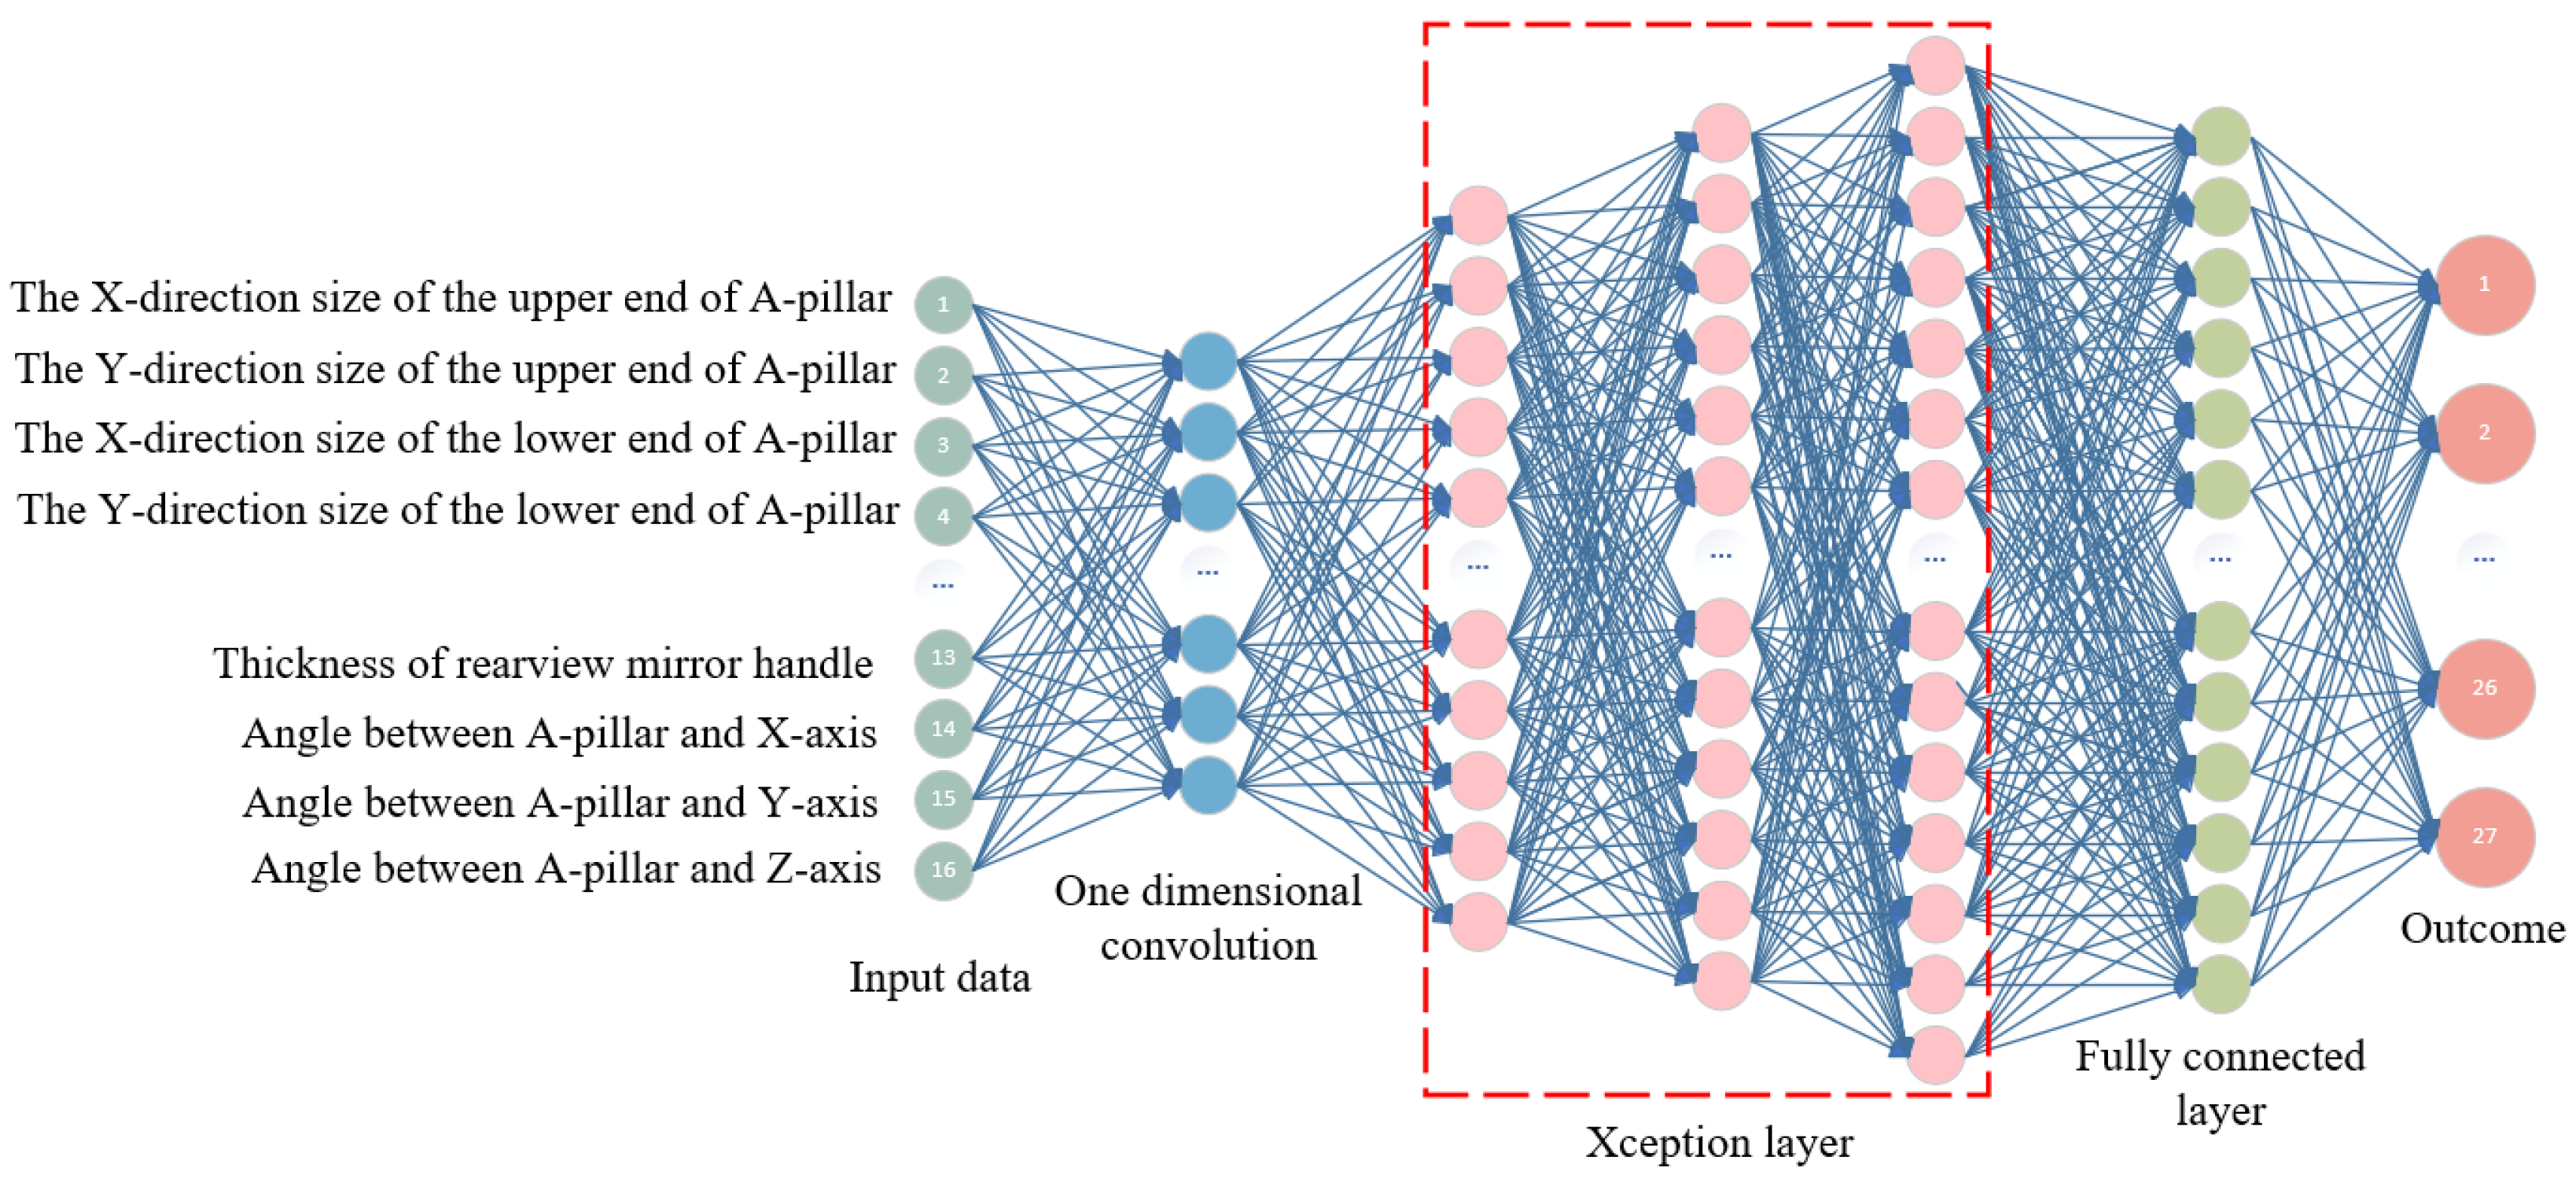
2.1. Xception Method

Xception is a deep convolutional neural network architecture based on separable convolutions, proposed by Google’s research team [40]. Its core idea is to decompose traditional convolution operations into channel-wise convolution and point-wise convolution, thereby significantly reducing computational complexity and parameter count while enhancing feature extraction capabilities. Building upon Inception V3, Xception optimizes the structure by assuming that the feature extraction processes along the channel dimension and spatial dimension can be completely decoupled and replaces standard convolution operations with deep separable convolution, thereby achieving an efficient feature learning mechanism.
Deep separable convolution consists of two main steps: depth convolution and point-wise convolution [41]. Depth-wise convolution is the first step of depth-wise separable convolution. It independently applies a K × K × 1 convolution kernel to each channel of the input feature map without summing across channels. Therefore, each input channel corresponds to an independent convolution kernel, and the number of channels in the output feature map remains C i m . Assuming that the input feature map is I R H × W × C i m and the depth-wise convolution kernel is D R H × W × C i m , the calculation of the output feature map O d w R H × W × C i m is as follows:
O d w h , w , c = i = 1 K j = 1 K I h + i 1 , w + j 1 , c · D i , j , c
In this context, h , w , c represents the coordinates and channels of the output feature map. The values of H and W are determined by the convolution stride and padding. The computational complexity of deep convolution is as follows:
C d w = H × W × C i m × K × K
The number of participants is given by the following:
P d w = K × K × C i m
The second step is point-by-point convolution, which is used to perform a linear combination of channels on the deep convolution output, which in turn generates the final output feature map. It uses a 1 × 1 × C i m convolution kernel with the number of output channels, C o u t . Assuming that the deep convolution output is O d w and the point-by-point convolution kernel is P R 1 × 1 × C i m × C o u t , the final output O R H × W × C o u t is as follows:
O h , w , c = c = 1 C i m O d w h , w , c · P 1 , 1 , c , c
The point-by-point convolution is computationally intensive:
C p w = H × W × C i m × C o u t
The number of participants is given by the following:
P p w = C i m × C o u t
The total computation of the depth separable convolution is the sum of the depth convolution and the point-by-point convolution:
C = H × W × C i m × K × K + H × W × C i m × C o u t
The total number of participants is given by the following:
P = K × K × C i m + C i m × C o u t
The ratio of computational reduction compared to standard convolution is roughly as follows:
R = K × K + C o u t K × K × C o u t 1 C o u t + 1 K 2
As demonstrated by the above formula, under the condition that the input and output sizes are equivalent, depth-separable convolution has the capacity to substantially reduce the necessary computation and the number of parameters. The efficacy of this method is predicated on the decoupling of spatial dimension and channel dimension operations, thereby enhancing computational efficiency while preserving expressive power. The pertinent operational process is illustrated in Figure 2.
The structural design of deeply separable convolution has been demonstrated to result in the Xception network exhibiting superior parameter efficiency, feature representation, and modeling performance. Xception has been demonstrated to enhance the accuracy and robustness of the network through a gradual separation and fusion of features, thereby facilitating the acquisition of more complex and abstract representations. Consequently, the deep separable convolution has emerged as a pivotal component in enhancing the efficacy of deep neural networks. The configuration of the deep separable convolution module within the Xception network is illustrated in Figure 3.
The overall structure of the Xception network is shown in Figure 4. The network mainly consists of three parts: Entry Flow, Middle Flow, and Exit Flow. Among them, the input layer is used for preliminary feature extraction and dimension reduction of the original input; the middle layer is the core part, which refines the features through multiple layers of repeatable stacking of separable convolution modules; and the output layer maps the features extracted by the middle layer to the final output space to complete the task objective [42]. In the network structure, “Conv” denotes standard convolution operations; “SeparableConv” denotes depth-separable convolution; “Stride” denotes the convolution stride; and “ReLU” is the activation function, which enhances the network’s nonlinear expression capability.
The Xception method has several advantages. First, its depth-separable convolutions significantly reduce computational complexity, reducing the number of parameters by approximately 30% and computation time by approximately 40% while maintaining model performance, making it particularly suitable for processing high-dimensional data [43]. Second, this method has multi-scale feature extraction capabilities, which can effectively capture complex data patterns and is widely used in tasks such as image recognition and speech processing. In this study, Xception was selected as the base model for in-vehicle wind noise prediction modeling, primarily because its structure has good generalization ability and robustness to outliers, enabling stable and reliable prediction results. It can also rank feature importance through weight evaluation during the training process [44]. However, since the prediction performance of this model depends on the reasonable configuration of hyperparameters, the parameter optimization process is crucial for improving the prediction accuracy.

2.2. WOA-Xception Method

The whale optimization algorithm (WOA) is a randomized global optimization algorithm inspired by the hunting behavior of humpback whales [45]. The algorithm initializes a specified number of candidate solutions, forming a population, and employs an objective fitness function to assess the quality of each solution. Subsequently, by simulating the behaviors exhibited by humpback whales, such as surrounding prey, bubble-net hunting, and searching for prey, the solutions are continuously updated and optimized. During the optimization process, the fitness function determines the update direction and step size for each candidate solution based on the objective function value. This guides the search process to iterate forward in the solution space until the predefined termination conditions are met. Ultimately, this process obtains a solution that is close to the global optimum [46].
The algorithm’s primary function is to facilitate cooperative search and random exploration among individuals in the population by emulating the intelligent hunting strategy of humpback whales. This is achieved by balancing global and local search to enhance search efficiency [47]. Given that the location of the optimal solution within the search space is not known beforehand, the WOA operates under the assumption that the individual with the highest fitness in the current population is the target prey or a candidate solution that is proximate to the optimal solution. It is hypothesized that, as a result of this assumption, other individuals will gradually gravitate toward the optimal individual according to the following formula:
D = C · X t X t
X t + 1 = X t A · D
In this context, t —denotes the current number of iterations; X t —denotes is the position vector; X t —denotes the position vector of the best solution obtained so far.
The vectors A and C are computed as follows:
A = 2 a × r 1 a
C = 2 × r 2
Throughout the iteration, a decreases linearly from 2 to 0; r 1 and r 2 are random vectors in [0, 1].
Humpback whale predation has two main mechanisms: encircling predation and bubble-net predation. When bubble-net feeding is used, the positional update between humpback whales and their prey is expressed by the logarithmic spiral equation as follows:
X t + 1 = D × e b 1 × cos 2 π l + X t D = X t X t
In this model, D denotes the distance between the current searching individual and the current optimal solution; b is a constant that defines the shape of the logarithmic spiral; and l is a random number between [−1, 1].
In order to simulate both the whale’s contraction-envelope mechanism and the spiral update mechanism, assuming that the two mechanisms are executed with equal probability, this can be expressed mathematically as follows:
X t + 1 X t A · D , p < 0.5 D × e b 1 × cos 2 π l + X t , p 0.5
To ensure that all whales can fully search in the solution space, the WOA updates the position according to the distance of whales from each other to achieve random search. Therefore, when A 1 , the searching individuals will swim to the random whale with the following expression:
D = C · X r a n d t X t
X t + 1 = X r a n d t A · D
where D denotes the distance between the current searching individual and the randomized individual; X r a n d t denotes the position of the current randomized individual.
In this study, the WOA method was employed to optimize the key hyperparameters of the Xception model, with the objective of enhancing its performance in the wind noise mapping task. The performance of the Xception model is found to be significantly affected by hyperparameters such as learning rate and batch size. To address this, a population of candidate parameters was first constructed, and the corresponding Xception models were trained using the training data. The models were evaluated using prediction accuracy as the fitness function. Subsequently, the parameter combinations were continuously optimized through the steps of enclosure predation, bubble-net update, and random search in the whale algorithm until the termination conditions were met, ultimately obtaining the optimal parameter configuration. The process of WOA optimization of the Xception model is illustrated in Figure 5.

3. In-Vehicle Master Driving Noise Test
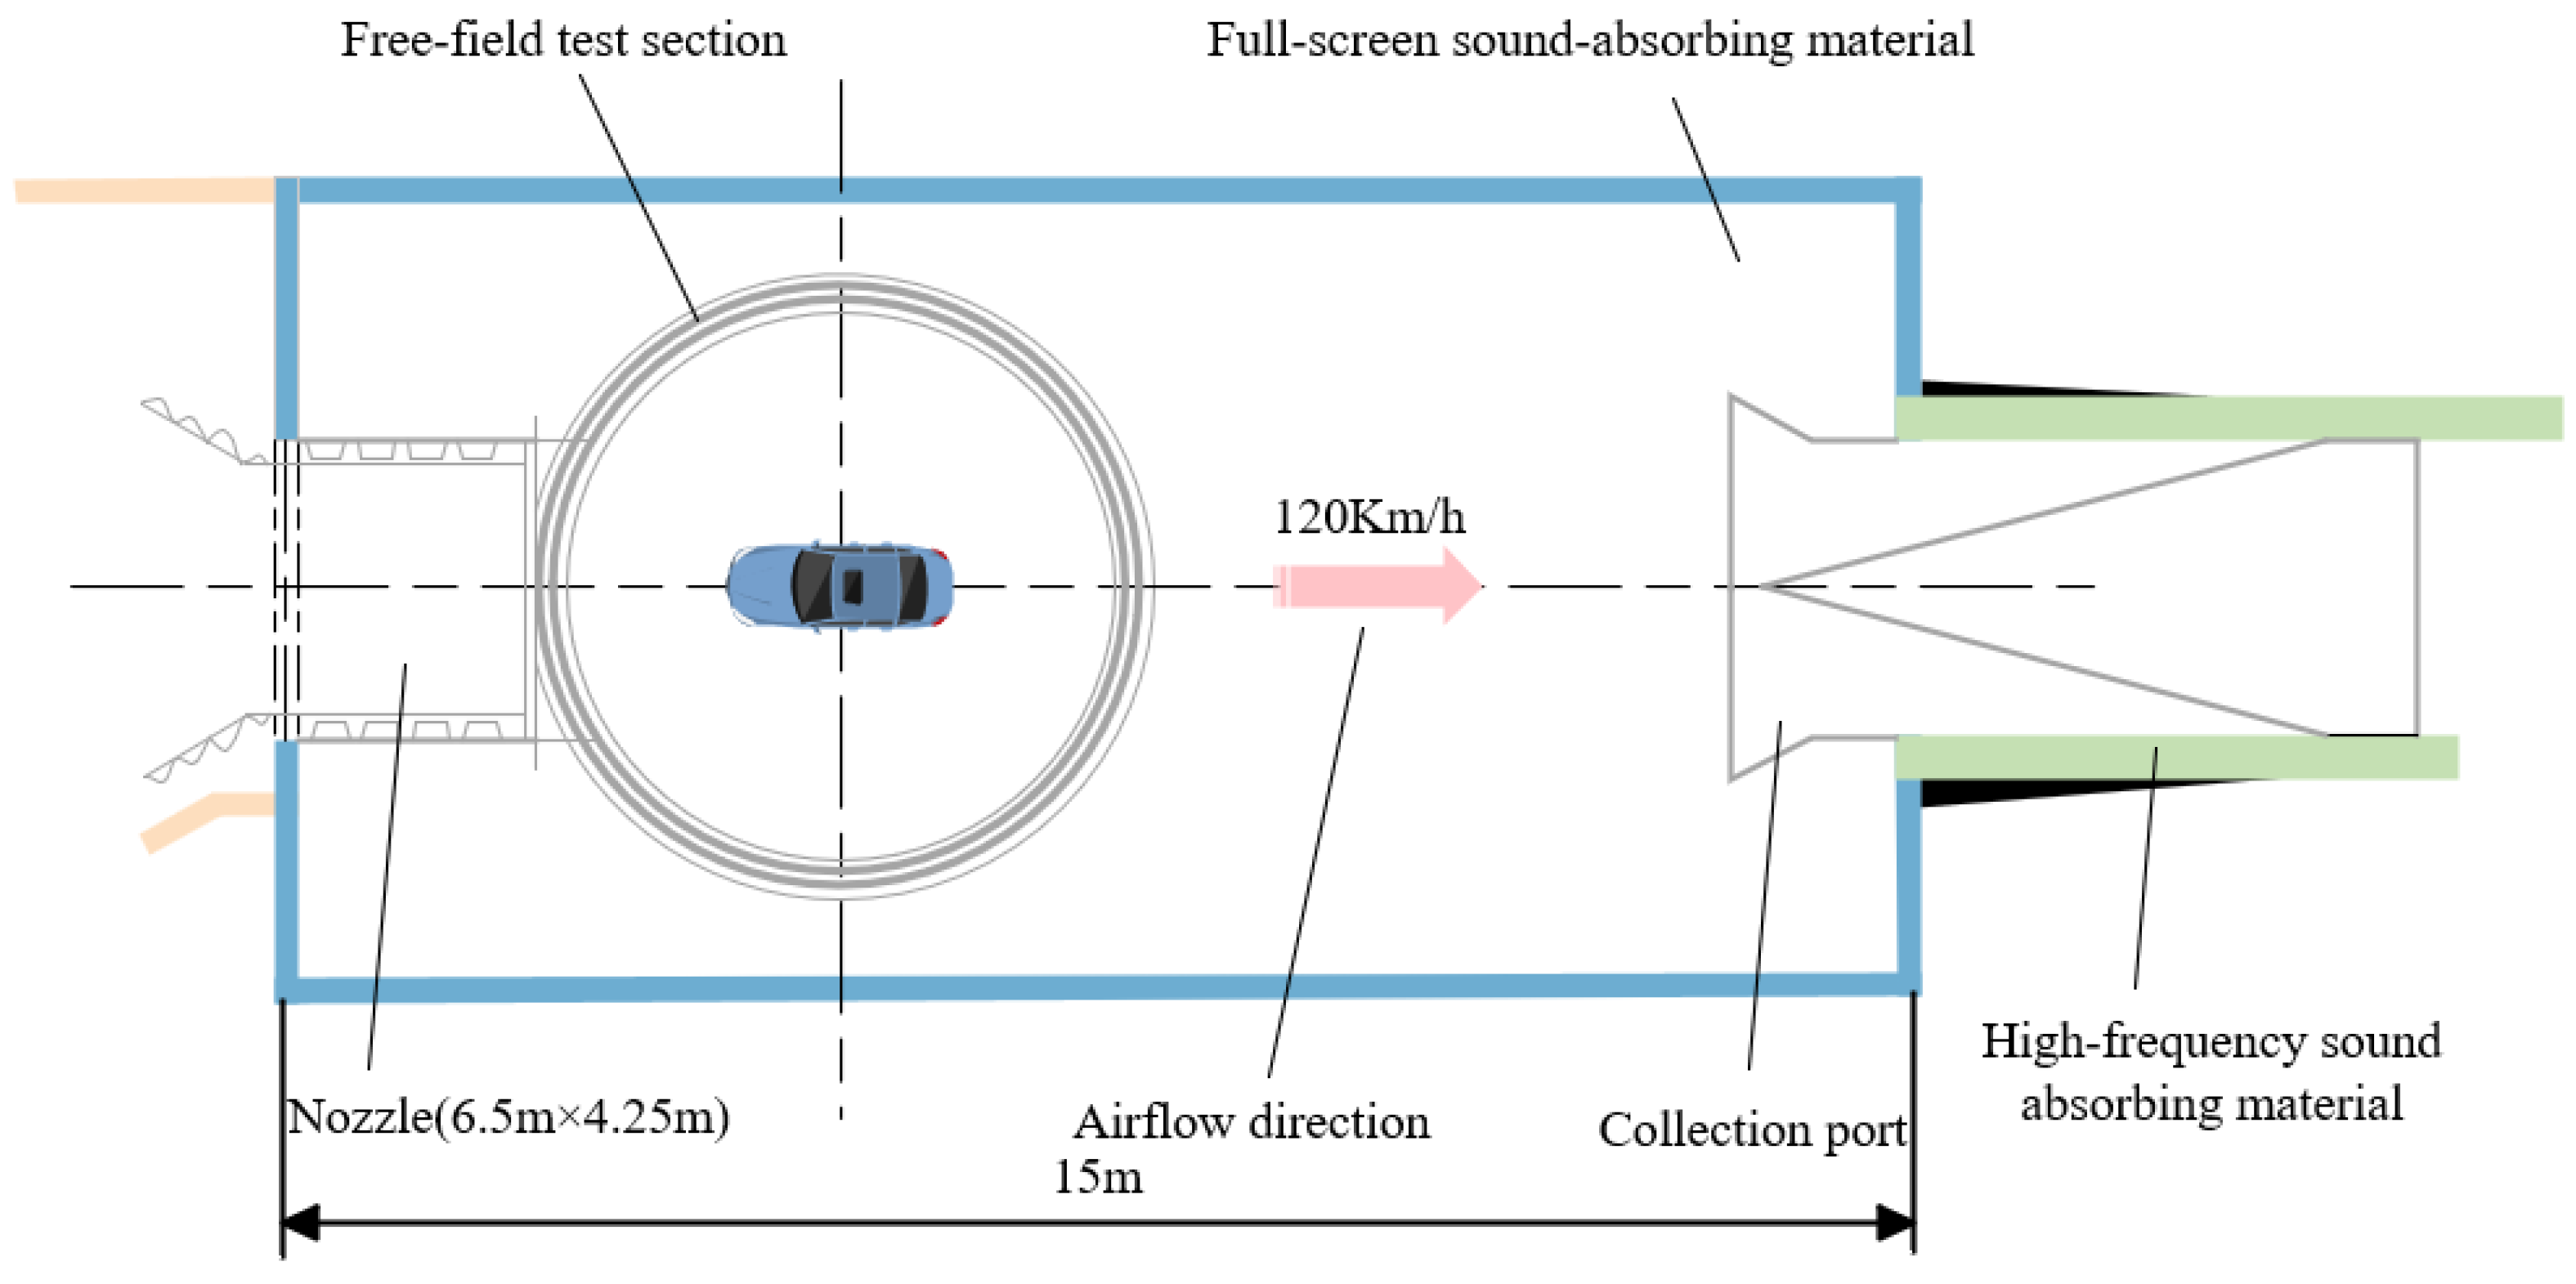
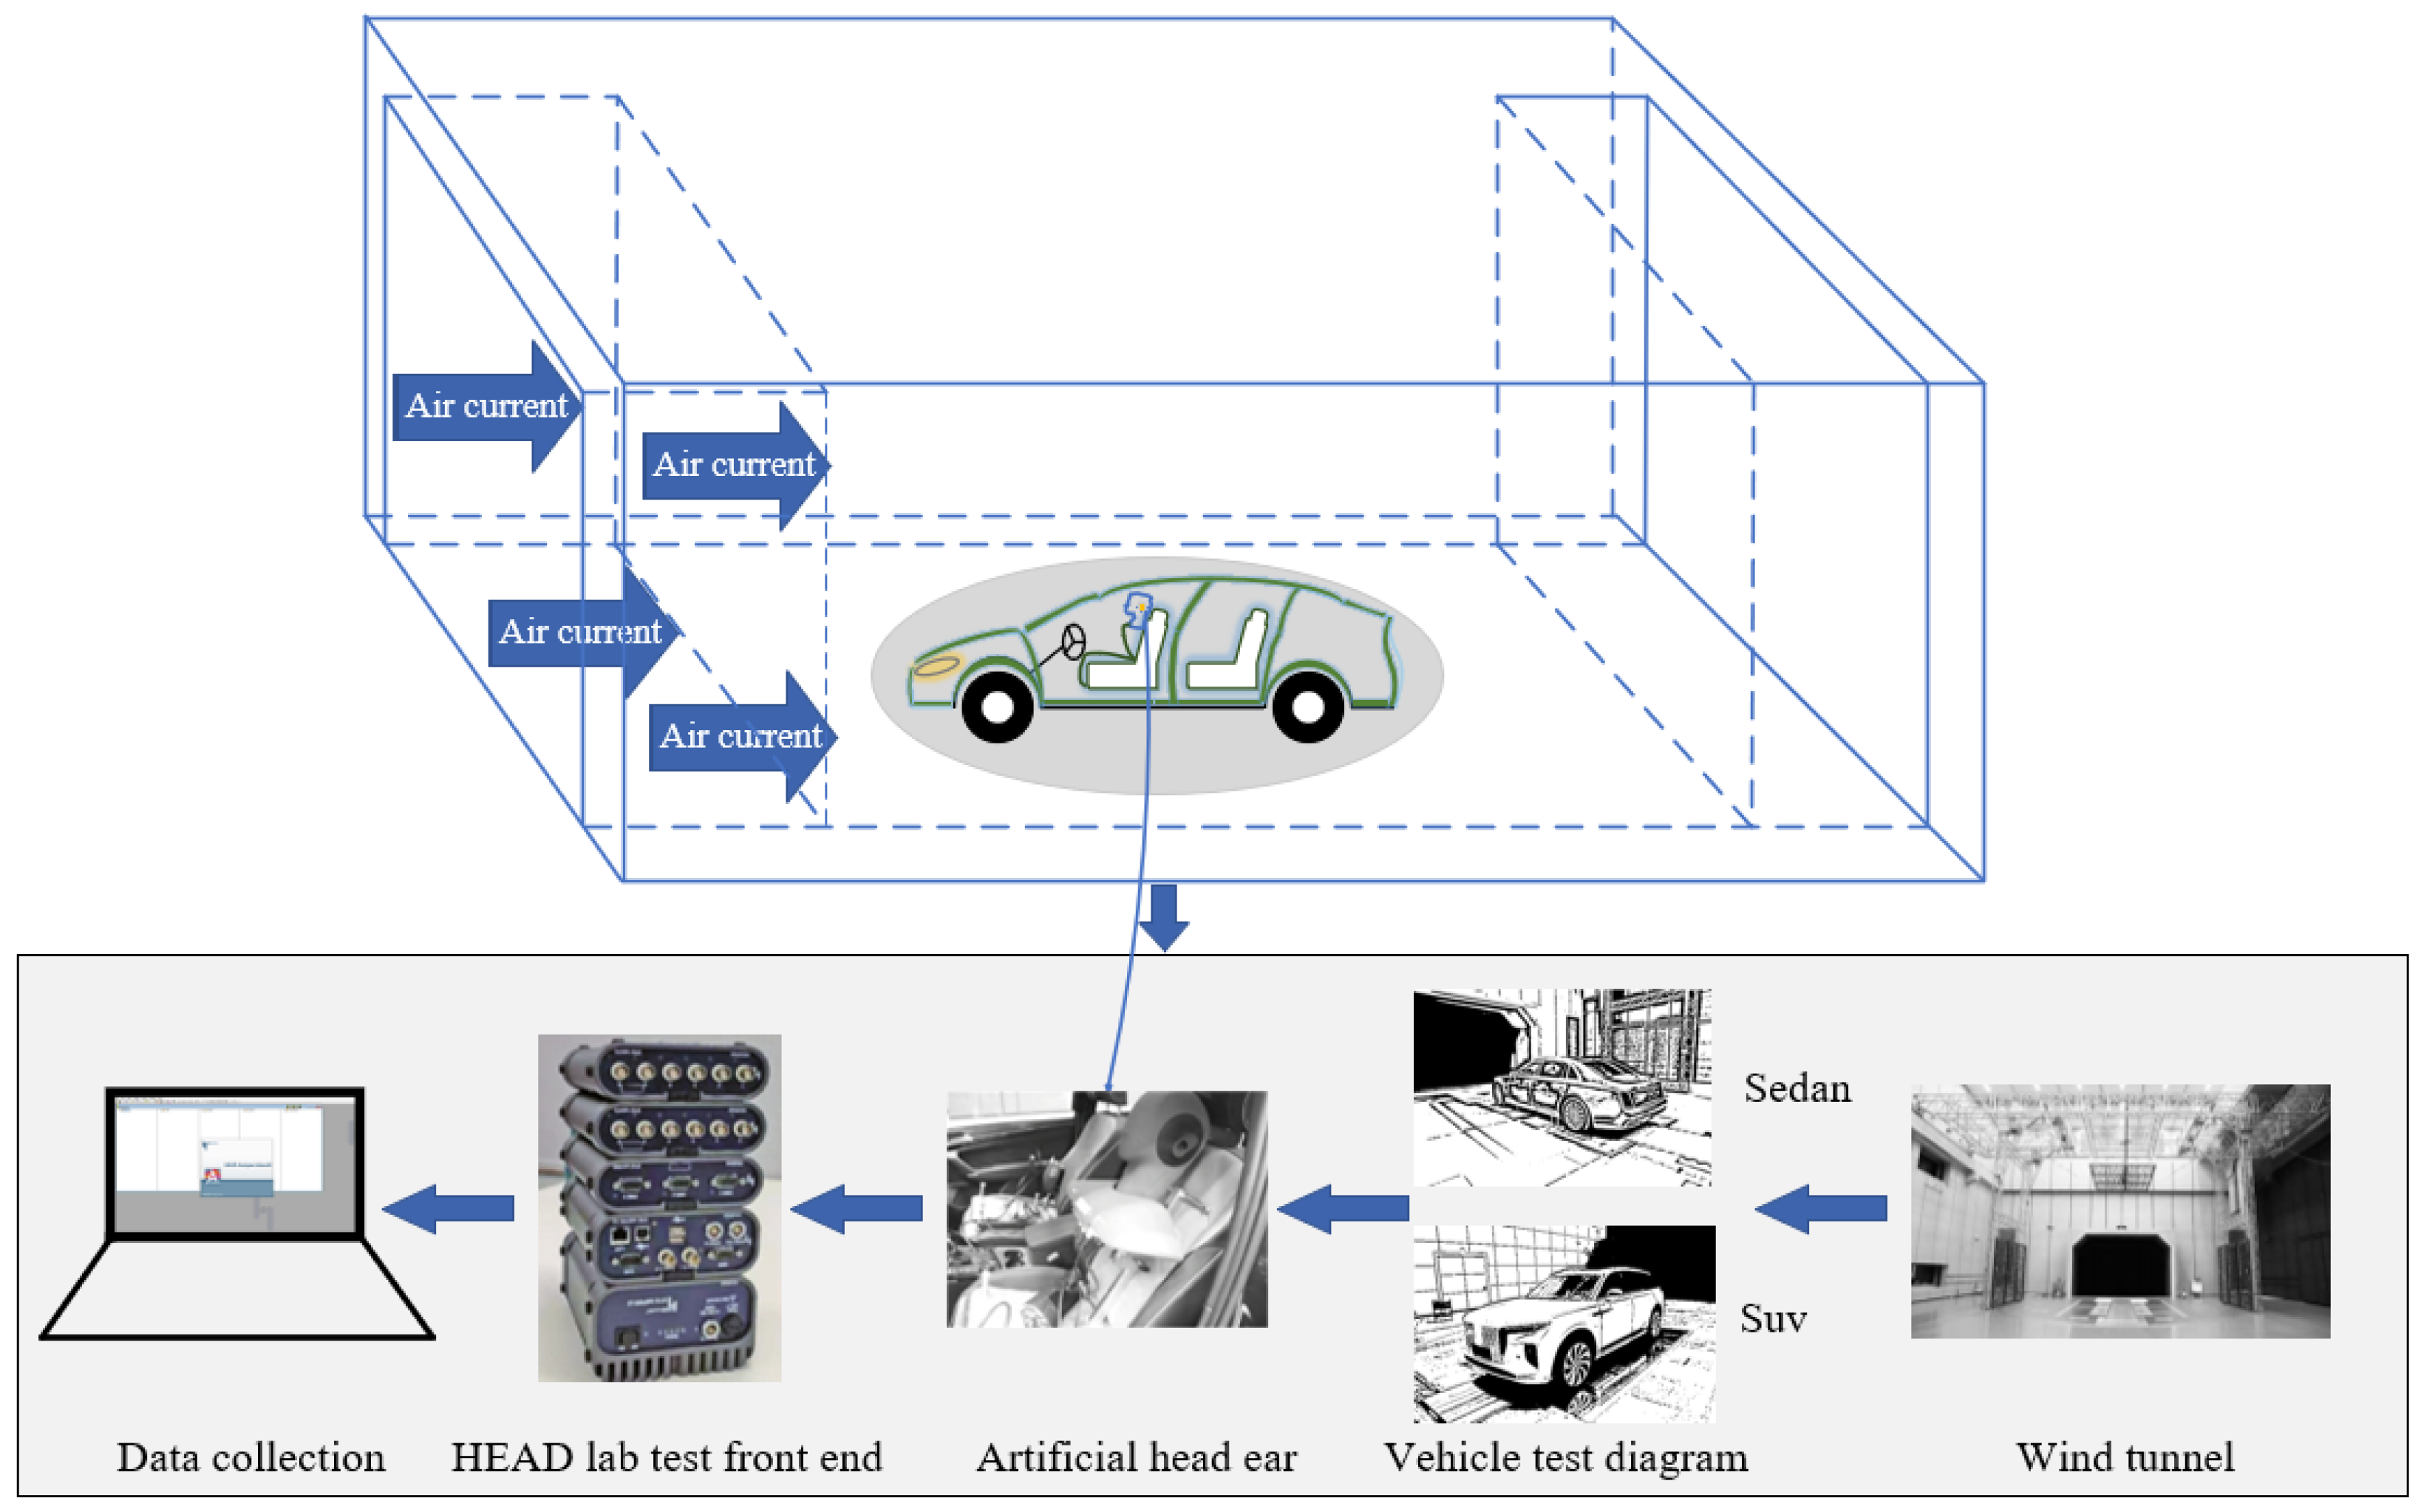
3.1. Test Platform

A vehicle wind tunnel is a specialized testing facility designed to simulate the operational state of vehicles in natural wind environments. It is widely used in research on the aerodynamic performance and wind noise performance of complete vehicles [48]. Vehicle wind tunnels are classified based on the different airflow circulation methods employed. The classification system includes two primary types: direct flow and recirculating flow. Of these, the recirculating-flow structure has seen the widest adoption due to its higher airflow stability and superior energy efficiency [49]. Furthermore, the configuration of the test section dictates a subsequent classification of wind tunnels as either open or closed [50]. Presently, the majority of newly constructed wind tunnels adopt a 3/4-open recirculating structure and integrate a ground effect simulation system at the lower part of the test section to simulate the relative motion between the vehicle and the road surface during vehicle operation. Consequently, this configuration is designated as a 3/4-open wind tunnel in certain literature sources [51]. The classification of automotive wind tunnels is primarily based on their functional purposes. These tunnels are divided into three categories: aerodynamic wind tunnels, acoustic wind tunnels, and environmental wind tunnels. Specifically, aerodynamic acoustic wind tunnels are engineered for the purpose of evaluating wind noise in and around vehicles, thereby serving as a pivotal experimental platform for guiding the design and optimization of vehicle wind noise [52]. The experiment was conducted in a designated aerodynamic and acoustic wind tunnel, as depicted in Figure 6. The test section of the wind tunnel is 15 m long, with a nozzle area of 27.625 square meters (nozzle dimensions: 6.5 m × 4.25 m), and the maximum wind speed can reach 250 km per hour. The temperature of the test is maintained within the range of 20–25 °C. The dimensions of the chamber are 22 m × 17 m × 12 m. The low-frequency pressure pulsations are less than 0.01; the axial static pressure gradients are less than 0.001; the turbulence levels are below 0.2%; and the background noise levels are below 57.5 dB(A) at a wind speed of 140 km/h. The critical components of the wind tunnel system, including the fans, ducts, corner sections, and test hall, have undergone acoustic treatment. This ensures that the overall aerodynamic and acoustic performance meets international advanced standards. The wind tunnel center is equipped with a high-performance acoustic testing system, suitable for various testing scenarios such as passenger vehicles, commercial vehicles, and unmanned aerial vehicles (UAVs).
The noise and vibration testing system employs the measurement and analysis platform from HEAD Acoustics GmbH, a German company located in Herzogenrath, Germany. The main equipment includes the HEAD lab test front end, fourth-generation digital artificial head, GRAS 46AQ microphone, HEAD Recorder 9.0 test software, and Artemis 9.0 analysis software.

3.2. Test Method

The test objects were SUV and sedan models produced by an automobile group Co., Ltd. (Changchun, China). The schematic diagram of the test is shown in Figure 7. During the test, the fourth-generation digital dummy head was positioned at the center of the driver’s seat with a sampling frequency of 48 kHz and a sampling time of 15 s. Prior to the test, the wind tunnel system was adjusted to an appropriate acoustic test condition. This included the following: moving the center belt of the lower balance, installing a center cover plate to ensure the continuity of the test area surface and the integrity of the aerodynamic environment, and closing the boundary layer suction system and the moving belt system to obtain a stable test airflow [53].
The test vehicle was situated at the center of the wind tunnel test section. The angle between the longitudinal symmetry plane of the vehicle body and the center symmetry plane of the wind tunnel was meticulously calibrated to ensure it fell within ±0.1°, thereby ensuring test symmetry and repeatability. The seats were adjusted to the standard position, i.e., the front-to-back position; the height was set to the middle position; and the front seatback angle was adjusted to vertical, ensuring consistent interior layout and accurate positioning of the artificial head model. The digital artificial head was positioned at the center of the driver’s seat to obtain acoustic signals from the right ear. The vehicle was designed to contain all the necessary test equipment, with the exclusion of any additional weights. The vehicle was adjusted to the ready state, ensuring that its posture was consistent with the design. Securing the vehicle was achieved through the implementation of the parking brake. For manual transmission vehicles, the shift into first gear was initiated, while automatic transmission vehicles were shifted into park. The front windshield wipers were retracted; the cooling fan was deactivated, permitted to rotate unimpeded; the air conditioning system was configured to internal circulation mode; and all the air vents were closed. All components associated with the opening and closing of the vehicle, including doors and windows, were in the closed position. Additionally, the exterior rearview mirrors were kept in an open configuration.
Following the completion of the vehicle layout and wind tunnel setup, the test system must be calibrated to ensure test accuracy and data consistency. Subsequently, the wind tunnel system was run; the wind speed was set to 120 km/h, and the yaw angle was 0°. The specific test configuration parameters are shown in Table 1, and the data acquisition started after the flow field was stable. Each data collection must be maintained for a minimum duration of 15 s, and a minimum of three replicate tests is required to ascertain the stability and repeatability of the test data. The experiment involved the evaluation of 30 prototype vehicles. Subsequent to the test, the system was recalibrated to ensure the validity and traceability of the test data.

3.3. Test Results for Noise in the Driver’s Right Ear Inside the Vehicle

The post-processing frequency range for test data was 20–8000 Hz. The spectral results are presented in A-weighting, and the loudness values were calculated in accordance with ISO 532-1 standards [54]. Following the completion of the objective tests, a vehicle was randomly selected from each of the SUV and sedan samples to serve as the representative vehicle for analysis. As illustrated in Figure 8, the one-third octave frequency response curves at the right ear measurement point of the driver’s seat for the selected SUV and sedan models are presented. As demonstrated in Figure 8, the spectral curves of the examined SUV and sedan models did not display any notable sharp peaks, suggesting that the vehicles’ overall condition was satisfactory and that any abnormal noise sources were absent. A comparison of the spectral results for the two vehicle types reveals that the noise level at the driver’s seat of the SUV was higher than that of the sedan. This discrepancy is primarily attributed to the SUV’s elevated body structure and augmented volume, which render it more vulnerable to airflow during operation, thereby inducing augmented wind noise. Furthermore, the augmented interior space gives rise to more intricate sound propagation pathways, thereby facilitating echoes and resonance, which in turn contribute to an augmented perceived noise level in the driver’s seat area [55].

4. Prediction and Verification of In-Vehicle Main Driving Noise Based on WOA-Xception

4.1. WOA-Xception Model Establishment

To reduce the high costs and resource consumption associated with traditional wind tunnel testing and real-vehicle testing, this paper proposes an efficient prediction method for interior driver-side noise. The method extracts vehicle shape features and combines them with driver-side right ear noise data obtained from wind tunnel tests to construct a prediction model with shape features as the input and noise levels as the output.
The input features of the prediction model are extracted from the three-dimensional model of the vehicle and cover key design parameters that have a significant impact on the generation of aerodynamic noise. These features include the following: the dimensions of the upper and lower ends of the A-pillar in the XY direction (which determine the location of airflow separation and vortex formation), the spatial angle of the A-pillar relative to the XYZ axis (which affects the degree of airflow adhesion), and the dimensions of the rearview mirror in the XYZ direction (which affects the intensity of the wake turbulence). Additionally, features such as the angle between the inner side of the rearview mirror and the side window glass, the front windshield angle, the distance between the rearview mirror and the vehicle body, and the side window tilt angle were selected to further characterize the degree of airflow disturbance. These design parameters were chosen due to their direct influence on turbulent flow structures and pressure fluctuations, making them important sources of low-frequency, mid-frequency, and high-frequency noise at the driver’s seat position. The output was defined as the 1/3 octave noise level at the right ear of the driver’s seat. Data collection was based on wind tunnel tests conducted at a wind speed of 120 km/h, including complete spectral characteristics and sound pressure level information, which can comprehensively characterize the aerodynamic noise characteristics. The dataset was constructed by combining the three-dimensional scanning measurements of the design features with the corresponding acoustic test results. During the modeling process, the Xception neural network model was introduced, and the model parameters were optimized using the whale optimization algorithm (WOA) to minimize prediction errors and improve model performance.
Figure 9 illustrates the basic structure of the prediction model. In terms of network architecture selection, WOA-Xception was used for the modeling process, with the learning rate and batch size determined as key hyperparameters. To enhance model training stability and prediction accuracy, the whale optimization algorithm was employed to search for the optimal hyperparameter combination. Specifically, the search range for the learning rate was set to 0.001 and 0.01, and the batch size was set to 32 and 128. The main parameter settings for the Xception network and the WOA algorithm are shown in Table 2, which clearly defines the key steps and parameter ranges involved in the optimization process.
The dataset used in this study was derived from the experimental data described in Section 3 and the experimental data provided by the database of an automobile group Co., Ltd., totaling 200 samples. To improve training accuracy, all the input data were normalized to the range of 0 to 1 before modeling to eliminate the impact of scale differences between different features on the stability of model training [56]. The sample data were divided into training and test sets in proportion, accounting for 80% and 20% of the total samples, corresponding to 160 training samples and 40 test samples. Each sample included 16 shape feature inputs and their corresponding right ear noise response outputs from the main driver. During model training, the whale optimization algorithm continuously optimizes model parameters by simulating the humpback whale’s behavior of surrounding prey, bubble-net hunting, and searching, ultimately obtaining the optimal parameter combination: learning rate of 0.008 and batch size of 50.
To enable comparative analysis and quantify prediction accuracy, the mean absolute percentage error (MAPE) and the root mean square error (RMSE) were selected as the primary evaluation metrics. All the modeling and simulation work was conducted on the Pycharm 2024.1 platform, with a hardware configuration of an Intel® Core™ i7-14700KF processor and 32 GB of memory.

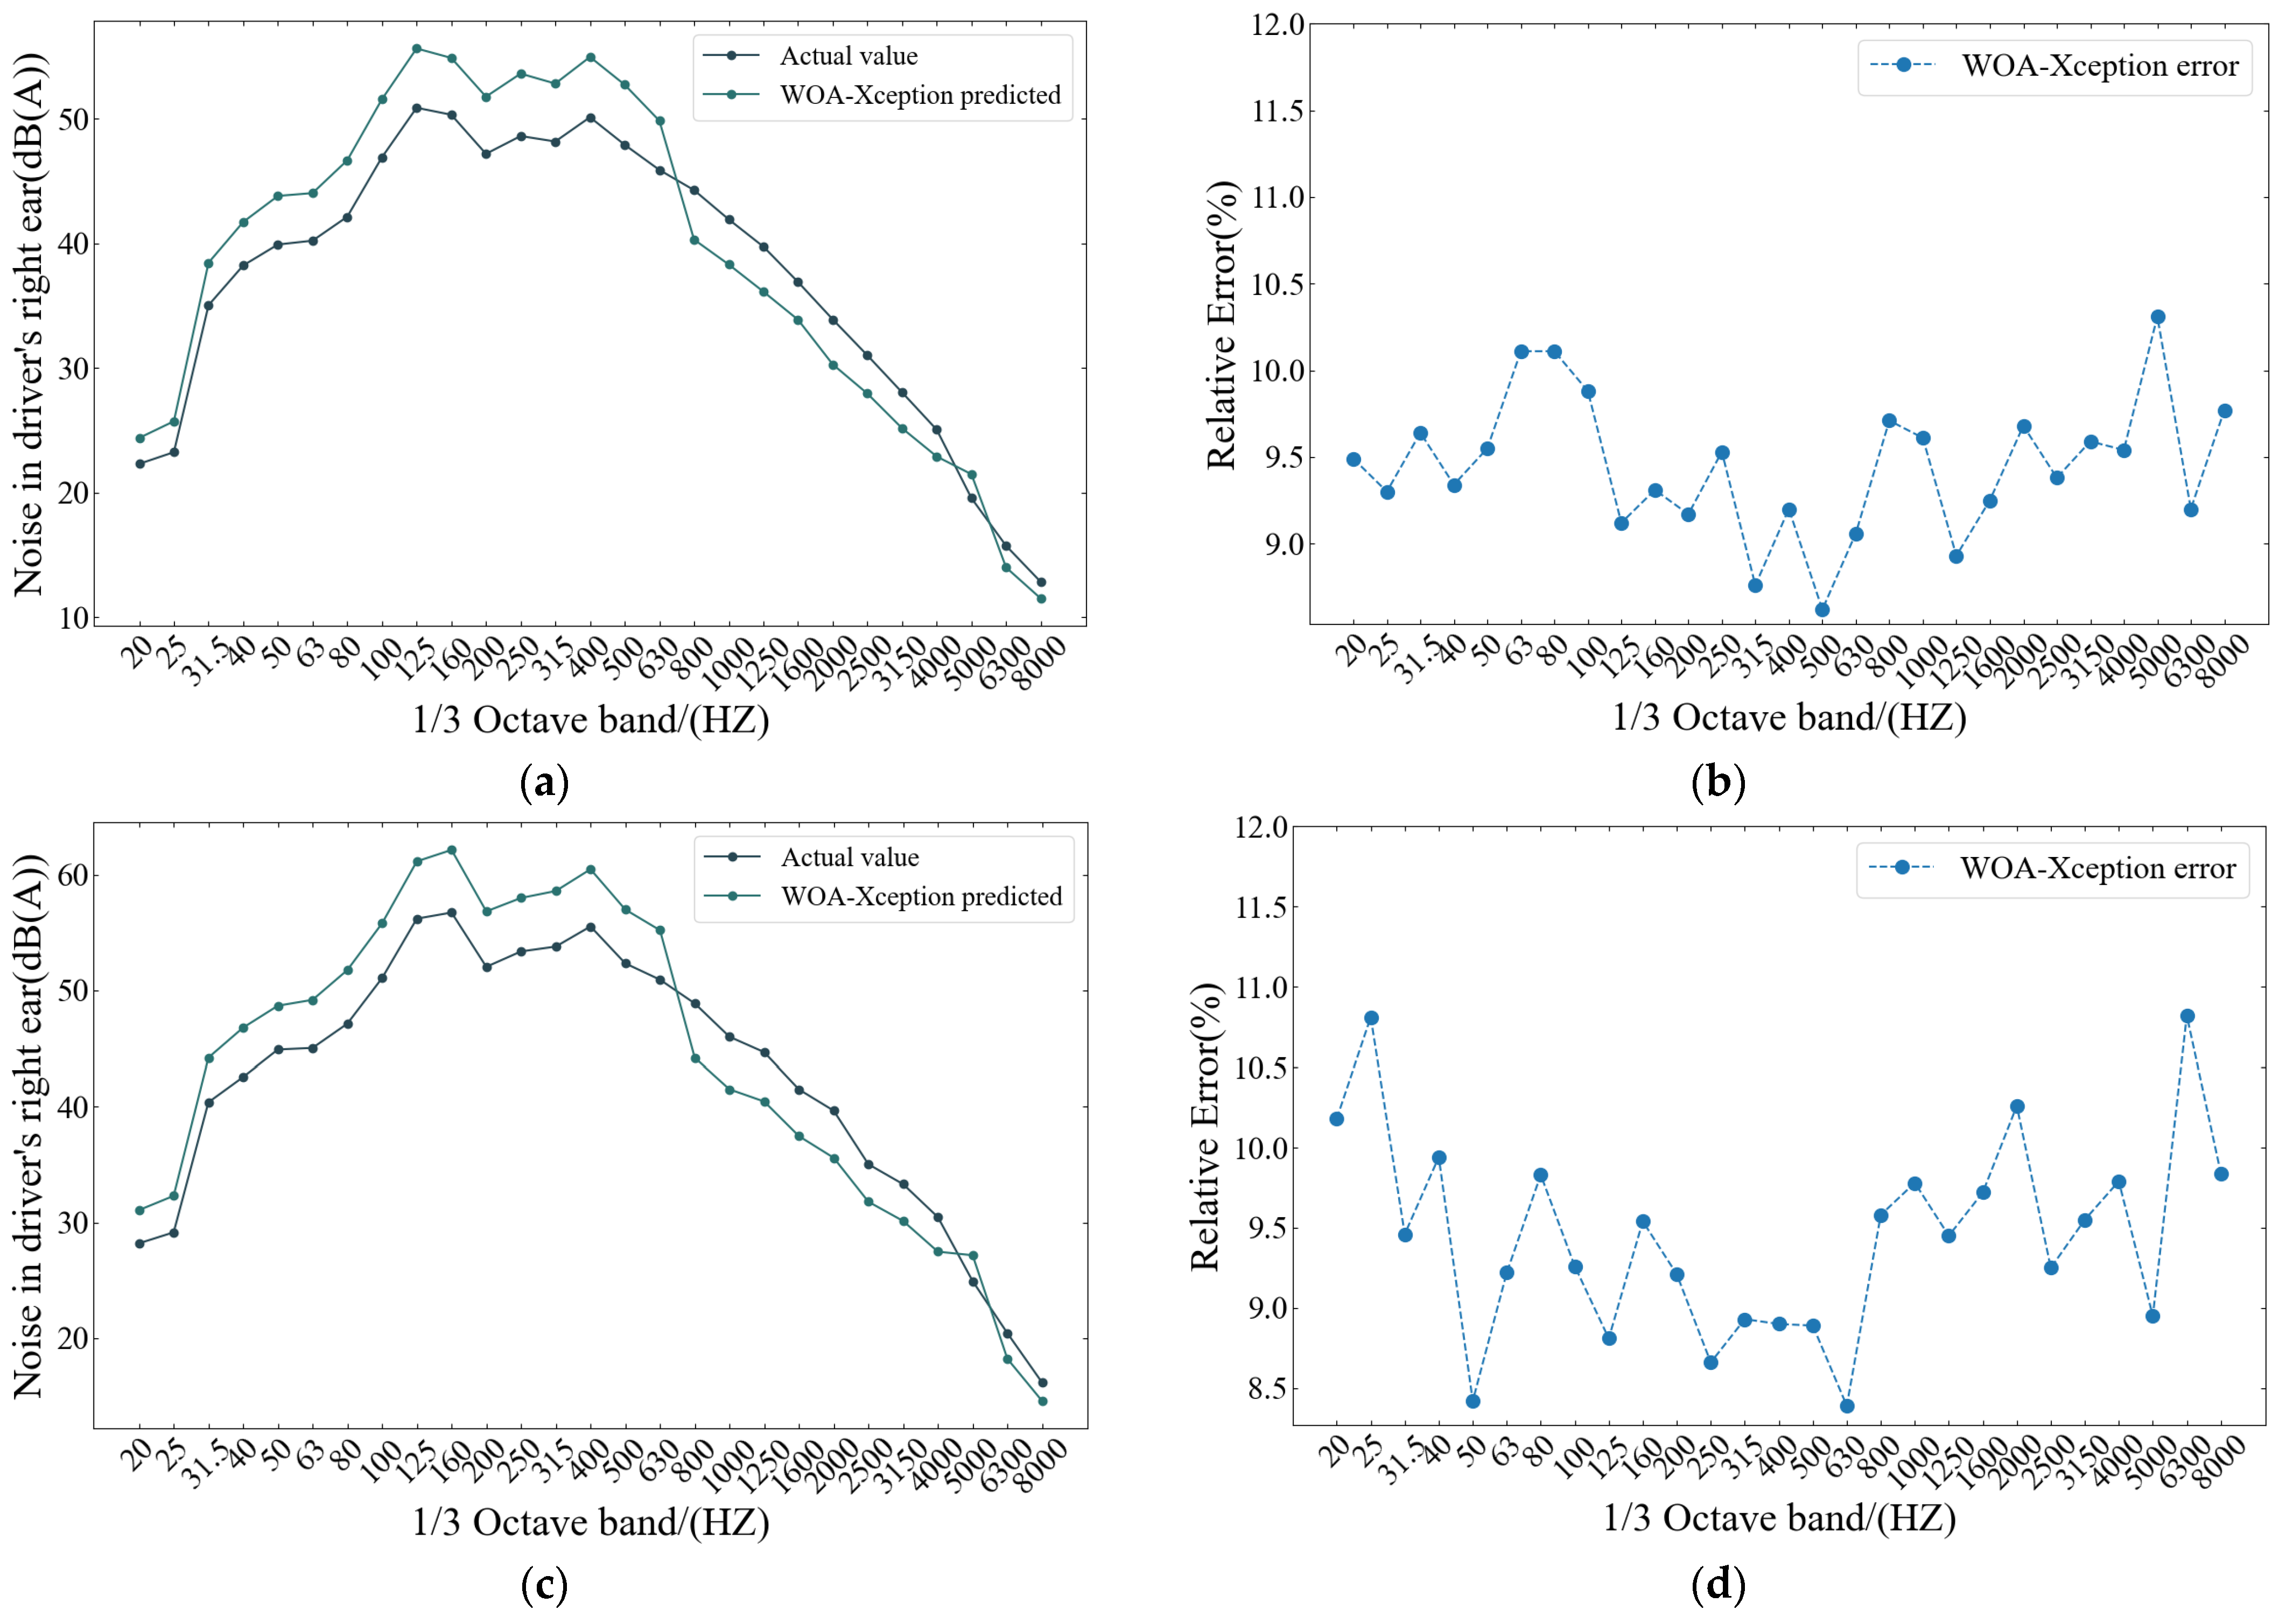
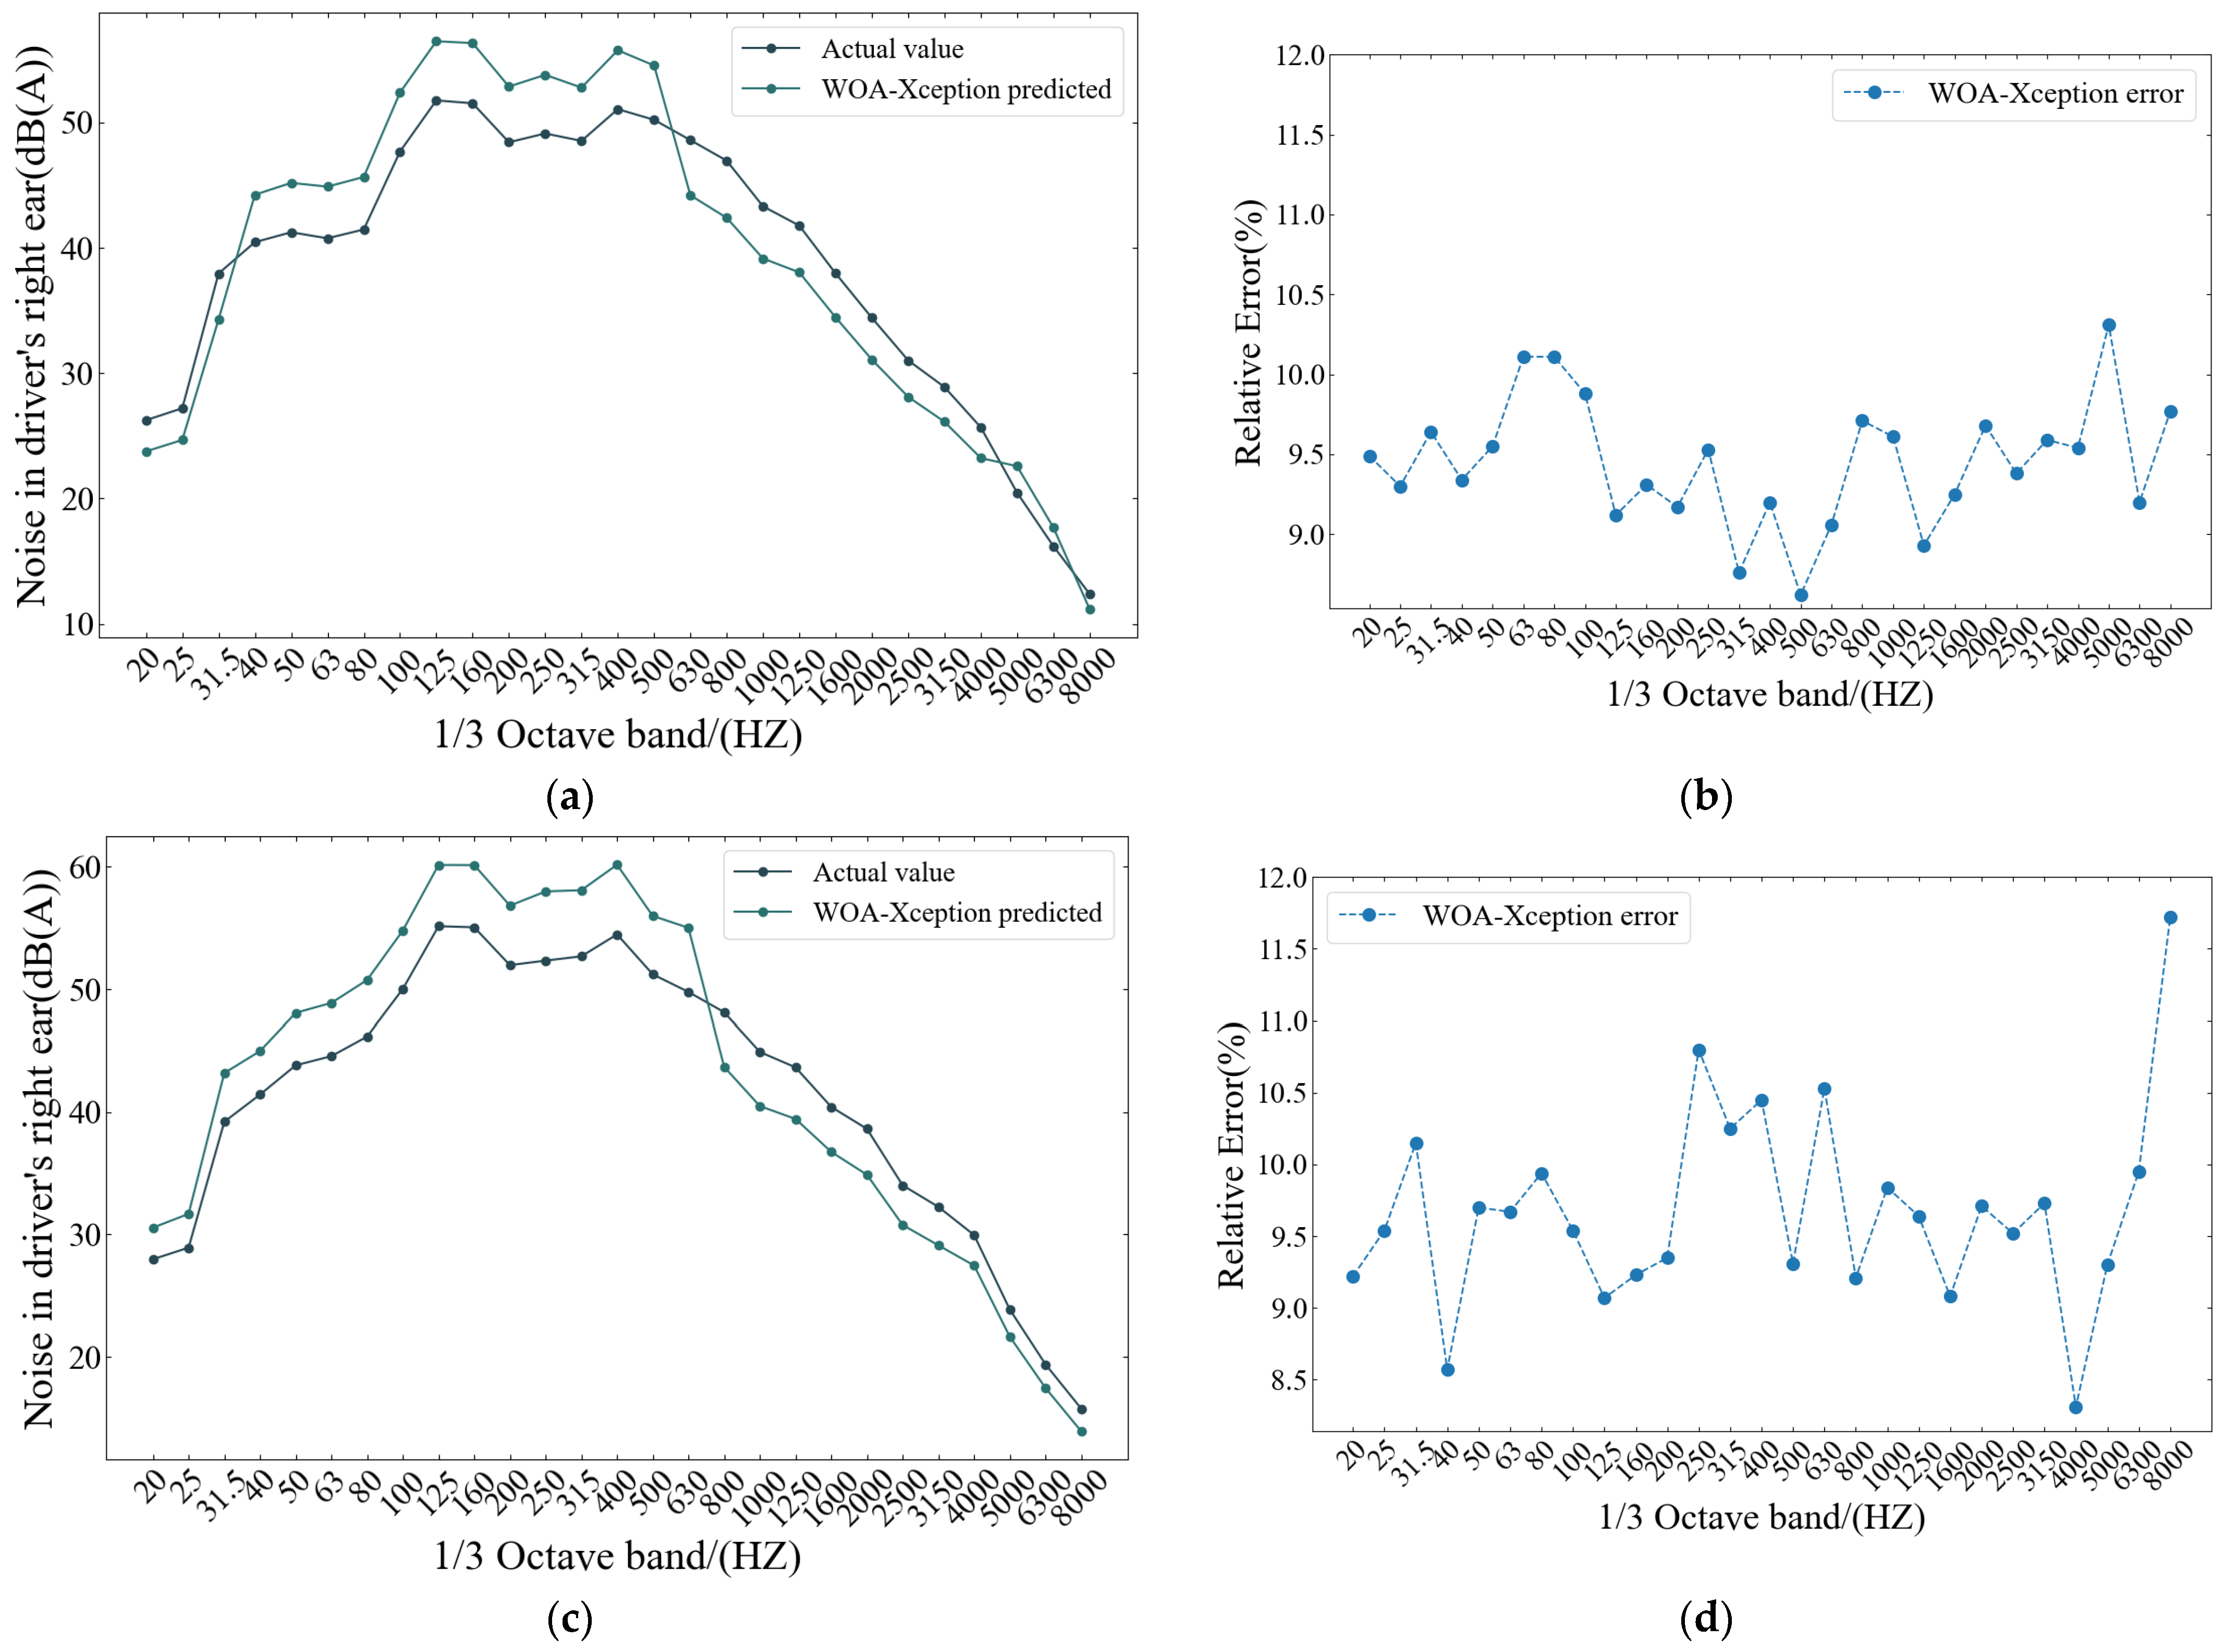
4.2. Prediction Analysis of WOA-Xception Model

After optimizing the hyperparameters of the Xception model using WOA, this paper predicts the noise at the right ear position of the driver in a passenger car. The effectiveness of the model is verified using test data, and Figure 10 shows the comparison between the predicted values and actual values for representative samples of sedans and SUVs.
As shown in Figure 10, the noise variation trends predicted by the WOA-Xception model are consistent with the measured data, indicating high prediction accuracy. To further quantify the model’s prediction performance, the mean absolute percentage error (MAPE) and the root mean square error (RMSE) between the predicted and actual values were calculated. The results on the test set show that the MAPE of the WOA-Xception model for sedans was 9.66% and the RMSE was 3.73, while the MAPE for SUVs was 9.46% and the RMSE was 4.06. This indicates that the model can not only effectively characterize the complex nonlinear relationship between vehicle exterior features and interior noise but also possesses strong generalization ability and stability.

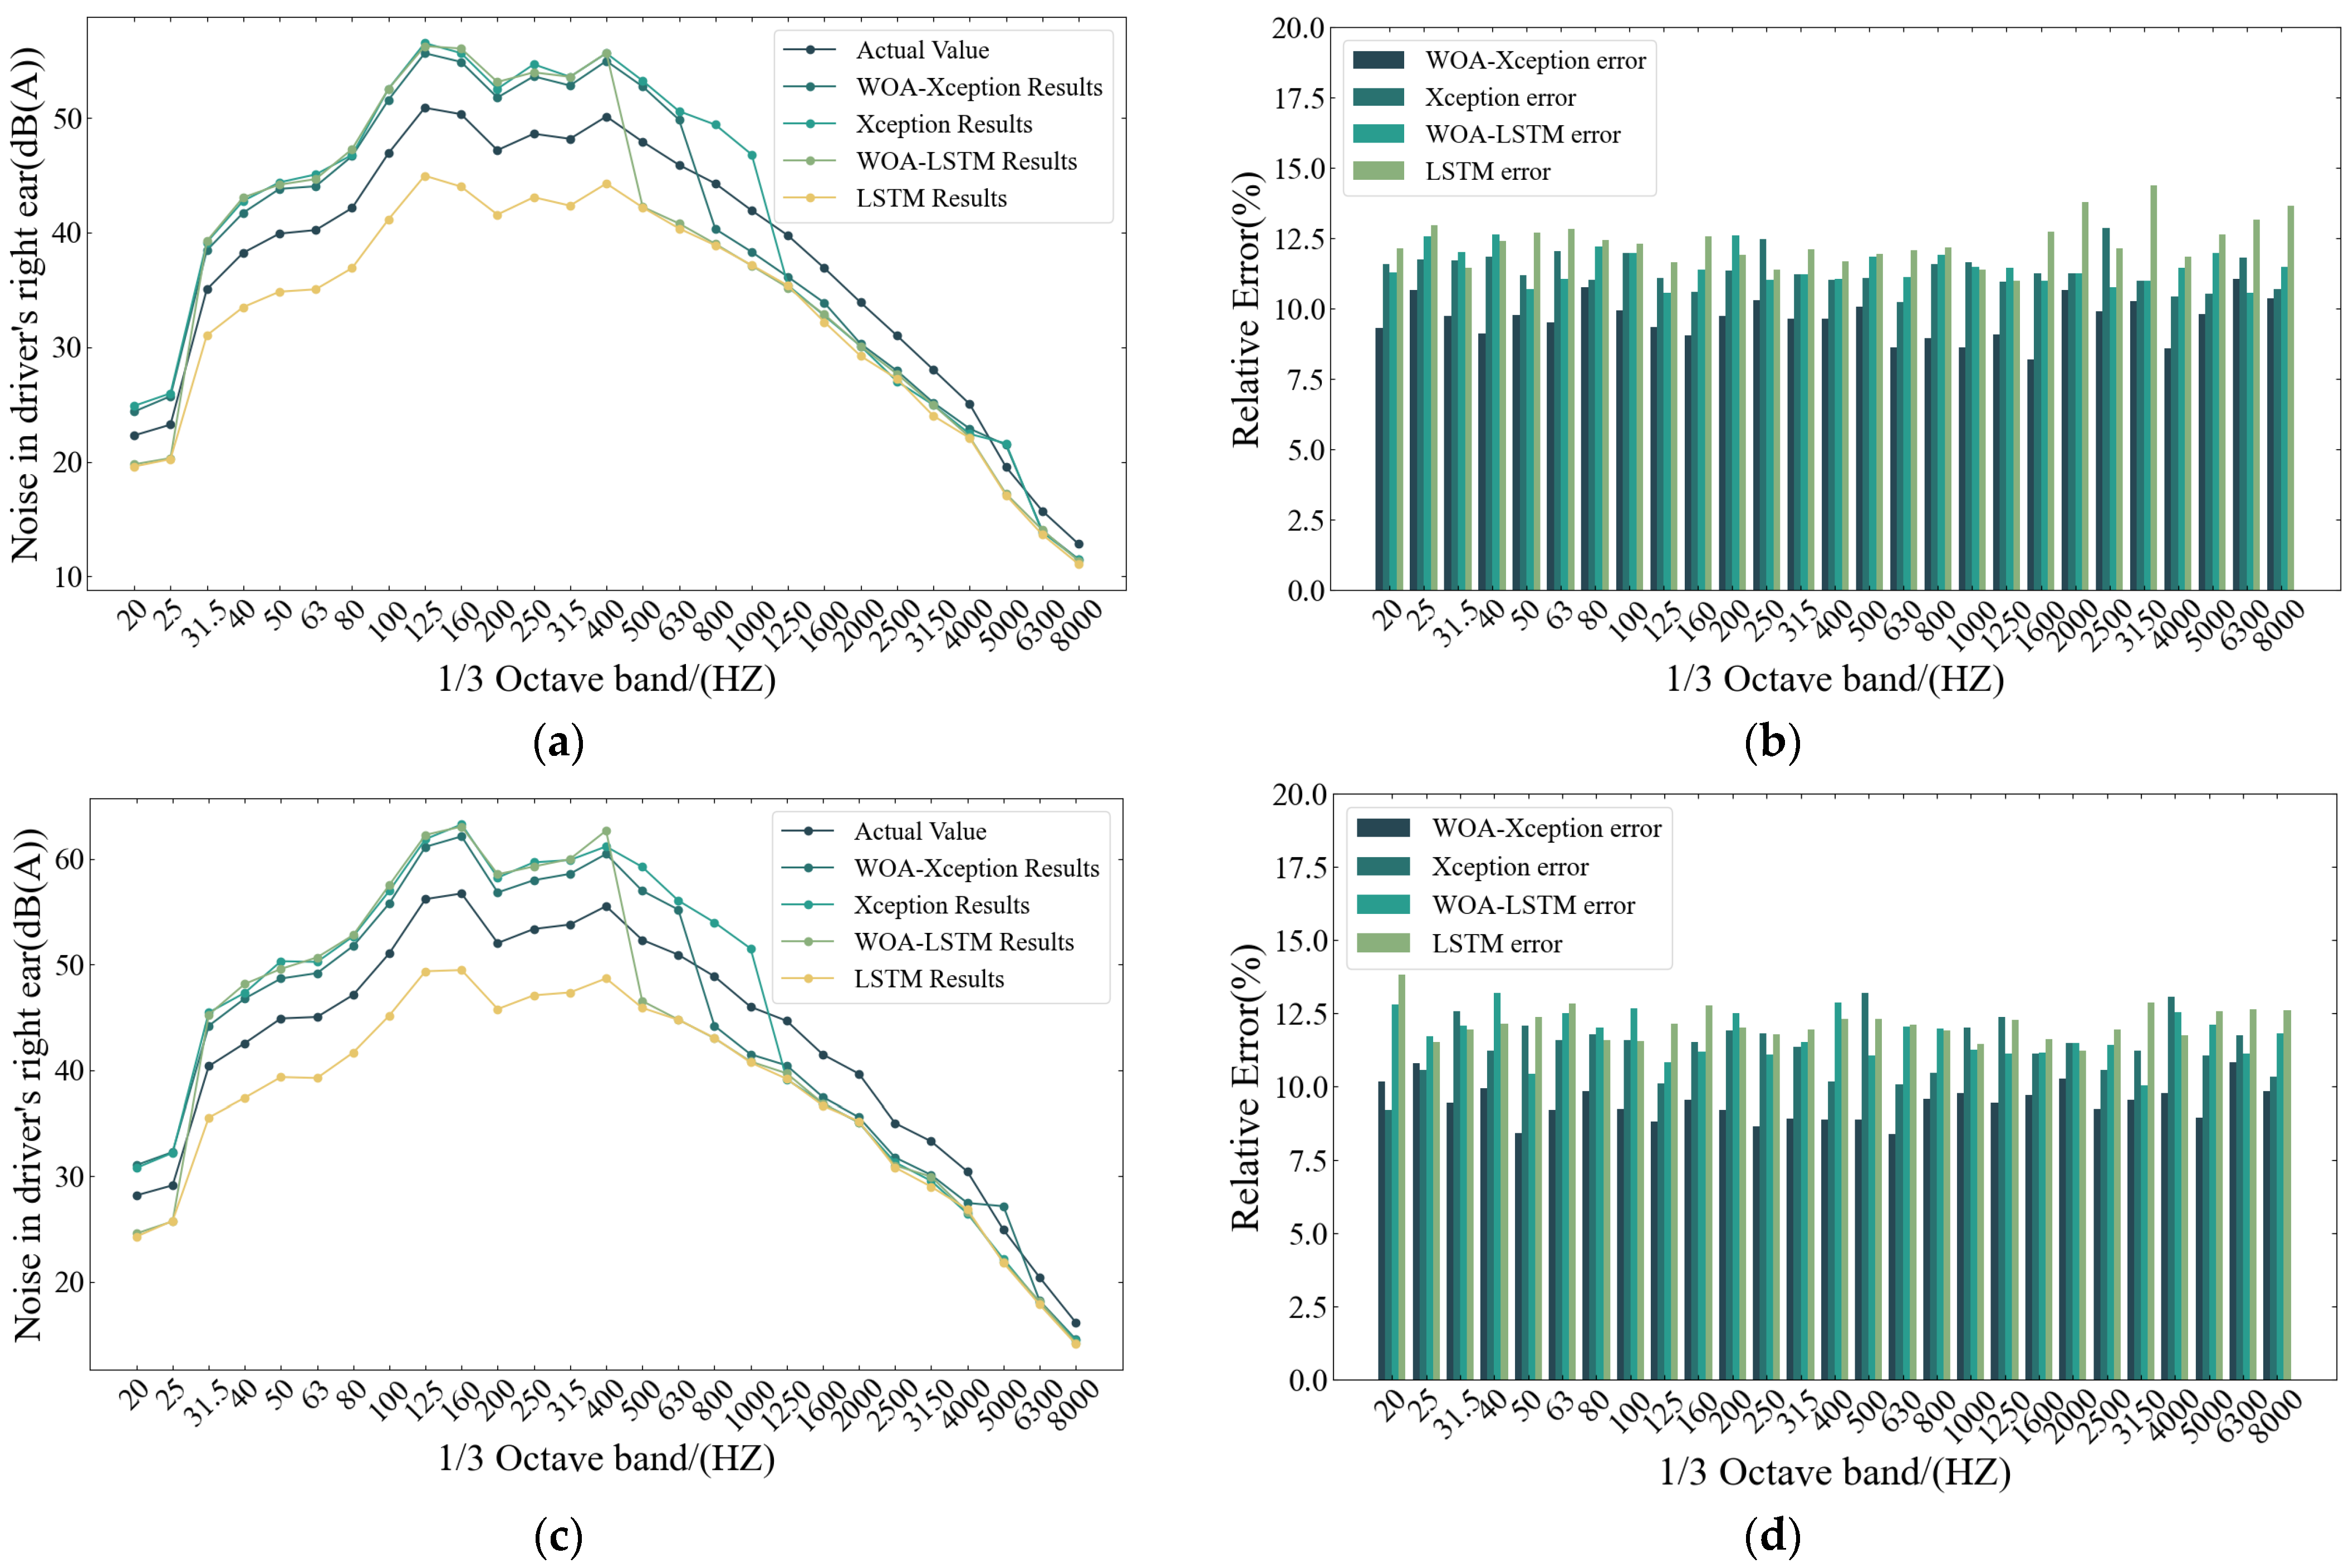
4.3. Compare Other Models

To further validate the effectiveness of the WOA-Xception model in predicting the noise level of the driver’s seat in passenger vehicles, this paper compares the traditional Xception model, the WOA-LSTM model, and the LSTM model. To ensure fairness in the comparison, all the models were trained using the same test dataset. In terms of model parameter optimization, the learning rate and batch size of the Xception model were optimized using grid search; the number of neurons and hidden layer nodes in the WOA-LSTM model were optimized using the WOA algorithm; and the parameters of the LSTM model were configured using grid search. The prediction performance of the four models on the test dataset is shown in Figure 11. Additionally, to further analyze the prediction accuracy of each model, the MAPE and RMSE metrics were calculated on the test set.
The results indicate that the WOA-Xception model achieves higher prediction accuracy on the test set than the other three models, particularly in terms of the MAPE and RMSE metrics. Compared with the unoptimized Xception model, the WOA-Xception model reduces the MAPE and RMSE by 1.56 percentage points and 0.69, 1.88 percentage points and 0.93, respectively, for sedans and SUVs. This result demonstrates that, during the parameter optimization process, the WOA demonstrates stronger global search capabilities and optimization efficiency than traditional grid search, thereby enhancing the accuracy of the Xception model in predicting interior noise in passenger vehicles. Additionally, when compared with the WOA-LSTM and traditional LSTM models, the WOA-Xception model exhibits superior prediction accuracy, with the lowest MAPE and RMSE values, further validating the advantages of integrating the WOA optimization mechanism with the Xception architecture.
To further validate the stability and reliability of the WOA-Xception model in practical applications, after establishing the model, an independent validation set was constructed under the same test conditions for additional experiments. Figure 12 shows the comparison between the prediction results of the WOA-Xception model and the actual values in the validation set. The results show that the MAPE of the model on the sedan and SUV validation sets was 9.45% and 9.68%, respectively, and the RMSE was 3.77 and 4.15, respectively.
The validation results further indicate that the WOA-Xception model not only has good generalization ability but also maintains high prediction accuracy when faced with new sample data, demonstrating its potential for practical application in real-world engineering scenarios.

5. Conclusions

This paper addresses the issue of wind noise in the driver’s compartment of passenger vehicles and proposes an efficient noise prediction method. By extracting the overall vehicle design features and combining them with noise data collected from the driver’s seat in wind tunnel tests, a prediction model was constructed with design features as the input and interior noise levels as the output. Based on this, we further propose and establish a WOA-Xception prediction model optimized using the whale optimization algorithm (WOA) to effectively model the complex nonlinear relationship between vehicle design features and interior noise at the driver’s seat, thereby significantly improving prediction accuracy. The experimental results indicate that there is a significant correlation between the noise level at the driver’s seat of passenger cars and the cars’ external design features. The predicted results of the proposed WOA-Xception model are consistent with the actual measured values in the test samples, verifying the effectiveness of this method. Comparative analysis with traditional Xception models, WOA-LSTM models, and LSTM models revealed that the WOA-Xception model achieved average absolute percentage error (MAPE) and root mean square error (RMSE) of 9.78% and 3.73, and 9.46% and 4.06, respectively, on sedan and SUV test sets, significantly outperforming other comparison models. The prediction results on the independent validation set also demonstrated good generalization ability and stability (MAPE of 9.45% and 9.68%, RMSE of 3.77 and 4.15), further proving the reliability of the model in practical applications.

Author Contributions

Writing—original draft: Y.M. and H.Y.; writing—review and editing, methodology: J.W. and Y.W.; funding acquisition: Y.D.; experiments and records: L.M.; validation, conception: Y.P. All authors have read and agreed to the published version of the manuscript.

Funding

This work was supported by the Major Science and Technology Project of Jilin Province and Changchun City (Grant No. 20240301010ZD).

Data Availability Statement

The authors do not have permission to share data.

Acknowledgments

The authors would like to acknowledge the support from the Institute of Energy and Power Research for the experimental research.

Conflicts of Interest

The authors declare that they have no known competing financial interests or personal relationships that could have appeared to influence the work reported in this paper.

Abbreviations

The following abbreviations are used in this manuscript:
NVHNoise, Vibration, and Harshness
WOAWhale Optimization Algorithm
MAPEMean Absolute Percentage Error
RMSERoot Mean Square Error
LSTMLong Short-Term Memory

References

  1. Huang, H.B.; Huang, X.R.; Li, R.X.; Lim, T.C.; Ding, W.P. Sound quality prediction of vehicle interior noise using deep belief networks. Appl. Acoust. 2016, 113, 149–161. [Google Scholar] [CrossRef]
  2. Zhu, H.; Zhao, J.; Wang, Y.; Ding, W.; Pang, J.; Huang, H. Improving of pure electric vehicle sound and vibration comfort using a multi-task learning with task-dependent weighting method. Measurement 2024, 233, 114752. [Google Scholar] [CrossRef]
  3. Qatu, M.S. Recent research on vehicle noise and vibration. Int. J. Veh. Noise Vib. 2012, 8, 289–301. [Google Scholar] [CrossRef]
  4. Huang, H.; Lim, T.C.; Wu, J.; Ding, W.; Pang, J. Multitarget prediction and optimization of pure electric vehicle tire/road airborne noise sound quality based on a knowledge-and data-driven method. Mech. Syst. Signal Process. 2023, 197, 110361. [Google Scholar] [CrossRef]
  5. Genuit, K. The sound quality of vehicle interior noise: A challenge for the NVH-engineers. Int. J. Veh. Noise Vib. 2004, 1, 158–168. [Google Scholar] [CrossRef]
  6. Wang, Y.S.; Guo, H.; Yuan, T.; Ma, L.F.; Wang, C. Electromagnetic noise analysis and optimization for permanent magnet synchronous motor used on electric vehicles. Eng. Comput. 2021, 38, 699–719. [Google Scholar] [CrossRef]
  7. Yang, M.; Dai, P.; Yin, Y.; Wang, D.; Wang, Y.; Huang, H. Predicting and optimizing pure electric vehicle road noise via a locality-sensitive hashing transformer and interval analysis. ISA Trans. 2025, 157, 556–572. [Google Scholar] [CrossRef]
  8. Callister, J.R.; George, A.R. Measurement and Analysis of Automobile Wind Noise (No. 930299); SAE Technical Paper; SAE International: Warrendale, PA, USA, 1993. [Google Scholar] [CrossRef]
  9. Lighthill, M.J. On sound generated aerodynamically I. General theory. Proc. R. Soc. Lond. Ser. A Math. Phys. Sci. 1952, 211, 564–587. [Google Scholar] [CrossRef]
  10. George, A.R. Automobile aerodynamic noise. In Proceedings of the International Congress & Exposition, Detroit, MI, USA, 26 February–2 March 1990; pp. 434–457. [Google Scholar]
  11. Masri, J.; Amer, M.; Salman, S.; Ismail, M.; Elsisi, M. A survey of modern vehicle noise, vibration, and harshness: A state-of-the-art. Ain Shams Eng. J. 2024, 15, 102957. [Google Scholar] [CrossRef]
  12. Huang, H.; Huang, X.; Ding, W.; Yang, M.; Fan, D.; Pang, J. Uncertainty optimization of pure electric vehicle interior tire/road noise comfort based on data-driven. Mech. Syst. Signal Process. 2022, 165, 108300. [Google Scholar] [CrossRef]
  13. Fan, D.; Dai, P.; Yang, M.; Jia, W.; Jia, X.; Huang, H. Research on maglev vibration isolation technology for vehicle road noise control. SAE Int. J. Veh. Dyn. Stab. NVH 2022, 6, 233–245. [Google Scholar] [CrossRef]
  14. Nieuwenhuijsen, M.J.; Ristovska, G.; Dadvand, P. WHO environmental noise guidelines for the European Region: A systematic review on environmental noise and adverse birth outcomes. Int. J. Environ. Res. Public Health 2017, 14, 1252. [Google Scholar] [CrossRef] [PubMed]
  15. Huang, H.; Huang, X.; Ding, W.; Yang, M.; Yu, X.; Pang, J. Vehicle vibro-acoustical comfort optimization using a multi-objective interval analysis method. Expert Syst. Appl. 2023, 213, 119001. [Google Scholar] [CrossRef]
  16. Sohrabi, S.; Khreis, H. Burden of disease from transportation noise and motor vehicle crashes: Analysis of data from Houston, Texas. Environ. Int. 2020, 136, 105520. [Google Scholar] [CrossRef]
  17. T/CSAE113-2019; Test Method for Interior Wind Noise Measurement in Full-Vehicle Aeroacoustic Wind Tunnel Testing. China Society of Automotive Engineers: Beijing, China, 2019.
  18. Mukkera, S.; Premkumar, S.R.; Samar, D. A Test Methodology for Vehicle Wind Noise Reduction and Acoustic Quality Improvement (No. 2019-26-0216); SAE Technical Paper; SAE: Warrendale, PA, USA, 2019. [Google Scholar] [CrossRef]
  19. James, T.; Krueger, L.; Lentzen, M.; Woodiga, S.; Chalupa, K.; Hupertz, B.; Lewington, N. Development and initial testing of a full-scale DrivAer generic realistic wind tunnel correlation and calibration model. SAE Int. J. Passeng. Cars-Mech. Syst. 2018, 11, 353–367. [Google Scholar] [CrossRef]
  20. Roditcheva, O.; Lofdahl, L.C.; Sebben, S.; Harling cEng, P.; Bernhardsson, H. On the Possibilities and Limitations of Wind Noise Testing in the Aerodynamical Wind Tunnel at Volvo Cars (No. 2016-01-1807); SAE Technical Paper; SAE: Warrendale, PA, USA, 2016. [Google Scholar] [CrossRef]
  21. Chen, K.H.; Johnson, J.; Dietschi, U.; Khalighi, B. Wind noise measurements for automotive mirrors. SAE Int. J. Passeng. Cars-Mech. Syst. 2009, 2, 419–433. [Google Scholar] [CrossRef]
  22. Rovedatti, V.; Milhorn, J.; DeJong, R.; Ebbitt, G. Vehicle wind noise measurements in a wind tunnel with a contoured top profile. SAE Int. J. Passeng. Cars-Mech. Syst. 2016, 9, 234–237. [Google Scholar] [CrossRef]
  23. Becker, S.; Nusser, K.; Oswald, M. Aero-Vibro-Acoustic Wind Noise-Simulation Based on the Flow Around a Car (No. 2016-01-1804); SAE Technical Paper; SAE: Warrendale, PA, USA, 2016. [Google Scholar] [CrossRef]
  24. Tajima, A.; Ikeda, J.; Nakasato, K.; Kamiwaki, T.; Wakamatsu, J.; Oshima, M.; Li, C.; Tsubokura, M. Numerical Simulation of Fluctuating Wind Noise of a Vehicle in Reproduced on-Road Wind Condition (No. 2024-01-2353); SAE Technical Paper; SAE: Warrendale, PA, USA, 2024. [Google Scholar] [CrossRef]
  25. Mukkera, S.; Pandey, A.; Krishna, K.A.; Patil, S.; Prasad, P.L.N. Prediction of Mirror Induced Wind Noise Using CFD-FEM Approach (No. 2017-26-0221); SAE Technical Paper; SAE: Warrendale, PA, USA, 2017. [Google Scholar] [CrossRef]
  26. Blanchet, D.; Golota, A.; Zerbib, N.; Mebarek, L. Wind Noise Source Characterization and How It Can Be Used to Predict Vehicle Interior Noise (No. 2014-01-2052); SAE Technical Paper; SAE: Warrendale, PA, USA, 2014. [Google Scholar] [CrossRef]
  27. Moron, P.; Wu, L.; Powell, R.; Senthooran, S. Numerical simulation of on-road wind conditions for interior wind noise of passenger vehicles. In INTER-NOISE and NOISE-CON Congress and Conference Proceedings; Institute of Noise Control Engineering: Tokyo, Japan, 2023; Volume 266, pp. 867–874. [Google Scholar] [CrossRef]
  28. Powell, R.; Moron, P.; Balasubramanian, G.; Neuhierl, B.; Senthooran, S.; Crouse, B.; Freed, D.; Kain, C.; Ullrich, F. Simulation of underbody contribution of wind noise in a passenger automobile. SAE Int. J. Passeng. Cars-Mech. Syst. 2013, 6, 1251–1261. [Google Scholar] [CrossRef]
  29. Liu, Y.; Ding, W.; Yang, M.; Zhu, H.; Liu, L.; Jin, T. Distributed Drive Autonomous Vehicle Trajectory Tracking Control Based on Multi-Agent Deep Reinforcement Learning. Mathematics 2024, 12, 1614. [Google Scholar] [CrossRef]
  30. Huang, H.; Wu, J.; Lim, T.C.; Yang, M.; Ding, W. Pure electric vehicle nonstationary interior sound quality prediction based on deep CNNs with an adaptable learning rate tree. Mech. Syst. Signal Process. 2021, 148, 107170. [Google Scholar] [CrossRef]
  31. Dai, R.; Zhao, J.; Zhao, W.; Ding, W.; Huang, H. Exploratory study on sound quality evaluation and prediction for engineering machinery cabins. Measurement 2025, 253, 117684. [Google Scholar] [CrossRef]
  32. Wu, Y.; Liu, X.; Huang, H.; Wu, Y.; Ding, W.; Yang, M. Multi-objective prediction and optimization of vehicle acoustic package based on ResNet neural network. Sound Vib. 2023, 57, 73–95. [Google Scholar] [CrossRef]
  33. Huang, L.; Wang, D.; Cao, X.; Zhang, X.; Huang, B.; He, Y.; Grabner, G. Deep learning-based wind noise prediction study for automotive clay model. Meas. Sci. Technol. 2024, 35, 045302. [Google Scholar] [CrossRef]
  34. Yang, H.; Yuan, W.; Zhu, W.; Sun, Z.; Zhang, Y.; Zhou, Y. Wind turbine airfoil noise prediction using dedicated airfoil database and deep learning technology. Appl. Energy 2024, 364, 123165. [Google Scholar] [CrossRef]
  35. Huang, H.; Wang, Y.; Wu, J.; Ding, W.; Pang, J. Prediction and optimization of pure electric vehicle tire/road structure-borne noise based on knowledge graph and multi-task ResNet. Expert Syst. Appl. 2024, 255, 124536. [Google Scholar] [CrossRef]
  36. Kužnar, D.; Možina, M.; Giordanino, M.; Bratko, I. Improving vehicle aeroacoustics using machine learning. Eng. Appl. Artif. Intell. 2012, 25, 1053–1061. [Google Scholar] [CrossRef]
  37. Zhao, J.; Yin, Y.; Chen, J.; Zhao, W.; Ding, W.; Huang, H. Evaluation and prediction of vibration comfort in engineering machinery cabs using random forest with genetic algorithm. SAE Int. J. Veh. Dyn. Stab. NVH 2024, 8, 491. [Google Scholar] [CrossRef]
  38. Musser, C.; Calloni, M.; Golota, A.; Zerbib, N. Aero-Vibro-Acoustic Simulation Methodologies for Vehicle Wind Noise Reduction (No. 2019-26-0202); SAE Technical Paper; SAE: Warrendale, PA, USA, 2019. [Google Scholar] [CrossRef]
  39. Huang, X.; Huang, H.; Wu, J.; Yang, M.; Ding, W. Sound quality prediction and improving of vehicle interior noise based on deep convolutional neural networks. Expert Syst. Appl. 2020, 160, 113657. [Google Scholar] [CrossRef]
  40. Chollet, F. Xception: Deep learning with depthwise separable convolutions. In Proceedings of the IEEE Conference on Computer Vision and Pattern Recognition, Honolulu, HI, USA, 21–26 July 2017; pp. 1251–1258. [Google Scholar]
  41. Kaiser, L.; Gomez, A.N.; Chollet, F. Depthwise separable convolutions for neural machine translation. arXiv 2017, arXiv:1706.03059. [Google Scholar] [CrossRef]
  42. Gülmez, B. A novel deep neural network model based Xception and genetic algorithm for detection of COVID-19 from X-ray images. Ann. Oper. Res. 2023, 328, 617–641. [Google Scholar] [CrossRef]
  43. Jang, J.G.; Quan, C.; Lee, H.D.; Kang, U. Falcon: Lightweight and accurate convolution based on depthwise separable convolution. Knowl. Inf. Syst. 2023, 65, 2225–2249. [Google Scholar] [CrossRef]
  44. Sathya, R.; Mahesh, T.R.; Bhatia Khan, S.; Malibari, A.A.; Asiri, F.; Rehman, A.U.; Al Malwi, W. Employing Xception convolutional neural network through high-precision MRI analysis for brain tumor diagnosis. Front. Med. 2024, 11, 1487713. [Google Scholar] [CrossRef]
  45. Mirjalili, S.; Lewis, A. The whale optimization algorithm. Adv. Eng. Softw. 2016, 95, 51–67. [Google Scholar] [CrossRef]
  46. Yang, W.; Xia, K.; Fan, S.; Wang, L.; Li, T.; Zhang, J.; Feng, Y. A multi-strategy whale optimization algorithm and its application. Eng. Appl. Artif. Intell. 2022, 108, 104558. [Google Scholar] [CrossRef]
  47. Sharawi, M.; Zawbaa, H.M.; Emary, E. Feature selection approach based on whale optimization algorithm. In Proceedings of the 2017 Ninth International Conference on Advanced Computational Intelligence (ICACI), Doha, Qatar, 4–6 February 2017; IEEE: Piscataway, NJ, USA, 2017; pp. 163–168. [Google Scholar] [CrossRef]
  48. Duell, E.G.; Kharazi, A.; Muller, S.; Ebeling, W.; Mercker, E. The BMW AVZ Wind Tunnel Center (No. 2010-01-0118); SAE Technical Paper; SAE: Warrendale, PA, USA, 2010. [Google Scholar] [CrossRef]
  49. Ghani, S.A.; Aroussi, A.; Rice, E. Simulation of road vehicle natural environment in a climatic wind tunnel. Simul. Pract. Theory 2001, 8, 359–375. [Google Scholar] [CrossRef]
  50. Duell, E.; Yen, J.; Arnette, S.; Walter, J. Recent advances in large scale aeroacoustic wind tunnels. In Proceedings of the 8th AIAA/CEAS Aeroacoustics Conference & Exhibit, Breckinridge, CO, USA, 17–19 June 2002; p. 2503. [Google Scholar] [CrossRef]
  51. Fago, B.; Lindner, H.; Mahrenholtz, O. The effect of ground simulation on the flow around vehicles in wind tunnel testing. J. Wind Eng. Ind. Aerodyn. 1991, 38, 47–57. [Google Scholar] [CrossRef]
  52. Fu, C.; Uddin, M.; Zhang, C. Computational analyses of the effects of wind tunnel ground simulation and blockage ratio on the aerodynamic prediction of flow over a passenger vehicle. Vehicles 2020, 2, 318–341. [Google Scholar] [CrossRef]
  53. Yang, C.; Xu, L.; Wang, Q.Y. Test and evaluation method for low wind noise level of automobiles. Qual. Certif. 2025, 2, 39–41. [Google Scholar] [CrossRef]
  54. ISO 532-1:2017; Acoustics—Methods for Calculating Loudness—Part 1: Zwicker Method. ISO: Geneva, Switzerland, 2017.
  55. Blanchet, D.; Golota, A. Combining Modeling Methods to Accurately Predict Wind Noise Contribution (No. 2015-01-2326); SAE Technical Paper; SAE: Warrendale, PA, USA, 2015. [Google Scholar] [CrossRef]
  56. Patro, S.G.K.; Sahu, K.K. Normalization: A preprocessing stage. arXiv 2015, arXiv:1503.06462. [Google Scholar] [CrossRef]
Figure 1. Research process for the right ear noise of the main driver in the car.
Machines 13 00497 g001
Figure 2. Depth-separable convolution operation.
Machines 13 00497 g002
Figure 3. Depth-wise separable convolution.
Machines 13 00497 g003
Figure 4. Xception network structure.
Machines 13 00497 g004
Figure 5. The overall process of WOA-Xception.
Machines 13 00497 g005
Figure 6. Planar diagram of aeroacoustic wind tunnel.
Machines 13 00497 g006
Figure 7. Schematic diagram of noise test for the right ear of the driver’s seat inside the vehicle.
Machines 13 00497 g007
Figure 8. The frequency characteristic curve of the 1/3 octave of the right ear of the main driver in the car.
Machines 13 00497 g008
Figure 9. Basic structure of the noise prediction model for the right ear of the driver in the vehicle.
Machines 13 00497 g009
Figure 10. Prediction results and errors of WOA-Xception model sedan and SUV test set. (a) Sedan test set prediction results comparison. (b) Sedan test set prediction error. (c) SUV test set prediction results comparison. (d) SUV test set prediction error.
Machines 13 00497 g010
Figure 11. Comparison of prediction results and errors of four prediction models for sedan and SUV test sets. (a) Prediction results for the four model sedan test sets. (b) Prediction error of four models on the sedan test set. (c) Prediction results for the four model SUV test sets. (d) Prediction error of four models on the SUV test set.
Machines 13 00497 g011
Figure 12. WOA-Xception Model Validation Set Prediction Results and Errors. (a) Comparison of sedan validation set prediction results. (b) Prediction error of sedan validation set. (c) Comparison of SUV validation set prediction results. (d) SUV validation set prediction error.
Machines 13 00497 g012
Table 1. Parameter setting of vehicle wind tunnel test.
Vehicle ModelWind Velocity (km/h)Sampling Frequency (HZ)Sampling Time (s)Yaw Angle (°)
SUV12048k150
Sedan12048k150
Table 2. WOA-Xception parameter table.
Algorithm TypeParameter TypeNumerical
XceptionInput dimension1
Maximum number of iterations500
Number of Xception layers3
Learning rate optimization range[0.001, 0.01]
Batch size optimization range[32, 128]
WOAMaximum number of iterations5
Number of whales10
Disclaimer/Publisher’s Note: The statements, opinions and data contained in all publications are solely those of the individual author(s) and contributor(s) and not of MDPI and/or the editor(s). MDPI and/or the editor(s) disclaim responsibility for any injury to people or property resulting from any ideas, methods, instructions or products referred to in the content.

