Article

Study on the Potential of New Load-Carrying Capacity Descriptions for the Service Life Calculations of Gears

Gear Research Center (FZG), TUM School of Engineering and Design, Technical University of Munich, Boltzmannstraße 15, D-85748 Garching near Munich, Germany
*
Authors to whom correspondence should be addressed.
Machines 2024, 12(5), 304; https://doi.org/10.3390/machines12050304
Submission received: 8 April 2024 / Revised: 22 April 2024 / Accepted: 27 April 2024 / Published: 1 May 2024
(This article belongs to the Special Issue Advancements in Mechanical Power Transmission and Its Elements)

Abstract

:
Calculating the service life of gears under variable loads requires a description of the load-carrying capacity. The current standard for this is the use of the S/N curve. International standards such as ISO 6336 stipulate the use of this approach for the calculation of the service of gears under variable loads. In this paper, five new approaches are developed and evaluated to describe the load-carrying capacity of gears in the load range of finite life. Four methods are based on machine learning, and one uses mathematical regression. To validate the new approaches, the results of an experimental study investigating the service life of gears under variable loads are presented. These results form the basis for the conducted study, which compares the five new methods with the existing approach. The comparison focuses on the ability of the load-carrying capacity descriptions to provide an accurate calculation of the service life and to reduce scattering as much as possible. The results of the study show significant potential for the new methods, especially the one based on a neural network.

1. Introduction

Gearboxes are an essential part of many machines, such as electric cars, robots, ships, or aircraft. At the heart of the gearbox are, in most cases, the gears. Gears are one of the most common machine elements used to transmit and convert rotational movement [1]. In order to dimension these machine elements according to the load occurring during operation, a description of the load-carrying capacity is essential. The load-carrying capacity of gears depends on the load and must, therefore, be described as a function of the occurring loads. The accepted mathematical approach for this is based on a publication by Basquin [2] dating back to 1910. For instance, ISO 6336 [3,4] specifies this concept for the load-carrying capacity of gears. The approach to describing the load-carrying capacity of gears based on the concept of Basquin allows for a relatively simple procedure for testing and calculation and has proven to be applicable and reliable for gears.
Since the publication of this approach back in 1910, the possibilities for data analysis have changed fundamentally. In particular, the advent of computers opened up new potential. In addition, recent developments in the field of machine learning have created new options for analyzing and describing data. In many fields of engineering, the application of machine learning enabled significant advancements, for example, in the field of condition monitoring [5,6,7]. The scope of this paper is to evaluate these methods for the description of the load-carrying capacity of gears. More precisely, this paper investigates various alternatives for the description of the load-carrying capacity in the load range of finite service life. The main question of this study is whether it is possible to reduce the scattering of the calculation results for the service life of gears under variable loads by applying one of the developed approaches compared to the results based on the approach, according to Basquin.
First, a brief summary of the state of knowledge regarding the load-carrying capacity of gears is presented. In this context, the above-mentioned approach, according to Basquin, is introduced. This is followed by a description of the new approaches investigated to describe the load-carrying capacity of gears. These approaches are based on mathematical data analysis and machine learning. To validate the suitability of the presented approaches, an experimental study was conducted at FZG. The results are presented in this paper. Finally, the paper compares the newly presented methods with the common approach based on Basquin’s publication. The scope of this comparison is the assessment of the accuracy of the calculation of the service life of gears under variable loads.

2. Load-Carrying Capacity of Gears

The load-carrying capacity of gears is usually described using the S/N curve [8,9]. The S/N curve was developed by the German engineer August Wöhler [10] and is, therefore, also known as the “Woehler” curve. A schematic S/N curve is presented in Figure 1. The S/N curve divides the loads into three ranges:
  • Loads greater than the static strength cannot be tolerated for a relevant number of load cycles (red area in Figure 1).
  • Loads less than the endurance limit can be tolerated for an infinite number of load cycles (green area in Figure 1).
  • Loads between these two characteristic values can be tolerated for a limited number of load cycles (yellow area in Figure 1).
In the load range of finite life, the correlation between the load L and the number of endurable load cycles N is non-linear and based on the Basquin equation [2]. Due to the logarithmic scale of both axes of the S/N diagram, the correlation appears linear in Figure 1. The Basquin equation [2] is shown in Equation (1).
N = C × L k
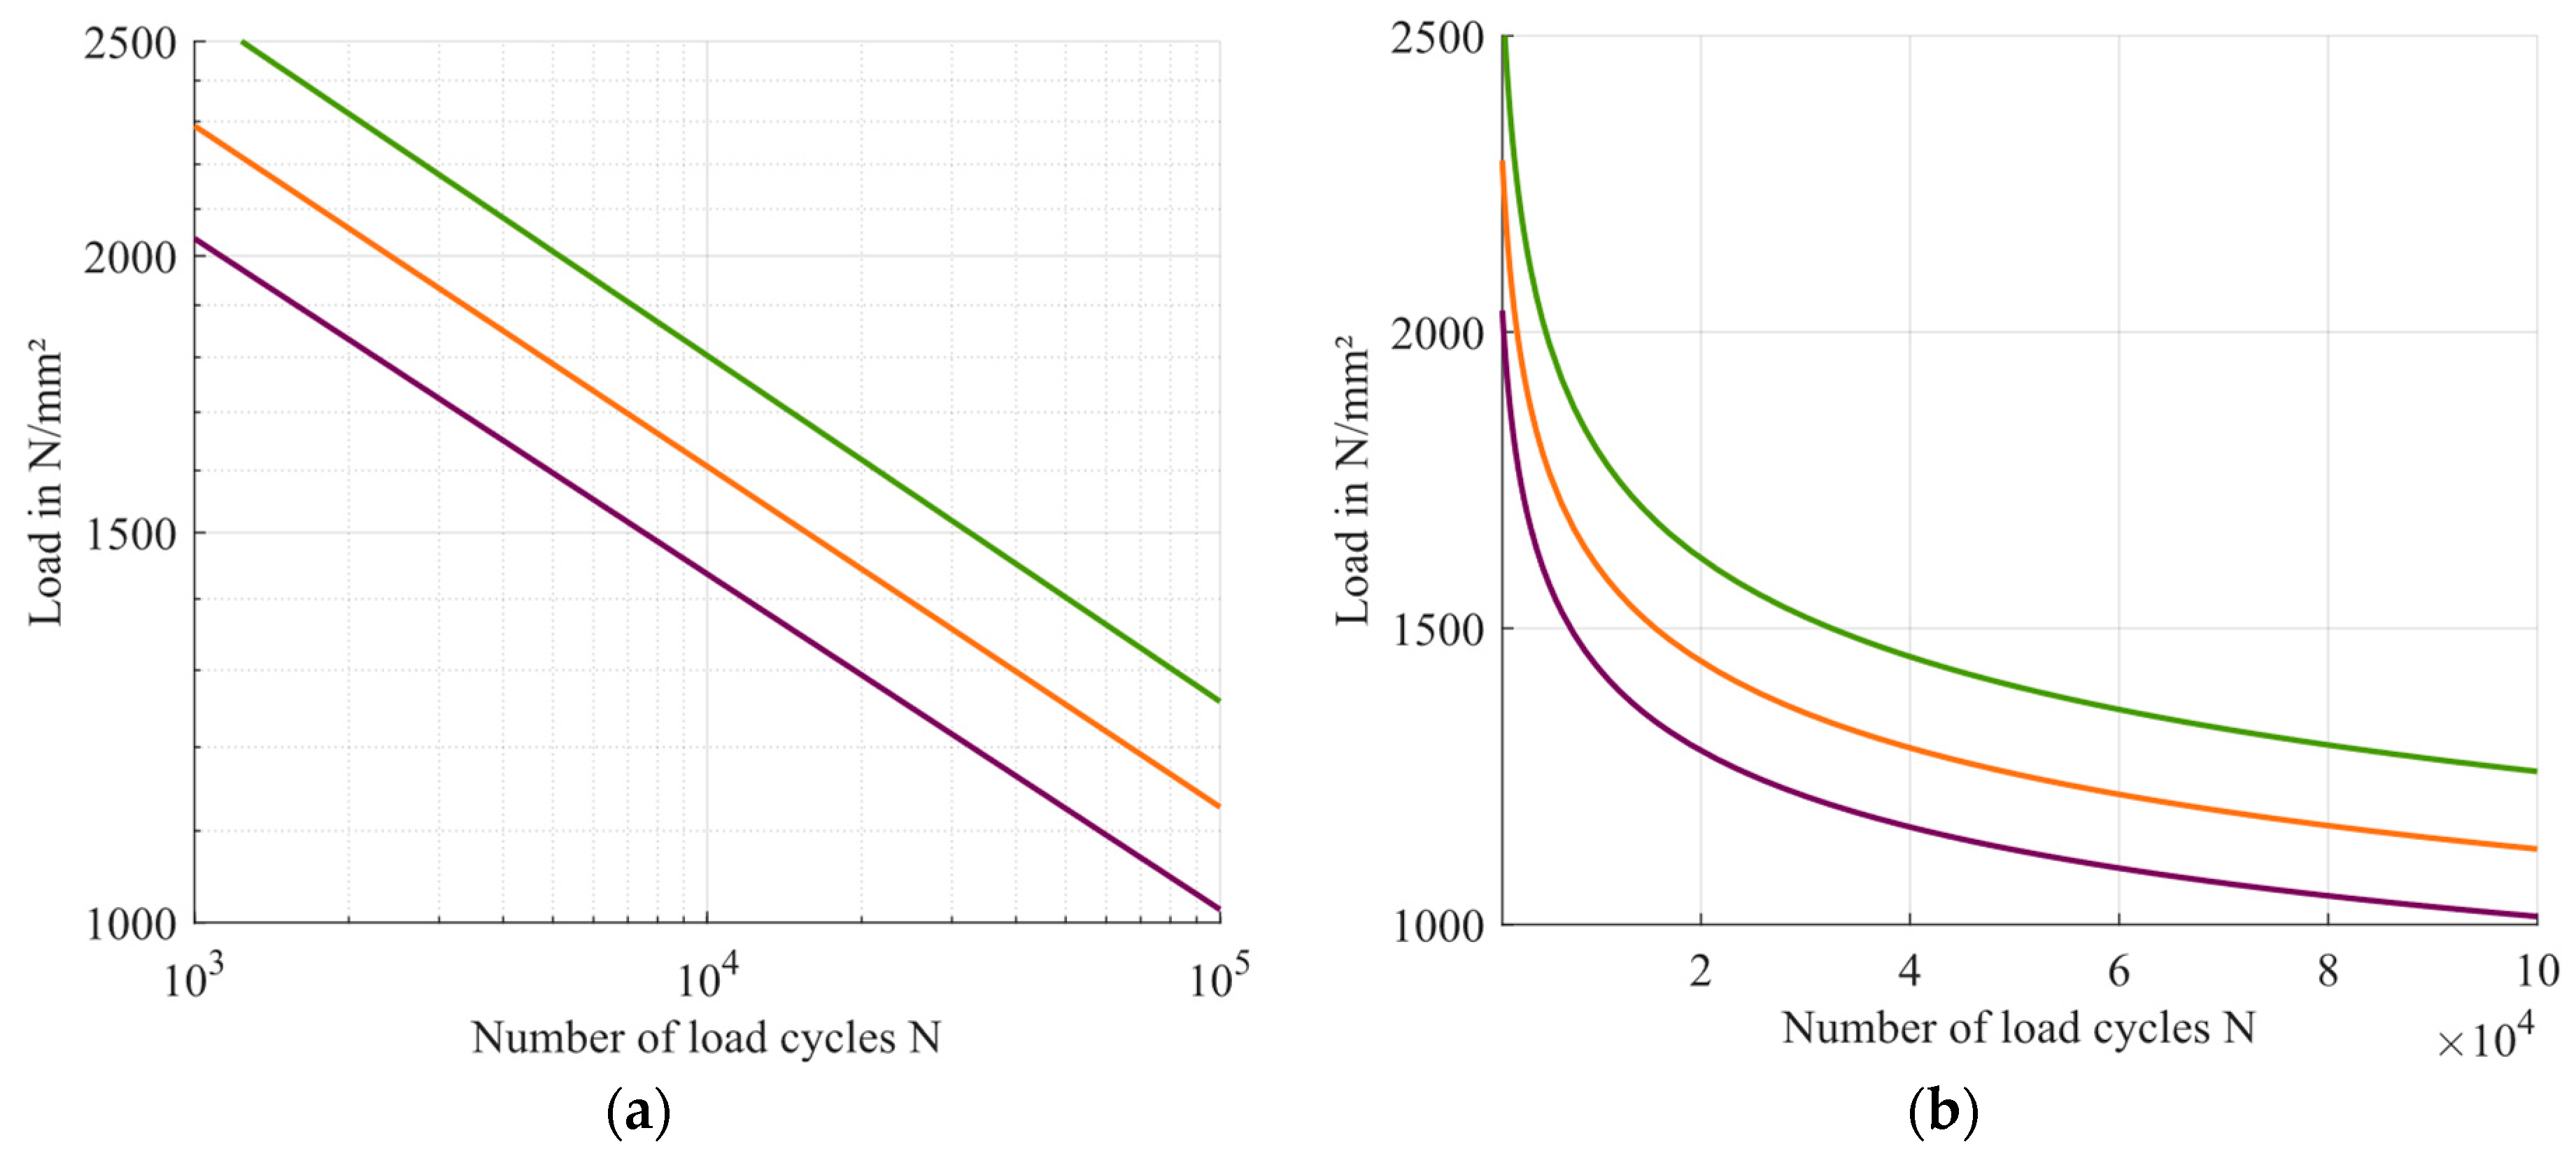
The Basquin equation uses only the slope k and the constant C to determine the S/N curve. Therefore, the ability to adapt the equation to describe the load-carrying capacity of a particular machine element or gear is limited. On the other hand, this significantly reduces the amount of data required to determine the S/N curve. Figure 2 shows three different examples of S/N curves. On the left-hand side, the curves according to the Basquin equation are shown with logarithmic scaling of both axes. On the right-hand side, both axes are scaled linearly. The slope k and constant C can be used to adjust the S/N curve, but the general shape and mathematical formula are fixed by the Basquin equation. The three exemplary S/N curves shown in Figure 2 are based on unique combinations of the slope k and constant C. This example is intended to show that the general shape cannot be influenced by choosing different values for the parameters, and, therefore, the possibility of adaption is limited.
The application of the Basquin equation to describe the load-carrying capacity is the state of knowledge for gears [8] and is stipulated by standards [9,11].
The procedure for the experimental determination of the S/N curve for gears is described in the FVA Guideline 563/I [9]. It is divided into two parts:
  • The determination of the endurance limit of the gear;
  • The specification of the S/N curve in the load range of limited service life.
The data for the S/N curve are generated using single load tests only. Gears are tested under a constant load until either the gears fail or the number of load cycles exceeds a certain threshold. If the latter occurs, the test run is classified as a runout. The two parts of the test procedure are separate and usually do not share any data points. To determine the endurance limit, both failures and runouts are required within the set of evaluated data points. Failures are the only valid basis for determining the S/N curve in the load range of limited service life.
The endurance limit can be determined using one of two approaches:
  • The horizon method uses a certain number of stress levels, which must be determined by the user. At every load level, a certain number of test points are conducted. This basis is used to calculate the endurance limit.
  • The staircase procedure includes a certain number of test runs. The load level of each test run is determined by the result of the previous test run. If a failure occurs, the next test will be performed at a lower load level. On the other hand, if a runout is observed, the next test run applies a higher load. The endurance limit is usually calculated using the method according to Hück [12]. Additional information about this method and its accuracy can be found in [13].
To define the parameters of the Basquin equation, which describes the number of endurable load cycles for loads above the endurance limit, two data points on the S/N curve must be determined. These two points are a combination of a load and the corresponding number of endurable load cycles. Since gear failure is subject to scattering, it is common to perform several test runs at both load levels and use the average number of load cycles N 50 % , n according to Equation (2) [9]. Where N i is the respective number of load cycles at failure for each one of the n test runs.
log 10 N 50 % , n = 1 n i = 1 n log 10 N i
Typically, the total number of test runs conducted for gears is in the range of 20 to 40 [9]. Finally, based on the results, it is possible to determine the number of load cycles at the knee point of the S/N curve N D . This point is the intersection of the sloped part of the S/N curve and the horizontal line representing the endurance limit.

3. Basics of Machine Learning and Application in the Field of Fatigue Life Analysis

Machine learning methods enable computers to solve problems without being specifically programmed for their solution. These methods rely on data to learn the correlation between the input and the output of a problem and, therefore, do not require a ridged algorithm specified by the user [14]. Especially in very complex cases with a lot of data, machine learning may provide a solution for a problem that otherwise may not have been solvable using traditional approaches. Machine learning can be classified into supervised and unsupervised learning. In the case of unsupervised learning, the algorithm only receives a set of input data and tries to find the best possible correlation between the data points. In the case of supervised learning, the output data are also provided, and therefore, the learning process can rely on these data to find the best possible solution for the problem. Later, the trained algorithm can then be used to provide the answer for new input data.
This paper investigates the potential of replacing the Basquin equation as a description of the load-carrying capacity with a machine learning-based model. For the implementation of this approach, a machine learning model solving a regression problem first has to be trained; for this, different methods of machine learning can be applied. The selection of the methods considered within this paper is based on the results and findings of publications in the field of fatigue life analysis. Three commonly used machine learning methods in the field of fatigue life analysis are neural network, support vector machine, and random forest. He et al. [15], for instance, applied all three methods for the estimation of the S/N curve of three different steels. Zhan and Li [16] utilized the neural network and the random forest approach to estimate the service life of aluminum parts.
Mudabbir and Mosavi [17] presented a review of the use of machine learning for the modeling of service life. They include 29 publications and conclude that neural network, support vector machine, and random forest are most commonly used within this field.
Another often-used method is the Gaussian process regression. In [18,19], this machine learning method was applied to estimate the state of damage of an off-shore wind turbine. In [20], the service life under multiaxial loading was predicted based on the Gaussian process regression.
Based on the presented results and publications, the following machine learning methods are applied within this paper:
  • Neural network (NN);
  • Support vector machine/support vector regression (SVR);
  • Random forest (RF);
  • Gaussian process regression (GPR).
In the following, the four machine learning methods applied in this paper are introduced in a compact manner. This paper only uses supervised learning. Additional information about machine learning can be found in the relevant literature [14].

3.1. Support Vector Machine

The support vector machine (SVM) is a machine learning method that was originally designed for classification. Classification is a kind of problem where input data have to be divided into two or more classes, for instance, if a picture shows a human or an animal. Further developments to the method enabled the application for regression [14]. Regression is the prediction of a floating output value based on the input, for instance, which air pressure can be expected in a certain area based on the current weather data. The SVM is based on the so-called kernel trick that uses a transformation of the data into higher mathematical dimensions to solve the problem, which could not have been solved in its original dimension. The SVM requires little input data and computational power compared to other methods of machine learning [21].

3.2. Random Forest

The random forest approach is, per se, not an original machine learning method. It can be allocated to the field of ensemble learning. Ensemble learning is the approach to combining several methods or several trained models of one method to solve a problem [14]. The random forest approach combines several decision trees, which are, per se, a machine learning method. Software tools like MATLAB (version 2023b) [22] can be used to automatically train and combine decision trees to build a random forest and solve the problem based on this approach. In the cases of the software MATLAB [22], 100 decision trees are combined for the solution of the regression problem [23].

3.3. Neural Network

The neural network is a machine learning method that uses a structure in the style of the human brain. The network is composed of layers consisting of single neurons. These neurons are linked to each other and, therefore, enable the transfer of data from the input to the output side of the network. During the training process, the weighting of the single neurons and the functions activating each one is determined to fit the data best [14]. Neural networks are part of the field of deep learning, which enabled many of the remarkable results achieved with machine learning in the past years. Neural networks can be scaled to solve very complex problems but, in general, require more input data and computational power compared to other methods of machine learning like the SVM [21].
Within this paper, a feedforward, fully connected neural network designed for regression is applied. Additional information about the used approach can be found in [24].

3.4. Gaussian Process Regression

The Gaussian process regression is commonly used to solve regression problems [25]. The process enables inter- and extrapolation based on data. The approach is capable of performing well with a relatively small database. Additional information about the Gaussian process regression can be found in [25].

4. Experimental Data for the Determination of the S/N Curve

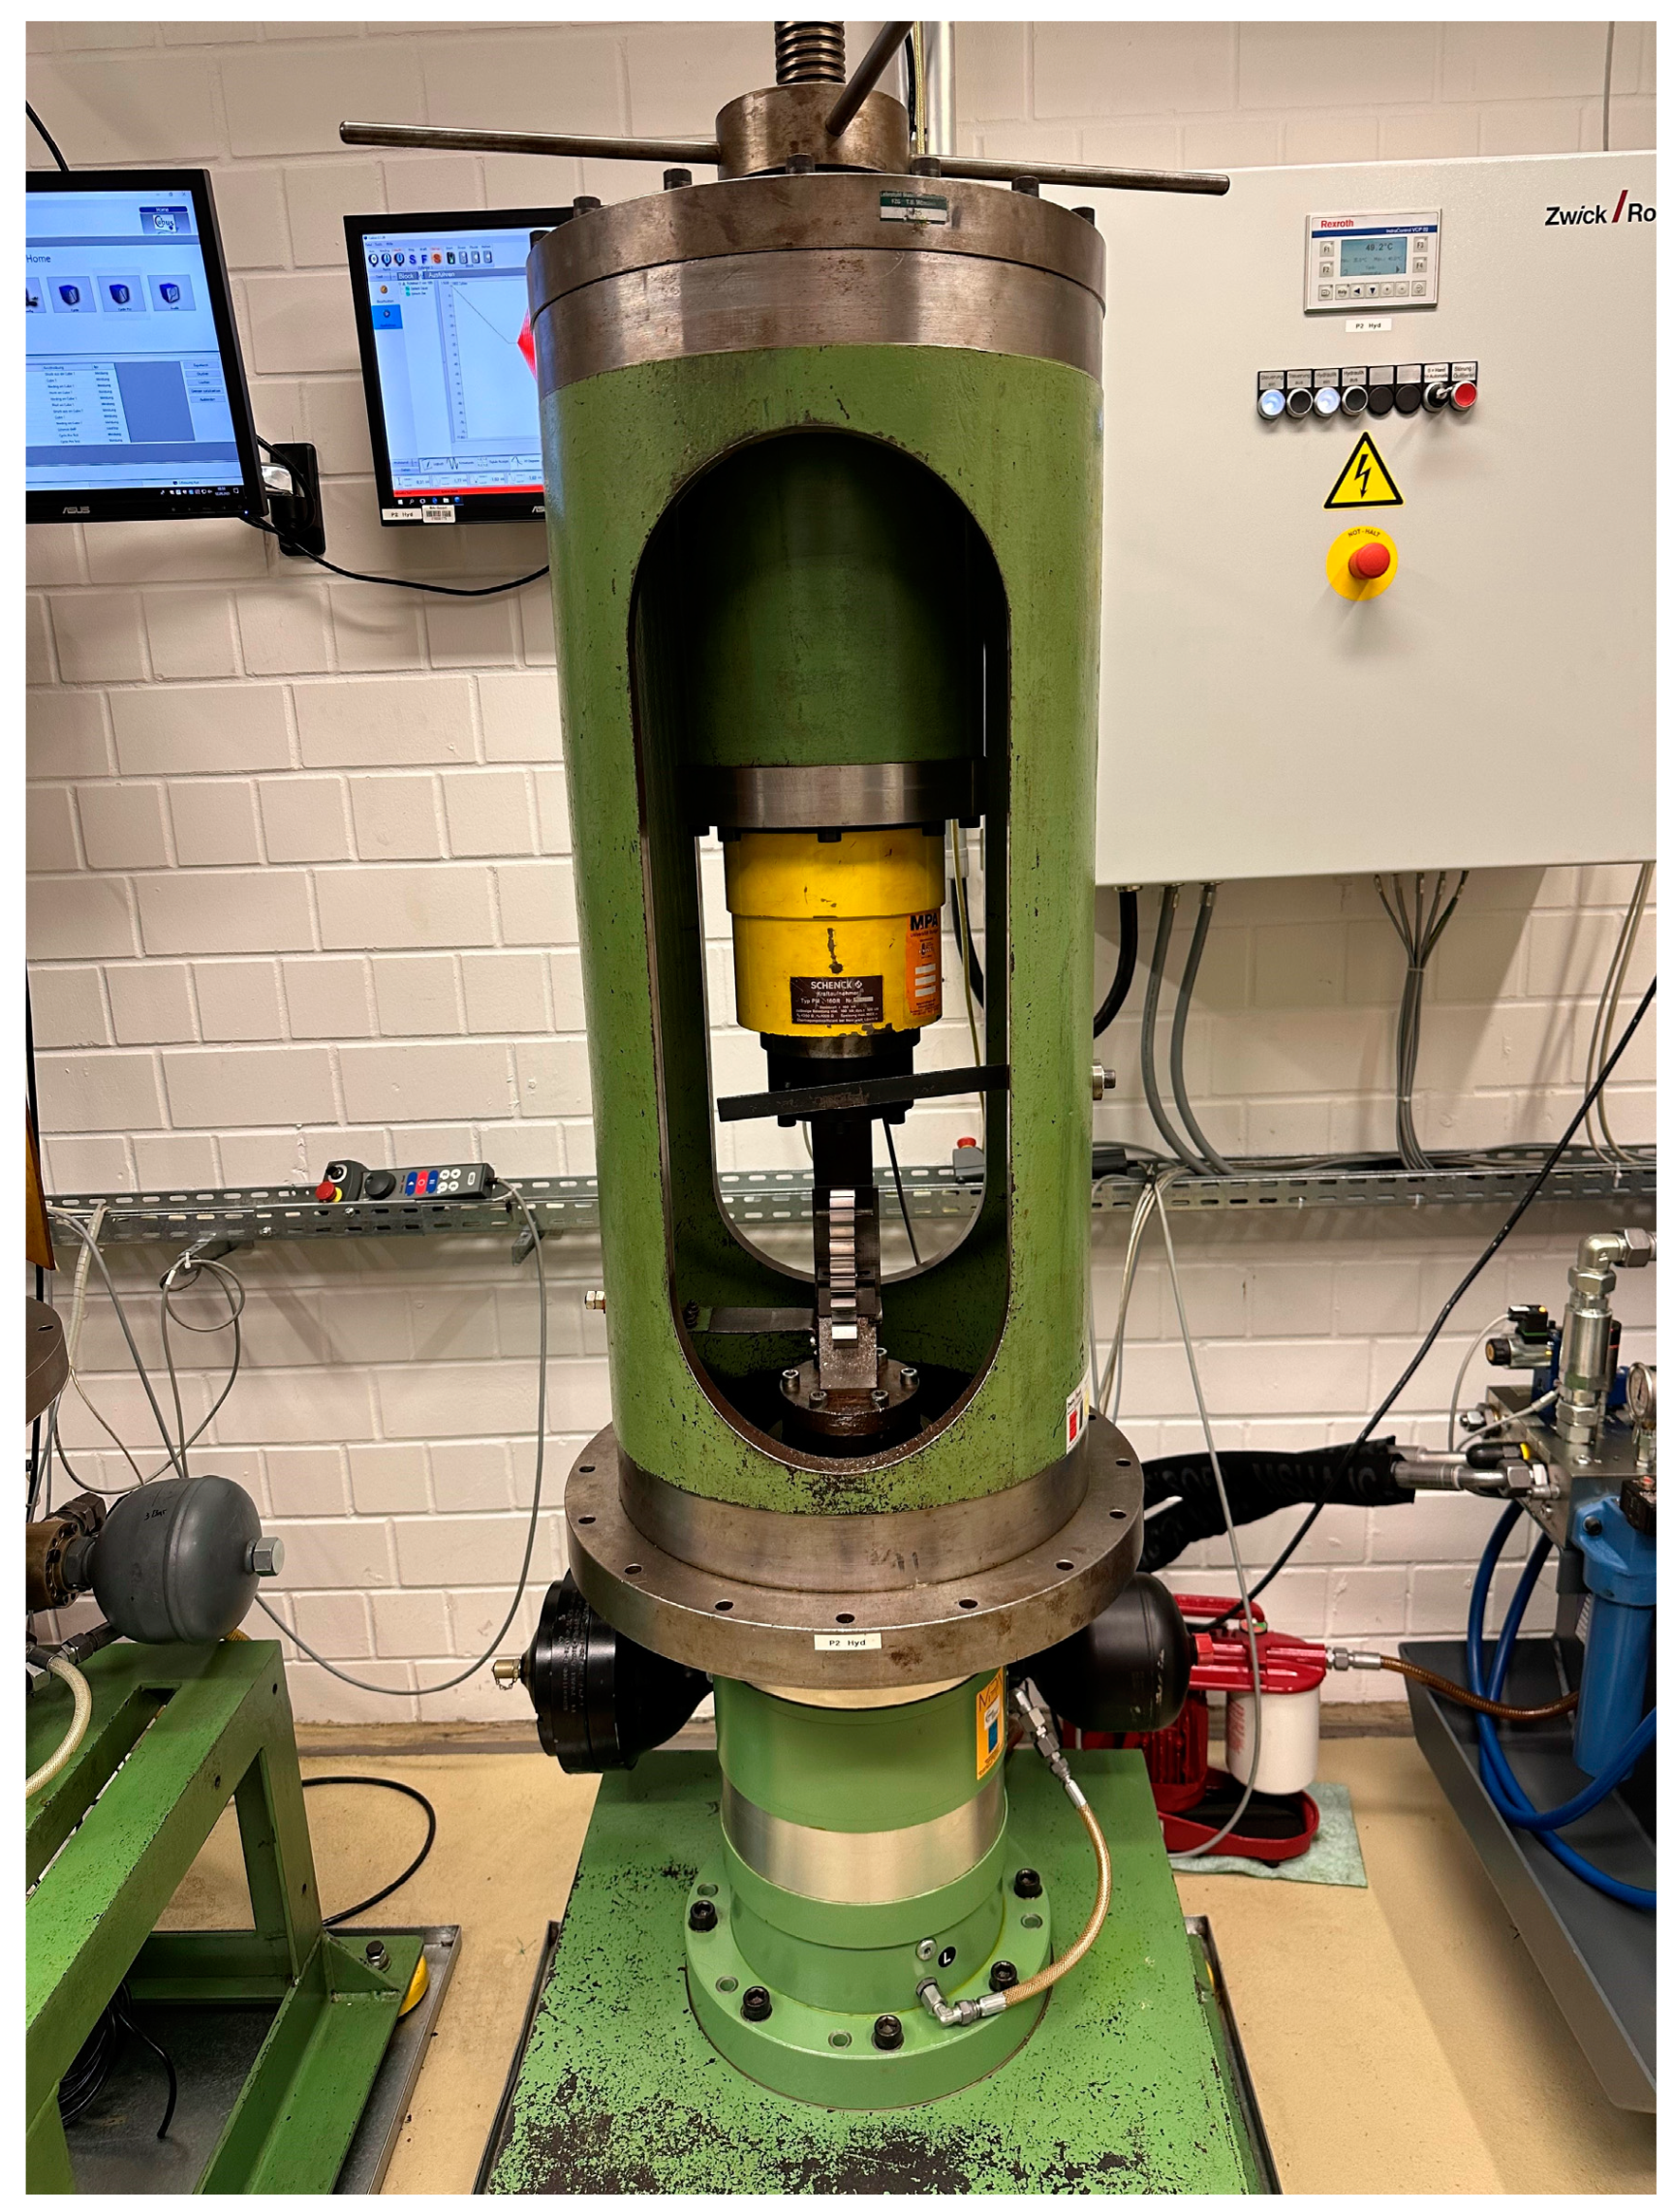
This paper uses data derived from tooth root breakage tests of spur gears. The tests are a continuation of the results presented by the authors in [26]. The data on the gears used are presented in Table 1. The gear geometry was developed at FZG, especially for the application as test gear regarding the tooth root carrying capacity at a pulsator test rig, and was used before in serval research projects at FZG [27,28]. The pulsator used for the experiments is shown in Figure 3, and a detailed description of this test rig is presented in [27,29]. The data generated using a pulsator test rig cannot be directly applied to the real operating conditions of gears; instead, an additional conversion has to be conducted. This is due to differences regarding loading conditions and statistics. Additional information on this topic can be found in [30]. This does not affect the validity of the results presented in this paper. All compared data and results originate from the same experimental setup, and therefore, a direct application of the test data is possible.
The results of the tests are presented in Figure 4, together with the resulting S/N curve. The endurance limit is determined using the staircase procedure, according to Hück [12]. The sloped section of the S/N curve is based on the results of the test using the load levels corresponding to 70 and 80 kN of pulsator force, respectively. All data points marked in blue are included in the determination of the S/N curve. To create an advanced database, additional test runs were conducted. These test runs would not have been required to determine the S/N curve but are used as an extended basis for the new approaches presented in this paper. The results of the additional runs are marked in orange and are not included in the presented S/N curve.
The data presented within this paper refer to the nominal tooth root stress σ F 0 . The nominal tooth root stress caused by the applied pulsator force F is calculated according to ISO 6336-3 [31] standard and is based on Equation (3).
σ F 0 = F b m n × Y s × Y F  
The stress correction factor Y s and the form factor Y F are determined based on geometry data of the actual tooth root of the gears. Therefore, the tooth root curve is measured at FZG using a CNC-controlled precision measuring center by manufacturer Klingelnberg. These data are then used to determine the factors by applying an iterative calculation process.
The numerical values of the S/N curve are listed in Table 2.

5. Methods for the Advanced Description of the Load-Carrying Capacity of Gears

The purpose of this paper is to investigate the possibility of using alternative methods to describe the load-carrying capacity of gears. Instead of using the Basquin equation, machine learning and regression using polynomials are applied. All data points representing a failure are used as the database. Therefore, runouts are not included. In total, the database consists of 31 data points. Within this paper, only the sloped section of the S/N curve is described when alternative methods are applied. The endurance limit is set to the value corresponding to the original S/N curve. Five different approaches are investigated as possible alternatives to the Basquin equation. Four approaches are based on machine learning, and one is a polynomial regression. As mentioned, runouts are not included as data for the presented methods. In this paper, the scope is limited to the failures as a starting point for the investigation of new approaches. The information provided by the runouts yields potential for further investigations following this publication.

5.1. Polynomial Regression

The general shape of the curve of the Basquin equation is similar to a third-degree polynomial. As mentioned before, the Basquin equation has two coefficients to be adapted to the test data. A third-degree polynomial, on the other hand, has four coefficients c 0 c 3 to be adjusted for. The general formula for this polynomial is shown in Equation (4).
L   N = c 3 N 3 + c 2 N 2 + c 1 N + c 0
MATLAB (version 2023b) [22] software was used to determine the polynomial from the test data presented. The coefficients c 0 c 3 were optimized to represent the test points best. During the optimization an additional condition was added. To ensure good compatibility with the endurance limit, the polynomial was optimized to intersect the endurance limit at the same number of load cycles as the Basquin equation. Therefore, the same number of load cycles is set at the knee point. The results for the coefficients c 0 c 3 are presented in Table 3. The resulting new sections of the S/N curve are presented in Figure 5.

5.2. Approaches Based on Machine Learning

Machine learning allows the user to evaluate data without any additional input other than the data. For instance, there is no need to choose a specific mathematical approach to describe the correlations within the data. Therefore, this approach has the advantage of being highly adaptable to the input data. For a general introduction to the field of machine learning, this paper refers to the relevant literature [14].
The model based on Gaussian process regression is built using the software MATLAB (version 2023b) [22]. The same dataset applied to the polynomial regression serves as a basis. To ensure plausible results, one data point is removed for the Gaussian process regression. The failure, which occurred at nearly one million load cycles, caused the result to shift far to the right within the S/N diagram; therefore, this point is not considered for this method.
For the training of the three remaining machine learning methods, the input data are divided into 70% training data and 30% test data. The training of the methods is also conducted in the software MATLAB (version 2023b) [22] and uses the internal optimization of this tool. Additional information about machine learning with the software MATLAB can be found in [32]. A specific documentation of the used models and approaches can be found in [23] for the random forest, in [33] for the Gaussian process regression, in [34] for the support vector regression, and in [24] for the neural network.

5.3. Overview

The results of all five approaches are presented in Figure 5. Additionally, the S/N curve based on the Basquin equation is added to each chart for reference.
All five new descriptions of the load-carrying capacity are positioned near the one based on the Basquin equation within the S/N diagram. In general, the new approaches exhibit a more complex shape compared to the Basquin equation. The validation of the new approaches will be conducted within the following chapters using experimental data. At this point, it is important to mention that it is reasonable to argue about the physical logic of the shape of the new load-carrying descriptions. Some of them may seem unintuitive to some. Especially the load-carrying description based on the random forest approach shows an abnormal shape. Within the scope of this study, the suitability will only be validated by the results of the following calculations. This is performed with the intention that it may be possible to increase the calculation accuracy with an approach that seems unintuitive regarding its shape.

6. Experimental Data for Validation

The focus of this publication is to evaluate the accuracy of the service life calculation under variable loads based on the different approaches for the load-carrying capacity. Therefore, data about the service life of gears under variable loads are required. These data are generated using the same experimental setup as described in Section 4. The test rig offers the possibility to program load sequences and test the gears until failure.
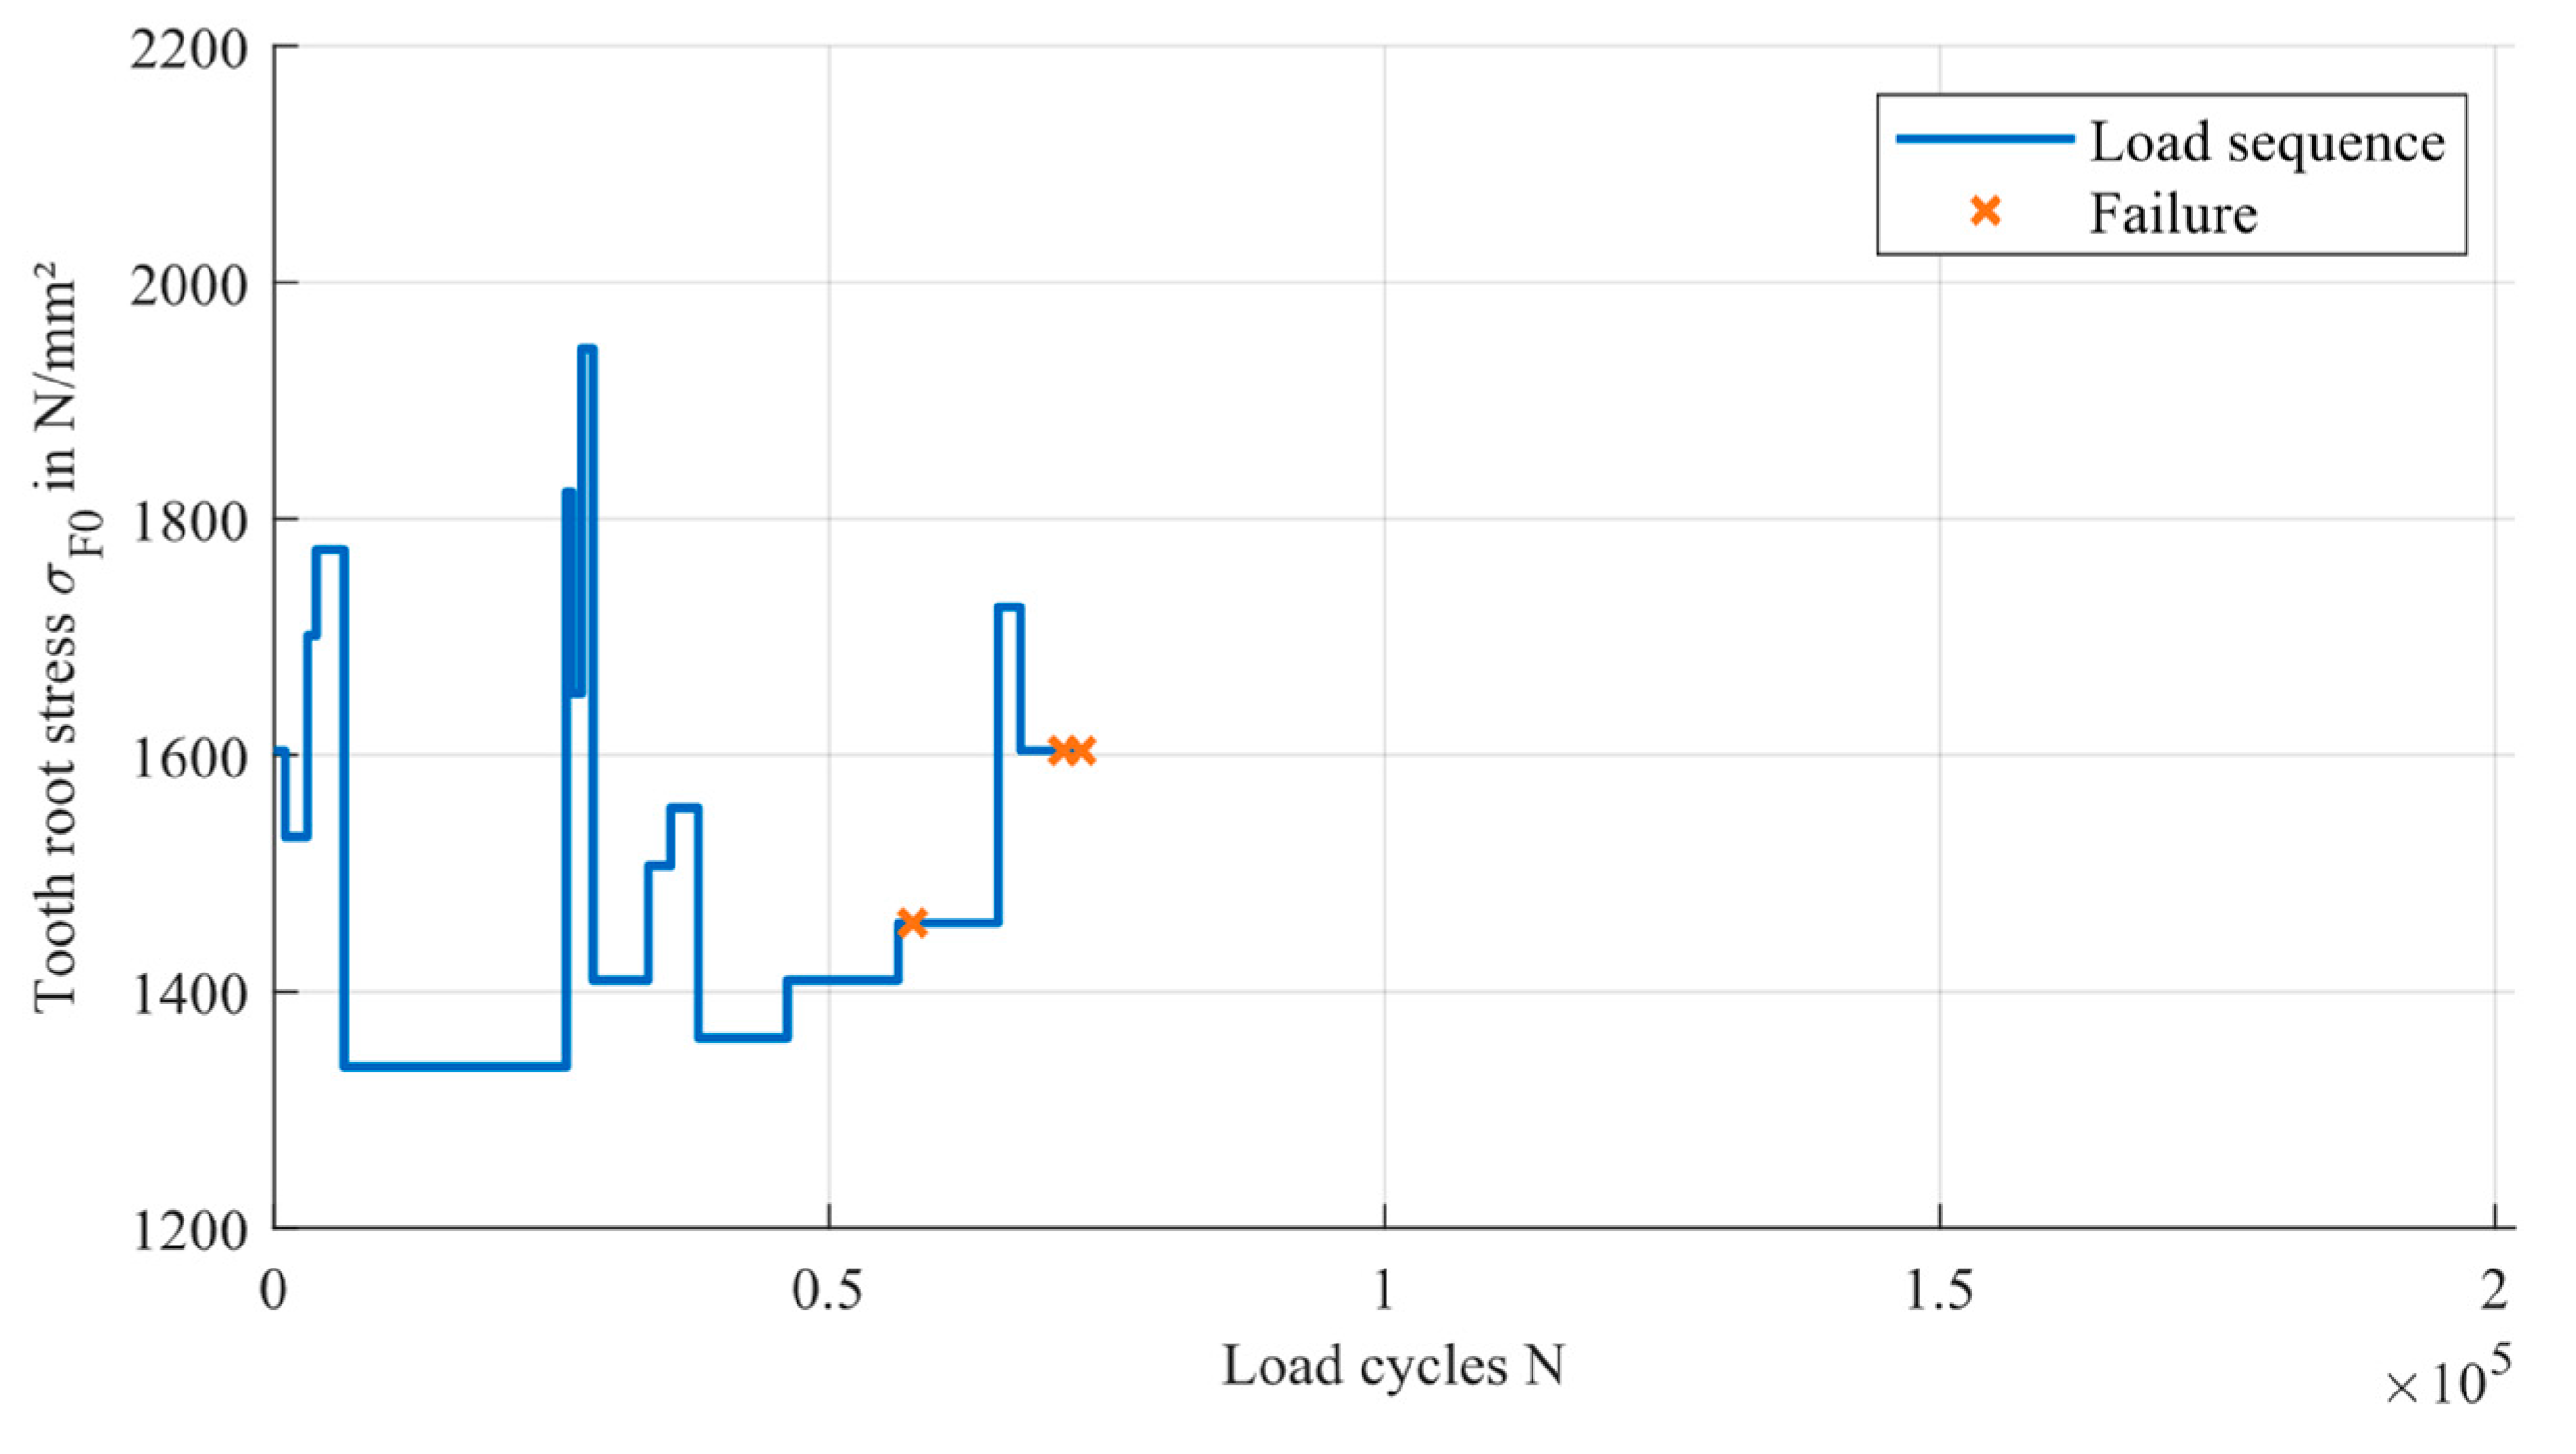
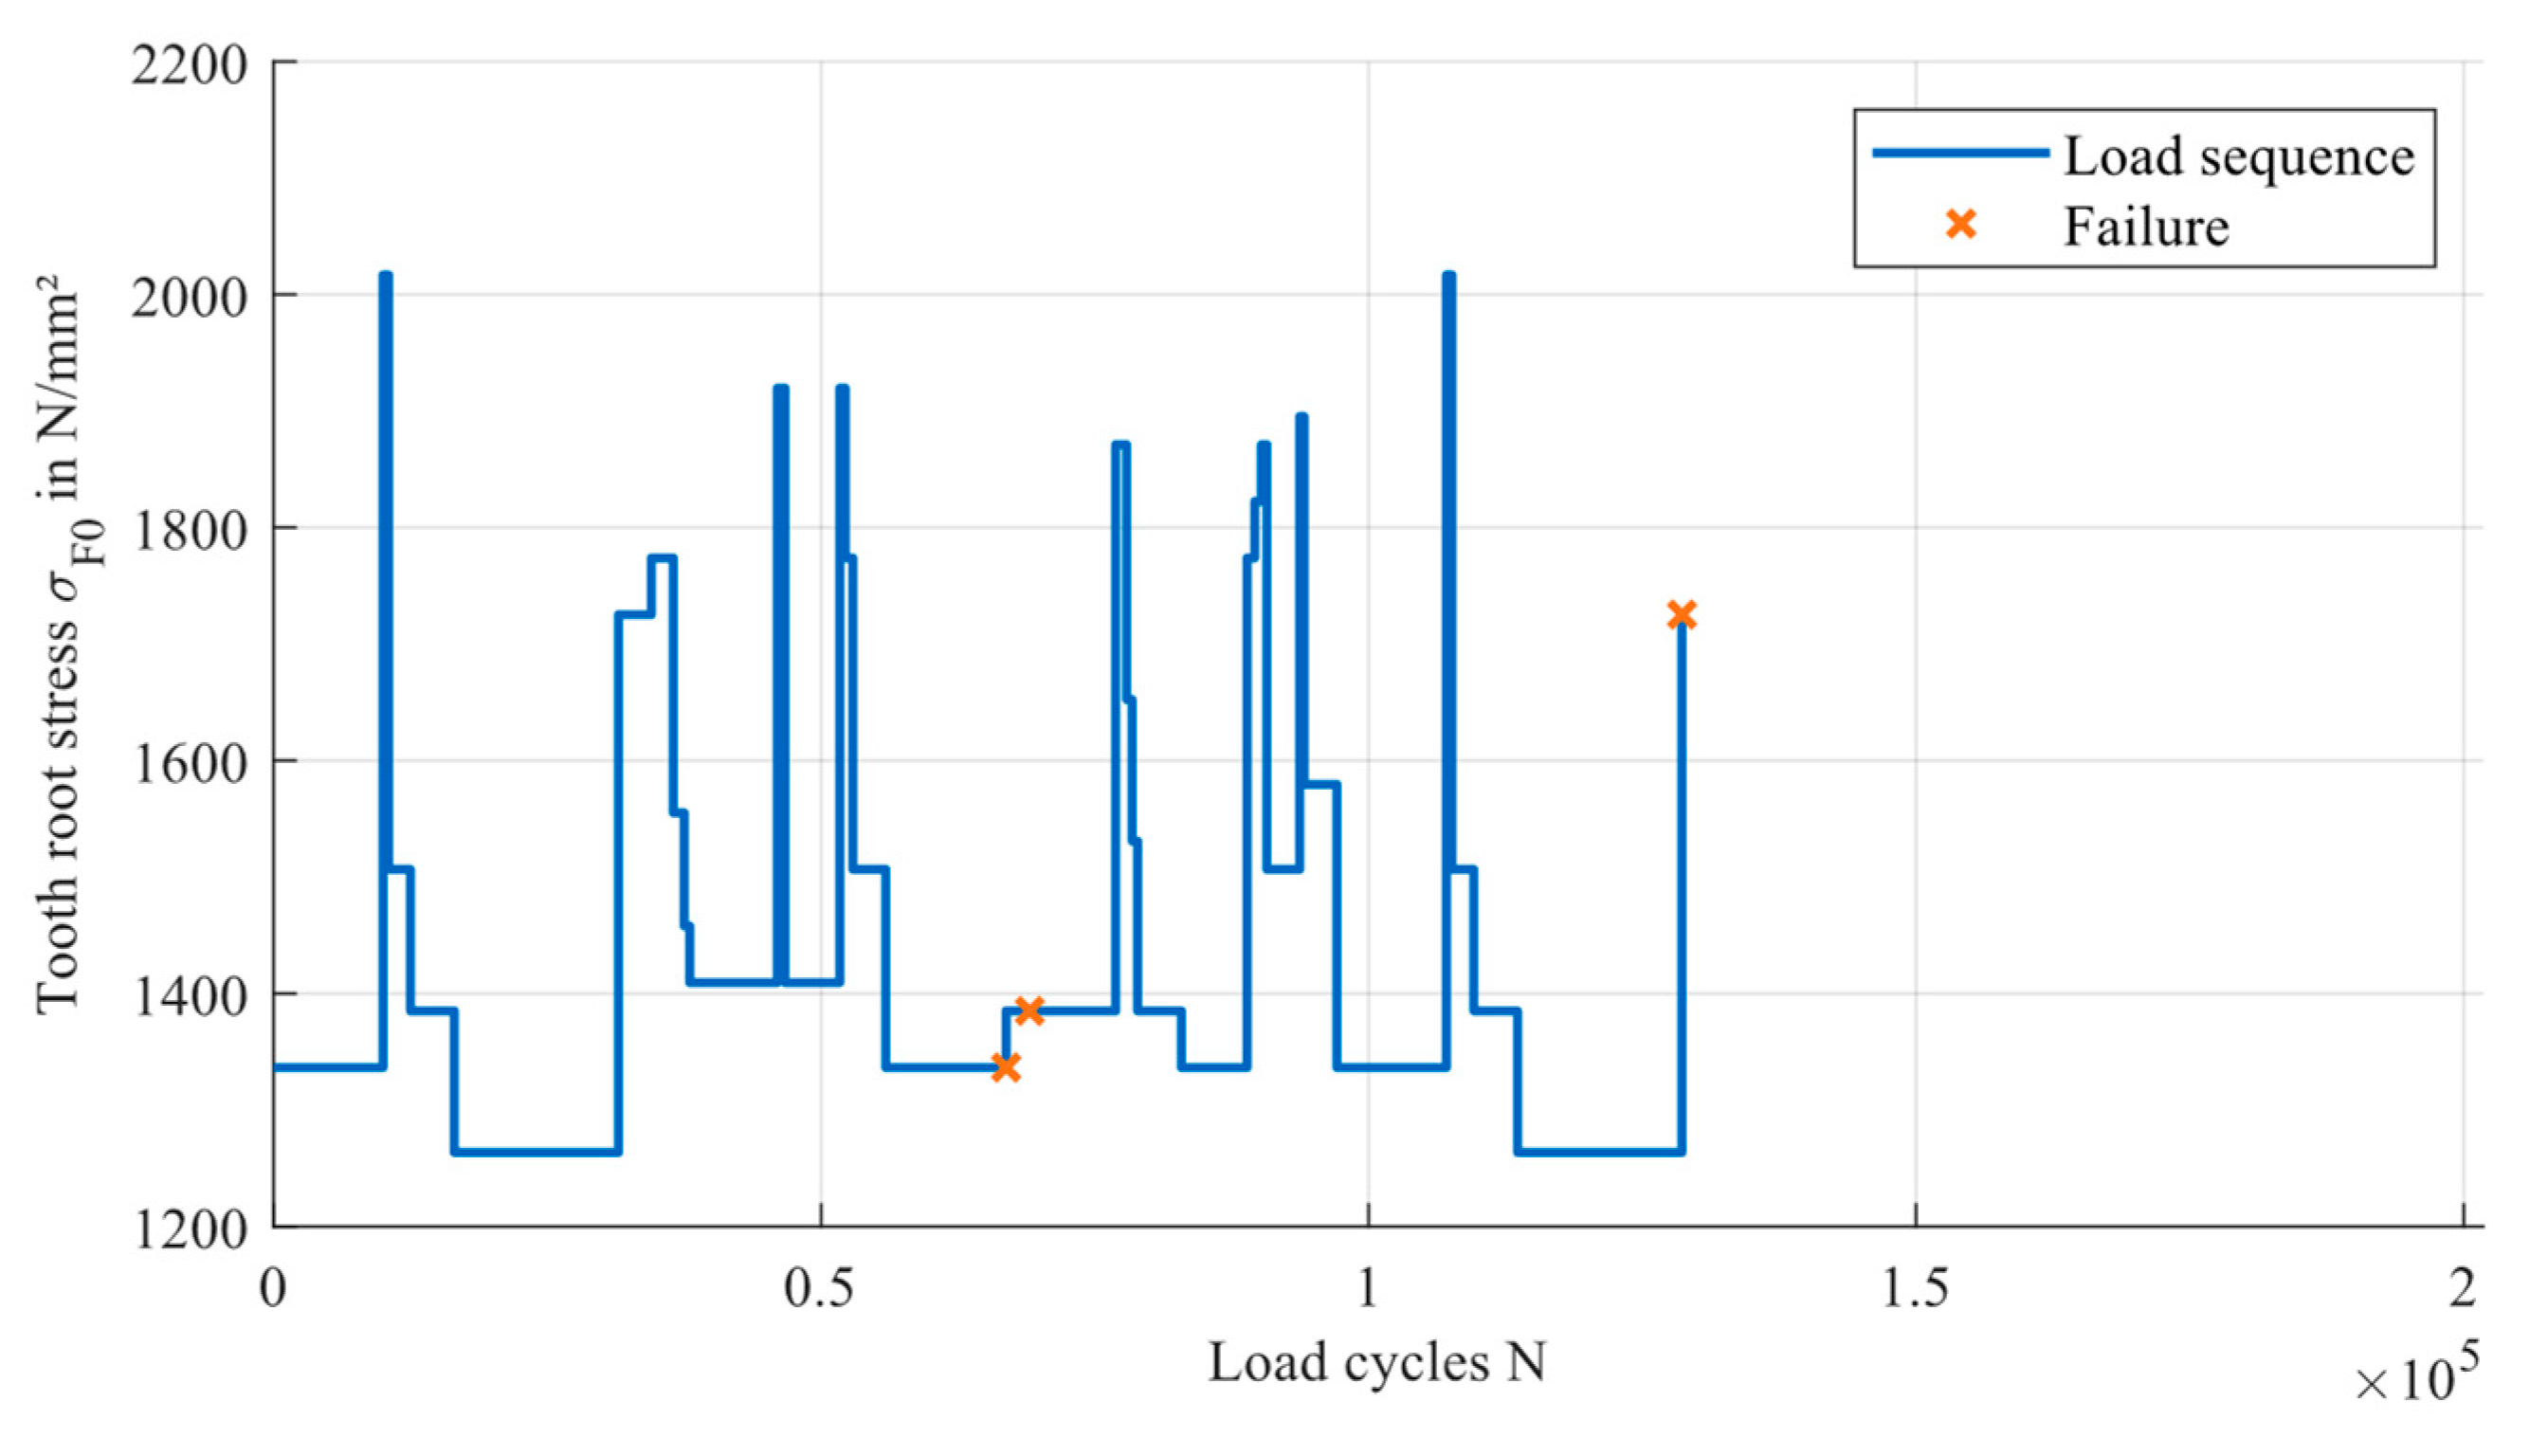
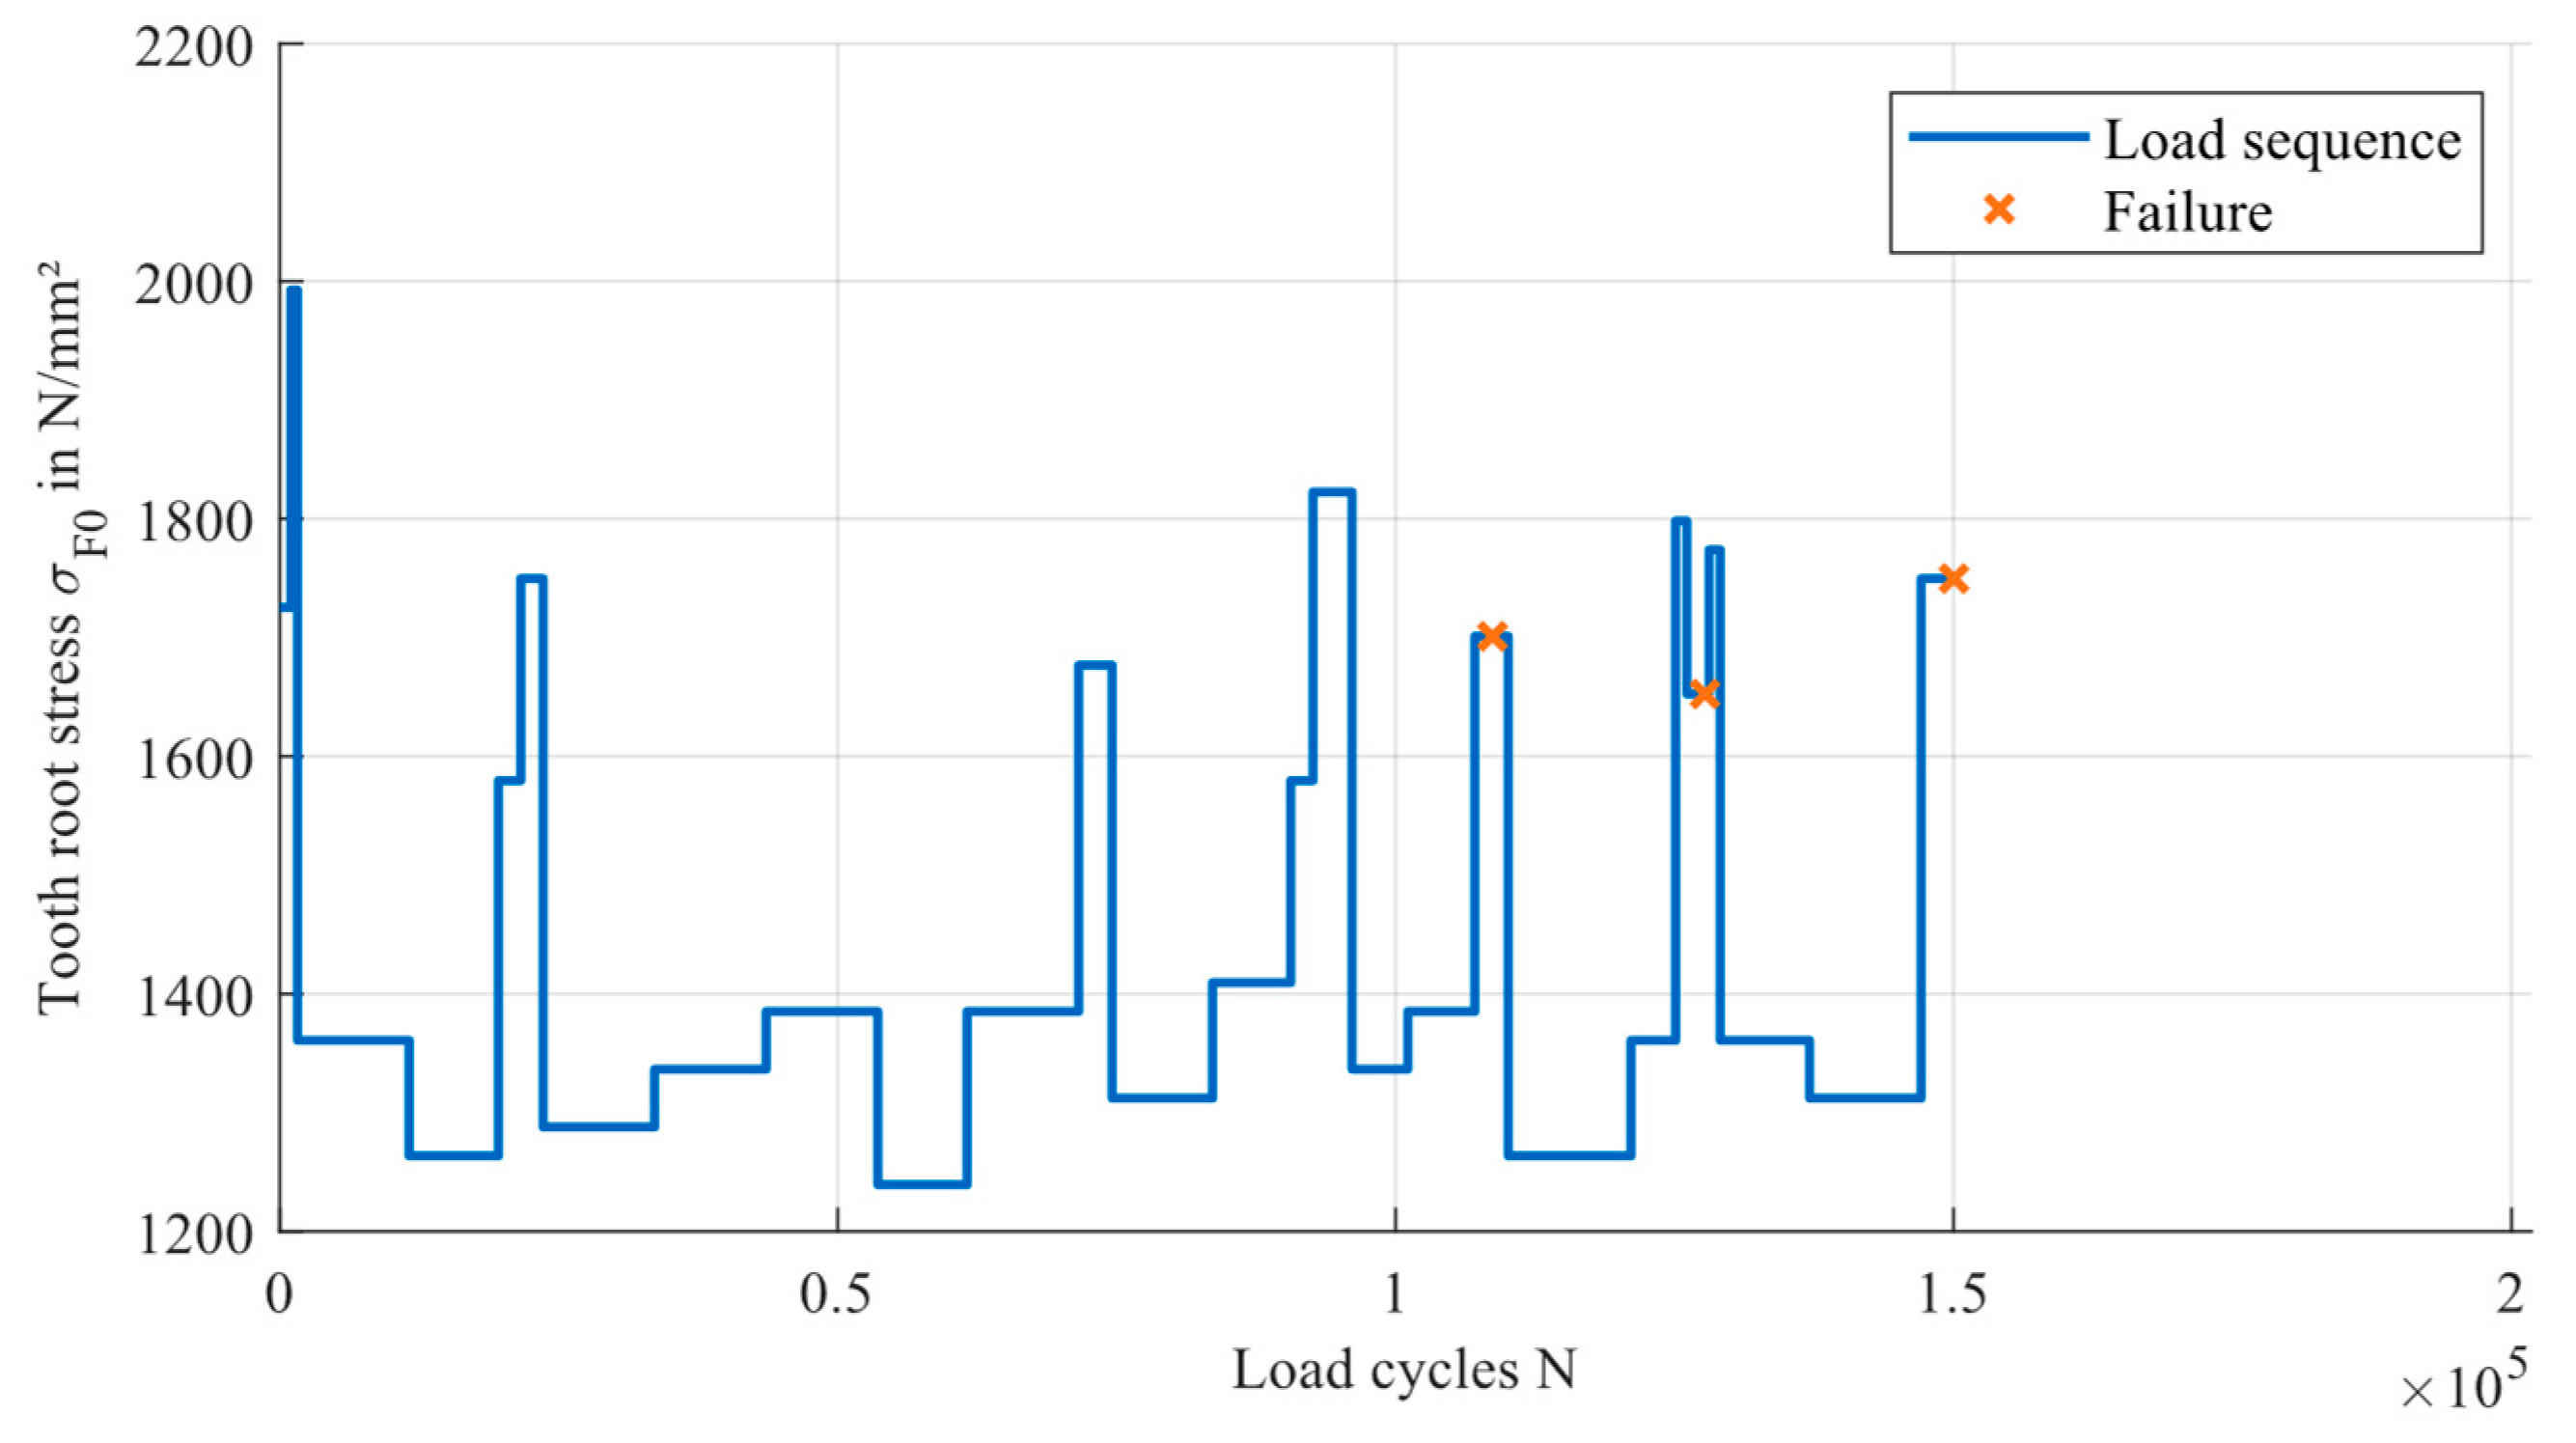
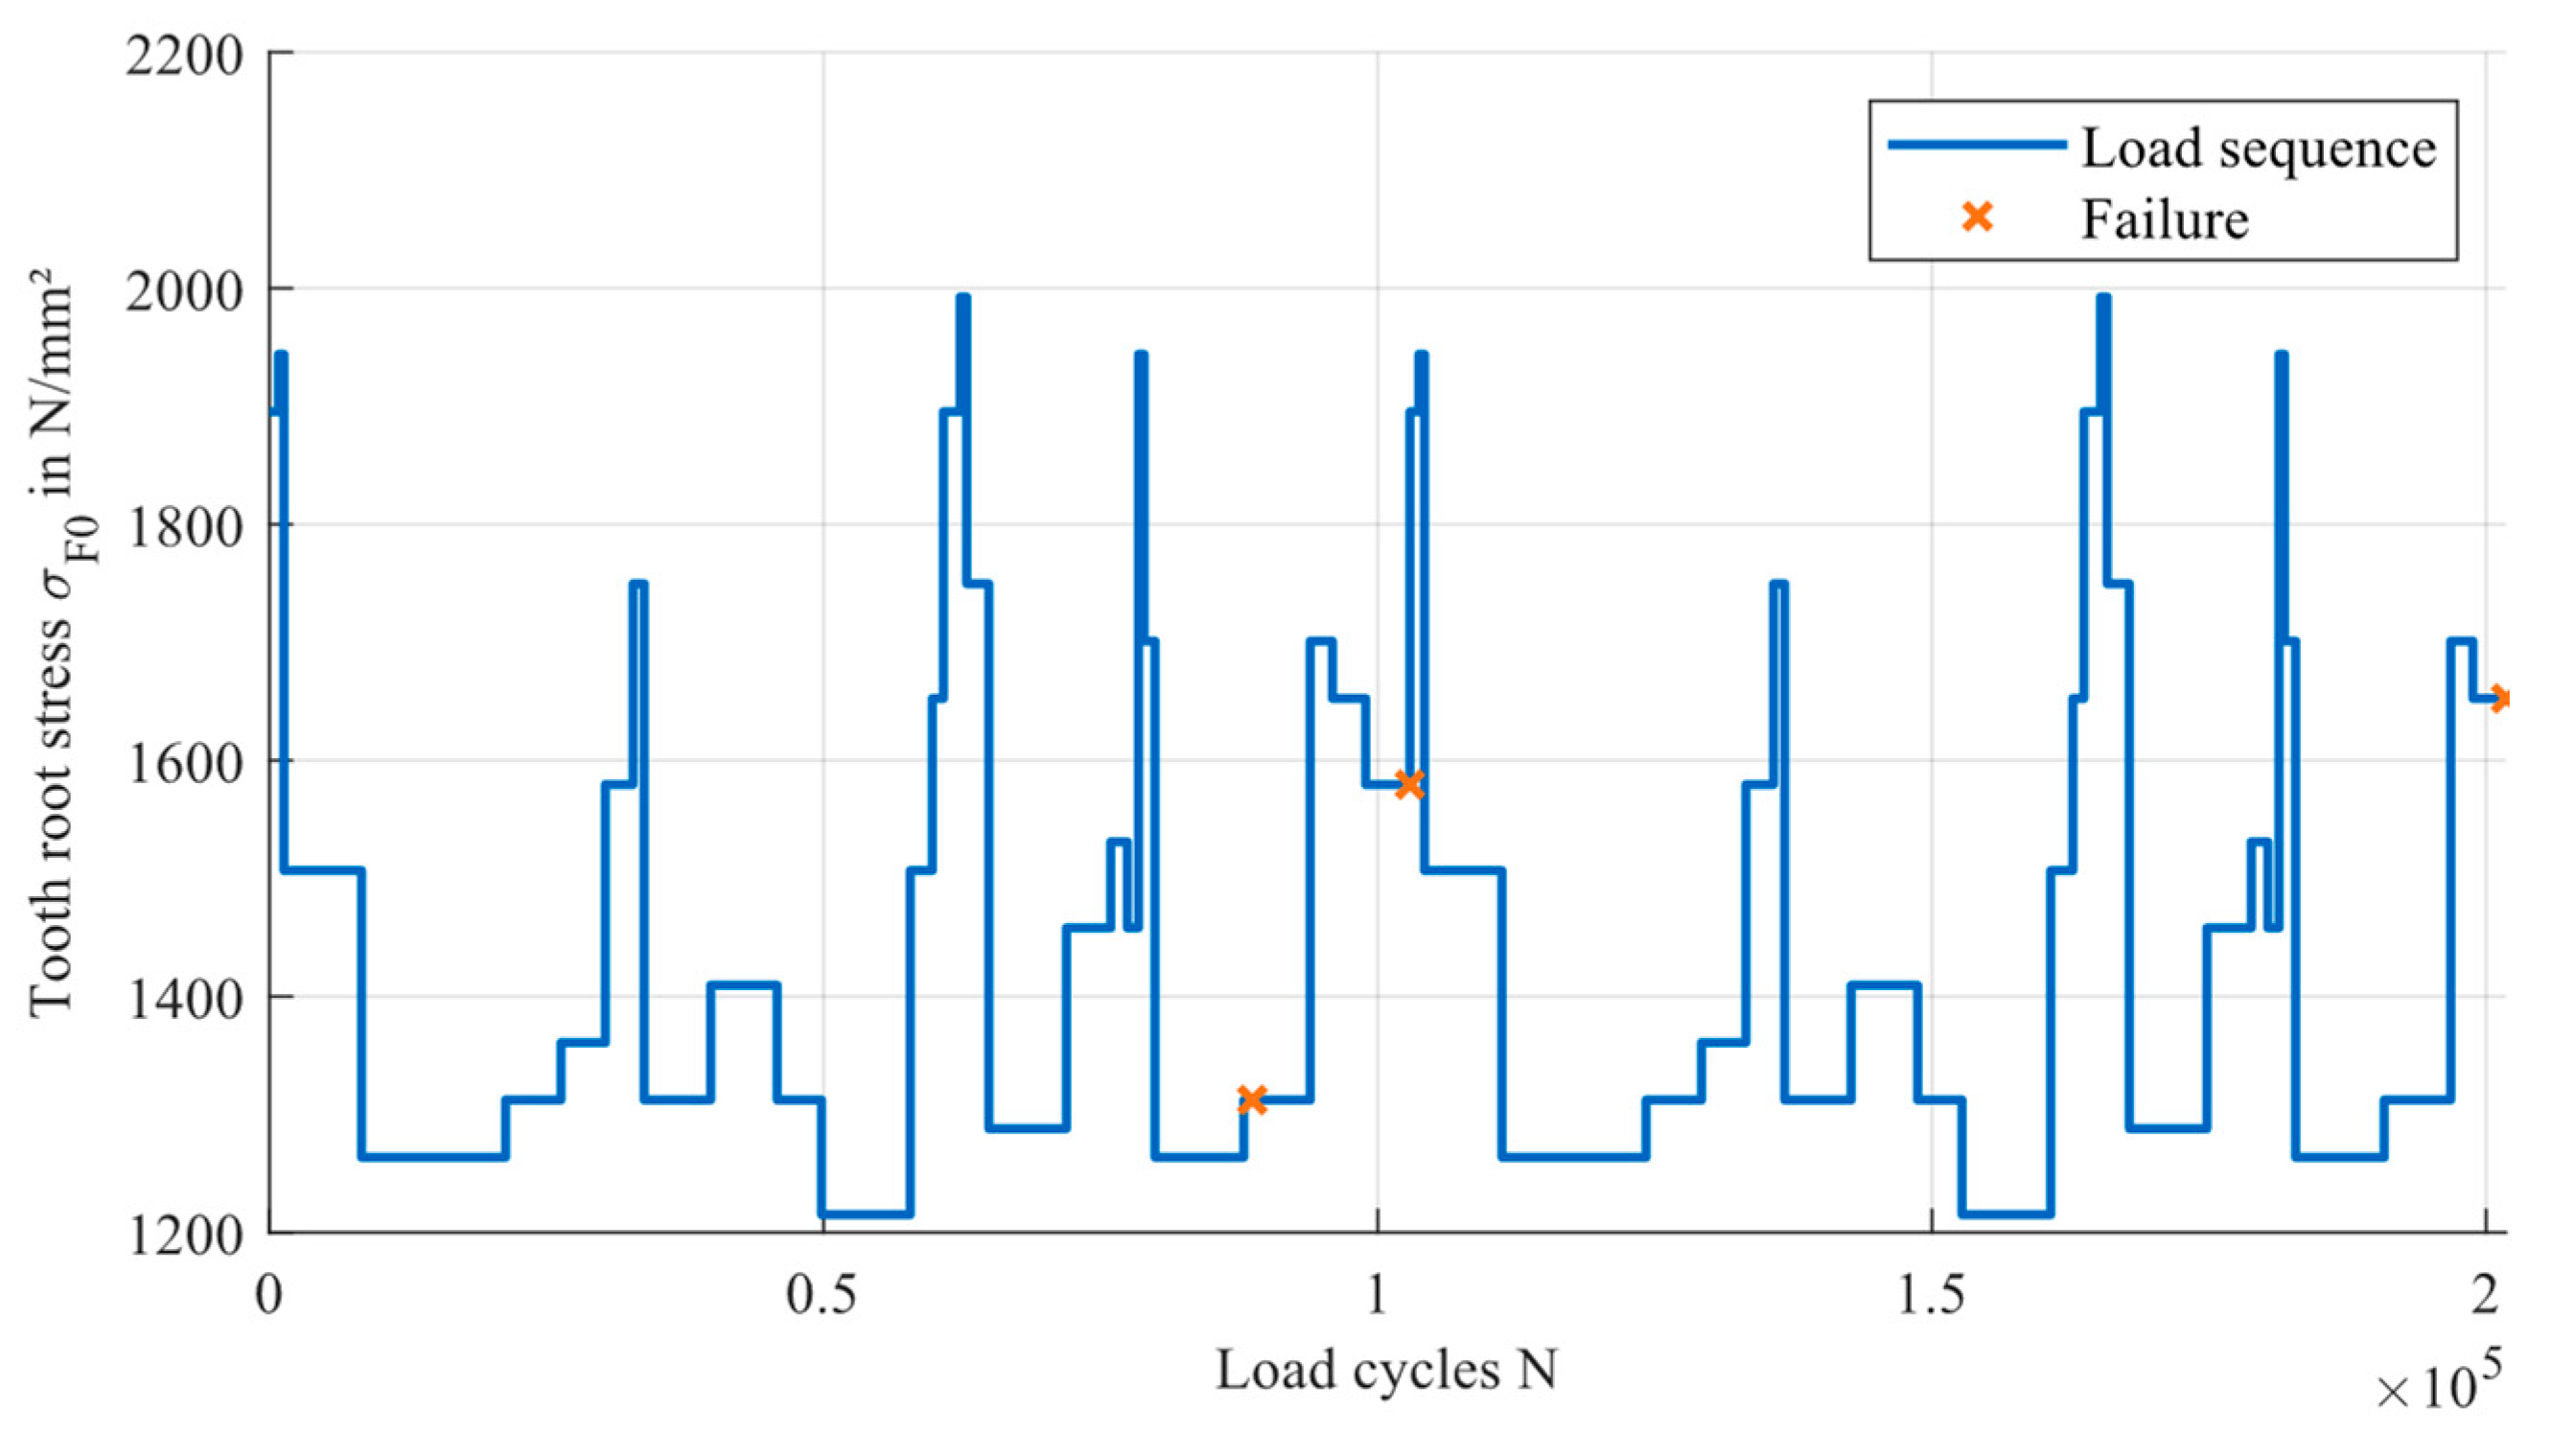
Four different load sequences are designed. The design of the load sequences is mostly random. The loads are chosen in a reasonable range, and the overall design is chosen in a way that ensures usable results. For example, high loads are applied for shorter periods of time to avoid early failures. Each load sequence is used for three runs, resulting in a total of twelve data points. The results of the experimental study under variable loads are shown in Figure 6, Figure 7, Figure 8 and Figure 9. More detailed results can be found in the following chapter.

7. Results of the Validation

To compare the results of the different approaches for the description of the load-carrying capacity, the twelve test runs presented in Section 6 are used to calculate the damage sum D at failure. The damage sum is calculated according to the damage accumulation hypothesis according to Palmgren [35] and Miner [36]. The original form of the hypothesis (DAH Miner original) is used; therefore, loads beneath the endurance limit are not taken into account [37]. The reason for this choice is the design of the new approaches. All five concepts were designed to replace only the part of the S/N curve above the endurance limit. No changes were made to account for lower loads. Therefore, a damage accumulation hypothesis, including loads below the endurance limit, would negatively affect the comparability of the concepts. The use of this damage accumulation hypothesis is also the recommendation of standards [4,38,39,40] regarding the calculation of the service life of gears under variable loads. The resulting damage sum according to the different load-carrying capacity descriptions is given in Table 4.
The use of the S/N curve in combination with a damage accumulation hypothesis is common for calculating the service life of gears under variable loads [4]. In theory, failure should occur at a damage sum of D = 1 . In reality scattering spreads the damage sum at failure over a numerical range [41,42,43]. This poses a challenge for the design of gears. On the one hand, a certain level of reliability must be ensured [44]. On the other hand, the design of the gear should be as efficient as possible. Therefore, the calculated service life should be as accurate as possible, and the scattering range should be as small as possible. The evaluation of the different approaches considers two ranges of scattering:
  • The range of the damage sum at failure of all data points (total scattering);
  • The range of the damage sum at failure of the inner 50% of the data points.
For the calculation of the total scattering, one data point is excluded. The corresponding point failed at a damage sum of D = 2.455 according to the DAH Miner original based on the Basquin equation. This comparatively high damage sum causes a significant increase in the total scattering and, therefore, causes a less informative result regarding the other data points. Table 5 shows the results of the damage sums calculated using the different approaches. The reference for the results is the calculation using the Basquin equation, which represents the state of knowledge for the service life calculation of gears.
Overall, the results of all five approaches are comparable, and the differences are within a reasonable range. This corresponds to the expectations since the general shape of all approaches is similar (see Figure 5). The performance regarding the scattering of the inner 50% of the data points is decreased for all of the new approaches compared to the Basquin equation. For the total scattering, the Basquin equation is outperformed by the machine learning approaches using ensemble learning (−3.90%) and a neural network (−6.49%).
All five methods underestimate the average service life of the gears. Both the arithmetic means and the medians of the damage sum at failure are greater than one. This is not an unusual phenomenon. The actual damage sum at failure can deviate from one quite substantially. Therefore, a predicted damage sum at failure or a permissible damage sum has to be determined for the calculations. This damage sum depends, among other things, on the applied damage accumulation hypothesis. Through this approach, deviations within the calculations can be adjusted for. On the other hand, this does not influence the scattering of the damage sum at failure. For a reliable prediction of the service life of gears, the scattering should be as minimal as possible. The focus of the following evaluation is the scattering of the damage sums at failure according to the different approaches for the description of the load-carrying capacity.
For this evaluation, the data are processed to adjust the arithmetic mean of each method to one. Therefore, each data point of one method is divided by the arithmetic mean of all data points of this method. Based on this recalculation, it is possible to assess the ratio between the arithmetic mean of the damage sum at failure and the scattering of the damage sum at failure. The recalculated data are presented in Table 6.
When analyzing this interpretation of the data, it is interesting to notice that the Basquin equation is outperformed by each of the five new approaches in terms of total scattering. Focusing on the scattering of the inner 50%, the neural network, the third-degree polynomial, and the Gaussian process regression also result in lower scattering compared to the results based on the Basquin equation.
This approach to manipulating service life data is uncommon in service life calculations. It is used in this paper to better understand the differences between the methods. All five new approaches result in an increase in the average damage sum at failure (see Table 5). Therefore, these methods are more conservative than the Basquin equation. The results of the recalculated scattering show an important fact. The new approaches do not simply scale up the calculated damage sums. The new methods fundamentally change the weighting of different loads. Although the average damage sum is increased by 7.50% by using the neural network, the total scattering is decreased by 13.85% in relative terms.

8. Conclusion and Outlook

The scope of this paper was to investigate the potential of new approaches to describe the load-carrying capacity of gears. The Basquin equation was used as a reference, which is the state of knowledge for the description of the load-carrying capacity of gears. Five new methods have been developed within this paper. Four of them are based on machine learning, and one applies polynomial regression. All five methods produce applicable results.
The scattering of the results is one of the major aspects when evaluating a method for the service life calculation. With respect to this aspect, none of the new approaches can outperform the reference set by the Basquin equation. The approaches using support vector regression and a neural network result in a reduction in the total scattering but in an increase in the scattering of the inner 50% of the data points. When examining the relative scattering, the neural network, the third-degree polynomial, and the Gaussian process regression are able to outperform the Basquin equation.
This is quite an impressive result, considering that the database of only 31 points is quite small for the application of machine learning and that the evaluation of the performance was conducted with a different dataset. The training of the method was based on single load tests, and the validation was based on variable load tests. An alternative approach for the description of the load-carrying capacity would be the use of variable load data as training data for machine learning. Due to the increased requirements regarding the amount of data, this approach has not yet been successfully implemented. Another important step in proceeding with the research regarding this will be the application of the methods for real-world data on gears. Currently, the research focuses on test rig data because this type of data is more suitable for the investigation of the general suitability and the potential of the methods. This is due to the reduced number of influences on the service life and load-carrying capacity compared to real-world operating conditions.
The results of this paper show that there is potential for new approaches to describe the load-carrying capacity of gears. The ability of the presented approaches to better fit the experimental data is potentially beneficial for the service life calculation. Even a small increase in accuracy has the potential to increase the efficiency of the dimensioning of gears. This could result in overall cost savings and a reduction in the carbon footprint.
The potential of the presented methods goes far beyond the presented results. Increasing the amount of training data could improve the performance even more. In addition, it is possible to expand the methods to include variable load test data in the determination of an alternative S/N curve.
The potential reduction in the scattering of the calculated damage sum at failure can be especially significant for applications in the field of engineering. One example is the prediction of the remaining service life of gearboxes based on damage accumulation, as suggested by Foulard et al. [45,46]. For this prediction, the damage sum at failure has to be assumed by the engineer. The remaining service life is then calculated based on the ratio of the current damage sum and the assumed damage sum at failure. The scattering of the actual damage sum at failure decreases the accuracy of the prediction significantly. Therefore, the presented approaches create a potential for engineers to increase the accuracy of their service life calculations and predictions without being much more complex compared to the established approach.
The application of approaches based on machine learning and mathematical regression may seem more complex compared to the Basquin equation at first, but it is possible to create an automated program for the training and validation of different methods for the load-carrying capacity description. The user only needs to input the test data. Therefore, it is possible to implement the presented methods with the same or even less effort required by the engineer compared to the traditional approach.

Author Contributions

Conceptualization, D.V.; methodology, D.V.; software, D.V.; validation, D.V.; investigation, D.V.; writing, D.V.; supervision, J.P. and K.S. All authors have read and agreed to the published version of the manuscript.

Funding

The presented results are based on the research project STA 1198/19-1, supported by the German Research Foundation e.V. (DFG). The authors would like to thank the DFG for the sponsorship and support received.

Data Availability Statement

Data are contained within the article.

Conflicts of Interest

The authors declare no conflicts of interest.

Nomenclature

Unit
b Face widthmm
C Constant of the S/N curve-
c Coefficients of the polynomial-
D Damage sum-
F Pulsator forceN
k Slope of the S/N curve-
L LoadN/mm2 or N
m n Normal modulemm
N Number of endurable load cycles-
N D Number of load cycles at the knee point of the S/N curve-
Y F Form factor-
Y S Stress correction factor-
σ F 0 Tooth root stressN/mm2

References

  1. Niemann, G.; Winter, H. Machine Elements—Part 2 (In German: Maschinenelemente—Band 2: Getriebe Allgemein, Zahnradgetriebe—Grundlagen, Stirnradgetriebe), 2nd ed.; Springer: Berlin/Heidelberg, Germany, 2003. [Google Scholar]
  2. Basquin, O. The exponential law of endurance tests. In Proceedings of the Thirteenth Annual Meeting, Trenton, NJ, USA, 8 November 1910; pp. 625–630. [Google Scholar]
  3. ISO 6336-1:2019-11; Calculation of Load Capacity of Spur and Helical Gears—Part 1: Basic Principles, Introduction and General Influence Factors. ISO: Geneva, Switzerland, 2019.
  4. ISO 6336-6:2019-11; Calculation of Load Capacity of Spur and Helical Gears—Part 6: Calculation of Service Life under Variable Load. ISO: Geneva, Switzerland, 2019.
  5. Dong, Z.; Zhao, D.; Cui, L. An intelligent bearing fault diagnosis framework: One-dimensional improved self-attention-enhanced CNN and empirical wavelet transform. Nonlinear Dyn. 2024, 112, 6439–6459. [Google Scholar] [CrossRef]
  6. Zhao, D.; Wang, T.; Chu, F. Deep convolutional neural network based planet bearing fault classification. Comput. Ind. 2019, 107, 59–66. [Google Scholar] [CrossRef]
  7. Dong, Z.; Zhao, D.; Cui, L. Non-negative wavelet matrix factorization-based bearing fault intelligent classification method. Meas. Sci. Technol. 2023, 34, 115013. [Google Scholar] [CrossRef]
  8. Hein, M. Holistic Approach for Fatigue Life Design and Testing of Gearwheels (In German: Zur Ganzheitlichen Betriebsfesten Auslegung und Prüfung von Getriebezahnrädern). Ph.D. Thesis, Technical University of Munich, München, Germany, 2018. [Google Scholar]
  9. Tobie, T.; Matt, P. FVA 563 I—FVA Guideline: Recommendations for the Standardisation of Load Capacity Tests on Hardened and Tempered Cylindrical Gears; Research Association for Drive Technology (FVA): Frankfurt am Main, Germany, 2012. [Google Scholar]
  10. Wöhler, A. Report on the experiments carried out on the Royal Lower Silesian-Mark Railway with devices for measuring the bending and twisting of railroad car axles during travel. (In German: Bericht über die Versuche, welche auf der Königl. Niederschlesisch-Märkischen Eisenbahn mit Apparaten zum Messen der Biegung und Verdrehung von Eisenbahnwagen-Achsen während der Fahrt angestellt wurden). Z. Bauwes. 1858, 8, 641–678. [Google Scholar]
  11. DIN 50100:2022-12; Load Controlled Fatigue Testing—Execution and Evaluation of Cyclic Tests at Constant Load Amplitudes on Metallic Specimens and Components. DIN: Berlin, Germany, 2022.
  12. Hück, M. An improved procedure for the evaluation of staircase procedure tests (In German: Ein verbessertes Verfahren zur Auswertung von Treppenstufenversuchen). Z. Werkst. 1982, 14, 147–176. [Google Scholar]
  13. Müller, C.; Wächter, M.; Masendorf, R.; Esderts, A. Accuracy of fatigue limits estimated by the staircase method using different evaluation techniques. Int. J. Fatigue 2017, 100, 296–307. [Google Scholar] [CrossRef]
  14. Russell, S.J.; Norvig, P. Artificial Intelligence: A Modern Approach, 4th ed.; Pearson: Hoboken, NJ, USA, 2021. [Google Scholar]
  15. He, L.; Wang, Z.; Akebono, H.; Sugeta, A. Machine learning-based predictions of fatigue life and fatigue limit for steels. J. Mater. Sci. Technol. 2021, 90, 9–19. [Google Scholar] [CrossRef]
  16. Zhan, Z.; Li, H. A novel approach based on the elastoplastic fatigue damage and machine learning models for life prediction of aerospace alloy parts fabricated by additive manufacturing. Int. J. Fatigue 2021, 145, 106089. [Google Scholar] [CrossRef]
  17. Mudabbir, M.; Mosavi, A. Machine Learning for Modeling Service Life: Comprehensive Review, Bibliometrics Analysis and Taxonomy. In Proceedings of the 2023 IEEE 27th International Conference on Intelligent Engineering Systems (INES), Nairobi, Kenya, 26–28 July 2023; pp. 235–244. [Google Scholar] [CrossRef]
  18. Liu, D.P.; Ferri, G.; Heo, T.; Marino, E.; Manuel, L. On long-term fatigue damage estimation for a floating offshore wind turbine using a surrogate model. Renew. Energy 2024, 225, 120238. [Google Scholar] [CrossRef]
  19. Wilkie, D.; Galasso, C. Gaussian process regression for fatigue reliability analysis of offshore wind turbines. Struct. Saf. 2021, 88, 102020. [Google Scholar] [CrossRef]
  20. Karolczuk, A.; Słoński, M. Application of the Gaussian process for fatigue life prediction under multiaxial loading. Mech. Syst. Signal Process. 2022, 167, 108599. [Google Scholar] [CrossRef]
  21. Döbel, I.; Leis, M.; Vogelsang, M.; Neustroev, D.; Patzka, H.; Rüping, S.; Voss, A.; Wegele, M.; Welz, J. BMBF Nr. 01IS17019—Machine Learning—Competence, Applications and Research Deamnd (In German: Maschinelles Lernen—Kompetenzen, Anwendungen und Forschungsbedarf—Ergebnisbericht); Fraunhofer Society: Munich, Germany, 2018. [Google Scholar]
  22. The MathWorks, Inc. MATLAB Version 2023b. Available online: https://de.mathworks.com/products/matlab.html (accessed on 19 April 2024).
  23. The MathWorks, Inc. MATLAB Documentation—Fitrensemble. Available online: https://de.mathworks.com/help/stats/fitrensemble.html (accessed on 22 April 2024).
  24. The MathWorks, Inc. MATLAB Help Center—Fitrnet. Available online: https://de.mathworks.com/help/stats/fitrnet.html#mw_f074fe92-8d2f-48a0-b8f9-8c7d7a6ddf54 (accessed on 19 April 2024).
  25. Wang, J. An Intuitive Tutorial to Gaussian Process Regression. Comput. Sci. Eng. 2023, 25, 4–11. [Google Scholar] [CrossRef]
  26. Vietze, D.; Pellkofer, J.; Stahl, K. Non-Linear Analysis of Gear-Fatigue-Damage under Variable Load: 23FTM08. In Proceedings of the AGMA Fall Technical Meeting, FTM 2023, Detroit, MI, USA, 16–18 October 2023. [Google Scholar]
  27. Illenberger, C.; Tobie, T.; Stahl, K. FVA-Nr. 610/III—Booklet 1328—Gearing steel worldwide Part III (fina report) (In German: Zahnradstähle weltweit III—Abschlussbericht—Referenzwerte zur Zahnradtragfähgikeit moderner Zahnradstähle im Weltmarkt—Teil III); Forschungsvereinigung Antriebstechnik e.V.: Frankfurt am Main, Germany, 2019. [Google Scholar]
  28. Saddei, P.; Schurer, S.; Güntner, C.; Steinbacher, M.; Tobie, T.; Zoch, H.-W.; Stahl, K. IGF-Nr. 17903 N/2—FVA-Nr. 513/III—Heft 1248—Randschichtgefüge—Abschlussbericht—Alternative mehrphasige Randschichtgefüge beim Einsatzhärten zur Steigerung der Festigkeitseigenschaften von verzahnten Getriebebauteilen; Forschungsvereinigung Antriebstechnik e.V.: Frankfurt am Main, Germany, 2017. [Google Scholar]
  29. Weber, C.; Tobie, T.; Stahl, K. Rapid and Precise Manufacturing of Special Involute Gears for Prototype Testing: 19FTM20. In Proceedings of the AGMA Fall Technical Meeting, FTM 2019, Detroit, MI, USA, 14–16 October 2019. [Google Scholar]
  30. Bonaiti, L.; Rosa, F.; Rao, P.M.; Concli, F.; Gorla, C. Gear root bending strength: Statistical treatment of Single Tooth Bending Fatigue tests results. Eng. Res. 2022, 86, 251–258. [Google Scholar] [CrossRef]
  31. ISO 6336-3:2019-11; Calculation of Load Capacity of Spur and Helical Gears—Part 3: Calculation of Tooth Bending Strength: Corrected Version 2020-11. ISO: Geneva, Switzerland, 2019.
  32. The MathWorks, Inc. Machine Learning with MATLAB. 2022. Available online: https://de.mathworks.com/content/dam/mathworks/ebook/gated/machine-learning-ebook-all-chapters.pdf (accessed on 19 April 2024).
  33. The MathWorks, Inc. MATLAB Documentation—Fitrgp. Available online: https://de.mathworks.com/help/stats/fitrgp.html (accessed on 22 April 2024).
  34. The MathWorks, Inc. MATLAB Documentation—Fitrsvm. Available online: https://de.mathworks.com/help/stats/fitrsvm.html#buxgtub (accessed on 22 April 2024).
  35. Pålmgren, A. Service Life of Ball Gearings (In German: Die Lebensdauer von Kugellager). Z. Vereines Dtsch. Ingenieure 1924, 58, 339–341. [Google Scholar]
  36. Miner, M.A. Cumulative Damage in Fatigue. J. Appl. Mech. 1945, 12, 159–164. [Google Scholar] [CrossRef]
  37. Haibach, E. Operational Strength—Methods and Data for Calculation (In German: Betriebsfestigkeit—Verfahren und Daten zur Bauteilberechnung), 3rd ed.; Springer: Berlin/Heidelberg, Germany, 2006. [Google Scholar]
  38. DIN 3990-6:1994-12; Calculation of Load Capcity of Cylindrical Gears—Part 6: Calculation of Service Strength. DIN: Berlin, Germany, 1994.
  39. DNVGL-CG-0036:2015-12; Calculation of Gear Rating for Marine Transmissions. DNVGL: Bærum, Norway, 2015.
  40. ANSI/AGMA 2101-D04; Fundamental Rating Factors and Calculation Methods for Involute Spur and Helical Gear Teeth. AGMA: Alexandria, VA, USA, 2004.
  41. Stahl, K.; Michaelis, K.; Höhn, B.-R.; Winter, H. IGF-Nr. 11154, FVA-Nr. 304—Booklet 580—Service Life Statistics (Final Report) (In German: Lebensdauerstatistik—Statistische Methoden zur Beurteilung von Bauteillebensdauer und Zuverlässigkeit und ihre Beispielhafte Anwendung auf Zahnräder); Research Association for Drive Technology (FVA): Frankfurt, Germany, 1999. [Google Scholar]
  42. Geitner, M.; Tobie, T.; Stahl, K. FVA-Nr. 610 IV—Booklet 1432—Materials 4.0 (Final Report) (In German: Werkstoffe 4.0—Erweiterte Datenanalyse zur Bewertung des Einflusses von Werkstoff und Wärmebehandlungseigenschaften auf die Zahnradtragfähigkeit); Research Association for Drive Technology (FVA): Frankfurt, Germany, 2021. [Google Scholar]
  43. Götz, S.; Eulitz, K.-G. Fatgiue Life Analysis (In German: Betriebsfestigkeit), 2nd ed.; Springer: Berlin/Heidelberg, Germany, 2022. [Google Scholar]
  44. Gudehus, H.; Zenner, H. Guideline for Fatigue Life Analysis (In German: Leitfaden für eine Betriebsfestigkeitsrechnung), 4th ed.; Verlag Stahleisen: Düsseldorf, Germany, 1999. [Google Scholar]
  45. Foulard, S.; Rinderknecht, S.; Ichchou, M.; Perret-Liaudet, J. Real-time and online lifetime monitoring of automotive transmissions: Determining of the remaining lifetime of transmission components with the aid of torque measure. In Proceedings of the International Conference on Gears: VDI-Berichte 2199, München, Germany, 7–9 October 2013. [Google Scholar]
  46. Foulard, S.; Rinderknecht, S.; Perret-Liaudet, J.; Ichchou, M. Online and real-time damage calculation in automotive transmissions Application to remaining service life estimation. In Proceedings of the International Gear Conference 2014: Conference Proceedings Volume II, Lyon Villeurbanne, France, 26–28 August 2014; pp. 933–949. [Google Scholar]
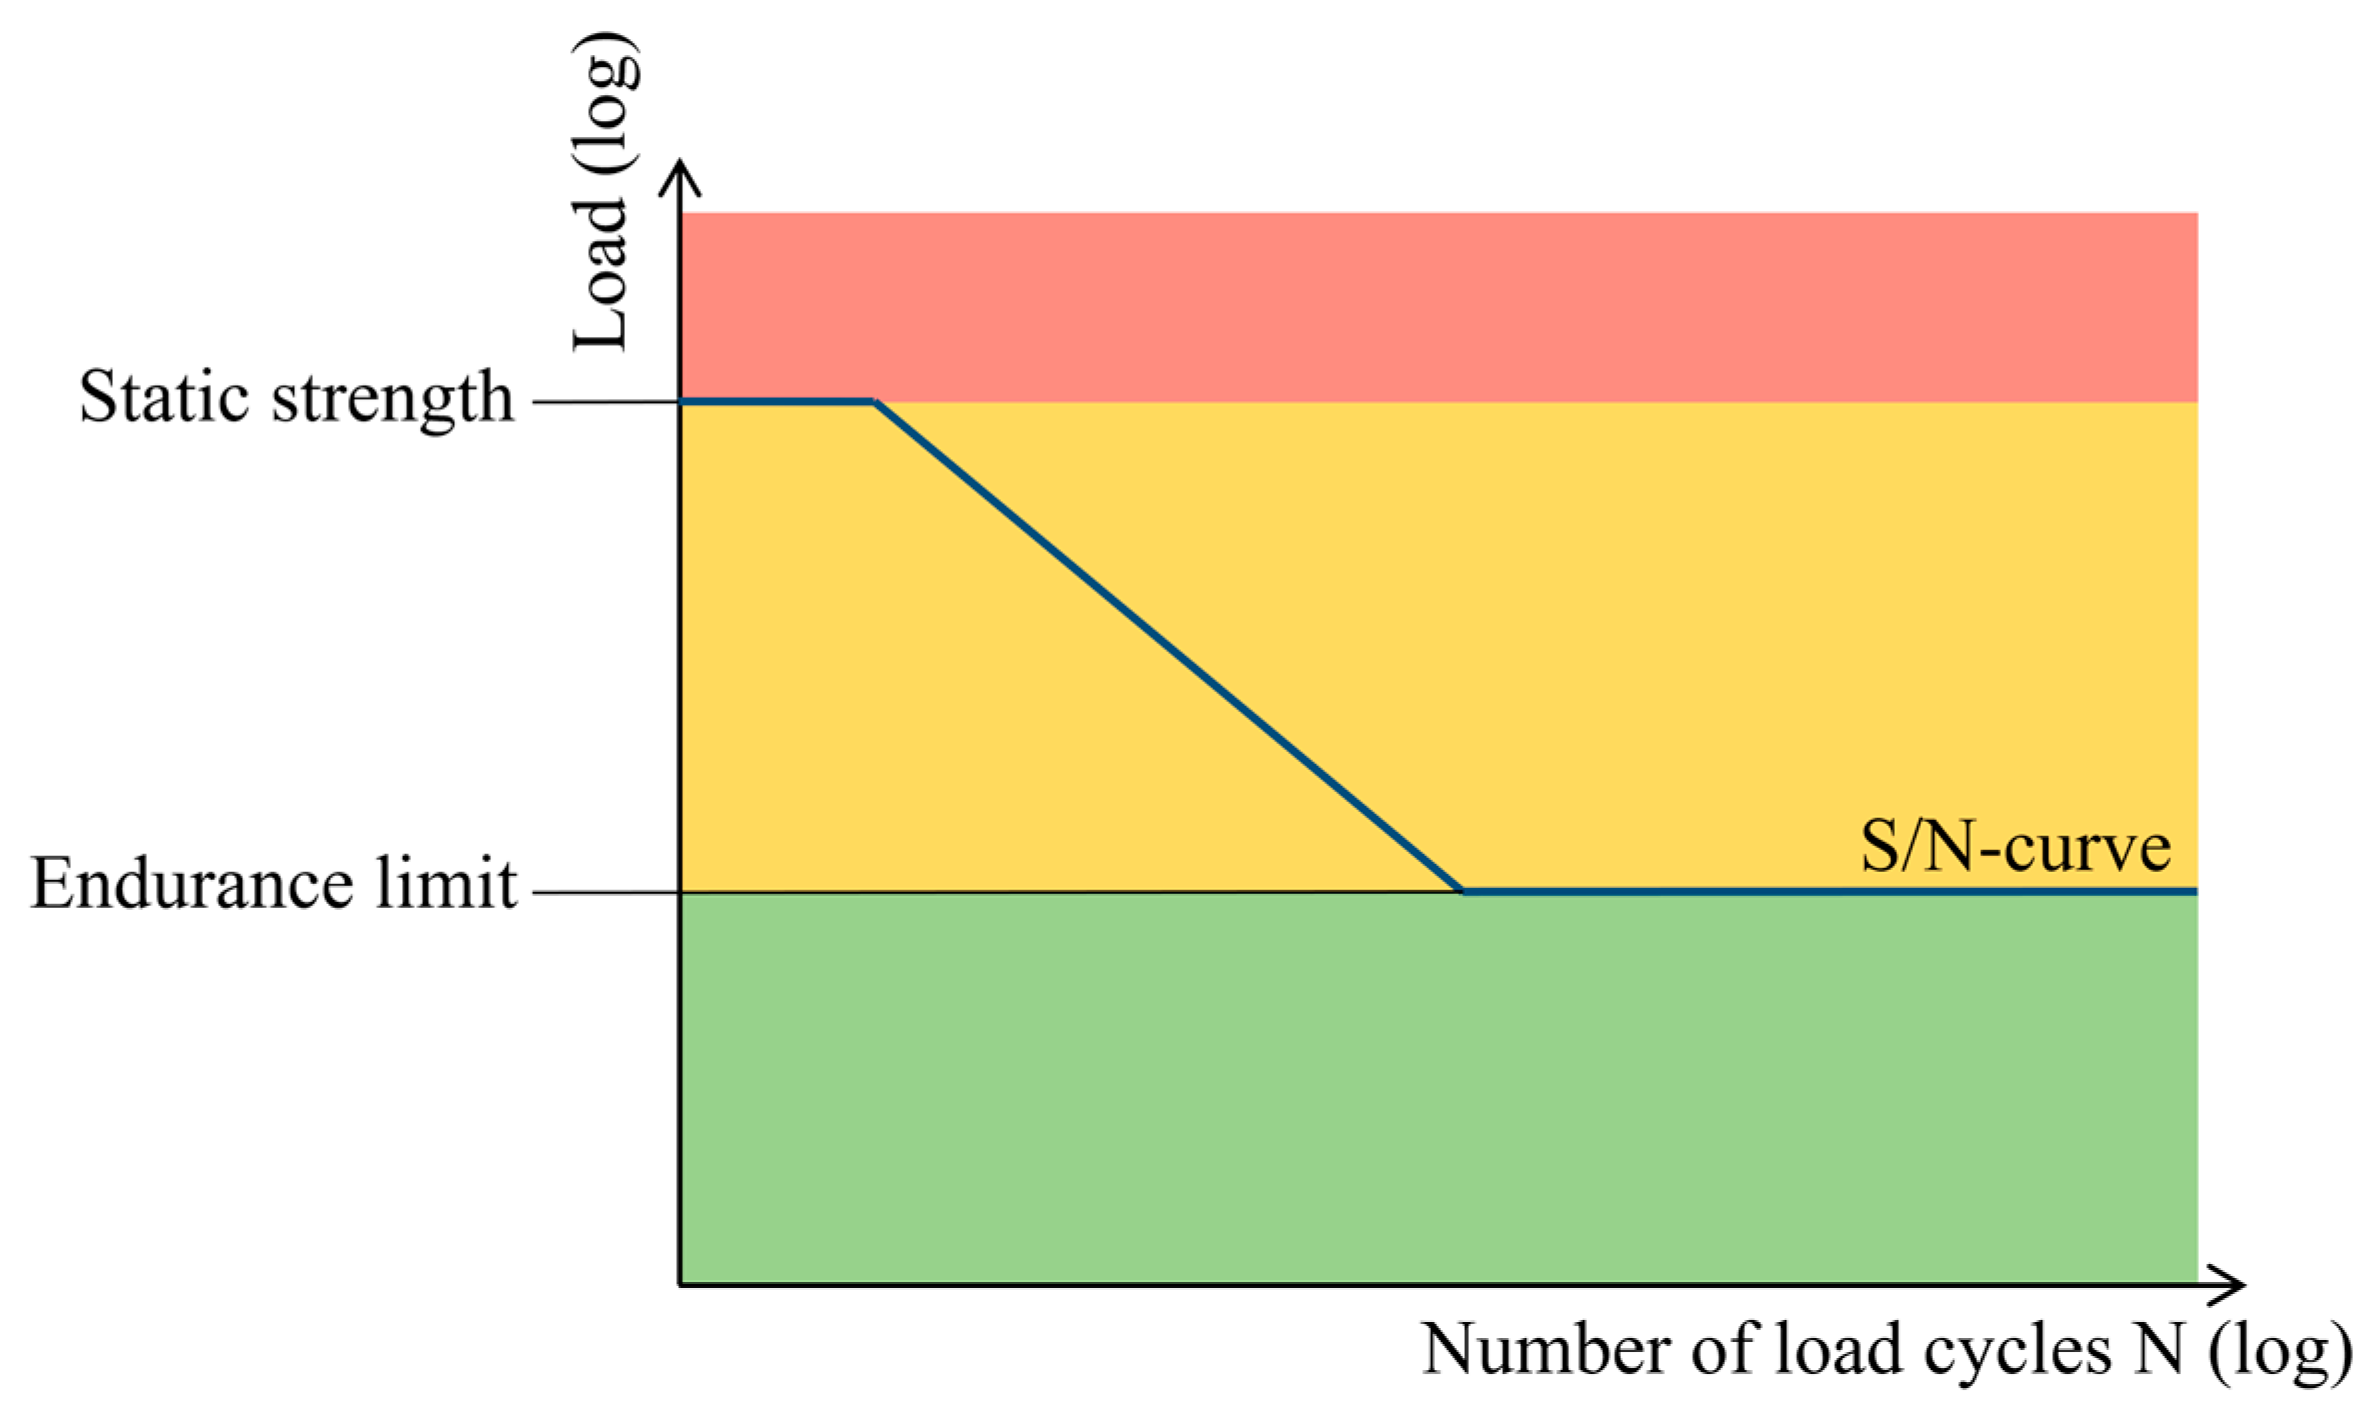
Figure 1. Schematic presentation of a S/N curve.
Machines 12 00304 g001
Figure 2. Comparison of different S/N curves in logarithmic (a) and linear (b) scale.
Machines 12 00304 g002
Figure 3. Pulsator test rig at FZG.
Machines 12 00304 g003
Figure 4. S/N curve of the gears, including all test points with constant load.
Machines 12 00304 g004
Figure 5. Alternative descriptions of the load-carrying capacity, based on (a) a third-degree polynomial, (b) a SVR, (c) a random forrest, (d) a neural network and (e) a gaussian process regression.
Machines 12 00304 g005
Figure 6. Results of the first test run with variable loads.
Machines 12 00304 g006
Figure 7. Results of the second test run with variable loads.
Machines 12 00304 g007
Figure 8. Results of the third test run with variable loads.
Machines 12 00304 g008
Figure 9. Results of the fourth test run with variable loads.
Machines 12 00304 g009
Table 1. Basic test gear data.
GearSpur Gear
Normal   module   m n 5 mm
Number of teeth24
Face   width   b 20 mm
MachiningMilling and grinding
MaterialSteel 18CrNiMo7-6
Heat treatmentCase-hardened
Table 2. Data of the S/N curve.
Endurance limit1375.81 N/mm2
Slope k6.33
Constant C6.90 × 1024
Table 3. Coefficients c 0 c 3 of the third-degree polynomial.
c 0 2274.519
c 1 −0.033
c 2 4.067 × 10⁻⁷
c 3 −1.697 × 10⁻¹²
Table 4. Damage sums resulting from the test runs with variable load.
Data PointDamage Sum According to DAH Miner Original Calculated with the Load-Carrying Description Based On
BasquinPolynomialSVRRFNNGPR
10.6990.8060.7860.7710.7890.779
21.0171.1871.1731.1561.1791.161
31.0631.2411.2321.2161.2411.226
40.8030.8930.8760.8270.8470.849
50.7790.8650.8470.8020.8240.821
61.4621.6071.5931.5131.5121.583
71.0911.1721.2181.1191.1111.152
81.2631.3471.4121.3091.2951.325
91.4731.5511.6391.5101.5051.511
100.9921.0921.0641.0901.0621.096
112.4552.6962.7022.7782.6982.751
121.2791.4101.4171.4621.4211.450
Table 5. Analysis of the results.
Arithmetic MeanMedianScattering
(Inner 50%)
Total
Scattering
Basquin1.201.080.47Reference0.77Reference
Polynomial1.321.210.49+4.26%0.80+3.90%
SVR1.331.230.54+14.89%0.85+10.39%
RF1.301.200.53+12.77%0.74−3.90%
NN1.291.210.51+8.51%0.72−6.49%
GPR1.311.190.51+8.51%0.80+3.90%
Table 6. Analysis of the relative results.
Arithmetic MeanMedianScattering
(Inner 50%)
Total
Scattering
Basquin1.000.900.40Reference0.65Reference
Polynomial1.000.920.37−7.50%0.61−6.15%
SVR1.000.920.40±0%0.64−1.54%
RF1.000.920.41+2.50%0.57−12.31%
NN1.000.940.39−2.50%0.56−13.85%
GPR1.000.910.39−2.50%0.61−6.15%
Disclaimer/Publisher’s Note: The statements, opinions and data contained in all publications are solely those of the individual author(s) and contributor(s) and not of MDPI and/or the editor(s). MDPI and/or the editor(s) disclaim responsibility for any injury to people or property resulting from any ideas, methods, instructions or products referred to in the content.