Perspective

Towards Customer Outcome Management in Smart Manufacturing

1
Department of Industrial Engineering and Innovation Sciences, Eindhoven University of Technology, 5612 AZ Eindhoven, The Netherlands
2
Eviden Digital Transformation Consulting, 1185 MC Amstelveen, The Netherlands
3
Faculty of Economics and Business, Katholieke Universiteit Leuven, 3000 Leuven, Belgium
4
Department of Advanced Computing Sciences, Maastricht University, 6211 LK Maastricht, The Netherlands
5
Ulsan National Institute of Science and Technology, Ulsan 44919, Republic of Korea
6
IBM Almaden Research Center, San Jose, CA 95120, USA
*
Author to whom correspondence should be addressed.
Machines 2023, 11(6), 636; https://doi.org/10.3390/machines11060636
Submission received: 11 April 2023 / Revised: 14 May 2023 / Accepted: 6 June 2023 / Published: 7 June 2023
(This article belongs to the Topic Smart Manufacturing and Industry 5.0)

Abstract

:
The outcome economy is a relatively new economic and business paradigm that promotes focusing on the effects that the use of provided products and services create for customers in their markets, rather than focusing on these products or services themselves from the providers’ perspective. This paradigm has been embraced in various fields of business but has not yet been fully integrated with the concept of smart industry. To fill this gap, in this vision paper we provide a framework that does make this integration, showing the full structure of customer outcome management in smart manufacturing, from both business and digital technology perspectives. In applying this structure, a feedback loop is created that spans the markets of provider and customer and supports data-driven product evolution, manufacturing, and delivery. We propose a business reference framework that can be used as a blueprint for designing practical scenarios. We show how integrated digital support for such a scenario can be realized using a well-structured combination of technologies from the fields of the internet of things, business intelligence and federated learning, blockchain, and business process management. We illustrate all of this with a visionary case study inspired by industrial practice in the automotive domain. In doing so, we provide both an academic basis for the integration of several currently dispersed research fields that need to be integrated to further smart manufacturing towards outcome management and a practical basis for the well-structured design and implementation of customer outcome management business cases in smart manufacturing.

1. Introduction

In the current economy, we see a major trend towards outcome thinking that is causing an essential shift of focus for many business organizations. In a traditional business-to-business supply chain setting, producers deliver products (or combinations of products and services) to their customers. The producers focus on optimizing the quality of their products to their standards, and the customers are responsible for using these products to their best advantage. This often causes a mismatch between what is delivered to the customers and what they need to strengthen their own market position. In the new setting known as the outcome economy, customers expect producers to deliver their products so that they directly contribute to their success in their market. In other words, producers are expected to create value by delivering solutions to customers that in turn lead to quantifiable results for these customers [1]: their outcomes. In this vision paper, we apply outcome economy thinking to the domain of smart manufacturing. Below, we first further explain the context and goal of this paper. Next, we discuss the approach taken to achieve this goal and the structure of this paper that follows from this approach.

1.1. Context and Goal of This Paper

In this paper, we focus on the business paradigm of outcome management for customers in the advanced manufacturing domain, which we label customer outcome management in smart manufacturing (abbreviated as COM in SM). Moving from delivering products to delivering outcomes to customers opens a wealth of new business opportunities in the manufacturing domain. It means that a manufacturer does not limit itself to providing its customers with products, leaving it to the customers to use these products to become successful in their markets. Rather, a manufacturer is actively engaged in generating success for its customers. Thus, it creates a closer relationship with these customers. Apart from this improved relationship, the customer outcome management paradigm provides the manufacturer with direct information about the effects of the use of its products. This opens doors for data-driven product evolution and innovation.
The need for outcome thinking in manufacturing has already been recognized [2], but its adoption in practice is lagging behind more service-oriented domains. This is understandable to some degree, as the manufacturing domain is a very “physical” domain by nature and outcome thinking moves the focus partly away from the physical product. To support the introduction of outcome thinking into manufacturing scenarios, we present a visionary business framework in this paper. This framework aids in a structured exploration, design, and realization of outcome-oriented business mechanisms in smart manufacturing. In our work, we interpret the term “smart manufacturing” in the broad sense, i.e., including both the product design, actual product manufacturing, and after-sales service aspects. The framework that we propose is a blueprint that does not solve all detailed problems in the adoption of an outcome orientation in manufacturing practice but that provides a well-structured basis for making the first steps.
When moving from selling products to selling outcomes, it is essential to establish the “amount of outcome” generated by the use of products—this will be the basis of the compensation of the producer by the customer. To quantify these results of customer outcome management, i.e., to measure and report these outcomes, digital technology comes into play. Outcome management requires data-driven business management, which acquires an increasingly real-time character in modern business settings. Therefore, internet and internet of things (IoT) technologies are used to capture data in the customer context. Additionally, business intelligence (BI) technologies are used to transform this data into actionable information in the provider context. Other digital technologies, such as blockchain and federated learning, are used to create a basis for trust in the processing of data, as these data reflect essential business characteristics of involved organizations. Business process management technology (BPM) comes into play to support the structured execution of processes that generate outcomes. All in all, customer outcome management is a typical example of required integration of diverse digital technologies to realize complex business goals. Just a single technology class does not provide a complete solution [3,4]. In this paper, we discuss this kind of digital technology integration in the context of customer outcome management in the smart manufacturing domain.

1.2. Approach for and Structure of This Paper

To support customer outcome management best and use digital technology in an optimal way, the business paradigm point of view and the digital technology point of view (as discussed above) cannot be seen independently: they are strongly connected. In other words, in a complex setting such as customer outcome management in smart manufacturing, we need a holistic framework to carefully balance the pull of requirements from the business perspective with the push of technology from the IT perspective. This allows us to achieve the optimal development of digitally enabled business operations [5].
The attention to the outcome economy concept in existing literature, however, mainly focusses on the business strategy level in a descriptive way [1,2,6]. For example, managerial guidelines to set up outcome-based collaboration have been researched [7,8]. When outcome thinking needs to be translated, however, into actual operational, data-driven business structures, a proper operationalization of the outcome economy concept is still lacking. A reference design guideline for its operational implementation is needed, both in business and in information technology terms.
In this paper, we discuss the construction of this design guideline for customer outcome management in smart manufacturing (COM in SM), following the approach shown in Figure 1. In this figure, we see the main four steps taken in the approach. As the first step, we have selected the basis for our work, i.e., the starting ingredients. These are formed by the concept of the outcome economy, the concept of cybernetic control, and a value chain model. This basis is next integrated in two sub-steps. First, we construct a general model for customer outcome management, using prior exploratory work [9]. Then, we specialize this towards the domain of smart manufacturing. In the third step, we enrich the model in consecutive sub-steps with respect to three aspects that are essential to operationalize the model towards application in industrial practice. These aspects are reactivity, intelligence, and trust. For each aspect, we first look at the concept, then map this to concrete digital technology. In the fourth step, all the foregoing is operationalized into a set of reference tools that consists of a reference model and a reference architecture. This set embodies the reference design guideline for COM in SM. Throughout the second to the fourth step, we illustrate the models developed by means of a case study that is inspired by a real-world case in the domain of automotive manufacturing.
The developed reference model and reference architecture help define business relations between organizations and positioning data capture and data-processing technologies for the data-driven business execution required by the outcome paradigm. They also provide the basis for the first step in digital operationalization of the paradigm. In other words, with these tools we lay the foundation of the digital transformation of a manufacturing organization towards customer outcome management.
This paper is structured as follows. In Section 2, we discuss related work and position our work in the RAMI4.0 reference model for smart industry, addressing Steps 1a and 1b of Figure 1. In Section 3, we introduce the business outcome management paradigm by means of a multi-stage cybernetic model, addressing Step 2a. In this section, we also introduce our smart industry example case scenario, which we use throughout the paper to illustrate introduced models (Step 5). We specialize the cybernetic model towards the smart manufacturing domain in Section 4 by linking the model to Porter’s value chain model (Steps 1c and 2b). In the next three sections, we operationalize the conceptual cybernetic model by infusing three operational aspects essential to customer outcome management (Step 3). We show how specific information technology classes provide functionality for these aspects. In Section 5, we show how sensor technology of different kinds supports the aspect of reactivity (Steps 3a and 3b). In Section 6, we discuss how business intelligence (BI) and artificial intelligence (AI) technologies support the aspect of intelligence (Steps 3c and 3d). In Section 7, we show how the aspect of trust in a customer outcome management setting can be supported by blockchain and federated learning technologies (Steps 3e and 3f). Throughout the entire paper, we lean on business process management (BPM) technology for the enactment of business processes—we do not allocate a specific section to BPM. In Section 8, we process all of this into a reference model and reference architecture for customer outcome management in smart industry, addressing Step 4 of our approach. We end the paper with conclusions and an outlook in Section 9.

2. Related Work and Positioning

The outcome economy concept has attracted substantial attention from industrial practice and academic research in recent years [1,2,6,7,8]. We see, however, that the focus is often either on the business side or on the technology side, paying little attention to the required operational interplay between these two perspectives. It is this interplay that is the basis for the framework presented in the current paper. Our previous work [9] takes the first steps towards the required integration of business and IT aspects in outcome engineering. In the current paper, we heavily extend this work and specialize it towards smart manufacturing.
One way to analyze the field of outcome management from a business perspective is to look at contracts between a provider and a customer in an outcome setting [7]. In outcome-based contracts, the remuneration of a provider by a customer is defined based on the realized outcomes. The payment is not for the product, nor for the use of the product, but for the positive effects of the use of the product. This is in stark contrast to many current scenarios in the manufacturing domain, where the customer either pays for the ownership of the product (a traditional product sales scenario) or for the use of the product (a traditional leasing scenario), irrespective of what the product actually brings in terms of business advantage for the customer. There are examples, however, of a shift towards outcome management. An illustrative example from the manufacturing domain can be found in the aircraft engine industry, where settings are explored in which actual performance of engines is sold instead of the physical product [6]. We see examples in other industries, as well. In the financial industry, we see the emergence of pay-for-effect contracts, such as companies that detect double payments in financial records [10] and are compensated with a share of the hence-saved money.
Outcome management is also studied from the perspective of business model innovation. From this perspective, outcome management can be seen as a mechanism of value creation and value capture [8]. Often, academic work from this perspective stays at the strategic (or sometimes tactical) level of business innovation. This kind of work does not provide explicit structures for realization at the operational level, let alone blueprints for the involvement of advanced information technology. In the industrial transport and logistics domains, business models are explored in which the effects of data analytics services on transport efficiency are sold instead of the services themselves [11]. This is an operationalization of outcome-based contracts [7] as discussed above. On a more strategic level, work on the customer-activated enterprise [12] shares some aspects with outcome thinking, as it proposes concepts to use customer input to decide what a provider should deliver.
On the technology-inspired side, we find work on using the internet of things (IoT) and edge computing to measure performance indicators and outcomes. In a manufacturing context, this can be coupled with developments in the field of data-driven smart manufacturing [13] and the industrial internet of things (IIoT) [14]. Some work exists that mentions the link between the IIoT and the outcome economy [15] or the link between the IIoT and business models [16]. To the best of our knowledge, however, there is no work available that presents a structured way to implement this link from an engineering perspective.
Between customer value management and deployment of digital technology, we find approaches that model the value of technology. For example, in the service value modeling approach [17], the business value of industry solutions is analyzed. Even though this work also mentions “outcomes”, the term is used in a more general sense to denote strategic customer benefits. This is different from the way the term is used in outcome economy thinking (and the current paper) to denote the main “object of transaction” in the operational relation between a provider and a customer.
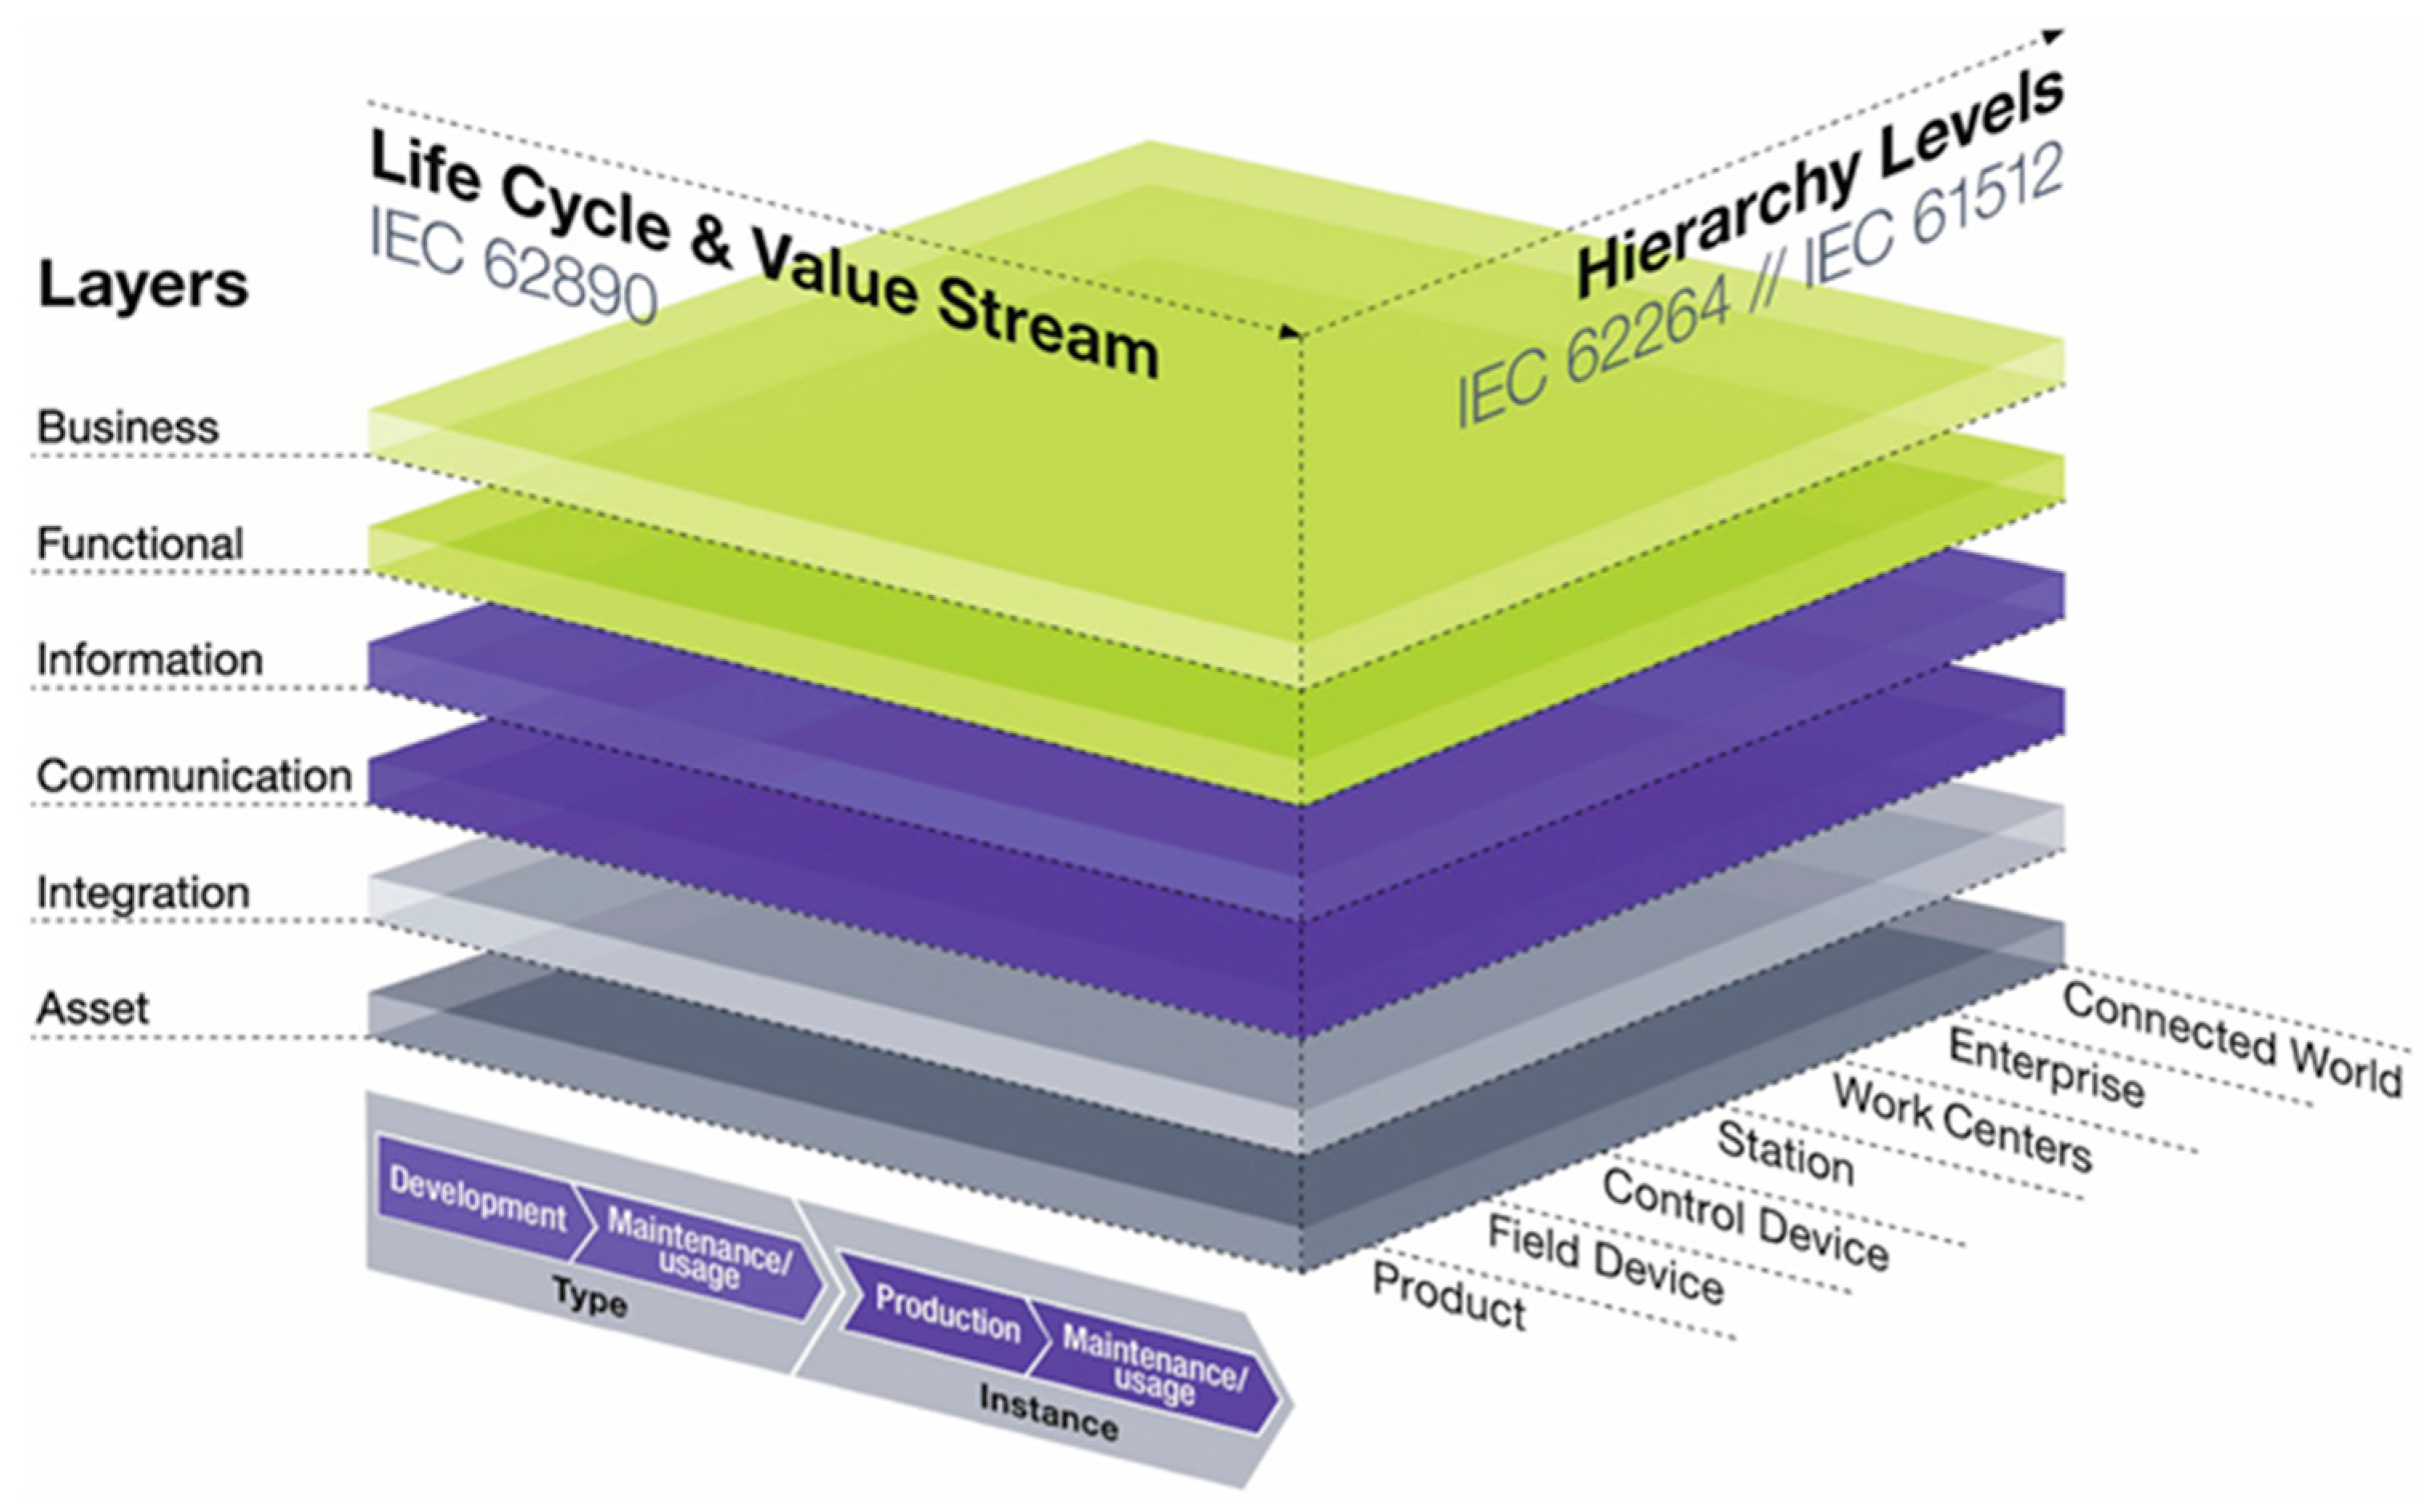
In this paper, we focus on outcome management in smart manufacturing. The field of smart manufacturing is a subfield of smart industry. There is too much general work (i.e., not focused on outcome thinking) on smart manufacturing and smart industry to review in this paper. We do, however, explicitly use the well-known RAMI4.0 reference model for smart industry to position our vision. RAMI4.0 [18] is a leading standard framework for organizing various dimensions used to structure concepts and developments in smart manufacturing. RAMI4.0 is typically illustrated by the three-dimensional cube shown in Figure 2.
As shown in the figure, the three dimensions in RAMI4.0 are labeled layers, life cycle and value stream and hierarchy levels. The layers dimension “represents the information that is relevant to the role of an asset”. It covers the business-to-technology spectrum by relating different aspects of a manufacturing asset to layers of the enterprise architecture. The life cycle and value stream dimension “represents the lifetime of an asset and the value-added process”. This axis distinguishes between the type and instance of a production system and its elements, such as the digital design of a product and its instantiation as a manufactured product. The hierarchy levels dimension is used to “assign functional models to specific levels” of an enterprise. This axis uses aggregation to establish enterprise levels, ranging from the connected world (i.e., networks of manufacturing organizations in their eco-systems) via stations (manufacturing work cells) to devices and products. The hierarchy levels dimension is related to the ISA-95 manufacturing hierarchy standard [19]. The connected world level is introduced above the enterprise level of ISA-95 to emphasize the importance of supply chain networks in Industry 4.0.
The work in this paper is positioned along the entire life cycle and value stream dimension of RAMI4.0. In the hierarchy levels dimension, we explicitly cover the connected world to work centers levels of a manufacturer in our control model, but the actual implementation of outcome management mechanisms typically involves lower levels as well. If we also use this dimension for the product use environment (on the consumer side), our scope is larger: we cover the control device to connected world levels. Obviously, the connected world level is of paramount importance for the work in this paper, as we focus on inter-organizational process control. In the layers dimension, we mainly focus on the business to communication layers, though the two lower layers are implicitly of importance too.

3. The Business Outcome Management Paradigm

In this section, we discuss the business outcome paradigm. As follows from the discussion in the previous section, existing work on the paradigm is not based on a conceptual, holistic view. To realize this view, we start with the development of conceptual model that is the basis for the well-structured incorporation of both business and technological aspects. We do this from an engineering perspective by using a cybernetic model as the basis for our approach [9]. First, we discuss a single-stage model that represents cybernetic control of a single organization. Then we extend this to a multi-stage model (i.e., an abstraction of a supply chain) with outcome-based control. We end this section with the presentation of the case study that we use to illustrate the topics in the next sections.

3.1. Single-Stage Cybernetic Model

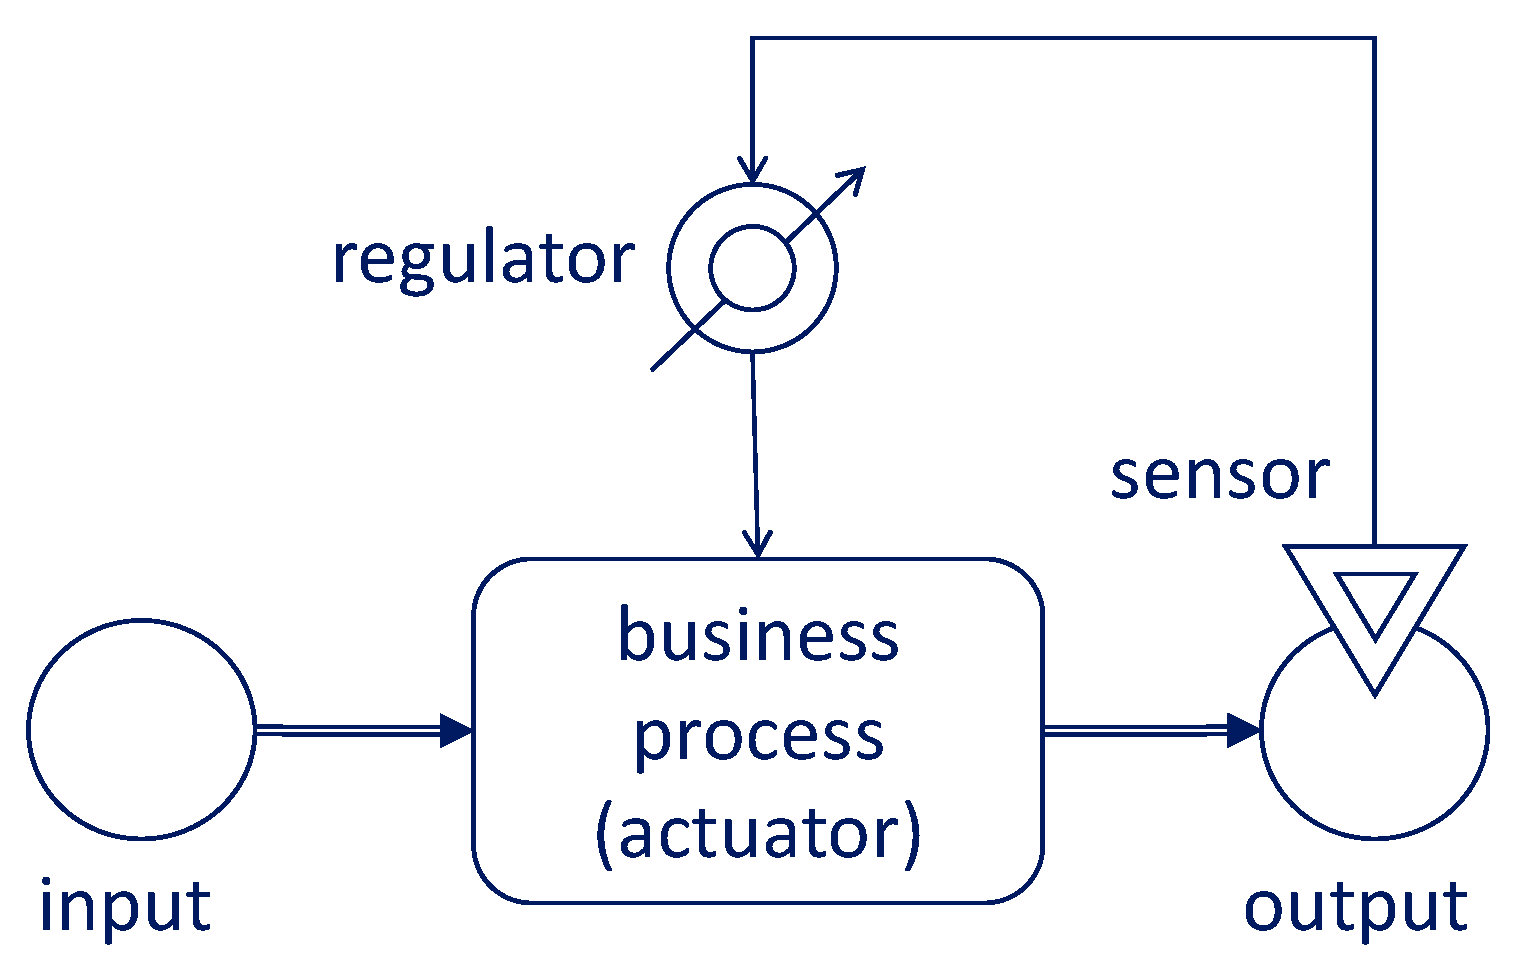
In traditional systems engineering [20] applied to business design [21], we typically find single-stage cybernetic models for control of the production process of products or services only within the scope of the producing organization. Such a model is often used for quality control purposes. This model is shown in Figure 3, which is easily mappable to the control systems in traditional approaches [20].
In the model, we see a business process that represents the production of goods or services by an organization. It consumes input consisting of combinations of raw materials, parts, and possibly input services. It produces output in the form of products or services for acquisition by customers. Quality characteristics of the output are measured by a sensor element (depicted by the double triangle in the figure). This may be an automated sensor but may also be a manual inspection procedure. The output of the sensor is processed by a regulator element (depicted by the double circle with arrow in the figure) to create instructions for the business process whenever the quality level of the produced product or service needs to be adjusted. Instructions may be explicit in the form of commands or implicit in the form of parameter values for the execution of the business process. As such, the business process acts as the actuator in the control loop.

3.2. Multi-Stage Cybernetic Model

When we use the cybernetic model for a chain of organizations (i.e., a supply chain), we obtain a model such as the one shown in Figure 4. This model shows a simple chain with only two organizations: the provider organization that produces and supplies goods or services and the customer organization that consumes these. The model can be extended to a supply chain of arbitrary length in which each predecessor organization provides to its successor organization. This does not change the principles of our approach.
In the cybernetic model in Figure 4, each organization has its own feedback loop to control the quality of its own business process, focused on its own market. Consequently, it observes the quality of its own output, but not the quality of the output of its customer. This implies that the focal organization is unaware of the performance of the customer organization in its market. To implement outcome thinking in this model (as introduced in Section 1), we need to make the focal organization aware of this performance. We do this by introducing an additional feedback loop across the organizations to create a two-stage cybernetic model with a chain-level feedback mechanism, i.e., a customer outcome management model. This model is shown in Figure 5 (omitting the local feedback loops of Figure 4 for reasons of clarity). In this model, the provider is directly aware of the effects of its products in the market of the customer: the customer outcomes. These customer outcomes are measured by the sensor in the market of the customer, which measures the “outcome key performance indicators”. These we call outcome performance indicators or OPIs for short.
In the figure, we see that the output (which is the achievement of the desired outcome) is produced by two actuators in a sequential configuration: that of the provider and that of the customer. Both actuators are business process-based: it is the operation of the firm that actuates. For smart manufacturing processes to be controlled in a structured way, they should be built using business process management (BPM) principles [22,23]. In this paper, we focus on the actuator formed by the provider business process, as we focus on smart manufacturing scenarios in which a provider produces products that are the basis for customer outcome realization.
Outcomes can be measured using various frameworks and standards. For instance, in the framework domain, Van Looy et al. [24] provide a general framework of typical performance metrics used in organizations. In the standards domain, the ISO 22400 standard provides a reference of key performance indicators (KPIs) for production systems [25,26].

3.3. The Example HBM Case Study

As a case study for the next sections of this paper, we look at a fictive (but real-world-inspired) manufacturer of hybrid-drive buses for inner-city passenger transport. As this paper is a vision paper (i.e., forward-looking), it is not based on experiences with a specific case (i.e., backward-looking), but on the general experience in the author team in both the automotive industry [27,28] and the smart mobility domain [29,30]. We label the company HBM (Hybrid Bus Makers).
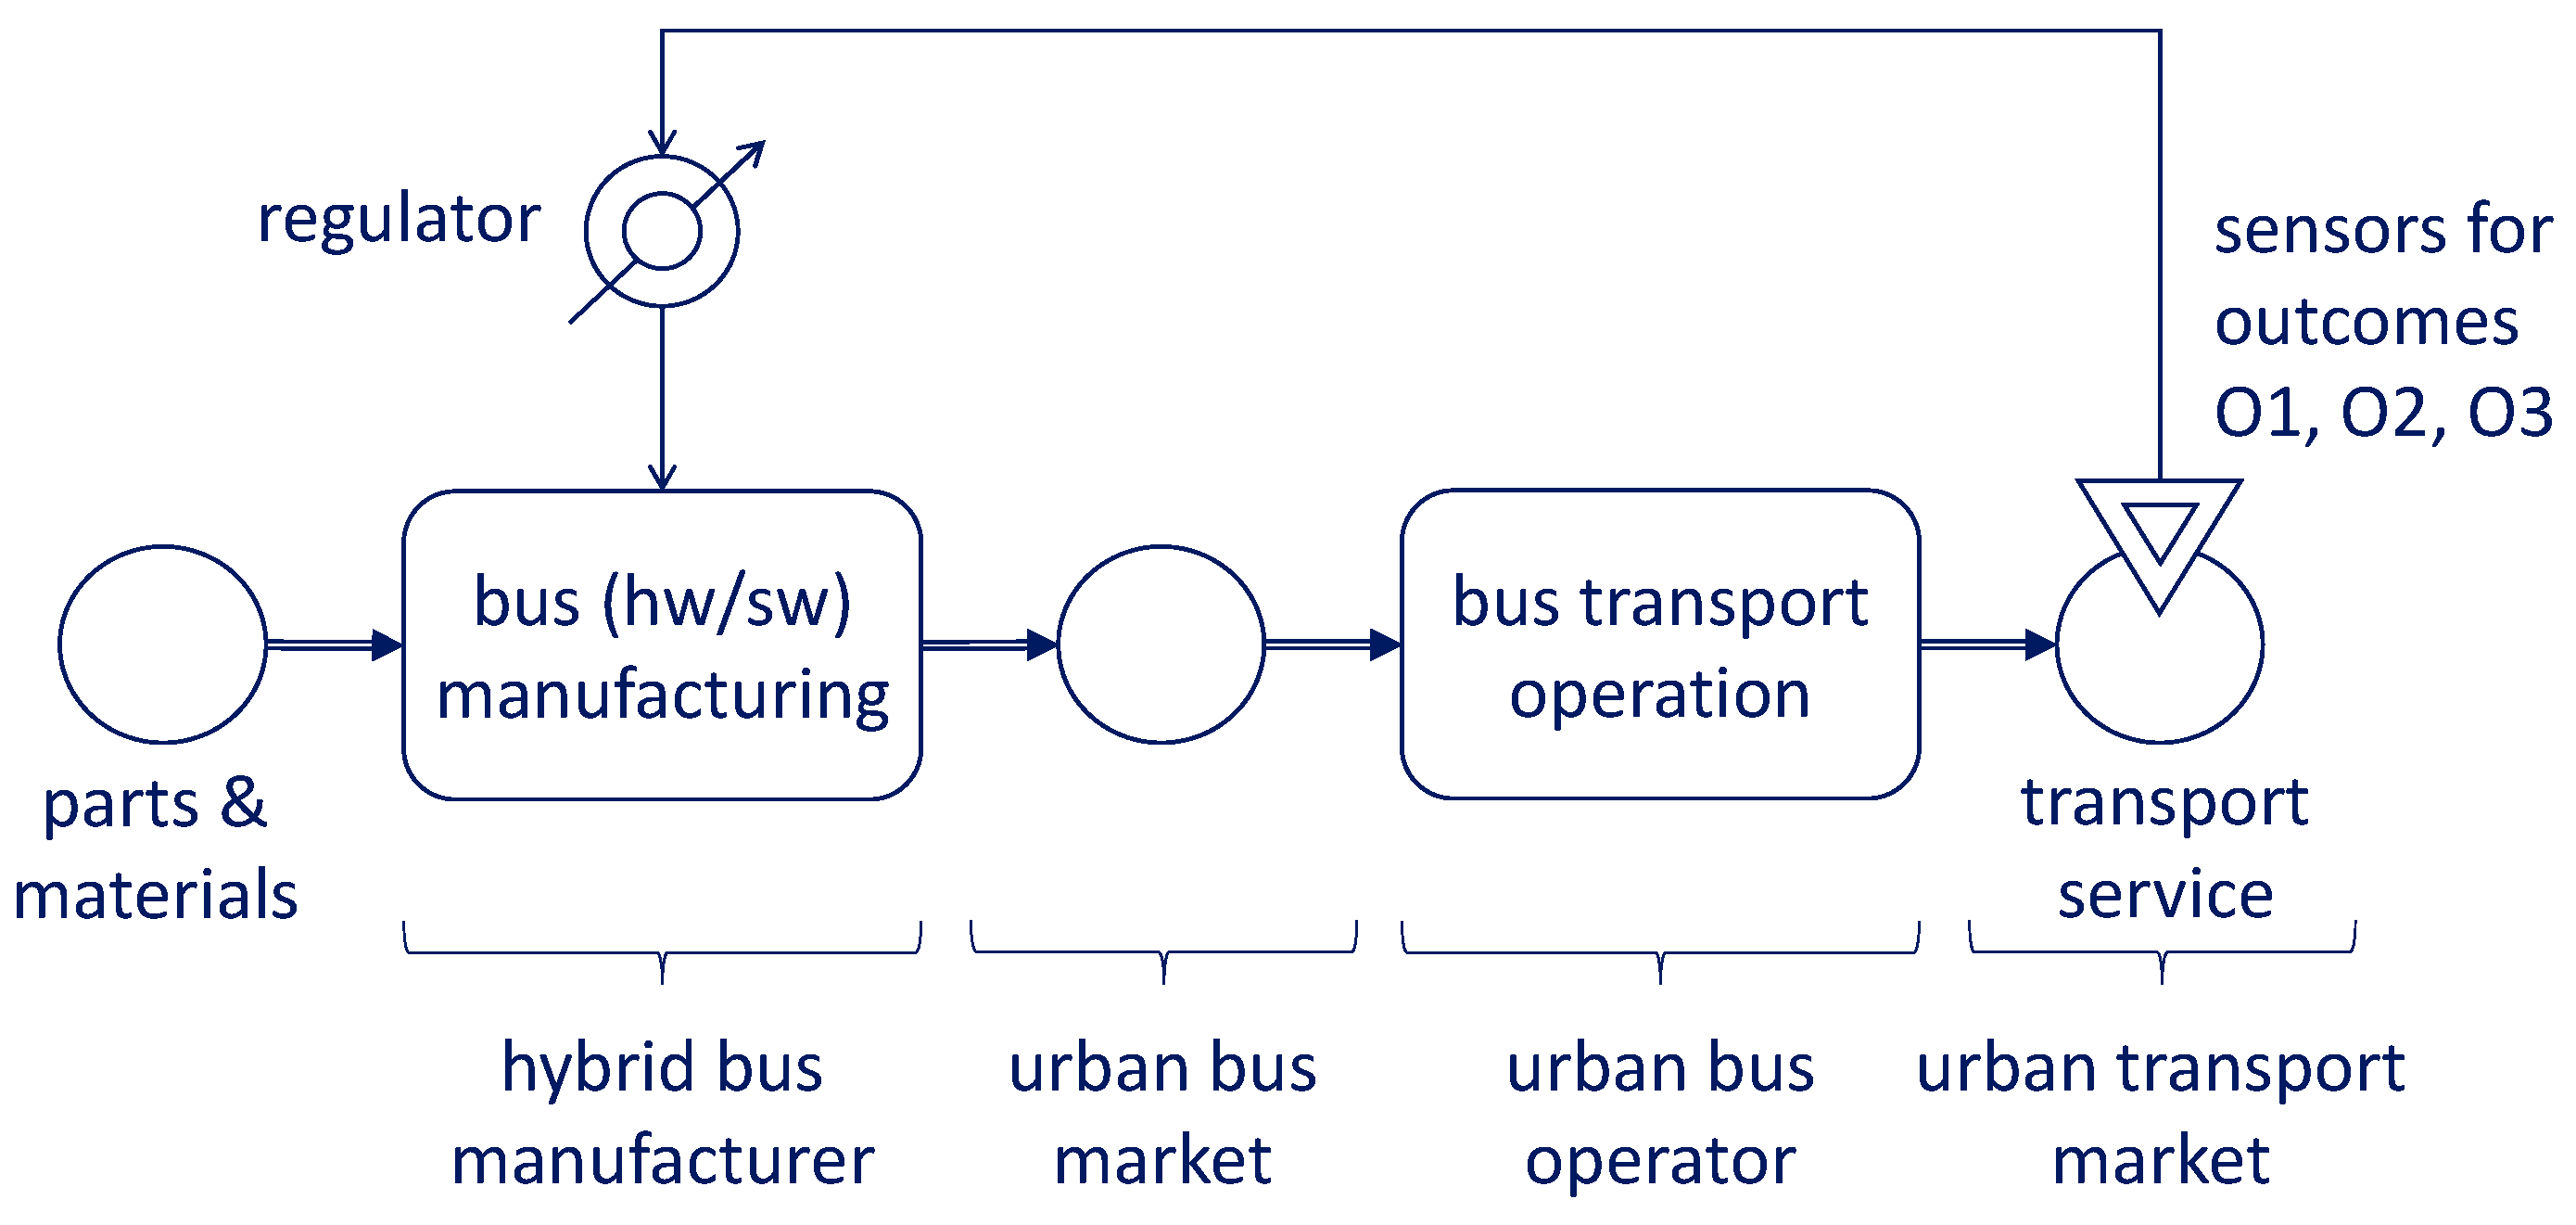
HBM decides that in the modern economy, it is time to add an outcome-based business model to their portfolio. In this model, they provide hybrid buses to urban transportation providers (bus operators) and bill them not for the buses themselves, but for the outcomes that the use of the buses generates for an operator, i.e., for the contribution to the realization of the OPIs of an operator. This aligns well with the need for more market orientation of the operators themselves [31]. After discussions with their customers, HBM decides to use three kinds of customer outcomes:
O1:
The number of passengers transported per time unit—this reflects the main operational KPI for the operators. HBM can influence this outcome by making their busses more attractive to travelers (e.g., in terms of speed of transport, in terms of operational reliability, or perhaps even in terms of cost of transportation—the latter being influenced by the cost of operating a bus).
O2:
The operating efficiency of buses in terms of energy consumption per distance—it is important for bus operators to be “green” [32]. HBM can influence this outcome by improving the physical characteristics of the drive train of their busses or by improving (the parametrization) of the software that controls the drive train.
O3:
The average traveler satisfaction with the comfort in buses in a specific period (where comfort is influenced by smooth driving behavior of buses). This is an important strategic KPI for the operators, as it helps obtain more customers in their markets (i.e., passengers).
We show the resulting outcome scenario in Figure 6. The outcomes can be further detailed in an outcome specification table as shown in Table 1. For each KPI, the outcome performance indicator (OPI) is specified as well as the required reporting interval. For example, outcome O3 is measured by the net promoter score (NPS) of HBM services on a daily basis.
We revisit the HBM scenario in the next sections of this paper. In Section 4, we add an explicit view on smart manufacturing, looking at the business functions of HBM. In Section 5, Section 6 and Section 7, we analyze the scenario with respect to the aspects of reactivity, intelligence and trust in customer outcome management. In Section 8, we use the scenario as an application for the reference model and architecture introduced in this section.

4. Customer Outcome Management in Smart Manufacturing

In this section, we refine the general customer outcome management model that we have introduced in the previous section for application in the smart manufacturing domain. In the smart manufacturing domain, products are delivered to customers for the realization of customer outcomes. The products can have accompanying services that aid in this realization, following the concept of product–service–system (PSS). The product or product–service combination goes through a lifecycle that is relevant to the outcome management paradigm, as an outcome is realized differently in each phase of the lifecycle. We discuss this lifecycle in the subsection below. In Section 4.2, we introduce Porter’s value chain model [33], which we use for the integration of the product lifecycle phases into the outcome management model as discussed in the previous section. In Section 4.3, we apply the concepts of this section to our running HBM case study.

4.1. The Product Lifecycle Perspective

A product typically goes through a product lifecycle with a number of phases. Many lifecycle models have been described using different sets of phases. In a recent comparison [34], a model with nine phases [35] is the most detailed. It contains the phases shown in the first column of Table 2.
To delineate the scope of our approach to customer outcome management, in the second column of the table, we consider whether each phase is relevant to the line of thought in the current paper. Two phases are outside the operational scope of customer outcome management: to start customer outcome management, a completed product concept is required; also, a contract between provider and customer (i.e., a completed sale phase) must have been established. The recycle/disposal phase of a product is outside the design scope of our current framework. It may be considered in future research, though. Raw material purchase (i.e., procurement) is within scope, but considered of secondary importance in our current framework and hence omitted for reasons of brevity (it can be added where necessary). The utilization stage is certainly in scope (as this is when customer outcomes are realized), but the provider is not involved in the actual utilization of the product. In our model (Figure 5), the provider only observes measurements from the sensors in the utilization context. Hence, the utilization phase is implicit to the provider and hence is omitted from explicit discussion in this paper. In Section 7, we will see that it is actually important to keep this phase implicit to guarantee trust in competitive scenarios.
Following this discussion, we keep four lifecycle phases for discussion in this paper, as shown in the third column of Table 2. We describe these phases as follows:
  • Product design: product design results in the blueprint of the product (including the bill-of-materials or BOM) as well as the blueprint of the process for manufacturing the product (including the bill-of-processes or BOP). This phase is often supported by a product lifecycle management (PLM) system.
  • Product manufacturing: product manufacturing uses the BOM and BOP to actually manufacture (physically create) the product. In smart manufacturing, the manufacturing process is typically controlled by a management execution system (MES) or by a manufacturing process management system (MPMS) [36].
  • Product delivery: the product delivery phase takes care of sending manufactured products to the customer for deployment in the customer business context, i.e., the context where outcomes are realized.
  • Product after-sales servicing: during the use of the manufactured products in the customer context, after-sales services can be deployed to enhance the use of the products and hence the improvement of customer outcomes. Examples are maintenance, product reparameterization or the installation of new versions of firmware into the product.
These four product life cycle phases can be mapped directly to a value chain model to further operationalize our line of reasoning towards business functions in customer outcome management. We do this in the next subsection.

4.2. Adding Porter’s Value Chain Model to Outcome Thinking

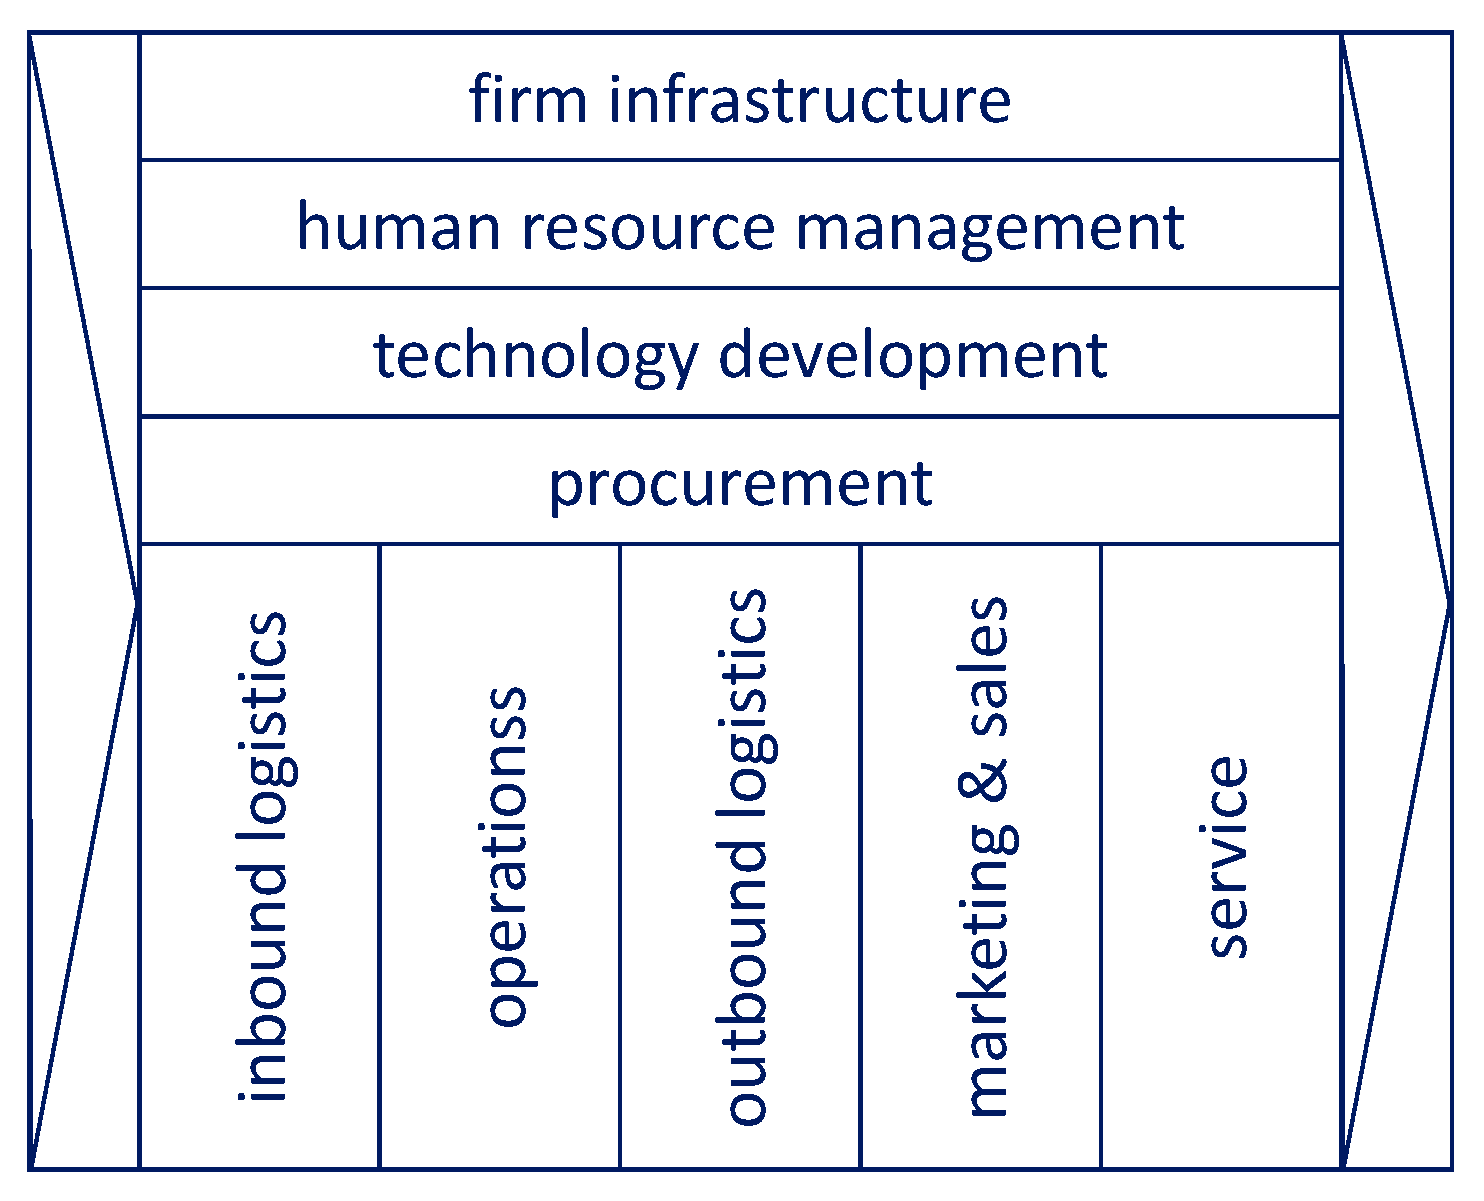
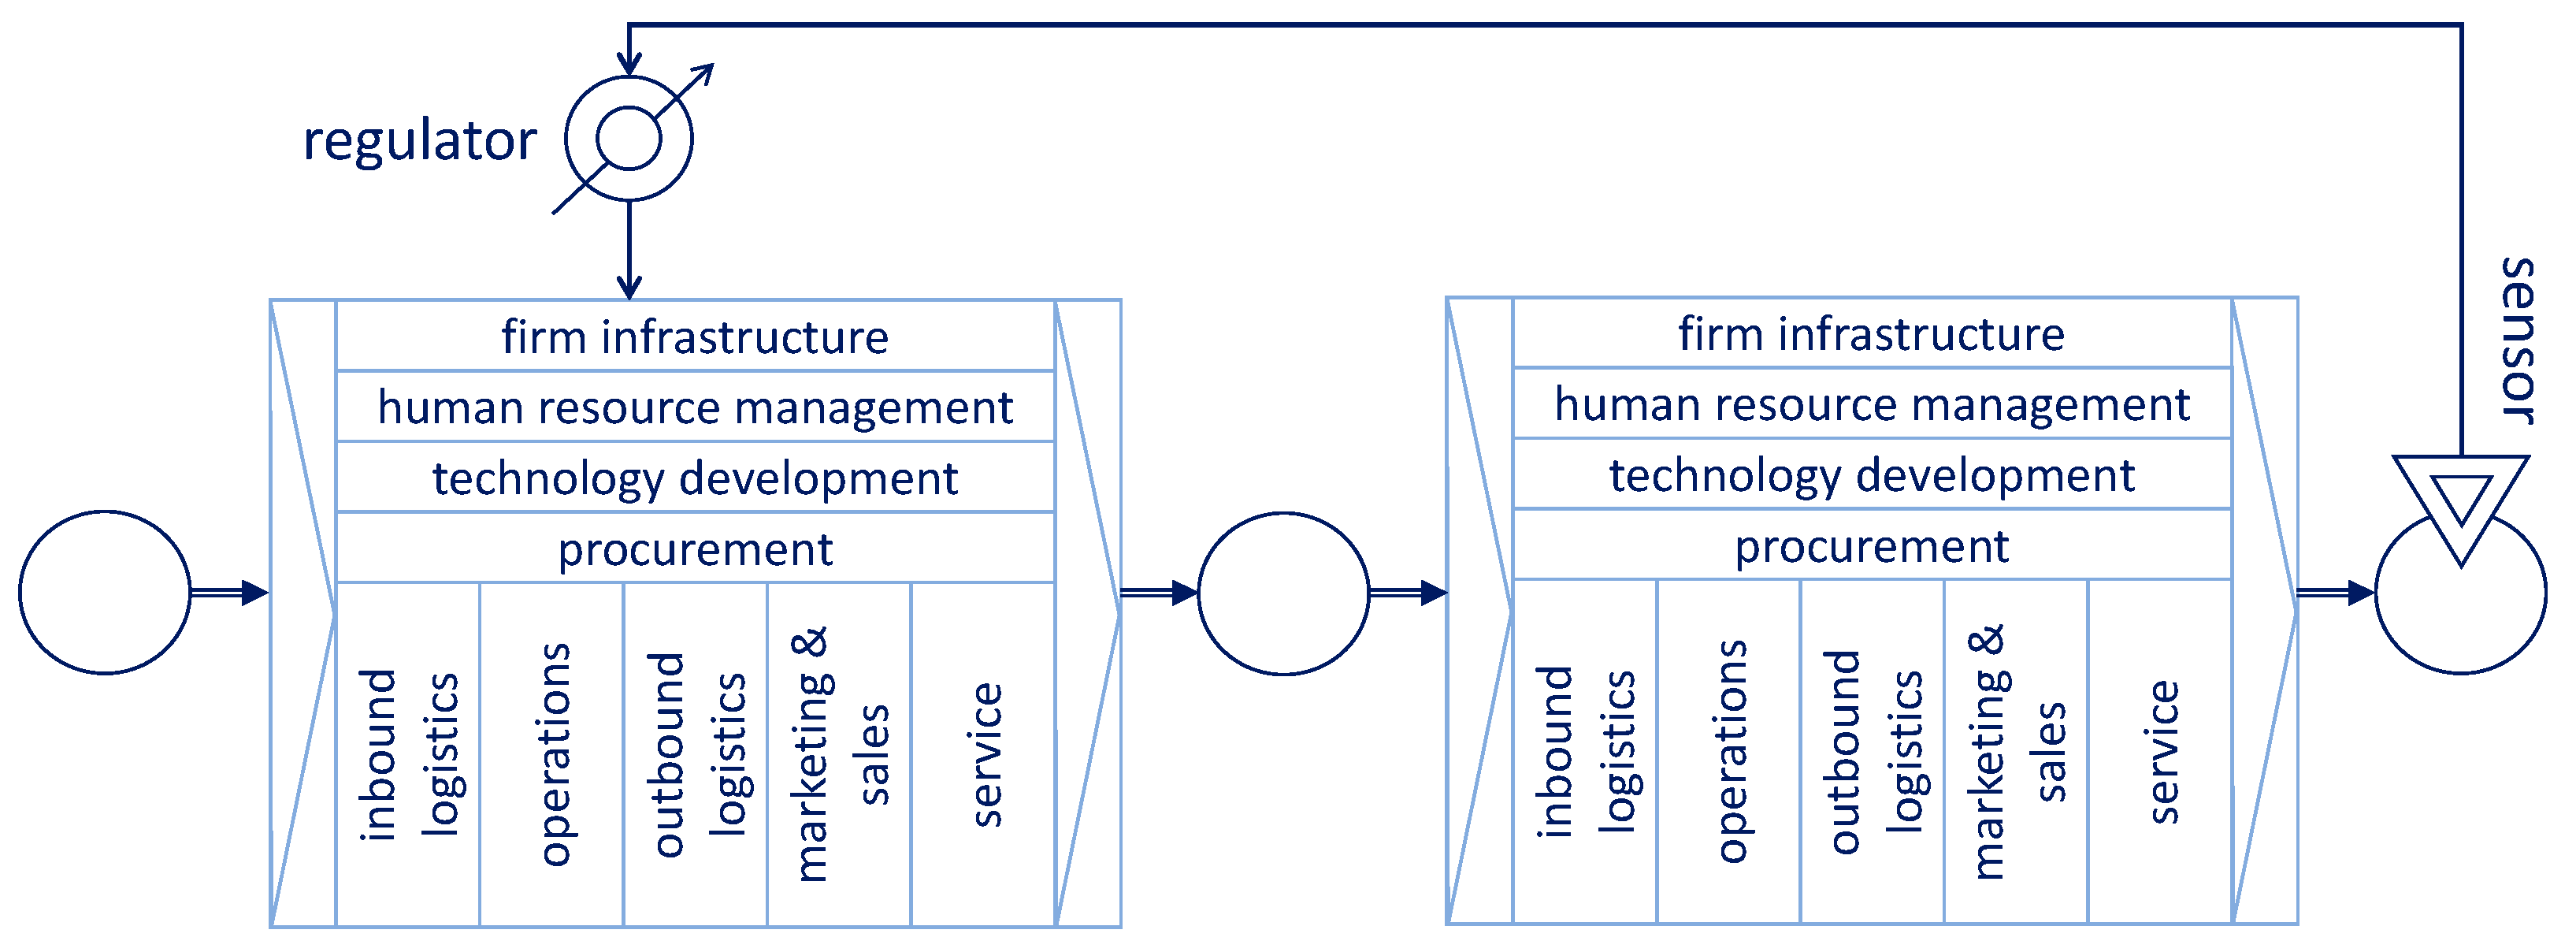
Porter’s value chain model [33] is one of the best-known models for structuring the functions in a manufacturing organization. As the feedback loop in outcome management is used to control functions in the provider organization, we use Porter’s model to refine the black boxes of the provider and customer organizations as shown in Figure 5. We use a slightly adapted version of Porter’s value chain model, shown in Figure 7. Below, we first explain the structure and elements of this model, and next link the elements to the product life cycle phases that we have selected in the previous subsection.
Like the original model, our model contains nine basic functions that can be distinguished in a manufacturing organization. In the lower half of the figure, we see the five primary functions that directly generate the value of the organization: inbound logistics, operations, outbound logistics, marketing and sales, and service. From a supply chain management perspective, the left side from operations is upstream-oriented and the right side from operations downstream-oriented. In the upper half, we see the secondary or supporting functions that enable the primary functions: procurement, technology development, human resource management and firm infrastructure management (including finance and subfunctions such as building maintenance). On the right side of the figure, we have the output of the combined functions that in our context represents the customer outcome. Likewise, on the left side we find the input to the combined functions. This actually may be a customer outcome from the perspective of an upstream provider in the value chain. We do not discuss this, however, as it repeats the downstream discussion.
In traditional, make-to-stock manufacturing, only the three downstream-oriented primary functions are directly influenced by customers at the operational level. In make-to-order manufacturing, the other two primary functions are also influenced. In highly customized manufacturing (i.e., engineer-to-order), even product design in the technology development function is directly influenced. One might even reason that product design becomes a primary function—but as the Porter model is widely used, we keep to the organization of this model. As customer outcome management embraces these more modern trends, these influence the further design of our model.
When we embed the value chain model of Figure 7 into the customer outcome management model of Figure 5, we obtain the model of Figure 8. This model we can label as a value-chain-refined customer outcome management model, but we will use the shorter term outcome management model for pragmatic reasons.
The outcome management model of Figure 8 shows the structure of the internal functions of both provider and customer but does not make use of this structure. This means that it is not clear which provider functions deliver the product or services to which customer functions, such that outcomes can be realized. It is also not clear which functions of the provider are controlled by the decisions made by the regulator in the feedback loop. To bring in this level of detail, we refine the model of Figure 8 to the model in Figure 9.
In Figure 9, we firstly see a refinement of the outcome generation process, based on the four product lifecycle stages that we have identified in Section 4.1:
  • The technology development function of the provider implements the processes related to the product design lifecycle stage.
  • The operations function of the provider implements the process related to the product manufacturing stage.
  • The outbound logistics function of the provider implements the processes related to the product delivery stage, delivering the manufactured product to the inbound logistics function of the customer.
  • The service function of the provider implements the processes related to the product after-sales servicing stage. It supports the operations function of the customer in creating products or services that in turn generate the targeted customer outcomes (via the outbound logistics and service functions of the customer, which serve the customer’s market).
In Figure 9, we next see a refinement of the outcome control mechanism. Based on the interpretation of the measurements of the sensor in the market environment of the customer, the regulator of the outcome management loop can influence the manufacturing and delivery of products—and hence the generation of the customer outcome down the chain—in four different ways. These four ways are indicated by the four arrows from the regulator in Figure 9, which we discuss in left-to-right order):
  • The regulator can decide that the product specification needs to be adapted to enhance the customer outcome and signal this to the technology development function of the provider, for example as a product change request to its PLM system. As an example, the sensor measurements may indicate a too-low uptime of the products, which requires a change to a product parameter.
  • The regulator can decide that the customer outcome can be enhanced by improvements to the manufacturing process and hence signals this to the operations function of the provider. As an example, the conclusion of analyzing the sensor readings may be that there is a significant variation in the performance of individual products, which may indicate too much tolerance in the manufacturing process. This can be handled by advice for a change of machine settings in the bill-of-processes (BOP) handled by the manufacturing execution system (MES) of the provider.
  • The regulator can decide that the customer outcome can be enhanced by a timelier delivery of products and hence signals this to the outbound logistics function, which may be reflected as a change in its product delivery planning. As an example, sensor readings may indicate lost transactions of the customer because of unavailability of the product manufactured by the provider.
  • The regulator can decide that the customer outcome is not optimal because of inadequate after-sales performance and hence signals this to the service function of the provider. As an example, sensor readings may indicate that a deployed product is not always fed the latest version of product parameters that are distributed by the service function (such as embedded software versions) or that maintenance is necessary. Note that maintenance in this context is reactive maintenance from an outcome generation perspective, but may be preventive (i.e., proactive) maintenance from a traditional product perspective. These kinds of regulator decisions should lead to a change in customer service scheduling.
Note that each of the four ways implies a feedback loop that includes one of the four functions of Porter’s model that have effects that are directly visible to the customer. Each of these four feedback loops is related to product lifecycle stages, which are again related to the life cycle and value stream dimension of the RAMI 4.0 reference model [18] (see Figure 2). The four ways in the order discussed above cover this dimension from left to right, paying special attention to logistics. This use of feedback loops is related to the concept of data-driven product lifecycle management [37], be it that we use the loops for outcome evolution, not primarily for product evolution.
We chose the aggregation level of the Porter model for our purposes in this paper, as this provides enough detail for a thorough, high-level analysis of outcome scenarios in smart manufacturing (obviously more than the abstract model of Figure 5). Complete manufacturing process models, such as have been developed in for example the HORSE project [22,38], come into play once the overall outcome scenario has been designed and the full, detailed operationalization has to be realized. These models have similar levels of detail to those in other business process management (BPM) [39] application domains, which goes beyond the scope of the current vision paper.
In the next three sections of this paper, we show how the aspects of reactivity, intelligence and trust can be explicitly added to the model of Figure 9 to arrive at a complete framework for IT-enabled customer outcome management in smart manufacturing. Before going there, we first introduce our running example.
The application scenario that we use in these sections for the illustration of our vision.

4.3. Application to the HBM Case Study

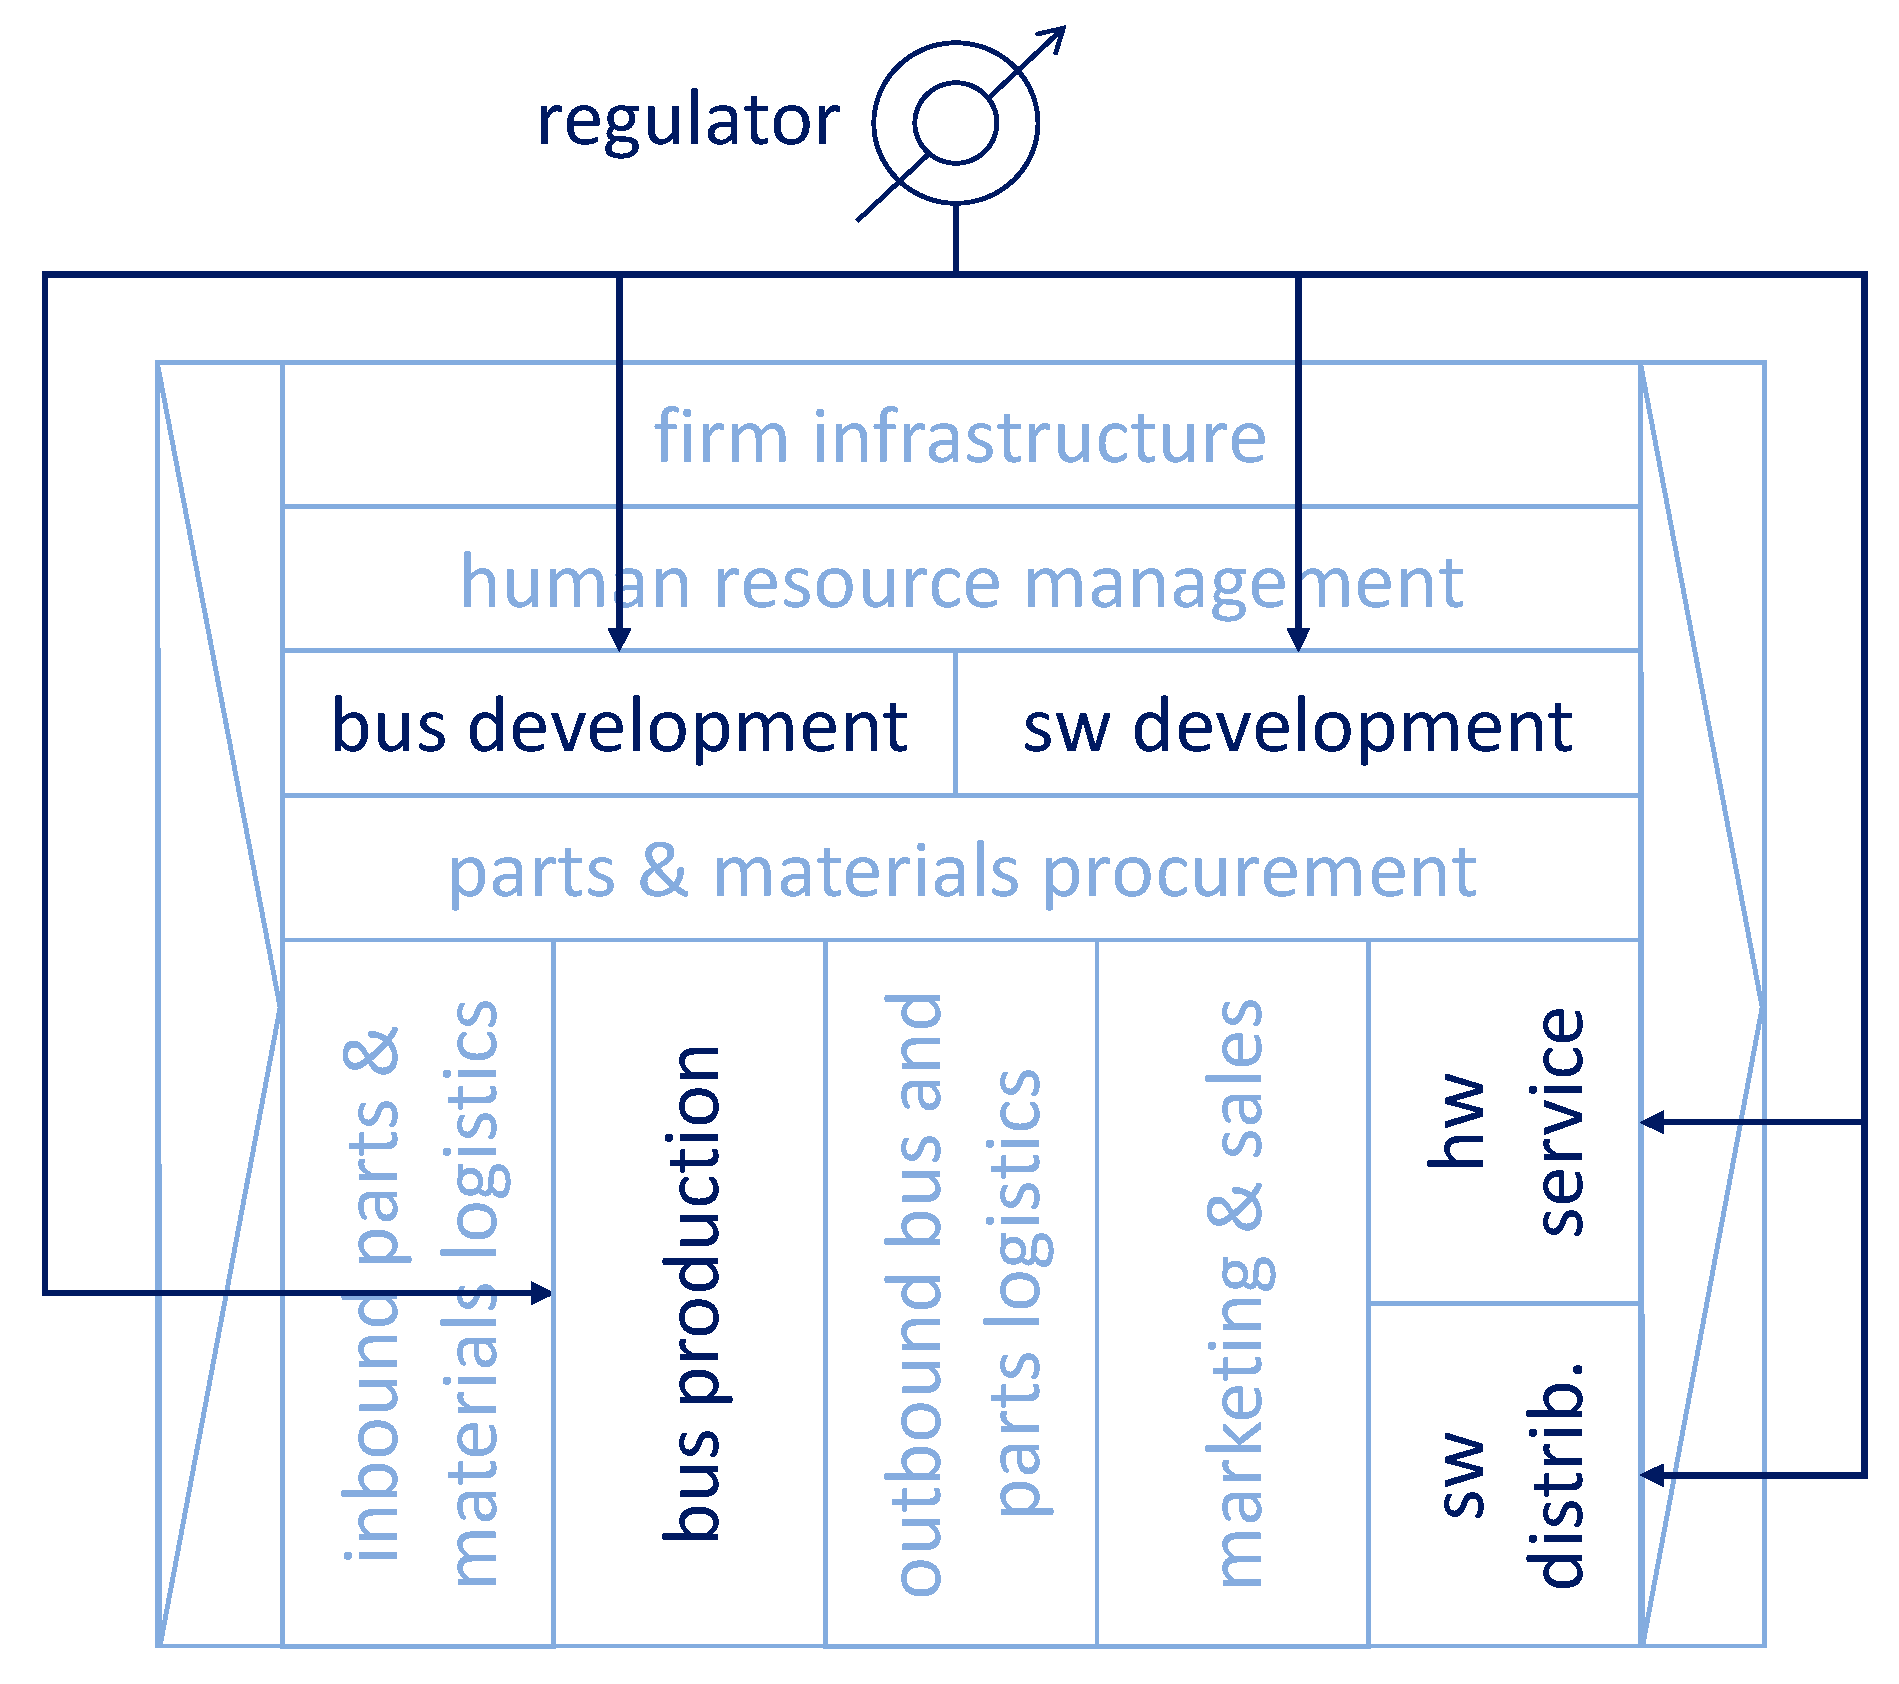
When we apply the concepts of this section to the HBM case introduced in Section 3.3, we first have to look at the concretization of Porter’s model to the HBM situation. The first important observation is the fact that HBM’s product consists of two important parts: a physical bus and the onboard software for this bus. The onboard software controls many of the functions of the bus, such as engine and brake operation. As such, the software determines the operational characteristics of the bus, such as energy consumption and passenger comfort. The second important observation is the fact that physical buses need physical logistics to reach customers, but software does not need this. Hence, HBM has allocated the software distribution function to the service function of Porter’s model. This results in the applied value chain model of Figure 10.
Next, we link the functions in the HBM value chain model to the regulator in the outcome management scenario, as shown abstractly in Figure 9, such that HBM can enable outcome generation for its customers. As shown in Figure 10 (note that we have omitted the customer side of the scenario to keep the figure legible), five functions are linked to the regulator. This means that the operation of five functions is influenced by the regulator to optimize customer outcome generation. We can refine the linkage by looking at the individual outcomes defined by HBM. This leads to the linkage shown in Table 3.
For reasons of brevity, we omit the discussion of details in this table—they are based on domain-specific characteristic choices. Do note, however, that we include only links that are related to outcome management. For example, obviously the business function of bus development (like the use of more modern engines) can produce a reduction of energy consumption by busses (related to O2). HBM, however, does not need an outcome management mechanism to control this development: it is part of the standard technology evolution process within HBM. In other words: not everything related to the operation of a provider is related to outcome management. This illustrates the fact that an outcome management scenario should be designed with care.

5. Adding Reactivity to the COM Model in SM with Sensors

In the previous sections, we have introduced the notion of customer outcome management, and we have operationalized it into a cybernetic model and applied it to a smart manufacturing setting. The functionality covered so far is basic outcome management. To make it usable in industrial manufacturing practice, we need to extend this functionality with respect to several aspects. In this section, we cover the first of these aspects: reactivity.
To address reactivity in outcome management, we focus on the sensing capability of a digital outcome management system to support real-time behavior in the feedback loop that is a core element in the outcome management mechanism, as shown in Figure 5. More concretely, we take a detailed look at the types of sensors in the market of the customer that we need to enable reactivity. This sensor classification is discussed in Section 5.1. After that, we illustrate the use of the classification in our running HBM case study.

5.1. Sensor Classification

The way data are collected in data-driven smart manufacturing depends heavily on the kind of data collected [35]. Likewise, the way the sensor function can be embodied in our customer outcome management framework depends heavily on the nature of the variables that describe the outcomes to be measured [9] and hence on the way the data is captured.
From a systems point of view, these variables can be divided into three main classes, with corresponding sensor elements. Firstly, there are variables of which the data values are recorded in an existing information system of the customer’s (such as the number of sales transactions). In this case, the sensor is a software interface to the information system of the customer to retrieve the data. Secondly, there are physical variables that can be measured directly in the customer’s domain (such as the speed of a vehicle). In this case, the sensor is a physical measuring (IoT) device in the field of operation of the customer with a software data interchange interface. Thirdly, there are non-physical variables that cannot be measured directly (such as customer satisfaction). In this case, the variables are measured by and stored in a system external to the cybernetic feedback system, such as a social media system. To the cybernetic feedback system, such external systems are black boxes. Hence, the external system is the sensor. In all cases, the sensor should be of a trusted type, since it provides the basic data that regulate the business relationship between the provider and the customer.
The data-provisioning mechanism from sensor to regulator can be organized in either a push or a pull fashion. In the push fashion, the sensor element automatically provides the values to the regulator component on a periodic basis. In real-time feedback mechanisms, the period is short, and the data takes the form of a continuous data stream. In the pull fashion, the regulator element explicitly requests the values from the sensor element. In case of a continuous, real-time data stream, this may imply substantial overhead. In more “sparse” circumstances, this can avoid unnecessary data transfer.
When we combine these two dimensions of the feedback mechanism, we obtain the six classes of sensor elements shown in Table 4. We briefly discuss the six classes below.
(i) Pushed recorded data is provided by a software module in an information system that retrieves the data from the data store of that system and sends it on its own initiative to the regulator element of our framework. An example of this type of data is a set of records from a customer relationship management (CRM) system that contains new customer data. Data can be pushed on a periodic basis (such as once per minute) or on the basis of specific events (such as observed threshold values). The provisioning module can either be a standard module of the system or a plug-in for monitoring purposes.
(ii) Pulled recorded data is explicitly requested by the regulator element of our framework. The kind of data may be similar to that in Class i, but the trigger for data transfer is different. To enable this, the information system managing the recorded data needs to publish a query interface. The regulator element determines the moments that data is pulled and the exact nature of the data. The source system and the regulator typically belong to different organizations, so the query interface needs to be subject to an access control mechanism.
(iii) Pushed physical data is provided by an active IoT device containing a measuring instrument that measures physical context variables or by a cyber–physical system (CPS) containing such an instrument. One example is a digital temperature sensor in a factory machine or a GPS location sensor in a vehicle. It is “wrapped” by the IoT device or CPS that transmits the data resulting from measurements. The IoT or CPS determines when data is sent and may perform basic data processing, such as averaging measurements.
(iv) Pulled physical data is provided by an IoT device or CPS as in Class iii, but in this class the device or CPS are passive: they only provide data upon request by the regulator element. As in Class ii, explicit access control is important in this class. An advanced CPS may have a query interface such as the systems in Class ii. A simple IoT device typically has a simpler polling interface.
(v) Pushed external data originates from active external systems that monitor the environment of the customer, which function as a sensor in the feedback loop. Examples of such systems are social media systems (the data of which can be used for sentiment analysis) and traffic monitoring systems (the data of which can be used for transport efficiency analysis). Subscriptions are required to a data stream provided by these systems, where the subscription parameters specify the precise kind of data streamed.
(vi) Pulled external data originates from active external systems that function as a sensor, as in Class v. To allow data pulling from the sensor, these systems provide external query interfaces. These query interfaces are often made available in the form of Web Services or public APIs. To use them, a subscription may be required.
Apart from the type of sensor, the sensing frequency is important. For the measurement of some outcomes, the frequency needs to be in the sub-second scale, whereas for other outcomes, a frequency in the days scale is sufficient (we present examples in the discussion of the case study). In the case of high-frequency sensing, it may be necessary to buffer (or even aggregate) sensor measurements before sending them to the regulator in order not to overload the communication channel.
Note, finally, that sensor readings are transmitted to the regulator of our outcome management mechanism. The regulator is typically located with the provider, such that outcome-related data has to be transmitted between organizations. This data is obviously sensitive, as it contains important business performance data of the customer. Hence, it may be necessary to encrypt the data for transmission. Various techniques to do so are available [40].

5.2. Application to Example Case Study

As discussed in Section 3.3, three outcomes are managed in the HBM scenario: number of passengers transported (O1), energy efficiency of buses (O2), and passenger satisfaction (O3). Each of these outcomes is of a very different nature and hence requires a different sensor setup.
For managing O1, two different sensing strategies can be followed. As the first alternative, the number of passengers can be measured by retrieving data from HBM’s ticketing system (i.e., we have a Class ii sensor). This approach assumes that every individual bus ride is registered in the system. As the second alternative, physical sensors can be placed at the entrance of each bus to physically observe the number of passengers boarding and transmit this data to the regulator (i.e., we have a Class iii sensor).
For managing O2, we require a direct coupling to the engine management system in each bus. This system typically contains physical energy consumption sensors as well as other sensors to measure contextual data that help to understand the energy consumption values, such as bus acceleration sensors [41]. Measurements need to be very frequent to obtain data with a granularity that allows HBM to optimize their bus management software in a quantitative way. Hence, buffering of measurements is required.
For managing O3, two strategies are again available. Either the sensor is formed by a customer survey system of an external marketing agency that periodically sends reports (Class v sensor), or the sensor is formed by a sentiment analysis system that scrapes social media upon request (Class vi sensor).
In Table 5, we provide an overview of the above considerations. Note that the details in the table are all the consequence of design choices. Different choices would have led to different details in the HBM sensor setup.
The sensing frequencies specified in Table 5 should at least be high enough to support the reporting intervals specified in the outcome specification table as shown in Table 1. If the frequencies are higher, local aggregation of measurements (i.e., at the sensor location) can take place to avoid excess data transmission.

6. Adding Intelligence to the COM Model in SM with Data Analytics

In the previous section, we have added reactivity to our outcome management framework to enable more real-time-oriented behavior in the control loop. More real-time-oriented behavior implies more frequent decisions by the regulator in the framework and this in turn requires automation of decision making by the regulator as the element that makes the operational outcome management decisions. Therefore, in this section we pay attention to the business intelligence perspective of customer outcome management.
Control theory (as used in our control models) is always prescriptive: it aims at steering the behavior of a system—in our case, the behavior of an outcome business ecosystem by the regulator. There can be different levels of automation, however, in a control model: with high levels of automation, little human input is required; with low levels of automation, most of the work is done by humans. Therefore, we discuss intelligence ambition levels for the regulator below, as these levels are the basis for levels of automated control in outcome management.
After discussing the ambition levels, we briefly discuss how the various ambition levels can be coupled to the business functions that we have identified in Section 4.2. Then, we pay brief attention to the representation of data to be processed by the regulator. We end this section by bringing the discussed aspects in practice in the context of the HBM case study.

6.1. Intelligence Ambition Levels

In Section 5.1, we discuss a classification for the embodiment of the sensor element in the cybernetic feedback mechanism. In this section, we discuss a similar exercise for the various types of embodiments of the regulator element. In doing so, we focus on classifying the functionality of the data processing by the regulator, based on Gartner’s four ambition levels for data analytics [42]. Going from a low to a high ambition level, we have summarized the four classes of regulators in Table 6 and discuss them below.
(a) A descriptive regulator interprets data from the sensor element in the customer environment and produces descriptions of this data, i.e., summarizes what happened in the market environment of the customer. This summarization can be presented, for example, in a dashboard for a decision maker. Interpretation of this information is performed completely manually by the focal organization. A descriptive regulator typically requires rather simple analytics technology. The level of automation in the feedback mechanism is low in this case. In production environments, this class of regulator can be referred to as a digital shadow [48] of the customer outcome.
(b) A diagnostic regulator interprets data from the sensor element in the customer environment and produces diagnoses for the events that happened in the market environment of the customer in terms of the business process of the focal organization. It typically also requires measurements from the sensor element local to the customer. This provides the focal organization with input for reactively tuning its business process to optimize the outcome for its customer. This class of regulator is a basic digital twin [49] with simple analytical power but no simulation capabilities, also referred to as a digital shadow [48] with analytical power.
(c) A predictive regulator interprets data from the sensor element in the customer environment (and the local sensor of the focal organization) to generate predictions of the effects of changes on the business process of the focal organization on the outcome for the customer organization. This enables the focal organization to perform what-if analyses and to tune its business processes proactively to optimize the outcome for its customer. This class of regulator corresponds to a digital twin [49] with advanced analytical power, often based on simulation capabilities.
(d) A prescriptive regulator interprets data from the sensor element in the customer environment (and the local sensor of the focal organization) to generate models that prescribe the parameters for the business process of the focal organization to optimize the outcome of its customer. Prescriptive analytics is the most advanced class of analytics, but it is used in industry [50]. It can be used in a supply chain that requires a high level of automation where human involvement can be avoided. If the prescriptive regulator can also autonomously control the business process of the focal organization (e.g., by linking it to a process management system [51]), we obtain a fully automated control loop.

6.2. Coupling Intelligence Ambition Levels to Manufacturing Functions

Not all ambition levels are equally applicable to regulate actuation in the four identified manufacturing functions of the provider (see Figure 9). We briefly discuss the use of the ambition levels per business functions below.
In the technology development function, we typically find activities for qualitative product design and quantitative product parameterization. Each of these two kinds of activities can be actuators for customer outcome realization. Regulator input for qualitative product design is typically descriptive, or at best diagnostic, as it is difficult to provide predictive or prescriptive feedback to qualitative product redesign. Regulator input for quantitative product parameterization is preferably diagnostic or predictive to help in setting the right product parameters. In case of the availability of high-quality, predictive product models (i.e., product digital twins), prescriptive input may be feasible.
In the operations function, diagnostic regulator input is typically easily usable, as it describes the reason for sub-optimal outcome realization in the product manufacturing process. Given the fact that the operations function in a manufacturing organization is usually of a heterogeneous, physical kind, using predictive or prescriptive models in the regulator typically is difficult.
For the outbound logistics function, in principle, all ambition levels are possible, depending on the maturity level of the logistic functions involved. This includes both the outbound function at the provider and the inbound function at the customer, as these are tightly linked in the overall logistics process.
For the service function, again all ambition levels are possible. Similar to the outbound logistics function, this depends on the maturity levels of the service functions of the provider and the operations function of the customer.

6.3. Intelligent Representation of Outcome Data

In order to facilitate intelligent processing, the stream of outcome data provided by the sensors in the customer domain has to be in a format which allows it to be interpreted by the regulator. This is true across all intelligence ambition levels (as outlined in Section 6.1) and may be achieved by following the frameworks and standards described in Section 3.2, which ensure conformity across customers.
Following such practices ensures that measurement data are structured [52], allowing for their (automated) ingestion by regulators regardless of which customer the data are coming from. With this in mind, it is still necessary to store and organize the incoming data and ensure compliance with the agreed-upon standards. Semantic technologies may be leveraged for this purpose. Data interoperability and machine readability are the driving motivators behind the development of such technologies [53].
One such technology, namely an ontology, is a data model for capturing information about concepts and their relationships in a given domain. In the context of our paper, an ontology provides a formal description of the different components of an organization, its partner organizations, and the relationships between these components. Of particular interest is the modeling of the relations between customer sensors and regulators as this provides an opportunity to impose constraints on the data exchanged between these two entities. For instance, an ontology could specify that the data exchanged be of a certain type with values in a specified range.
Domain ontologies for manufacturing, and more recently smart manufacturing, have been proposed [54], allowing for easy adoption and extension to the outcome-based business model. We note, however, that ontology modeling does not prescribe how data exchange occurs between customers and producers in our approach. We describe the technologies which can be utilized for such exchanges in Section 7.

6.4. Application to Example Case Study

In Table 7, we show sample regulator ambition levels for the HBM case for the combinations of outcomes and business functions (based on the links identified in Table 3)—note that these are design choices and other choices are possible. For reasons of brevity, we do not discuss all entries in detail.
We observe that the ambition levels range from descriptive to prescriptive. For example, the regulator output to the bus development function for the realization of outcome O1 (passenger numbers transported) is descriptive. The level of automated control is low, as the bus development function contains many diverse design activities that may each influence realized passenger numbers in some way. Consequently, highly automated control does not apply. Hardware servicing to increase outcome O2 (energy efficiency of a bus) can be controlled in a prescriptive fashion, as there is a clear, quantitative relation between the level of service of a bus and the operating efficiency of this bus. Hardware servicing for outcome O3 (passenger satisfaction) can be controlled in a predictive way (as in predictive maintenance [55]) to prevent customer complaints with respect to the comfort of bus rides. The relation between bus production (the actual manufacturing process of individual busses) and outcome O3 is much more complicated, however. Consequently, diagnostic control is chosen here to find correlations between manufacturing activities and passenger satisfaction and leave further decisions about process changes to human experts.

7. Adding Trust to the COM Model in SM with Blockchain and Federated Learning

In this section, we analyze the aspect of trust in customer outcome management. Trust is (obviously) an important element in any manufacturing supply chain. Trust can be established based on the quality of the products that are delivered by a provider to a customer and that the customer pays for: there is a physical basis for trust. In a customer outcome management scenario, the provider delivers an outcome, not a product. The outcome is measured in the scenario and this measurement results in outcome data. These data are the basis for trust in the scenario—they replace measurements of physical product characteristics. Therefore, trust management in a customer outcome scenario has to be data-based. This data-based mechanism has two important aspects.
First, we need a mechanism for data-based trust between provider and customer. Both parties need to be sure that the outcome measurements are mutually agreed on, as the full outcome management is based on these measurements. This implies that they have to be passed through a trusted “channel” that both parties can rely on in a symmetric sense and that they have to be stored in a trusted way such that there is a common basis to handle possible disputes between the parties. We discuss this aspect in Section 7.1. We will show how blockchain technology can be used to provide a digital basis for this aspect of trust management.
Second, we need to be aware that in most manufacturing supply chains, and hence customer outcome scenarios, there is more than one customer. In traditionally organized supply chains, the provider supplies products to the individual customers, who proceed completely independently. In customer outcome management, all customers send their outcome measurement data to the provider that they share, which processes the data. The outcome data are, however, the key data about the performance of each customer and hence highly sensitive in a competitive market. Without any “data protection”, the customer would therefore not trust the outcome mechanism. We address this aspect in Section 7.2. Here we show how federated learning technology can be used as a digital means of creating trust in a multi-customer environment by distributing intelligent processing of sensitive information.

7.1. Trust between Provider and Customer

In outcome-based business models, the payment of the provider for aiding in the realization of outcomes for the customer is typically completely based on the measurements of these outcomes: the provider is paid for the amount of outcomes realized. For this reason, it is essential that the provider and consumer have a shared and trusted repository for these measurements. This is shown in Figure 11 as an extension of Figure 9. Here we see that the measurement results of the sensor element are fed to this the trusted repository and the regulator reads its input from this repository.
When the provider bills the customer, this is on the basis of the measurements in the shared trusted repository. This means that the financial settlement process between provider and customer (handled by the firm infrastructure function of Porter’s model) uses this data to verify billing steps. This is shown in Figure 12.
Blockchain is the obvious technology for implementing the trusted measurement repository [56]. Its symmetric, distributed character suits the impartial position needed in the outcome management mechanism. Moreover, the immutability of data stored in a blockchain platform suits the purpose of storing measurements: historic measurements should be unalterable by any of the involved parties.
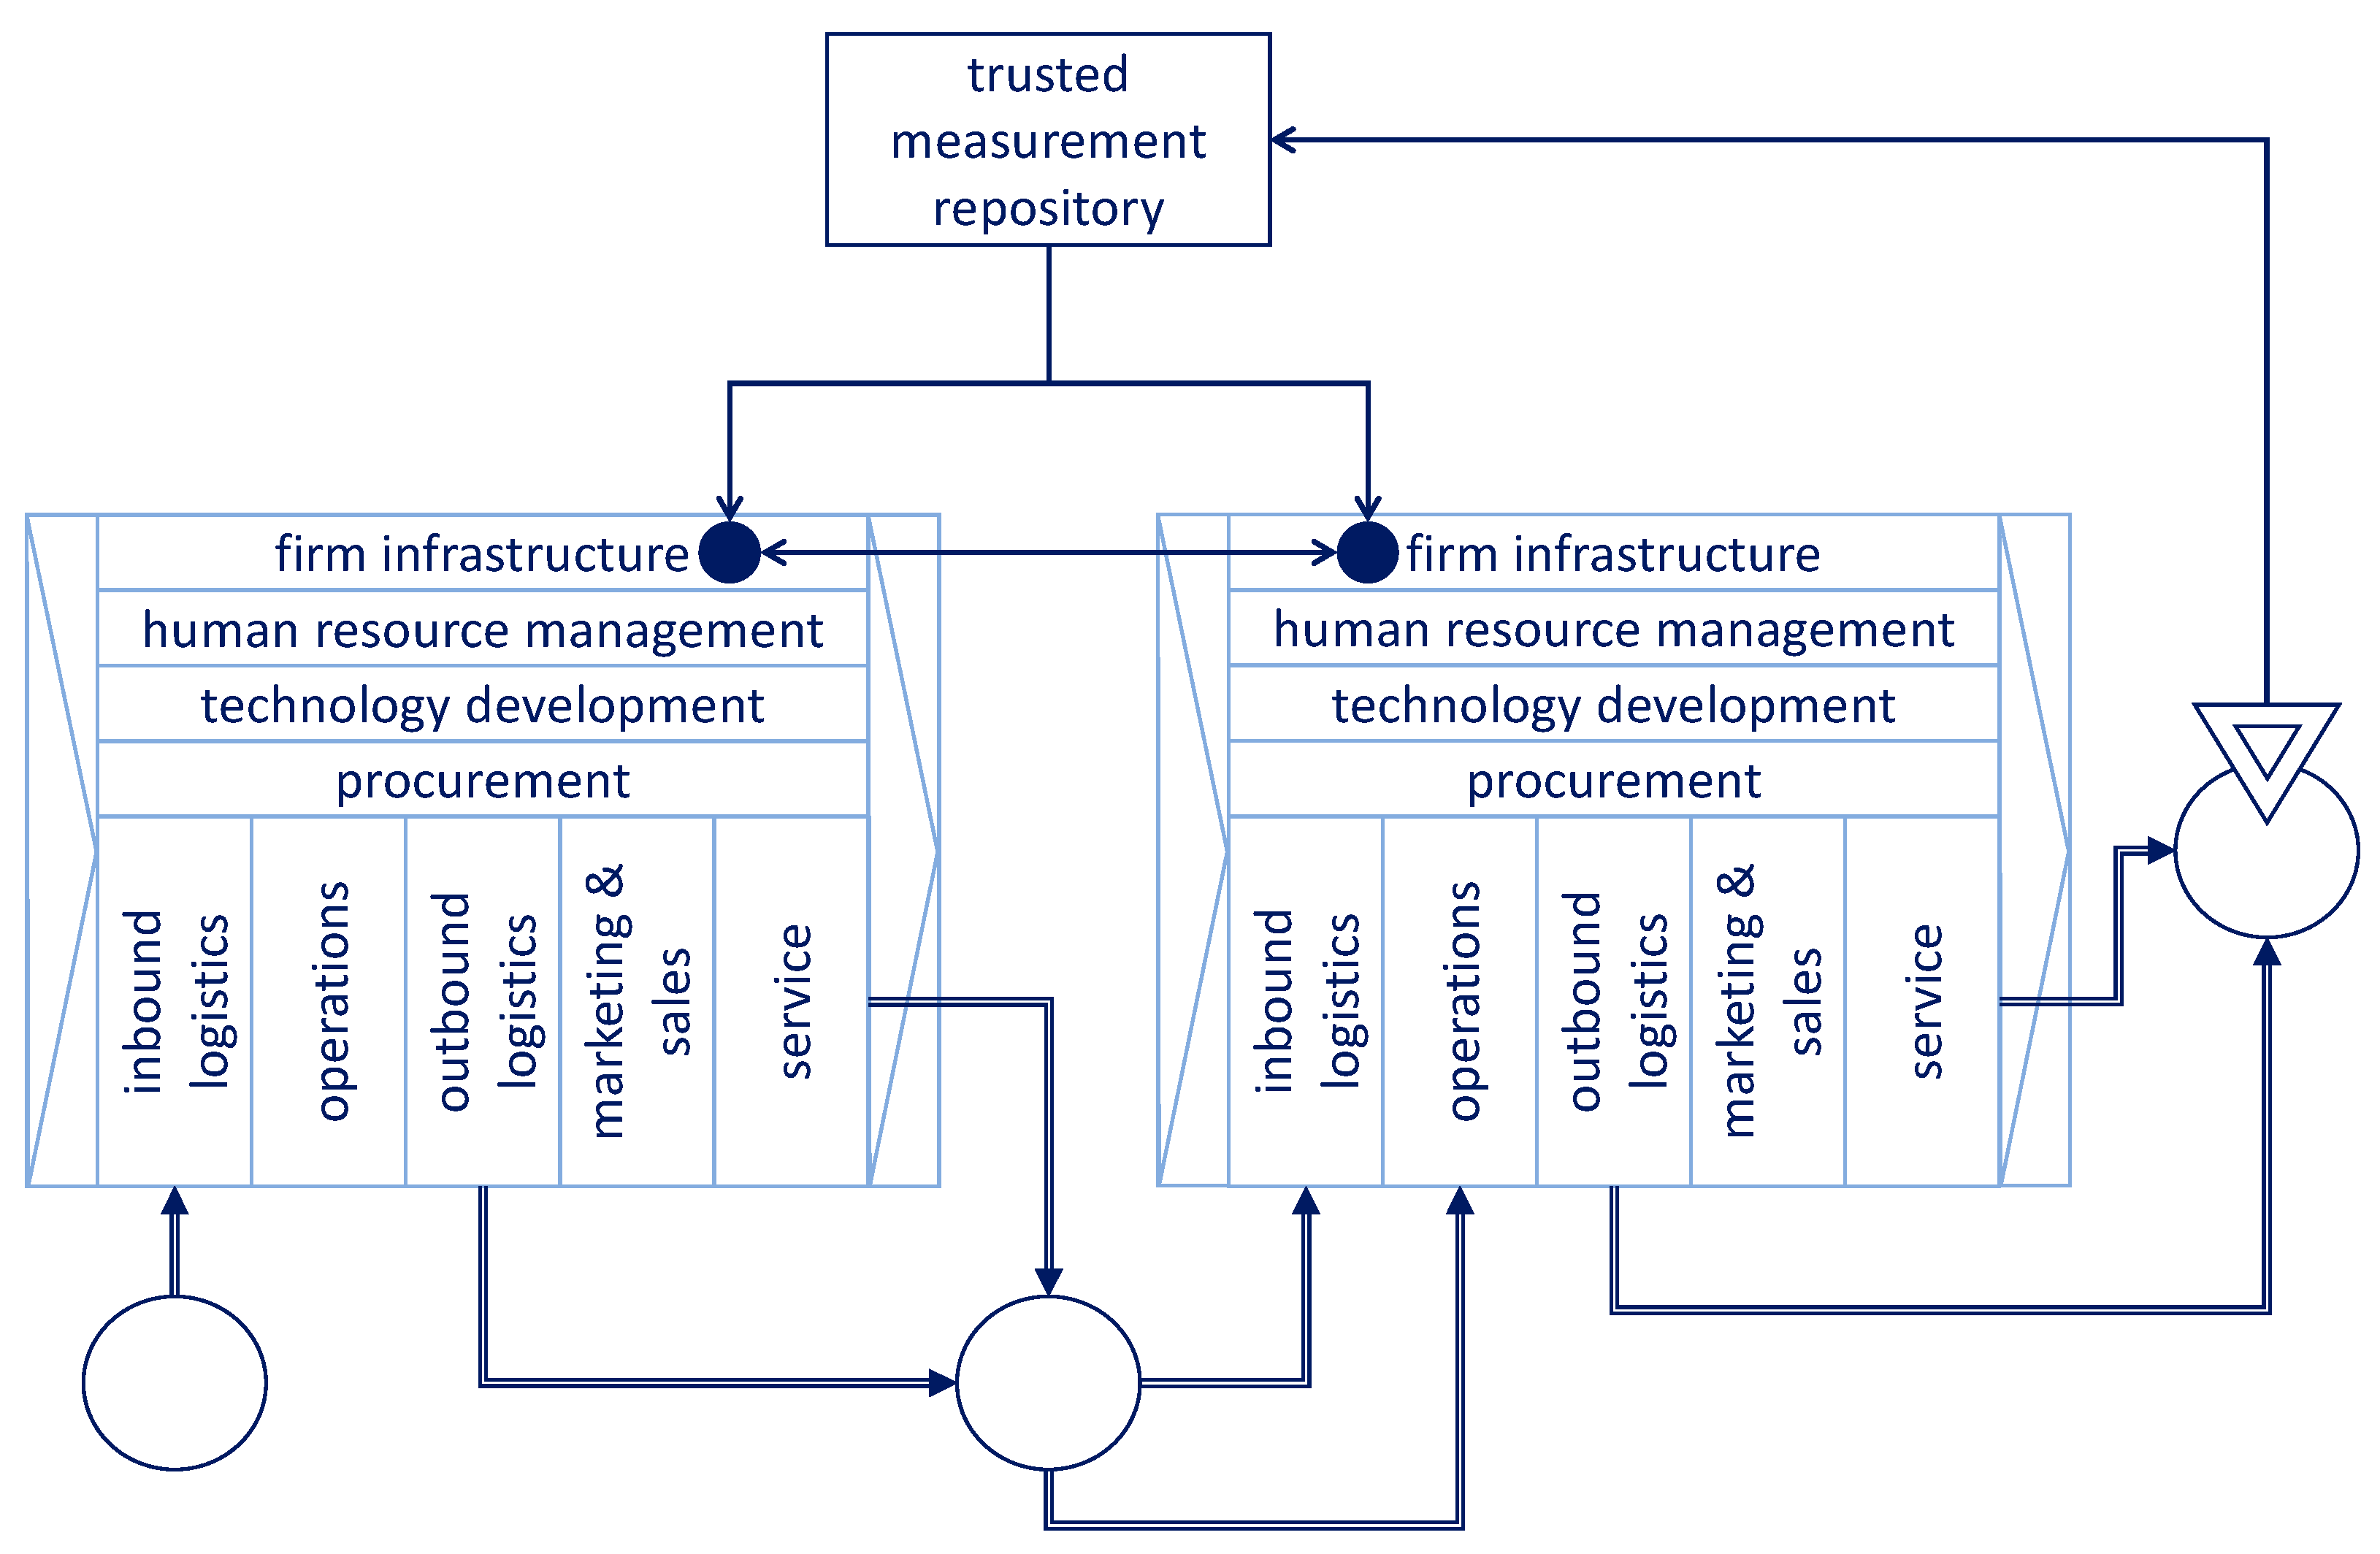
There is one technical consideration that we need to include into our framework. A sensor element may produce frequent readings. This depends among other things on its type, as discussed in Section 5.1: IoT- or CPS-based sensors with a push mechanism may produce readings that are much more frequent than strictly required for the outcome management mechanism. Storing these readings in a blockchain platform is costly from a computational perspective if the platform is owned by the partners and from a financial perspective if a third-party blockchain provider is used. For this reason, an aggregation of sensor readings may be required on the customer side [56]. Like the sensor itself, this aggregator needs to be of a trusted (certified) kind. This extension of the model is shown in Figure 13.
A private blockchain network may suit this scenario. In this case, the nodes of the network can be run by the provider and customer but also by a third-party blockchain system provider. In case a public blockchain is required to improve the level of transparency, specific technology such as Layer 2 Ethereum networks [57] or IOTA [58] may be considered. Layer 2 Ethereum networks, such as Polygon (https://polygon.technology/, accessed on 23 February 2023), provide higher performance and scalability, as well as lower costs, by processing transactions on a limited-scale network that synchronizes its state only at regular intervals with the main Ethereum network. IOTA [58] provides an immutable distributed storage environment that requires neither its nodes to pay fees when submitting new transactions nor miners to perform computational work or stake their cryptocurrency to produce new blocks. As such, it is well-suited to high-frequency IoT transactions. Note that information in a public blockchain is public, so the customer should store encrypted data in the blockchain and grant the provider the key to decode such data.
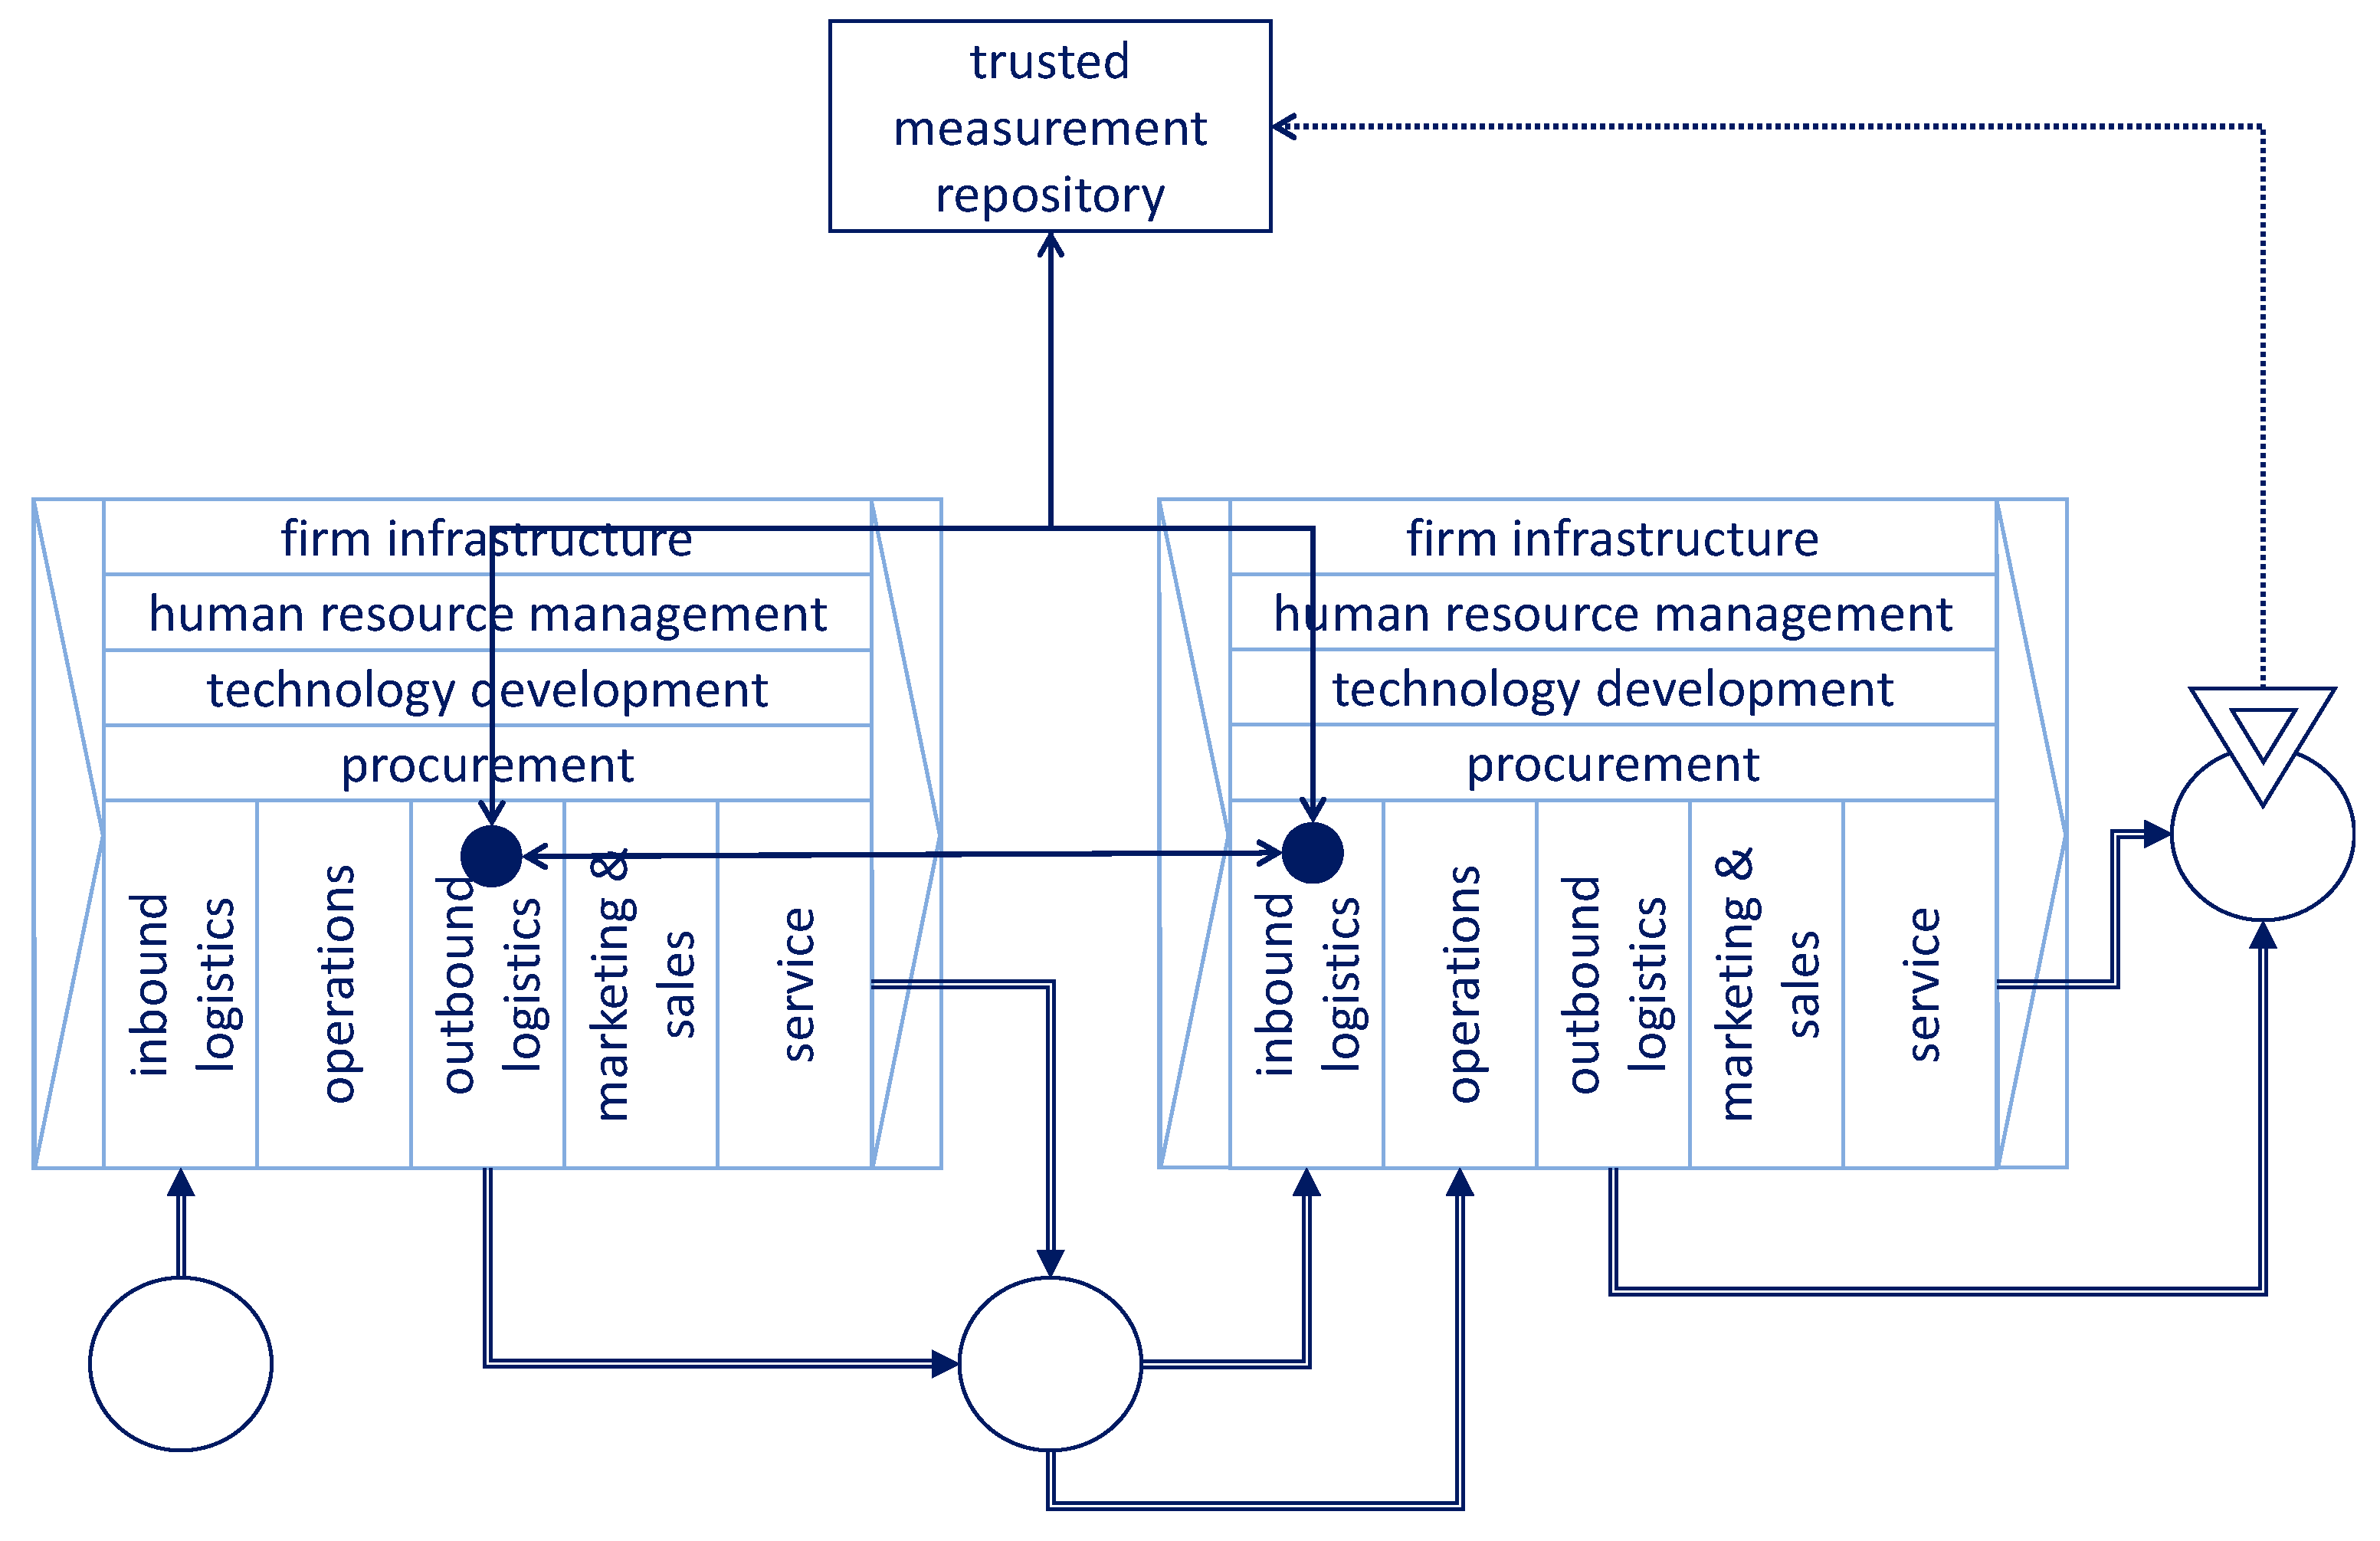
With a blockchain platform in place for outcome management, the platform can—obviously—also be used for creating trust in the “traditional” elements of the business relation, such as in keeping a log of the delivery of manufactured products. In this case, the outbound logistics function of the provider and the inbound logistics function of the customer use the blockchain platform for the digital administration of goods movements between the organizations. This is illustrated in Figure 14 by the arrows between the two involved logistics functions and between these and the trusted measurement repository. This mechanism does not directly rely on the outcome measurements—hence we have dotted the data flow between sensor and repository.

7.2. Trust between Customers in Competitive Markets

The application of outcome management in a multi-customer outcome management scenario brings a very different aspect of trust to the table. In such a scenario, a provider serves multiple customers by helping each of them individually to achieve their desired outcomes. A customer typically, however, does not want their private business data to be potentially visible to the other customers, such as because they operate in the same market and are in a competitive relationship. In addition, obviously, sensor measurement data in outcome management is typically sensitive, as it is usually directly related to key performance indicators of a customer.
To create a situation of trust in such a scenario, we need to keep the sensitive, private data with the customer that generates the data and move some of the business intelligence logic of the regulator element to that customer. This decentralized business intelligence logic performs the “local intelligent preprocessing” of the data, such that only non-sensitive, abstracted data needs to be sent to the provider party, which manages the central part of the business intelligence. The provider makes the decentralized part of the business intelligence mechanisms available to each individual customer. This situation is shown in Figure 15. In a practical scenario, the customer side of the figure (the customer functions, the sensor element, and the decentral part of the regulator) is replicated for each individual customer (as shown by the light dotted box in the figure).
To operationalize the trust mechanism for multiple (competitive) customers in an outcome management scenario, we can use federated learning concepts and technology [59]. Federated learning is a machine learning technique that enables a collaborative learning approach in which different customers can train a neural network while the training data never leaves the organization. It applies to many forms of machine learning, including linear models, decision tree-based variants, and deep neural networks. In its basic case, each contributor trains a local model and shares the model parameters with the other contributors. This is typically carried out via an aggregator (the provider in our model), which merges the individual models into a new common model. Federated learning is applied to construct predictive control systems (regulators in the context of our framework) that employ classification or regression machine learning models [60]. Regarding descriptive regulators, there are approaches to federated clustering where clusters can be seen as data descriptors [61].
To further enhance the privacy of customers in a federated scenario, secure multi-party computations [62] can be used to prevent the regulator from learning about the individual updates, as can differential privacy [63] to prevent reengineering the used learning models.

7.3. Application to the HBM Case

In the HBM case, HBM makes large investments by making buses available to bus operators to realize their outcomes, as well by providing service on these buses. Consequently, the bus operators make sizeable payments to HBM for their part in the realization of the outcomes. Given this, HBM has considered a third-party blockchain operator to provide a private trusted measurement repository for the storage of outcome measurements—for all three kinds of outcomes (O1, O2 and O3). Alternatively, the customer may store the encrypted outcome measurements on a public blockchain such as Ethereum, thereby reducing the storage costs through a Layer 2 network.
As bus operators served by HBM may be competitors in specific transport markets, HBM employs a distributed business intelligence solution based on federated learning. Using federated learning, competition-sensitive details of bus operation can be abstracted from. A typical example of such details can be found on ridership details on specific bus routes (where multiple operators may be active in the same urban area). An updated version of the logic of the decentralized portion of the regulator is periodically distributed by HBM to all the participating bus operators. Part of this logic can be run on the on-board system of buses to directly process readings from onboard sensors. This portion can be updated via the channel for new releases of the overall onboard software of the busses.

8. A Reference Operations Model and Reference Architecture for COM in SM

In this section, we combine the discussions of the previous sections into two models: an overall reference operations model for customer outcome management in smart manufacturing and a reference architecture for customer outcome management in smart manufacturing. Combined with the conceptual customer outcome management model introduced in Section 3, these two reference models are used in the design of the system landscape and system requirements for customer outcome management in a concrete application setting. This is illustrated in Figure 16.
Put briefly, the reference operations model provides guidance with respect to what is to be achieved in an outcome scenario (i.e., the business operations view) and the reference architecture provides guidance with respect to how to implement this with advanced IT (i.e., the digitization view). We discuss the two reference models in the two subsections below.

8.1. The Reference Operations Model

The aim of the reference model is to be a guiding tool in two kinds of process.
First, the reference model is designed to help in operationalizing a customer outcome scenario in which the outcomes to be managed have been clearly defined. In this process, the reference model guides making structured and informed choices of which technologies to employ in which way, i.e., with which variations as presented in the previous three sections of this paper. Hence, the model helps in a top-down structured design process to bridge the world of business requirements (defined as outcomes) to IT infrastructures needed to perform the data processing for outcome management.
Second, the reference model is designed to explore the implications of various choices in a scenario in which the outcomes to be managed are not yet clear. This aids in determining which outcomes are feasible to be managed, given constraints in available (or achievable) data and data processing mechanisms, as well as the “controllability” of provider business functions required for managing specific outcomes.
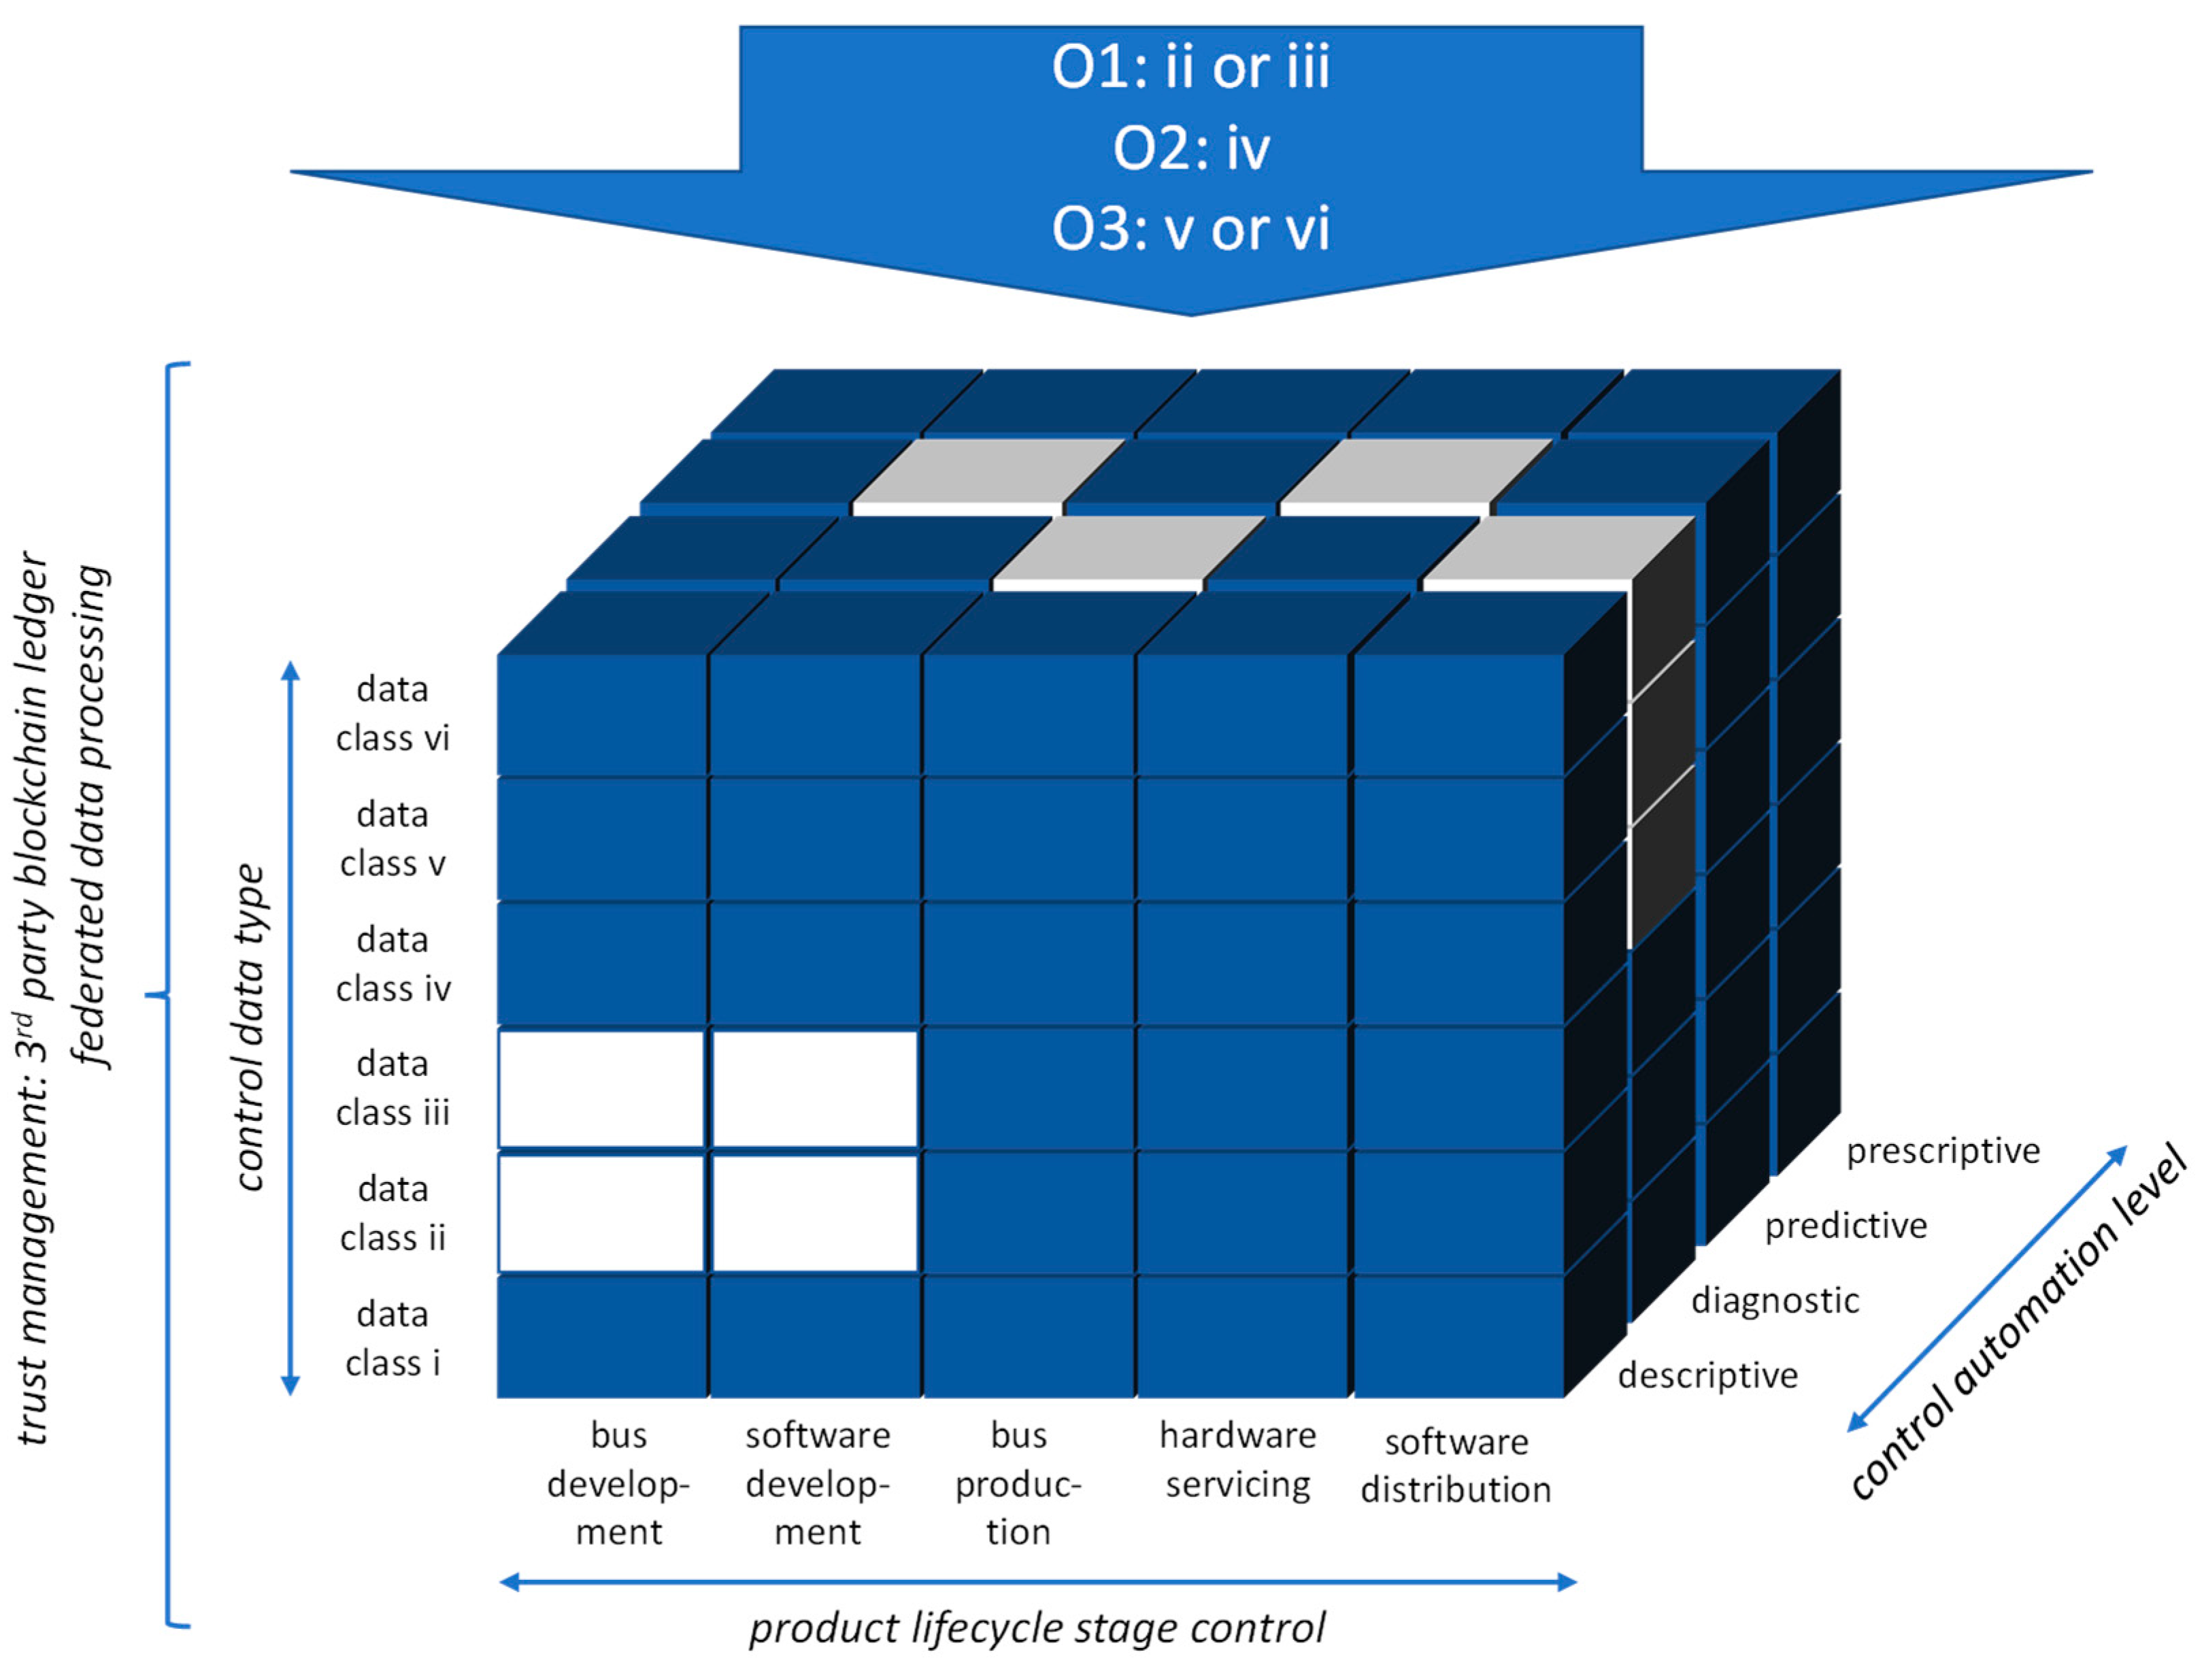
The reference model is shown in Figure 17. Start with definition of outcomes to be managed. Trust management choice depends on specific kind of data, which in essence can be any of the identified data types.
Choices can lead to “short” and “long” feedback loops as illustrated in Figure 18. In this figure, we see the relevant business functions of the provider on the left side and the business functions of the customer on the right side. The functions of the provider have been identified in Section 4.1. For reasons of brevity, we omit a Porter-style analysis of the customer side and concentrate on deployment of the product delivered by the provider and the functions for internal realization of outcomes respectively external (in the market of the customer) realization of outcomes. The shorter feedback loops (for example between product deployment and product servicing in Figure 18) may be found in existing value chain configurations. The longer feedback loops (feeding data back from internal and external outcomes realization) are the ones that are specific to customer outcome management and are rarely found in current value chain practice.
All combinations of provider and customer functions as shown in Figure 18 are possible in principle as a basis for a feedback loop. This leads to all cells shown in Table 8, in which we have marked the three combinations shown in Figure 18 for illustrative purposes. The “easier”, more traditional feedback loops are in the bottom-left corner of the table; the “harder”, more advanced loops are in the top-right corner.

8.2. The Reference Architecture

In the previous subsection, we have presented a reference operations model for business outcome management. To support this model with digital systems to arrive at a data-driven solution, we mapped the control model to a reference architecture that identifies the main systems involved as well as the required interfaces between them. The reference architecture is meant as a blueprint to facilitate organizations in designing digital support for outcome management scenarios. Consequently, it can be considered a preliminary facilitation architecture to be applied in multiple organizations or a Type 5 reference architecture in the framework presented by Angelov et al. [64]. We present the reference architecture at two levels: a collapsed architecture that gives a high-level overview and an expanded architecture that provides more detail.
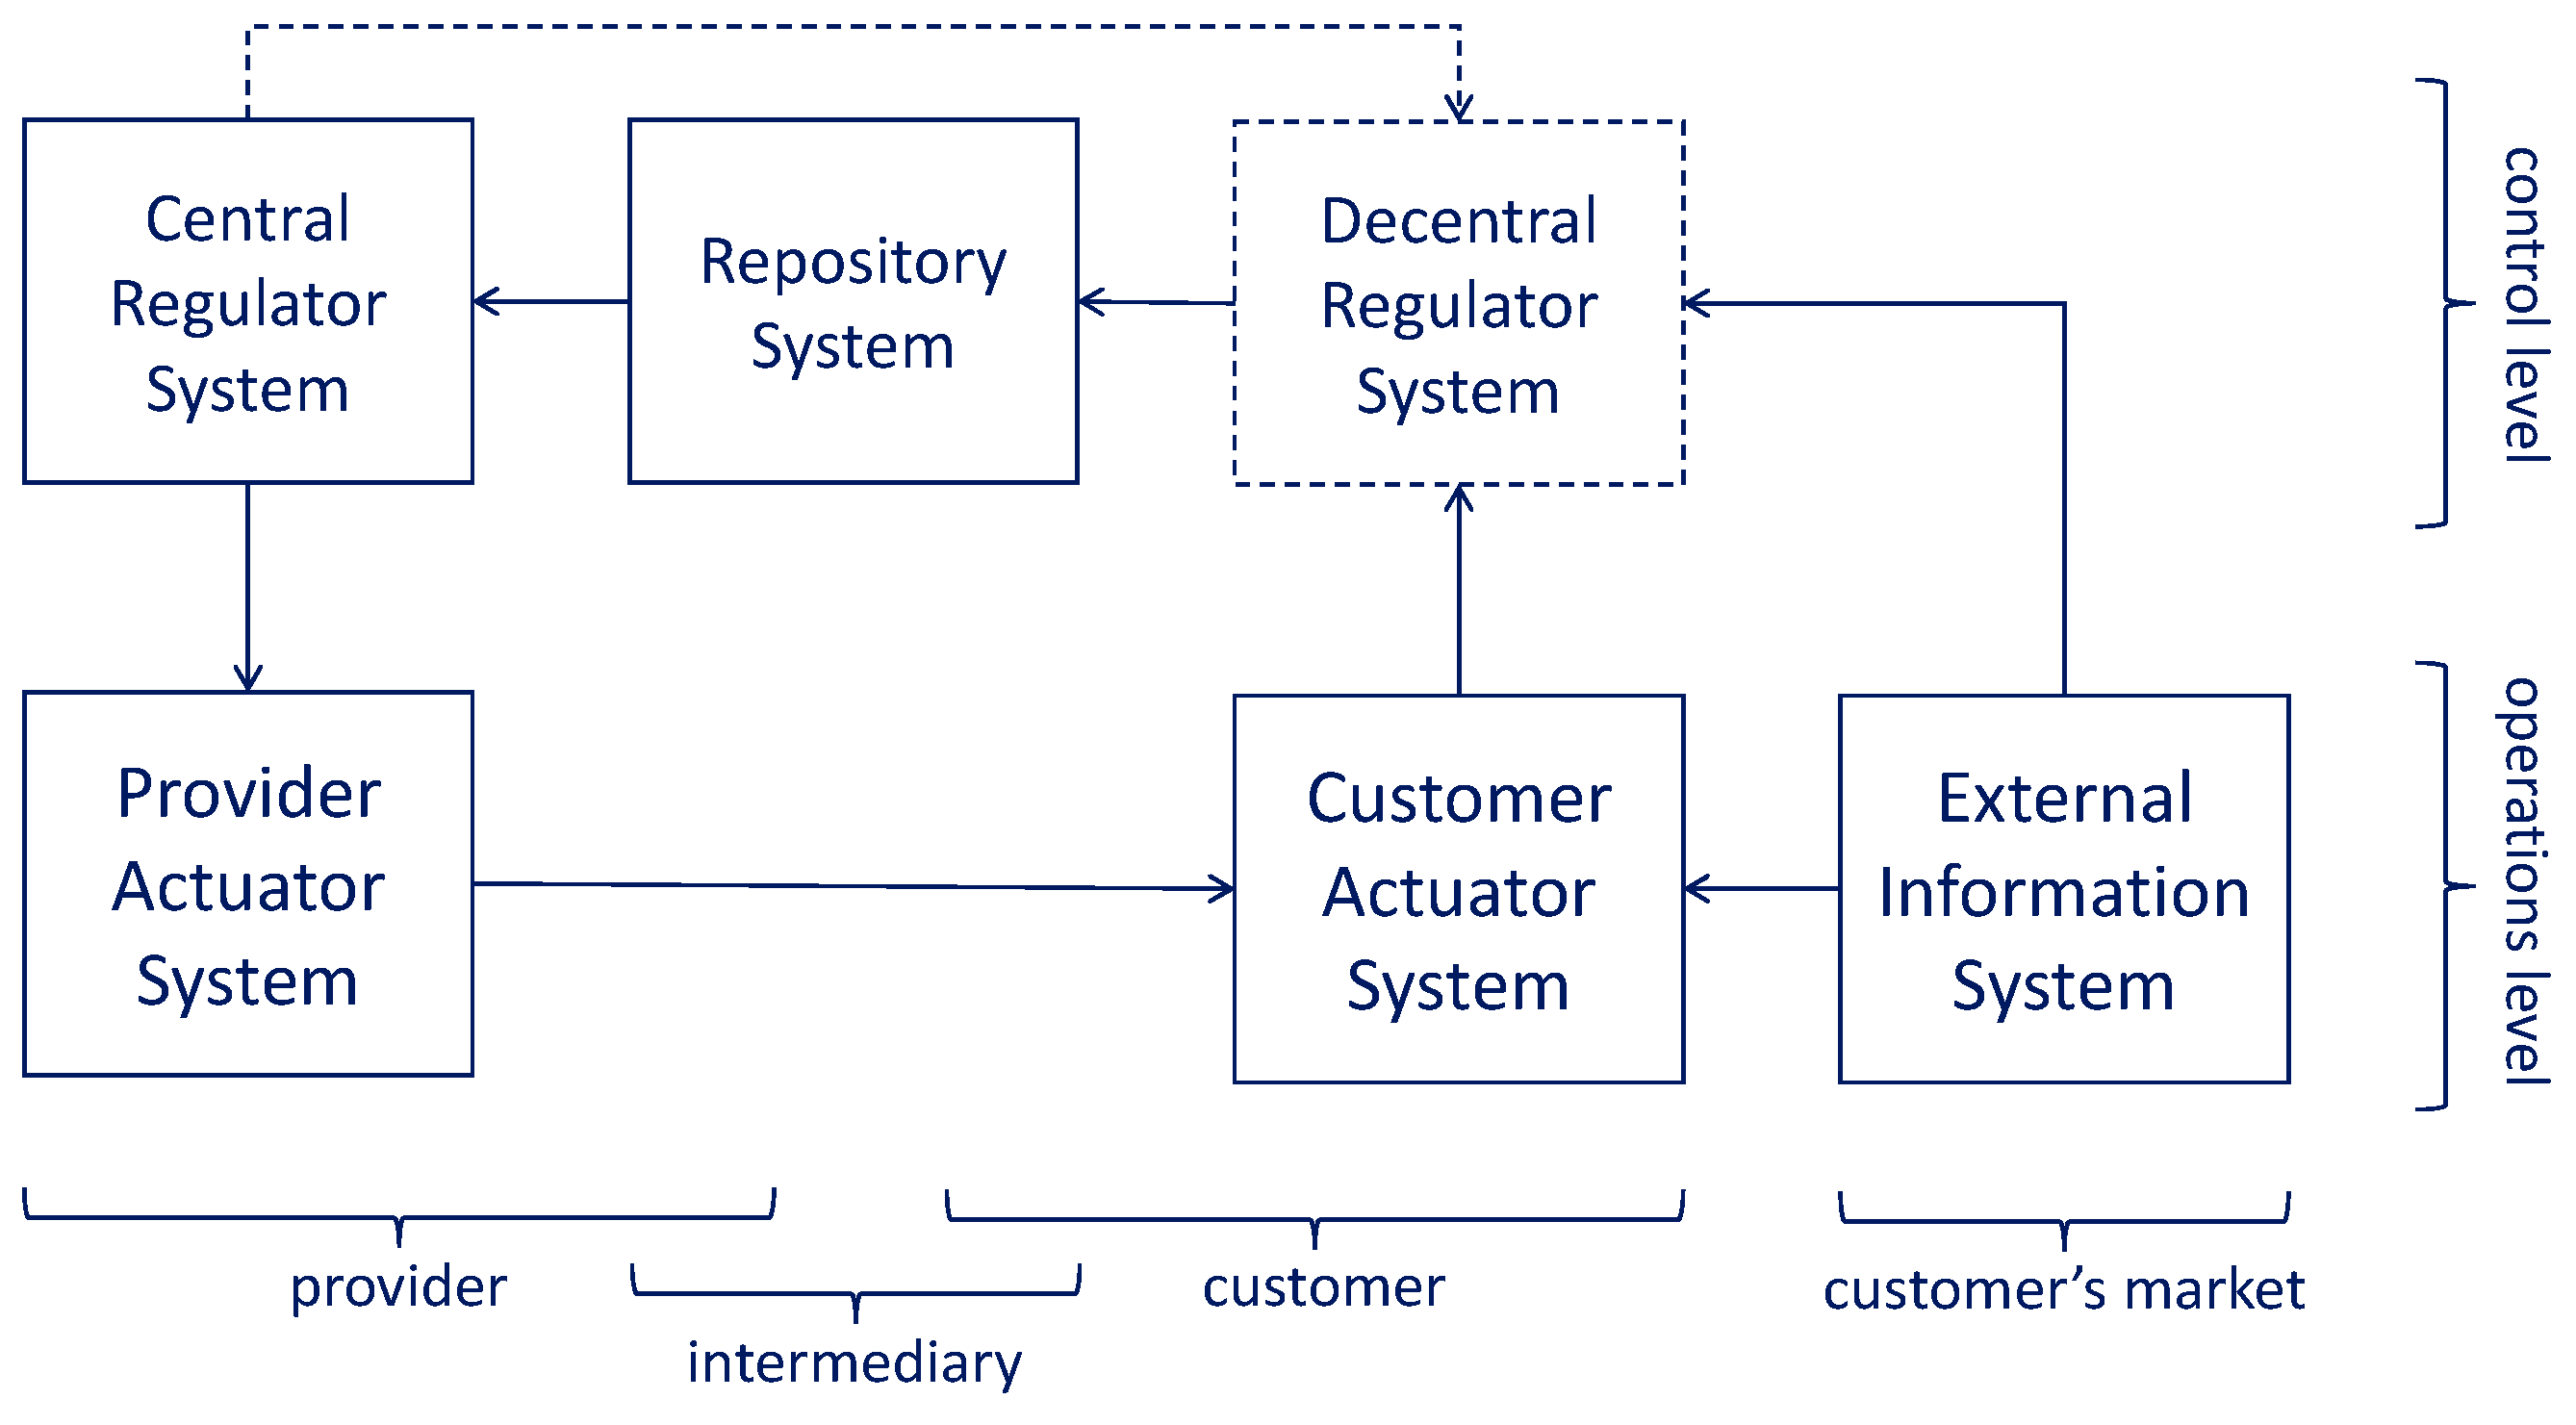
The collapsed architecture is shown in Figure 19. We see that this architecture contains an operations level, at which the systems that directly support the operations of the organizations involved are located. It also contains a control level, at which the systems that implement the control loop of the cybernetic model that underlies the outcome management scenario are located. At the operations level, the provider and customer have their actuator systems, and an external information system is included (run by a third party) that is necessary in case a sensor of Type v or Type vi (see Table 4) is involved. These systems encapsulate the sensor element(s) of the outcome management mechanism. At the control level, there is a decentralized regulator system in case a federated approach is used (as discussed in Section 7.2). It is not necessary if the regulator is fully located at the provider side (therefore, it is shown with a dashed box). The repository system can be located in various places, depending on which mechanism is used and who controls it (as discussed in Section 7.1).
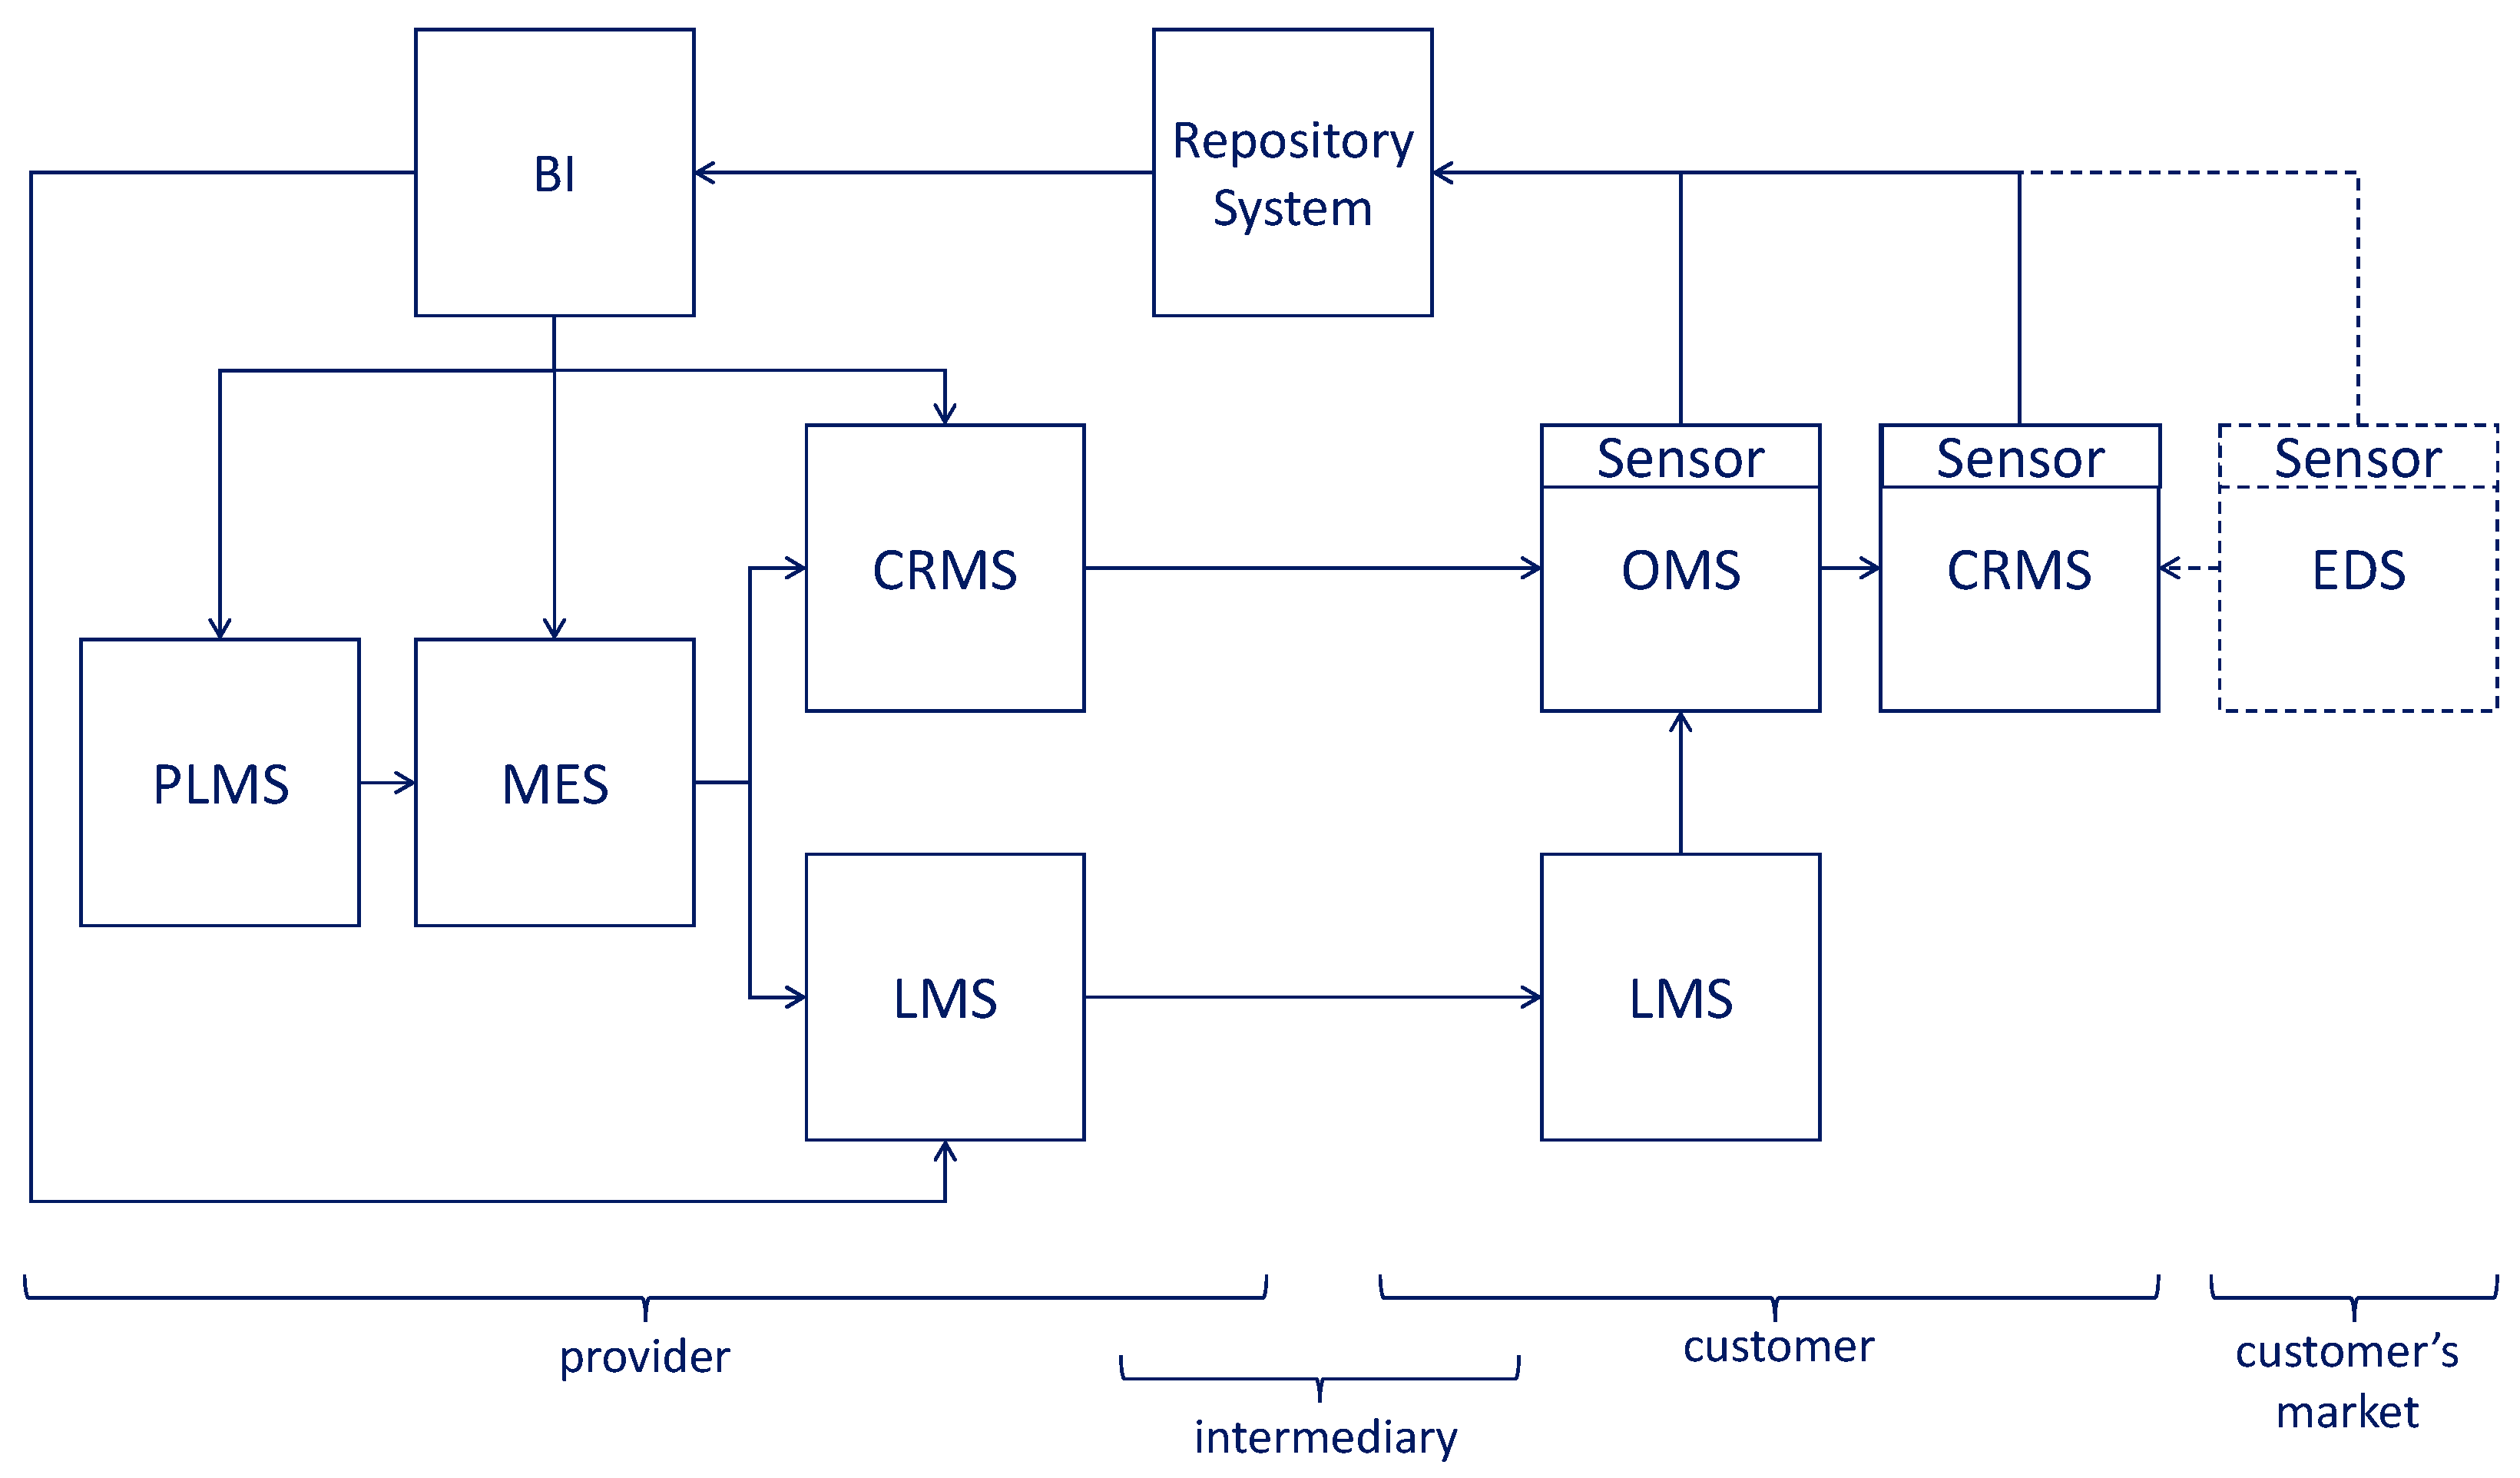
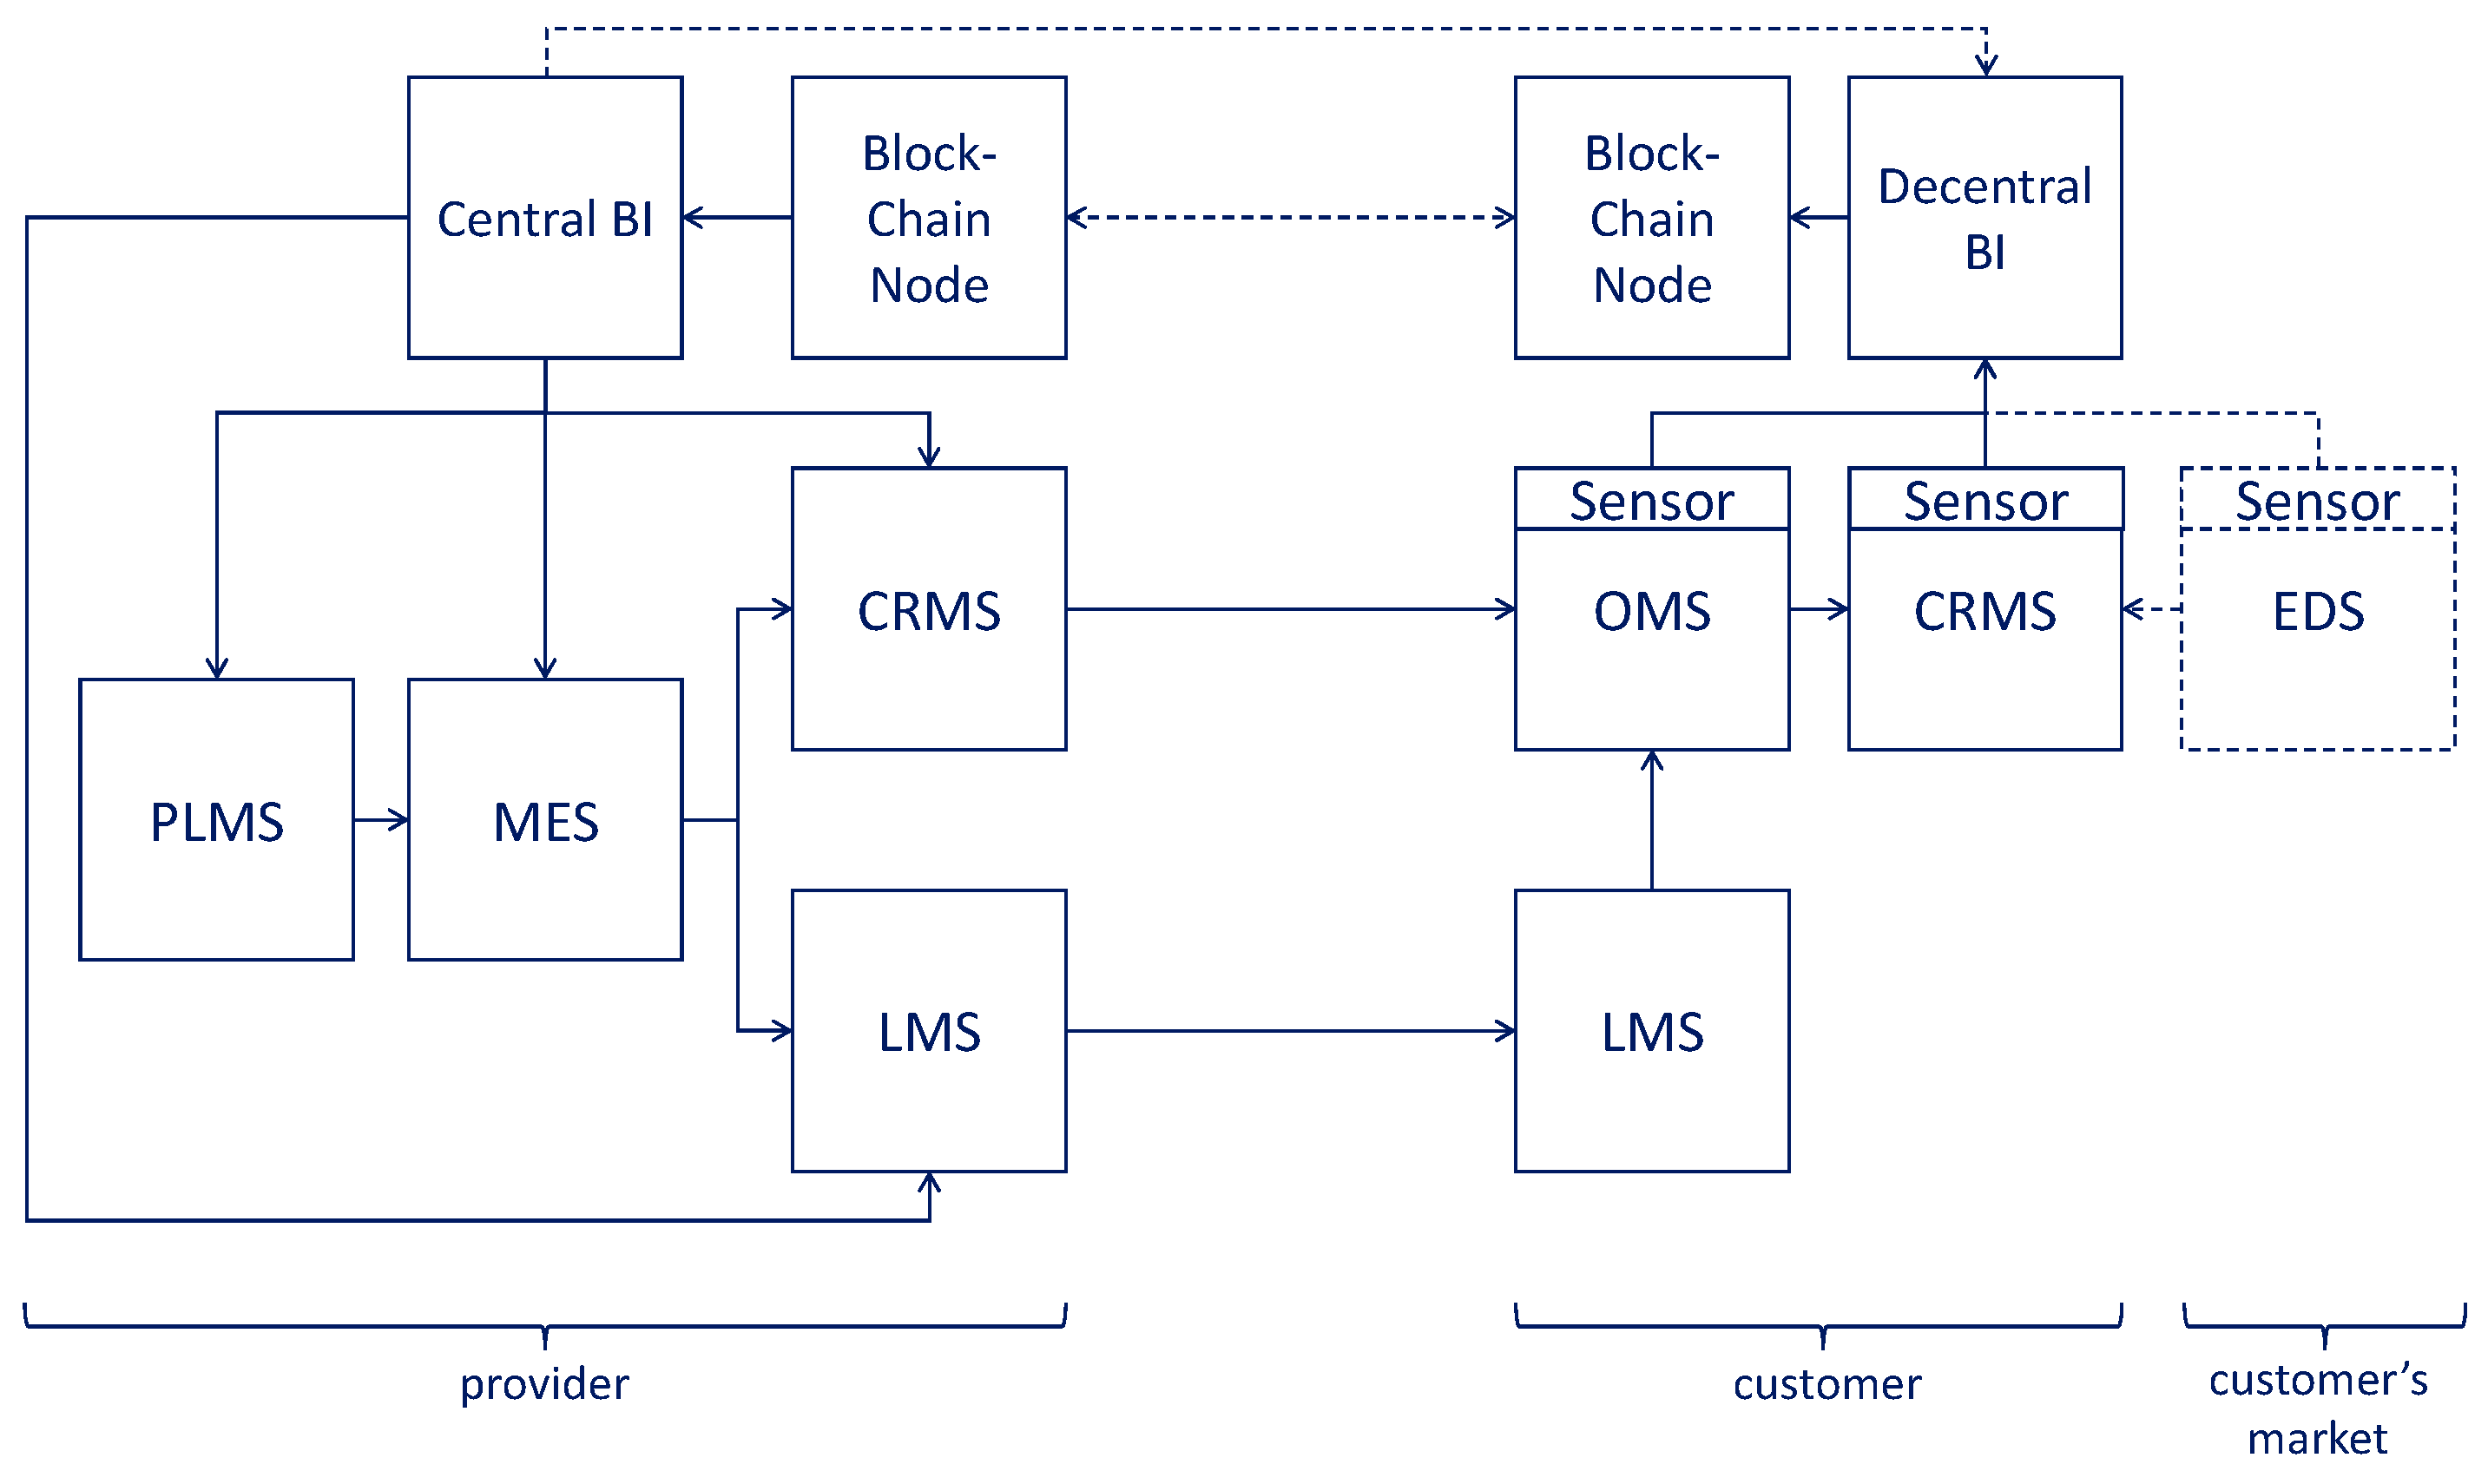
To detail the collapsed reference architecture of Figure 19, we map the business functionality of Figure 15 to a typical system landscape found in a smart manufacturing context to arrive at the expanded reference architecture. In expanding the collapsed architecture, we identify system types that realize specific functionality related to the business functions that we have identified in Section 4.2. Note that this functionality—or part of it—may be controlled by an end-to-end manufacturing process management system (MPMS) [38]. For reasons of clarity and brevity, we omit this layer in the discussion below, as its explicit inclusion introduces many variations depending on the chosen system landscape in a particular context.
Depending on the choices that we make with respect to support for explicit trust management (as discussed in Section 7), we can have two variations of the expanded reference architecture (with the possibility of a hybrid between the two).
The variation of the expanded reference architecture without support for explicit trust management is shown in Figure 20. As discussed with the collapsed reference architecture, at the control level, the repository system for outcome measurements can be located with the provider, the customer, or a third-party intermediary. At the operations level, we find a number of systems as detailed below.
On the provider side, we find four main systems in the manufacturing domain related to the business functions identified in Section 4.2:
  • A product lifecycle management system (PLMS) supports technology development (product engineering).
  • A manufacturing execution system (MES) supports manufacturing shop floor operations.
  • A logistics management system (LMS) supports the outbound logistics of manufactured products to the customer.
  • A customer relations management system (CRMS) supports service towards the customer.
On the customer side, we show a very general set of systems, as the precise set depends on the business domain the customer is in. We have the following systems:
  • A logistics management system (LMS) supports the inbound logistics of manufactured products from the provider.
  • An operations management system (OMS) manages the core business process of the customer (the actuator in our model that directly generates the outcomes). The precise nature of the OMS is heavily dependent on the business domain of the customer. The OMS may consist of a number of more specific systems. It can include sensor(s) of types i to iv.
  • A customer relations management system (CRMS) that is faced towards the market of the customer and is involved in collecting outcome measurements from that market. It can include sensor(s) of types i and ii.
  • An optional external data system (EDS), which is not in the domain of the customer, but provides external customer outcome measurements. If present, it includes sensor(s) of types v and vi.
The variations of the expanded reference architecture with support for explicit trust management are shown in Figure 21. The operational level is the same as that of Figure 20. At the control level, we have included support for explicit trust management in the form of blockchain and federated learning systems. The architecture explicitly shows that each organization has its own blockchain nodes. The blockchain network takes care that all organizations have the same view of the data in the blockchain. The details of the synchronization mechanism [56] are not relevant to the outcome management mechanism; hence the connection between the blockchain nodes is shown with a dashed arrow.
We show a concrete elaboration of the expanded reference architecture in the discussion of the HBM case study in Section 8.4.

8.3. Positioning in RAMI4.0 and OT-IT Connection

In Section 2, we have positioned our approach with respect to the RAMI4.0 framework [18], stating that the main control mechanism for the manufacturer is positioned between the connected world and work centers level of the hierarchy levels dimension of the framework. The overall outcome management feedback loop is obviously at the connected world level, as it connects multiple organizations. The business functions as identified in Section 4.2 and shown again in Table 8 are at the work centers level. When going down into the details of the actual actuation of activities at the provider level, however, lower levels of the hierarchy levels dimension are involved. This can involve manufacturing business processes [22,38] or specific functional systems, as discussed in the next subsection on the reference architecture for customer outcome management.
On the customer side, we have the sensors. These sensors can be positioned at low levels of the hierarchy levels dimension of RAMI4.0: physical sensors are typical at the field device level, though they may be encapsulated by digital systems one or two levels up. External sensors may be at a much higher level, up to the connected world level. A regulator in our framework is typically positioned at the enterprise or work center level. All of this means that various hierarchy levels have to be covered and connected to achieve full customer outcome management. Consequently, the levels of what are often considered operational technology (OT) and information technology (IT) in manufacturing contexts have to be integrated, and typical OT-IT dichotomy problems [28] have to be addressed.

8.4. Application to Case Study

In this section, we apply the reference model and reference architecture introduced before in this section to the HBM case study.
Figure 22 shows the application of the reference model to the case study. We see that the identified outcomes to be managed (O1, O2, and O3—as identified in Section 3.3) are the starting point for all further considerations. These are mapped to their characteristics along the three dimensions of the model, using:
  • the considerations in Section 4.3 for the mapping of outcomes to business functions (leading to the details of the product lifecycle stage control dimension of the reference model);
  • the considerations in Section 5.2 for the mapping to the control data type (leading to the selection of data types in the vertical dimension of the reference model);
  • the considerations in Section 6.4 for the mapping to control automation levels in the respective dimension of the reference model;
  • the considerations in Section 7.3 for the selection of trust management characteristics governing the exchange of outcome data, as shown in the left side of the reference model.
Though complicated at first glance, the reference model shows the main characteristics of data processing for outcome management by sensors and regulators, as well as the actuated business functions. As such, it is the basis for the embodiment of the reference architecture for the case study.
Figure 23 shows the application of the expanded reference architecture to the HBM case study. The architecture is based on the variation with support for explicit trust management (as shown in Figure 21). The decision has been made to make two modifications to the reference architecture (apart from specializing the systems towards the application scenario of HBM). Firstly, HBM does not have a separate CRM system that can be used in the control loop of the outcome management scenario. HBM has CRM functionality in their enterprise resource planning (ERP) system, but this is used at too aggregated a level to be useful here. Secondly, HBM produces hardware and software (busses and onboard software systems)—the production of the former is managed by an MES, the production of the latter by an application management system (AMS, which can be seen as a PLMS/MES for software production).
By separating MES and AMS in this architecture, it becomes evident that there are two outcome-provisioning channels between the bus manufacturer and a bus operator: one for hardware (the buses and spare parts for them) and one for the onboard software in the buses.

9. Outlook and Conclusions

This paper presents a vision for a complete mechanism for customer outcome management in an advanced smart manufacturing scenario. For the smart manufacturing industry, we see outcome-based business as THE next logical step in the product-to-value ladder that we see in many markets:
  • Traditionally, markets were based on selling products (such as cars in the automotive market)
  • Then, markets (partially) transformed into selling period-based usage contracts (such as lease contracts in the automotive market)
  • Next, mechanisms were developed to shift to pay-per-use models (such as pay-as-you-go models in the automotive markets, e.g., ShareNow (https://www.share-now.com, accessed on 23 February 2023))
  • Finally, in outcome-based thinking, we move to not being paid for the product or the use of the product, but for the value that the use of the product brings (such as actual transport performance in the automotive market)
The customer outcome management mechanism that we propose takes all main business functions in a manufacturing organization into account in a data-driven business control loop, including product design, production, and after-sales service. This means that it goes beyond using data only for the optimization of the core production processes as in more narrowly-focused smart manufacturing approaches and even beyond approaches that include product design next to production, such as [65].
The customer outcome management approach provides new opportunities in a world that is based on more dynamic, value-based relations between providers and customers. In our running case in this paper, we provide an example from the business-to-business (B2B, in this case bus maker-to-bus operator) automotive domain. In this case, outcome management provides new forms of business interaction, allowing more dynamism but also better coupling between provider and customer goals. Outcome management can also play a role in business-to-consumer (B2C) markets. An interesting example from the automotive domain is an electric car maker that sells optimal transportation as an outcome to individual car owners—where optimal transportation for electric cars is heavily dependent on battery usage and available driving range. This requires a broad range of sensors and trusted processing of sensor readings (because of privacy concerns of the drivers), as well as a regulator with advanced analytics to optimize car characteristics, engine and battery use, and driving instructions to the user (as a form of service). Exploring B2C manufacturing scenarios is an interesting field for further research.
The fact that many products—such as in the automotive market—become networked opens possibilities in this direction for the producers of these products as an outcome provider. They can consider selling the performance of their products (such as uptime) instead of selling the hardware of the products. As a side note, outcome-based thinking can also work for a manufacturing firm in the role as a customer. To create and maintain networked product solutions, they may have outcome-based contracts with their digital infrastructure solution provider. This opens new ways to flexibly digitize their ecosystem. In this way, a network of outcome-based business can be built.
As we have shown in Section 7, customer outcome management can take input from various customers, using explicit trust management mechanisms where these customers are in a competitive relationship. This input can in principle be used to specialize outcome delivery for specific customers, i.e., bring the principle of mass customization in smart manufacturing [66,67] into the customer outcome management paradigm. Mass customization, however, is not a general requirement to serve multiple customers in an outcome management scenario: customers with different variations in outcome definition can be served by the same outcome management mechanism (driven by all their outcome measurements, as discussed in Section 7). Hence, we see mass customization as an add-on to customer outcome management in smart manufacturing. As the customer outcome management paradigm in itself is complex and can be readily applied in a multi-customer context, we have not included this possible extension in this paper. It is interesting for possible future work, however.
Our outcome management mechanism is based on the business and organization perspectives and is operationalized with several classes of advanced IT. The business and organization perspectives are structured in the presented reference model and the classes of IT in the presented reference architecture. As such, it can be regarded as guidance for smart manufacturing organizations that want to make a digital transformation towards outcome-based markets. In making such a digital transformation, not all elements need to be realized in one step. The presented reference model and reference architecture provide a basis for a structured, step-wise approach.
As this paper is intended to be a vision paper on the interface between academic development and industrial deployment, we cannot present a full evaluation of our reference model and architecture yet. Experience in evaluating elements of our overall approach to outcome management (as presented for example in [9]) provides positive feedback, however. In future work, we intend to perform more organized evaluation of our contributions. One of the points that need some improvement towards more practical use and evaluation is the reference model as presented in Section 8, as the three-dimensional model may be hard to use in practice—details of this improvement are part of future work.
Additionally in future work, it will be interesting to cover business functions in the actuating business process that we have left out of scope in this paper: recycle/disposal of manufactured products (to couple outcome engineering to support for cradle-to-cradle manufacturing and a circular economy concept) and procurement (to include just-in-time buying strategies into our approach).

Author Contributions

Conceptualization, P.G., I.V., A.W., M.C., H.L., E.S., F.K. and M.B.; methodology, P.G.; validation, P.G., I.V., A.W., M.C., H.L., E.S., F.K. and M.B.; investigation, P.G., I.V., A.W., M.C., H.L., E.S., F.K., M.B. and M.P.; writing—original draft preparation, P.G., I.V., A.W., M.C., H.L., E.S., F.K., M.B. and M.P.; writing—review and editing, P.G., I.V., A.W., M.C., H.L., E.S., F.K., M.B. and M.P.; visualization, P.G.; supervision, P.G. All authors have read and agreed to the published version of the manuscript.

Funding

This research received no external funding.

Data Availability Statement

Not applicable.

Acknowledgments

Dillan Spijkers of Eviden Digital Transformation Consultancy is thanked for his proofreading of this paper.

Conflicts of Interest

The authors declare no conflict of interest.

References

  1. Accenture. Digital Business Era: Stretch Your Boundaries. In Accenture Technology Vision 2015; Accenture: Dublin, Ireland, 2015. [Google Scholar]
  2. Connerty, M.; Navales, E.; Kenney, C.; Bhatia, T. Manufacturing Companies Need to Sell Outcomes, Not Products. In Harvard Business Review; Harvard Business Publishing: Cambridge, MA, USA, 2016. [Google Scholar]
  3. Grefen, P.; Ludwig, H.; Tata, S.; Dijkman, R.; Baracaldo, N.; Wilbik, A.; D’Hondt, T. Complex Collaborative Physical Process Management: A Position on the Trinity of BPM, IoT and DA. In Proceedings of the 19th IFIP WG 5.5 Working Conference on Virtual Enterprises, PRO-VE 2018, Cardiff, UK, 17–19 September 2018; pp. 244–253. [Google Scholar] [CrossRef]
  4. D’Hondt, T.; Wilbik, A.; Grefen, P.; Ludwig, H.; Baracaldo, N.; Anwar, A. Using BPM Technology to Deploy and Manage Distributed Analytics in Collaborative IoT-Driven Business Scenarios. In Proceedings of the 9th International Conference on the Internet of Things, Bilbao, Spain, 22–25 October 2019; p. 19. [Google Scholar] [CrossRef]
  5. Grefen, P. Beyond E-Business: Towards Networked Structures; Routledge: Abingdon, UK, 2016. [Google Scholar]
  6. Barkai, J. The Outcome Economy: How the Industrial Internet of Things is Transforming Every Business; Createspace: Scotts Valley, CA, USA, 2016. [Google Scholar]
  7. Ng, I.; Xin Ding, D.; Yip, N. Outcome-Based Contracts as New Business Model. Ind. Mark. Manag. 2013, 42, 730–743. [Google Scholar] [CrossRef] [Green Version]
  8. Sjödin, D.; Parida, V.; Jovanovic, M.; Visnjic, I. Value Creation and Value Capture Alignment in Business Model Innovation: A Process View on Outcome-Based Business Models. J. Prod. Innov. Manag. 2020, 37, 158–183. [Google Scholar] [CrossRef] [Green Version]
  9. Grefen, P.; Wilbik, A.; Kuitems, F.; Blanken, M. Outcome-Based Business Design in IoT-Enabled Digital Supply Chain Transformation. In Proceedings of the 2021 IEEE International Conference on Internet of Things and Intelligence Systems (IoTaIS), Bandung, Indonesia, 23–24 November 2021; pp. 28–34. [Google Scholar] [CrossRef]
  10. Van Asseldonk, M. A Process Mining-Based Approach to Accounts Payable Recovery Audit; Eindhoven University of Technology: Eindhoven, The Netherlands, 2020. [Google Scholar]
  11. Atos. Smart Connected Vessels: Commercial Model. In Atos Codex IoT Services CT-200402; Atos: Bezons, France, 2021. [Google Scholar]
  12. IBM. The Customer-Activated Enterprise: Insights from the Global C-Suite Study; IBM Institute for Business Value: Armonk, NY, USA, 2013. [Google Scholar]
  13. Tao, F.; Qi, Q.; Liu, A.; Kusiak, A. Data-driven smart manufacturing. J. Manuf. Syst. 2018, 48, 157–169. [Google Scholar] [CrossRef]
  14. Industrial Internet of Things. Available online: https://en.wikipedia.org/wiki/Industrial_internet_of_things (accessed on 23 February 2023).
  15. World Economic Forum. Industrial Internet of Things: Unleashing the Potential of Connected Products and Services; World Economic Forum: Cologny, Switzerland, 2015. [Google Scholar]
  16. Gierej, S. The Framework of Business Model in the Context of Industrial Internet of Things. Procedia Eng. 2017, 182, 206–212. [Google Scholar] [CrossRef]
  17. Ren, G.; Nakamura, Y.; Ludwig, H. Service Value Modeling: A Systematic Method to Unveil the Business Value of Industry Solutions. In Proceedings of the 2014 Annual SRII Global Conference, San Jose, CA, USA, 23–25 April 2014; pp. 82–89. [Google Scholar] [CrossRef]
  18. Hankel, M.; Rexroth, B. The Reference Architectural Model Industrie 4.0 (RAMI4.0); German Electrical and Electronic Manufac-turers’ Association: Frankfurt, Germany, 2015. [Google Scholar]
  19. IEC. Enterprise-Control System Integration—Part 1: Models and Terminology, 2nd ed.; The International Electrotechnical Commission (IEC): Geneva, Switzerland, 2013. [Google Scholar]
  20. Blanchard, B.; Fabrycky, W. Systems Engineering and Analysis, 4th ed.; Prentice Hall: Upper Saddle River, NJ, USA, 2006. [Google Scholar]
  21. ‘t Veld, J. Analyse van Bedrijfsprocessen: Een Toepassing van Denken in Systemen; Wolters-Noordhoff: Groningen, The Netherlands, 2019. (In Dutch) [Google Scholar]
  22. Erasmus, J.; Vanderfeesten, I.; Traganos, K.; Grefen, P. Using business process models for the specification of manufacturing operations. Comput. Ind. 2020, 123, 103297. [Google Scholar] [CrossRef]
  23. Erasmus, J.; Vanderfeesten, I.; Traganos, K.; Keulen, R.; Grefen, P. The HORSE Project: The Application of Business Process Management for Flexibility in Smart Manufacturing. Appl. Sci. 2020, 10, 4145. [Google Scholar] [CrossRef]
  24. van Looy, A.; Shafagatova, A. Business process performance measurement: A structured literature review of indicators, measures and metrics. SpringerPlus 2016, 5, 1797. [Google Scholar] [CrossRef] [Green Version]
  25. Kang, N.; Zhao, C.; Li, J.; Horst, J.A. A Hierarchical structure of key performance indicators for operation management and continuous improvement in production systems. Int. J. Prod. Res. 2016, 54, 6333–6350. [Google Scholar] [CrossRef]
  26. Varisco, M.; Johnsson, C.; Mejvik, J.; Schiraldi, M.M.; Zhu, L. KPIs for Manufacturing Operations Management: Driving the ISO22400 standard towards practical applicability. IFAC-PapersOnLine 2018, 51, 7–12. [Google Scholar] [CrossRef]
  27. Tummers, A.; Grefen, P. Projecting a Complex IT Legacy Landscape onto Future Strategic Scenarios in the High-Tech Manufacturing Industry in Capital Goods. In Proceedings of the 7th International Conference on Information Systems, Logistics and Supply Chain, Lyon, France, 8–11 July 2018; pp. 230–239. [Google Scholar]
  28. Grefen, P.; Vanderfeesten, I.; Traganos, K.; Domagala-Schmidt, Z.; van der Vleuten, J. Advancing Smart Manufacturing in Europe: Experiences from Two Decades of Research and Innovation Projects. Machines 2022, 10, 45. [Google Scholar] [CrossRef]
  29. Grefen, P.; Türetken, O.; Razavian, M. Awareness Initiative for Agile Business Models in the Dutch Mobility Sector: An Experience Report; Beta Working Papers; Eindhoven University of Technology: Eindhoven, The Netherlands, 2016; p. 505. [Google Scholar]
  30. Türetken, O.; Grefen, P.; Gilsing, R.; Adali, O. Service-Dominant Business Model Design for Digital Innovation in Smart Mobility. Bus. Inf. Syst. Eng. 2019, 61, 9–29. [Google Scholar] [CrossRef] [Green Version]
  31. Molander, S.; Fellesson, M.; Friman, M.; Skålén, P. Market Orientation in Public Transport Research—A Review. Transp. Rev. 2012, 32, 155–180. [Google Scholar] [CrossRef]
  32. Shah, K.; Pan, S.Y.; Lee, I.; Kim, H.; You, Z.; Zheng, J.M.; Chiang, P.C. Green transportation for sustainability: Review of current barriers, strategies, and innovative technologies. Clean. Prod. 2021, 326, 129392. [Google Scholar] [CrossRef]
  33. Porter, M. Competitive Advantage: Creating and Sustaining Superior Performance; Free Press: New York, NY, USA, 1985. [Google Scholar]
  34. Nadisa, F. Implementing Green PLM to Reach Sustainability Goals: Challenges and Opportunities; TUE: Eindhoven, The Netherlands, 2023. [Google Scholar]
  35. Tao, F.; Cheng, J.; Qi, Q.; Zhang, M.; Zhang, H.; Sui, F. Digital twin-driven product design, manufacturing and service with big data. Int. J. Adv. Manuf. Technol. 2017, 94, 3563–3576. [Google Scholar] [CrossRef]
  36. Traganos, K.; Grefen, P.; Vanderfeesten, I.; Erasmus, J.; Boultadakis, G.; Bouklis, P. The HORSE framework: A reference architecture for cyber-physical systems in hybrid smart manufacturing. J. Manuf. Syst. 2021, 61, 461–494. [Google Scholar] [CrossRef]
  37. Zhang, Y.; Ren, S.; Liu, Y.; Sakao, T.; Huisingh, D. A framework for Big Data driven product lifecycle management. J. Clean. Prod. 2017, 159, 229–240. [Google Scholar] [CrossRef]
  38. Grefen, P.; Boultadakis, G. Designing an Integrated System for Smart Industry: The Development of the HORSE Architecture; Independently Published: Eindhoven, The Netherlands, 2021. [Google Scholar]
  39. Dumas, M.; La Rosa, M.; Mendling, J.; Reijers, H. Fundamentals of Business Process Management, 2nd ed.; Springer: Berlin, Germany, 2018. [Google Scholar]
  40. Mota, A.; Azam, S.; Shanmugam, B.; Yeo, K.; Kannoorpatti, K. Comparative analysis of different techniques of encryption for secured data transmission. In Proceedings of the 2017 IEEE International Conference on Power, Control, Signals and Instrumentation Engineering (ICPCSI), Chennai, India, 21–22 September 2017; pp. 231–237. [Google Scholar] [CrossRef]
  41. Madziel, M.; Campisi, T. Energy Consumption of Electric Vehicles: Analysis of Selected Parameters Based on Created Database. Energies 2023, 16, 1437. [Google Scholar] [CrossRef]
  42. Gartner. Magic Quadrant for BI Platforms—Analytics Value Escalator; Gartner: Stamford, CT, USA, 2012. [Google Scholar]
  43. Cui, W. Visual Analytics: A Comprehensive Overview. IEEE Access 2019, 7, 81555–81573. [Google Scholar] [CrossRef]
  44. Pearl, J. Causal inference in statistics: An overview. Stat. Surv. 2009, 3, 96–146. [Google Scholar] [CrossRef]
  45. Lepenioti, K.; Bousdekis, A.; Apostolou, D.; Mentzas, G. Prescriptive analytics: Literature review and research challenges. Int. J. Inf. Manag. 2020, 50, 57–70. [Google Scholar] [CrossRef]
  46. Mitchell, T. Machine Learning; McGraw-Hill: New York, NY, USA, 2007; Volume 1. [Google Scholar]
  47. GM, H.; Gourisaria, M.; Pandey, M.; Rautaray, S. A comprehensive survey and analysis of generative models in machine learning. Comput. Sci. Rev. 2020, 38, 100285. [Google Scholar] [CrossRef]
  48. Schuh, G.; Gützlaff, A.; Sauermann, F.; Maibaum, J. Digital Shadows as an Enabler for the Internet of Production. In Proceedings of the 2020 APMS: IFIP International Conference on Advances in Production Management Systems, Novi Sad, Serbia, 30 August–3 September 2020. [Google Scholar]
  49. Hartmann, D.; Van der Auweraer, H. Digital Twins. In Progress in Industrial Mathematics: Success Stories; Springer: Berlin, Germany, 2021. [Google Scholar]
  50. Vater, J.; Harscheidt, L.; Knoll, A. Smart Manufacturing with Prescriptive Analytics. In Proceedings of the 2019 8th International Conference on Industrial Technology and Management (ICITM), Cambridge, UK, 2–4 March 2019. [Google Scholar]
  51. Erasmus, J.; Grefen, P.; Vanderfeesten, I.; Traganos, K. Smart Hybrid Manufacturing Control Using Cloud Computing and the Internet-of-Things. Machines 2018, 6, 62. [Google Scholar] [CrossRef] [Green Version]
  52. Antunes, A.; Cardoso, E.; Barateiro, J. Incorporation of Ontologies in Data Warehouse/Business Intelligence Systems—A Systematic Literature Review. Int. J. Inf. Manag. Data Insights 2022, 2, 100131. [Google Scholar] [CrossRef]
  53. Breslin, G.; O’Sullivan, D.; Passant, A.; Visiliu, L. Semantic Web computing in industry. Comput. Ind. 2010, 61, 729–741. [Google Scholar] [CrossRef]
  54. Yahya, M.; Breslin, J.; Ali, M. Semantic web and knowledge graphs for industry 4.0. Appl. Sci. 2021, 11, 5110. [Google Scholar] [CrossRef]
  55. Killeen, P.; Ding, B.; Kiringa, I.; Yeap, T. IoT-based predictive maintenance for fleet management. Procedia Comput. Sci. 2019, 151, 607–613. [Google Scholar] [CrossRef]
  56. Comuzzi, M.; Grefen, P.; Meroni, G. Blockchain for Business: IT Principles into Practice; Routledge: Abingdon, UK, 2023. [Google Scholar]
  57. Minoli, D.; Occhiogrosso, B. Blockchain mechanisms for IoT security. Internet Things 2018, 1–2, 1–13. [Google Scholar] [CrossRef]
  58. Silvano, W.F.; Marcelino, R. Iota tangle: A cryptocurrency to communicate internet-of-things. Future Gener. Comput. Syst. 2020, 112, 307–319. [Google Scholar] [CrossRef]
  59. Ludwig, H.; Baracaldo, N. Federated Learning: A Comprehensive Overview of Methods and Applications; Springer: Berlin, Germany, 2022. [Google Scholar]
  60. Kairouz, P.; McMahan, H.B.; Avent, B.; Bellet, A.; Bennis, M.; Bhagoji, A.N.; Bonawitz, K.; Charles, Z.; Cormode, G.; Cummings, R.; et al. Advances and open problems in federated learning. Found. Trends Mach. Learn. 2021, 4, 1–210. [Google Scholar] [CrossRef]
  61. Stallmann, M.; Wilbik, A. On a Framework for Federated Cluster Analysis. Appl. Sci. 2022, 12, 10455. [Google Scholar] [CrossRef]
  62. Lindell, Y. Secure multiparty computation. Commun. ACM 2020, 64, 86–96. [Google Scholar] [CrossRef]
  63. Wei, K.; Li, J.; Ding, M.; Ma, C.; Yang, H.H.; Farokhi, F.; Jin, S.; Quek, T.Q.; Poor, H.V. Federated Learning with Differential Privacy: Algorithms and Performance Analysis. IEEE Trans. Inf. Forensics Secur. 2020, 15, 3454–3469. [Google Scholar] [CrossRef] [Green Version]
  64. Angelov, S.; Grefen, P.; Greefhorst, D. A framework for analysis and design of software reference architectures. Inf. Softw. Technol. 2012, 54, 417–431. [Google Scholar] [CrossRef]
  65. Zheng, P.; Wang, H.; Sang, Z.; Zhong, R.Y.; Liu, Y.; Liu, C.; Mubarok, K.; Yu, S.; Xu, X. Smart manufacturing systems for Industry 4.0: Conceptual framework, scenarios, and future perspectives. Front. Mech. Eng. 2018, 13, 137–150. [Google Scholar] [CrossRef]
  66. Wang, Y.; Ma, H.; Yang, J.; Wang, K. Industry 4.0: A way from mass customization to mass personalization production. Adv. Manuf. 2017, 5, 311–320. [Google Scholar] [CrossRef]
  67. Pech, M.; Vrchota, J. The Product Customization Process in Relation to Industry 4.0 and Digitalization. Processes 2022, 10, 539. [Google Scholar] [CrossRef]
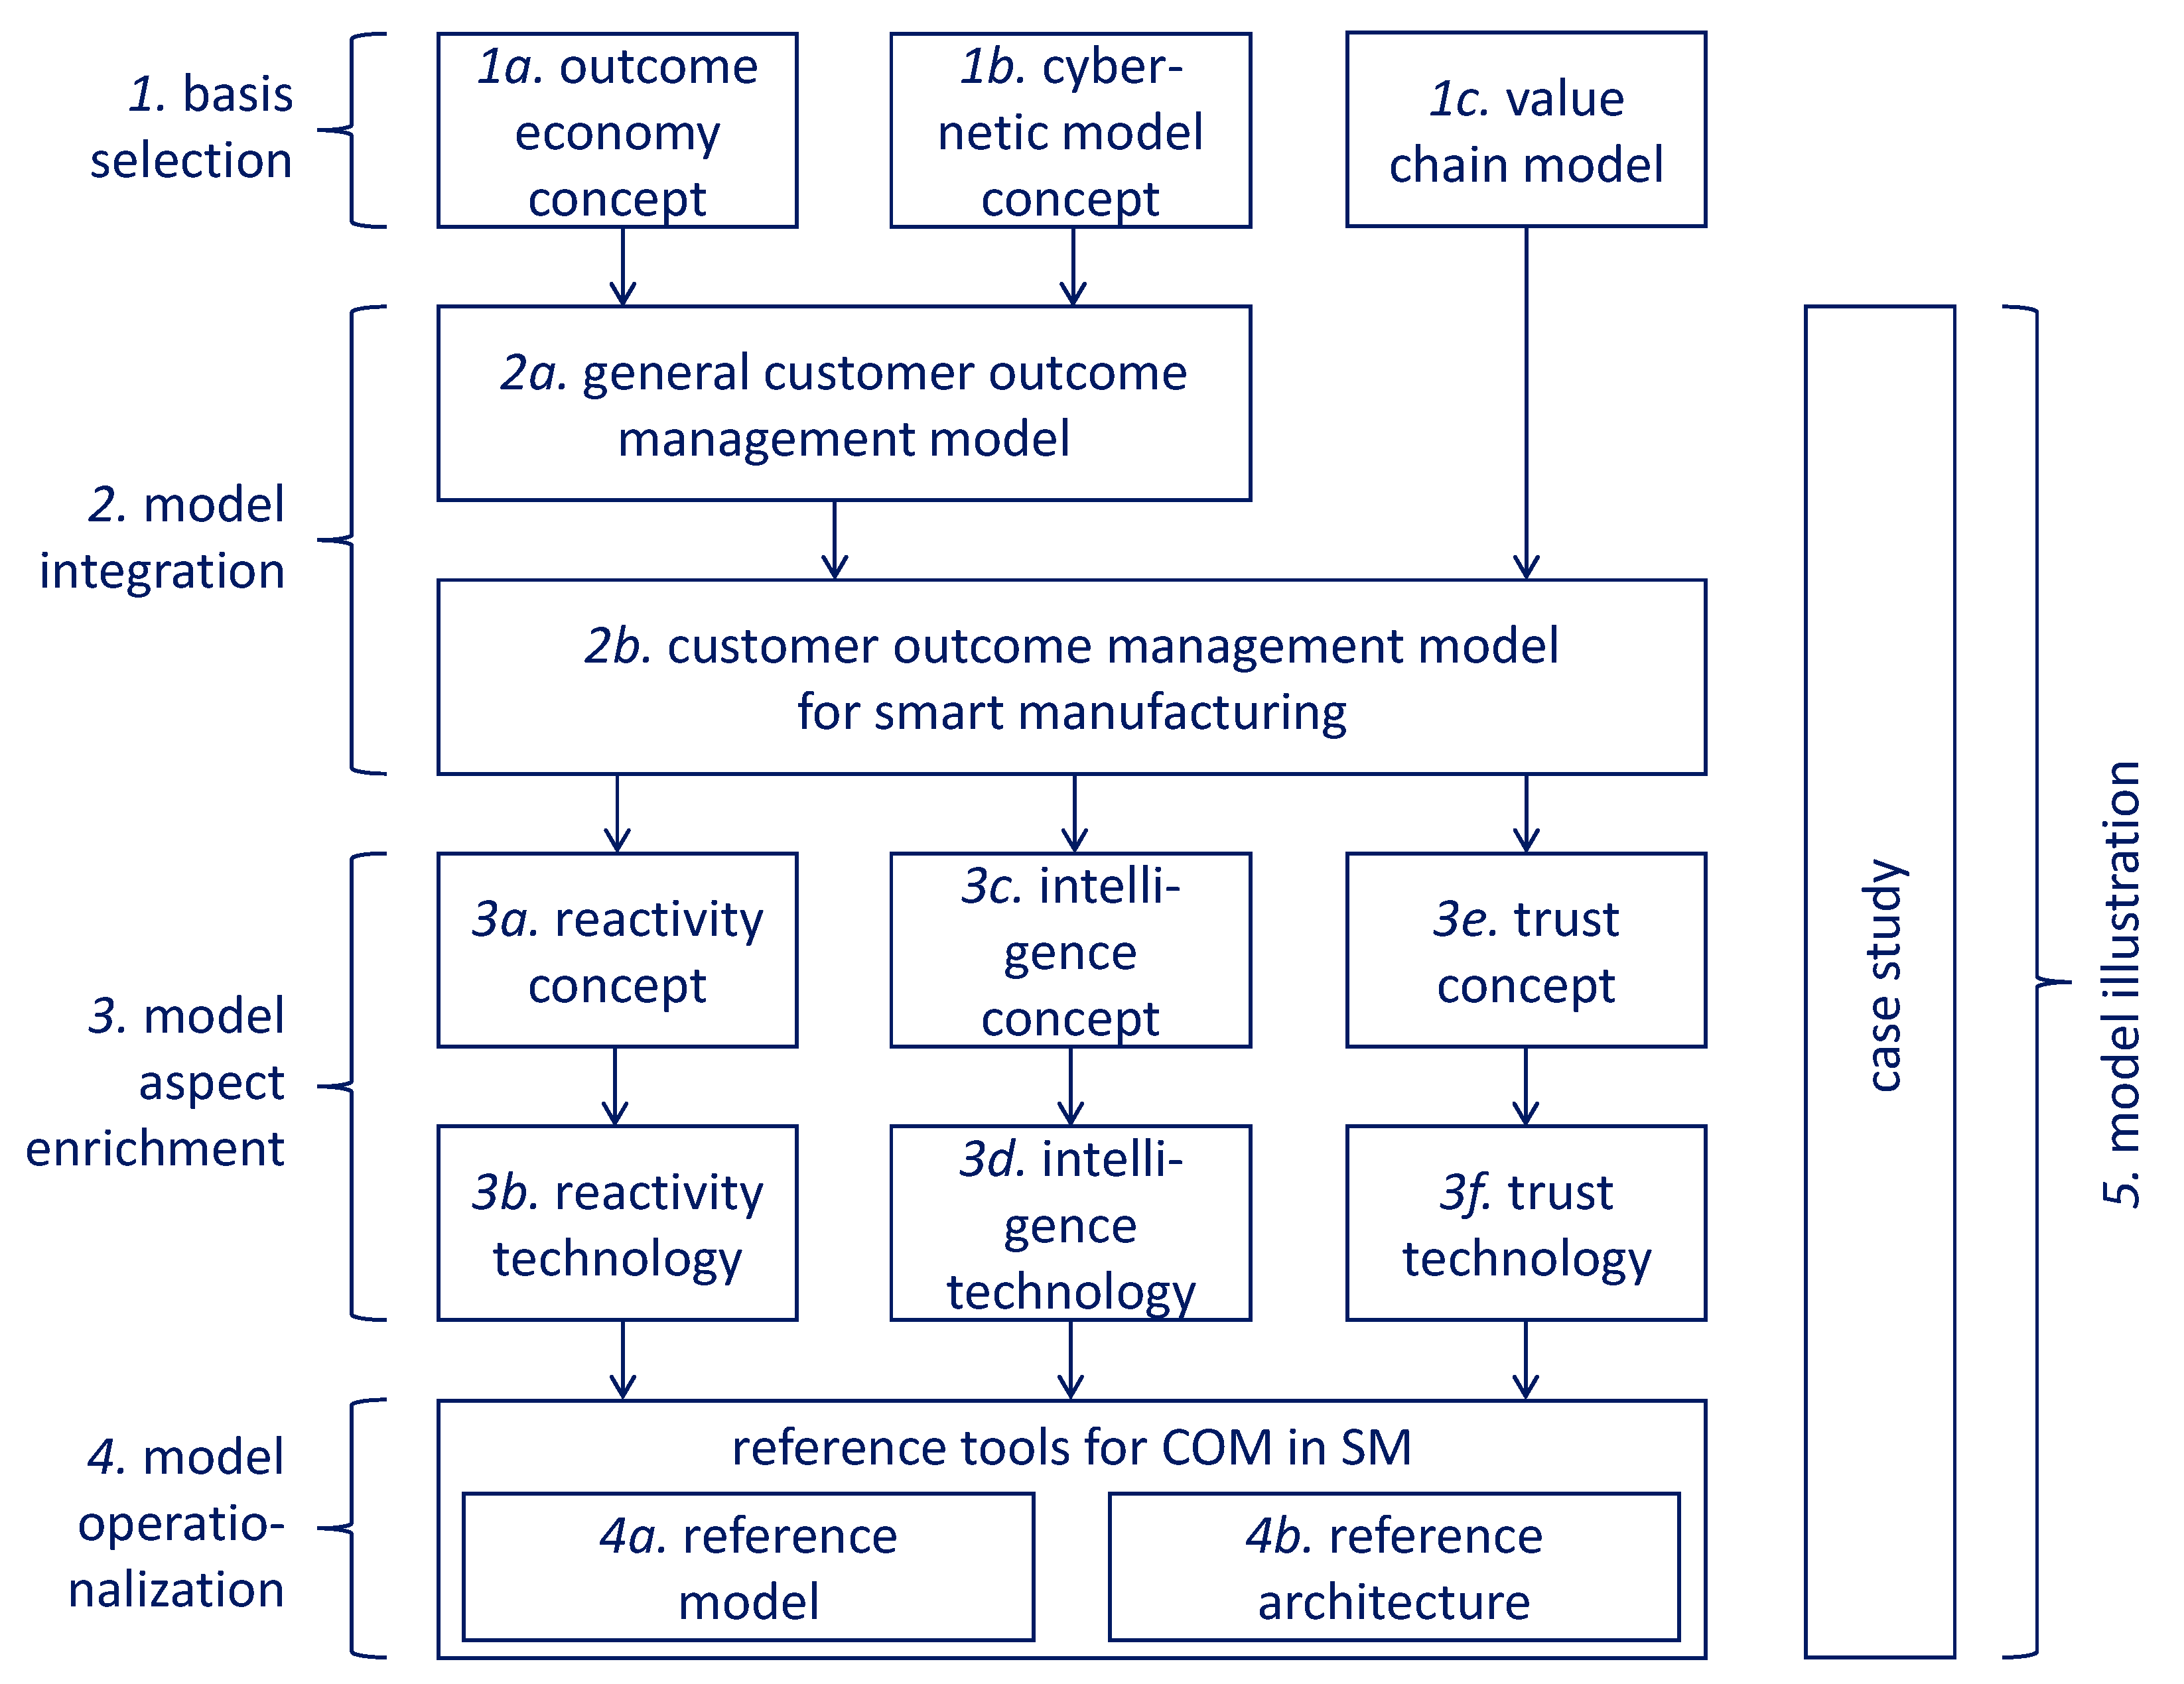
Figure 1. Construction approach taken.
Machines 11 00636 g001
Figure 2. RAMI4.0 reference model for smart industry.
Machines 11 00636 g002
Figure 3. Single-stage business control model.
Machines 11 00636 g003
Figure 4. Multi-stage business control model.
Machines 11 00636 g004
Figure 5. Multi-stage customer outcome management model.
Machines 11 00636 g005
Figure 6. Outcome scenario for HBM case.
Machines 11 00636 g006
Figure 7. Value chain model (adapted from [33]).
Machines 11 00636 g007
Figure 8. Porter’s model embedded in customer outcome management model.
Machines 11 00636 g008
Figure 9. Porter’s model embedded in customer outcome management model with detailed connections.
Machines 11 00636 g009
Figure 10. Porter’s model applied to HBM outcome generation.
Machines 11 00636 g010
Figure 11. Using a trusted measurement repository for trusted regulator input.
Machines 11 00636 g011
Figure 12. Using a trusted measurement repository for trust in outcome-based billing.
Machines 11 00636 g012
Figure 13. Customer outcome management mechanism with trusted measurement aggregator.
Machines 11 00636 g013
Figure 14. Blockchain platform used for creating trust in goods transactions.
Machines 11 00636 g014
Figure 15. Using distributed business intelligence to create trust between customers.
Machines 11 00636 g015
Figure 16. Use of reference models.
Machines 11 00636 g016
Figure 17. Reference model for customer outcome management in smart manufacturing.
Machines 11 00636 g017
Figure 18. Examples of short and long outcome feedback loops.
Machines 11 00636 g018
Figure 19. Collapsed reference architecture for customer outcome management.
Machines 11 00636 g019
Figure 20. Expanded reference architecture without explicit trust management support.
Machines 11 00636 g020
Figure 21. Expanded reference architecture with explicit trust management support.
Machines 11 00636 g021
Figure 22. Reference model applied to HBM case study.
Machines 11 00636 g022
Figure 23. Reference architecture applied to HBM case study.
Machines 11 00636 g023
Table 1. Outcomes in HBM case.
OutcomeOPIReporting Interval
O1nr. of passengers/(hr × route)Minute
O2nr. of KJ/kmSecond
O3NPSDay
Table 2. Discussion of product lifecycle phases.
Product Lifecycle Phases [35]Relevant for Current Paper?Included and Label
product conceptNo, outside outcome scopeNo
designYesProduct design
raw material purchaseYes, secondary importanceNo
manufacturingYesProduct manufacturing
transportationYesProduct delivery
saleNo, outside outcome scopeNo
utilizationYes, but implicit to providerNo
after-sale serviceYesProduct after-sales servicing
recycle/disposalNo, outside outcome scopeNo
Table 3. Linkage between outcomes and business functions in HBM scenario.
Bus DevelopmentSoftware DevelopmentBus ProductionHardware ServicingSoftware Distribution
O1
O2
O3
Table 4. Sensor element classification.
PushPull
Recorded data(i) data provisioning software module(ii) data query interface
Physical data(iii) active IoT device or CPS(iv) passive IoT device or CPS
External data(v) external system with data stream subscription(vi) external system with data query interface
Table 5. Sensor setup in HBM case.
Sensor ClassSensing FrequencyImplementation Aspects
O1ii or iiiminute scaleClass ii: coupling to HBM ticketing system;
Class iii: physical sensors in buses—buffering of measurements may be required
O2ivsub-second scaleClass iv: coupling to bus engine management system—buffering of measurements is required
O3v or viday scaleClass v: coupling to external passenger survey system; Class vi: coupling to social media-based sentiment analysis system
Table 6. Regulator element classification.
Type of RegulatorLevel of ComplexityLevel of Control AutomationTypical Techniques and Technology Used
(a) DescriptiveLowLowDashboards, visual analytics [43] (e.g., with Power BI (https://powerbi.microsoft.com, accessed on 23 February 2023)), statistical analysis (e.g., with SPSS (https://www.ibm.com/products/spss-statistics, accessed on 23 February 2023))
(b) DiagnosticLow-MediumMediumStatistical analysis (e.g., correlation analysis), causal analysis [44]
(c) PredictiveMedium-HighMediumClassification models, regression models [45], neural networks [46], SciKit Learn (https://scikit-learn.org/stable/, accessed on 23 February 2023), PyTorch (https://pytorch.org/, accessed on 23 February 2023)
(d) PrescriptiveHighHighOptimization models, advanced machine learning, generative models [47]
Table 7. Regulator ambition levels in HBM case.
Bus DevelopmentSoftware DevelopmentBus ProductionHardware ServicingSoftware Distribution
O1DescriptiveDescriptive
O2 Predictive PrescriptiveDiagnostic
O3 DiagnosticPredictive
Table 8. Matrix for customer-provider feedback loops.
Product DeploymentInternal Outcome RealizationExternal Outcome Realization
product development X
product manufacturing X
product logistics
product servicingX
Disclaimer/Publisher’s Note: The statements, opinions and data contained in all publications are solely those of the individual author(s) and contributor(s) and not of MDPI and/or the editor(s). MDPI and/or the editor(s) disclaim responsibility for any injury to people or property resulting from any ideas, methods, instructions or products referred to in the content.