Article

Combining Students’ Grades and Achievements on the National Assessment of Knowledge: A Fuzzy Logic Approach

Faculty of Education, University of Primorska, Cankarjeva 5, 6000 Koper, Slovenia
*
Author to whom correspondence should be addressed.
Axioms 2022, 11(8), 359; https://doi.org/10.3390/axioms11080359
Submission received: 16 June 2022 / Revised: 16 July 2022 / Accepted: 21 July 2022 / Published: 23 July 2022

Abstract

:
Although the idea of evaluating students’ mathematical knowledge with fuzzy logic is not new in the literature, few studies have explored the possibility of assessing students’ mathematical knowledge by combining teacher-assigned grades (i.e., school grades) with students’ achievements on standardized tests (e.g., national assessments). Thus, the present study aims to investigate the use of fuzzy logic to generate a novel assessment model, which combines teacher-assigned mathematics grades with students’ results on the Italian National Assessment of Mathematical Knowledge (INVALSI). We expanded the findings from previous works by considering a larger sample, which included more than 90,000 students attending grades 8, 10, and 13. The results showed that the tested model led to a lower assessment score compared to the traditional grading method based on teacher’s evaluation. Additionally, the use of fuzzy logic across the examined school levels yielded similar results, suggesting that the model is adequate among different educational levels.
MSC:
03B52

1. Introduction

The assessment of students’ knowledge is one of the most important components of the pedagogical process [1], as it provides educators, students, and their parents with important feedback information on learners’ knowledge, skills, and competencies [2]. In recent decades, several researchers [3,4,5,6,7,8,9,10,11,12,13,14] have studied the possibility of evaluating students’ knowledge with fuzzy logic.
Fuzzy logic is based on the fuzzy set theory introduced by the Iranian mathematician Lofti A. Zadeh in 1965 [15]. This type of logic provides a significant addition to standard logic since its applications are wide-ranging and it offers the possibility of modeling under conditions of imprecision [3,4], for example in engineering [16], science [17], economics [18], medicine [19], and psychology [20]. Despite its name, which may recall an imprecise, hazy, or even false mathematical theory, fuzzy logic operates on the basis of precise and rigorous mathematical rules [21]. In real-life situations, fuzzy logic could be used to construct mathematical solutions of problems, which are expressed in natural language and characterized by a degree of vagueness and/or uncertainty [3]. Fuzzy logic refers to the ability to calculate with words; additionally, it provides mathematical strength to emulate several linguistic attributes associated with human cognition [4].
Precisely because fuzzy logic tackles operating with inaccurate data, some research [3,4,5,6,7,8,9,10,11,12,13,14] has proposed its use for the purpose of assessing students’ knowledge and competencies. In particular, teacher-given grades are usually based on verbal judgements. For instance, in Italy, where grades range from 1 to 10, grade “10” corresponds to “excellent”, while grade “6” means “sufficient”. In addition, teacher-given grades can include several factors that contribute to the final grading, such as students’ academic knowledge [5], their class attendance [8], achievements obtained in different exams [7], students’ lab work [6], etc. Fuzzy logic, therefore, represents a mathematical tool which educators and researchers can use to combine multiple verbal and imprecise variables.
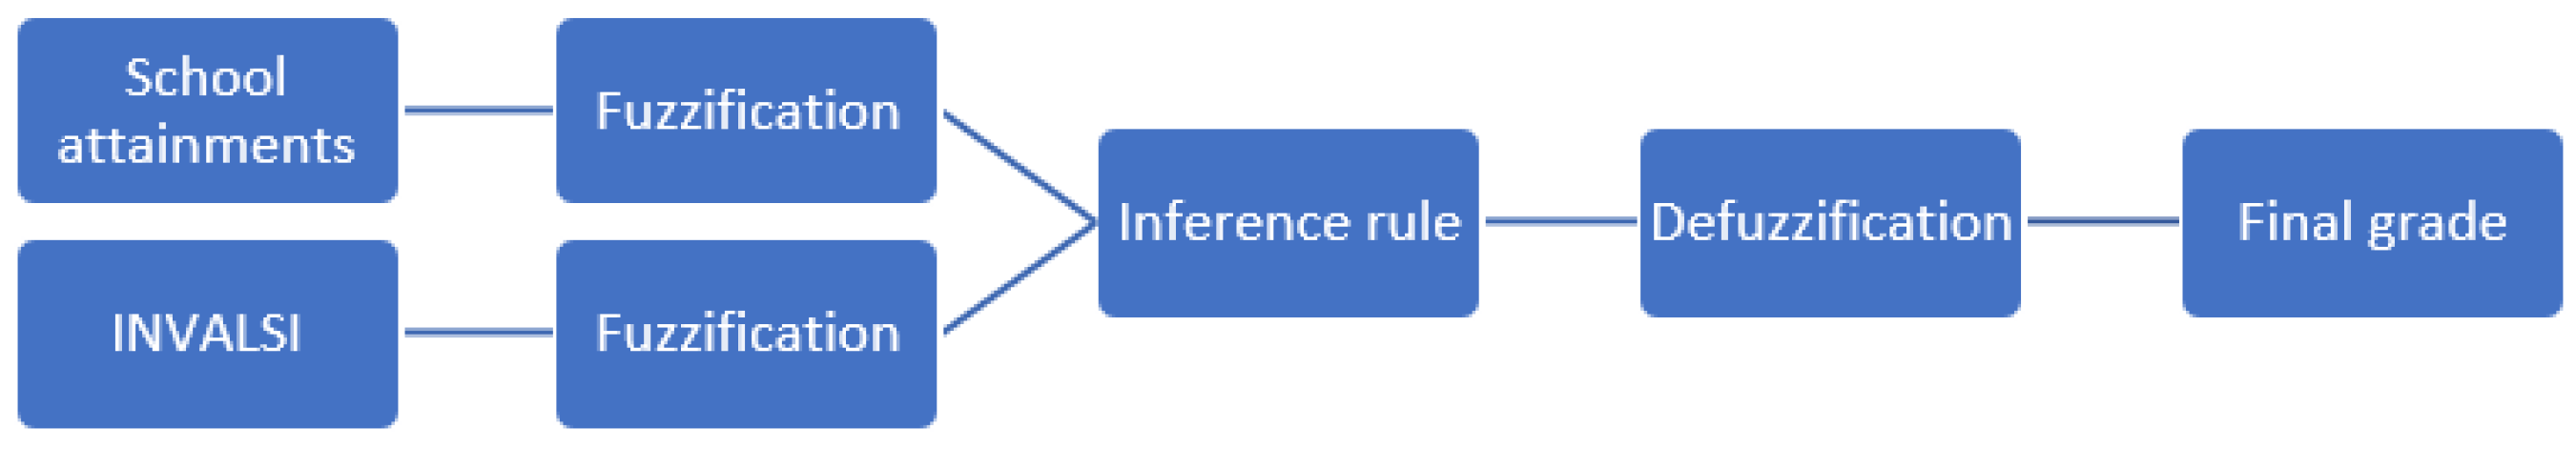
The present paper aims to explore how fuzzy logic can be used to evaluate students’ mathematical knowledge, specifically by combining their school grades (i.e., teacher-given grades) with their achievements on a standardized mathematics test, namely the Italian National Assessment of Mathematical knowledge INVALSI. The topic on how to combine teacher-given grades with their performance on standardized tests is still developing. Therefore, with the present paper, we want to contribute to the literature by comparing the traditional method of assessing students’ mathematical knowledge (i.e., teacher-given grades) with the fuzzy logic model.
In the paper, we will first present some basic definitions regarding fuzzy logic and then a review of the literature on using fuzzy logic for student’s evaluation. A detailed description of the adopted methodology and the obtained results will follow. Finally, the results will be discussed and implication for practice will be presented.

2. Related Works

2.1. Basic Definitions

A basics concept of fuzzy logic is the fuzzy set [9]. A fuzzy set is a set A in a universal set X , defined as a set of pairs A = { ( x , μ A ( x ) ) : x X } , where μ A : X [ 0 , 1 ] is a mapping called “membership function” of the fuzzy set A , and μ A ( x ) is the degree of belongingness (or degree of membership) of element x X in the fuzzy set A .
Among the most used membership functions, we focus on the triangular, trapezoidal, and Gaussian membership functions. Due to the simple formula and computational efficiency, the triangular and trapezoidal membership functions are among the most popular in fuzzy logic applications [9] and have been widely used in evaluating students’ academic achievement [22]. On the other hand, the Gaussian membership function is the most adequate to represent uncertainty in the measurements [23] and some authors [24,25] have suggested that it is the most suitable for improving the reliability and robustness of the evaluation of student systems. The triangular function (for a < b < c ) is defined as follows [9,22]:
Tri ( x , a , b , c ) = { 0 x a ,   x c x a b a a < x < b c x c b b x < c .
The trapezoidal membership function (for a < b < c < d ) is defined as follows [9,17]:
Trap ( x , a , b , c , d ) = { 0   x a ,   x d x a b a   a < x b 1   b < x c d x d c   c < x d .
The Gaussian membership function (for two parameters μ and σ ) is defined as follows [18]:
Gauss ( x , μ , σ ) = e ( x μ ) 2 2 σ 2 .
Fuzzy logic consists of three main components [3,6,21]: (i) the fuzzification process, (ii) decision-making based on fuzzy rules and (iii) the defuzzification process (Figure 1). Fuzzification is the process in which crisp (i.e., clear) terms and data are transformed into a fuzzy set. This process is determined by the membership functions, which are applied to the crisp values of the variables to determine their membership factor in the fuzzy set. The fuzzification process allows us to express inputs and outputs in linguistic terms. Decision-making (i.e., the inference process) consists in defying the rules, which will determine the fuzzy output information. The inference rules are logical sequences of the IF-THEN form. They are defined by the user based on their experience [25]. The result of the inference phase must be then converted back into crisp data. This process is called defuzzification. There are several ways to defuzzify the data. Among the most used ones, there are the Mean of Maximum (MoM) and the Center of Gravity (CoG) [25]. The MoM method is given by the following:
MoM ( A ) = 1 | T | × x T x ,
where T is the set of all elements x X , for which μ A ( x ) has the maximum degree of membership and | T | is its cardinality. The CoG for continuous values of x is defined as:
CoG ( A ) = μ A ( x ) × x   d x μ A ( x )   d x .

2.2. The Usage of Fuzzy Logic in Education

In education, teachers often face a situation of vagueness when evaluating students’ knowledge, so fuzzy logic offers many applications to partially solve this issue [3]. Several applications of the fuzzy logic have been proposed in the past. For instance, the study by Sripan and Suksawat [4] aimed to investigate the use of fuzzy logic to evaluate students’ knowledge by combining their scores on a test and the time to solve it. They experimented the proposed model with 26 students and found that students’ traditional grades and their fuzzy grades were similar, but fuzzy logic represented an effective method for classifying student learning groups based on their performance and real-time implementation.
In the research by Gokmen and colleagues [6], the authors focused on generating students’ grades by considering two input values, i.e., their performance in two exams. They tested their model on 20 students and contrary to the previously mentioned study [4], they found a difference in the grades obtained with the classical assessment method and the fuzzy logic method. They concluded that fuzzy logic has greater flexibility, however the evaluation criteria are difficult to explain to students. Similar conclusions are presented by Petrudi and colleagues [7], who aimed to assess students’ knowledge by considering the performance on three exams, one of which was practical. The findings revealed that the fuzzy logic evaluation method lowered the grades of better performing students and conversely, increased the grades of lower performing students.
Saliu [26] developed a student knowledge assessment model by considering various factors that could influence students’ final performance, such as the originality of students’ work. The author tested the model on a sample of 33 students and found no significant differences between the classic evaluation method and the fuzzy logic one.
Namli and Şenkal [9] proposed a model for assessing students’ knowledge by considering their grades and class attendance. The researchers found that student assessment with fuzzy logic did not significantly differ from the traditional assessment method.
Very few works have explored the possibility of using fuzzy logic on a larger scale, as for example for assessing students’ knowledge by combining academic results with the results obtained in standardized tests. Recently, the work ref. [27] explored the possibility of using fuzzy logic to evaluate students’ mathematical knowledge by merging both oral and written students’ grades, and their results on the Italian national assessment. There were 2279 students from grade 13 involved in the tested model. The results indicated that students’ grades generated by the fuzzy logic method (i.e., a combination of teacher-assigned math grades and students’ performance on the INVALSI test) were significantly lower than teacher-given grades. The study explored the differences in students’ achievement between the four types of Italian high schools (i.e., scientific high schools, technical schools, vocational schools, and other high schools), finding significant differences in final grades between the four types of schools.
Considering the abovementioned studies, it can be noticed that the literature is ambivalent and contrasting as to whether fuzzy logic is similar to traditional evaluation methods or whether there are substantial differences between these assessment methods. Some papers have found that fuzzy logic produces lower or higher grades than traditional evaluation methods [6,7,27], while others have concluded that there are no significant differences between the two methods [4,9,26]. Furthermore, the previously cited works tested the models on relatively small samples of students and did not consider the possibility that fuzzy logic could have different effects at different school levels, such as secondary or high school. The present empirical research aims to address this gap in the literature by examining the effects that fuzzy logic-based assessment model could have on a larger sample of students considering the different school levels.

2.3. Research Aims

The aim of the current research is to develop and test a model for assessing students’ mathematical knowledge which considers both students’ academic achievements (i.e., mathematics grades assigned by the teacher) and their performance on the INVALSI national assessment, and comparing it to the traditional assessment method (i.e., teacher-given grades). In doing this, we aimed to broaden the existing studies on the application of fuzzy logic for the assessment of students’ mathematical knowledge (e.g., [27]) by testing it among a larger sample of participants, as well as considering different school levels, particularly grades 8, 10, and 13. This would allow us to understand whether fuzzy logic-based assessment method produces similar evaluations at different educational levels and if it is therefore adequate for measuring math knowledge of younger and older students.
Thus, the research questions of the present study are the following:
RQ1: Is there any significant difference between the fuzzy logic evaluation method (which considers the combination of teacher-assigned grades and students’ performance on national assessment) of students’ math knowledge and the traditional one (based on teacher-assigned grades) in students attending the 8th, 10th, and 13th grade?
RQ2: Is there any significant difference in the evaluation of students’ math knowledge based on fuzzy method among school levels of the 8th, 10th, and 13th grade?

3. Materials and Methods

3.1. Methodology

The present study is a quantitative non-experimental empirical study. The nature of the research is descriptive.
The diagram of the methodology is presented in Figure 2. The data about students’ teacher-given grades and their achievements on the national assessment of mathematics INVALSI were retrieved from official data sources [28]. The data were then filtered to remove the missing items (see also the Research sample subsection). The remaining data were then combined using the fuzzy logic method, explained in detail in the Procedure subsection. After the combined grade was produced in terms of fuzzy logic, the data were analyzed with statistical tools.

3.2. Data Collection

The data were obtained from the official web page of the Statistical Service [28], where the following variables were available:
  • Teacher-given grades on oral evaluations in mathematics;
  • Teacher-given grades on written evaluations in mathematics;
  • Scores on the national assessment INVALSI;
  • Students’ gender.
We focused solely on these variables, since the aim of the research was to compare the teacher-given grades with the fuzzy grades. The data about gender were used for the description of the sample. Furthermore, since the data were collected directly by the INVALSI Institute, they are considered a reliable source [29,30]. However, despite the attention that the INVALSI institute places on collecting valid and reliable data, it must be noted that there is still an almost negligible probability that these data contain some small errors which could result from inattentive transcription of students’ written and oral grades [31].

3.3. Data Filtering

From the official website of the Statistical Service [28], which includes data from all Italian students who completed the INVALSI assessment, three samples of students were retrieved. In particular, a sample of 29,675 students attending grade 8, a sample of 35,802 students from grade 10, and a sample of 36,589 students from grade 13. Students’ data referred to school year 2018–2019.
From the original samples, a total of 9801 students (9.6%) were deleted, since they reported missing data on both teacher-given grades (oral and written grade). (Table 1). In particular:
  • Grade 8: 619 students presented missing data on both teacher-given grades and were therefore excluded from the analyses. The remaining sample consisted of students who had at least one teacher-assigned grade (oral or written). We did not make any distinction between oral or written grades, since in Italian middle school educational system, students receive only one grade for mathematics, which refers to both oral and written evaluations;
  • Grade 10: 3008 students were excluded due to missing data. The remaining sample consisted of students who had at least one teacher-assigned grade. For the students who had both oral and written grades, only the oral grade was considered, since it includes a broader range of evaluations;
  • Grade 13: 6174 students presented missing data on both teacher-given grades. The filtering procedure is the same as for grade 10.
The gender distribution among the final samples is presented in Table 2. The participants’ age was not possible to retrieve.

3.3.1. Teacher-Given Grades

In Italian secondary (i.e., middle school; grades 6–8) and high schools (grades 9–13), the grades assigned by teachers are numerical and range from a minimum of 1 to a maximum of 10, with 10 being the highest grade. Grades lower than 6 are “failing grades”, while grades greater or equal to 6 are “passing grades” [32]. Several laws [32,33] establish that the teacher of a certain subject suggests students’ final grade; however, the class councils (i.e., all schoolteachers who teach in a given class) are in charge of accepting or modifying the proposed grade.
For each subject, students’ knowledge can be assessed in three possible ways: (1) through written and oral evaluations, (2) only written evaluations, or (3) only oral evaluations [33]. Written evaluations are obtained through more complex written tests, whereas oral evaluations are assessments that consist of oral examinations, homework, project work, exercises, or other shorter written tests. High school class councils determine the preferred assessing method [32,33,34], which could result in students obtaining one (oral or written) or two grades (oral and written) in each subject. In contrary, middle school students have only one grade on their report cards (i.e., only one oral or written grade).

3.3.2. The INVALSI Test

Each school year, the INVALSI institute assesses the entire Italian student population in the 2nd (average age 7 years), 5th (10 years old), 8th (13 years old), 10th (15 years old) and from school year 2018–2019 also 13th (18 years old) grades. Students are thus required to take the mandatory national standardized assessment of mathematical knowledge [32]. It is a standardized assessment evaluating students’ knowledge of the mathematical contents present in the National indications for the curriculum in the primary and secondary school [35] (for secondary schools), and in the Indications for high schools [36] (for high schools). These documents cover the themes that math teachers are required to teach in secondary and high schools.
The national assessment INVALSI is composed of several questions, which vary each year (normally around 30–45 items), and which can be closed or open ended. All students in grades 8, 10, and 13 solve the computerized version of the test [32,37]. Moreover, questions are automatically and randomly chosen from a database of questions, which decreases the possibility of cheating. Since the chosen questions are equally difficult, the tests can be considered equivalent and comparable [37]. The results obtained by students in the INVALSI test are measured on a quantitative Rasch scale, where 200 is the mean and the standard deviation is 40 [38,39]; a similar method is used by the PISA [40] and TIMSS [41] evaluations. INVALSI tests are an objective measure of students’ knowledge [42].

3.4. Application of Fuzzy Logic

The model proposed for the evaluation of students’ mathematical knowledge is presented in Figure 3. The model considers two students’ attainments in mathematics, i.e., (1) teacher-given school grades (“School attainments”), and (2) their results on the national assessment of mathematics (“INVALSI”). These crisp data are numerical values: school attainments are ordinal data from 1 to 10, where “10” represents excellent grade, while the INVALSI results are interval data, which are determined with the Rasch method by the institute INVALSI. These data are then fuzzified (“Fuzzification”) using the membership functions we present in the following subsection. Fuzzified grades are combined by using inference rules (“Inference rule”) which are defined in the following subsections: this permits us to retrieve fuzzified combined grades. Such grades are then defuzzified following the procedure depicted in the following subsections (“Defuzzification”) and final grades are produced (“Final grade”).

3.4.1. Fuzzification of Teacher-Given Grades

The fuzzification of students’ school (i.e., teacher-given) grades was performed using input variables (on a discrete scale from a minimum of 1 to a maximum of 10) and their membership functions of fuzzy sets. Each student had one school grade. Each input variable has a triangle or trapezoidal membership functions (Table 3 and Figure 4).

3.4.2. Fuzzification of Students’ Attainments on the National Assessment INVALSI

Students’ scores on the national assessment of mathematical knowledge INVALSI are interval data, thus the Gaussian membership function was preferred. Since the mean of students’ attainments on the test is set to be around 200 and the standard deviation is 40, we considered the Gaussian functions presented in Table 4 and Figure 5 [27].

3.4.3. Rules and Inference

Inference rules are linguistic variables, also entitled “If-Then” rules. In Table 5 we present the inference rules. The inference rules used are the same as in [7] with the following differences [25]:
4.
It is possible to have the “Very high” (VH) level only if both tests are very high (VH), so the VH levels of [7] have been adapted to H;
5.
High performance (H) on the INVALSI tests can only produce at least medium (M) ratings;
6.
The final grade is high (H) only if both ratings are high (H) or one rating is very high (VH) and the other is at least medium (M).
For instance, a student with a high teacher-given grade (H) and a low achievement (L) on the INVALSI test gets a medium (M) final grade (M).

3.4.4. Defuzzification

The output variable, which is the overall students’ mathematical achievement, is entitled “Final grade” and has five membership functions (Table 3 and Figure 4). After completing the fuzzy inference, the fuzzy final grade has to be converted into a crisp value through defuzzification. In the present study, the MoM method was applied. The surface of the final grades is presented in Figure 6. All fuzzy grades (i.e., the output data) were rounded to the nearest integer.
Figure 6 presents the final grades obtained with the fuzzy logic method (“Final Grade”) depending on the teacher-given grades (“Grade”) and students’ results on the INVALSI test (“INVALSI”). Thus, Figure 6 represents the plot of the function F i n a l G r a d e ( G r a d e ,   I N V A L S I ) . For example, a student who has 2 in mathematics (insufficient) but did well in the INVALSI test and got 300 points, has a final grade produced with the fuzzy logic of 5.50: F i n a l G r a d e ( 2300 ) = 5.50 , which is then rounded to 6.

3.5. Quantitative Analysis

Fuzzification, inference, and defuzzification were conducted with the “Fuzzy Logic Toolbox” [43,44] (Figure 7) of the MATLAB R2020b [45]. Statistical analyses were performed with the Jamovi [46] statistical software.
Both descriptive and inferential statistical methods have been applied. Among the descriptive statistical tools, frequencies, means, medians, and standard deviations were computed. The Kolmogorov–Smirnov test was used to check for the normality of data, which is reasonably sensitive to the characteristics of distribution, such as its dispersion, shape, and location [47], and works best if the sample size is more than 50 [48]. Due to the violation of the conditions of normality, non-parametric inference statistical tests were used in order to lower the possibility of Type II error [49]. In particular, we used:
7.
The Spearman’s ρ coefficient to compute the correlation between data [50,51], e.g., to what extent are teacher-given grades and fuzzy final grades correlated. The requirement is that each variable is measured on at least ordinal scale; the usage of this coefficient does not make any assumption regarding the distribution of the variables.
8.
The Wilcoxon W signed-rank test for paired samples to check for differences between two categories [52], e.g., the difference between the traditional and fuzzy final grades. The assumptions of the test are that samples are random samples, which are mutually independent, and that the measurement scale is at least ordinal.
9.
The Kruskal–Wallis χ2-test to check for differences among three or more categories [53] with the Dwass-Steel-Critchlow-Fligner (DSCF) post-hoc test, e.g., whether fuzzy final grades differ among different teacher-given grades. The assumptions are similar to those for the Wilcoxon test.
For the effect sizes, we used the ε2 coefficient [54] for the Kruskal–Wallis test and the rank biserial correlation coefficient rrb [55] for the Wilcoxon test. Effect sizes lower than 0.10 are considered small, those around 0.25 are considered middle, and those greater than 0.40 are considered large [56,57].

4. Results

4.1. Differences between Classical and Fuzzy Logic Assessment

4.1.1. Grade 8

In Table 6, the descriptive statistics concerning teacher-given grades, students’ attainments on the INVALSI test, and the fuzzy grade for students of grade 8 (n = 29,056) are presented.
The Kolmogorov–Smirnov test for normality showed that teacher-given grades (KS = 0.128; p < 0.001), INVALSI achievements (KS = 0.026; p < 0.001) and fuzzy grades (KS = 0.251; p < 0.001) violate the assumption of normality. This justifies the use of non-parametric statistical tests.
The Wilcoxon test indicated that fuzzy grades are significantly lower than students’ mathematics grades (W = 1.96 × 10⁸; p < 0.001) with a big effect size (rrb = 0.922).
The correlation analysis indicated that fuzzy grades are highly correlated both with students’ mathematics grades (ρ = 0.693; p < 0.001) and with their scores on the INVALSI test (ρ = 0.880; p < 0.001).
To have a better insight into how fuzzy grades were distributed among students with different teacher-given mathematics grades, we constructed Table 7. The results indicate that among the 613 students with teacher-given grade 10, only 310 (50.6%) of them would receive the same grade (“10”) even if evaluated with the fuzzy logic method. Moreover, 300 students (48.9%) would receive grade 8, while 3 students (0.0%) would get 6. On the other hand, among the 4668 students with teacher-given grade 5, 2860 (61.3%) would get an even lower grade (4), while the remaining 1808 (1792 + 16) students would get a passing grade (i.e., 6 or higher).
In Table 8 presents the descriptive statistics for fuzzy grades distinguished among teacher-given grades. The results suggest that students from each teacher-given grade category would get a lower grade if assessed with the fuzzy logic method. For instance, students with teacher-given grade 10 would get grade 9 on average, if assessed with fuzzy logic.
The Kruskal–Wallis test has shown that fuzzy grades statistically significantly differ among the categories of teacher-given grades (χ2(7) = 15,035; p < 0.001; ε2 = 0.517). The DSCF pairwise comparisons between school grades are all statistically significant (p < 0.05), except for the comparison among students with teacher-given grade 3 and 4 (W = 3.89; p = 0.108).

4.1.2. Grade 10

In Table 9, the descriptive statistics concerning teacher-given grades, students’ attainments on the INVALSI test and the fuzzy grade for the students of grade 10 (n = 32,794) are presented.
The Kolmogorov–Smirnov test for normality showed that teacher-given grades (KS = 0.148; p < 0.001), INVALSI achievements (KS = 0.023; p < 0.001), and fuzzy grades (KS = 0.228; p < 0.001) violate the assumption of normality. This justifies the use of non-parametric statistical tests.
The Wilcoxon test indicated that fuzzy grades are significantly lower than students’ mathematics grades (W = 1.88 × 10⁸; p < 0.001) with a medium effect size (rrb = 0.600).
The correlation analysis indicated that fuzzy grades are correlated both with students’ mathematics grades (ρ = 0.572; p < 0.001) and highly correlated with their scores on the INVALSI test (ρ = 0.825; p < 0.001).
To have a better insight into how fuzzy grades were distributed among students with different teacher-given mathematics grades, we constructed Table 10, which shows that 69 (39.9%) students with school grade 10 would get the same grade if assessed with the method of fuzzy logic, while the remaining 104 (98 + 6) students would get a lower grade. On the contrary, if we consider students with the teacher-given grade 5 (insufficient), we note that 3861 (3652 + 209) students (62.9%) would get a passing grade, while 2282 (37.1%) students would get a much lower grade.
In Table 11, the descriptive statistics for fuzzy grades distinguished among the teacher-given grades are presented. The results showed that on average, some categories of students, such as excellent (10) and very good (9) students would get a lower grade if assessed with the method of fuzzy logic.
The Kruskal–Wallis test has shown that fuzzy grades statistically significantly differ among the categories of teacher-given grades (χ2(9) = 13,150; p < 0.001; ε2 = 0.401). The DSCF pairwise comparisons between school grades are all statistically significant (p < 0.05), except for the comparison among students with teacher-given grade 6 and 7 (W = 4.43; p = 0.055).

4.1.3. Grade 13

In Table 12, the descriptive statistics concerning teacher-given grades, students’ attainments on the INVALSI test, and the fuzzy grade for the students of grade 13 (n = 30415) are presented.
The Kolmogorov–Smirnov test for normality showed that teacher-given grades (KS = 0.140; p < 0.001), INVALSI achievements (KS = 0.021; p < 0.001) and fuzzy grades (KS = 0.199; p < 0.001) violate the assumption of normality. This justifies the use of non-parametric statistical tests.
The Wilcoxon test indicated that fuzzy grades are significantly lower than students’ mathematics grades (W = 1.85 × 10⁸; p < 0.001) with a medium effect size (rrb = 0.690).
The correlation analysis revealed that fuzzy grades are correlated with students’ mathematics grades (ρ = 0.552; p < 0.001) and highly correlated with their scores on the INVALSI test (ρ = 0.824; p < 0.001).
To have a better insight into how fuzzy grades were distributed among students with different teacher-given mathematics grades, we constructed Table 13. The results highlight that among the students with an excellent school grade (10), only 141 (48.6%) would get the same grade if assessed with the method of fuzzy logic; the remaining 149 (51.4%) students would get a lower grade. On the contrary, among the 5109 students with the teacher-given grade 5, 3085 (2907 + 178; 60.4%) would still get a passing grade, while the remaining 2024 (39.6%) would get an even lower grade.
In Table 14, the descriptive statistics for fuzzy grades distinguished among the teacher-given grades are presented.
The Kruskal–Wallis test has shown that fuzzy grades statistically significantly differ among the categories of teacher-given grades (χ2(9) = 11,351; p < 0.001; ε2 = 0.373). The DSCF pairwise comparisons between school grades are all statistically significant (p < 0.05), except for the comparison among students with teacher-given grade 1 and 2 (W = 4.37; p = 0.063).

4.2. Differences in Fuzzy Logic Assessment among Students of Grade 8, 10, and 13

Students’ fuzzy achievements statistically significantly differ among grades (χ2(2) = 51.2; p < 0.001), although the effect size is extremely low (ε2 = 5.55 × 10⁻⁴). The DSCF test has shown that there are statistically significant differences in fuzzy grades between the 8th and 10th grade students (W = −8.572; p < 0.001), as well as between the 8th and 13th grade students (W = −8.983; p < 0.001). However, there are no statistically significant differences between the 10th and 13th grade students (W = −0.824; p = 0.830). Due to the low effect size, results indicate that students’ fuzzy achievements are hardly dependent on students’ classes. Moreover, high school students have similar fuzzy achievements, thus fuzzy grades are almost uniformly distributed in all grades.

5. Discussion

The idea of evaluating students’ knowledge with fuzzy logic is not entirely new, as it has been studied by several researchers [3,4,5,6,7,8,9,10,11,12,13,14,22,26,27], mainly because the grades awarded by teachers are based on verbal descriptions of students’ knowledge. Moreover, students’ assessment is an imprecise construct and fuzzy logic seems to be suitable for such variables [3,4]. The international literature has proposed different models for assessing students’ knowledge, i.e., combining test scores and the time taken to solve them [4], combining two or more test/exam outcomes [6,7], combining student achievement and class attendance [9], etc. Among those studies which investigated the difference between traditional assessing method and fuzzy logic based one, the findings are relatively inconsistent: some researchers found no difference between fuzzy grades and traditional grades [4,9,26], while others found that fuzzy grades were lower or higher than those of the teachers [6,7,27].
Therefore, the main aim of the present work was to clarify these inconsistencies by comparing the traditional (based on teacher-given grades) math knowledge assessing method to the fuzzy logic one, which combines teacher-assigned grades with students’ performance on a standardized math test (i.e., the INVALSI). Moreover, extending previous literature, we were interested in exploring whether there are differences in the fuzzy logic evaluation method among different school levels (grades 8, 10, and 13).
To answer the first research question, we compared traditional grades to the fuzzy ones in students attending the 8th, 10th, and 13th grade in Italy. In all school levels, students’ traditional grades were statistically higher than their fuzzy grades; the effect sizes were medium to large, suggesting that the fuzzy logic evaluation method yields lower overall ratings. Therefore, combining teacher-given grades with students’ results obtained from the national assessment using fuzzy logic reduces their final grades. This result is consistent with previous research [27]; we have shown that the affirmation is valid for all considered school levels.
A deeper look at the distribution of fuzzy grades across categories of teacher-assigned grades reveals that fuzzy grades within the same teacher-assigned grades are sparse. This consequently means that students with the same grade assigned by the teacher could get a different grade when assessed with the proposed fuzzy model. This finding also raises questions regarding the validity and reliability of teachers’ grades [2]: students who have excellent academic results could get lower grades if the INVALSI standardized test is also considered. This could have important consequences, especially considering the labor market [58] and the possibility of being accepted to higher education institutions, such as universities. For example, the present study showed that 5 students who had an excellent grade on their report cards (i.e., a 10), would obtain a lower grade (i.e., a 6), if evaluated by the fuzzy logic method proposed. On the other hand, there have been some students who received an insufficient grade by the teacher (e.g., 5), but would have obtained a sufficient grade (e.g., 6 or more) if evaluated with the system of logic fuzzy. Therefore, although the academic results of some excellent students may indeed be excellent, their results on the INVALSI test could demonstrate that these students do not master all the mathematics topics assessed by the national standardized test. In the document ref. [37] it is stated that the INVALSI test cannot evaluate the non-cognitive and metacognitive factors involved in math learning, such as the students’ attitude toward the subject, therefore, considering merely the students’ performance on the INVALSI test might not give a complete picture of students’ math competencies. Thus, the proposed fuzzy logic method for assessing students’ mathematical knowledge and skills could provide educators, students, and their parents with a clearer picture of students’ mathematical skills [2].
The importance of predicting students’ grades and developing a sustainable learning environment was recently studied by Kanetaki and colleagues [59]. They identified and quantified the factors affecting mechanical engineering students’ outcomes (e.g., classroom fatigue, understanding of the concept of planes, insecurity, computer skills, etc.,) when classes were held online or in a hybrid learning environment due to the COVID-19 outbreak. The proposed model is a valid model that can be used to predict students’ failure of promotion in a hybrid or online learning environment. Although the model predicted the promotion of some students who then failed (and therefore, the model overestimated their achievements), the model still has a non-negligible importance from an educational point of view, as it could help educators and especially learners to have a clearer picture of students’ knowledge and competencies. Our work can be placed within the effort made by Kanetaki et al. [59] and could be used by educators to implement sustainable assessment, i.e., giving students skills to become lifelong learners [60]. In particular, students would gain self-awareness and would be able to self-assess [60], since they might constantly monitor their performances by receiving additional feedback information from the standardized INVALSI tests. Future research could seek to develop a model for predicting the grades that students would receive if the INVALSI test results were also considered, so that students could self-assess their mathematics knowledge, improving and possibly changing their way of learning mathematics. The model could be tested as suggested by [59] and used by students to obtain real-time feedback on their knowledge and competencies in mathematics.
The second aim of the research was to explore possible differences in fuzzy scores between 8th, 10th, and 13th grade students. We found that among high school students (i.e., grades 10 and 13), there are no significant differences in fuzzy scores, while there are some significant differences between secondary (i.e., grade 8) and high school students. However, the differences found have an almost negligible effect size, meaning that the proposed method produces similar results at all levels of education. This fact therefore underlines that the evaluation method with fuzzy logic is solid and produces very similar outcomes, even when used at different educational levels. Further research could extend the proposed model to primary schools and verify whether the fuzzy logic assessment model produces comparable grades to those found in this study. In particular, the fact that the obtained results do not significantly differ among school levels contributes to a further validation of the model proposed in the present study.
The present study has some relevant implications for educators. For instance, the assessment method based on teacher-assigned grades and performance on standardized tests (such as national assessment) has been suggested by some authors as a possible solution to grade inflation [61], i.e., the phenomenon of assigning students higher grades than they deserve or that they would obtain if they were evaluated with a sort of standardized evaluation [62]. The proposed fuzzy logic method could serve the purpose of lowering excessively high mathematics grades while also offering a clearer picture of students’ mathematical knowledge. Furthermore, as already mentioned, the model could help students develop self-assessment skills and therefore, sustainable learning and assessment [59,60]. In addition, the existence of different evaluation methodologies can influence the improvement of teaching policies. In particular, teachers who consider other methods of assessing students’ knowledge and competencies can verify how much their grades differ from students’ achievements in other forms of assessment, such as standardized tests [63]. Additionally, educators need to know about different data sources [64] and use multiple assessment strategies, including criterion-referenced methods and standardized tests [65]. Recent research on the impacts the INVALSI test has on teachers’ practices [66] has shown that some teachers (1) enhanced activities aimed at improving students’ skills in problem-solving and critical thinking; (2) changed the teaching method by using more examples of the applications of mathematics to reality; and (3) implemented the curriculum by anticipating the order of the topics covered. Another aspect that was highlighted in the same research is the fact that a critical analysis of the INVALSI tests has led teachers to reflect on their teaching methodologies and try developing argumentative skills in students. Moreover, some argued that standardized tests are promising tools for the evaluation of the effectiveness of different instructional practices [67], therefore, by using the fuzzy logic model teachers would be able to monitor the effectiveness of their teaching practices and implement them.
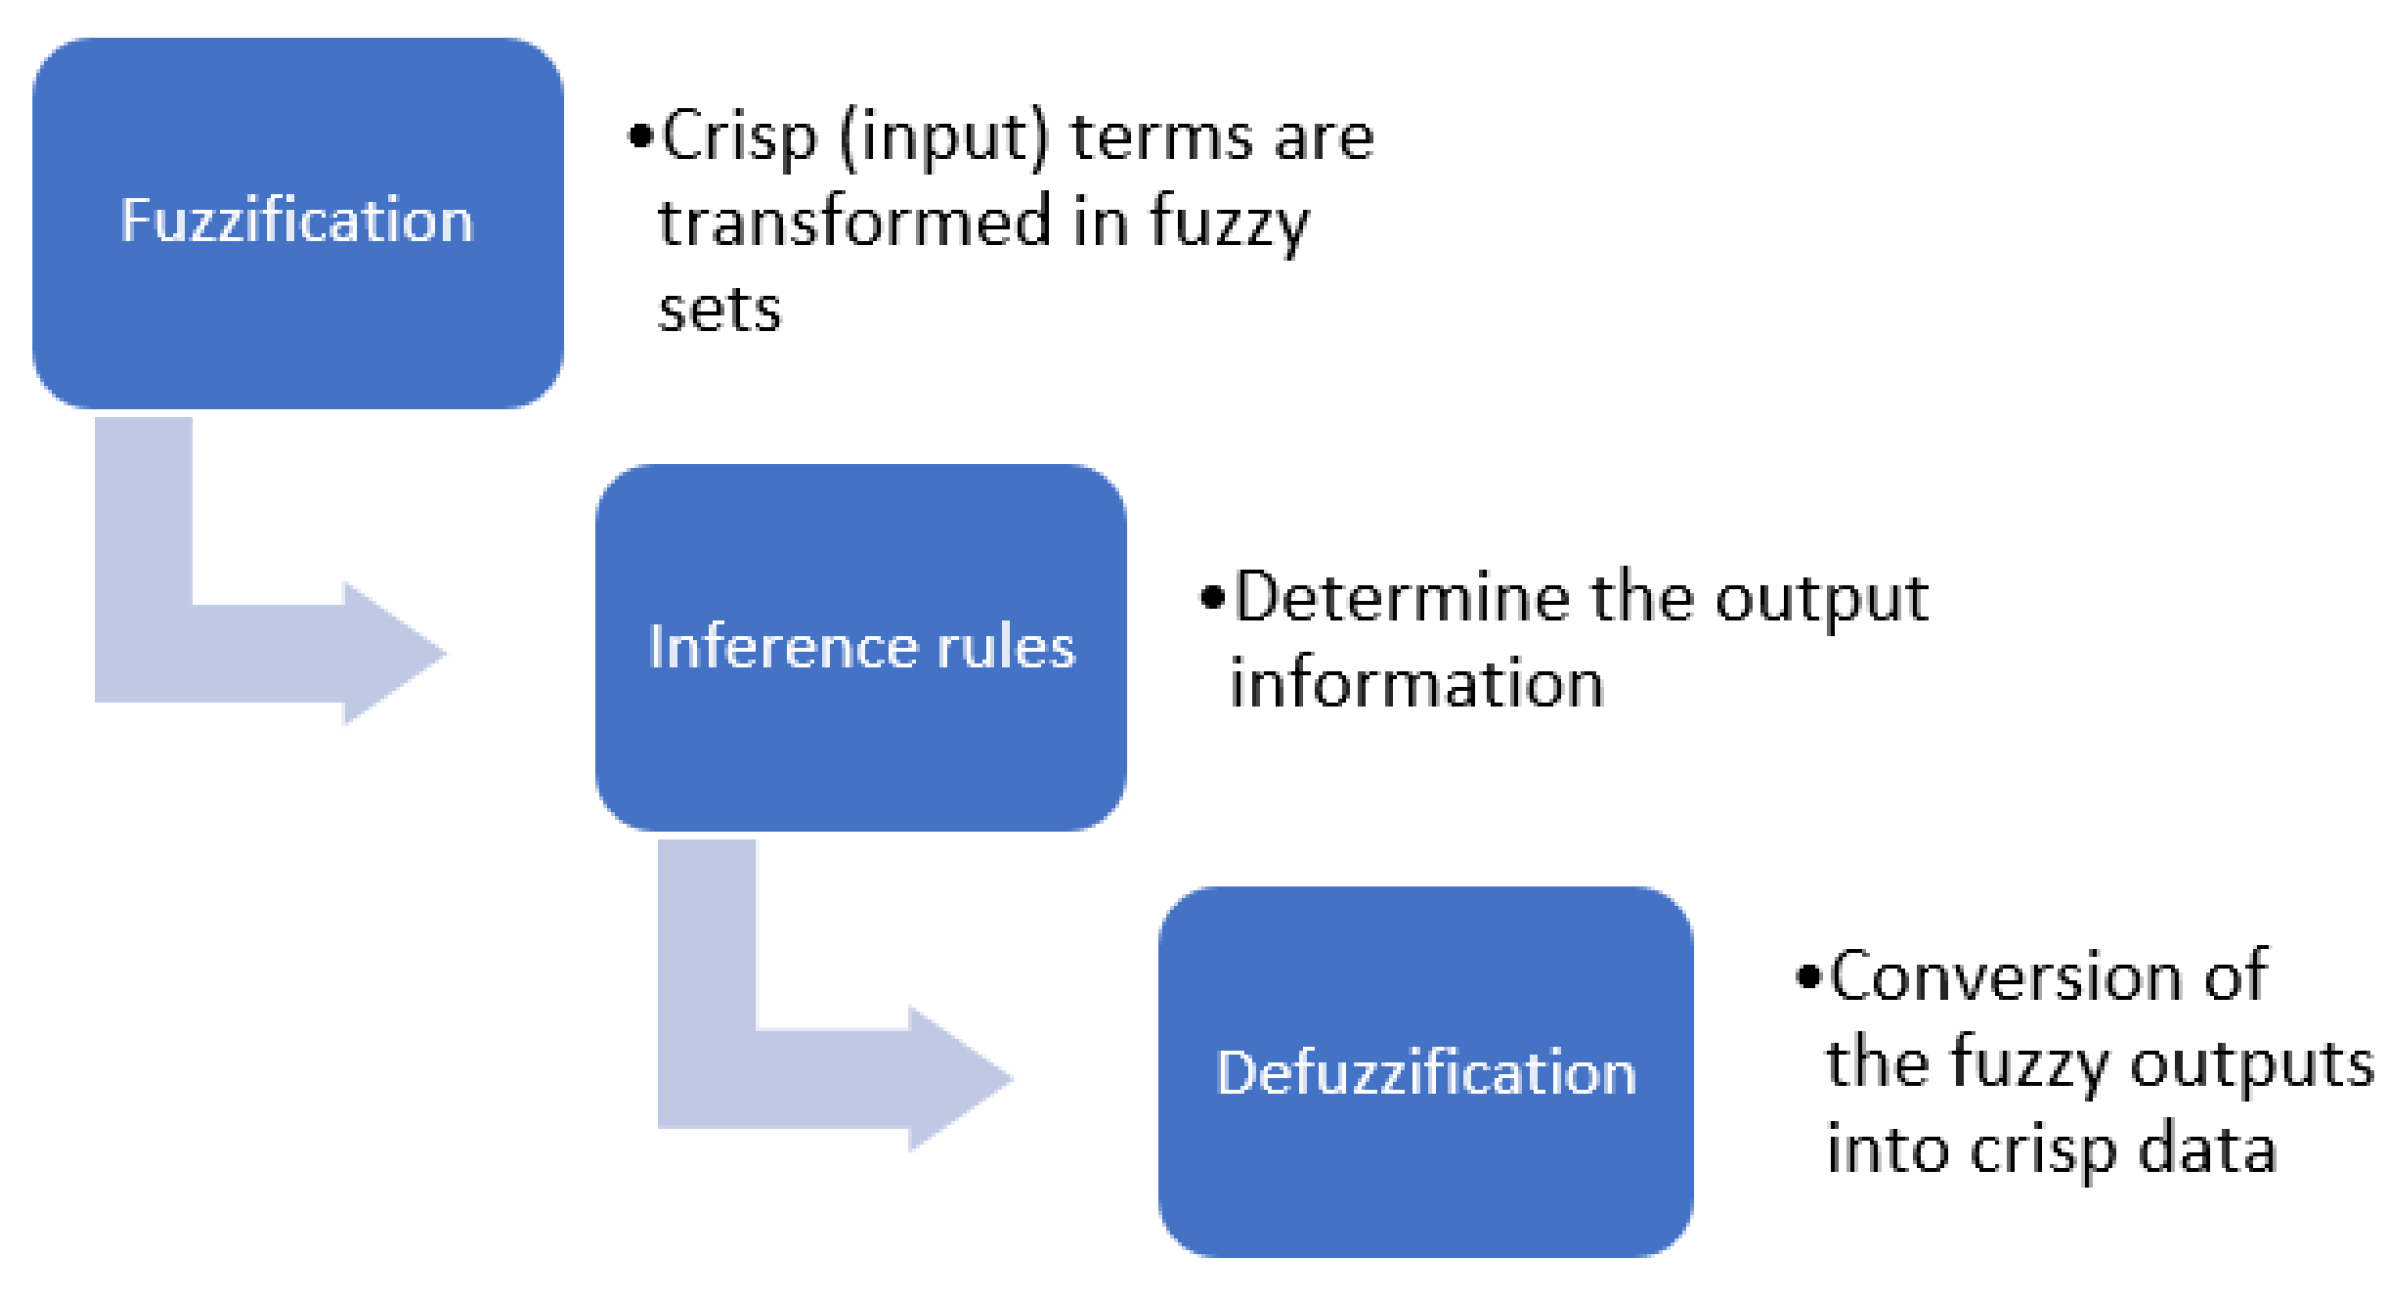
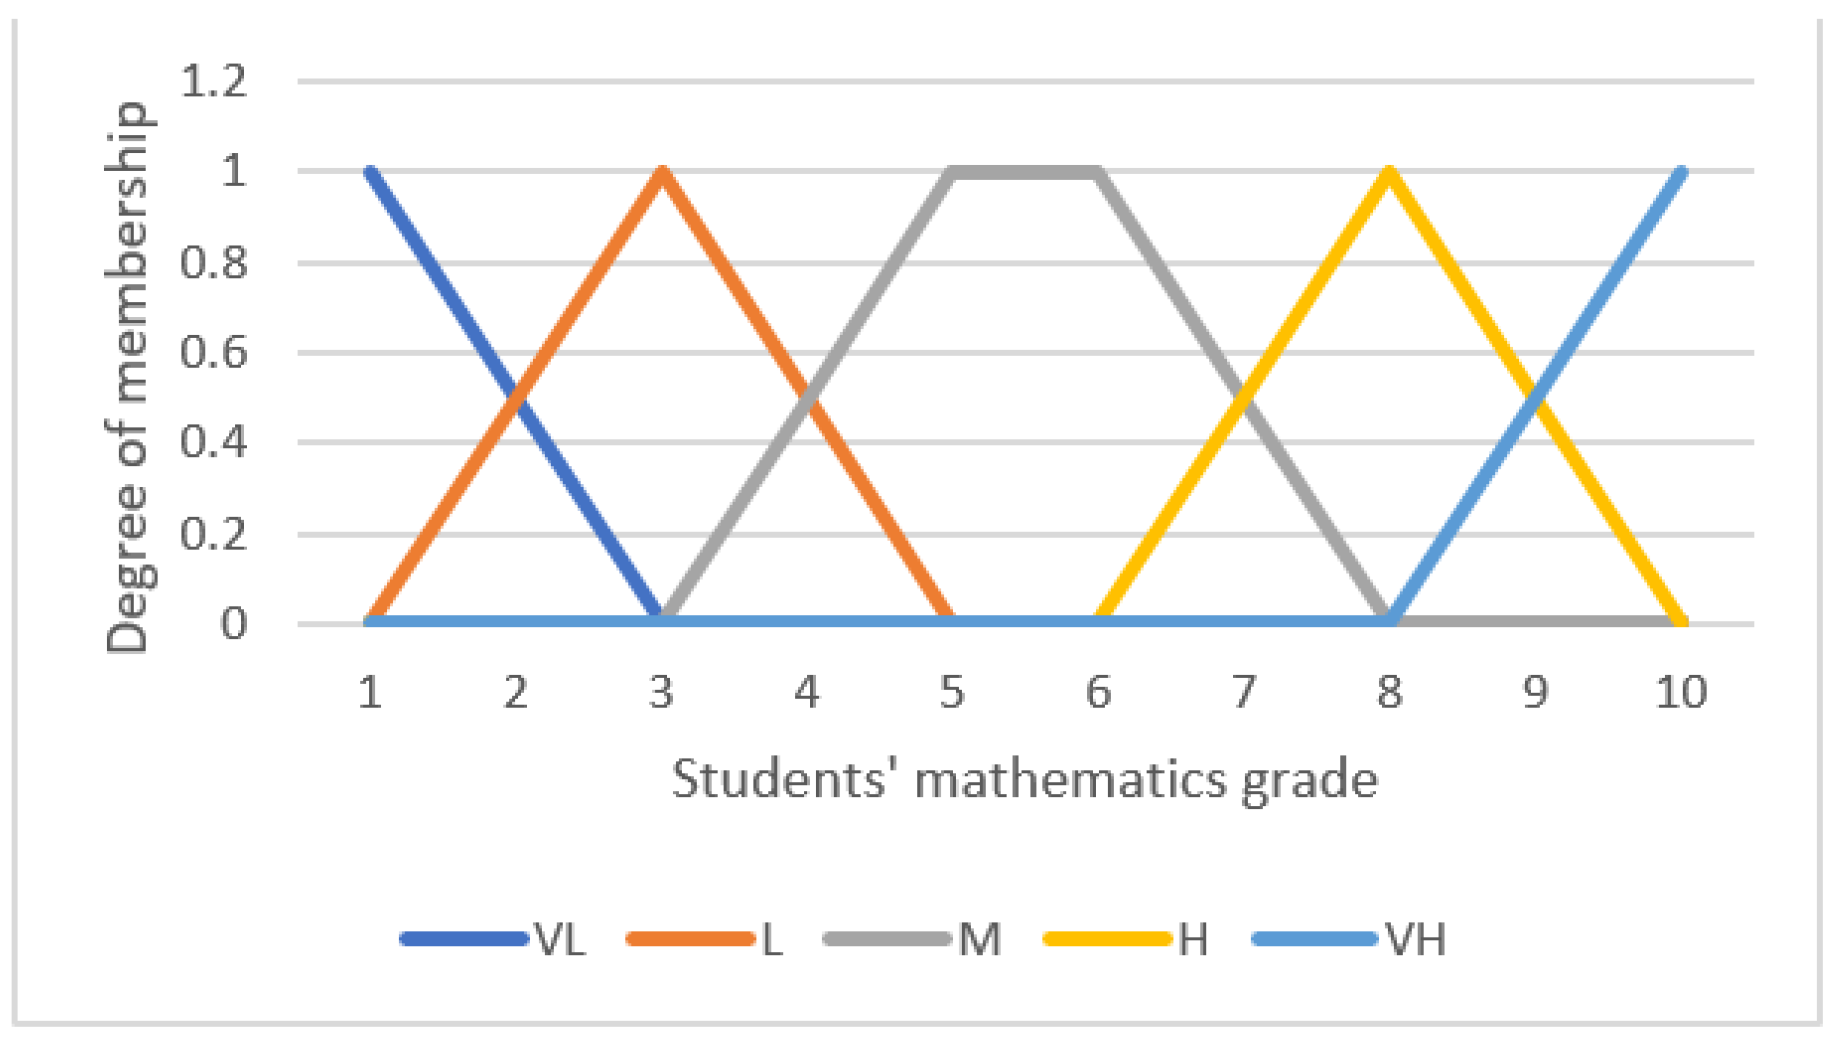
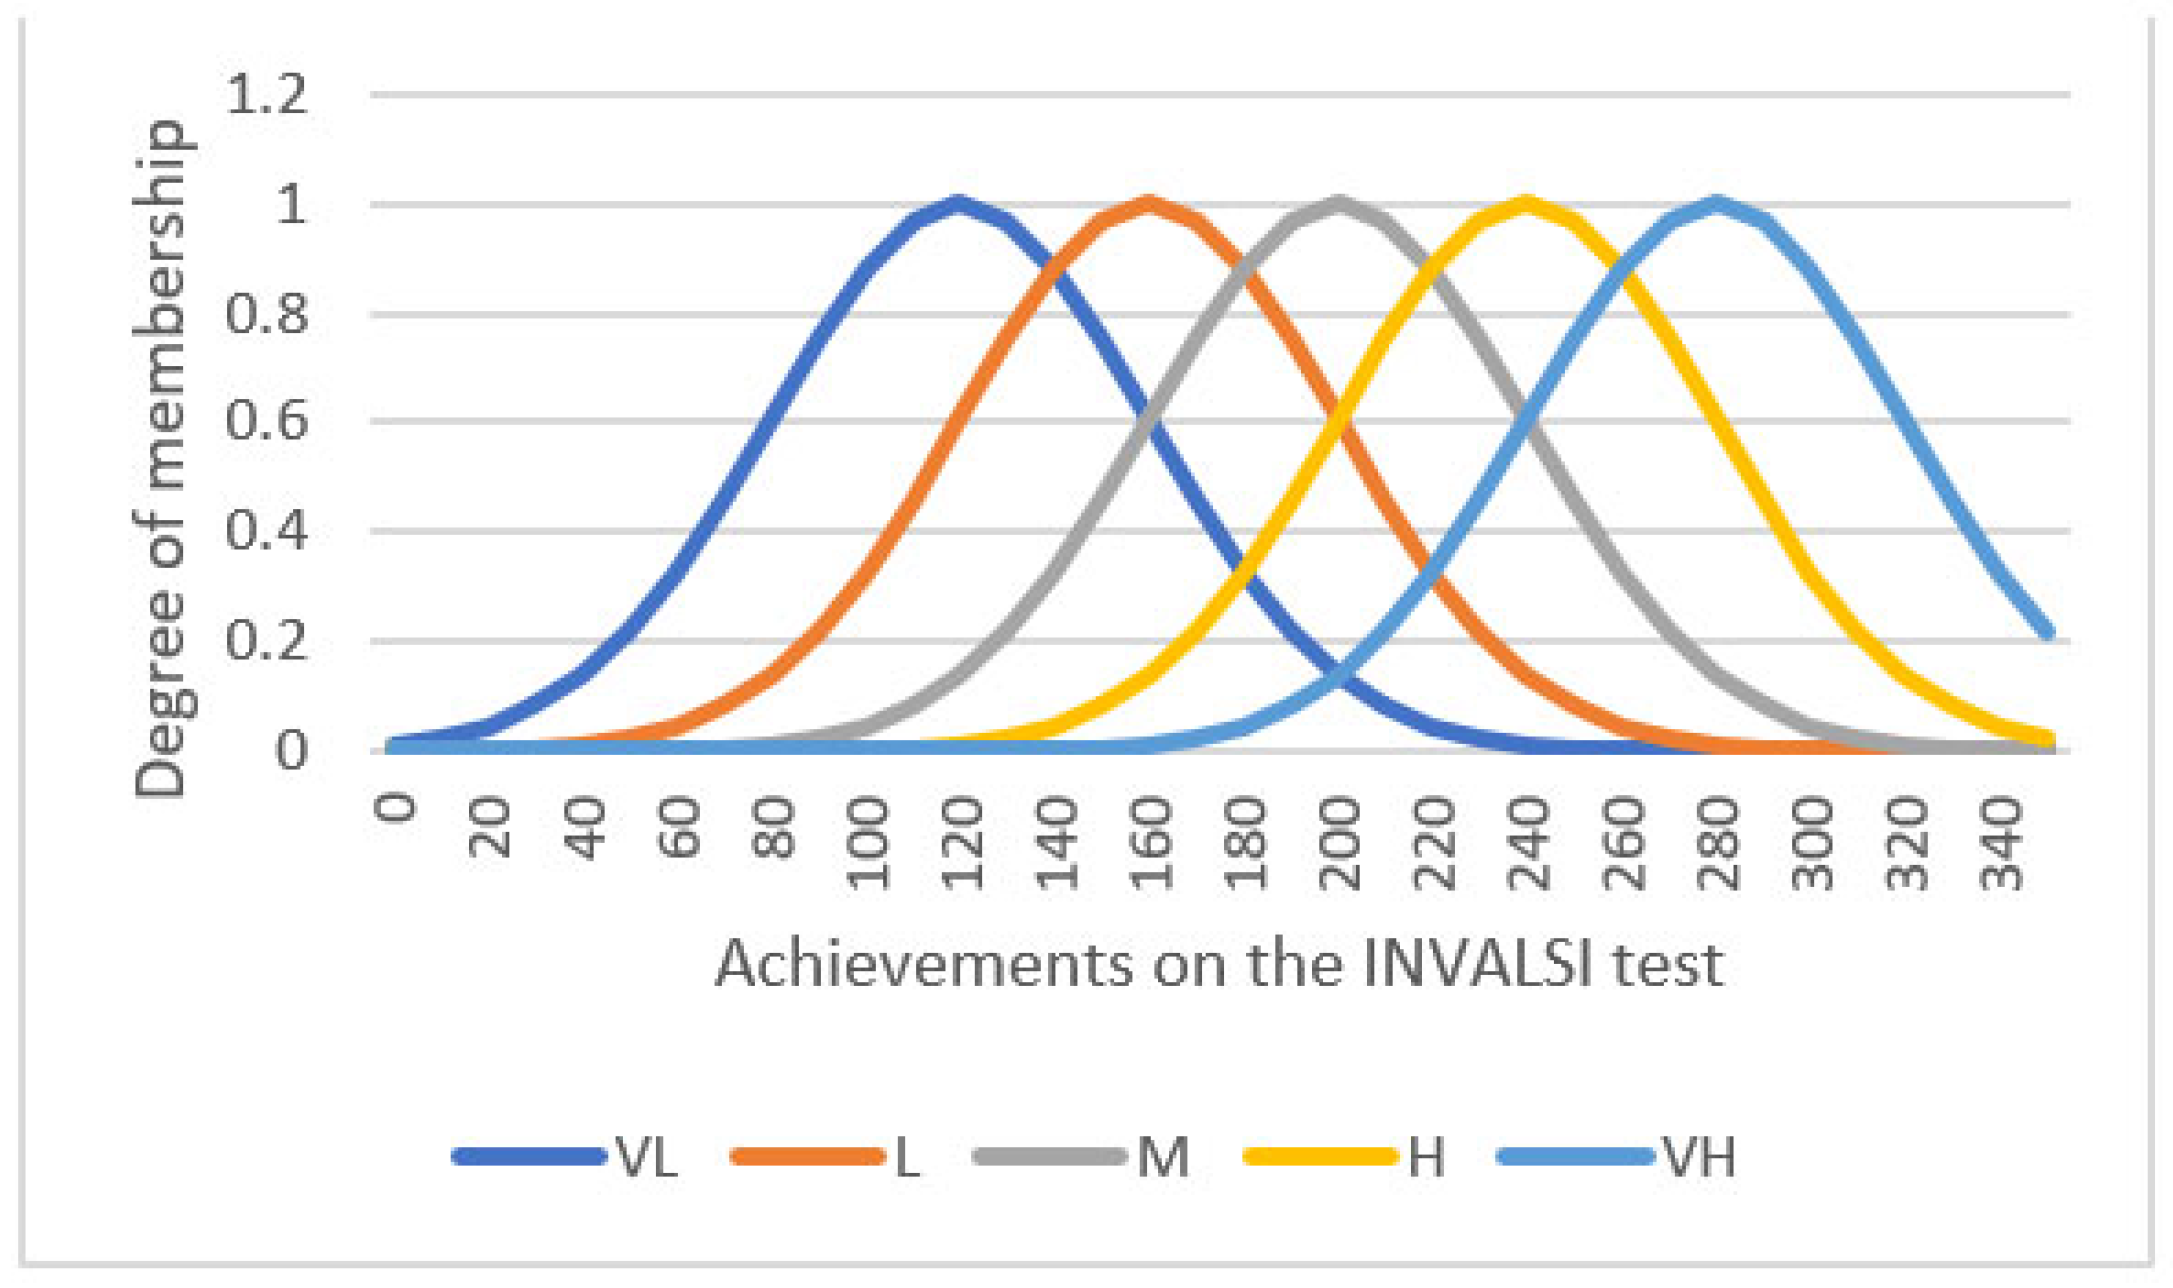
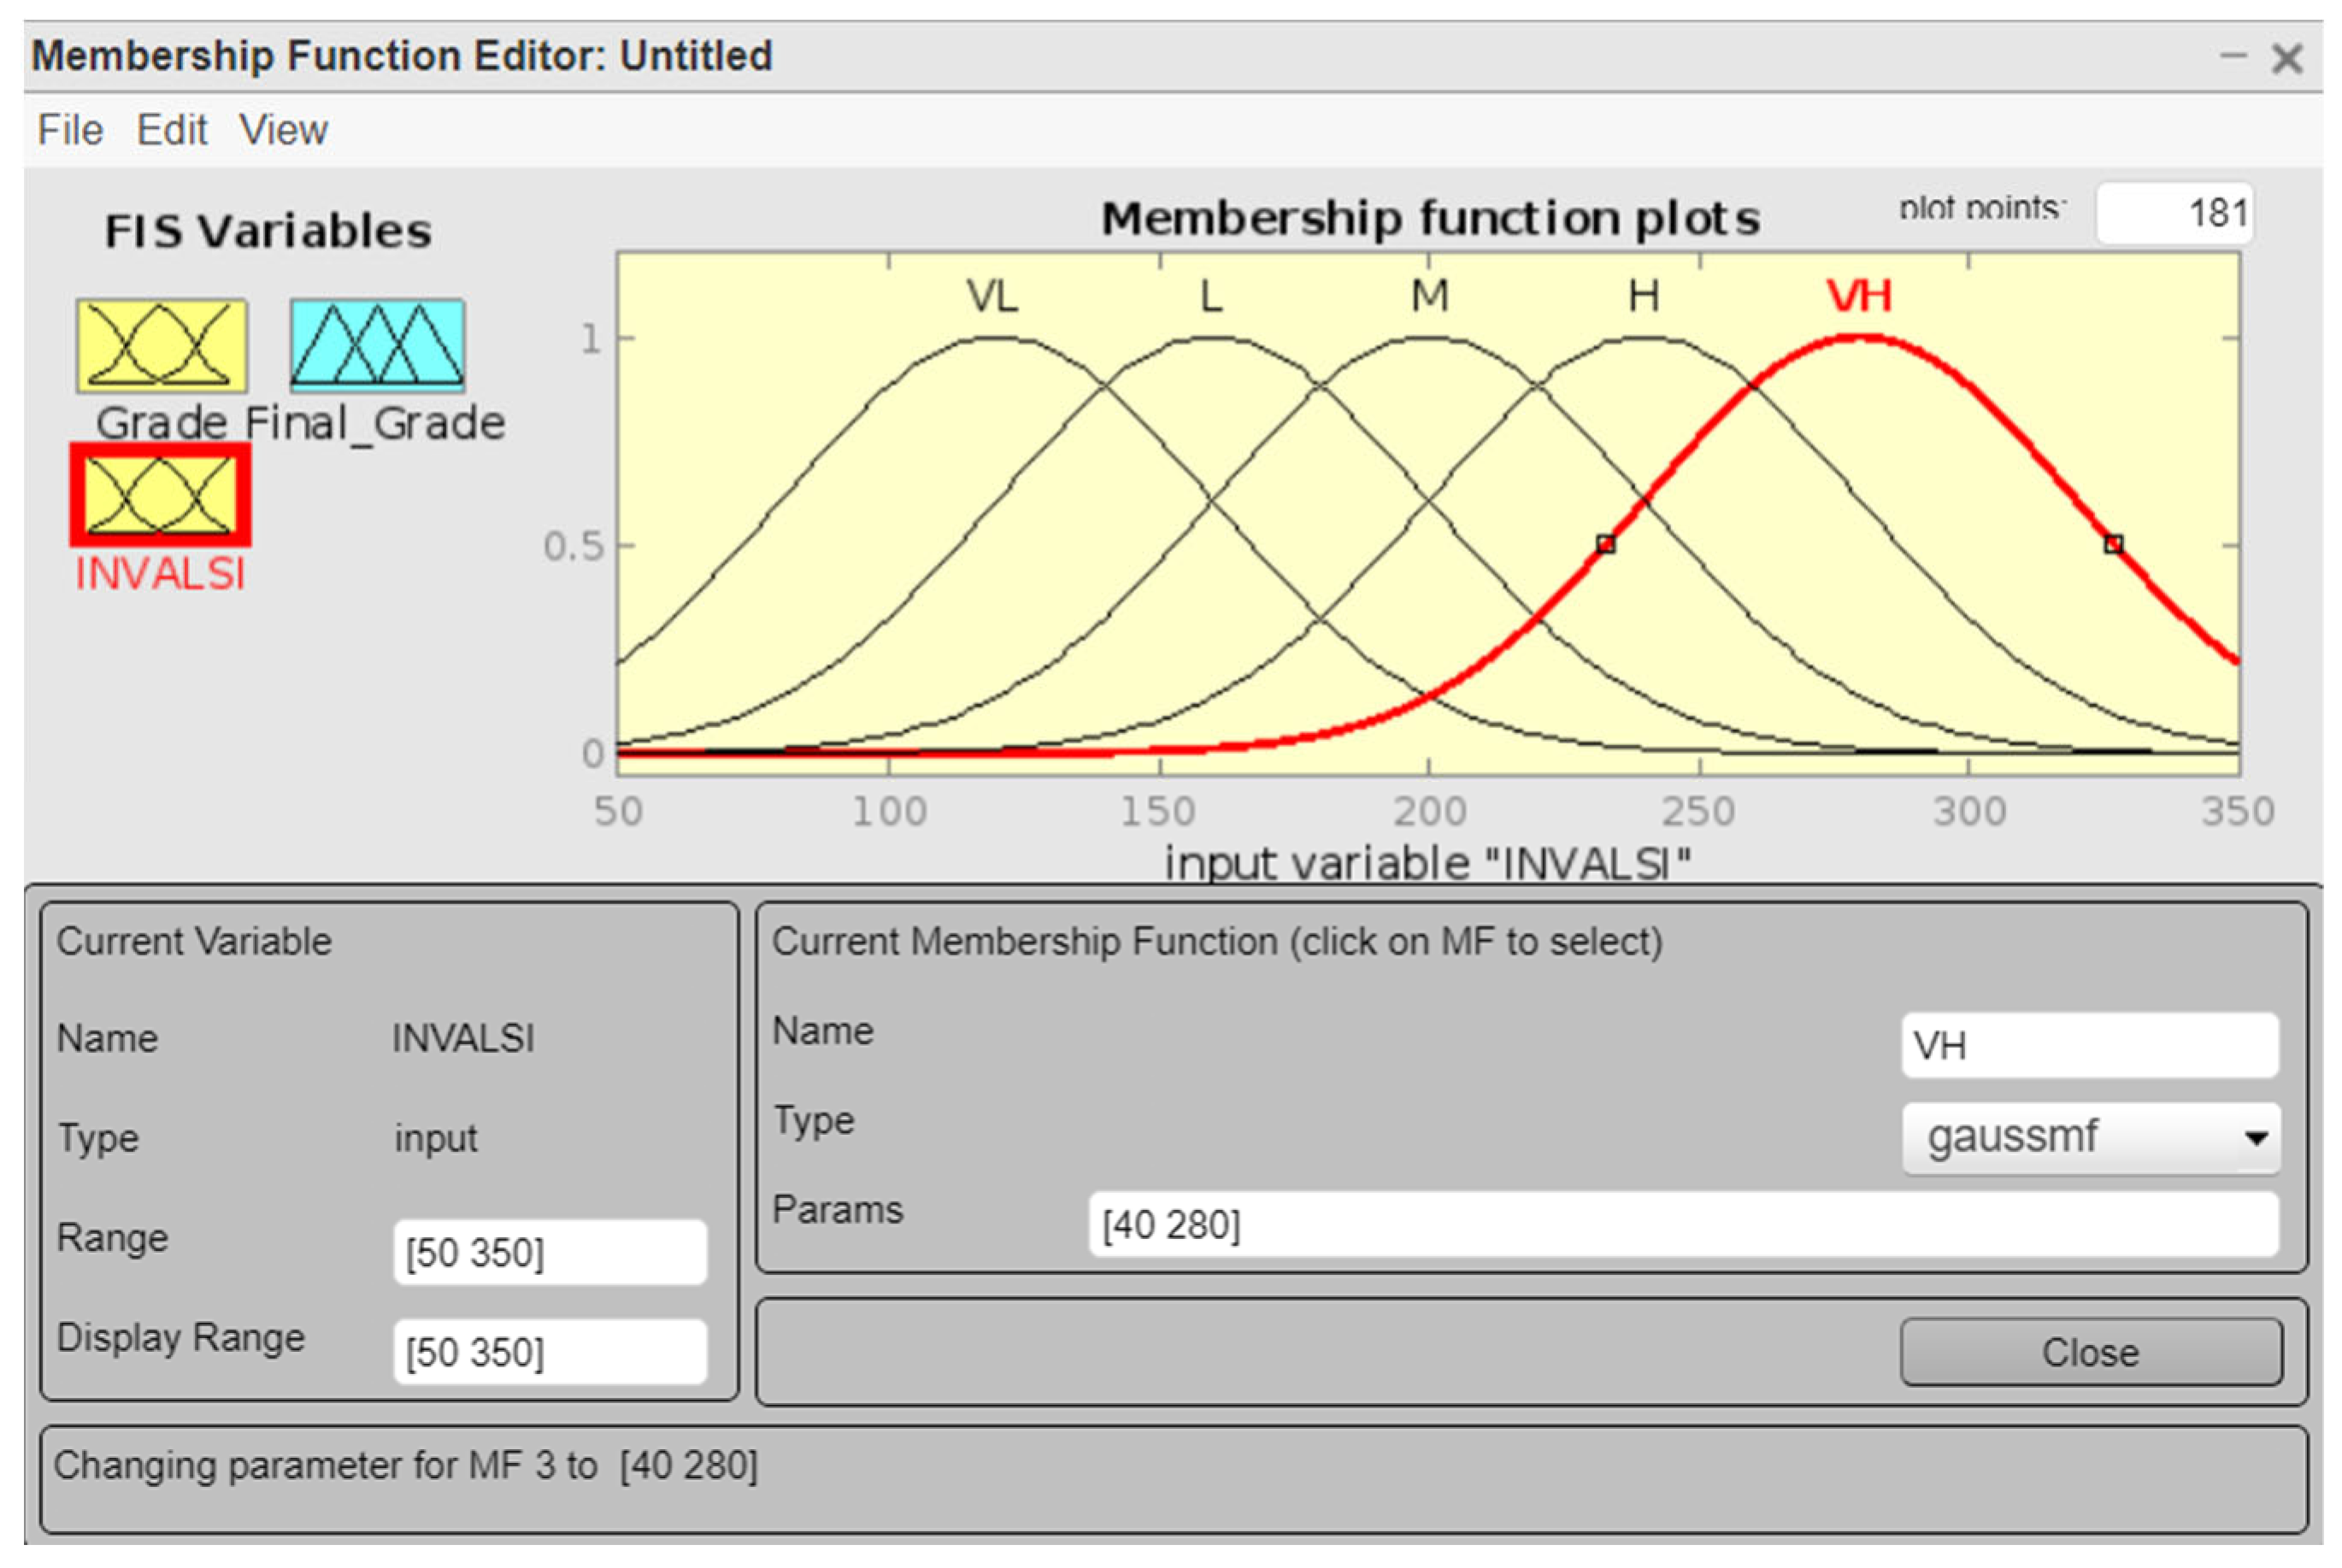
The present empirical research should be considered in light of some limitations. First, the results obtained through fuzzy logic depend on the techniques used, on fuzzification, on the definition and the granularity of fuzzy rules, and on defuzzification. Membership functions and inferential rules were chosen by the researchers based on previous studies [7] and based on their experiences as educators [25]. Changing the functions and inference rules would lead to potentially very different results. Future research should address the question of how fuzzy grades would change if different membership functions or defuzzification methods were used. Second, in the present work, we assumed the proposed model to be better than considering solely teacher-given grades. In particular, teacher-given grades and standardized assessment scores measure slightly different aspects of achievement and achievement-related behavior [68]. Considering both measures of students’ knowledge and competencies is important to improve student achievement [69] and give educators, students, and parents more complete information regarding students’ achievements [2]. However, we did not compare the proposed model with other assessing models. Future studies could therefore evaluate the validity of the proposed model by comparing it with other methods. Lastly, in this study, we did not consider some factors which could affect students’ achievement, such as their gender, socio-economic status, and geographic origin. Future studies could therefore explore the role these factors play in the fuzzy logic model proposed in this paper. There are also practical limitations in applying the methodology described in this work. Indeed, teachers may not be familiar with fuzzy logic, so the transition from traditional to fuzzy assessing model may not be smooth. Teachers should thus receive specific training and knowledge on the fuzzy logic itself before the model could be used in everyday teaching practice.

6. Conclusions

Although teacher-given grades are often reported numerically, the grades awarded by teachers are based on verbal descriptions of students’ knowledge and competencies. To work with variables that are based on descriptions and verbal judgments and characterized by a degree of vagueness, it is recommended to use the fuzzy logic [3]. Moreover, the teachers’ approach to evaluation in classrooms may not coincide with the approach taken in INVALSI tests. Indeed, in classrooms, the tests have a concentrated focus on the subject content which is studied (e.g., tests assess solely students’ knowledge of equations), while in the INVALSI tests, the focus is usually more multidisciplinary (i.e., several mathematics topics are assessed). The aim of the present work was to investigate how to combine teacher-given grades with students’ results in the standardized INVALSI test in order to create a novel assessing method, based on fuzzy logic, and how it differs from the traditional assessment method.
From the obtained results we can deduce that in the considered samples, the fuzzy assessment method reduces students’ grades. Therefore, the evaluation method with fuzzy logic is stricter than the traditional one. Furthermore, we have shown that the level of schooling has an almost negligible effect on students’ fuzzy grades.
Although this research has considered solely secondary and high school students, future research is needed to test the possibility of evaluating students’ mathematical knowledge also in lower schools, namely elementary schools. Therefore, more research is needed to explore the possibility of extending the proposed model of assessing students’ mathematical knowledge across grades. In the present research, we used students’ achievement on the Italian national assessment of mathematics knowledge INVALSI, while future research could investigate the combination of student grades with their results in other standardized tests, such as the PISA or TIMSS. Additionally, the proposed model, although it has been tested only for mathematics, can also be extended to other subjects, for which there are standardized national or international tests (e.g., the INVALSI institute also assesses the knowledge of Italian and English language).

Author Contributions

Conceptualization, D.D., D.F. and M.C.; methodology, D.D.; software, D.D.; validation, D.F. and M.C.; resources, D.D., D.F. and M.C.; data curation, D.D., D.F. and M.C.; writing—original draft preparation, D.D. and D.F.; writing—review and editing, D.D. and M.C.; supervision, M.C. All authors have read and agreed to the published version of the manuscript.

Funding

This research received no external funding.

Institutional Review Board Statement

Not applicable.

Informed Consent Statement

Not applicable.

Data Availability Statement

Not applicable.

Conflicts of Interest

The authors declare no conflict of interest.

References

  1. Gao, X.; Li, P.; Shen, J.; Sun, H. Reviewing assessment of student learning in interdisciplinary STEM education. Int. J. STEM Educ. 2020, 7, 24. [Google Scholar] [CrossRef]
  2. Mellati, M.; Khademi, M. Exploring teachers’ assessment literacy: Impact on learners’ writing achievements and implications for teacher development. Austr. J. Teach. Educ. 2018, 43, 1–18. [Google Scholar] [CrossRef]
  3. Voskoglou, M.G. Fuzzy logic as a tool for assessing students’ knowledge and skills. Educ. Sci. 2013, 3, 208–221. [Google Scholar] [CrossRef]
  4. Sripan, R.; Suksawat, B. Propose of fuzzy logic-based students’ learning assessment. In Proceedings of the ICCAS 2010, Gyeonggi-do, Korea, 27–30 October 2010; IEEE: Manhattan, NY, USA, 2010; pp. 414–417. [Google Scholar]
  5. Krouska, A.; Troussas, C.; Sgouropoulou, C. Fuzzy logic for refining the evaluation of learners’ performance in online engineering education. Eur. J. Eng. Sci. Tech. 2019, 4, 50–56. [Google Scholar]
  6. Gokmen, G.; Akinci, T.Ç.; Tektaş, M.; Onat, N.; Kocyigit, G.; Tektaş, N. Evaluation of student performance in laboratory applications using fuzzy logic. Procedia Soc. 2010, 2, 902–909. [Google Scholar] [CrossRef]
  7. Petrudi, S.H.J.; Pirouz, M.; Pirouz, B. Application of fuzzy logic for performance evaluation of academic students. In Proceedings of the 2013 13th Iranian Conference on Fuzzy Systems (IFSC), Qazvin, Iran, 27–29 August 2013; IEEE: Manhattan, NY, USA, 2013; pp. 1–5. [Google Scholar]
  8. Namli, N.A.; Şenkal, O. Using the fuzzy logic in assessing the programming performance of students. Int. J. Assess. Tool. Educ. 2018, 5, 701–712. [Google Scholar] [CrossRef]
  9. Yadav, R.S.; Soni, A.K.; Pal, S. A study of academic performance evaluation using Fuzzy Logic techniques. In Proceedings of the 2014 International Conference on Computing for Sustainable Global Development (INDIACom), New Delhi, India, 5–7 March 2014; IEEE: Manhattan, NY, USA, 2014; pp. 48–53. [Google Scholar]
  10. Ivanova, V.; Zlatanov, B. Application of fuzzy logic in online test evaluation in English as a foreign language at university level. In Proceedings of the 45th International Conference on Application of Mathematics in Engineering and Economics (AMEE’19), Sozopol, Bulgaria, 7–13 June 2019; AIP Publishing: Long Island, NY, USA, 2019; Volume 2172, p. 040009. [Google Scholar]
  11. Eryılmaz, M.; Adabashi, A. Development of an intelligent tutoring system using bayesian networks and fuzzy logic for a higher student academic performance. Appl. Sci. 2020, 10, 6638. [Google Scholar] [CrossRef]
  12. Ivanova, V.; Zlatanov, B. Implementation of fuzzy functions aimed at fairer grading of students’ tests. Educ. Sci. 2019, 9, 214. [Google Scholar] [CrossRef]
  13. Amelia, N.; Abdullah, A.G.; Mulyadi, Y. Meta-analysis of student performance assessment using fuzzy logic. Indones. J. Sci. Technol. 2019, 4, 74–88. [Google Scholar] [CrossRef]
  14. Chrysafiadi, K.; Troussas, C.; Virvou, M. Combination of fuzzy and cognitive theories for adaptive e-assessment. Expert Syst. Appl. 2020, 161, 113614. [Google Scholar] [CrossRef]
  15. Zadeh, L.A. Fuzzy sets. Inf. Control 1965, 8, 338–353. [Google Scholar] [CrossRef]
  16. Bissey, S.; Jacques, S.; Le Bunetel, J.C. The fuzzy logic method to efficiently optimize electricity consumption in individual housing. Energies 2017, 10, 1701. [Google Scholar] [CrossRef]
  17. Liu, H.; Jeffery, C.J. Moonlighting Proteins in the Fuzzy Logic of Cellular Metabolism. Molecules 2020, 25, 3440. [Google Scholar] [CrossRef] [PubMed]
  18. Thalmeiner, G.; Gáspár, S.; Barta, Á.; Zéman, Z. Application of Fuzzy Logic to Evaluate the Economic Impact of COVID-19: Case Study of a Project-Oriented Travel Agency. Sustainability 2021, 13, 9602. [Google Scholar] [CrossRef]
  19. Khalil, S.; Hassan, A.; Alaskar, H.; Khan, W.; Hussain, A. Fuzzy Logical Algebra and Study of the Effectiveness of Medications for COVID-19. Mathematics 2021, 9, 2838. [Google Scholar] [CrossRef]
  20. Xue, Z.; Dong, Q.; Fan, X.; Jin, Q.; Jian, H.; Liu, J. Fuzzy Logic-Based Model That Incorporates Personality Traits for Heterogeneous Pedestrians. Symmetry 2017, 9, 239. [Google Scholar] [CrossRef]
  21. Zadeh, L.A.; Aliev, R.A. Fuzzy Logic Theory and Applications: Part I and Part II; World Scientific Publishing: Singapore, 2018. [Google Scholar]
  22. Yadav, R.S.; Singh, V.P. Modeling academic performance evaluation using soft computing techniques: A fuzzy logic approach. Int. J. Comput. Sci. Eng. 2011, 3, 676–686. [Google Scholar]
  23. Azam, M.H.; Hasan, M.H.; Hassan, S.; Abdulkadir, S.J. Fuzzy type-1 triangular membership function approximation using fuzzy C-means. In Proceedings of the 2020 International Conference on Computational Intelligence (ICCI), Bandar Seri Iskandar, Malaysia, 8–9 October 2020; IEEE: Manhattan, NY, USA, 2020; pp. 115–120. [Google Scholar]
  24. Bakar, N.A.; Rosbi, S.; Bakar, A.A. Robust estimation of student performance in massive open online course using fuzzy logic approach. Int. J. Eng. Technol. 2020, editor issue. 143–152. [Google Scholar]
  25. Bai, Y.; Wang, D. Fundamentals of fuzzy logic control—fuzzy sets, fuzzy rules and defuzzifications. In Advanced Fuzzy Logic Technologies in Industrial Applications; Bai, Y., Zhuang, H., Wang, D., Eds.; Springer: London, UK, 2006; pp. 17–36. [Google Scholar]
  26. Saliu, S. Constrained subjective assessment of student learning. J. Sci. Educ. Technol. 2005, 14, 271–284. [Google Scholar] [CrossRef]
  27. Doz, D.; Felda, D.; Cotič, M. Assessing Students’ Mathematical Knowledge with Fuzzy Logic. Educ. Sci. 2022, 12, 266. [Google Scholar] [CrossRef]
  28. INVALSI. Servizio Statistico. Available online: https://invalsi-serviziostatistico.cineca.it/ (accessed on 1 June 2022).
  29. INVALSI. Rapproto Prove INVALSI 2019. Available online: https://invalsi-areaprove.cineca.it/docs/2019/rapporto_prove_invalsi_2019.pdf (accessed on 1 June 2022).
  30. Cardone, M.; Falzetti, P.; Sacco, C. INVALSI Data for School System Improvement: The Value Added. Available online: https://www.invalsi.it/download2/wp/wp43_Falzetti_Cardone_Sacco.pdf (accessed on 1 June 2022).
  31. INVALSI. Istruzioni Informazioni Contest Scuola Secondaria Secondo Grado. Available online: https://invalsi-areaprove.cineca.it/docs/2020/02_2020_Istruzioni_informazioni_contesto_Scuola_secondaria_secondo%20_grad.pdf (accessed on 1 June 2022).
  32. DLgs 62/2017. Available online: https://www.gazzettaufficiale.it/eli/id/2017/05/16/17G00070/sg (accessed on 1 June 2022).
  33. RD 653/1925. Available online: https://www.normattiva.it/uri-res/N2Ls?urn:nir:stato:legge:1925-05-04;653 (accessed on 1 June 2022).
  34. DLgs 297/1994. Available online: https://www.gazzettaufficiale.it/eli/id/1994/05/19/094G0291/sg (accessed on 1 June 2022).
  35. D 254/2012. Available online: https://www.gazzettaufficiale.it/eli/id/2013/02/05/13G00034/sg (accessed on 1 June 2022).
  36. DPR 89/2010. Available online: https://www.gazzettaufficiale.it/eli/id/2010/06/15/010G0111/sg (accessed on 1 June 2022).
  37. INVALSI. Quadro di Riferimento 2018. Available online: https://invalsi-areaprove.cineca.it/docs/file/QdR_MATEMATICA.pdf (accessed on 1 June 2022).
  38. INVALSI. Rapproto Prove INVALSI 2018. Available online: https://www.invalsi.it/invalsi/doc_evidenza/2018/Rapporto_prove_INVALSI_2018.pdf (accessed on 1 June 2022).
  39. INVALSI. Rapproto Prove INVALSI 2017. Available online: https://www.invalsi.it/invalsi/doc_eventi/2017/Rapporto_Prove_INVALSI_2017.pdf (accessed on 1 June 2022).
  40. Organization for Economic Co-Operation and Development [OECD]. Technical Report PISA 2018. Available online: https://www.oecd.org/pisa/data/pisa2018technicalreport/Ch.09-Scaling-PISA-Data.pdf (accessed on 1 June 2022).
  41. Trends in International Mathematics and Science Study [TIMSS]. Scaling Methodology. Available online: https://timssandpirls.bc.edu/timss2019/methods/pdf/T19_MP_Ch11-scaling-methodology.pdf (accessed on 2 June 2022).
  42. Pastori, G.; Pagani, V. What do you think about INVALSI tests? School directors, teachers and students from Lombardy describe their experience. J. Educ. Cult. Psychol. Stud. 2016, 13, 97–117. [Google Scholar] [CrossRef]
  43. Thukral, S.; Rana, V. Versatility of fuzzy logic in chronic diseases: A review. Med. Hypotheses 2019, 122, 150–156. [Google Scholar] [CrossRef] [PubMed]
  44. MATLAB. Fuzzy Logic Toolbox. Available online: https://it.mathworks.com/products/fuzzy-logic.html (accessed on 2 June 2022).
  45. MATLAB. Breve Riepilogo su R2020b. Available online: https://it.mathworks.com/products/new_products/release2020b.html (accessed on 2 June 2022).
  46. The Jamovi Project. Jamovi (Version 2.2.5) [Computer Software]. Available online: https://www.jamovi.org (accessed on 1 June 2022).
  47. Arnastauskaitė, J.; Ruzgas, T.; Bražėnas, M. An Exhaustive Power Comparison of Normality Tests. Mathematics 2021, 9, 788. [Google Scholar] [CrossRef]
  48. Gerald, B. A brief review of independent, dependent and one sample t-test. Int. J. Appl. Math. Theor. Phys. 2018, 4, 50–54. [Google Scholar] [CrossRef]
  49. Hopkins, S.; Dettori, J.R.; Chapman, J.R. Parametric and nonparametric tests in spine research: Why do they matter? Glob. Spine J. 2018, 8, 652–654. [Google Scholar] [CrossRef] [PubMed]
  50. Schober, P.; Boer, C.; Schwarte, L.A. Correlation coefficients: Appropriate use and interpretation. Anesth. Analg. 2018, 126, 1763–1768. [Google Scholar] [CrossRef]
  51. Akoglu, H. User’s guide to correlation coefficients. Turk. J. Emerg. Med. 2018, 18, 91–93. [Google Scholar] [CrossRef]
  52. Grzegorzewski, P.; Śpiewak, M. The sign test and the signed-rank test for interval-valued data. Int. J. Itell. Syst. 2019, 34, 2122–2150. [Google Scholar] [CrossRef]
  53. Johnson, R.W. Alternate Forms of the One-Way ANOVA F and Kruskal–Wallis Test Statistics. J. Stat. Data Sci. Educ. 2022, 30, 82–85. [Google Scholar] [CrossRef]
  54. Albers, C.; Lakens, D. When power analyses based on pilot data are biased: Inaccurate effect size estimators and follow-up bias. J. Exp. Soc. Psychol. 2018, 74, 187–195. [Google Scholar] [CrossRef]
  55. Liu, X.S.; Carlson, R.; Kelley, K. Common language effect size for correlations. J. Gen. Psychol. 2019, 146, 325–338. [Google Scholar] [CrossRef] [PubMed]
  56. Lovakov, A.; Agadullina, E.R. Empirically derived guidelines for effect size interpretation in social psychology. Eur. J. Soc. Psychol. 2021, 51, 485–504. [Google Scholar] [CrossRef]
  57. Funder, D.C.; Ozer, D.J. Evaluating effect size in psychological research: Sense and nonsense. Adv. Methods Pract. Psychol. Sci. 2019, 2, 156–168. [Google Scholar] [CrossRef]
  58. Quadlin, N. The mark of a woman’s record: Gender and academic performance in hiring. Am. Sciol. Rev. 2018, 83, 331–360. [Google Scholar] [CrossRef]
  59. Kanetaki, Z.; Stergiou, C.; Bekas, G.; Jacques, S.; Troussas, C.; Sgouropoulou, C.; Ouahabi, A. Grade Prediction Modeling in Hybrid Learning Environments for Sustainable Engineering Education. Sustainability 2022, 14, 5205. [Google Scholar] [CrossRef]
  60. Chung, S.J.; Choi, L.J. The development of sustainable assessment during the COVID-19 pandemic: The case of the English language program in South Korea. Sustainability 2021, 13, 4499. [Google Scholar] [CrossRef]
  61. Bowers, A.J. Towards measures of different and useful aspects of schooling: Why schools need both teacher-assigned grades and standardized assessments. In Classroom Assessment and Educational Measurement; Routledge: New York, NY, USA, 2019; pp. 209–223. [Google Scholar]
  62. Gershenson, S.; Thomas, B.; Fordham Institute. Grade Inflation in High Schools (2005–2016). Available online: https://files.eric.ed.gov/fulltext/ED598893.pdf (accessed on 16 June 2022).
  63. Herppich, S.; Praetorius, A.K.; Förster, N.; Glogger-Frey, I.; Karst, K.; Leutner, D.; Behrmann, L.; Böhmer, M.; Ufer, S.; Klug, J.; et al. Teachers’ assessment competence: Integrating knowledge-, process-, and product-oriented approaches into a competence-oriented conceptual model. Teach. Teach. Educ. 2018, 76, 181–193. [Google Scholar] [CrossRef]
  64. Marsh, J.A.; Farrell, C.C. How leaders can support teachers with data-driven decision making: A framework for understanding capacity building. Educ. Manag. Adm. Leadersh. 2015, 43, 269–289. [Google Scholar] [CrossRef]
  65. Stronge, J.H.; Tucker, P.D. Handbook on Teacher Evaluation: Assessing and Improving Performance; Routledge: New York, NY, USA, 2020. [Google Scholar]
  66. Ferretti, F.; Funghi, S.; Martignone, F. How Standardised Tests Impact on Teacher Practices: An Exploratory Study of Teachers’ Beliefs. In Theorizing and Measuring Affect in Mathematics Teaching and Learning; Springer: Cham, Germany, 2020; pp. 139–146. [Google Scholar]
  67. Eriksson, K.; Helenius, O.; Ryve, A. Using TIMSS items to evaluate the effectiveness of different instructional practices. Instr. Sci. 2019, 47, 1–18. [Google Scholar] [CrossRef]
  68. Westphal, A.; Vock, M.; Kretschmann, J. Unraveling the relationship between teacher-assigned grades, student personality, and standardized test scores. Front. Psychol. 2021, 12, 627440. [Google Scholar] [CrossRef]
  69. Bergbauer, A.B.; Hanushek, E.A.; Woessmann, L. Testing. Available online: https://www.nber.org/system/files/working_papers/w24836/w24836.pdf (accessed on 14 July 2022).
Figure 1. The fuzzy logic process.
Axioms 11 00359 g001
Figure 2. General diagram illustrating the methodology used in the present study. * Data from school year 2018–2019 was used.
Axioms 11 00359 g002
Figure 3. The utilized model for the assessment of students’ mathematical knowledge.
Axioms 11 00359 g003
Figure 4. Plots of the membership functions for the fuzzification of crisp grades.
Axioms 11 00359 g004
Figure 5. Plots of the membership functions for the fuzzification of crisp test scores.
Axioms 11 00359 g005
Figure 6. The output surface for the fuzzy inference system, plotting the output variable “Final Grade” against the first two input variables, i.e., “INVALSI” and “Grade”.
Axioms 11 00359 g006
Figure 7. The “Fuzzy Logic Toolbox” in the MATLAB program.
Axioms 11 00359 g007
Table 1. The three considered samples.
GradeOriginal SampleFinal Sample% of Original Sample
829,67529,05697.9%
1035,80232,79491.6%
1336,58930,41583.1%
Table 2. The distribution of gender in the three samples.
GradeGenderFrequency (f)Percentage Frequency (%f)
8Male14,98351.6%
Female14,07348.4%
10Male15,66347.8%
Female17,13152.2%
13Male14,78548.6%
Female15,63051.4%
Table 3. The used membership functions for the fuzzification of the teacher-given grades.
LevelMembership Function
Very low (VL) Tri ( x , 1 , 1 , 3 )
Low (L) Tri ( x , 1 , 3 , 5 )
Medium (M) Trap ( x , 3 , 5 , 6 ,   8 )
High (H) Tri ( x , 6 , 8 , 10 )
Very high (VH) Tri ( x , 8 , 10 , 10 )
Table 4. Membership functions for the fuzzification of students’ attainments on the INVALSI test.
LevelMembership Function
Very low (VL) Gauss ( x , 120 , 40 )
Low (L) Gauss ( x , 160 , 40 )
Medium (M) Gauss ( x , 200 , 40 )
High (H) Gauss ( x , 240 , 40 )
Very high (VH) Gauss ( x , 280 , 40 )
Table 5. Inference rules.
Teacher-Given Grades
VLLMHVH
INVALSIVLVLVLLLM
LVLLLMM
MLLMMH
HMMMHH
VHMMHHVH
Table 6. Descriptive statistics for 8th grade students.
Mathematics GradeINVALSIFuzzy Grade
Mean6.792015.62
Standard deviation1.4238.51.78
Median72006
Minimum366.51
Maximum1032610
Skewness (SE)0.160 (0.0144)0.247 (0.0144)−0.0461 (0.0144)
Kurtosis (SE)−0.693 (0.0287)−0.0442 (0.0287)−0.390 (0.0287)
Table 7. The distribution of fuzzy grades among students with different school grades.
Fuzzy Grades
School Grade12345678910Total
3309000000012 (0.0%)
403842202420700001015 (3.5%)
5002860001792016004668 (16.1%)
6003276004274049007599 (26.2%)
70018024124064026006520 (22.4%)
8003500253302710005278 (18.2%)
900001112707170135303351 (11.5%)
1000000303000310613 (2.1%)
Total3 (0.0%)384 (1.3%)6200 (21.3%)202 (.7%)2843 (9.8%)12943 (48.0%)717 (2.5%)3101 (10.7%)1353 (4.7%)310 (1.1%)29056 (100.0%)
Table 8. Descriptive statistics for fuzzy grades among the levels of teacher-given grades.
Fuzzy Grade
Teacher-Given GradeMeanStandard DeviationMedianMinimumMaximum
32.500.905313
43.671.36426
54.171.47338
64.721.51638
75.630.523638
87.011.05838
97.421.35759
109.001.0210610
Table 9. Descriptive statistics for 10th grade students.
Mathematics GradeINVALSIFuzzy Grade
Mean6.152065.54
Standard deviation1.4539.11.60
Median62036
Minimum172.31
Maximum1031410
Skewness (SE)0.004 (0.0135)0.226 (0.0135)−0.293 (0.0135)
Kurtosis (SE)−0.233 (0.0271)−0.053(0.0271)0.009 (0.0271)
Table 10. The distribution of fuzzy grades among students with different school grades.
Fuzzy Grades
School Grade12345678910Total
130000000003 (0.0%)
23890141110000118 (0.4%)
3102068300510000835 (2.5%)
405190536195122700003233 (9.9%)
50022820036520209006143 (18.7%)
6002550006560 566009676 (29.5%)
700170200846540180006859 (20.9%)
8001700174502362004124 (12.6%)
900008634202078501629 (5.0%)
10000006098069173 (0.5%)
Total108 (0.3%)608 (1.9%)5549 (16.9%)550 (1.7%)3978 (12.1%)17539 (53%)202 (0.6%)3415 (10.4%)785 (2.4%)69 (0.2%)32794 (100.0%)
Table 11. Descriptive statistics for fuzzy grades among the levels of teacher-given grades.
Fuzzy Grade
Teacher-Given GradeMeanStandard DeviationMedianMinimumMaximum
11.00.000111
22.531.10216
32.941.02316
44.421.16526
54.951.54638
65.331.47638
75.75.599638
87.131.02838
97.561.42759
108.731.108610
Table 12. Descriptive statistics for 13th grade students.
Mathematics GradeINVALSIFuzzy Grade
Mean6.332045.54
Standard deviation1.4639.81.62
Median62016
Minimum169.51
Maximum1034110
Skewness (SE)−0.005 (0.014)0.211 (0.014)−0.205 (0.014)
Kurtosis (SE)−0.215 (0.0281)−0.177(0.0281)−0.053 (0.0281)
Table 13. The distribution of fuzzy grades among students with different school grades.
Fuzzy Grades
School Grade12345678910Total
140100000005 (0.0%)
2150013122000078 (0.3%)
359053400680000661 (2.4%)
404490320145822800002455 (10.5%)
50020240029070178005109 (16.8%)
60028890055000506008895 (29.2%)
700220237941410416006688 (22.0%)
8004200206202141004245 (14.0%)
90000188772981378301989 (6.5%
10000005013410141290 (1.0%)
Total64 (.2%)499 (1.6%)5512 (18.1%)333 (1.1%)3867 (12.7%)15790 (51.9%)298 (1.0%)3118 (10.3%)793 (2.6%)141 (0.5%)30415 (100.0%)
Table 14. Descriptive statistics for fuzzy grades among the levels of teacher-given grades.
Fuzzy Grade
Teacher-Given GradeMeanStandard DeviationMedianMinimumMaximum
11.400.894113
22.881.31216
33.131.13316
44.411.24526
54.881.57638
65.141.55638
75.680.608638
86.981.07838
97.331.40759
108.971.059610
Publisher’s Note: MDPI stays neutral with regard to jurisdictional claims in published maps and institutional affiliations.

