Article

The Effect of the Characteristics of the Partition Plate Unit on the Separating Process of −6 mm Fine Coal in the Compound Dry Separator

1
Key Laboratory of Coal Processing and Efficient Utilization of Ministry of Education, China University of Mining & Technology, Xuzhou 221116, China
2
School of Chemical Engineering and Technology, China University of Mining and Technology, Xuzhou 221116, China
*
Author to whom correspondence should be addressed.
Minerals 2019, 9(4), 215; https://doi.org/10.3390/min9040215
Submission received: 15 January 2019 / Revised: 24 March 2019 / Accepted: 30 March 2019 / Published: 4 April 2019
(This article belongs to the Special Issue Physical Separation and Enrichment)

Abstract

:
Although compound dry separation technology has been applied to industrial applications for +6 mm size fraction of coal separation, the technology has not been widely applied in the separation of fine coal (−6 mm). In this study, the effect of the partition plate unit characteristics on both the average density of particles in the bed uniformly and the final separation results in a fine coal separation process were studied. According to the results, the standard deviations of the corresponding density distribution were 0.08, 0.14, and 0.07 when the height of the partition plate was 2.5 cm, the partition plate angle was 35°, and the distance from the apex of partition plate on the backplane, was 12 cm, respectively, which were the lowest values at the same level. These results showed that the average density of particles in the bed was uniformly, and its corresponding density distribution contour map was more regular. When the amplitude was 2.8 mm, the frequency was 29 Hz, the height of the partition plate was 2.5 cm, the partition plate angle was 35°, and the distance from the apex of the partition plate to the backplane was 12 cm; as a result, the E value was 0.115 g/cm3, the yield of the concentrate was 69.24%, the ash content was 12.52%, and the separation effect was better. The characteristics of the partition plate unit have an important effect on the separating process of −6 mm fine coal in the compound dry separator.

1. Introduction

Since coal is becoming the main source of energy in China, many people in China have focused on optimizing the use of the coal resource. It is reported that coal consumption accounts for approximately 60% of domestic energy consumption, and is expected to remain the main energy source in the future [1]. According to predictions [2], coal will remain the primary energy source until 2040 in China. However, effective utilization of coal is poor. The problems of environmental pollution, such as the generation of sulfur dioxide, acid rain, and soot, caused by the burning of coal that has not been beneficiated, are becoming increasingly serious. Therefore, developing more efficient processing technology for cleaning coal is very urgent [3]. It is also important to develop more efficient processing technology for cleaning coal to realize high efficiency, cleanliness, and comprehensive utilization of coal resources. With global climate change, the problems of global water shortages are becoming increasingly serious. According to statistics, the per capita share of water resources in China is only 1/17 of the world per capita share of water resources, with the per capita share of water resources in the northwest region being 1/2 of the national average. However, the distribution of coal resources is not matched with the distribution of water resources in China, with the coal reserves in the northwest of China accounting for 70% of the national coal deposits. At present, the main beneficiation methods for coal in China are wet and dry separation. Wet separation requires consumption of a large quantity of water resources, which is problematic given drought and water shortages in northwest China. Thus, it is very important to give careful consideration to the advantages of dry separation. Moreover, dry coal separation has more advantages compared to wet coal separation [4,5,6,7,8,9,10,11], for example, it does not consume water resources, does not increase the moisture content of separated products, and does not pollute groundwater and ecological environment. As a result, it can reduce damage to the environment. Moreover, dry separation technology has attracted the attention of the world because of its particular advantages, especially in arid and water-deficient regions.
Scholars and experts from all over the world have successively developed dry separation technologies (such as the wind jigging washing technology, the wind shaking bed technology, and the air heavy medium fluidized bed technology), some of which have been applied semi-industrially [12,13,14,15,16,17,18,19,20,21]. The compound dry separation technology is a successful separation technology currently applied in industry. Compared with the traditional wind separation process, the compound dry separation technology has the advantages of high separation efficiency, wide size fraction, large handling capacity, strong adaptability to external moisture of raw coal, and so on. The compound dry separation technology is mainly used for removing gangue from steaming coal, but its separation efficiency is not good for fine coal −6 mm. With the extensive application of modern machinery for coal mining, the proportion of −6 mm fine raw coal increases, even reaching as high as 70%. Thus, it is very important to study the compound dry separation technology. Various researchers [22,23,24,25,26,27,28,29,30] have studied the effects of parameters such as vibration frequency and amplitude, air velocity, and back angle on the separation performance of compound dry separators. These researchers have studied the influence of the structure of the compound dry separator on the separation effect, but not the characteristics of the partition plate.
This paper studied the effects of the characteristics of the partition plate unit on the separating process of −6 mm fine coal in the compound dry separator, and the separation efficiency of fine coal of −6 mm was improved. As a result, the compound dry separation could adapt to the high efficiency separation of raw coal with full particle size, and increase the productivity of −6 mm materials in the process of compound dry separation. The low ash content and the increase of −6 mm raw coal separation rate were of great significance to both the efficient separation of coal in arid and water-scarce areas of western of China as well as the effective separation of fine raw coal, which is also a supplement to the treatment of −6 mm fine raw coal.

2. Materials and Methods

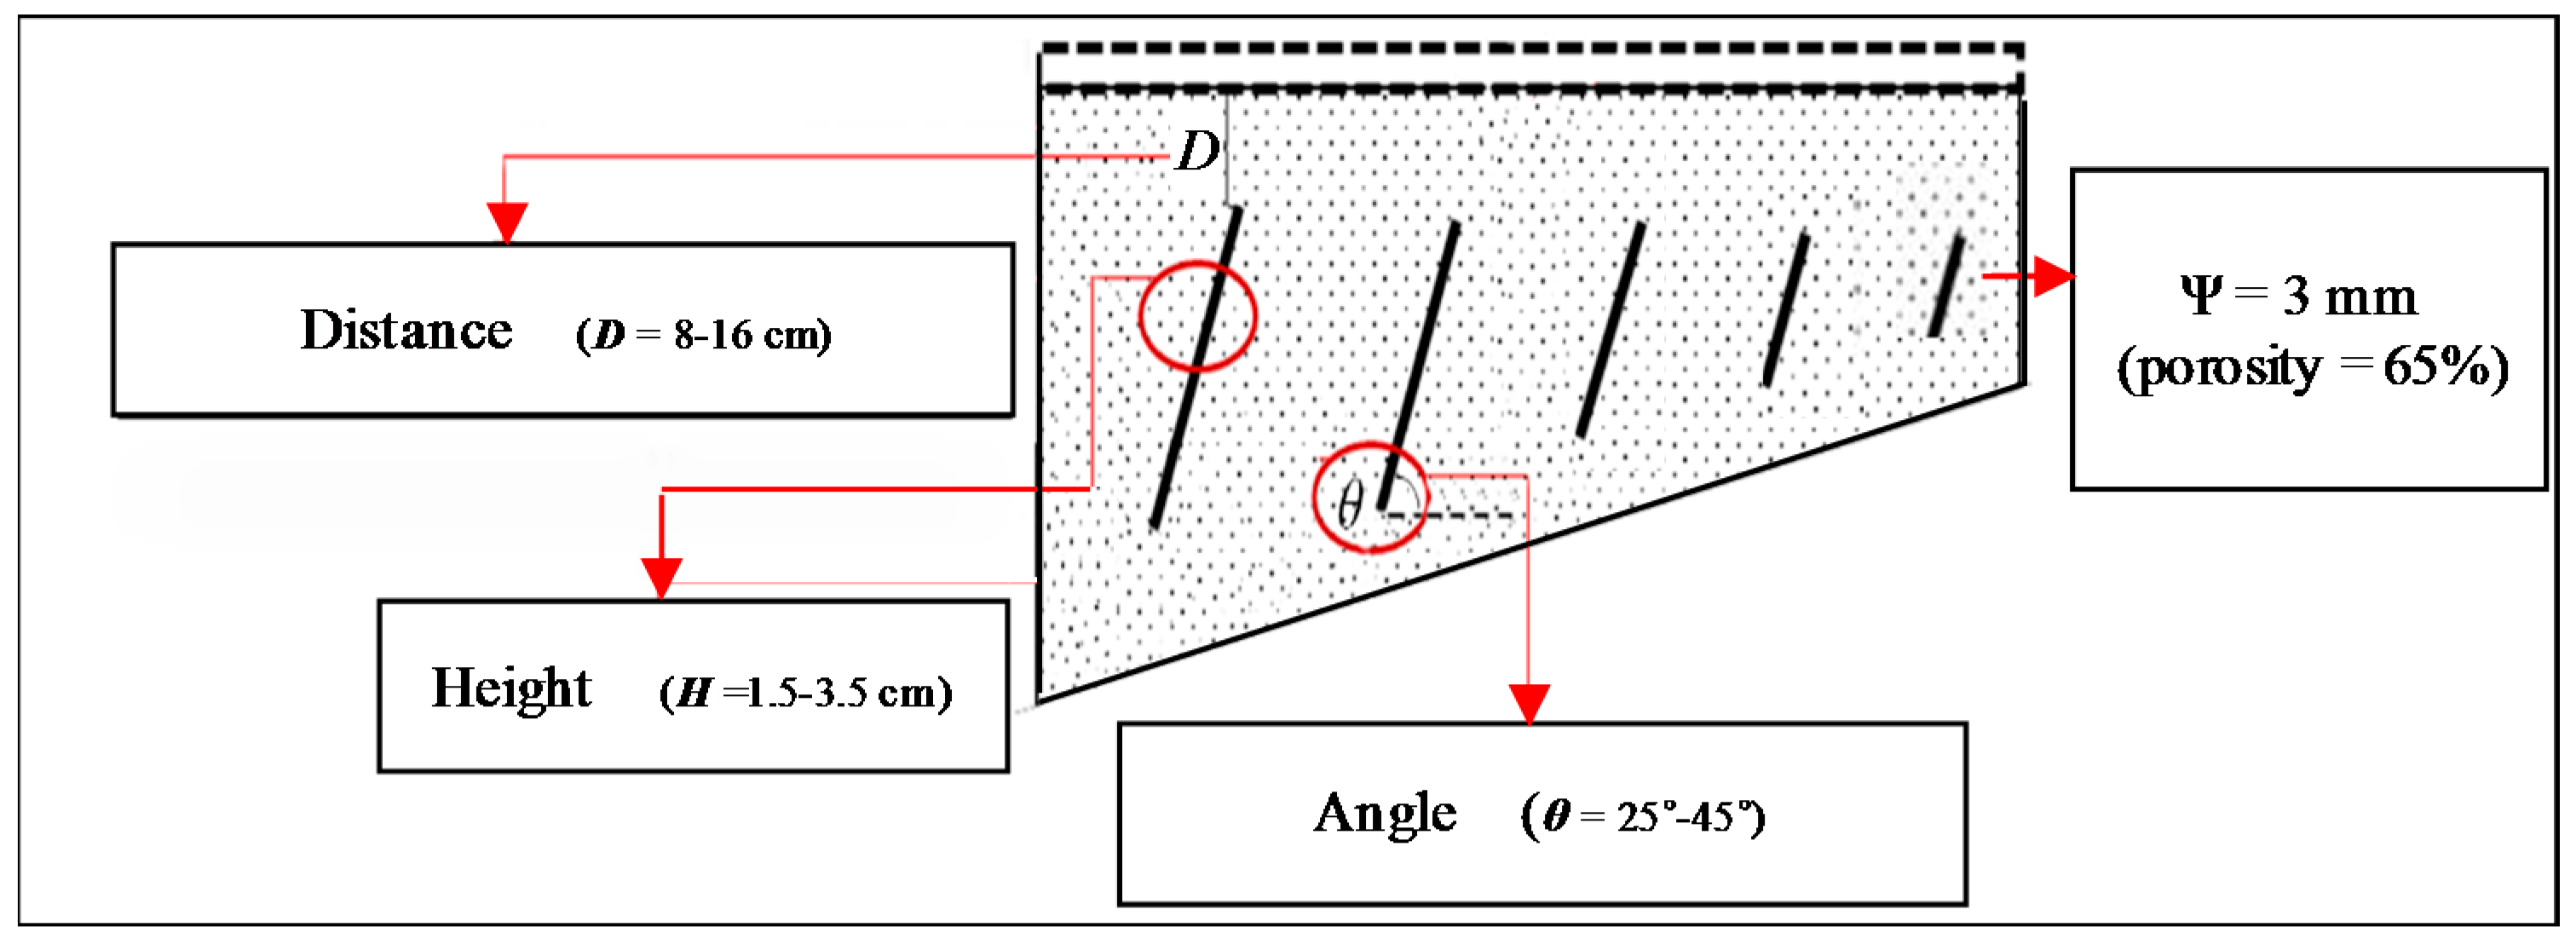
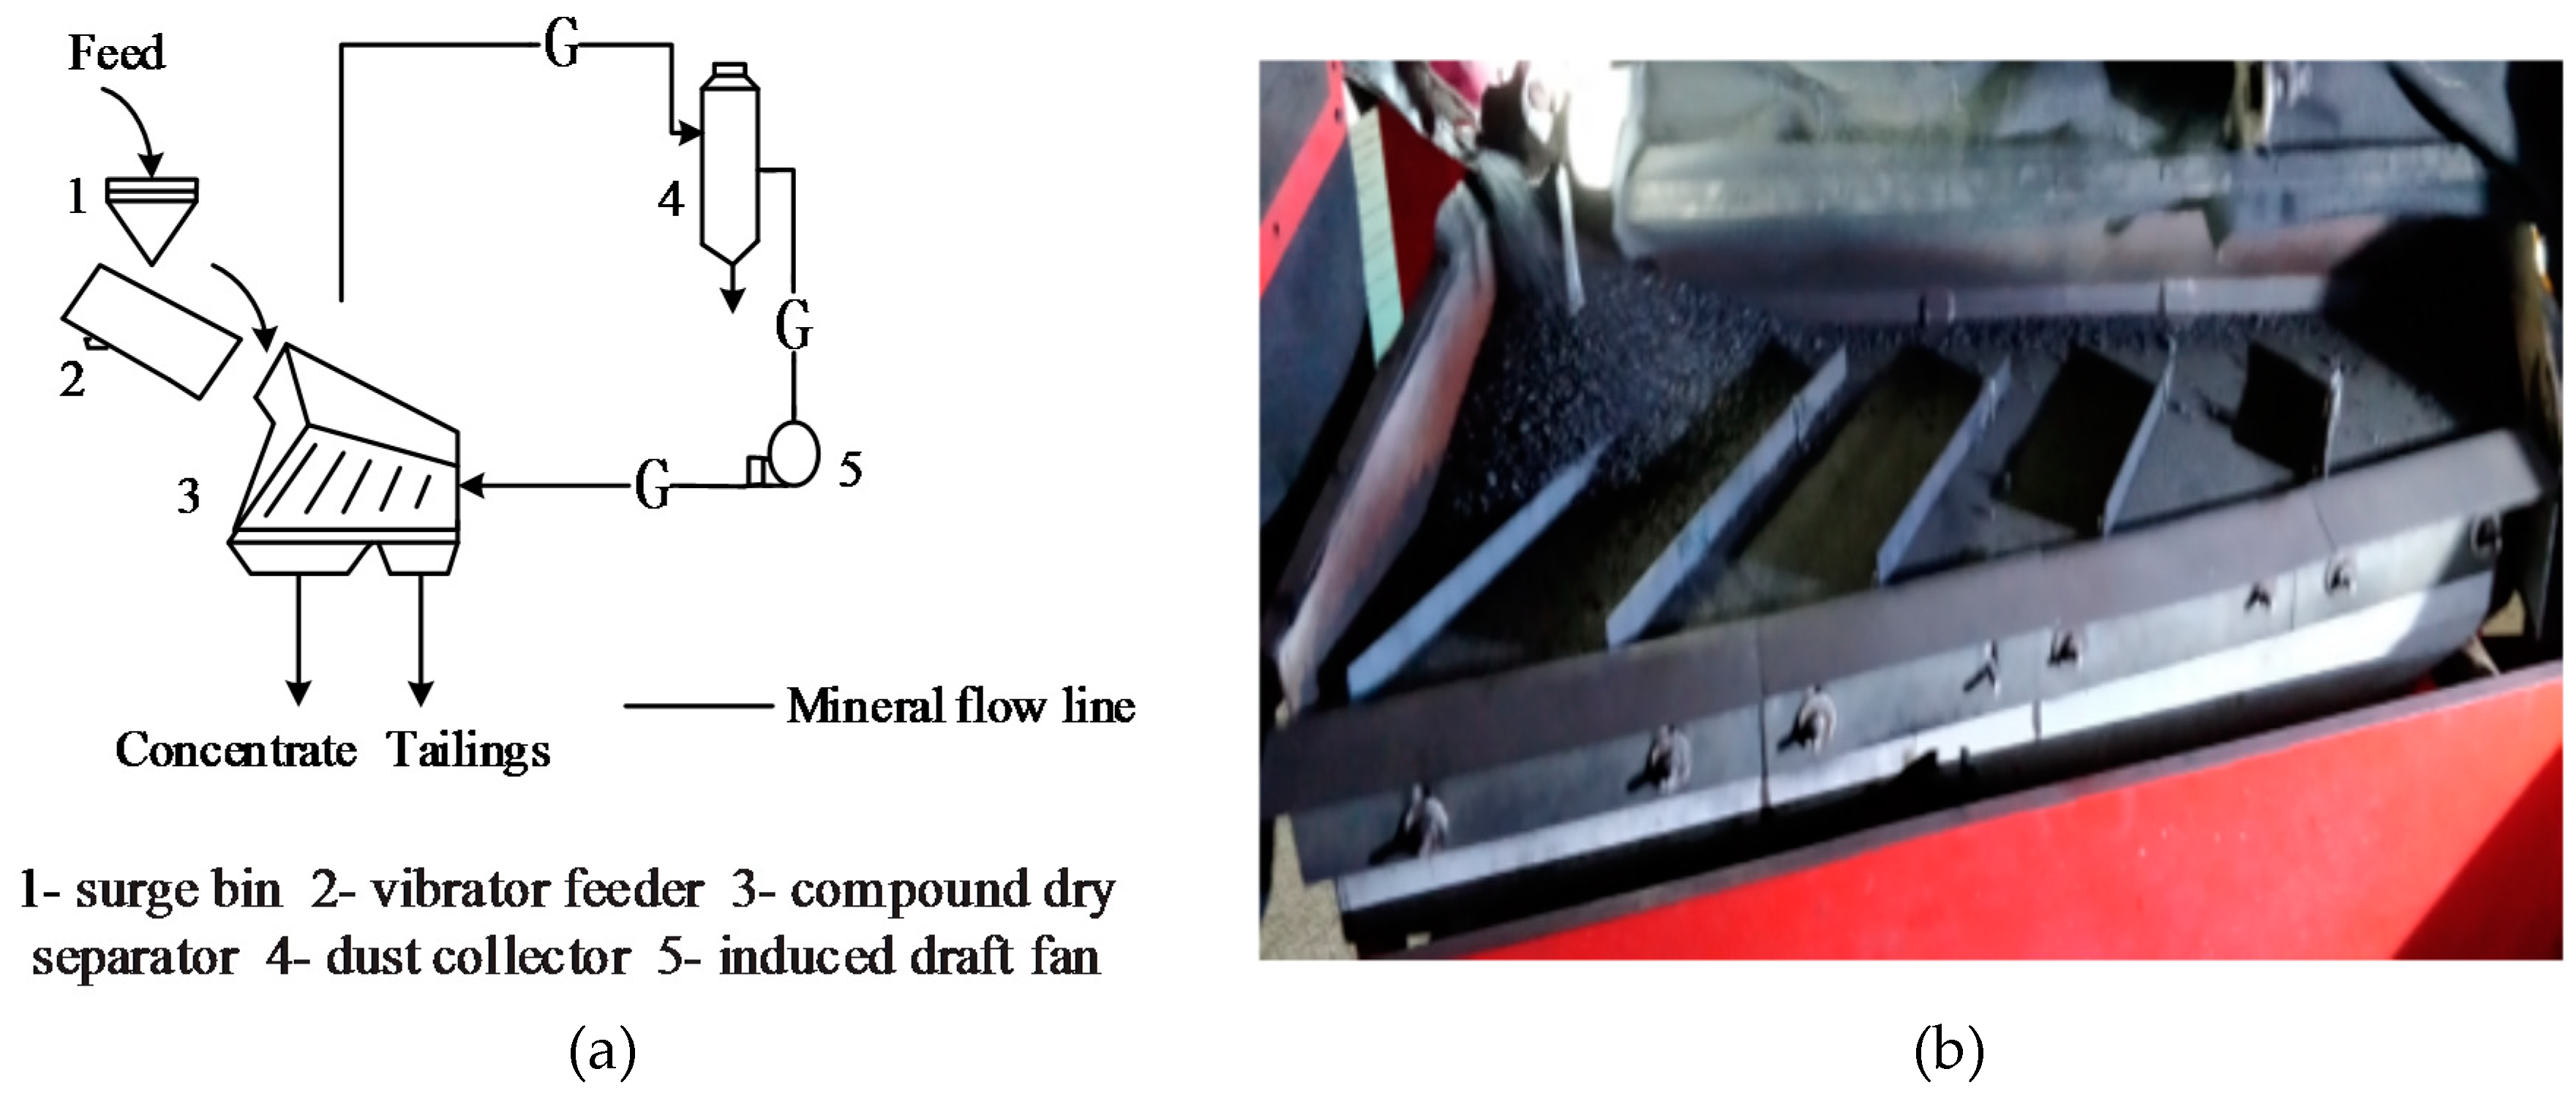
2.1. Experimental Equipment

As shown in Figure 1, the experimental system of compound dry separation of fine coal is mainly composed of the following parts: a raw coal preparation part, an air supply dust removal part, and a separation part. The raw coal feeding device is composed of a buffer bin and a vibrating feeder. The raw coal feeding device can distribute the raw materials into the separation bed evenly. A vibration motor, hanging device, and trapezoidal separation bed constitute the main separating parts. A blower, dust collector, and draught fan constitute the air dust collection system. The blower provides the air power for separation that is fed into the separation bed evenly through the bed surface air distribution hole.
The materials are fed into the separating bed with a certain longitudinal and transverse inclinations by a vibrating feeder, and vibration from the vibration source acts on the bed surface. There are several air chambers under the bed which can control the air flow. The air is fed into the air chamber by a centrifugal ventilator. Through the air holes on the bed surface, the air acts on the separating materials upward. Under the double actions of vibration force and air fluidization force, the materials become loose and stratified according to density. The light materials are on the top of the bed surface and the heavy materials are on the bottom of the surface. Due to the inclined angle in the horizontal direction of the bed, the low-density materials slide down from the surface of the bed, so that the materials in the top layer of the bed surface are continuously discharged through the side discharge baffle and enters the concentrate section. The high-density materials gather at the bottom of the bed, and moves towards the gangue section under the action of the partition plate on the bed surface, and finally enters the tailings chute [28].
In this study, the different parameters of the height of the partition plate (H), the partition plate angle (θ) and the distance from the apex of the partition plate to the backplane (D) were tested. The best test parameters were found. Figure 2 is the three experimental parameters for the dry coal separation. The porosity of the bed surface is 65% and the bore diameter of bed surface is 3 mm.
The separator parameters were listed in Table 1.

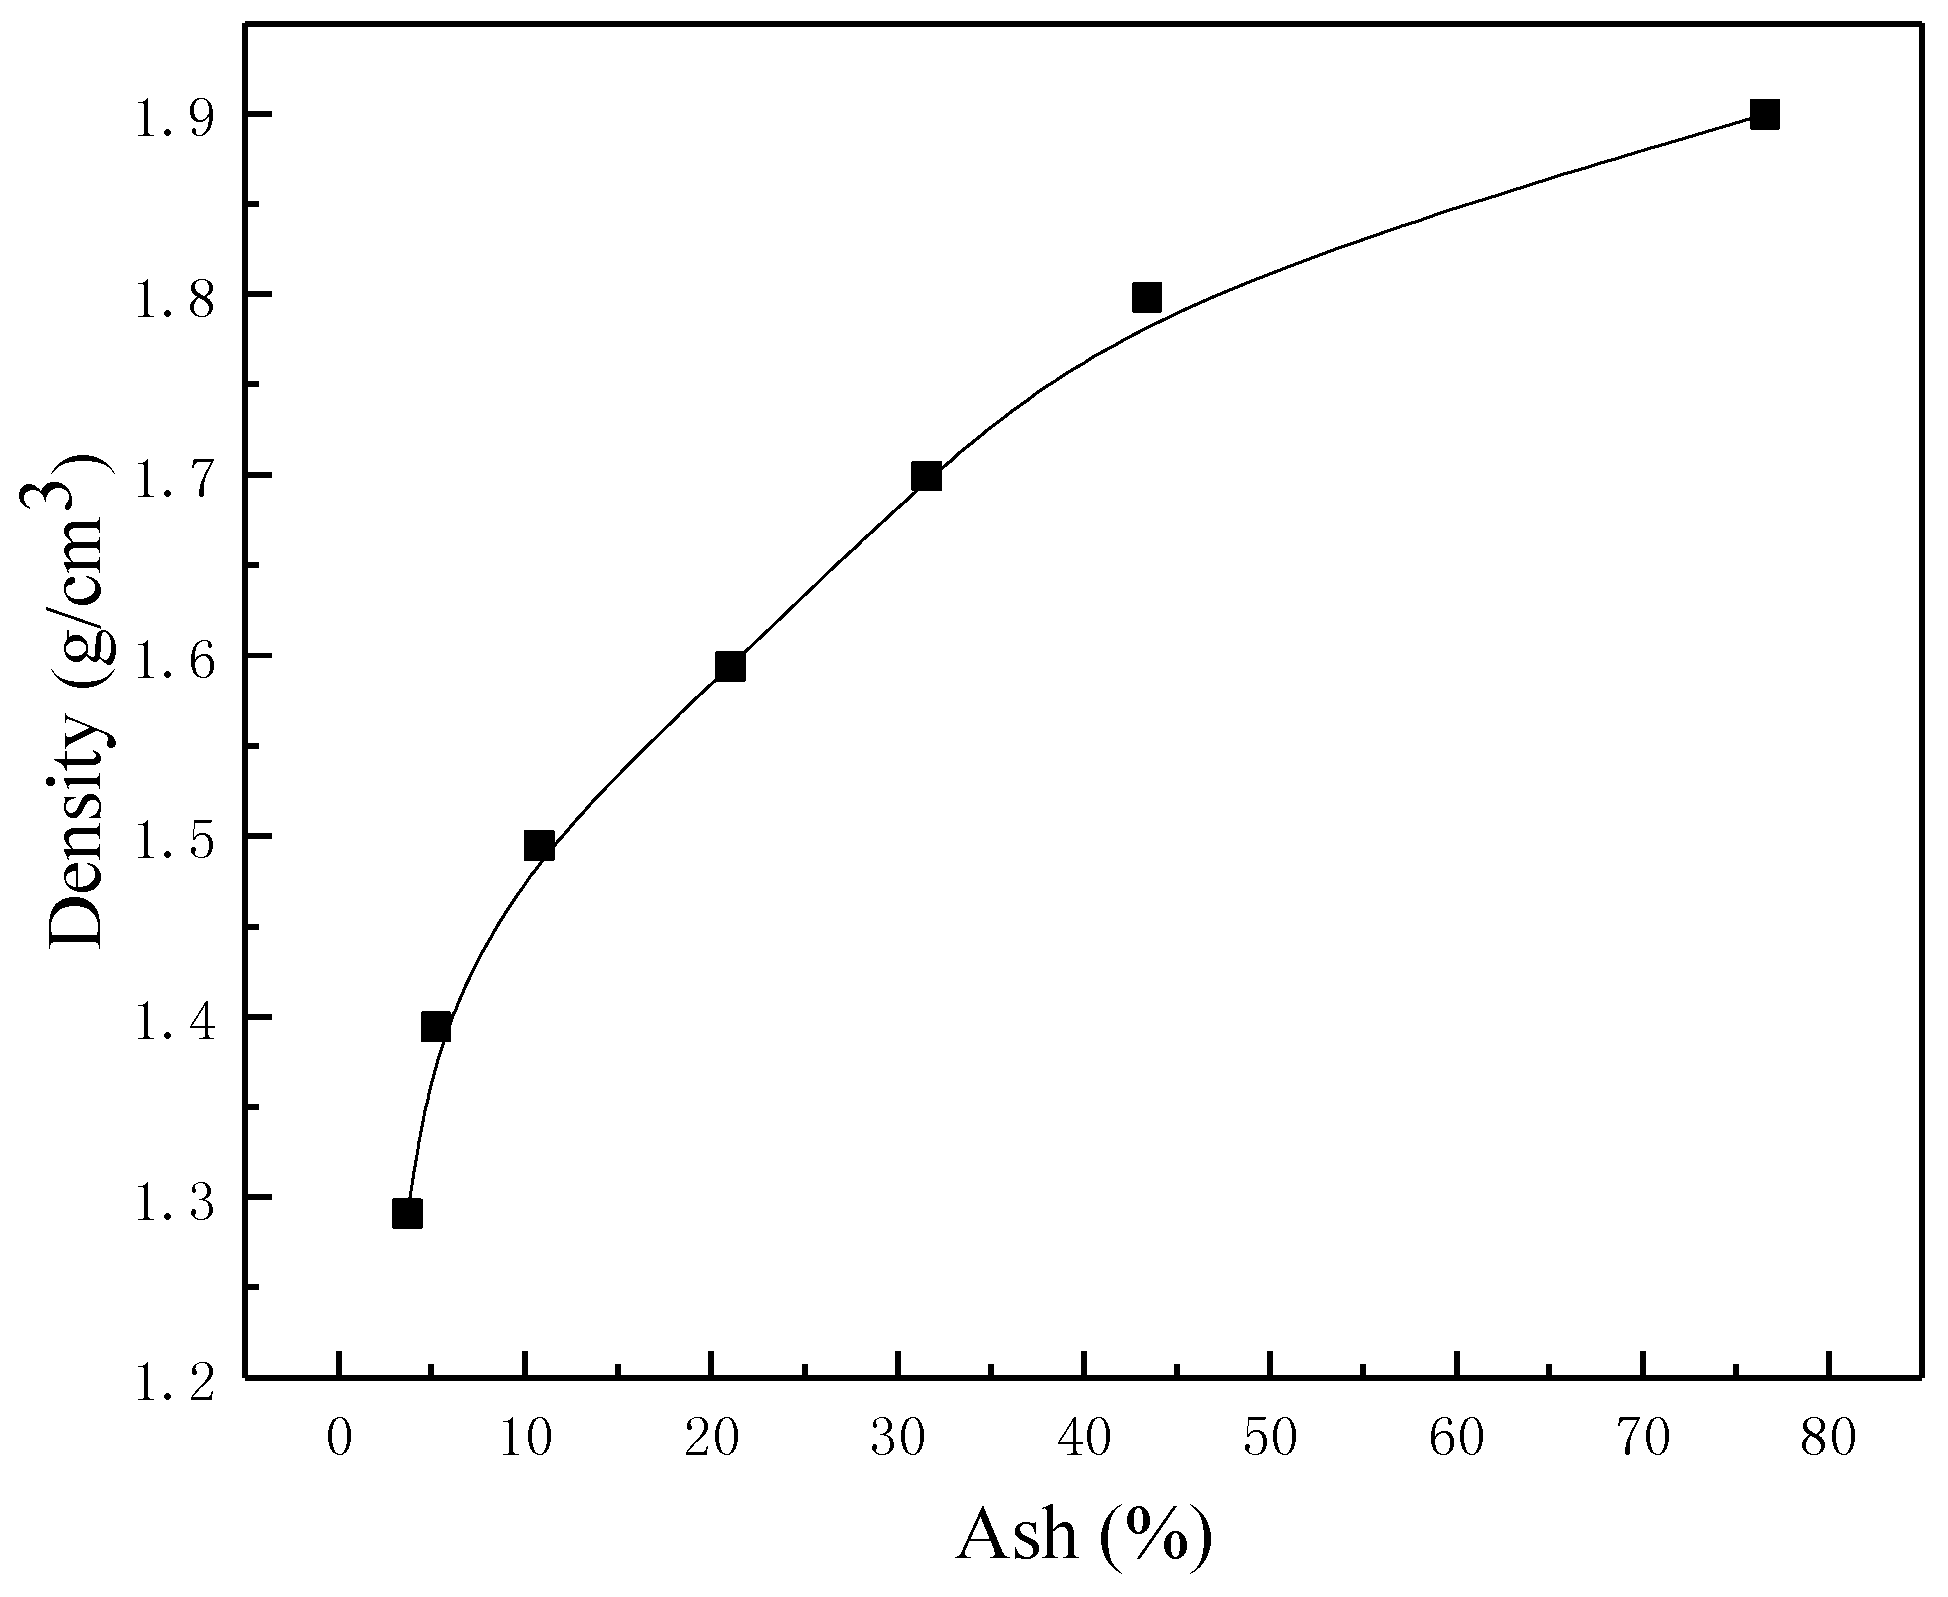
2.2. Material Properties

The experimental sample was come from Inner Mongolia, which was produced from Bula mine in Zhongmeishan of Ordos. The raw coal used in this study was is brittle and muddy. The density distribution of the −6 + 1 mm size fraction was measured by the sink-float method, with results shown in Table 2.
Table 2 showed that the head ash of the coal was 25.24%. The yield of coal with density −1.6 g/cm3 was nearly 68%, and the yield of density +1.8 g/cm3 was greater than 20%.

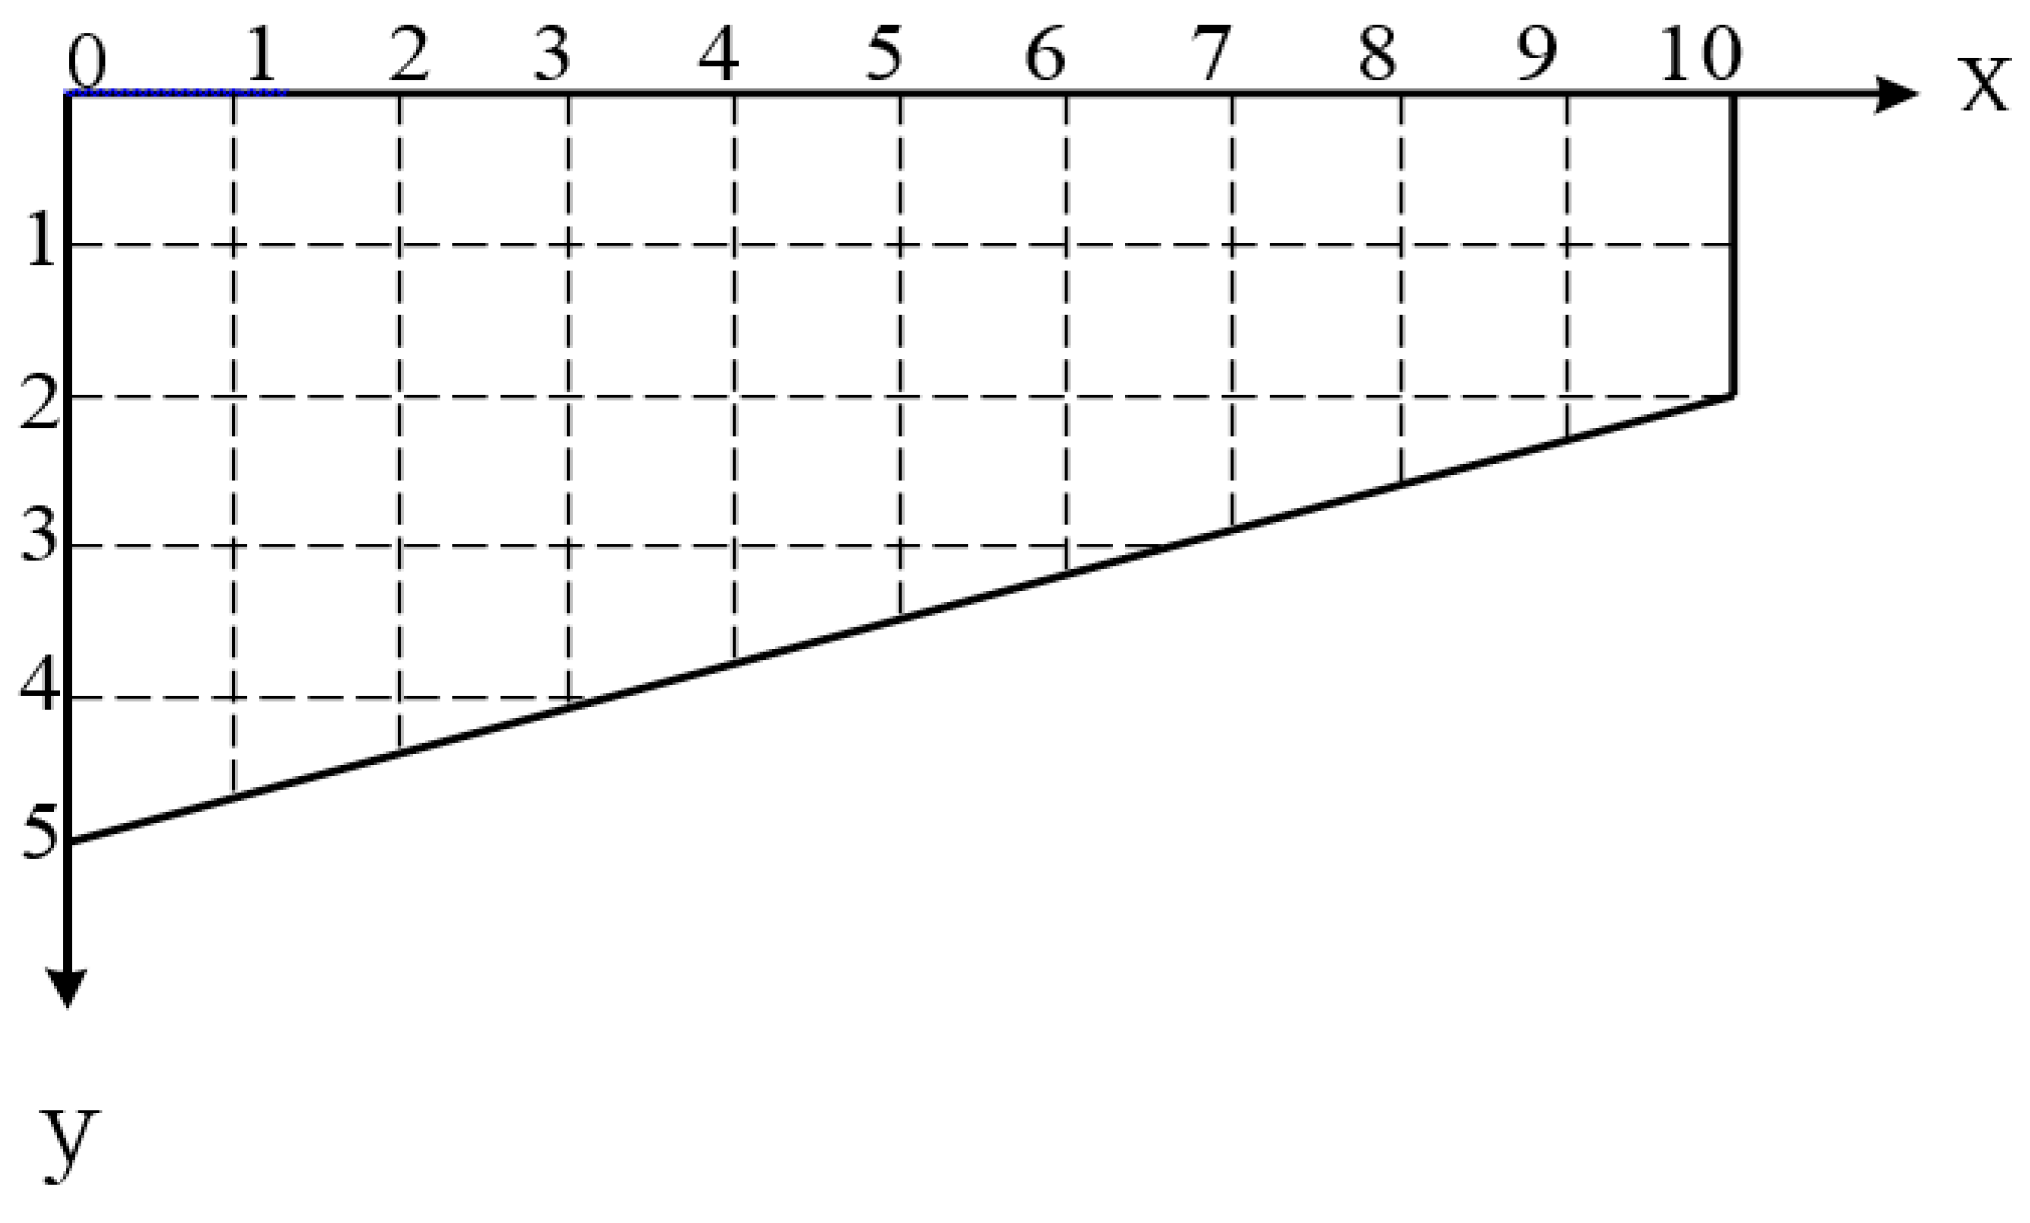
2.3. Experimental Method

After the materials were fed into the bed surface from the feeder of the separator, the materials were forced to move due to the vibration force and air fluidization force of the bed surface. When the separator operated stably, samples were taken in the divided area of the bed surface to measure the ash content of the samples. When the separating process was over, the yield and ash content of the collecting concentrate and gangue were calculated.
During the all of the experiments, different parameters would be used when the characteristics of the partition plate unit were analysed, but the amplitude and frequency of the separator were a fixed value when the parameter of the partition plate was changed. The amplitude was 2.8 mm and the frequency was 29 Hz. When the height of the partition plate was changed to a range of 1.5 cm to 3.5 cm, the angle and distance were fixed. The angle was 35° and the distance from the apex of partition plate on the backplane was 12 cm. When the partition plate angle of the partition plate was changed to a range of 25° to 45°, the height was 2.5 cm, the distance from the apex of partition plate on the backplane was 12 cm. When the distance from the apex of the partition plate on the backplane was changed to a range of 8 cm to 16 cm, the height of partition plate was 2.5 cm, the partition plate angle was 35°.

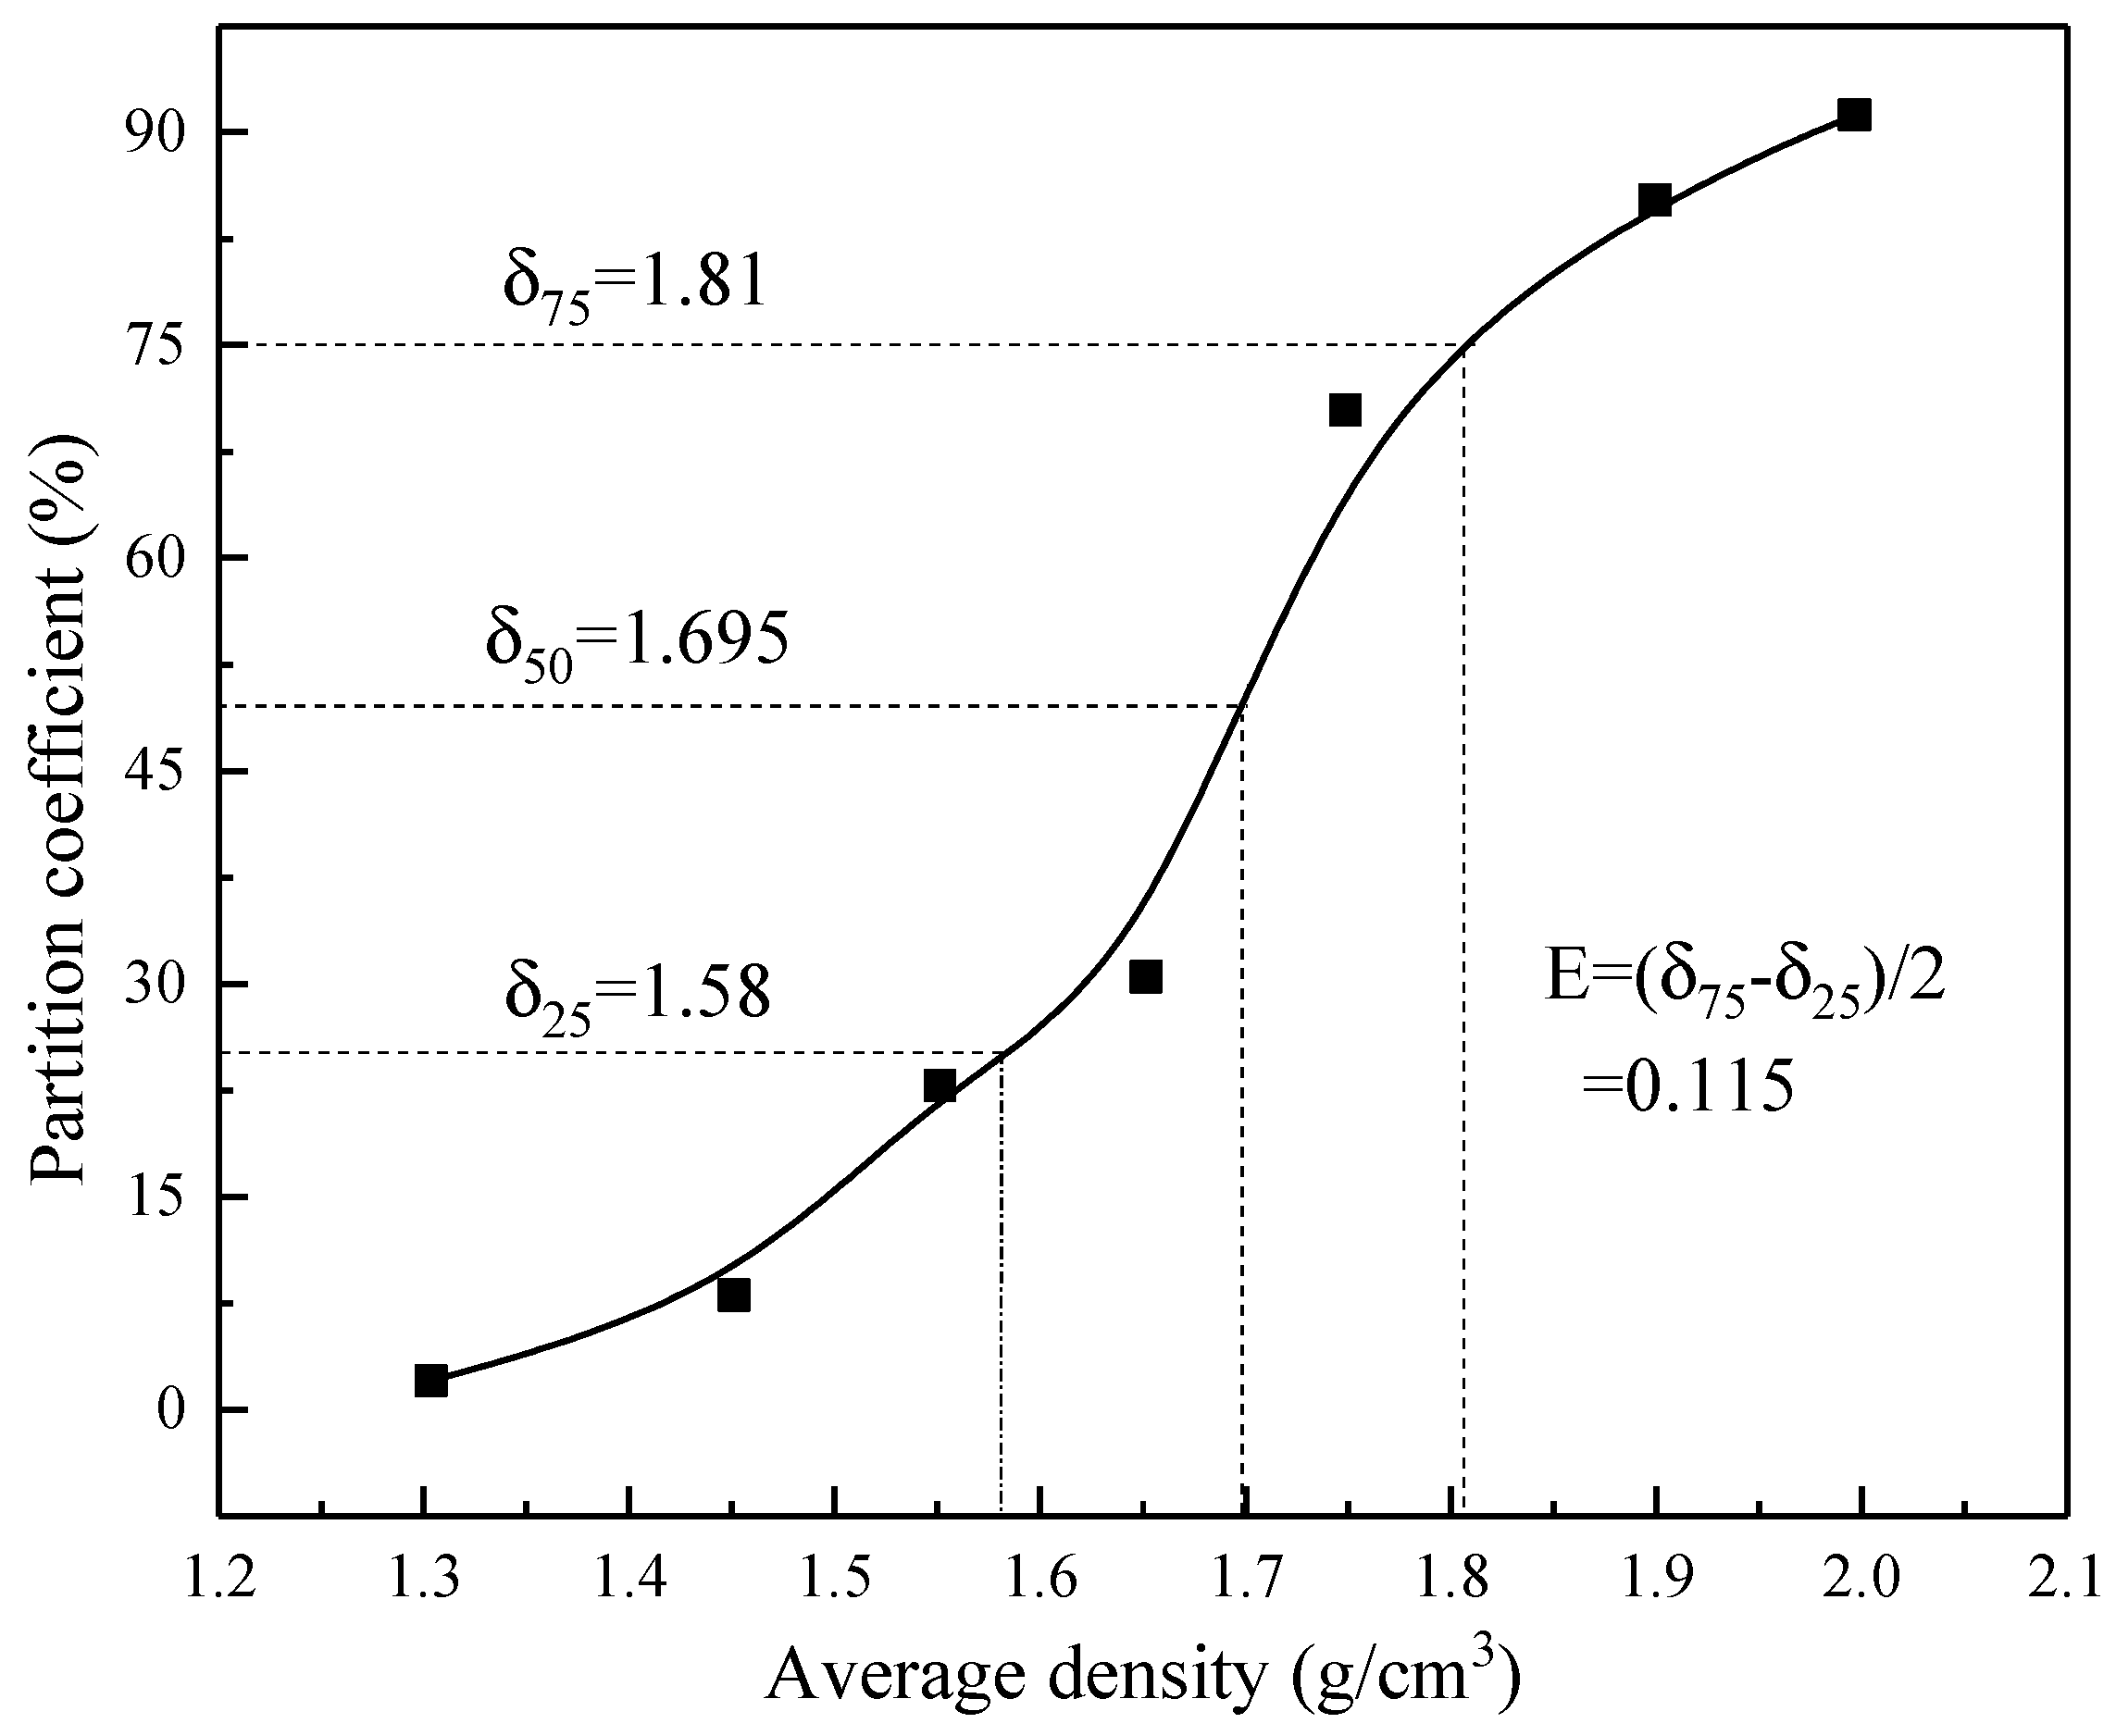
2.4. Evaluation Index

In the actual separation process, there is not a suitable method to measure the bed surface density of the compound separating machine directly at the present stage, mainly the coal density calibration has more standards, such as true density and apparent density. No matter which kind of measuring method, when the amount of data is large, the measurement is more complicated. Therefore, a linear correlation curve of ash content and density is established in this experiment. The density of specific area of bed surface is calculated by sampling and measuring ash, and the density distribution of bed surface is obtained by interpolation function in the MATLAB software. The calculation formula of ash content-density was shown in Formula 1, and the correlation coefficient R was 0.9801, indicating that ash content was closely related to density in this experiment, and the ash-density correlation curve was shown in Figure 3.
y = 1.906 × e [ ( ( x 68.23 ) / 109.9 ) 2 ] R = 0.9801
In order to understand the change of average density of particles in the bed during the process of compound dry separation of fine coal, the coordinate axis was established on the structure of trapezoidal bed surface, and the sampling was carried out in the separation process relying on the bed surface coordinates. The bed surface coordinates are shown in Figure 4. The x-axis is the direction from the feeding section to the gangue discharging section, and the y-axis is the direction from the feeding section to the discharging baffle. In the x-axis direction, the separation bed surface was divided into 10 sections, each segment spacing is 100 mm. In the y-axis direction, the separation bed surface was divided into 5 sections, each segment spacing is 100 mm. So, the bed surface was divided into many equal squares by x-axis and y-axis. In the direction of horizontal coordinate and longitudinal coordinate of bed surface, the areas which cross each other were sampling and measuring points. The sampling layout on the bed surface of the compound dry separator is shown in Table 3.
In each sampling process, after the equipment started to separate stably, the equipment was firstly turned off, and then the sampler was used to sample in the divided area on the bed surface, and all the samples in each area were taken away. Then the technology of division was acted on the sample, respectively. Finally, when the sample was suitable enough for ash content measurement, we tested the sample for ash content using a muffle furnace. we calculated the density through the ash content of the sample.
(1) Standard deviation of the average density of particles in the bed distribution (Sρ)
To characterize the uniformity of the average density of particles in the bed in a fixed area in the process of compound dry separation of fine coal, the density standard deviation (Sρ) is used to reflect the degree of deviation from the average density of the measured area. The smaller is conducive to the separation of materials by density. The expression describing the data is as follows:
S ρ = 1 n 1 i = 1 n ( ρ i ρ ¯ a ) 2
ρ ¯ a = 1 n i = 1 n ρ i
In the formula, Sρ is the standard deviation of the density distribution of the bed in units of g/cm3. ρi is the value of density measurement at test point i in units of g/cm3. ρ ¯ a is the average value of density measurement in units of g/cm3. n is the total number of measuring points.
(2) Comprehensive index K
The formula of the comprehensive evaluation index K is the yield of the concentrate divided by the ratio of ash reduction, which is the ration of concentrate ash to head ash. The expression of comprehensive index K is as follows:
K = γ j A j / A y
In the formula: γj is the yield of the concentrate in units of %. Aj is the ash content of concentrate in units of %. Ay is the ash content of raw coal in units of %.
Compared with other indices, the comprehensive index K not only covers the ash content and the yield of concentrate, but also takes the ash content of raw coal into account. The index can more comprehensively and accurately measure the effect of fine coal compound dry separation. Aj/Ay is the ratio of ash reduction, that is, the ratio of concentrate to raw coal ash content, which represents the effect of ash content reduction of the concentrate after separation. A higher K value denotes a better separation effect, that is, the lower ash content and the higher yield of concentrate.

3. Results and Discussion

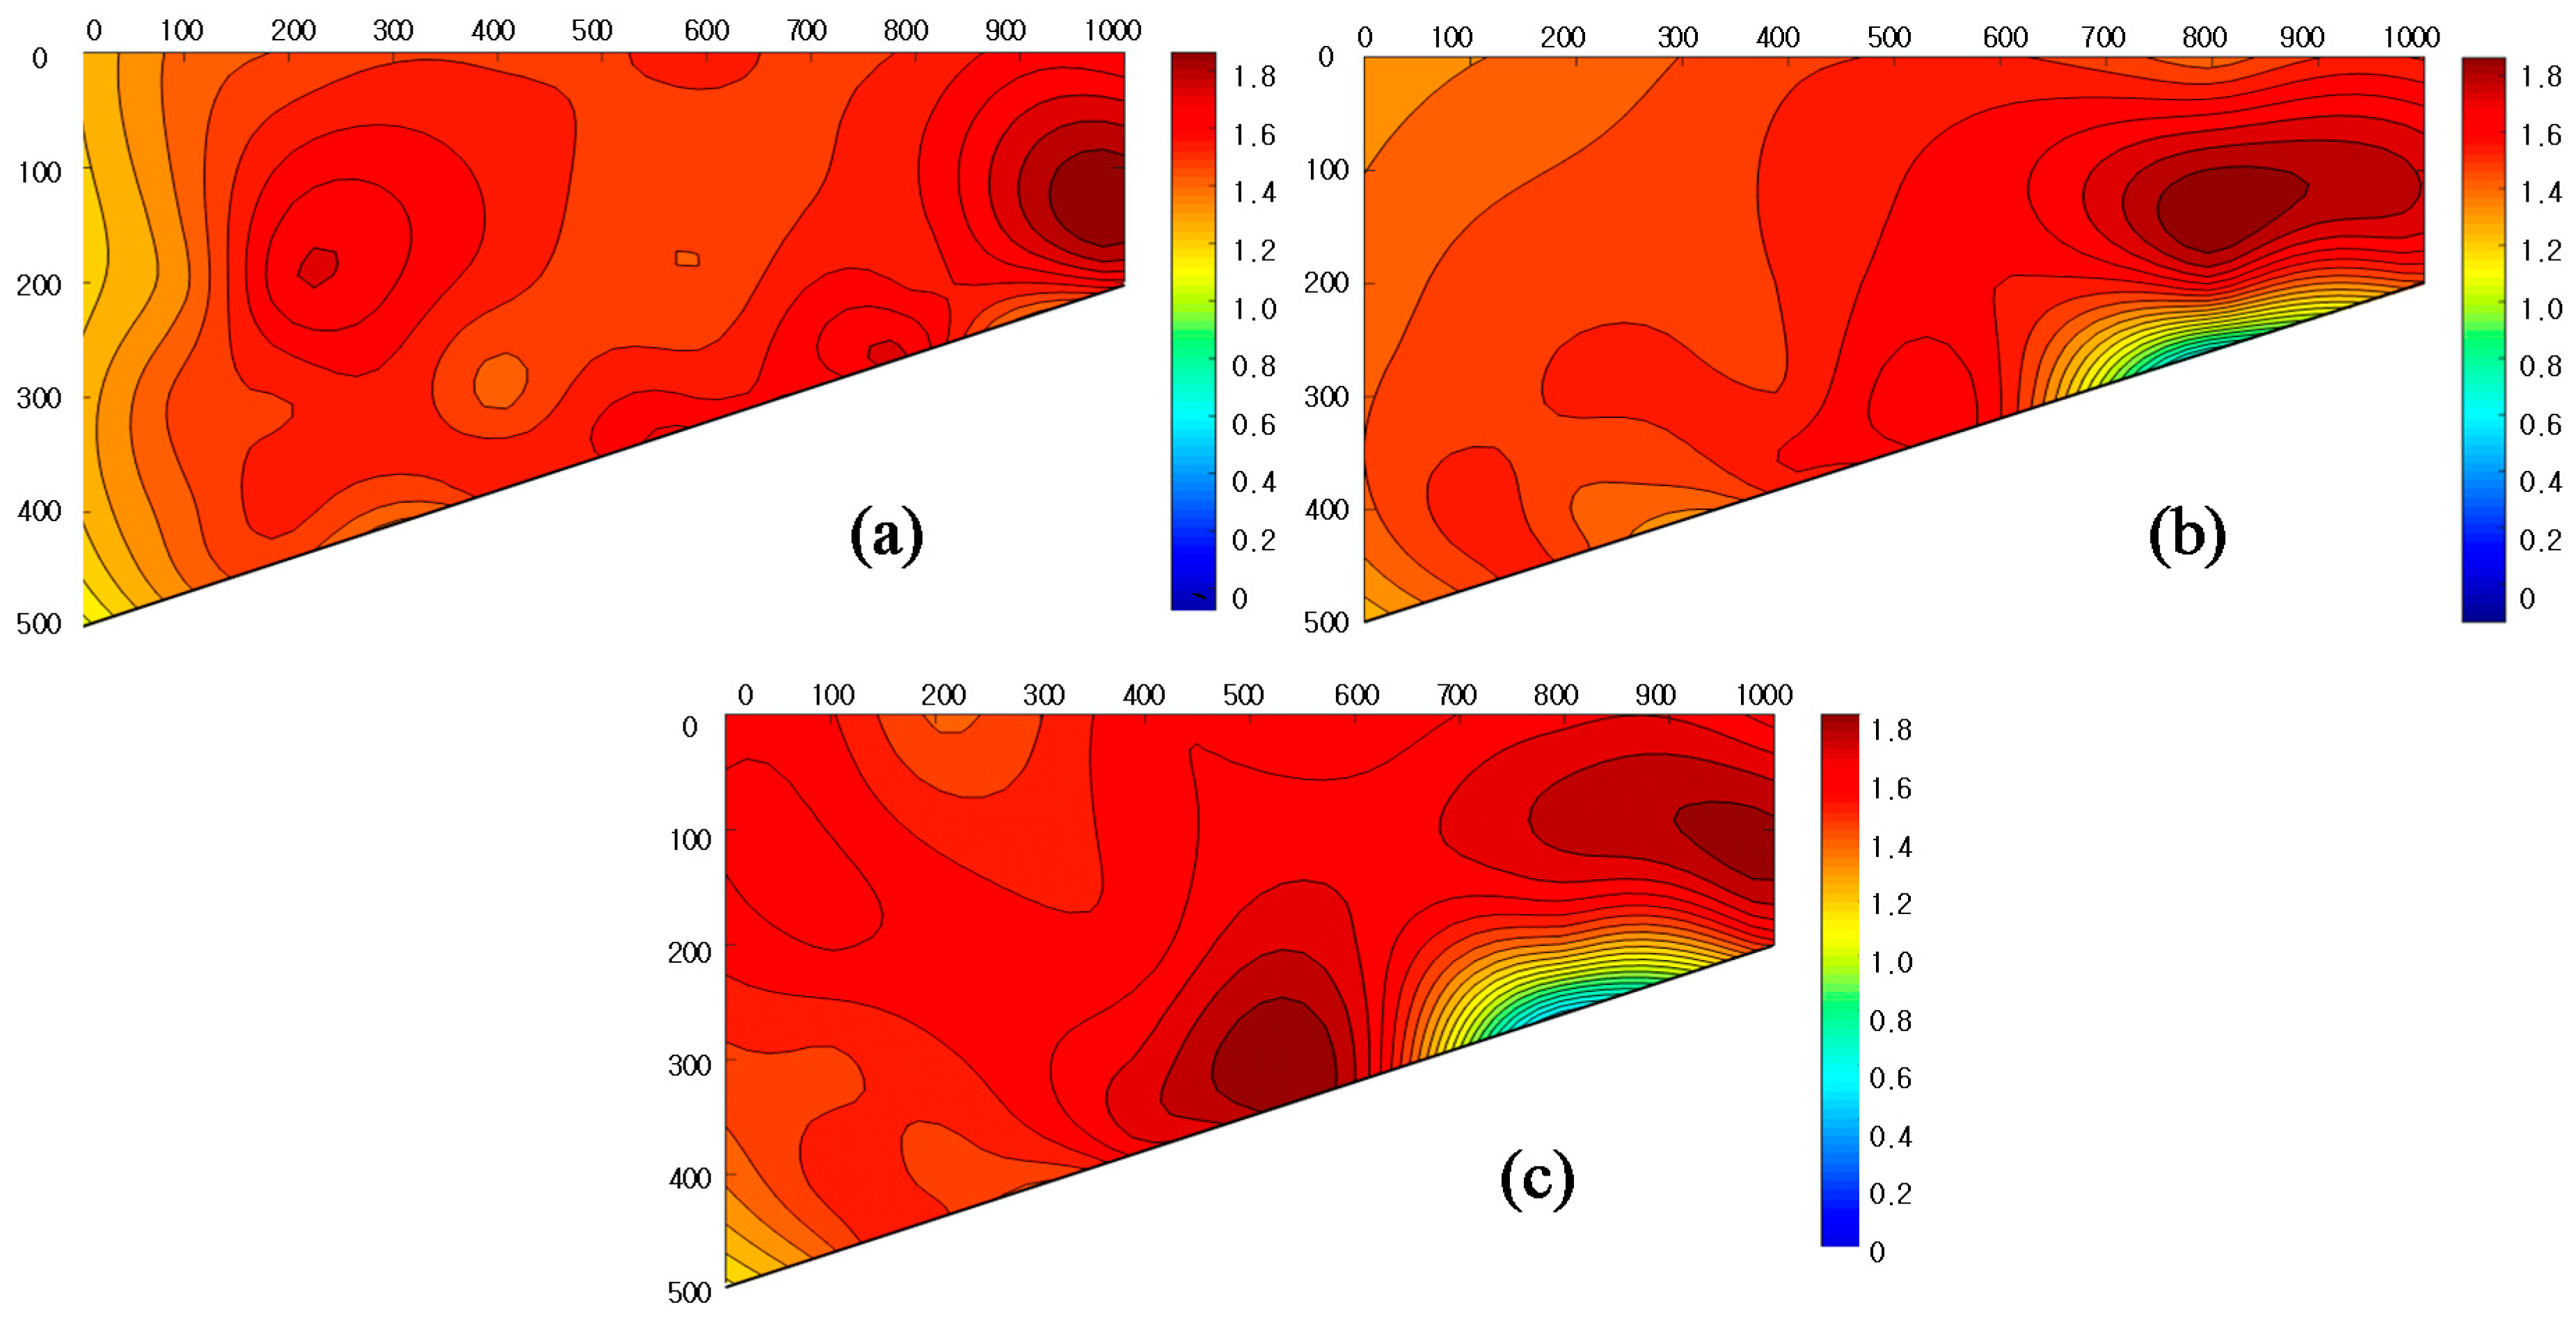
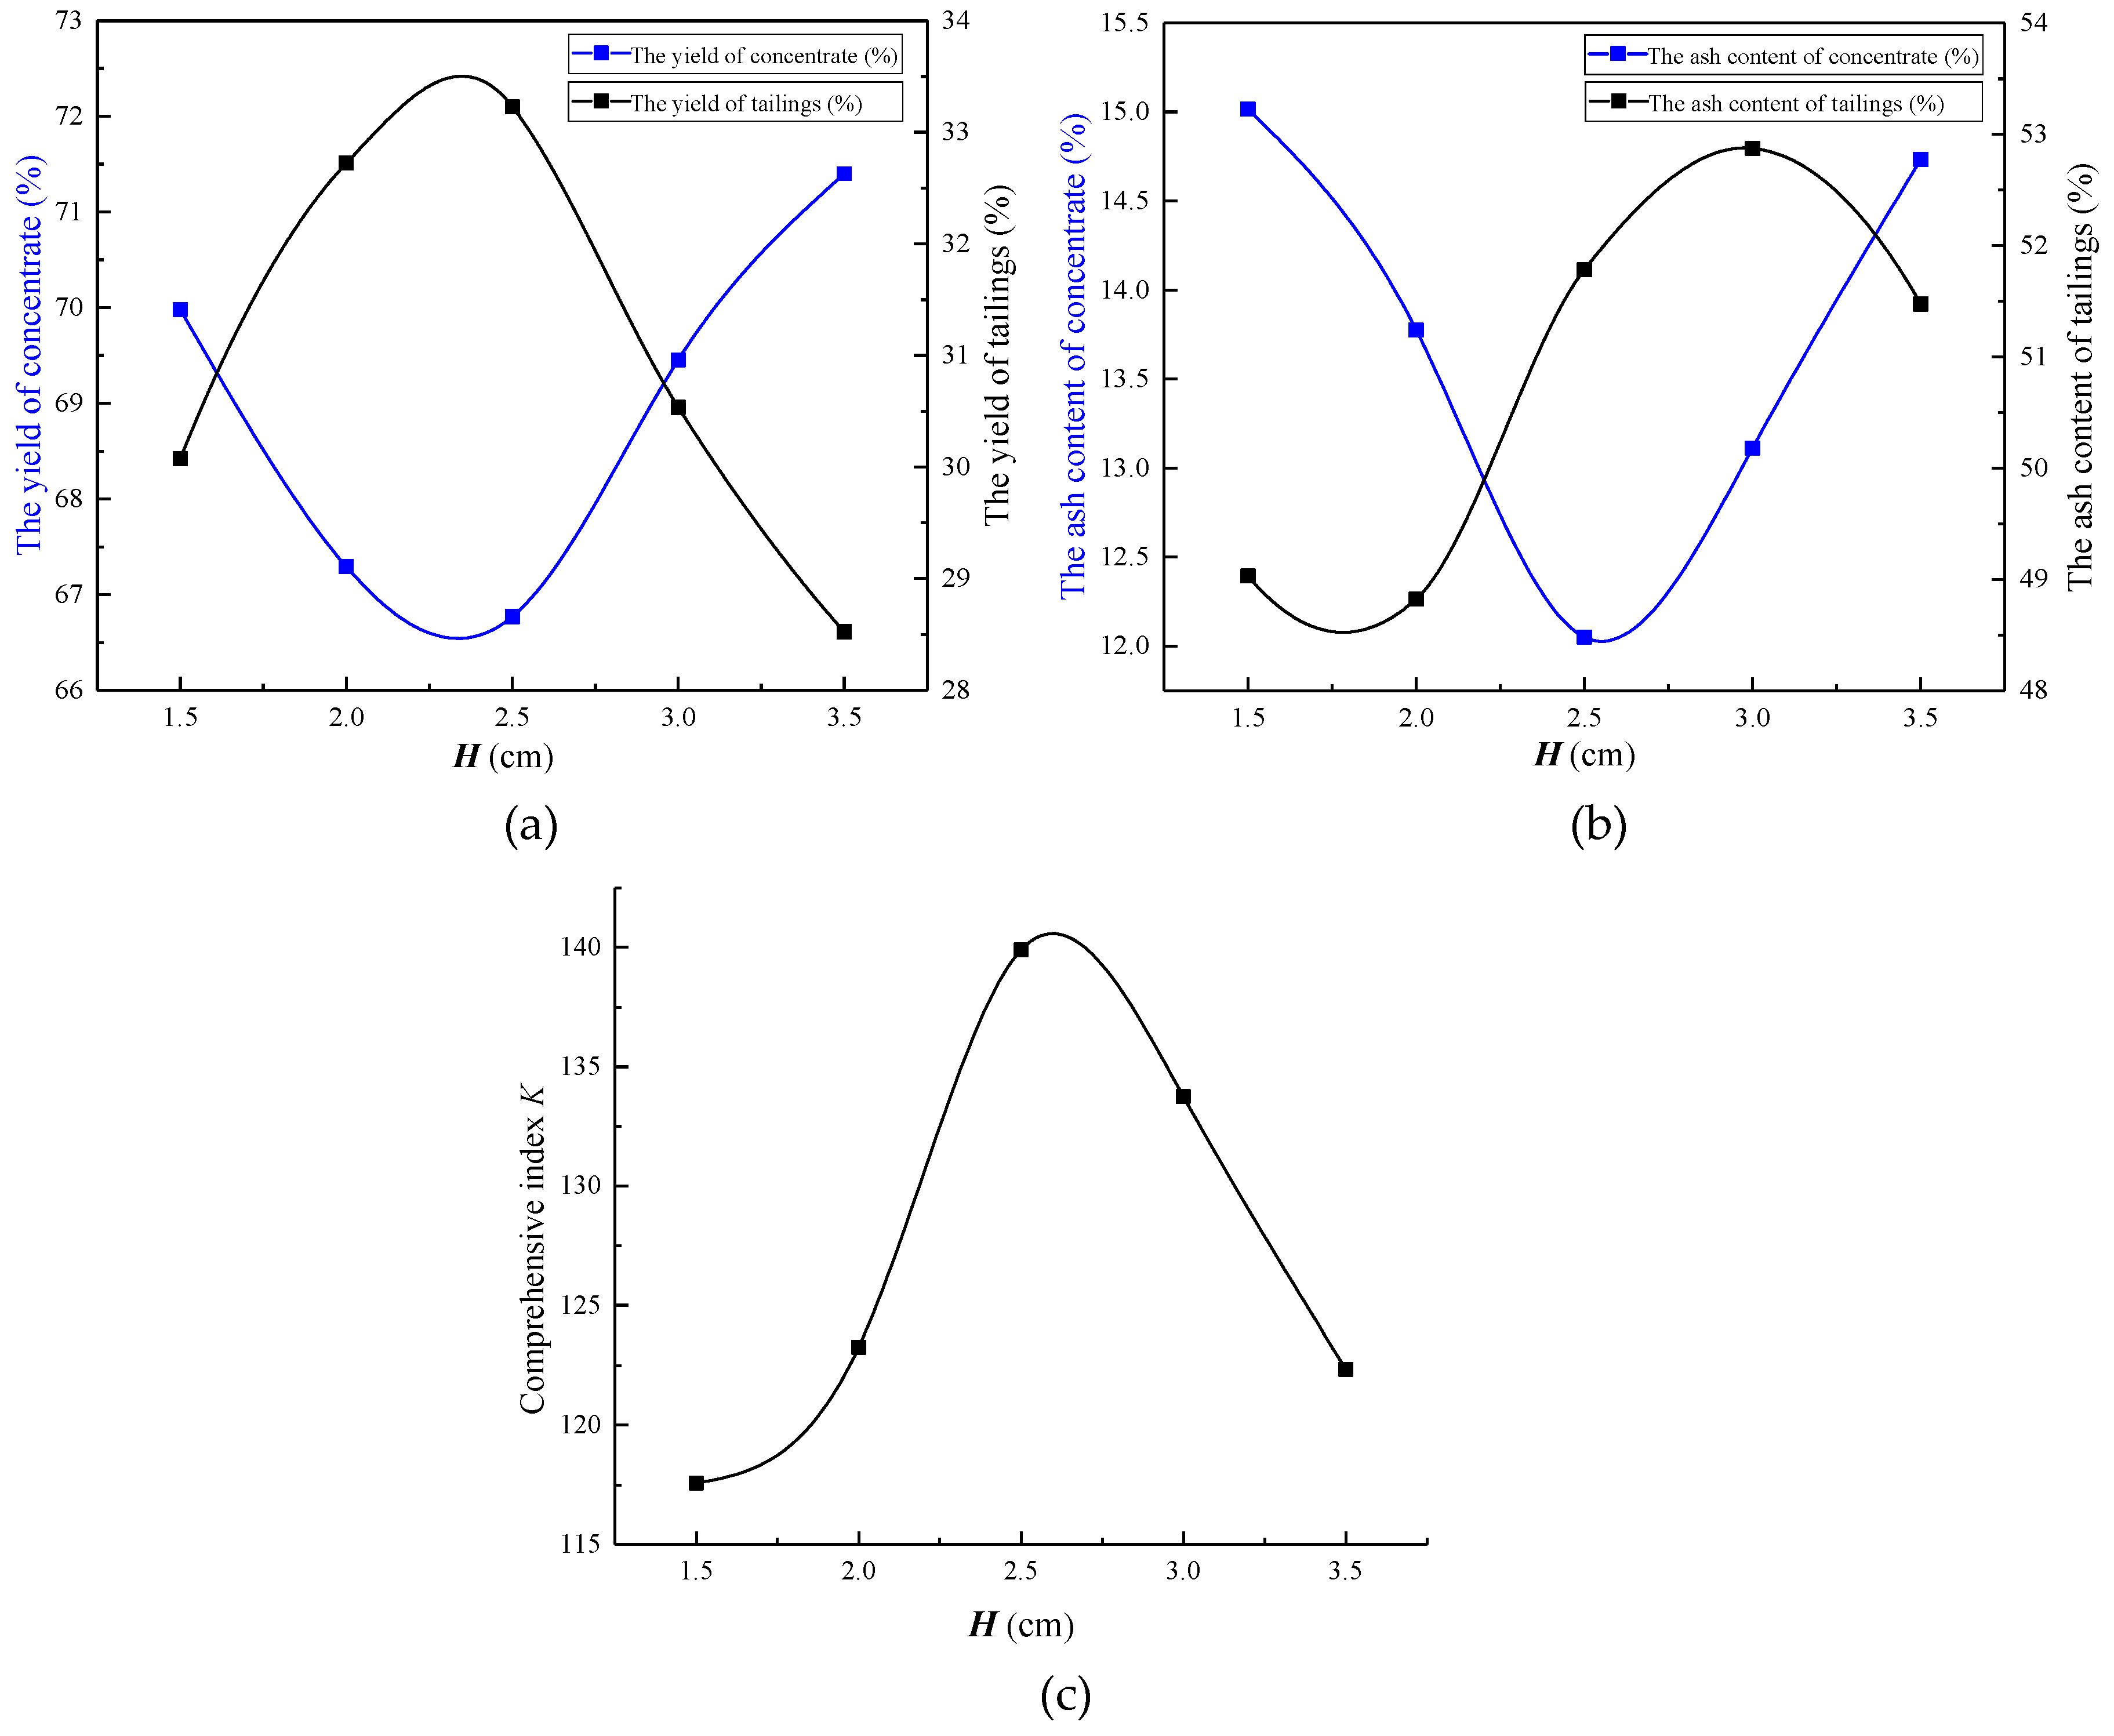
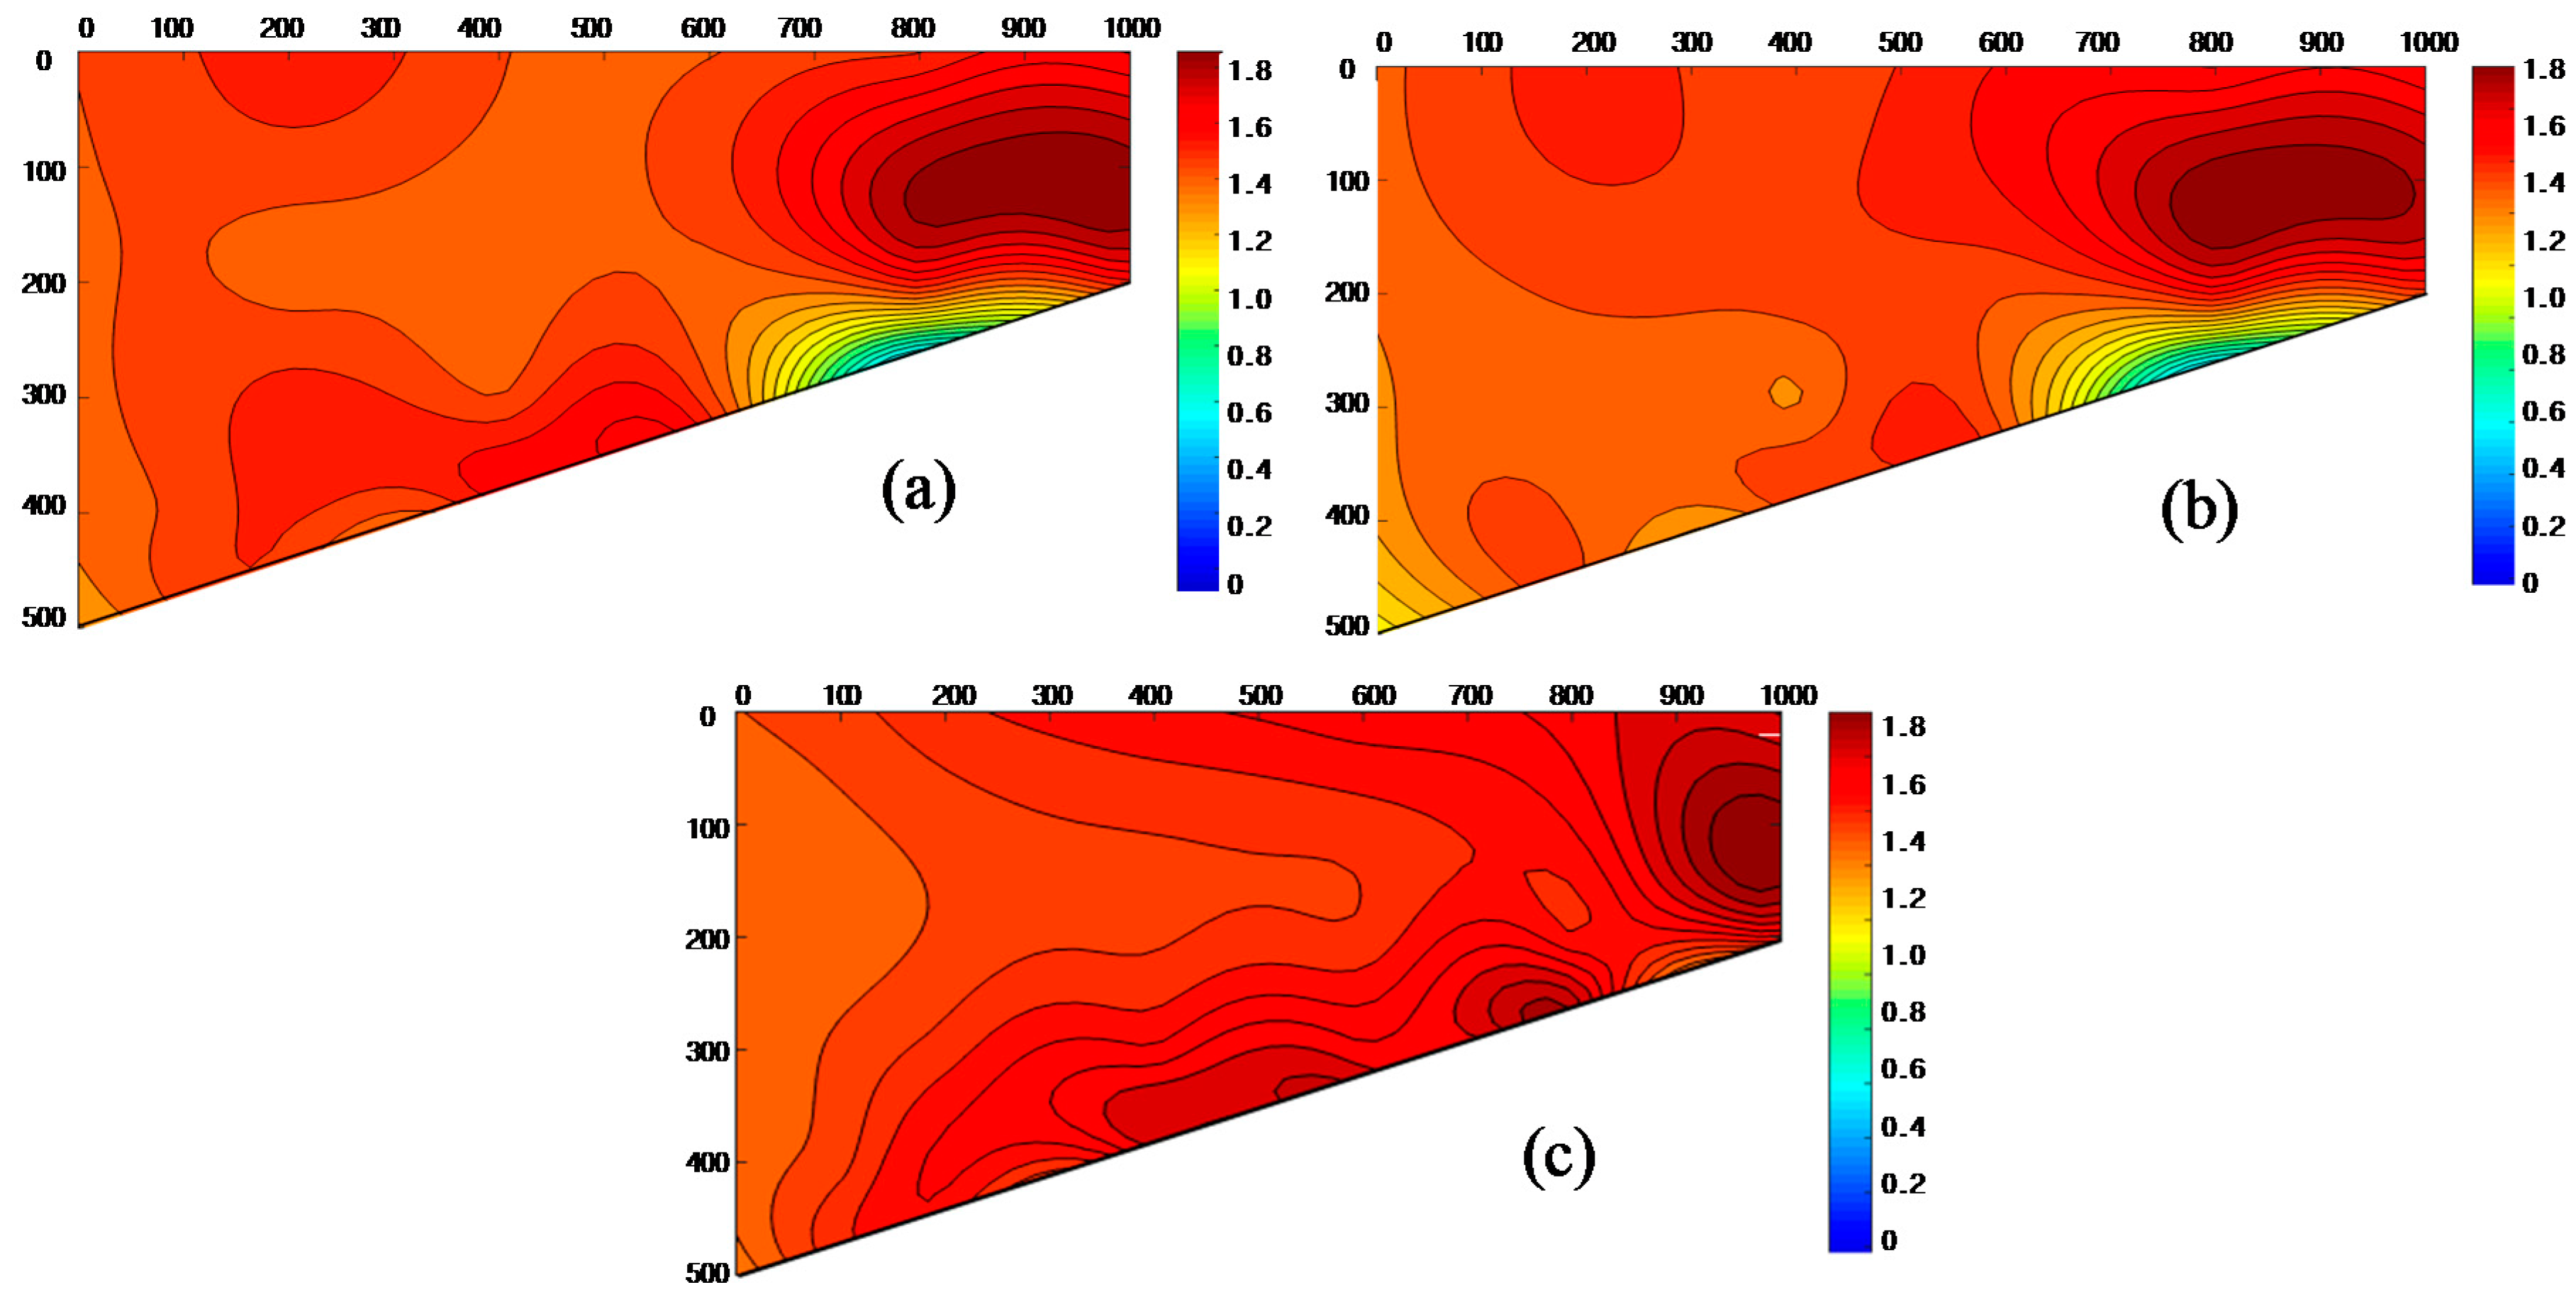
3.1. Effect of the Height of the Partition Plate (H) on the Separation Process

Figure 5 showed the effect of the height of the partition plate (H) on the uniformity of the average density of particles in the bed and the separation efficiency. When the value of H was 2.5 cm, the density distribution of the bed materials was more uniform than that of the other two separation conditions. The isoline of density distribution was regular, and many low-density particles were accumulated in the concentrate section. Moreover, the high-density particles were distributed in the gangue section of the bed body. The value of Sρ was 0.08, which was the lowest value under the same factors. This result indicated that the density stability of the bed surface for these parameters was uniform. When the value of H was 1.5 cm, the average density of particles in the bed distribution was less uniform, especially in the concentrate section and the middle coal section. One possible explanation for this result was that the value of H was too small, resulting in the bed materials accumulation thickness being too thin to form a more uniform density layer. Moreover, the thin bed made the materials between the bottom bed surface and the surface layer closing to the discharge section subject to the same force, which caused the surface low-density particles mixing with the bottom particles to move toward the gangue section, while the bottom materials moved toward the discharging section via the reverse thrust of the backplane. The value of Sρ was 0.51, and the uniformity of average density of particles in the bed was poor. Figure 5 showed that, when the value of H was 3.5 cm, the density distribution of the bed was again less uniform, and some of the high-density particles were distributed in the middle coal section, the corresponding Sρ was 0.35. The uniformity of the average density of particles in the bed was poor. Table 4 is Sρ for different values of H.
Figure 6 showed that the effect of fine coal compound dry separation was directly related to H. When the value of H was 1.5 cm, the partition plate was so short that the materials in the bed were thin. Thus, it was difficult to form a stable density separating layer, causing the particles that have entered the bed to be discharged under the action of vibration force before stratification. As a result, the high-density materials were discharged with the concentrate section, and the yield of the concentrate was reduced. In the process of increasing H from 1.5 cm to 2.5 cm, the comprehensive index K increased gradually, and the separation effect became better, which showed the following: (1) the ash content of concentrate decreased sharply; and (2) the yield of the concentrate decreased little. When the value of H was 2.5 cm, although the yield of concentrate decreased slightly, the ash content and comprehensive index K of the concentrate reached the maximum value, and the separation effect was the best. When the H increased from 2.5 cm to 3.5 cm, the index K showed a downward tread. The yield of concentrate increased, and the ash content also increased linearly. The separation materials accumulating on the bed surface increased when the value of H was too high. The value of H not only affected the final separation effect but also affected the production efficiency of the separator to some extent.

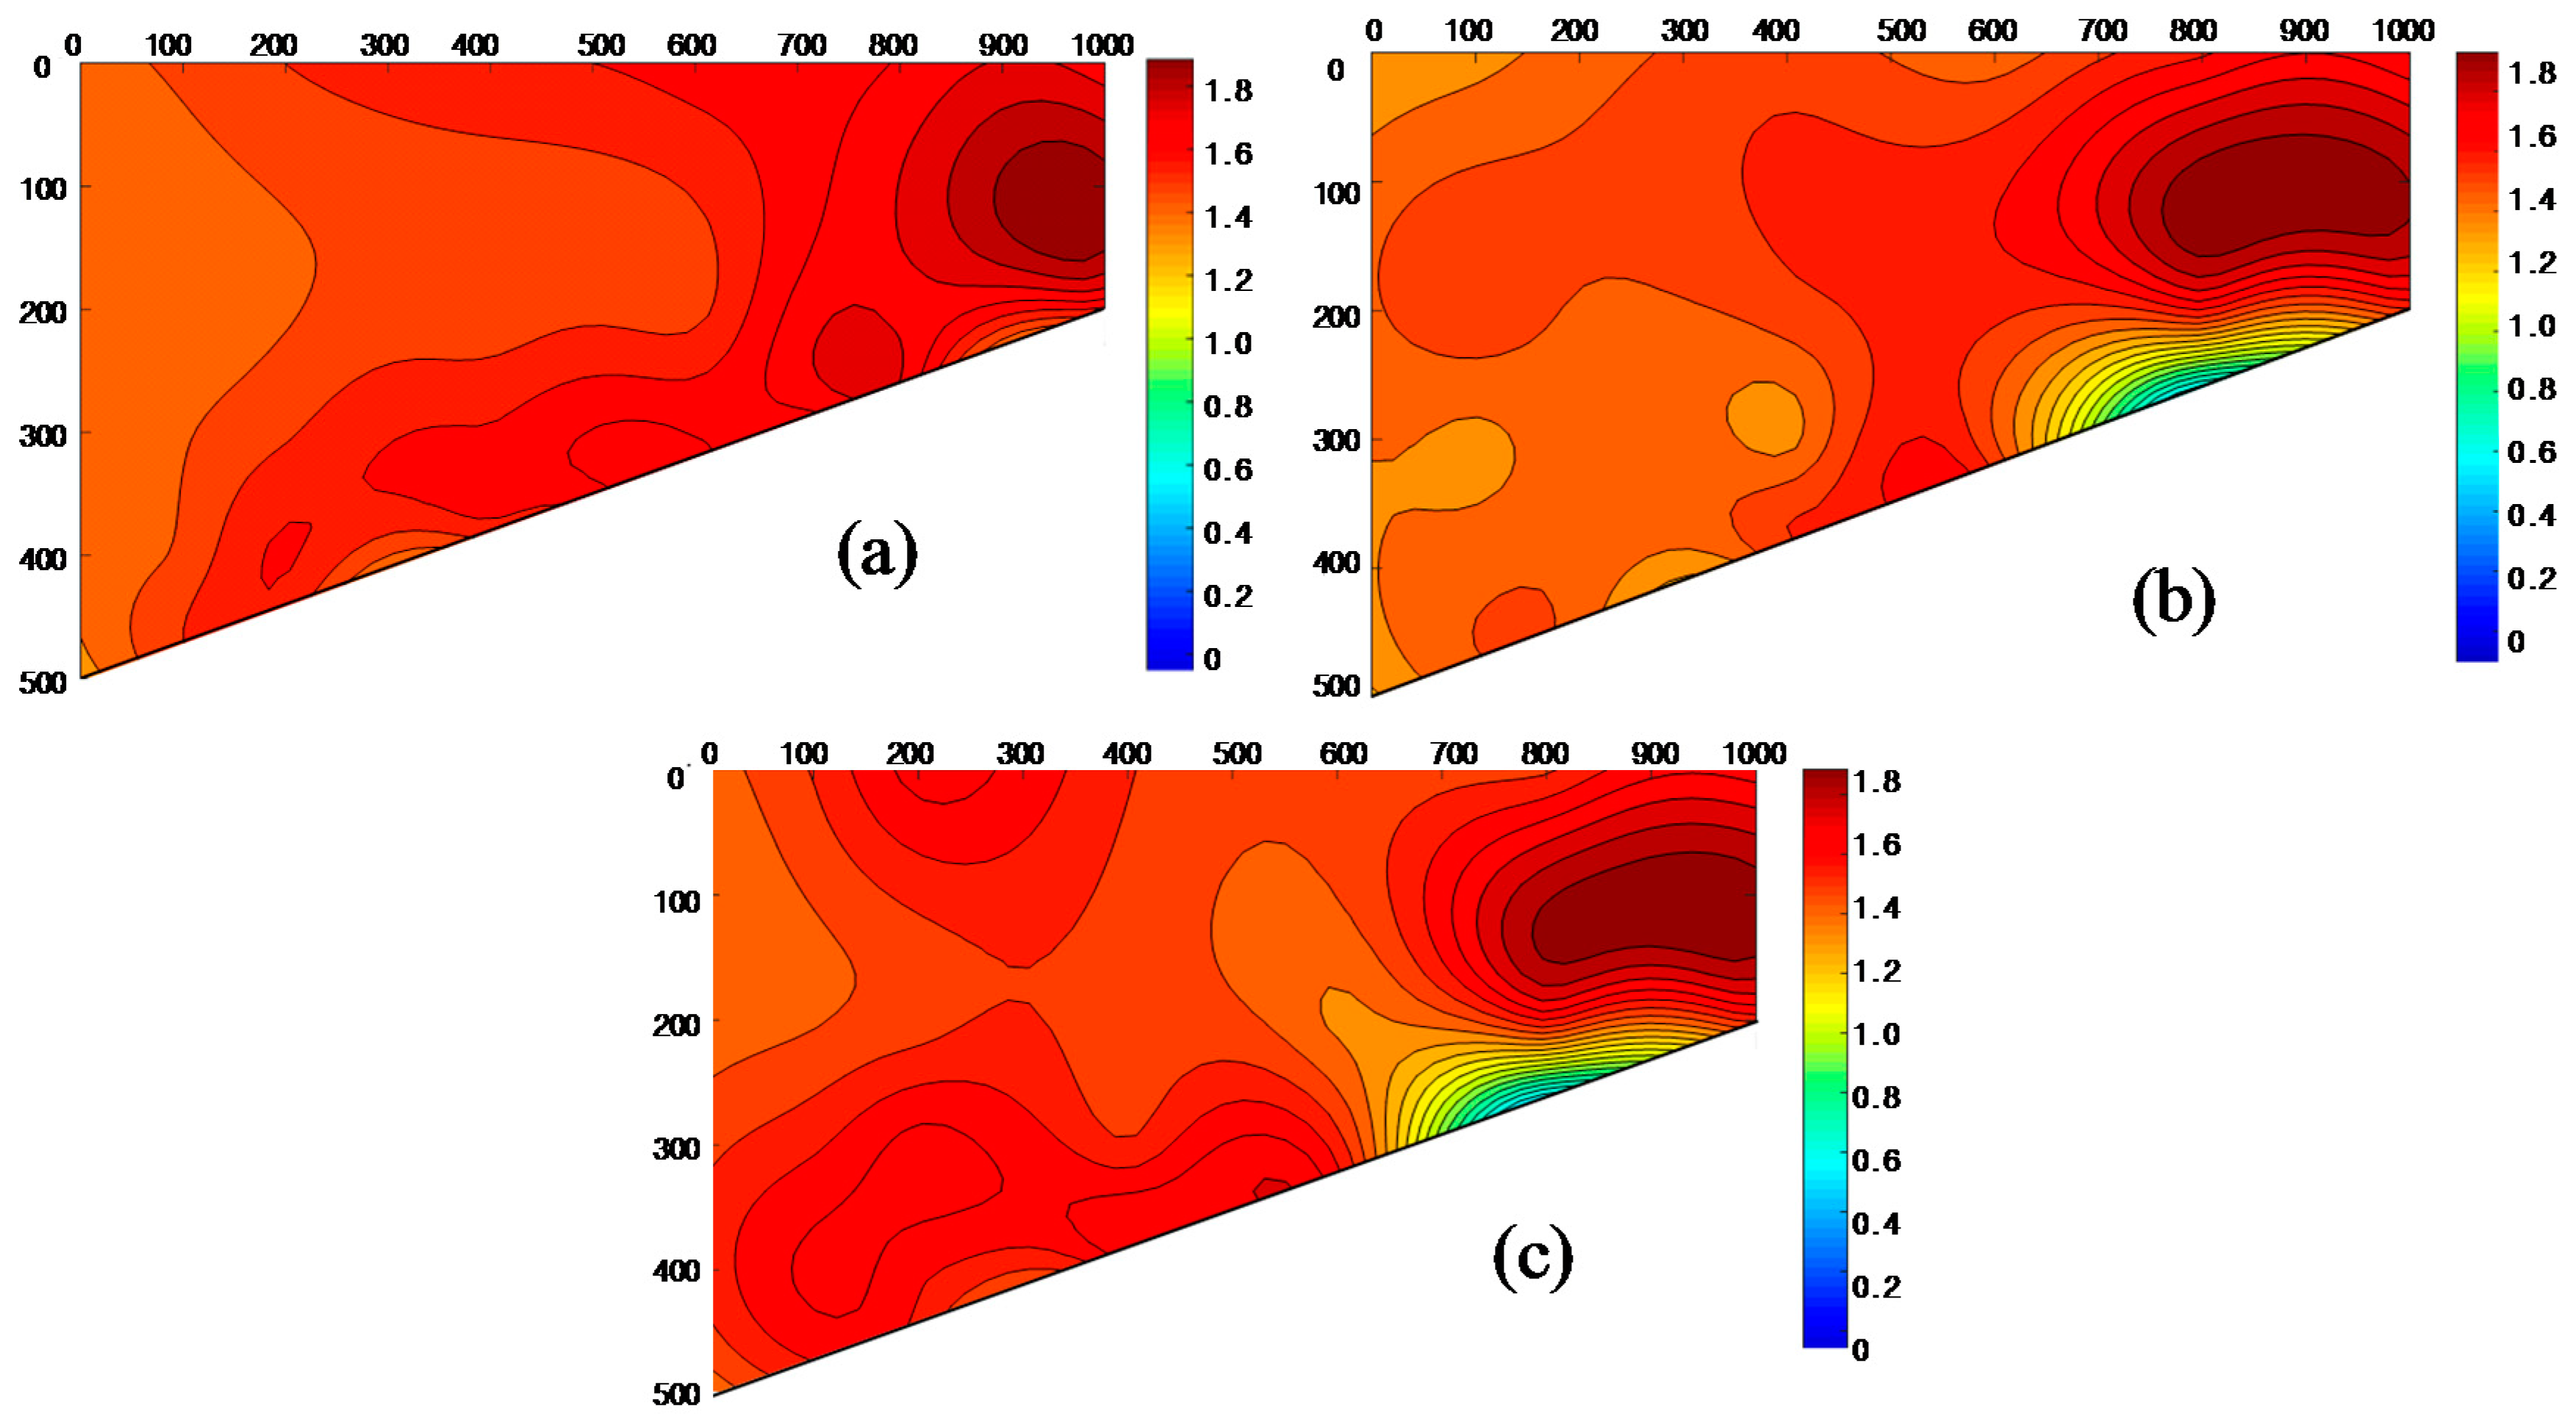
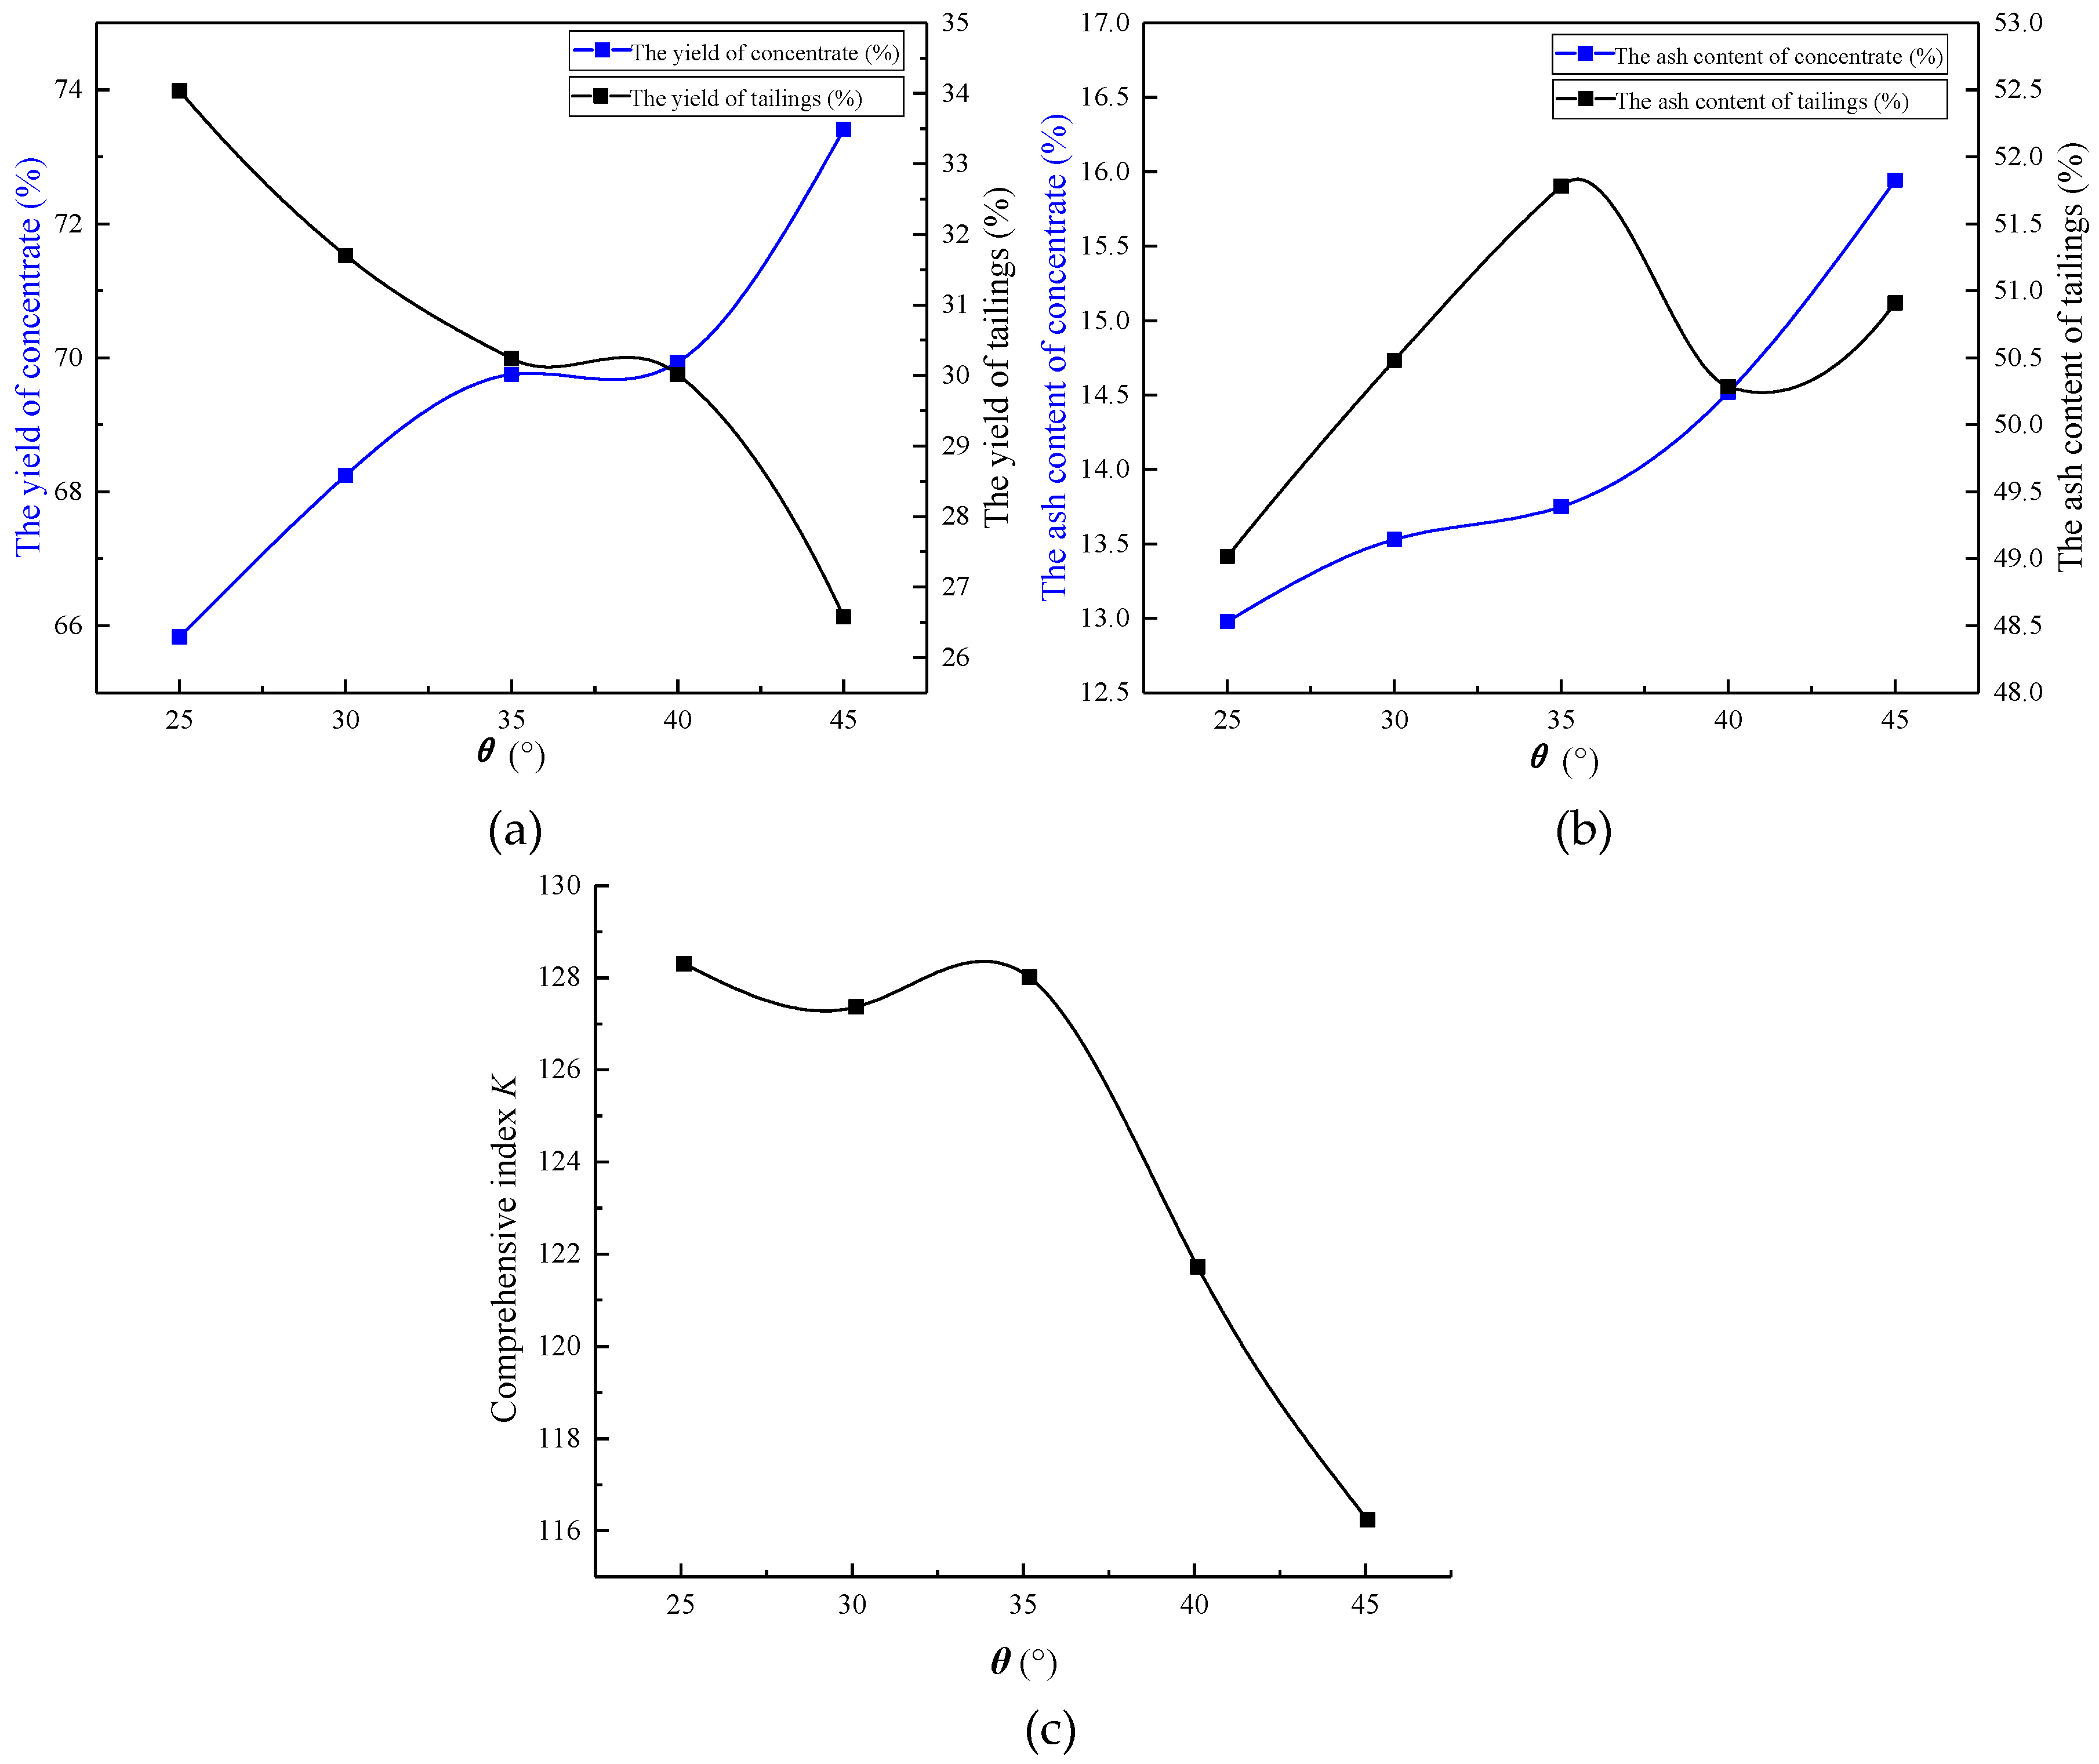
3.2. Effect of the Partition Plate Angle (θ) on the Separation Process

The effect of the partition plate on the uniformity of the average density of particles in the bed is shown in Figure 7. Figure 7a showed that, when the value of θ was 25°, the density distribution of bed surface was less uniform and had no obvious regularity, and the value of Sρ was 0.37. The results showed that, in the separation process, the movement of particles was less uniform, and a uniform and stable density separation layer had not been formed in the bed. This phenomenon occurred because, when θ was small, the force acted on the particles, so that materials distributed along the backplane, thereby this fraction of the particles to be not sufficiently separated and discharged. Figure 7b showed that, when the value of θ was 35°, the isoline of the bed surface distribution presented a certain regularity, and the separation effect was better. The value of Sρ reached 0.14, and the average density of particles in the bed value increased gradually in the x-axis direction. In the range of 0–500 mm of the x-axis, the density distribution of the bed surface was more uniform, which indicated that the average density distribution of bed surface in this area was uniform, and many low-density particles gathered in this area. In the range of 600–900 mm of the x-axis, the average density distribution of the bed increased obviously because many high-density materials moved to this side after separation. It showed that the particles in the bed surface could form a uniform average density layer when the value of θ was 35°, and the bed surface particles could be stratified according to the rule of density. When the value of θ was 45°, as shown in Figure 7c, there was no obvious regularity of the average density of particles in the bed distribution. In the range of 100–500 mm of the x-axis, the density distribution was less uniform than in the 35° case.
The effect of the partition plate angle on the separation is shown in Figure 8; when the value of θ increased from 25° to 35°, the yield of the concentrate increased quickly, and the ash content increased smoothly. The reason for these phenomena possible was that, when θ increased, the distance from the apex of partition plate to the backplane (D) reduced, resulting in the decrease of the tailings passage, thereby causing the concentrate carried by the tailings to be reduced. At the same time, the tailings passage became smaller, resulting in an increase in the amount of materials intercepted at the front of the separation bed surface. The materials intercepted on the bed surface increased, the density uniform separation layer could be formed under the actions of fluidization air, and the vibration. It made the high and low-density particles to separate quickly; thus, the separation efficiency was improved. When the value of θ was between 35° and 45°, the yield of the concentrate changed slowly, whereas the ash content increased sharply. The tailings passage on the bed surface became smaller, and the high-density particles could not be discharged through the tailings passage after separation, resulting in the deposition of high-density materials and the increase of the materials accumulation thickness in the upper part of the bed under the action of the reverse thrust of the backplane, followed by return of the materials to the separation bed. A large number of back-mixing particles after separation led to a sharp increase of the yield of the concentrate and an increase of the ash content of the concentrate. It could be also seen from the comprehensive index K that the range of K changed slowly in the process of increasing θ from 25° to 35°. When the value of θ further increased from 35°, the comprehensive index K decreased sharply; thus, the suitable value of θ was 35°. Table 5 is Sρ for different values of θ.

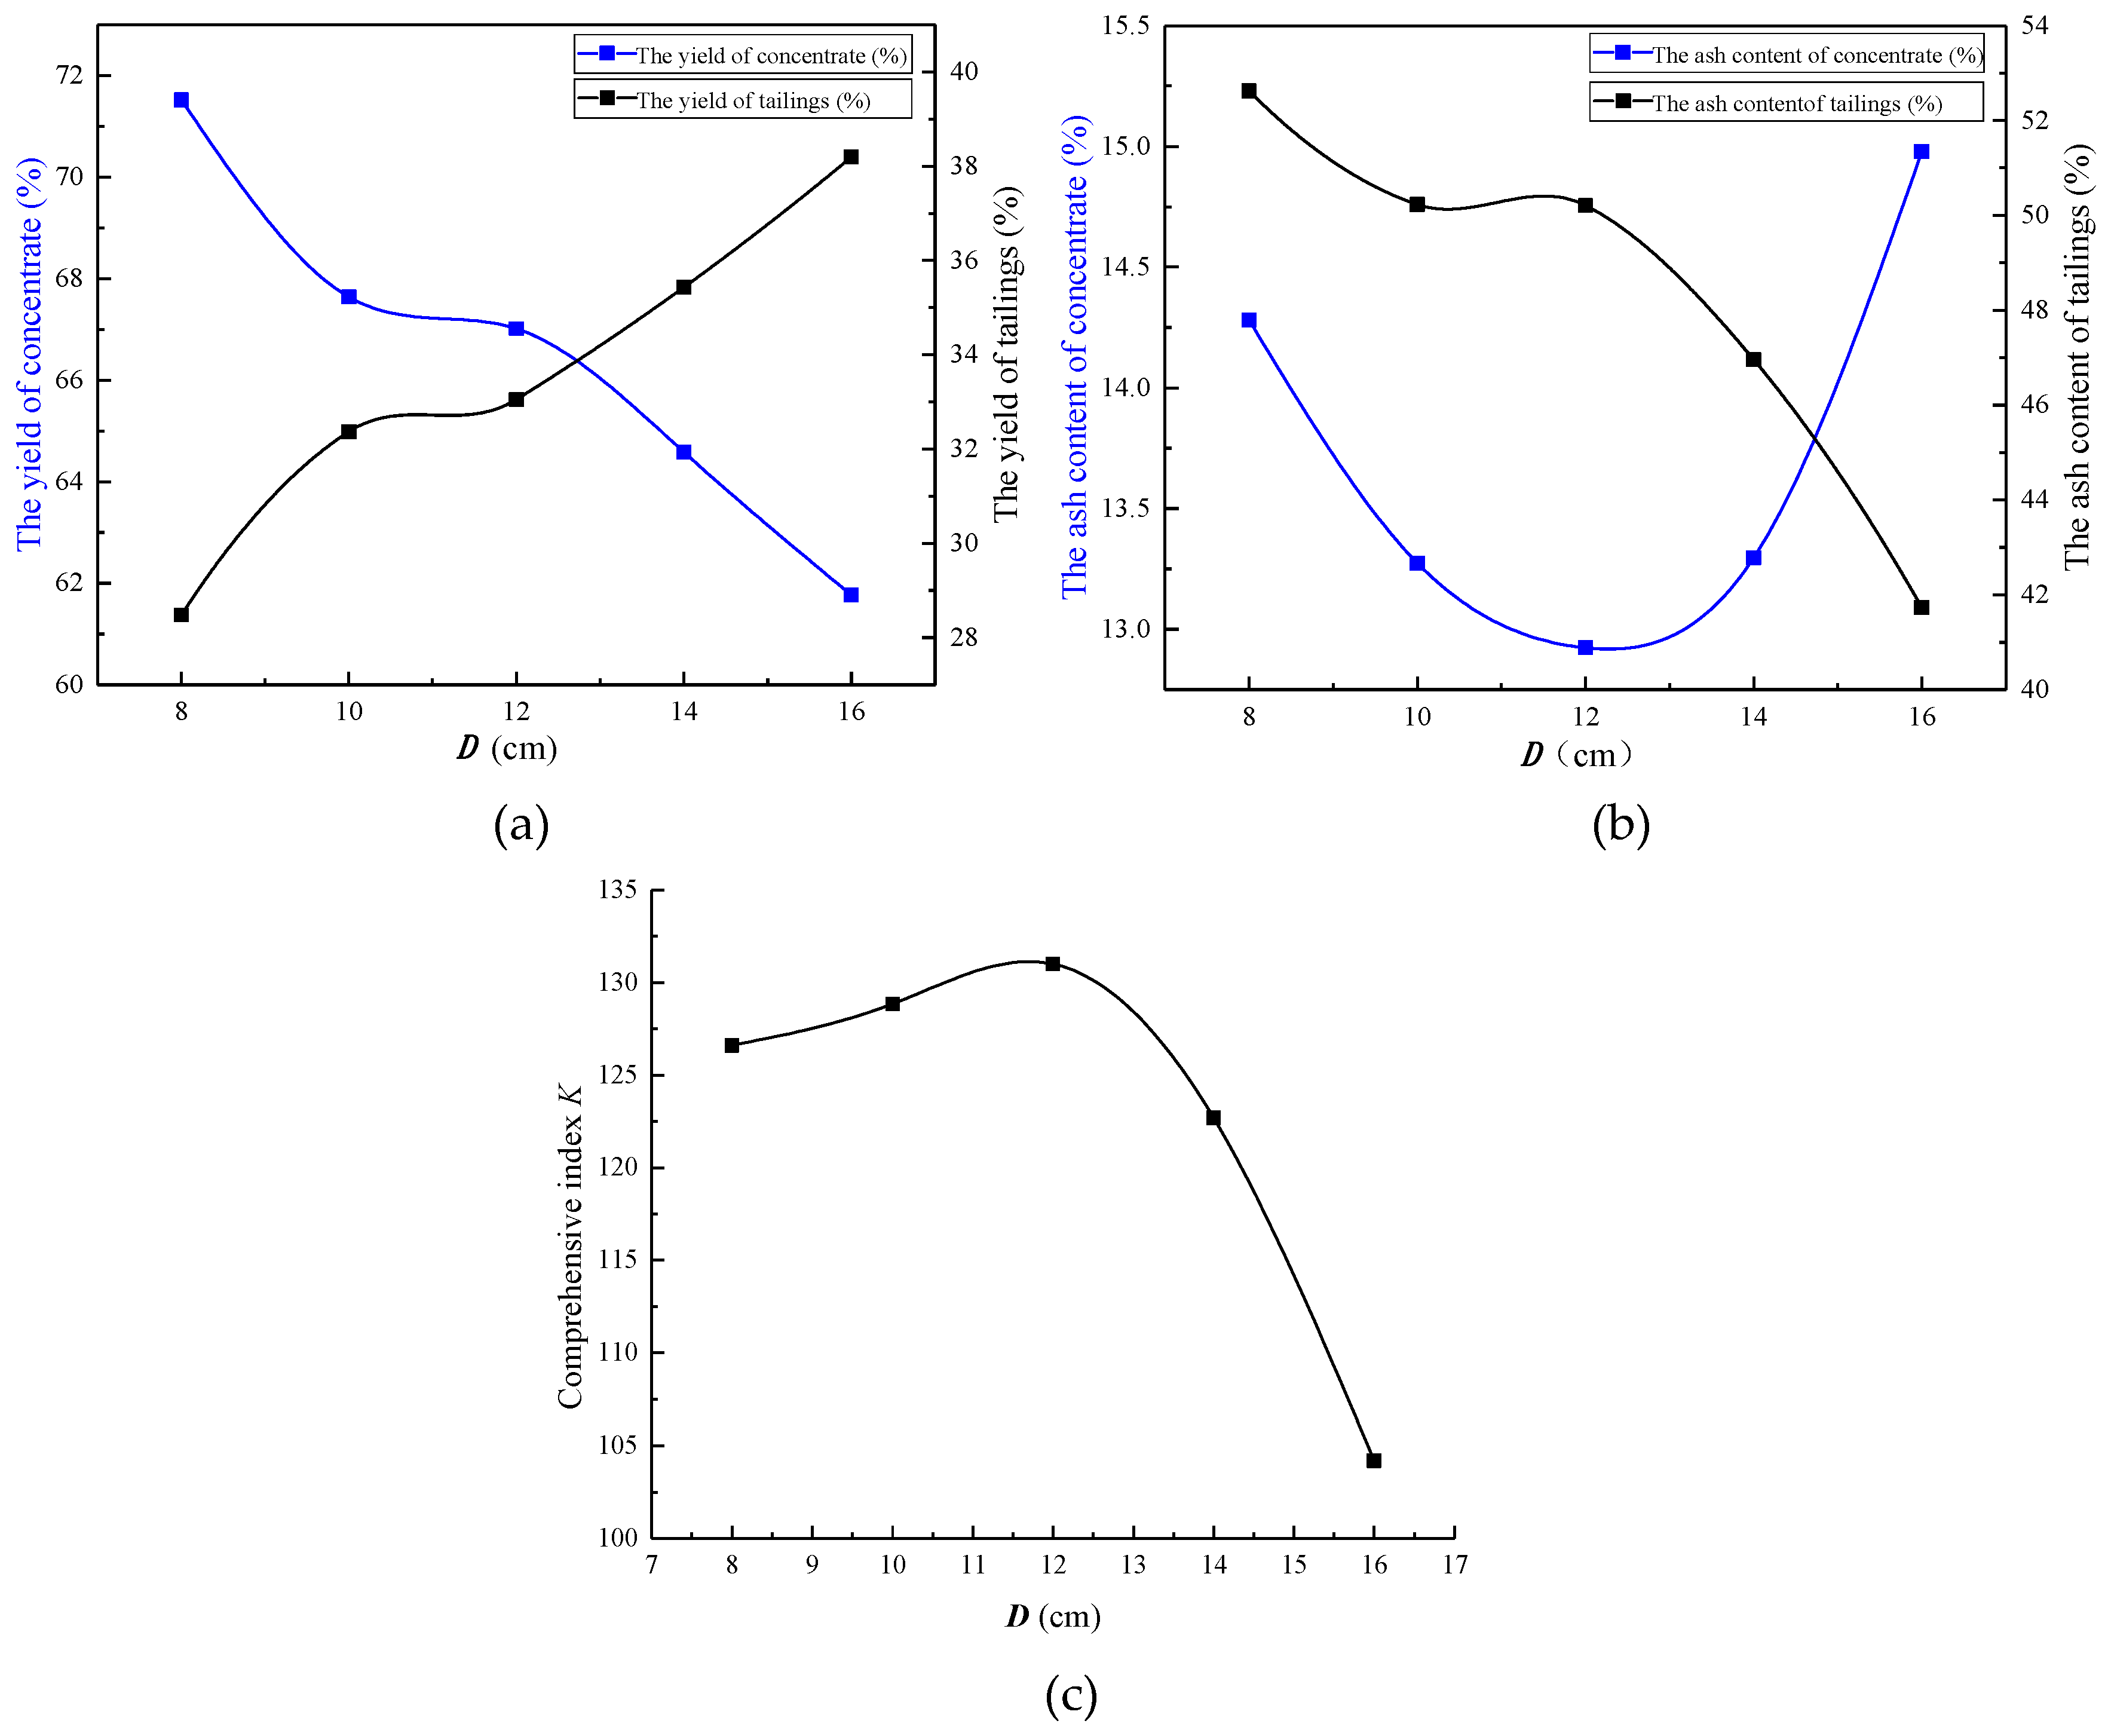
3.3. Effect of the Distance from the Apex of the Partition Plate to the Backplane (D) on the Separation Process

The distance from the apex of the partition plate to the backplane (D) is the region between the apex of the partition plates and the D provides a channel to separate the coal on the bed surface. High-density tailings can easily pass when the D is large enough. Thus, D determines the moving speed of high-density materials which would be transported to the tailings section after separation. D also affects the handling capacity of the separator in a unit time. Figure 9 showed the influence of D on the stability of the average density of particles in the bed. When the value of D was 8 cm, as shown in Figure 9a, the distribution of average density of particles in the bed was poor, and the value of Sρ was 0.45. A small number of high-density particles appeared in the 100–200 mm region of the x-axis because the value of D was small. It caused some high-density particles to spiral toward the backplane because the distance was so narrow that this fraction of particles could not be transported in time. As shown in Figure 9b, when the value of D was 12 cm, the average density of particles in the bed distribution showed a certain regularity, and the value of Sρ reached the minimum of 0.07. In the range of 0–500 mm of the x-axis, the bed surface density distribution was more uniform, and the density was relatively small in this area. In this region, the materials could form layers, and the average density of particles in the bed was low. In the region of 500–700 mm of the x-axis, the density was relatively high because of the gradual movement of the high-density materials after separation from the concentrate section to this area. In the range of 700–900 mm of the x-axis, all the separated materials would be discharged from this section. Thus, in this area, the average density of particles in the bed was high. When the value of D was 16 cm, the density distribution of the bed surface was shown in Figure 9c. Although there were some regularities in the density distribution map, the average density of particles in the bed was low, the particles distribution on the bed surface was less uniform, and the corresponding value of Sρ was 0.39. The uniformity of bed was poor. Table 6 is Sρ for different values of D.
The effect of the change in D on the separation of fine coal was shown in Figure 10. The diagram showed that the separation effect of fine coal was affected directly by the change in the value of D. Overall, the separation effect of compound dry separation improved when the distance increased gradually. However, when the value of D exceeded 12 cm, the separation effect deteriorated sharply. Figure 10a showed that, during the process of increasing D from 8 cm to 12 cm, the ash content of the concentrate decreased sharply and the yield of concentrate decreased slowly. Moreover, the comprehensive index K reached the maximum when the value of D was 12 cm. The results showed that the separation effect of fine coal was the best. One possible explanation for this result was that when the value of D was small, the high-density materials at the bottom of the bed after stratification moved near the backplane under the excitation force of the bed surface. Because the value of D was too small, this part of the stratified high-density particles could not be moved to the tailings section in time. In contrast, these particles returned to the concentrate section of the separation bed under the action of backplane reverse thrust. Furthermore, some high-density particles would be intercepted when the D was smaller. This fraction of back-mixing particles would aggravate the fluctuation of the average density of particles in the bed to a certain extent and worsen the overall separating effect. Under the combined action of the two factors, the yield and ash content of the concentrate were relatively high. When the value of the D was 12 cm, the yield of concentrate decreased sharply, the ash content increased linearly, and the separation index became the worst.

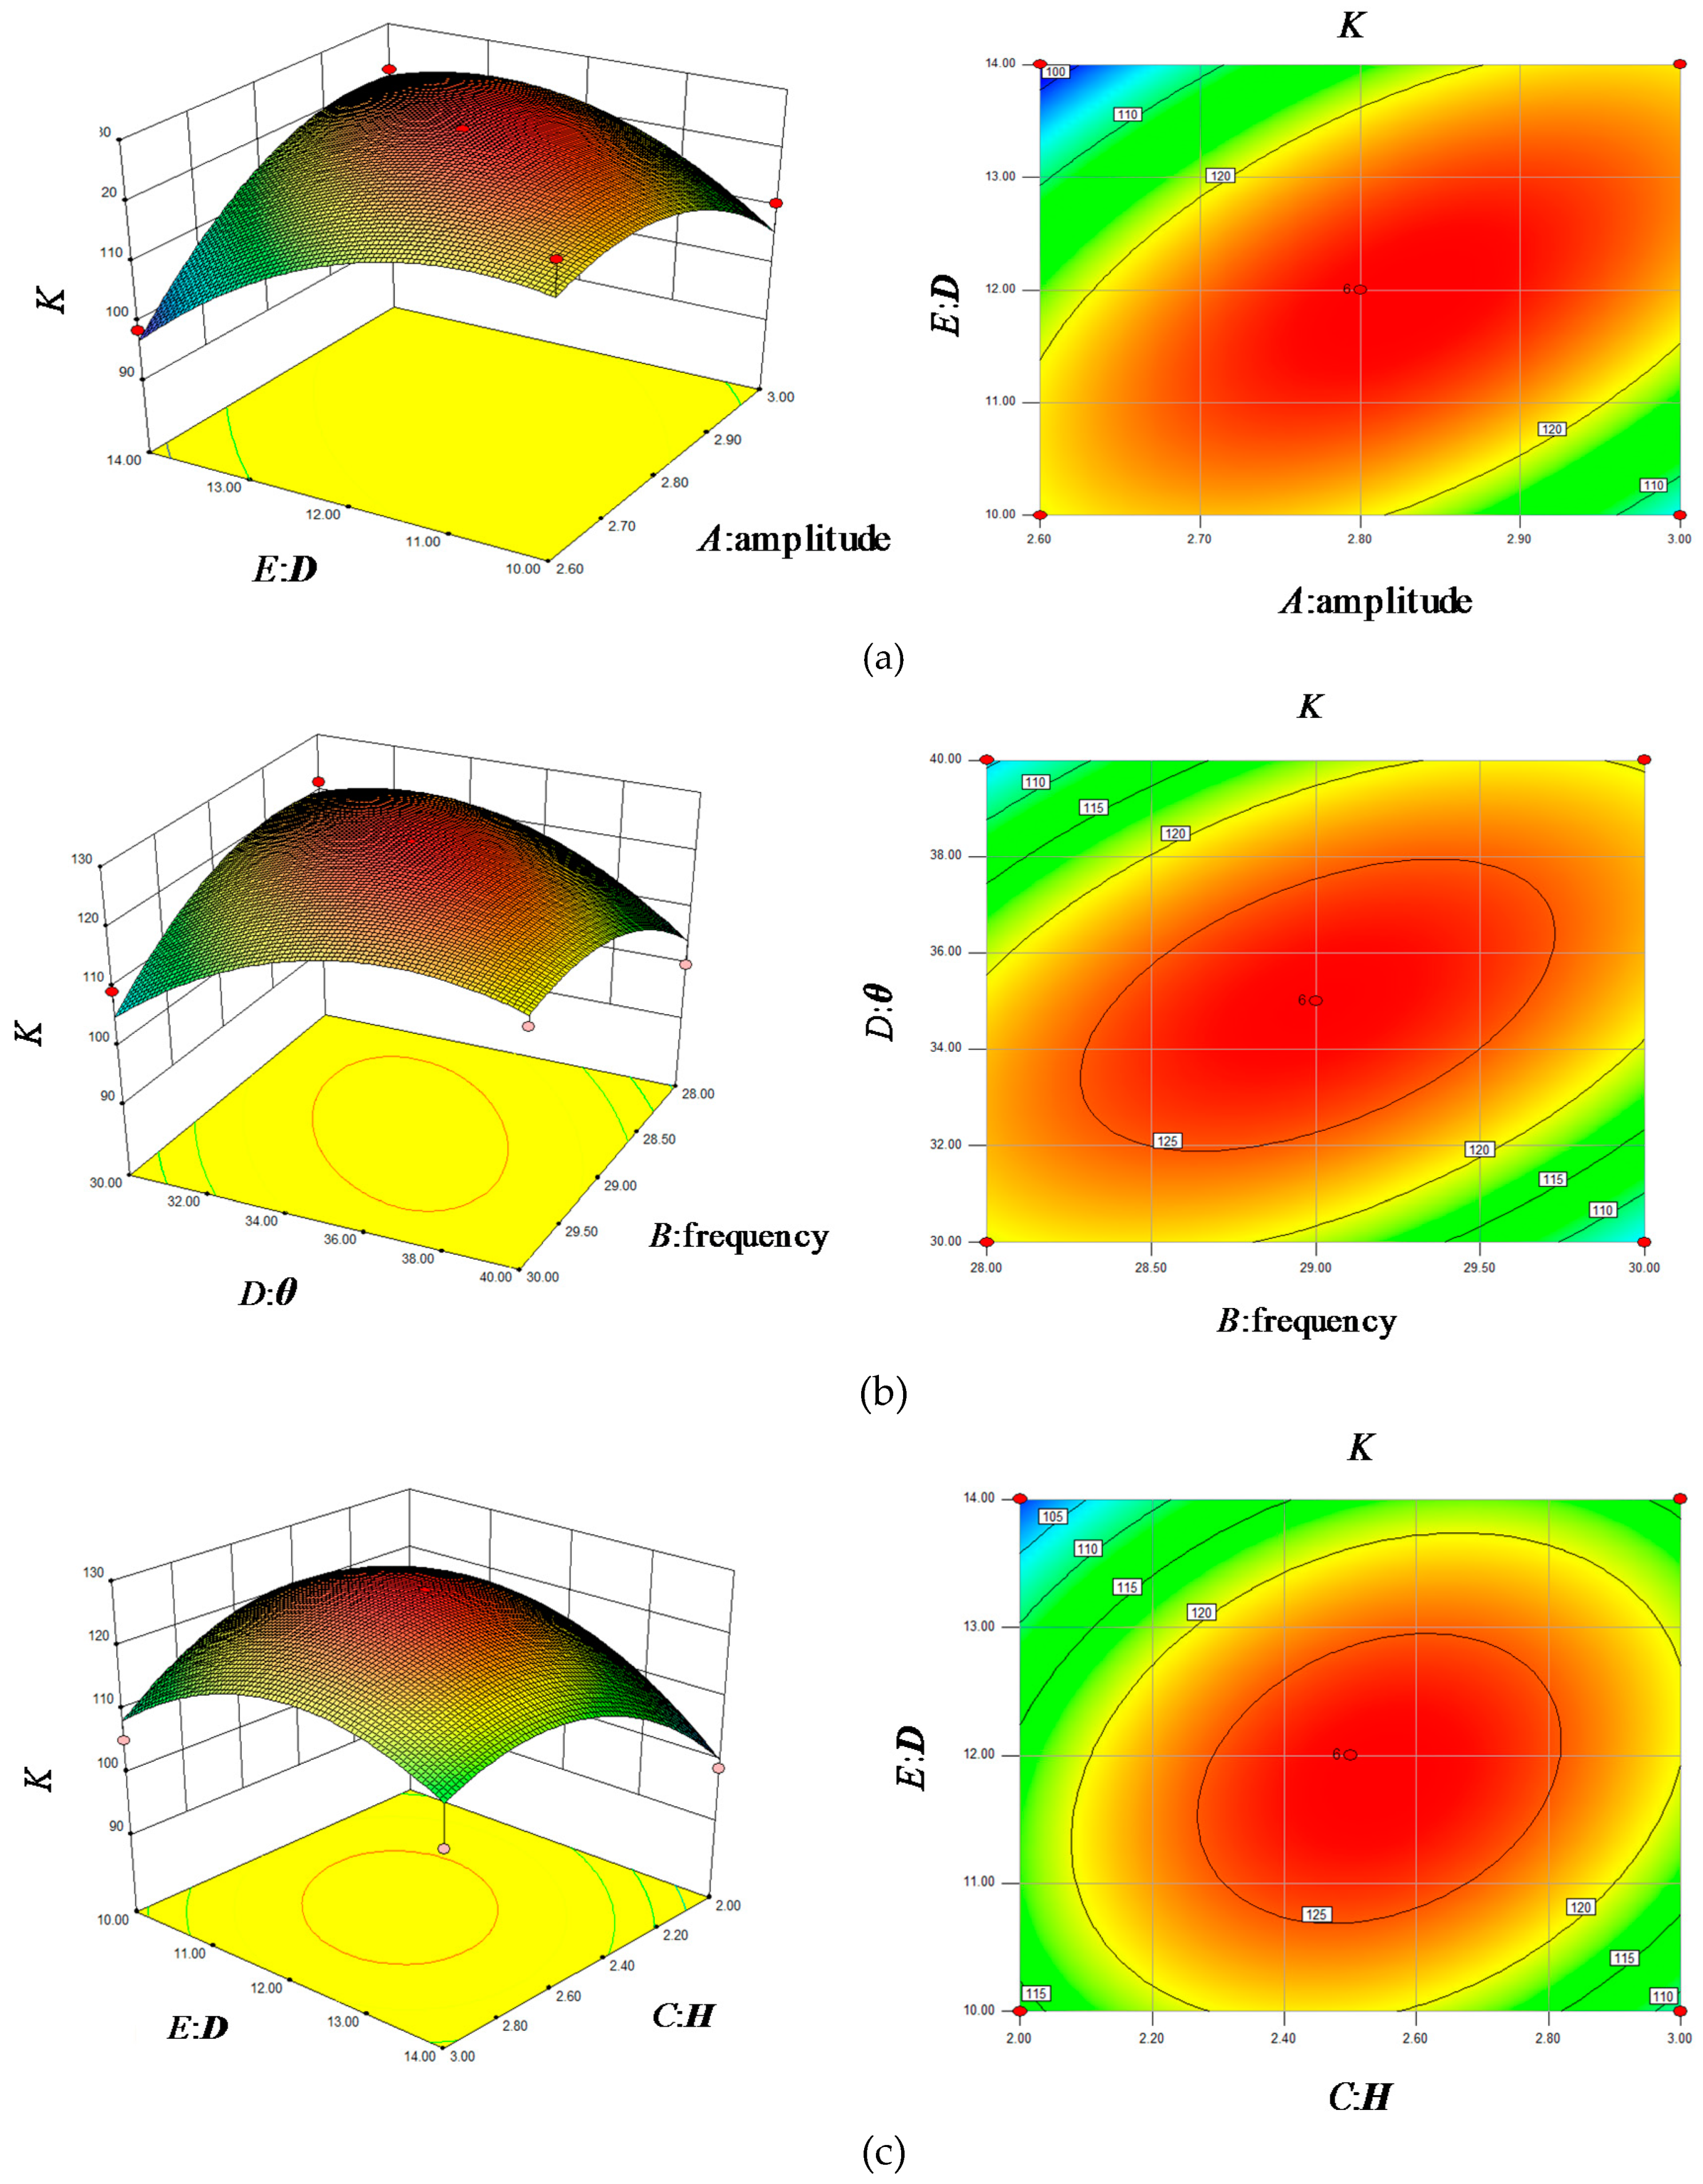
3.4. Determination of the Optimum Partition Parameter

In this paper, the Box-Behnken response surface method of Design-Expert software was used to analyze the influence of the operation factors on the separating effect. The operating factors were the following: amplitude, frequency, height of the partition plate, partition plate angle, and distance from the apex of the partition plate to the backplane. The basic parameters in the separation experiments were shown in Table 7, with each factor set at three levels. The selected amplitude was 2.8 mm, the frequency was 29 Hz, the H was 2.5 cm, the θ was 35°, and the D was 12 cm. The same numerical interval between the left and right sides were taken to carry out the multi-factor experimental design with these five data as the center. The reason why these ranges of variation were chosen was that we just chose the optimal parameters under the operability of the machine. The recommended model was the quadratic polynomial model (Prob > F, value of Prob was 0.0075, indicating that the model was significant. The Prob is the possibility). The analysis results are shown in Table 8.
It can be seen in Table 7 that the mathematical model is expressed as follows:
(1) Mathematical model in terms of factors of code:
K = 127.4944 + 2.48A + 0.25B + 2.02C − 0.33D − 2.03E − 0.60AB − 0.61AC − 1.12AD + 9.51AE − 0.17BC + 7.46BD + 0.70BE + 4.78CE + 6.82DE − 7.70A2 − 6.41B2 − 9.52C2 − 8.96D2 − 8.92E2
(2) Mathematical model in terms of actual operational factors:
K = −5358.55 + 946.63α + 324.61β + 163.12γ − 23.35δ − 60.02ε − 3.0αβ − 6.13αγ − 1.12αδ + 23.78αε − 0.35βγ + 1.49βδ + 0.35βε + 0.04γδ + 4.78γε + 0.68δε − 192.48α2 − 6.41β2 − 32.08γ2 − 0.36δ2 − 2.23ε2
In this equation, α, β, γ, δ, ε represented amplitude, frequency, height, angle and distance, respectively.
Figure 11 showed the comprehensive index K response surface and its contour diagram. It could be seen from Figure 11a that the variation trend of comprehensive index K along the amplitude direction was more obvious than that along the D direction. From the contour map mapped by the response surface, the sensitivity of comprehensive index K to amplitude change was found to be more obvious than the variation of D. This result indicated that amplitude change had a great influence on the final separating efficiency. Figure 11b showed a comprehensive index K response surface and its contour under the interaction of different frequencies and angles. The response surface curve revealed that the trend of comprehensive index K along the direction of partition plate angle was steeper than that along the direction of amplitude. The corresponding contour line also showed that the comprehensive index K was more sensitive to the change of θ. This result showed that, in the separation process, θ had a greater effect on the final separating efficiency than the amplitude. Figure 11c showed a comprehensive index K response surface and its contour line under the influences of different values of H and D. The response surface curve revealed that the variation trend of comprehensive index K along the H direction was steeper than that along the D direction. The plot showed that the change of D had less influence on the comprehensive index K than the change of H. The contour of the corresponding surface also showed that the comprehensive index K was more sensitive to the change of H. It could be seen from the Table 8 that the significant factors that influence the comprehensive index K were ranked in level of influence as follows: amplitude > H > D > θ > frequency. Table 9 is the separation results of fine coal in a compound dry separator, Table 10 presents the partition coefficient results of −6 + 1 mm fine coal for compound dry separation and Figure 12 is the partition coefficient of the compound dry separation −6 + 1 mm fine coal.
After the parameters were optimized by multi-factor test, the −6 + 1 mm fine coal compound dry separation test was conducted. The experimental results were as follows. By drawing the partition curve to calculate the Ep value, the value was 0.115, and the yield of concentrate was 69.24%. The fine coal ash content dropped to 12.52 %.

4. Conclusions

(1) The effects of the characteristics of the partition plate element on the separation of fine coal were studied. For the height of the partition plate (H) is 2.5 cm, the partition plate angle (θ) is 35°, and the distance from the apex of partition plate to the backplane (D) is 12 cm, the standard deviation (Sρ) of the corresponding density were obtained as 0.08, 0.14, 0.07, respectively, reaching the lowest value under the same factors. This finding showed the following: (a) the density of the bed surface was more uniformity; and (b) the regularity of the isoline of the average density of particles in the bed distribution was obvious, that is, the density values of the concentrate section and the middle coal section to the tailings section increased gradually and the materials on the bed surface were separated according to the density distribution.
(2) Using Design-Expert software and univariate test factor, the test results showed that, under the conditions of the amplitude of 2.8 mm, the frequency of 29 Hz, the height of the partition plate (H) of 2.5 cm, the partition plate angle (θ) of 35°, and the distance from the apex of the partition plate to the backplane (D) of 12 cm, both the comprehensive index K and the separation efficiency of fine coal were the best. Through the numerical analysis of the response surface design experiment, it was concluded that the ranking of the effect of each factor on the comprehensive index K was: amplitude > H > D > θ > frequency.
(3) Using the optimum set of operating conditions, the separation test of −6+1 mm fine coal showed that the ash content of raw coal was 25.24%, the yield of concentrate was 69.24%, the separated coal ash was divided into 12.52%, the probable Ep was 0.115 g/cm3.

Author Contributions

Data curation, C.C., L.W.; Methodology, Z.L., C.C.; Software, C.C., B.L., Y.F.; Writing-review and editing, C.C., X.X.; Validation, Z.L., Y.Z.; Writing—original draft, C.C., L.W.; Formal analysis, C.C., B.L., Y.F.; Supervision, Z.L., Y.Z.; Project administration, Z.L.

Funding

The authors acknowledge the financial support by Fundamental Research Funds for the Central Universities (2018XKQYMS05).

Acknowledgments

The author appreciates the teacher for his careful guidance and for the help of his brother and sister.

Conflicts of Interest

The authors declare no conflict of interest.

References

  1. Circular of the National Energy: Administration on the Issuance of Guidance on Energy Work in 2018. National Energy Administration, 2017; pp. 2–26. Available online: http://zfxxgk.nea.gov.cn/auto82/201803/t20180307_3125.htm (accessed on 3 April 2019). (In Chinese)
  2. Statistical Bulletin of National Economic and Social Development for 2018. National Bureau of Statistics of the people’s Republic of China, 2018; pp. 2–28. Available online: http://www.stats.gov.cn/tjsj/zxfb/201902/t20190228_1651265.html (accessed on 3 April 2019). (In Chinese)
  3. Lu, X.; Yu, Z.F.; Wu, L.X.; Yu, J.; Chen, G.F.; Fan, M.H. Policy study on development and utilization of clean coal technology in China. Fuel Process. Technol. 2008, 89, 475–484. [Google Scholar] [CrossRef]
  4. Yang, X.L.; Zhao, Y.M.; Luo, Z.F. Dry cleaning of fine coal based on gas-solid two-phase flow-a review. Chem. Eng. Technol. 2017, 40, 439–449. [Google Scholar] [CrossRef]
  5. Zhao, Y.M.; Tang, L.G.; Luo, Z.F.; Liang, C.C.; Xing, H.B.; Duan, C.L.; Song, S.L. Fluidization characteristics of a fine magnetite powder fluidized bed for density-based dry separation of coal. Sep. Sci. Technol. 2012, 47, 2256–2261. [Google Scholar]
  6. Yang, X.L.; Zhao, Y.M.; Luo, Z.F.; Song, S.L.; Duan, C.L.; Dong, L. Fine coal dry cleaning using a vibrated gas-fluidized bed. Fuel Process. Technol. 2013, 106, 338–343. [Google Scholar] [CrossRef]
  7. Yang, X.L.; Zhao, Y.M.; Luo, Z.F.; Song, S.L.; Chen, Z.Q. Fine coal dry beneficiation using autogenous medium in a vibrated fluidized bed. Int. J. Miner. Process. 2013, 125, 86–91. [Google Scholar] [CrossRef]
  8. Luo, Z.F.; Tang, L.G.; Dai, N.N.; Zhao, Y.M. The effect of a secondary gas-distribution layer on the fluidization characteristics of a fluidized bed used for dry coal beneficiation. Int. J. Miner. Process. 2013, 118, 28–33. [Google Scholar] [CrossRef]
  9. Dong, L.; Zhao, Y.M.; Xie, W.N.; Duan, C.L.; Li, H.; Hua, C.P. Insights in active pulsing air separation technology for coarse coal slime by DEM-CFD approach. J. Cent. South Univ. 2013, 20, 3660–3666. [Google Scholar] [CrossRef]
  10. Zhao, Y.M.; Li, G.M.; Luo, Z.F.; Zhang, B.; Dong, L. Industrial application of a modularized dry-coal-beneficiation technique based on a novel air dense medium fluidized bed. Int. J. Coal Prep. Util. 2016. [Google Scholar] [CrossRef]
  11. Dong, L.; Zhao, Y.M.; Peng, L.P.; Zhao, J.; Luo, Z.F.; Liu, Q.X.; Duan, C.L. Characteristics of pressure fluctuations and fine coal preparation in gas-vibro fluidized bed. Particuology 2015, 21, 146–153. [Google Scholar] [CrossRef]
  12. Zhang, B.; Zhu, G.Q.; Lv, B.; Yan, G.H. A novel and effective method for coal slime reduction of thermal coal processing. J. Clean. Prod. 2018, 198, 19–23. [Google Scholar] [CrossRef]
  13. Chao, N.I.; Yuan, X.G.; Gui, J.Z.; Bo, L.; Li, P.Y. Problem analysis and optimization test for “2+2” coal slime separation process. J. China Coal Soc. 2013, 38, 2035–2041. [Google Scholar]
  14. Luo, Z.F.; Zhao, Y.M.; Chen, Q.R.; Tao, X.X.; Fan, M.M. Research on gas distribution of dense phase high density fluidized bed for separation. J. China Univ. Min. Technol. 2004, 33, 237–240. [Google Scholar]
  15. Luo, Z.F.; Zhao, Y.M.; Fan, M.M.; Tao, X.X.; Chen, Q.R. Density calculation of a compound medium solids fluidized bed for coal separation. J. South. Afr. Inst. Min. Metall. 2006, 106, 749–752. [Google Scholar]
  16. Dwari, R.K.; Rao, K.H. Dry beneficiation of coal-A review. Miner. Process. Extr. Metall. Rev. 2007, 28, 177–234. [Google Scholar] [CrossRef]
  17. Tang, L.G.; Zhao, Y.M.; Luo, Z.F.; Liang, C.C.; Chen, Z.Q.; Xing, H.B. The Effect of fine coal particles on the performance of gas-solid fluidized beds. Coal Prep. 2009, 29, 265–278. [Google Scholar] [CrossRef]
  18. Dong, H.L.; Liu, C.S.; Zhao, Y.M.; Zhao, L.L. Review of the development of dry coal preparation theory and equipment of the development of dry coal preparation theory and equipment. Adv. Mater. Res. 2013, 619, 239–243. [Google Scholar] [CrossRef]
  19. Zhao, Y.M.; Luo, Z.F.; Chen, Z.Q.; Tang, L.G.; Wang, H.F.; Xing, H.B. The effect of feed-coal particle size on the separating characteristics of a gas-solid fluidized bed. J. South Afr. Inst. Min. Metall. 2010, 110, 219–224. [Google Scholar]
  20. Luo, Z.F.; Zuo, W.; Tang, L.G.; Zhao, Y.M.; Fan, M.M. Preparation of solid medium for use in separation with gas-solid fluidized beds. Min. Sci. Technol. 2010, 20, 743–746. [Google Scholar] [CrossRef]
  21. Zhang, B.; Luo, Z.F.; Zhao, Y.M.; Lv, B.; Song, S.L.; Duan, C.L.; Chen, Z.Q. Effect of a high-density coarse-particle layer on the stability of a gas-solid fluidized bed for dry coal beneficiation. Int. J. Miner. Process. 2014, 132, 8–16. [Google Scholar] [CrossRef]
  22. Yu, X.D.; Luo, Z.F.; Li, H.; Yang, X.; Cai, L. Effect of vibration on the separation efficiency of high-sulfur coal in a compound dry separator. Int. J. Miner. Process. 2013, 157, 195–204. [Google Scholar] [CrossRef]
  23. Yu, X.D.; Luo, Z.F.; Li, H.B.; Yang, X.L.; Zhou, E.H.; Jiang, H.S.; Wu, J.D.; Song, S.L.; Cai, L.H. Effect of vibration on the separation efficiency of high-sulfur coal in a compound dry separator. Int. J. Miner. Process. 2016, 157, 195–204. [Google Scholar] [CrossRef]
  24. Yu, X.D.; Luo, Z.F.; Li, H.B.; Yang, X.L. Separation of <6 mm oil shale using a compound dry separator. Sep. Sci. Technol. 2017, 52, 1615–1623. [Google Scholar]
  25. Yu, X.D.; Luo, Z.F.; Li, H.B.; Gan, D.Q. Effect of vibration on the separation efficiency of oil shale in a compound dry separator. Fuel 2018, 214, 242–253. [Google Scholar] [CrossRef]
  26. Ling, X.Y.; He, Y.Q.; Zhao, Y.M.; Li, G.M.; Wang, J.; Wen, B.F. Distributions of size, ash, and density of coal particles along the front discharge section of a compound dry separator. Int. J. Coal Prep. Util. 2017, 38, 422–432. [Google Scholar] [CrossRef]
  27. Zhang, B.; Akbari, H.; Yang, F.; Mohanty, M.K.; Hirschi, J. Performance optimization of the FGX dry separator for cleaning high-sulfur coal. Int. J. Coal Prep. Util. 2001, 31, 161–186. [Google Scholar] [CrossRef]
  28. Ling, X.Y.; He, Y.Q.; Li, G.M.; Tang, X.L.; Xie, W.N. Separation performances of different particle sizes using an industrial FGX dry separator. Int. J. Coal Prep. Util. 2016. [Google Scholar] [CrossRef]
  29. Li, H.B.; Luo, Z.F.; Zhao, Y.M.; Wu, W.C.; Zhang, C.Y.; Dai, N.N. Cleaning of South African coal using a compound dry cleaning apparatus. Min. Sci. Technol. (China) 2011, 21, 117–121. [Google Scholar]
  30. Yang, X.L.; Zhao, Y.M.; Li, G.M.; Luo, Z.F.; Chen, Z.Q.; Liang, C.C. Establishment and evaluation of a united dry coal beneficiation system. Int. J. Coal Prep. Util. 2012, 32, 95–102. [Google Scholar]
Figure 1. Flow chart of the model system of compound dry coal separation. (a) The schematic diagram; (b) the equipment diagram.
Minerals 09 00215 g001
Figure 2. Three experiential parameters for the dry coal separation.
Minerals 09 00215 g002
Figure 3. A schematic diagram of the linear correlation curve of ash density.
Minerals 09 00215 g003
Figure 4. Schematic diagram of bed coordinates.
Minerals 09 00215 g004
Figure 5. Effect of height of the partition plate on the average density of particles in the bed. (a) H = 1.5 cm; (b) H = 2.5 cm; (c) H = 3.5 cm.
Minerals 09 00215 g005
Figure 6. Effect of H on the separation effect. (a) Effect of the H on yield; (b) effect of the H on ash content; (c) effect of the H on K.
Minerals 09 00215 g006
Figure 7. Effect of partition plate angle on the average density of particles in the bed. (a) θ = 25°; (b) θ = 35°; (c) θ = 45°.
Minerals 09 00215 g007
Figure 8. Effect of θ on the separation effect. (a) Effect of the θ on yield; (b) effect of the θ on the ash content; (c) effect of the θ on K.
Minerals 09 00215 g008
Figure 9. Effect of distance from the apex of partition plate to the backplane on the average density of particles in the bed. (a) D = 8 cm; (b) D = 12 cm; (c) D = 16 cm.
Minerals 09 00215 g009
Figure 10. Effect of D on the separation effect. (a) Effect of the D on yield; (b) effect of the D on ash content; (c) effect of the D on K.
Minerals 09 00215 g010
Figure 11. Response surface of K of −6 + 1 mm fine coal for various factors. (a) The response surface and its contour of K for different values of the amplitudes and D; (b) the response surface and its contour of K for different values of the frequencies and θ; (c) the response surface and its contour of K under different H and D.
Minerals 09 00215 g011
Figure 12. Partition coefficient of the compound dry separation −6 + 1 mm fine coal.
Minerals 09 00215 g012
Table 1. Characteristics of testing system of fine compound dry separator.
Size (mm)Operation Capacity (t/h)Amplitude (mm)Frequency (Hz)Air Volume (m3/h)
25–01–0.54–250–03517
Table 2. Results of sink-float test for −6 + 1 mm coal.
Density (g/cm3)Yield (%)Ash Content (%)Cumulative FloatCumulative Sink
Yield (%)Ash Content (%)Yield (%)Ash Content (%)
−1.4017.925.5117.925.5110025.24
1.4–1.531.017.4248.936.7282.0829.55
1.5–1.618.6314.1167.568.7651.0742.99
1.6–1.77.2321.1574.799.9532.4459.56
1.7–1.84.3234.8179.1111.3125.2170.58
1.8–2.03.3554.5882.4613.0720.8977.97
2.00 17.5482.4410025.2417.5482.44
Total10025.24
Table 3. Compound dry separation average density of particles in the bed test sampling layout table.
Base PointTransverse Region
12345678910
Longitudinal Region112345678910
211121314151617181920
321222324252627282930
431323334353637
5383940
Table 4. Sρ for different values of H.
H (cm)Sρ
1.50.51
2.50.08
3.50.35
Table 5. Sρ for different values of θ.
θ (°)Sρ
250.37
350.14
450.61
Table 6. Sρ for different values of D.
D (cm)Sρ
80.45
120.07
160.39
Table 7. Basic operation parameters in the separation experiments.
CodeFactorsUnitMinimumMaximumMinimum CodeMaximum Code
AAmplitudemm2.63.0−11
BFrequencyHz2830−11
CHeightcm2.03.0−11
DAngle°3040−11
EDistancecm1014−11
Table 8. Variance analysis of quadratic models.
SourceSum of SquaresdfMean SquareF valueProb > F
Model2618.3120.00130.923.470.00
A-Amplitude98.701.0098.702.620.12
B-Frequency1.011.001.010.030.87
C-Height65.551.0065.551.740.20
D-Angle1.781.001.780.050.83
E-Distance65.771.0065.771.740.20
AB1.441.001.440.040.85
AC1.501.001.500.040.84
AD5.041.005.040.130.72
AE361.761.00361.769.600.00
BC0.121.000.120.000.96
BD222.611.00222.615.900.02
BE1.971.001.970.050.82
CD0.031.000.030.000.98
CE91.301.0091.302.420.13
DE185.781.00185.784.930.04
Residual942.5325.0037.70
Lack of fit942.5320.0047.13
Pure error0.005.000.00
Table 9. Separation results of fine coal in a compound dry separator.
Separation TextAsh Content of
Raw Coal (%)
ConcentrateTailings
Yield (%)Ash Content (%)Yield (%)Ash Content (%)
Results25.2469.2412.5230.7653.87
Table 10. Partition coefficient results of −6 + 1 mm fine coal for compound dry separation.
Density (g/cm3)Average Density (g/cm3)Feed Density Distribution (%)Tailings Sink-Float Results (%)Concentrate Sink-Float Results (%)Calculated Feedstock Sink-Float Results (%)Partition Coefficient (%)
Of Products (%)Of Feedstock (%)Of Products (%)Of Feedstock (%)
−1.41.3017.920.760.2325.6317.7517.981.29
1.4–1.51.4531.017.622.3440.5028.0430.397.71
1.5–1.61.5518.6314.354.4121.7315.0519.4622.68
1.6–1.71.657.237.112.197.335.087.2730.11
1.7–1.81.754.329.933.051.831.274.3270.70
1.8–2.01.903.358.482.610.630.433.0485.72
+2.002.0017.5451.7615.922.351.6317.5590.73
Total 100.00100.0030.76100.0069.24100.00

