Article

Behavior of Tin and Antimony in Secondary Copper Smelting Process

1
Department of Chemical and Metallurgical Engineering, Aalto University, Kemistintie 1, P.O. Box 16100, FI-00076 Aalto, Finland
2
Geological Survey of Finland (GTK), Betonimiehenkuja 4, 02150 Espoo, Finland
*
Author to whom correspondence should be addressed.
Minerals 2019, 9(1), 39; https://doi.org/10.3390/min9010039
Submission received: 18 December 2018 / Revised: 4 January 2019 / Accepted: 8 January 2019 / Published: 12 January 2019
(This article belongs to the Special Issue Towards Sustainability in Extractive Metallurgy)

Abstract

:
Different types of metal-bearing wastes, such as WEEE (Waste Electrical and Electronic Equipment), are important urban minerals in modern society, and the efficient recycling and reuse of their metal values is of key interest. Pyrometallurgical copper smelting is one of the most prominent ways of treating WEEE, however, more accurate experimental data is needed regarding the behavior of different elements during each process stage. This article investigates the behavior of tin and antimony, both commonly present as trace elements in electrical and electronic waste, in secondary (i.e., sulfur-free) copper smelting conditions. The experiments were conducted in oxygen partial pressure range of 10−10–10−5 atm, covering the different process steps in copper smelting. The basis of the equilibrium system was metallic copper–iron silicate slag, with the addition of alumina and potassium oxide to account for the presence of these compounds in the actual industrial process. The results showed that the distribution coefficients of both trace metals, LCu/slag = [wt % Me]copper/(wt % Me)slag, increased significantly as a function of decreasing oxygen pressure, and the addition of basic potassium oxide also had an increasing effect on the distribution coefficient. A brief comparison between EPMA and LA-ICP-MS (electron probe microanalysis and laser ablation–inductively coupled plasma–mass spectrometry), the two in situ analytical techniques used, was also presented and discussed.

1. Introduction

Pyrometallurgical copper smelting is one of the most efficient and widely used ways of treating Waste Electrical and Electronic Equipment (WEEE) and recovering the valuable metals within. This processing method can be further divided into several routes: in primary copper smelters, WEEE is typically added to Peirce-Smith or Kaldo/TSL-type converters. One disadvantage of most primary smelters, regarding the handling of significant quantities of WEEE, is the remote location of the plants, as this scrap is mostly produced in urban areas and long-distance transportation is neither economically nor environmentally favorable. Thus, secondary copper smelters are more attractive, since they can be reasonably located closer to the WEEE collection network and operate economically with a smaller throughput compared to primary smelters [1]. The proximity to urban areas means that special attention must be paid to the handling of toxic emissions, such as dioxins and furans, potentially generated by WEEE-based secondary copper smelting [2,3]. However, with proper design and control of the entire smelting operation and especially the off-gas train, these emissions can be efficiently eliminated [3,4].
Secondary smelters can either produce a copper matte (for example Umicore [1,5]), or black copper from metallic and oxidic raw materials, such as electronic scrap [6,7,8]. The present study focuses on the different stages of the latter process and illustrates experimental observations on how tin and antimony as trace elements behave in black copper smelting conditions with alumina and potassium oxide containing slags. These oxides may not necessarily play a significant role in primary copper smelting, but can be present in considerable amounts when processing secondary raw materials, such as electronic waste.
When considering electronic appliances, tin is commonly used as a solder material, as well as in indium tin oxide (ITO) layers found for example in transparent, conductive display coatings. The concentration of tin in EEE varies from approximately 1 to 4 wt % [9]. Due to the comparatively high concentration of tin in electronic scrap, and consequently its notable effect on the recycling systems, the behavior of tin has been studied in different processes. Examples include different pretreatment methods [10], leaching [11,12,13] and pyrometallurgical waste processing. Focusing on the latter, studies have been conducted in tin-slag systems providing maximum solubility of tin in different types of slags [14,15,16,17,18] and, for relevant comparisons with the results of this study, in different copper-slag systems [19,20,21,22,23,24,25,26,27]. However, no data exists on the effect of alkali metal oxides in slag, in this case K2O, on the distribution behavior of tin with high-alumina slags common in secondary copper smelting processes.
Antimony is a common impurity in chalcopyrite, which is the most important sulfide mineral in primary copper production [28]. Antimony is used in a range of applications, such as rechargeable batteries, semiconductors and as a synergist for brominated flame retardants used in plastics. These antimony-containing plastics are also commonly used in manufacturing of electronic appliances [28,29] As antimony is from the same group as arsenic in the periodic table and shares similar biological and chemical properties, some regulations regarding for example the concentration of antimony in landfilled materials have already been implemented [30,31]. In the future, we may see regulatory limits for the concentration of antimony in electronic appliances as well [29]. It is worth recovering from different types of wastes as it has been classified as a toxic substance [30] and its mine reserves are decreasing rapidly [32]. Antimony was also classified as a critical raw material, with the largest expected deficit of all critical metals between 2015–2020, according to the European Commission [33].
Some studies have been conducted regarding the recovery of antimony from WEEE, MSWI (Municipal Solid Waste Incinerator) bottom ash and flue dusts by leaching [29,31,34,35] and from the plastic fraction of WEEE by staged-gasification [36,37]. The distribution of antimony between copper and different slags has also been studied by some authors previously [21,38,39,40,41,42,43]. Similarly as for tin, no studies regarding the effect of alkali metal oxides on the distribution behavior of antimony were found.
In this study, the distribution of tin and antimony between metallic copper and iron-alumina spinel saturated iron silicate slag, with 0–5 wt % K2O, was experimentally studied. The experimental temperature was selected as 1300 °C, which is in the same range as processing temperatures in industrial operations. The oxygen partial pressure range of interest was from 10−10 to 10−5 atm (10−5–1 Pa), covering most of the process steps in copper smelting. Industrial oxygen pressures are in the order of 10−8 atm in typical copper matte smelting, 10−11 atm in reducing matte smelting in a blast furnace or slag cleaning furnace, 10−6–10−5 atm in converter, and 10−5–10−4 atm in anode furnace. In different stages of sulfur-free black copper smelting, the partial pressure of oxygen is typically between 10−9 and 10−6 atm [44].

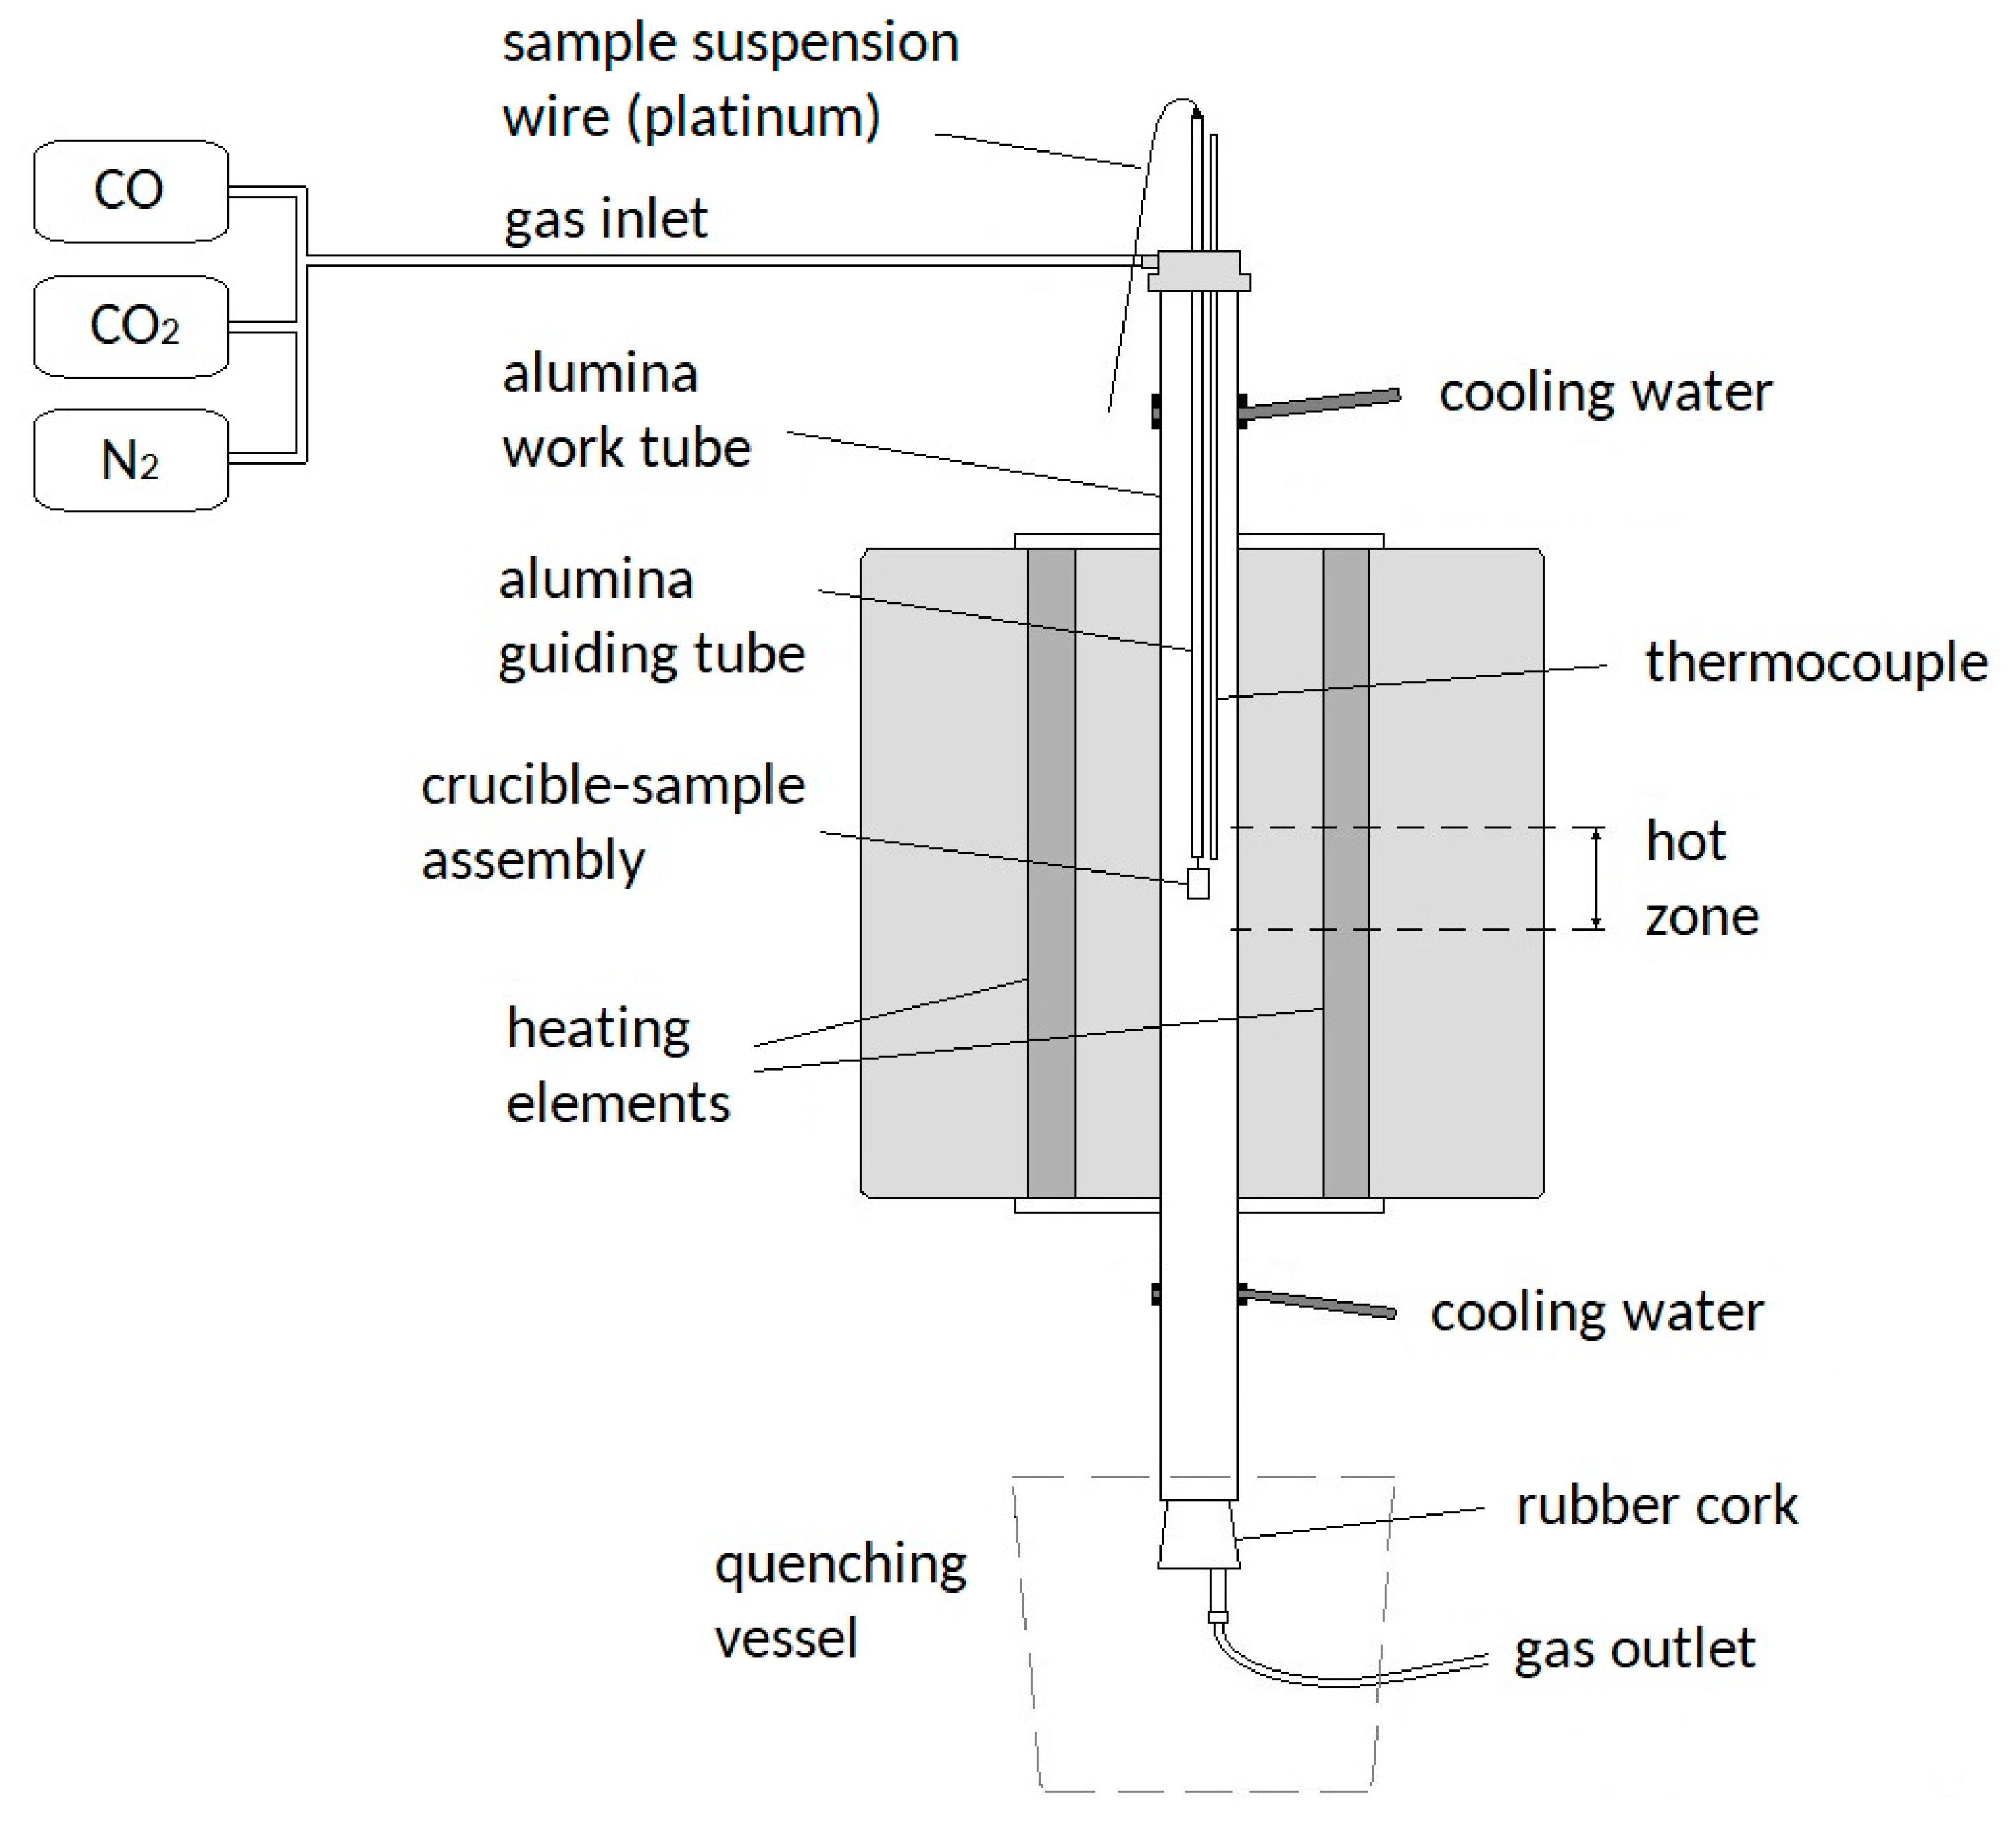
2. Materials and Methods
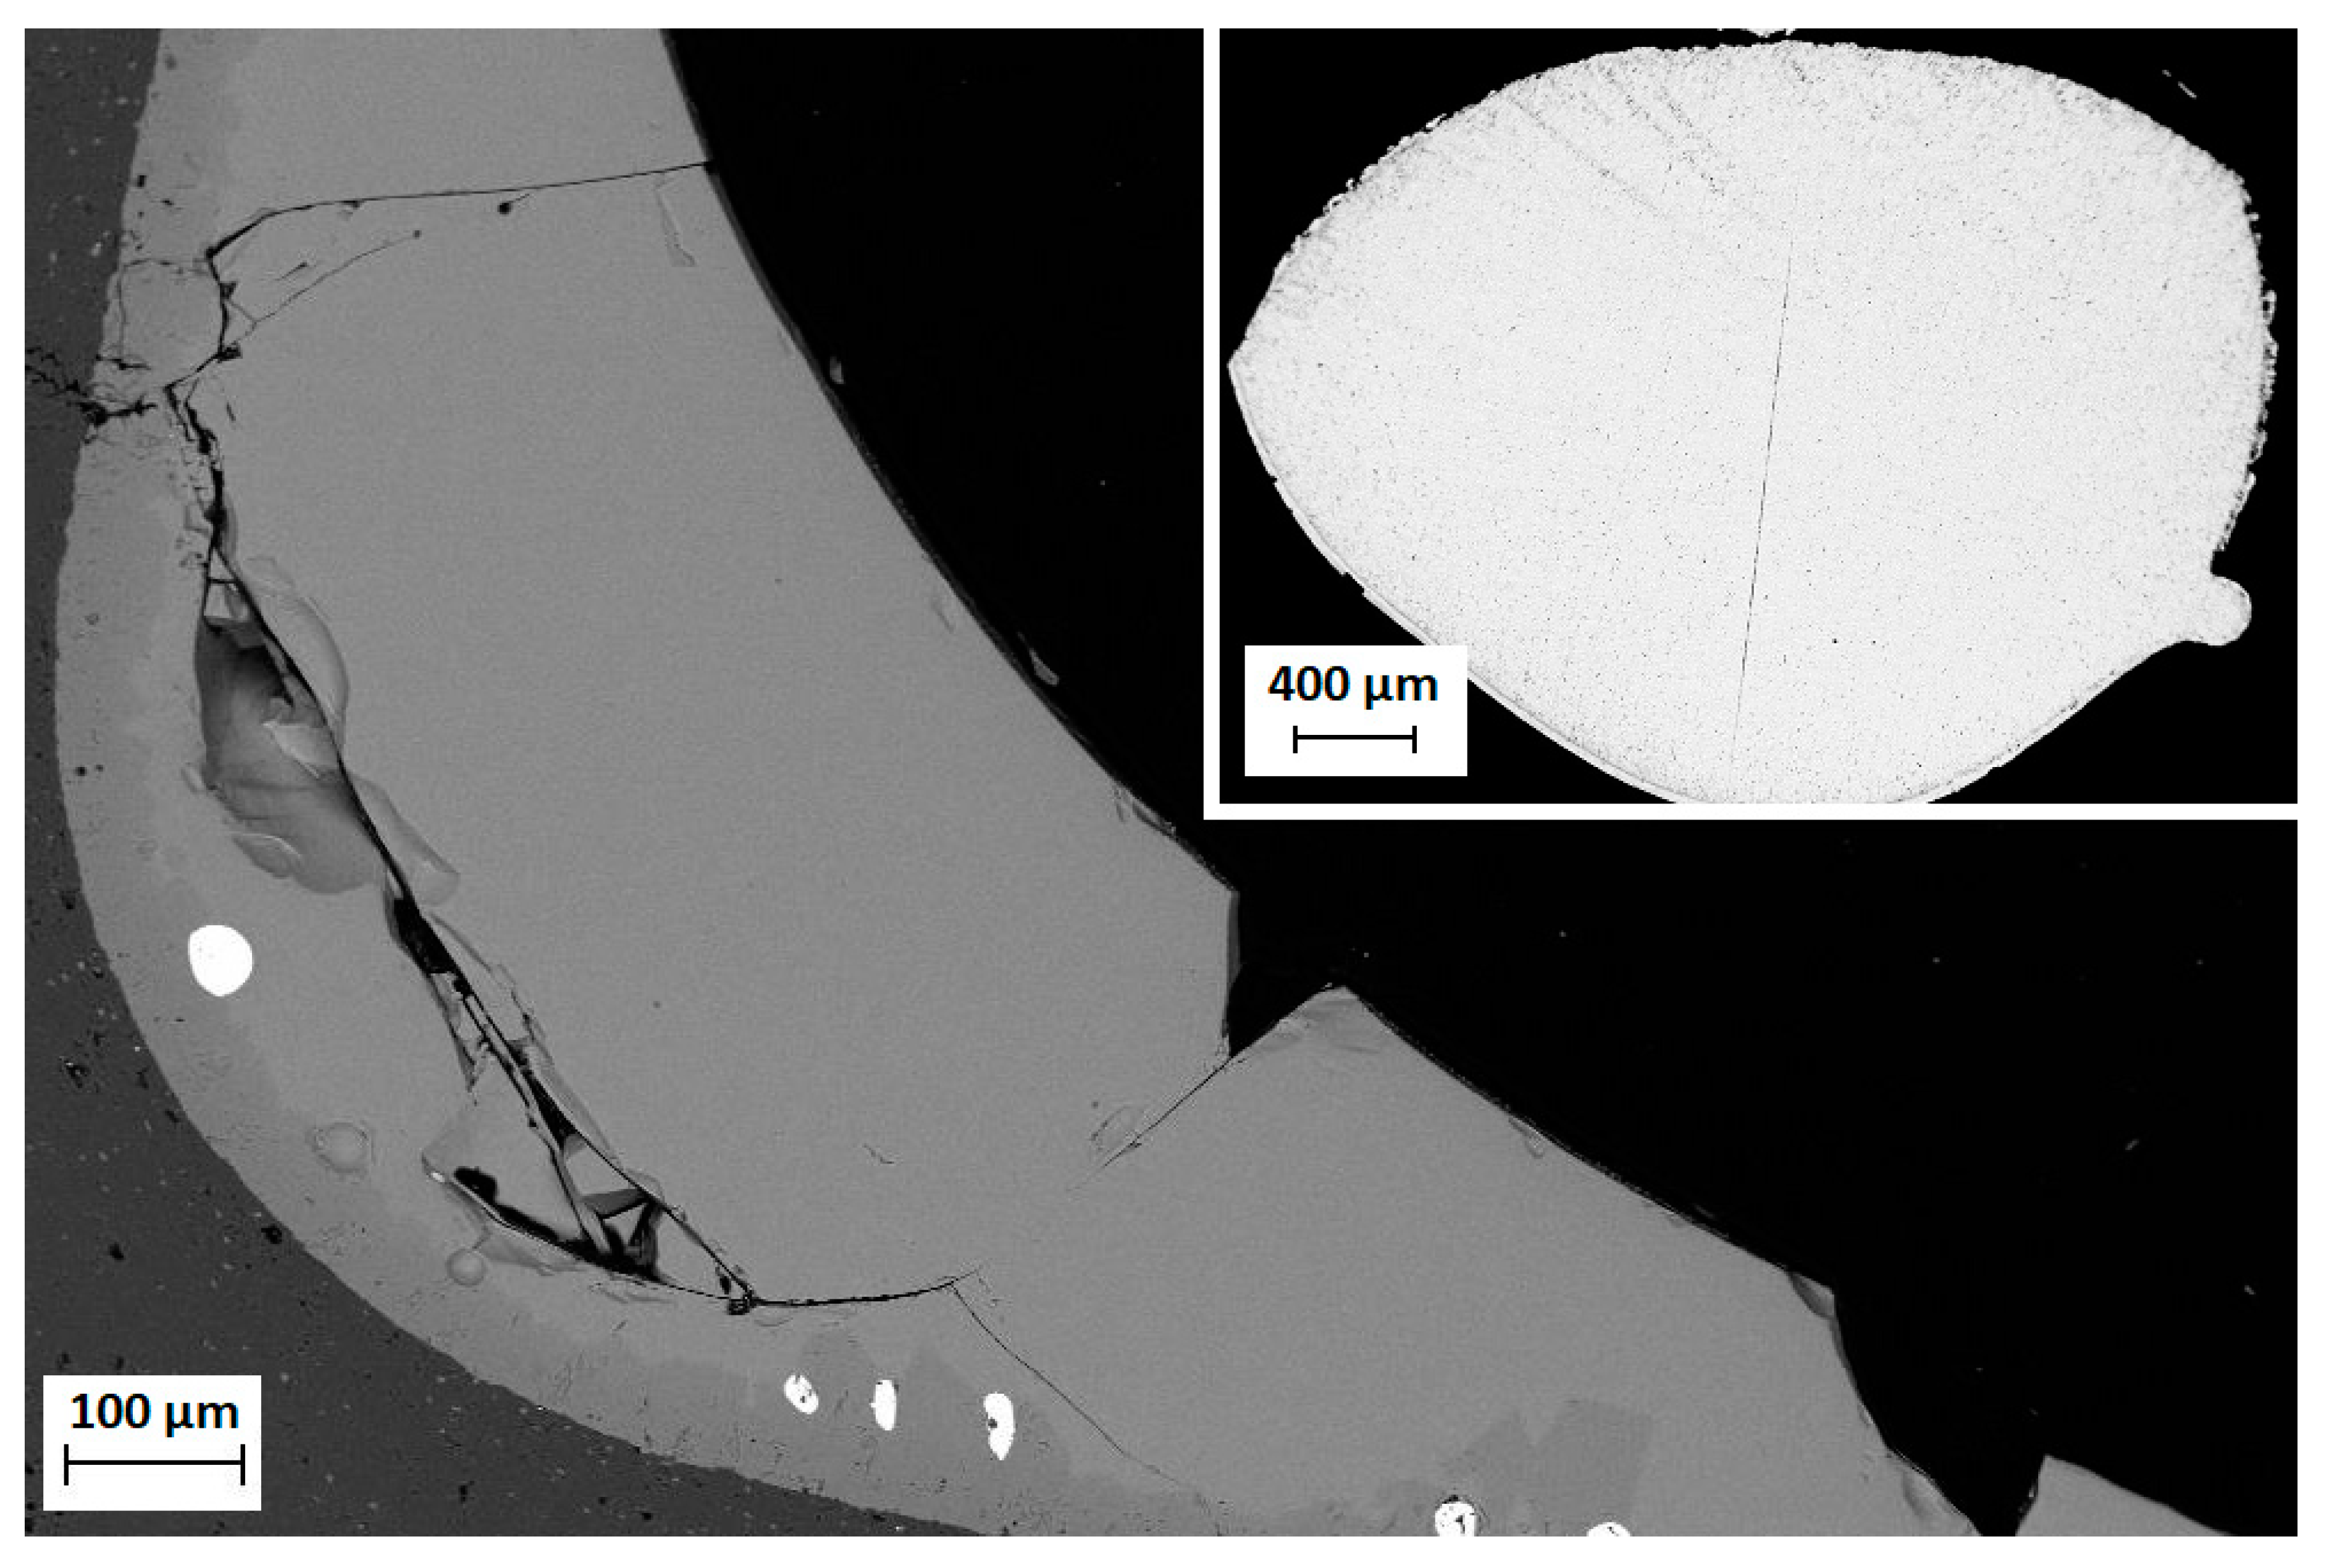
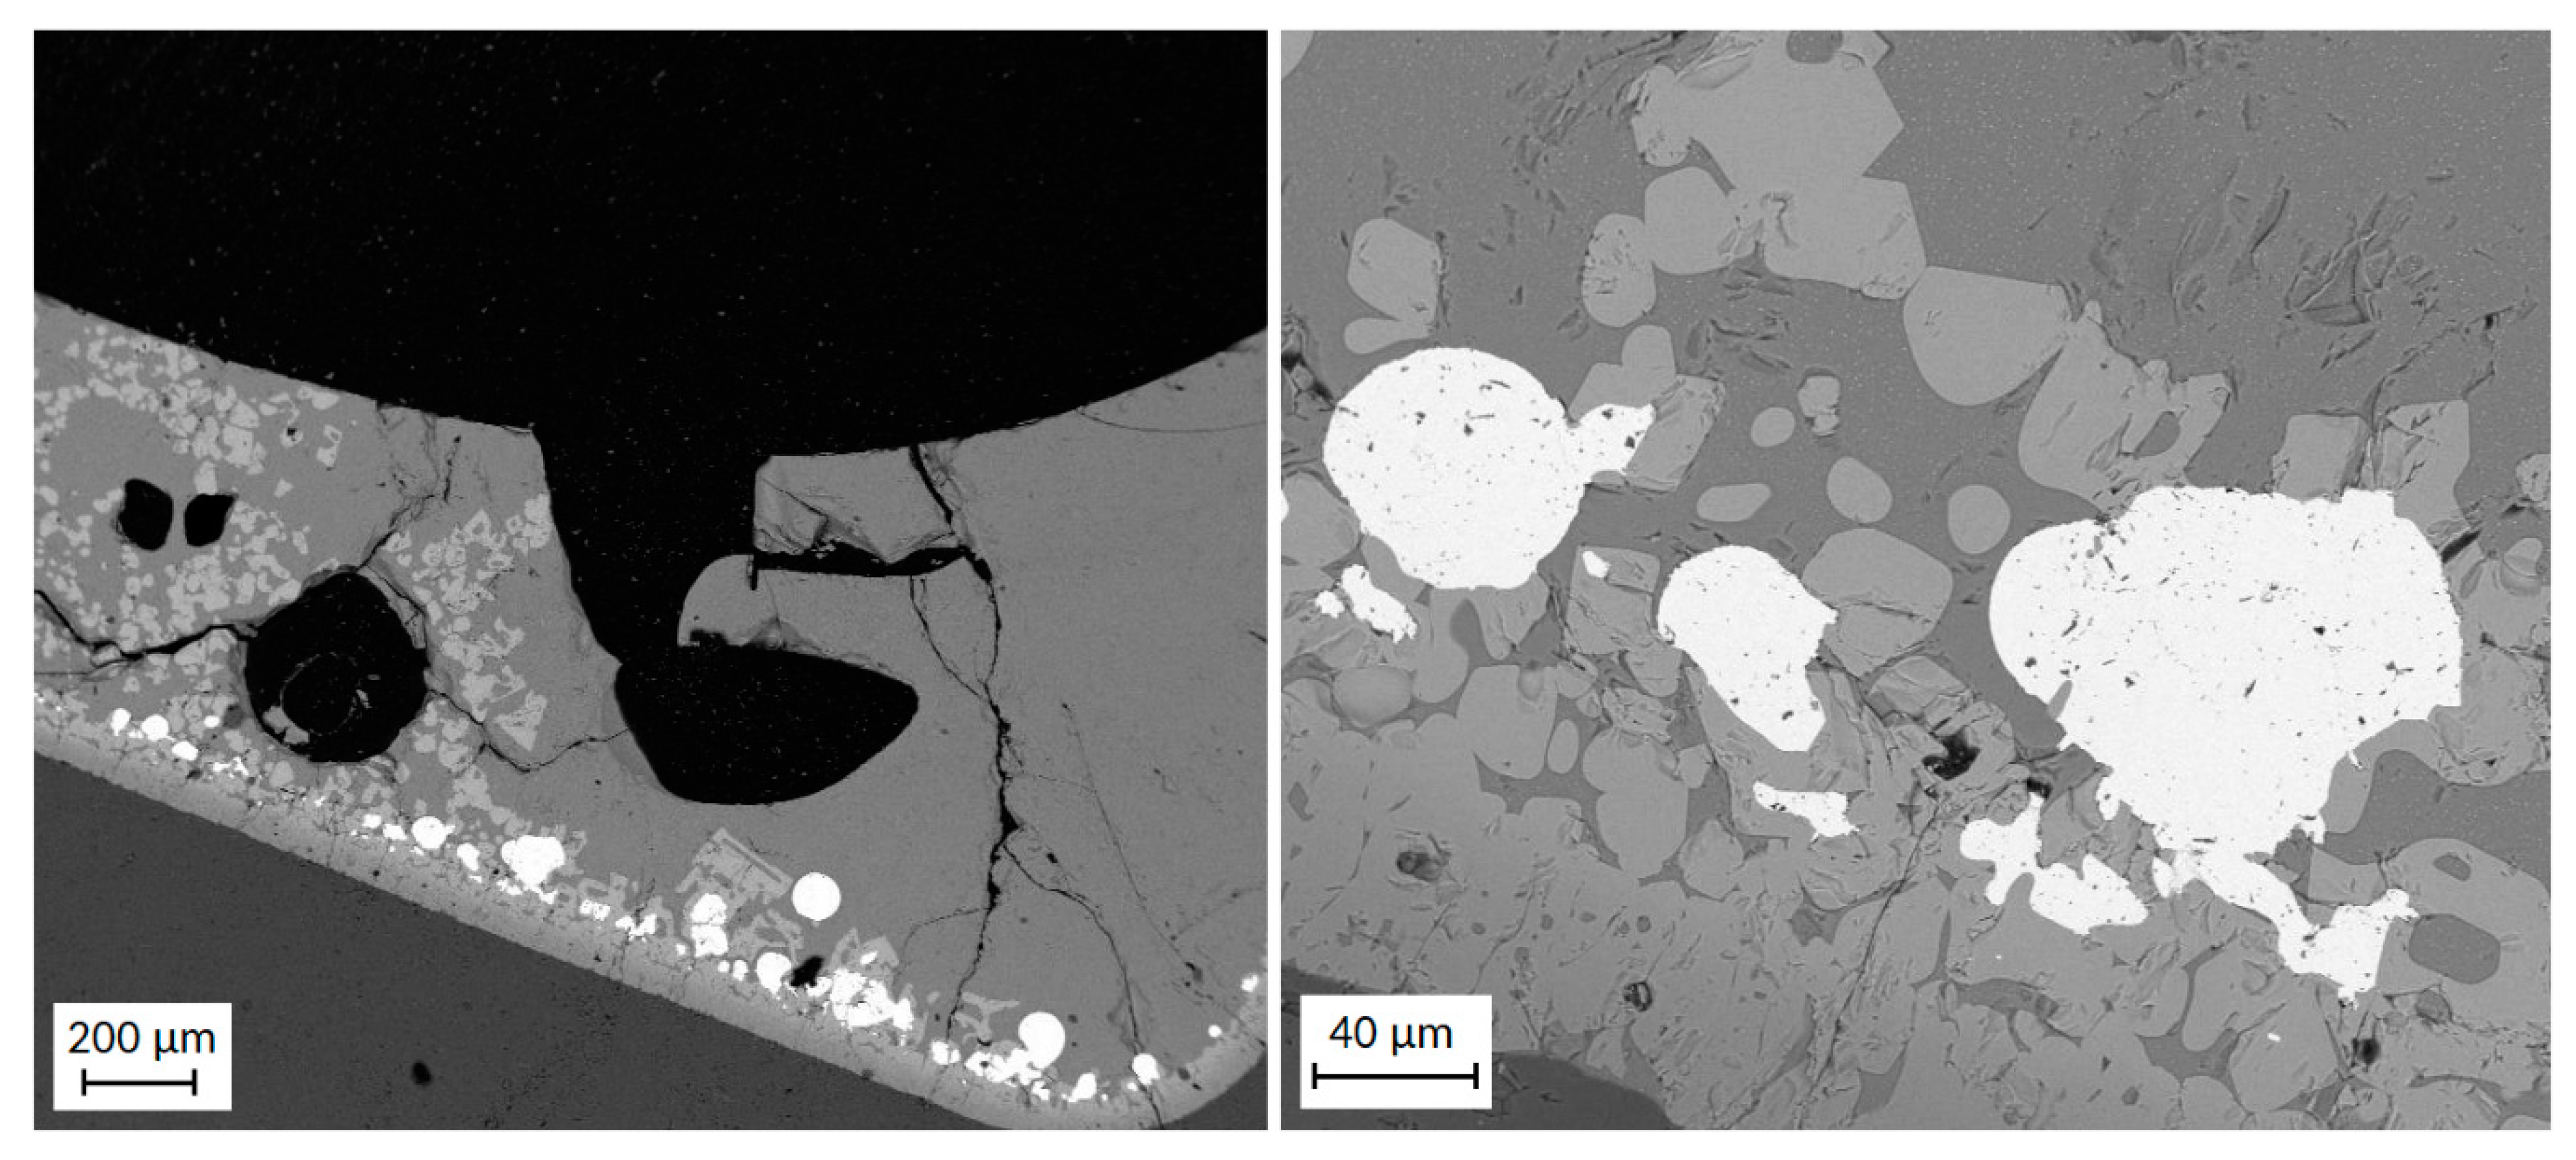
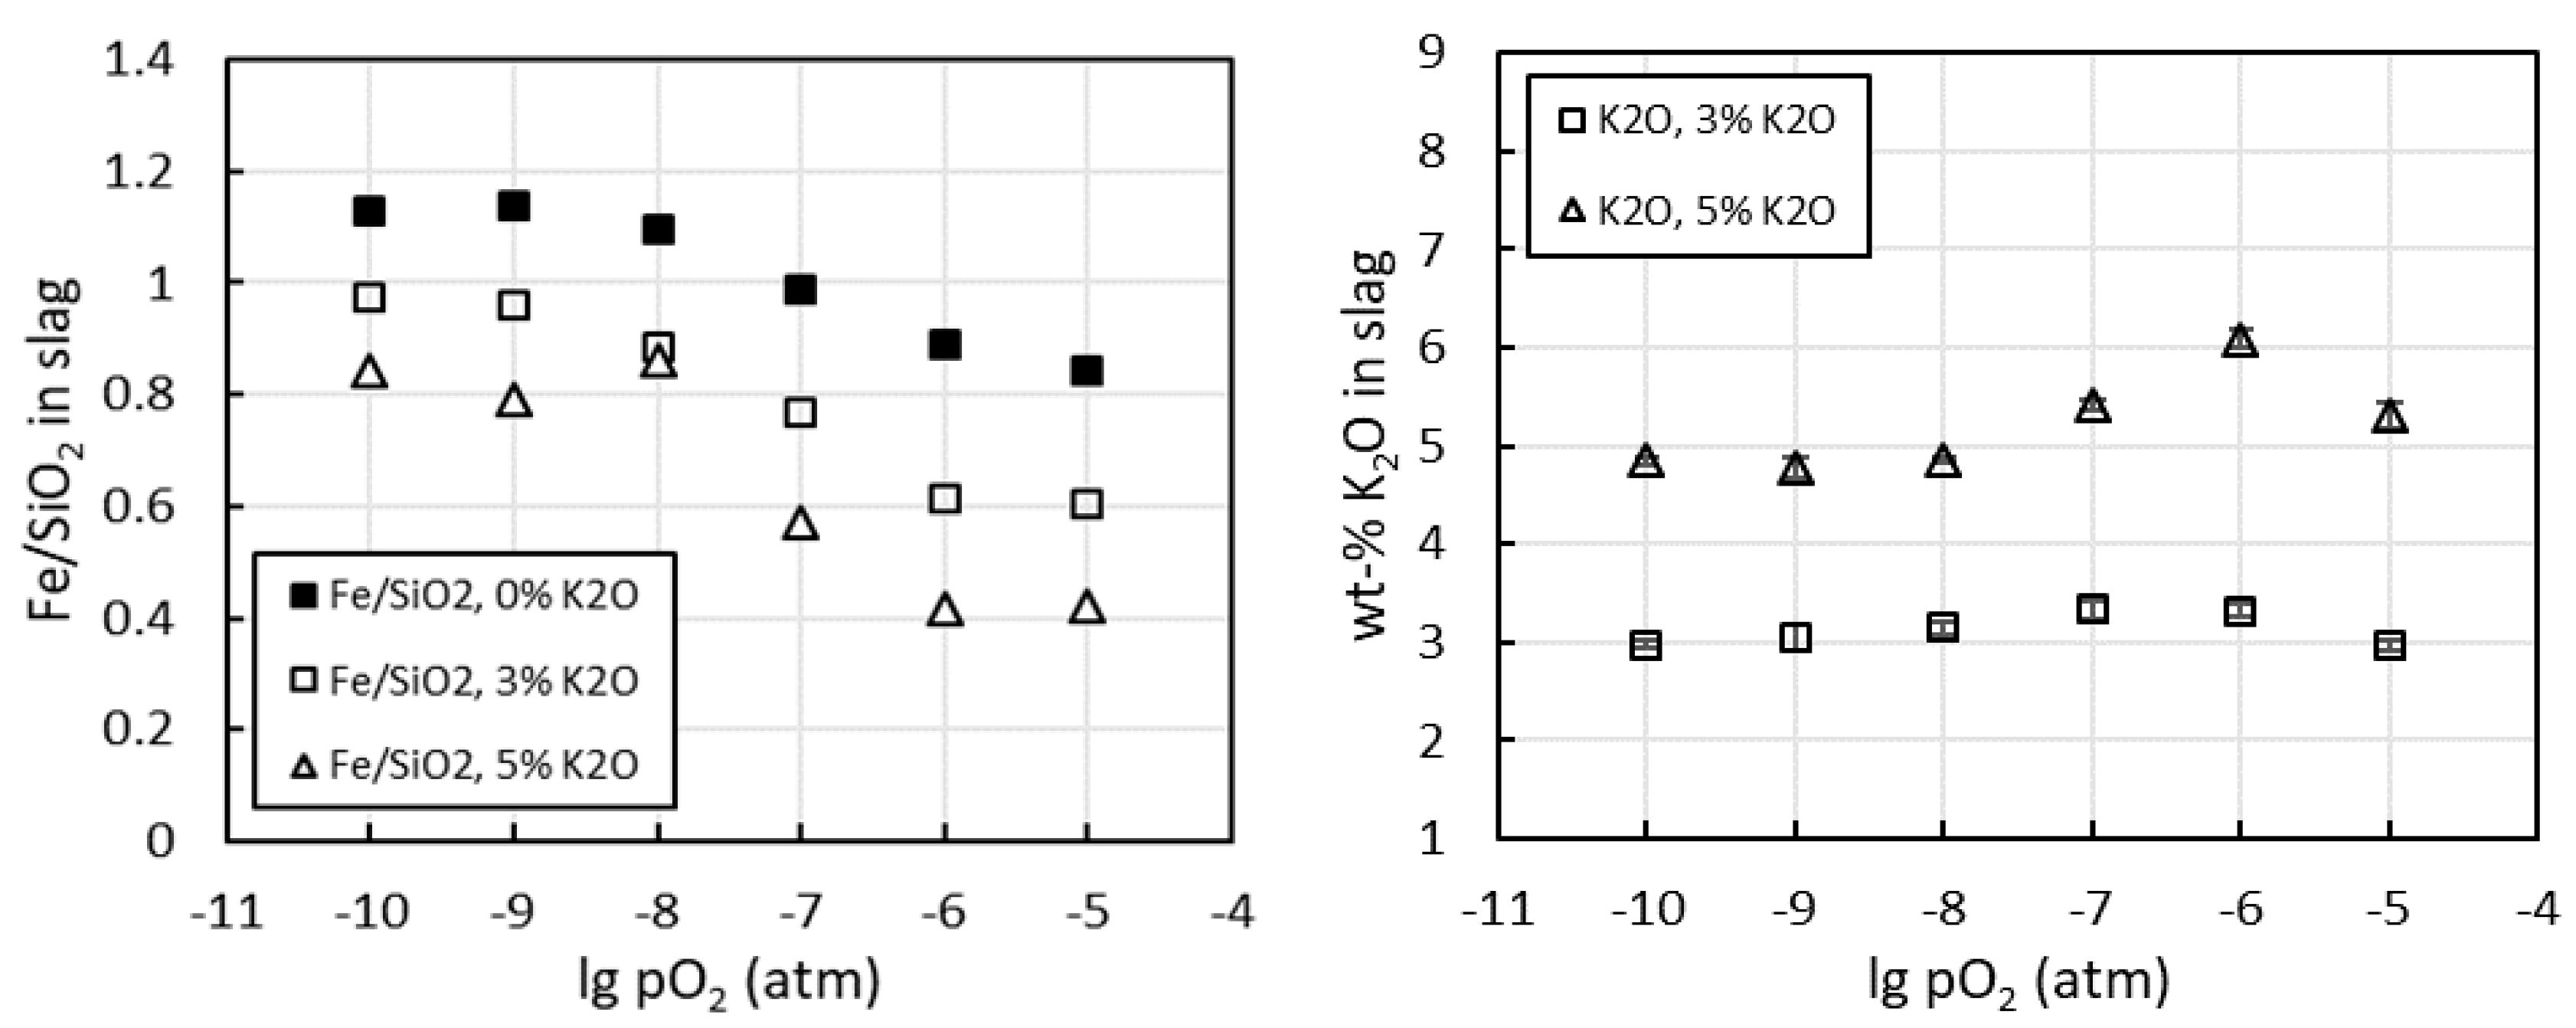
A vertical tube furnace (RHTV 120‒150/18, Nabertherm, Lilienthal, Germany) equipped with MoSi2 heating elements, Nabertherm P310 temperature controller and an alumina work tube (impervious pure alumina, 45/38 mm OD/ID), was used for the laboratory scale copper alloy–slag–gas equilibration experiments. Temperature measurement was performed with a calibrated Pt/Pt10Rh thermocouple (Johnson-Matthey, London, UK, accuracy ±3 °C; calibrated by the manufacturer according to ITS-90 standard, using the melting temperatures of palladium in air and gold as reference points), which was located next to the sample and connected to a Keithley 2010 DMM multimeter (Keithley, Solon, OH, USA; calibrated by the manufacturer). Cold junction compensation was performed by a Pt100 resistance thermometer (SKS-Group, Vantaa, Finland, accuracy class 1/10 B; calibrated in 0 °C ice-water mixture), connected to a Keithley 2000 DMM multimeter (Keithley, Solon, OH, USA; calibrated by the manufacturer). The desired oxygen partial pressures inside the furnace work tube were obtained with CO-CO2 gas mixture, with a total flow rate of 300 mL/min (NTP). A schematic of the furnace set-up is presented in Figure 1, and the full list of experiments as well as corresponding gas flows have been collected in Appendix A, Table A1.
The copper alloy and slag mixtures were prepared from pure powders. The copper alloy was mixed of copper (99.999%, Alfa Aesar, Kandel, Germany) with 1 wt % of Ni (99.996%, Alfa Aesar), Sn (99.85%, Alfa Aesar), Sb (99.9%, Alfa Aesar), and Te (99.99%, Alfa Aesar). The slag, with an initial Fe/SiO2 ratio of 1.3, was mixed of SiO2 (99.99%, Umicore, Balzers, Liechtenstein) and Fe2O3 (99.99%, Alfa Aesar). Approximately 3 and 5 wt % of K2O (initially as K2CO3, 99.5%, Sigma-Aldrich, St. Louis, MO, USA) were added to the second and third slag mixture, respectively, for investigating the effect of potassium oxide on the equilibrium system. The K2CO3 addition was kept constant throughout the oxygen partial pressure range. 200 mg of both copper alloy and slag mixtures were weighed into small alumina crucibles (Frialit AL23, Friatec, Mannheim, Germany, 8/15 mm ID/H, respectively), which were suspended in the furnace hot zone by a platinum wire and a platinum basket. The powder mixtures melted and reacted with the crucible, resulting in iron-alumina spinel saturation. After equilibration, the samples were rapidly quenched into ice-water mixture by pulling the platinum wire from the top of the furnace. The quenching vessel (Figure 1) was placed so that no air entered into the furnace work tube during the few seconds between removing the rubber cork and quenching the sample. The sufficiency of the selected 16-h equilibration time was confirmed with time series experiments of 8, 16 and 24 h at 10−6 atm oxygen partial pressure. Duplicate experiments were conducted for 0 and 3 wt % K2O-containing slags in the pO2 range of 10−9–10−6 atm for reliability, and these results have been included in the calculation of average values and standard deviations in the result Figures and Table A2, Table A3 and Table A4. This article focuses only on the behavior of tin and antimony. Observations regarding the behavior of nickel have been presented before [45].
After equilibration and quenching, the samples were cut in half and mounted in epoxy resin. Grinding and polishing were performed using traditional dry polishing techniques. SEM-EDS (LEO 1450 scanning electron microscope, Carl Zeiss AG, Oberkochen, Germany, and X-Max 50 mm2 energy dispersive spectrometer, Oxford Instruments, Oxford, UK) was used for determining phase homogeneity and obtaining micrographs. After SEM-EDS, the accurate phase compositions were analyzed directly, phase-by-phase (copper alloy, liquid slag, solid spinel), with EPMA (SX-100 electron microprobe equipped with five wavelength dispersive spectrometers, Cameca SAS, Gennevilliers, France). Eight analysis points were randomly selected from each phase for statistical reliability, and PAP-ZAF matrix correction procedure [46] was employed for raw data processing. An accelerating voltage of 20 kV, a beam current of 60 nA, and a defocused electron beam (100 µm for copper alloy, 50–100 µm for liquid slag, and 1 µm for solid spinel) were employed. The standards utilized in EPMA analyses were hematite (O Kα and Fe Kα), quartz (Si Kα), sanidine (K Kα), tin (Sn Lα), antimony telluride (Sb Lα for copper and spinel, Sb Lβ for slag), alumina (Al Kα for spinel, Al Kβ for copper and slag), and copper (Cu Kα). The average concentrations of Cu, Sn and Sb in copper alloy phase have been collected in Table A2. The average concentrations of Fe, Si, Cu, Al, K, Sn and Sb in slag and spinel phases have been presented in Table A3 and Table A4, respectively.
The detection limits of EPMA (Table 1) were low enough to measure the concentration of tin in copper alloy in all experimental conditions, and in slag in the oxidative side of the oxygen partial pressure range investigated. However, in reducing conditions, the measured concentration values in the slags were very close or even below the detection limits. For antimony, the concentrations in slags below 10−6 atm pO2 were close, or, in the most reducing conditions, significantly below the detection limits. Therefore, LA-ICP-MS (laser ablation–inductively coupled plasma–mass spectrometry) technique was also employed for trace element analysis from the slag phase. A Photon Machines Analyte Excite 193 nm ArF laser ablation machine (Teledyne CETAC Technologies, Omaha, NE, USA) coupled with an ICP-MS device Nu AttoM SC-ICP-MS (Nu Instruments Ltd., Wrexham, UK) was used. The laser spot size was selected as 85 µm, and the energy was set to 30% of 5.0 mJ, resulting in a fluence of 2.5 J/cm2 on the sample surface. The pulse frequency was 10 Hz with 4 ns laser pulses. The mass spectrometer was operated in FastScan mode in low resolution (ΔM/M = 300) for higher sensitivity. An analysis procedure of 5 preablation pulses, 15-s pause, 15-s gas background analysis, and 400 ablation pulses was adopted.
NIST 612 SRM (standard reference material) [47] was used as the external standard and Si concentration from EPMA (measured with 29Si in LA-ICP-MS) as the internal standard during the analyses. NIST 610 SRM, USGS BHVO-2G and BCR-2G reference materials were analyzed as unknowns for monitoring analysis accuracy. The obtained data from the mass spectrometer was analyzed with GLITTER software (ARC National Key Centre for Geochemical Evolution and Metallogeny of Continents (GEMOC) and CSIRO Exploration and Mining, Australia; version 4.4.4) [48]. The LA-ICP-MS detection limits for tin and antimony isotopes used for calculations (117,118,120Sn, 121,123Sb) have been collected in Table 1.

3. Results

The equilibrated-quenched samples consisted of three phases; liquid slag, solid iron-alumina spinel and liquid copper alloy. A backscattered electron (BSE) micrograph of sample V15 (pO2 10−8 atm) is shown in Figure 2. In this oxygen partial pressure, the spinel phase was formed only as a uniform layer at the crucible-slag interface, trapping also some smaller copper alloy droplets. The shape of these droplets seemed to adapt locally to the shape of the surrounding solid spinel phase, more clearly illustrated in Figure 3. DeWilde et al. [49,50] have closely investigated this phenomenon of copper droplets sticking to different types of spinels, and they concluded that this complex phenomenon is influenced by the slag-alloy-spinel composition and the oxygen potential. According to their findings, copper alloy droplets only attach to iron-rich spinels (and not aluminum-rich ones). In our study, the spinel phase contained more iron than aluminum in every oxygen pressure, and the fraction of iron increased as the oxygen pressure increased [45]. Correspondingly, according to SEM micrographs (comparison between Figure 2 and Figure 3), the number of entrained copper droplets also seemed to increase, supporting the findings of DeWilde et al. At higher oxygen pressures, some larger spinel grains became loose from the edge spinel structure and floated within the liquid slag, as shown in Figure 3. These spinel grains also trapped small and medium-size copper alloy droplets, hindering their sedimentation and coalescence. The composition and formation of the spinel phase as a function of time has been discussed previously [45]. Rämä et al. [51] also observed similar copper alloy–spinel interactions in experiments related to pyrometallurgical treatment of jarosite residue.
In this study, all the alumina dissolved in the slag and spinel originated from the alumina crucible. The final alumina concentration in the slag phase remained relatively constant at 17–19 wt % [45], regardless of the potassium oxide concentration shown in Figure 4 right side, and the oxygen partial pressure. However, the Fe/SiO2-ratio changed dramatically as a function of oxygen partial pressure and K2O concentration, as depicted in Figure 4 left side. The initial ratio was 1.3, but this was reduced even down to 0.4 in the most oxidizing conditions, with 5 wt % K2O containing slag. The decrease can be attributed to the formation of the spinel phase, which consumed part of the iron. As the iron enrichment in the spinel increased with increasing oxygen partial pressure, the Fe/SiO2 ratio of the slag decreased correspondingly. In addition, the liquid domain and slag boundaries changed significantly as copper solubility in the slags increased in more oxidizing conditions [25]. The difference between the different slags was due to the change in the activity coefficient of iron, caused by the addition of basic potassium oxide.
The concentrations of tin and antimony in copper alloy phase are presented in Figure 5. In the most reducing conditions, at pO2 10−10–10−9 atm, the concentration of tin in copper alloy was close to the initial concentration, i.e., tin was strongly distributed into the copper alloy. As the conditions became more oxidizing, tin started to oxidize and deport into the slag phase as well. Antimony behaved differently, as its concentration in copper alloy remained virtually unchanged between 10−10–10−6 atm oxygen partial pressure. Only in the most oxidizing conditions of this study, its concentration began to decrease. Contrary to an earlier study using silica crucibles [26], the vaporization of tin was not very significant. Notable vaporization was observed only in the most oxidizing conditions of this study, corresponding to the converting stage of secondary copper smelting. The addition of potassium oxide into the slag did not have a systematic effect on the concentration of either trace metal in copper alloy post quenching.
Figure 6 illustrates the concentration of the two trace elements in slag as a function of oxygen partial pressure. LA-ICP-MS results were used below 10−8 atm for tin and below 10−6 atm for antimony. As the oxygen pressure increased, the concentrations of both tin and antimony in the slag increased as well. Potassium oxide addition seemed to decrease the concentration of tin in the slag slightly, similarly as for nickel in the same system [45]. For antimony, this effect was not as clear.
The concentrations of tin and antimony in the iron-alumina spinel phase were not analyzed with LA-ICP-MS due to the small size of the spinel areas. According to EPMA data, approximately 200 ppmw (no K2O)–1200 ppmw (5 wt % K2O) tin deported into the spinel in the most oxidizing conditions, and the amount decreased with decreasing oxygen pressure. This is in fair agreement with the solubility values obtained by Avarmaa et al. [25]. For antimony, the concentrations were even lower, close or below the detection limits of EPMA. Considering the concentrations of both elements in copper and slag phases, their losses into the spinel phase were minor.
The effect of potassium oxide on the solubility of copper into the slags is not graphically shown in this article, but the numerical values have been collected in Table A3. Potassium oxide had a clear effect on the copper losses into the slag, most notably in the highest oxygen partial pressure investigated, as the copper concentration decreased from approximately 21 wt % in K2O-free slag to approximately 14 wt % in 5 wt % K2O-containing slag.

4. Discussion

The behavior of a trace element in the experimental system under investigation can be described with the distribution coefficient. This thermodynamic parameter illustrates how an element [Me] is distributed between two phases in the system, in this case copper and slag. In sulfur-free systems, a typical equilibrium reaction is dissolution of the element [Me] into the slag phase as an oxide. Considering this oxidation reaction, the distribution coefficient can be defined according to Equation (1), and in logarithmic form according to Equation (2) [52]:
L(copper/slag) [Me] = [wt % Me]copper/(wt % Me)slag = [nT](γMOx)/K(nT)[γM]pO2x/2
lgL(copper/slag) [Me] = −x/2 lgpO2 + lgC
where [ ] and ( ) brackets refer to metal and slag phases, respectively, and C includes the thermodynamic constants K, nT and γ (equilibrium constant of the aforementioned oxidation reaction, number of moles in 100 g of alloy and slag, and the activity coefficients of the investigated metal and its oxide form). Equation (2) proves extremely useful when plotting logarithm of the distribution coefficient as a function of logarithm of the oxygen pressure. Using this plot, the oxidation state of the element in the slag phase can be determined from the slope of a trend line fitted to the experimental result points.
This aforementioned distribution coefficient plot is drawn in Figure 7 for tin and in Figure 8 for antimony, with the results of some earlier studies for comparison. For tin, a value of approximately 60 was obtained in reducing experimental conditions (for slag without K2O), indicating a 60-fold concentration of tin in copper alloy phase compared to slag phase. As the conditions changed towards more oxidative, the concentration decreased in copper and increased in slag, and around pO2 10−6 atm, tin was distributed evenly between the two phases. Potassium oxide addition had clearly an increasing effect on the value of the distribution coefficient (more than 40% higher value at 10−10 atm pO2), indicating a better recovery of tin into the copper phase. The slopes of trend lines fitted to the experimental points were between −0.53 and −0.51, which correspond to an oxidation degree of Sn2+, i.e., dissolution into the slags as SnO. The obtained distribution coefficient values, as well as the oxide form are in fairly good agreement with previous publications [19,20,21,22,23,24,25,26,27] as far as relevant comparisons can be made. A comparison with the results obtained by Avarmaa et al. [27] with pure iron-silicate slag shows that saturating the slag with alumina does not have a very significant effect on the value of the distribution coefficient. Some researchers have suggested that with certain slags around 10−8 atm pO2, the slope of the trend line would change, corresponding to a change in the oxide form from SnO in reducing conditions to SnO2 in oxidizing process stages [21,24]. No evidence of such a change was found in this study with high-alumina iron silicate slags, with or without the addition of basic K2O.
For antimony (Figure 8), the distribution coefficient in reducing conditions was approximately two orders of magnitude higher (6500 with K2O-free slag and 11,000 with 5 wt % K2O-containing slag in pO2 10−10 atm) than for tin, and one order of magnitude higher in the oxidative side. The effect of K2O was notable for antimony as well. The slopes of the trend lines were between −0.76 and −0.66, corresponding to an oxidation state of Sb3+ and dissolution into slags as Sb2O3 (or SbO1.5 in monocationic form). The absolute values of distribution coefficients, as well as the dissolution form based on our results, correspond well with the observations of some earlier studies with calcium ferrite [21] and pure iron silicate slags [43]. The experimental distribution coefficient values from Hidayat et al. [43] overlap with our values obtained for slags without K2O in oxygen pressures below 10−7 atm, and are slightly lower in higher oxygen pressures. It can therefore be concluded that the addition of approximately 18 wt % alumina into iron-silicate slag had only a minor effect of the distribution behavior of antimony.
Some researchers have also reported considerably less negative slopes, above −0.38 [39,40]. The results of these studies may have been affected by the large sample size that slows the equilibration process, as explained by Hidayat et al. [43]. The independency of the distribution coefficient of antimony on the oxygen pressure, reported in [22,38,41], is likely due to the inadequate detection limits of the analysis techniques used and the possibly incomplete phase separation prior to analyses.
Figure 9 shows a comparison regarding the concentrations of tin and antimony in slags, analyzed with EPMA and LA-ICP-MS techniques. As the figure indicates, LA-ICP-MS gave quite systematically lower results when the concentrations increased, which is due to the selection of a standard reference material. NIST 612 SRM [47] is perhaps the best commercially available choice for trace and ultra-trace element analysis from metallurgical slags with laser ablation, as it is a silicate (high concentration of silica, as is in our samples) and it has tens of different trace elements added. Therefore, it can be used as an external standard in the determination of concentrations of most trace elements of interest for metallurgists. One downside, however, is the possible interferences caused by the large number of trace elements, which can sometimes be corrected for by employing a correction factor [53].
The NIST 612 SRM contains approximately 39 ppmw tin and 35 ppmw antimony [47]. When the concentrations of these elements become high enough in the unknown samples, the extrapolation becomes so significant that it inevitably leads to reduced accuracy, as depicted in Figure 9. In this work, the purpose was to measure the trace element concentrations in the slag phase as reliably as possible throughout the entire concentration range. NIST 612 SRM is ideal for determining the low concentrations of tin and antimony in the slag in reducing conditions (numerical values in Table A3). For the more oxidizing conditions, i.e., higher trace element concentrations in slags, EPMA data was utilized. EPMA and LA-ICP-MS analysis results can be used as validation for each other in the concentration range suitable for the selected standard reference materials, however, in general, these techniques should not be considered as alternatives, but as complementary. LA-ICP-MS is perhaps the only technique for reliable analysis of ultra-trace concentrations (<100 ppbw: parts per billion by weight) directly from solid samples. With different commercially available or in-house standard reference materials, matched to the matrix of the unknown samples as well as possible, it also performs extremely well in trace or even minor element concentration range. In this work, the limits of quantification, i.e., the concentrations that can be reported reliably [23], of EPMA for tin and antimony were in the order of 400 ppmw, and therefore EPMA data was used above this concentration.

5. Conclusions

As the amount of electronic waste produced in the world is increasing rapidly, suitable and efficient recycling processes for this waste must be investigated and developed, as well as accurate experimental data obtained regarding the behavior of different elements in the processes. In this study, the behavior of tin and antimony was experimentally studied in secondary copper smelting conditions. The experimental system was comprised of gas–copper alloy–spinel saturated iron silicate slag with 0–5 wt % K2O. The distribution coefficient between copper and slag increased for both metals as a function of decreasing oxygen partial pressure. Potassium oxide addition also increased the value of the copper-slag distribution coefficient, indicating a better recovery of the trace metals into the copper alloy phase, where they can be recovered in later process stages by vaporization into flue dusts or anode slime treatment for example. Therefore, it can be concluded that, when considering the recovery of tin and antimony, the presence of alkali metal oxides (for example Na2O or K2O) in the industrial process should have a desirable effect. In oxidizing conditions, a significant part of tin was vaporized into the gas phase, highlighting the importance of trace metal recovery from the off-gases of different process stages.
If considerable amount of solid phases, such as different types of spinels, form during the industrial process, notable losses of copper and consequently trace elements into the slag may occur through mechanical entrainment of copper droplets. Therefore, as is well known in the industry, the formation of solid phases should be minimized; everything that is fed in should be tapped out. For reliable and accurate characterization of (ultra-)trace and minor element concentrations directly in each phase, EPMA together with LA-ICP-MS provides a powerful solution. These techniques should not be considered as alternatives, but as complementary, providing reliable data from ultra-trace concentrations all the way to major element composition.

Author Contributions

Conceptualization, L.K., P.T. and A.J.; methodology, L.K., K.A. and P.T.; software, L.K., H.O.; validation, L.K., K.A., H.O. and P.T.; formal analysis, L.K.; investigation, L.K., H.O.; resources, A.J.; writing—original draft preparation, L.K.; writing—review and editing, K.A., H.O., A.J. and P.T; visualization, L.K.; supervision, A.J.; funding acquisition, L.K. and A.J.

Funding

A research grant from the Finnish Steel and Metal Producers’ Fund (L.K.) has enabled this work. The authors also acknowledge the financial support from Business Finland through CMEco project.

Acknowledgments

This study utilized the Academy of Finland’s RawMatTERS Finland Infrastructure (RAMI) based at Aalto University. The work of Lassi Pakkanen from Geological Survey of Finland in conducting the EPMA analyses is greatly appreciated.

Conflicts of Interest

The authors declare no conflicts of interest. The funders had no role in the design of the study; in the collection, analyses, or interpretation of data; in the writing of the manuscript, or in the decision to publish the results.

Appendix A

Table A1. List of experiments and experimental conditions. Temperature was kept constant at 1300 °C.
Sample IDSlagpO2 (atm)CO (mL/min)CO2 (mL/min)Equilibration Time (hours)
V3 13 wt % K2O10−64.1295.98
V1 13 wt % K2O10−64.1295.916
V2 13 wt % K2O10−64.1295.924
V25no K2O10−51.3298.716
V12, V13no K2O10−64.1295.916
V11, V14no K2O10−712.6287.416
V15, V18no K2O10−836.6263.416
V16, V19no K2O10−991.5208.516
V39no K2O10−10174.4125.616
V83 wt % K2O10−51.3298.716
V7, V103 wt % K2O10−64.1295.916
V6, V93 wt % K2O10−712.6287.416
V21, V233 wt % K2O10−836.6263.416
V20, V243 wt % K2O10−991.5208.516
V223 wt % K2O10−10174.4125.616
V265 wt % K2O10−51.3298.716
V385 wt % K2O10−64.1295.916
V285 wt % K2O10−712.6287.416
V355 wt % K2O10−836.6263.416
V305 wt % K2O10−991.5208.516
V315 wt % K2O10−10174.4125.616
1 Time series experiments.
Table A2. Concentrations of copper, tin and antimony in copper alloy phase. All results are from EPMA, in wt %.
Copper Alloy Phase
0% K2Owt %
lg pO2 (atm)CuSnSb
−596.660.060.70
−696.690.201.05
−797.140.301.00
−895.310.571.15
−995.430.811.11
−1094.920.830.97
3% K2Owt %
lg pO2 (atm)CuSnSb
−597.470.060.72
−696.890.190.94
−796.450.451.12
−896.180.651.00
−995.660.771.01
−1096.110.760.92
5% K2Owt %
lg pO2 (atm)CuSnSb
−594.960.110.91
−695.080.191.15
−795.070.581.05
−895.130.640.97
−993.950.901.20
−1093.711.061.26
Table A3. Concentrations of iron, silicon, copper, aluminum, potassium, tin and antimony in slag phase. The concentrations of tin and antimony are shown in ppmw. LA-ICP-MS results have been used below 10−8 atm oxygen partial pressure for tin, and below 10−6 atm for antimony.
Slag Phase
0% K2Owt %ppmw
lg pO2 (atm)FeSiCuAlKSnSb
−523.5413.0720.759.42-3641.83652.8
−628.6215.0211.279.64-3195.21136.4
−732.7515.486.379.75-2055.4221.1
−836.1015.423.029.75-823.337.0
−936.6015.041.759.58-349.57.3
−10>36.34>15.051.079.94-134.51.5
3% K2Owt %ppmw
lg pO2 (atm)FeSiCuAlKSnSb
−519.7415.3216.939.472.463487.33870.4
−622.9317.508.899.562.762389.1877.0
−728.5717.394.499.262.771476.4145.0
−832.1216.992.489.352.61731.041.4
−933.6316.391.369.232.54303.78.1
−10>34.57>16.620.939.482.47117.62.5
5% K2Owt %ppmw
lg pO2 (atm)FeSiCuAlKSnSb
−515.8817.6313.819.874.403181.93159.5
−617.2819.489.039.315.052627.81423.4
−723.0918.893.8510.024.481255.9118.4
−829.6516.082.398.414.04740.136.9
−929.1017.171.079.813.97179.53.1
−1030.3116.800.709.924.0295.71.1
Table A4. Concentrations of iron, silicon, copper, aluminum, potassium, tin and antimony in spinel phase. All values are shown in ppmw. The analyses were taken from spinels surrounded by slag whenever possible, i.e., when they formed (above 10−8 or 10−7 atm). <MDL = below minimum detection limit of EPMA.
Spinel Phase
0% K2Owt %
lg pO2 (atm)FeSiCuAlKSnSb
−543.790.032.1420.23-0.02<MDL
−645.010.040.6920.34-0.020.02
−741.670.050.3022.93-<MDL0.03
−838.990.050.1225.87-<MDL<MDL
−935.540.050.1127.73-<MDL<MDL
−1032.710.030.0829.61-<MDL<MDL
3% K2Owt %
lg pO2 (atm)FeSiCuAlKSnSb
−549.420.031.9415.53<MDL0.050.03
−650.500.060.5915.65<MDL0.030.02
−745.510.060.1920.18<MDL<MDL0.02
−840.760.090.1725.000.01<MDL<MDL
−937.290.060.0527.45<MDL<MDL<MDL
−1036.240.060.0529.38<MDL<MDL<MDL
5% K2Owt %
lg pO2 (atm)FeSiCuAlKSnSb
−556.470.091.549.55<MDL0.12<MDL
−660.100.060.707.980.010.10<MDL
−745.070.060.2720.060.03<MDL<MDL
−846.170.080.1718.000.01<MDL<MDL
−935.480.140.0527.610.07<MDL<MDL
−1034.890.070.0428.410.03<MDL<MDL

References

  1. Anindya, A.; Swinbourne, D.; Reuter, M.; Matusewicz, R. Tin distribution during smelting of WEEE with copper scrap. In Proceedings of the European Metallurgical Conference EMC2009, Innsbruck, Austria, 28 June–1 July 2009; GDMB Verlag GmbH: Clausthal-Zellerfeld, Germany, 2009; pp. 555–568. [Google Scholar]
  2. Tsydenova, O.; Bengtsson, M. Chemical hazards associated with treatment of waste electrical and electronic equipment. Waste Manag. 2011, 31, 45–58. [Google Scholar] [CrossRef] [PubMed]
  3. Hense, P.; Reh, K.; Franke, M.; Aigner, J.; Hornung, A.; Contin, A. Pyrolysis of Waste Electrical and Electronic Equipment (WEEE) for recovering metals and energy: Previous achievements and current approaches. Environ. Eng. Manag. J. 2015, 14, 1637–1647. [Google Scholar] [CrossRef]
  4. Kojo, I.V.; Storch, H. Copper production with Outokumpu flash smelting: An update. In Proceedings of the Metals and Materials Volume 8: International Symposium on Sulfide Smelting 2006, San Diego, CA, USA, 27–31 August 2006; pp. 225–238. [Google Scholar]
  5. Vanbellen, F.; Chintinne, M. Extreme makeover—UPMR’s Hoboken plant. In Proceedings of the European Metallurgical Conference EMC2007, Dusseldorf, Germany, 11–14 June 2007; GDMB Verlag GmbH: Clausthal-Zellerfeld, Germany, 2007; Volume 1, pp. 371–380. [Google Scholar]
  6. Woerz, H.; Wallner, J. Copper recycling plant at Brixlegg (Austria). In Proceedings of the Symposium on World Survey of Nonferrous Smelters, Phoenix, AZ, USA, 25–29 January 1988; Taylor, J.C., Traulsen, H.R., Eds.; Metallurgical Society of AIME: Warrendale, PA, USA, 1988; pp. 281–288. [Google Scholar]
  7. Mackey, P.J.; Wraith, A.E. Development of copper quality: An historical perspective. Miner. Process. Extr. Metall. 2004, 113, 25–37. [Google Scholar] [CrossRef]
  8. Cui, J.; Zhang, L. Metallurgical recovery of metals from electronic waste: A review. J. Hazard. Mater. 2008, 158, 228–256. [Google Scholar] [CrossRef] [PubMed]
  9. Khaliq, A.; Rhamdhani, M.A.; Brooks, G.; Masood, S. Metal Extraction Processes for Electronic Waste and Existing Industrial Routes: A Review and Australian Perspective. Resources 2014, 3, 152–179. [Google Scholar] [CrossRef]
  10. Havlik, T.; Orac, D.; Berwanger, M.; Maul, A. The effect of mechanical–physical pretreatment on hydrometallurgical extraction of copper and tin in residue from printed circuit boards from used consumer equipment. Miner. Eng. 2014, 65, 163–171. [Google Scholar] [CrossRef]
  11. Havlik, T.; Orac, D.; Petranikova, M.; Miskufova, A.; Kukurugya, F.; Takacova, Z. Leaching of copper and tin from used printed circuit boards after thermal treatment. J. Hazard. Mater. 2010, 183, 866–873. [Google Scholar] [CrossRef]
  12. Mecucci, A.; Scott, K. Leaching and electrochemical recovery of copper, lead and tin from scrap printed circuit boards. J. Chem. Technol. Biotechnol. 2002, 77, 449–457. [Google Scholar] [CrossRef]
  13. Grimes, S.M.; Yasri, N.G.; Chaudhary, A.J. Recovery of critical metals from dilute leach solutions—Separation of indium from tin and lead. Inorg. Chim. Acta 2017, 461, 161–166. [Google Scholar] [CrossRef]
  14. Takeda, Y.; Yazawa, A.; Chit, P.P.; Ujiie, H. Equilibria between Liquid Tin and FeOx-CaO-SiO2 Slag. Mater. Trans. JIM 1990, 31, 793–801. [Google Scholar] [CrossRef]
  15. Xu, X.; Hayes, P.C.; Jak, E. Phase equilibria in the “SnO”-SiO2-“FeO” system in equilibrium with tin–iron alloy and the potential application for electronic scrap recycling. Int. J. Mater. Res. 2012, 103, 529–536. [Google Scholar] [CrossRef]
  16. Yazawa, A. Thermodynamic Interpretation on Oxidic Dissolution of Metal in Slag. In Proceedings of the Australian Asian Pacific Course and Conference on Pyrometallurgy for Complex Materials and Wastes, Melbourne, Australia, 6–8 June 1994; Nilmani, M., Lehner, T., Rankin, W.J., Eds.; TMS: Warrendale, PA, USA, 1994; pp. 61–72. [Google Scholar]
  17. Grimsey, E.J.; Dawson, P. High Temperature Electrochemical Measurement of Tin Oxide Activity in Slag. Proc. Australas. Inst. Min. Metall. 1983, 286, 15–21. [Google Scholar]
  18. Rankin, W.J. The slag-metal equilibrium in tin smelting. Metall. Trans. B 1986, 17, 61–68. [Google Scholar] [CrossRef]
  19. Anindya, A.; Swinbourne, D.R.; Reuter, M.A.; Matusewicz, R.W. Distribution of elements between copper and FeOx–CaO–SiO2 slags during pyrometallurgical processing of WEEE: Part 1–Tin. Miner. Process. Extr. Metall. 2013, 122, 165–173. [Google Scholar] [CrossRef]
  20. Nagamori, M.; Mackey, P.J. Distribution equilibria of Sn, Se and Te between FeO-Fe2O3-SiO2-AI2O3-CuO0.5 slag and metallic copper. Metall. Trans. B 1977, 8, 39–46. [Google Scholar] [CrossRef]
  21. Takeda, Y.; Ishiwata, S.; Yazawa, A. Distribution equilibria of minor elements between liquid copper and calcium ferrite slag. Trans. Jpn. Inst. Met. 1983, 24, 518–528. [Google Scholar] [CrossRef]
  22. See, J.B.; Rankin, W.J. Copper Losses and the Distribution of Impurities in the Systems FeO-Fe2O3-SiO2-Al2O3-Cu and FeO-Fe2O3-SiO2-Al2O3-CaO-Cu at 1300 °C; National Institute for Metallurgy, process development division: Randburg, South Africa, 1981; 22p. [Google Scholar]
  23. Van den Bulck, A.; Turner, S.; Guo, M.; Malfliet, A.; Blanpain, B. The Distribution of Sn between CaO-CuOx-FeOy-SiO2 Slag and Copper Metal at 1300 °C. In Proceedings of the Extraction 2018, Ottawa, ON, Canada, 26–29 August 2018; Springer: Cham, Switzerland, 2018; pp. 1083–1092. [Google Scholar]
  24. Gortais, J.; Hodaj, F.; Allibert, M.; Welter, J.M. Equilibrium distribution of Fe, Ni, Sb, and Sn between liquid Cu and a CaO-rich slag. Metall. Mater. Trans. B 1994, 25, 645–651. [Google Scholar] [CrossRef]
  25. Avarmaa, K.; Yliaho, S.; Taskinen, P. Recoveries of rare elements Ga, Ge, In and Sn from waste electric and electronic equipment through secondary copper smelting. Waste Manag. 2018, 71, 400–410. [Google Scholar] [CrossRef]
  26. Avarmaa, K.; Taskinen, P. The Influence of Aluminum on Indium and Tin Behaviour during Secondary Copper Smelting. In Proceedings of the Extraction 2018, Ottawa, ON, Canada, 26–29 August 2018; Springer: Cham, Switzerland, 2018; pp. 1061–1071. [Google Scholar]
  27. Avarmaa, K.; Klemettinen, L.; O’Brien, H.; Taskinen, P. The behavior of tin in black copper smelting conditions with different iron-silicate based slags. In Proceedings of the EMC2019, Dusseldorf, Germany, 23–26 June 2019. [Google Scholar]
  28. Dupont, D.; Arnout, S.; Jones, P.T.; Binnemans, K. Antimony Recovery from End-of-Life Products and Industrial Process Residues: A Critical Review. J. Sustain. Metall. 2016, 2, 79–103. [Google Scholar] [CrossRef] [Green Version]
  29. Tostar, S.; Stenvall, E.; Boldizar, A.; Foreman, M. Antimony leaching in plastics from waste electrical and electronic equipment (WEEE) with various acids and gamma irradiation. Waste Manag. 2013, 33, 1478–1482. [Google Scholar] [CrossRef]
  30. Shotyk, W.; Krachler, M.; Chen, B. Contamination of Canadian and European bottled waters with antimony from PET containers. J. Environ. Monit. 2006, 8, 288–292. [Google Scholar] [CrossRef] [PubMed]
  31. Cornelis, G.; Van Gerven, T.; Vandecasteele, C. Antimony leaching from uncarbonated and carbonated MSWI bottom ash. J. Hazard. Mater. 2006, 137, 1284–1292. [Google Scholar] [CrossRef] [PubMed]
  32. McNutt, M.K.; Salazar, K. Mineral Commodity Summaries 2012; U.S. Geological Survey: Reston, VA, USA, 2012; pp. 18–19. ISBN 978-1-4113-3349-9.
  33. European Commission. Report on Critical Raw Materials for the EU: Report of the Ad hoc Working Group on Defining Critical Raw Materials; European Commission, DG Enterprise & Industry: Brussels, Belgium, 2014. [Google Scholar]
  34. Cornelis, G.; Van Gerven, T.; Vandecasteele, C. Antimony leaching from MSWI bottom ash: Modelling of the effect of pH and carbonation. Waste Manag. 2012, 32, 278–286. [Google Scholar] [CrossRef] [PubMed]
  35. Zhang, B.; Li, Q.; Shen, W.; Min, X. Recovery of bismuth and antimony metals from pressure-leaching slag. Rare Met. 2012, 31, 102–106. [Google Scholar] [CrossRef]
  36. Boerrigter, H. Implementation of thermal processes for feedstock recycling of bromine and antimony, with energy recovery, from plastics waste of electrical and electronic equipment (WEEE). In Phase 1: Literature Survey/Status Update, Evaluation, and Ranking of Combustion, Gasification, and Pyrolysis Based Technologies; Energy research Centre of the Netherlands (ECN): Petten, The Netherlands, 2000. [Google Scholar]
  37. Boerrigter, H. Implementation of thermal processes for feedstock recycling of bromine, with energy recovery, from plastics waste of electrical and electronic equipment (WEEE). In Phase 2: Production of Bromine Salt in Staged-Gasification to Determine Technical Feasibility of Bromine Recovery; Energy research Centre of the Netherlands (ECN): Petten, The Netherlands, 2001. [Google Scholar]
  38. Nagamori, M.; Mackey, P.J.; Tarassoff, P. Copper Solubility in FeO-Fe2O3-SiO2-Al2O3 Slag and Distribution Equilibria of Pb, Bi, Sb and As Between Slag and Metallic Copper. Metall. Trans. B 1975, 6B, 295–301. [Google Scholar] [CrossRef]
  39. Goto, S.; Ogawa, O.; Inoue, Y.; Ohara, H. On the Equilibria Between Cu-Sb Alloys and Silica-Saturated Iron Silicate Slags: Behavior of Impurities in Copper Smelting (1st. Report). J. Min. Inst. Jpn. 1979, 95, 205–211. [Google Scholar] [CrossRef]
  40. Jimbo, I.; Goto, S.; Ogawa, O. Equilibria between silica-saturated iron silicate slags and molten Cu-As, Cu-Sb, and Cu-Bi Alloys. Metall. Trans. B 1984, 15, 535–541. [Google Scholar] [CrossRef]
  41. Kim, H.G.; Sohn, H.Y. Effects of CaO, Al2O3, and MgO Additions on the Copper Solubility, Ferric/Ferrous Ratio, and Minor-Element Behavior of Iron-Silicate Slags. Metall. Mater. Trans. B 1998, 29B, 583–590. [Google Scholar] [CrossRef]
  42. Kaur, R.R.; Swinbourne, D.R.; Nexhip, C. Nickel, lead and antimony distributions between ferrous calcium silicate slag and copper at 1300 °C. Miner. Process. Extr. Metall. 2009, 118, 65–72. [Google Scholar] [CrossRef]
  43. Hidayat, T.; Chen, J.; Hayes, P.C.; Jak, E. Distributions of Ag, Bi, and Sb as Minor Elements between Iron-Silicate Slag and Copper in Equilibrium with Tridymite in the Cu-Fe-O-Si System at T = 1250 °C and 1300 °C (1523 K and 1573 K). Metall. Mater. Trans. B 2018. [Google Scholar] [CrossRef]
  44. Yazawa, A. Distribution of various elements between copper, matte and slag. Erzmetall 1980, 33, 377–382. [Google Scholar]
  45. Klemettinen, L.; Avarmaa, K.; Taskinen, P.; Jokilaakso, A. Behavior of nickel as a trace element and time-dependent formation of spinels in WEEE smelting. In Proceedings of the Extraction 2018, Ottawa, ON, Canada, 26–29 August 2018; Springer: Cham, Switzerland, 2018; pp. 1073–1082. [Google Scholar]
  46. Pouchou, J.L.; Pichoir, F. Basic expression of “PAP” computation for quantitative EPMA. In Proceedings of the 11th International Congress on X-ray Optics and Microanalysis ICXOM, London, UK, 4–8 August 1986; Brown, J.D., Packwood, R.H., Eds.; Graphic Services, University of Western Ontario: London, ON, Canada, 1986; pp. 249–256. [Google Scholar]
  47. Jochum, K.P.; Weis, U.; Stoll, B.; Kuzmin, D.; Yang, Q.; Raczek, I.; Jacob, D.E.; Stracke, A.; Birbaum, K.; Frick, D.A.; et al. Determination of Reference Values for NIST SRM 610-617 Glasses Following ISO Guidelines. Geostand. Geoanal. Res. 2011, 35, 397–429. [Google Scholar] [CrossRef] [Green Version]
  48. Griffin, W.L.; Powell, W.J.; Pearson, N.J.; O’Reilly, S.Y. GLITTER: Data Reduction Software for Laser Ablation ICP-MS. In Laser Ablation-ICP-MS in the Earth Sciences: Current Practices and Outstanding Issues; Sylvester, P.J., Ed.; Short Course Series #40; Mineralogical Association of Canada: Quebec, QC, Canada, 2008; pp. 308–311. ISBN 9-0-921294-49-8. [Google Scholar]
  49. De Wilde, E.; Bellemans, I.; Kampforts, M.; Guo, M.; Blanpain, B.; Moelans, N.; Verbeken, K. Investigation of High Temperature Slag/Copper/Spinel Interactions. Metall. Mater. Trans. B 2016, 47, 1–14. [Google Scholar] [CrossRef]
  50. De Wilde, E.; Bellemans, I.; Kampforts, M.; Guo, M.; Vanmeensel, K.; Blanpain, B.; Moelans, N.; Verbeken, K. Study of the Effect of Spinel Composition on Metallic Copper Losses in Slags. J. Sustain. Metall. 2017, 3, 416–427. [Google Scholar] [CrossRef]
  51. Rämä, M.; Nurmi, S.; Jokilaakso, A.; Klemettinen, L.; Taskinen, P.; Salminen, J. Thermal Processing of Jarosite Leach Residue for a Safe Disposable Slag and Valuable Metals Recovery. Metals 2018, 8, 744. [Google Scholar] [CrossRef]
  52. Yazawa, A.; Nakazawa, S.; Takeda, Y. Distribution behavior of various elements in copper smelting systems. In Proceedings of the International Sulfide Smelting Symposium: Advances in Sulfide Smelting, San Francisco, CA, USA, 6–9 November 1983; Volume 1, pp. 99–117. [Google Scholar]
  53. Sylvester, P.J. A Practical Guide to Platinum-group Element Analysis of Sulphides by Laser-ablation ICPMS. In Laser-Ablation in the Earth Sciences: Principles and Application; Sylvester, P.J., Ed.; Short Course Series #40; Mineralogical Association of Canada: Quebec, QC, Canada, 2001; pp. 203–213. ISBN 978-092-12942-9-0. [Google Scholar]
Figure 1. A schematic of the experimental furnace set-up.
Minerals 09 00039 g001
Figure 2. SEM-BSE micrograph of the liquid slag and solid spinel layer in sample V15 (pO2 10−8 atm, no K2O). Large copper alloy droplet (detached from the slag during quenching) is shown in the upper right corner. The dark grey in the bottom left corner is the alumina crucible, the medium grey phase is the edge spinel layer, and the lighter grey is liquid slag phase.
Minerals 09 00039 g002
Figure 3. Left side: SEM-BSE micrograph of sample V38 (pO2 10−6 atm, 5 wt % K2O). Numerous loose spinel grains were observed floating in the liquid slag and the number of sticking copper alloy droplets was much higher compared to Figure 2. Right side: a close-up of the entrained copper droplets in the same sample; the shape of the liquid droplets has adapted to the surrounding solid spinel structure.
Minerals 09 00039 g003
Figure 4. Left side: Fe/SiO2 ratio in slags after equilibration. Right side: K2O concentration in slags as a function of oxygen partial pressure.
Minerals 09 00039 g004
Figure 5. Left side: concentration of tin in copper alloy phase. Right side: concentration of antimony in copper alloy as a function of oxygen partial pressure.
Minerals 09 00039 g005
Figure 6. Left side: concentration of tin in liquid slag phase. Right side: concentration of antimony in slags as a function of oxygen partial pressure. For tin, LA-ICP-MS results were used for oxygen partial pressures below 10−8 atm, and for antimony below 10−6 atm. The concentration of antimony is plotted in logarithmic scale in order show more accurately the low concentrations in reducing conditions.
Minerals 09 00039 g006
Figure 7. Distribution coefficient of tin between copper alloy and different slags as a function of oxygen partial pressure. For the concentrations in slags, LA-ICP-MS results were used below 10−8 atm pO2.
Minerals 09 00039 g007
Figure 8. Distribution coefficient of antimony between copper alloy and different slags as a function of oxygen partial pressure. For the slags, LA-ICP-MS results were used below 10−6 atm pO2.
Minerals 09 00039 g008
Figure 9. Concentrations of tin and antimony in slags, analyzed with EPMA and LA-ICP-MS techniques. For concentrations inside the orange square, LA-ICP-MS results were used. EPMA results were utilized for the higher concentrations.
Minerals 09 00039 g009
Table 1. EPMA and LA-ICP-MS elemental/isotopic detection limits for each phase analyzed. ppmw = parts per million by weight.
PhaseOSiAlKCuSnSbFe
Detection limit (ppmw) EPMA
Copper12152734497116348150169179
Slag1443202325894278124121197
Spinel136519318392272121115195
Detection limit (ppmw) LA-ICP-MS
Slag 12 (29Si) 0.03 (117Sn)
0.02 (118,120Sn)
0.02 (121,123Sb)

