Article

Microstructural Evidence for Grain Boundary Migration and Dynamic Recrystallization in Experimentally Deformed Forsterite Aggregates

by
Caroline Bollinger
1,2,*,
Billy C. Nzogang
3,
Alexandre Mussi
3,
Jérémie Bouquerel
3,
Dmitri A. Molodov
4 and
Patrick Cordier
3
1
Bayerisches Geoinstitut, Universität Bayreuth, D-95445 Bayreuth, Germany
2
Department of Earth and Planetary Sciences, Washington University in Saint Louis, Saint Louis, MO 63117, USA
3
University of Lille, CNRS, INRA, ENSCL, UMR 8207-UMET-Unité Matériaux et Transformations, F-59000 Lille, France
4
Institute of Physical Metallurgy and Metal Physics, RWTH Aachen University, 52074 Aachen, Germany
*
Author to whom correspondence should be addressed.
Minerals 2019, 9(1), 17; https://doi.org/10.3390/min9010017
Submission received: 21 October 2018 / Revised: 27 November 2018 / Accepted: 21 December 2018 / Published: 27 December 2018

Abstract

:
Plastic deformation of peridotites in the mantle involves large strains. Orthorhombic olivine does not have enough slip systems to satisfy the von Mises criterion, leading to strong hardening when polycrystals are deformed at rather low temperatures (i.e., below 1200 °C). In this study, we focused on the recovery mechanisms involving grain boundaries and recrystallization. We investigated forsterite samples deformed at large strains at 1100 °C. The deformed microstructures were characterized by transmission electron microscopy using orientation mapping techniques (ACOM-TEM). With this technique, we increased the spatial resolution of characterization compared to standard electron backscatter diffraction (EBSD) maps to further decipher the microstructures at nanoscale. After a plastic strain of 25%, we found pervasive evidence for serrated grain and subgrain boundaries. We interpreted these microstructural features as evidence of occurrences of grain boundary migration mechanisms. Evaluating the driving forces for grain/subgrain boundary motion, we found that the surface tension driving forces were often greater than the strain energy driving force. At larger strains (40%), we found pervasive evidence for discontinuous dynamic recrystallization (dDRX), with nucleation of new grains at grain boundaries. The observations reveal that subgrain migration and grain boundary bulging contribute to the nucleation of new grains. These mechanisms are probably critical to allow peridotitic rocks to achieve large strains under a steady-state regime in the lithospheric mantle.

1. Introduction

As (Mg, Fe)2SiO4 olivine is the main constituent of the upper mantle, understanding its plastic behavior and deformation mechanisms is important in order to model the rheology of the mantle. From a mineral physics point of view, despite efforts by the research community for more than 50 years, a lot of questions remain unsolved. At a very fundamental level, olivine raises many questions. With only two slip directions, i.e., [100] and [001], this crystal structure does not exhibit enough slip systems to satisfy the von Mises–Taylor criterion [1,2], which states that five independent slip systems are required to allow homogeneous grain-scale deformation of polycrystalline aggregates. Below ca. 1200 °C, laboratory deformation experiments on olivine rapidly show significant hardening due to the increase in the internal stored energy, which rapidly leads to brittle behavior [3]. Further deformation, especially under steady-state regime, is only possible if the microstructure can evolve to release this stored energy. Recrystallization is a general term that encompasses different mechanisms leading to such evolution of microstructures during deformation [4]. The formation of new grains is one of those mechanisms. Other recovery mechanisms involving dislocation annihilation (by cross-slip or climb) as well as grain boundary migration can also contribute.
Most studies on recrystallization in olivine have addressed its influence on crystal preferred orientations [5,6,7,8] and on grain size evolution [8,9,10,11]. Recently, Trepmann et al. [12] experimentally addressed the recrystallization of olivine following low-temperature (300–600 °C) deformation episodes followed by annealing at 700–1100 °C, showing some microstructural observations. They suggested that “recrystallization microstructures have a great diagnostic potential for past seismic activity because they are expected to be stable over geological timescales” (cf. p.1 in [12]). Karato et al. [13] showed that, at high temperatures (above 1500 °C), recrystallization can occur in single crystals, provided strains are large enough (40–60%). However, the number of studies documenting the microstructural evolutions of olivine during recrystallization are relatively scarce. The materials science literature [14,15] demonstrates that there is a large variety of mechanisms involved in recrystallization. Further microstructural investigations are thus needed so that reliable criteria can be used to decipher recrystallization processes in naturally deformed rocks.
In this paper, we present a microstructural characterization of forsterite samples that have been deformed to relatively large strains under conditions that promote a strong activity of intragranular deformation by dislocation activity. We used orientation mapping in transmission electron microscopy (TEM) to infer active recovery mechanisms using the morphology of grains, grain boundaries (GB), and determination of intracrystalline misorientations.

2. Materials and Methods

Experimental set up, data analysis, and results for sample For70B have been previously reported in [16,17,18] for sample M642. The following section is hence limited to the most relevant information regarding the present study.

2.1. Synthesis

2.1.1. Sample M642

Forsterite was synthesized from MgO (99.99% purity with 1.5 µm grain size) and SiO2 (99.99% purity with ~150 µm grain size) oxide powders from ChemPur. MgO was added in excess to avoid the formation of enstatite during synthesis because MgO powders easily capture humidity from the air during the weighing. This mixture was then sintered in a furnace at 1500 °C for at least 12 h and crushed again. This procedure was repeated five times. The evolution to 100% forsterite was monitored with X-ray diffraction and confirmed later in the study. Once forsterite was formed, the excess MgO was removed using acetic acid at 10% at 60 °C (this process was repeated four times). The resulting forsterite powder was then sent to PNF2 (CIRIMAT, Toulouse, France) to be aggregated and densified by flash sintering [19]. This resulted in pellets that were 2 cm high and 4 cm in diameter.

2.1.2. Sample For70B

The forsterite starting material was prepared by crushing one gem-quality single crystal of Fo100 in an alumina mortar and grinded to a fine-grained powder at the optical scale (average grain size of ~10 µm). Forsterite powder was mixed with a small fraction (5 wt. %) of natural enstatite (En84Fs13Wo3) powder [17] in order to buffer the orthopyroxenes (Opx) activity (aOpx = 1) and limit grain growth during the runs. Oxygen fugacity (fO2) was not controlled during the runs.

2.2. Deformation Experiments

A summary of the experimental conditions is given in Table 1.

2.2.1. Sample M642

M642 was deformed within the six second-stage anvils in the six-ram MAVO press [20] at the Bayerisches GeoInstitut (Bayreuth, Germany). The pressurization occurred in approximately 60 min, followed by heating within 30 min by current injection controlled with the power supply. After reaching the pressure–temperature conditions, annealing was performed for ~30 min to let the system adjust before deformation. One pair of rams was then pushed forward by injecting oil at a rate corresponding to an applied strain rate of ~2 × 10⁻⁵ s−1. Another pair of rams remained fixed as the last one was pushed backward in response to ensure a constant confining pressure while the sample was deformed in pure shear geometry. The applied pressure was 3.5 GPa with a temperature of 1100 °C. The power-controlled temperature was monitored using a thermocouple. After deformation, the sample was quenched by switching off the power, and pressure was released slowly for 18 h. The applied strain was 40%, corresponding to a deformation duration of 5 h. The measurement of the capsule after the deformation showed that the strain transmitted to the sample was ~25%.

2.2.2. Sample 70B

For70B was uniaxially deformed at 3.1 GPa, 1100 °C, and 4.5 × 10⁻⁵ s−1 to 40% strain (Table 1) in the deformation-DIA apparatus (D-DIA, [21,22] at the X17B2 beamline of the National Synchrotron Light Source (Upton, NY, USA). The deformation cell containing the forsterite powder was first pressurized at room temperature (T), then brought to high T. Annealing under hydrostatic conditions was performed for ~1 h to allow sintering of pistons and sample and relaxation of cold-compression stresses. Then, axisymmetric deformation was ensured by moving the D-DIA vertical anvils forward at a fixed rate until 5–10% strain was reached at a constant strain rate. At the end of the run, temperature was quenched by turning off the power supply, and both D-DIA vertical anvils were stopped. Pressure (P) was then released (for 1 to 2 h) to room pressure. To preserve specimen deformation microstructures during decompression, the specimen length was maintained constant by adjusting the vertical anvil positions. The grain size distribution in this highly deformed material was found to be bimodal. Grains with the size of 2–3 µm were surrounded by smaller grains with the sizes in the range of 0.2–0.5 µm.

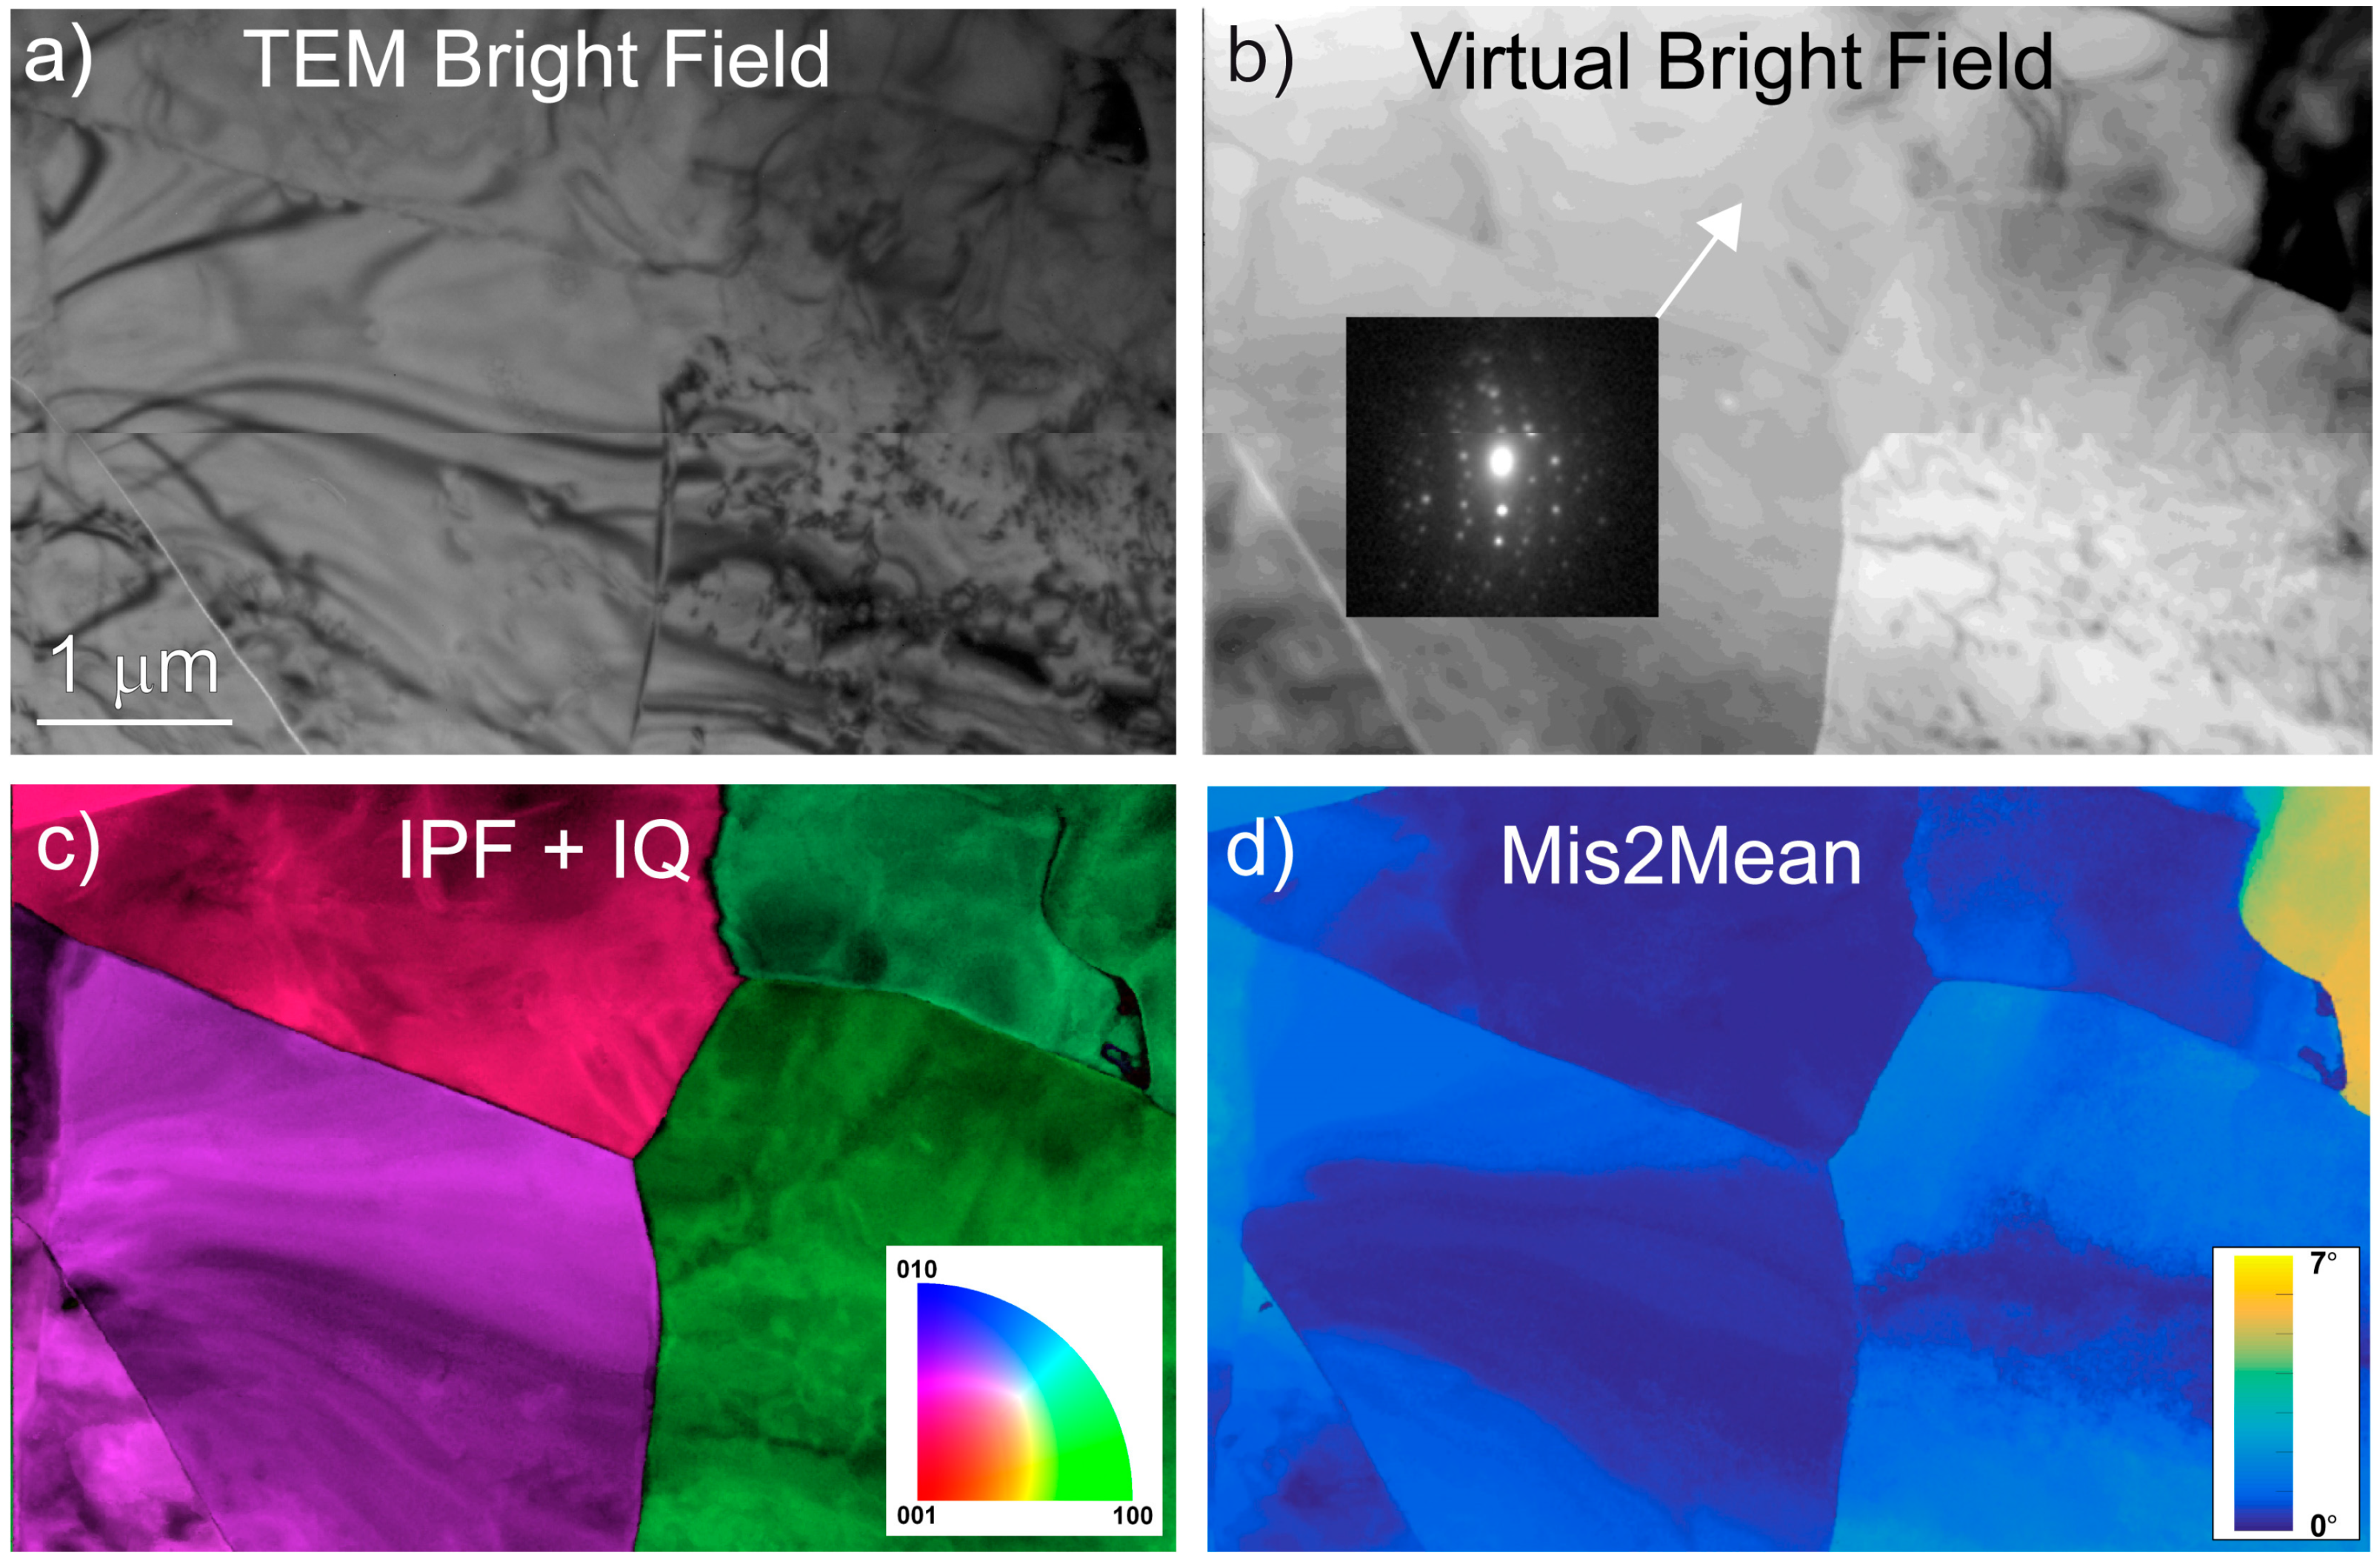
2.3. Orientation Mapping in the Transmission Electron Microscope

After deformation, thin sections (~25 µm thick) from the central part of the deformed specimens were prepared for TEM. Thin slabs were cut and mechanically polished down to a thickness of about 30 µm. In order to reach electron transparency, the sample foils were Ar-ion sputtered with a Gatan® DuoMillTM model 600. Carbon films were deposited on the thin foils to ensure electron conduction. TEM investigations were performed at the university of Lille (France) with a FEI® Tecnai G220Twin microscope (FEI Company, Hillsboro, OR, USA) operating at 200 kV and a Philips CM30 microscope (PHILIPS, Amsterdam, The Netherlands) operating at 300 kV, both equipped with a LaB6 filament and using a double tilt sample holder.
Automated crystal orientation mapping (ACOM-TEM) was operated in the TEM with the ASTARTM tool from NanoMEGAS [23]. The TEM was set in microbeam mode (nominal spot size of ~6 nm without precession), and the incident electron beam, which was focused on the sample, was scanned over the area with a step size of 6 nm, thanks to a dedicated hardware control system of the TEM deflecting coils. In this mode, where the sample was illuminated by a convergent beam, the diffraction pattern consisted of discs. Using the smallest condenser aperture (50 µm), the diffraction patterns were made of very small spot-like discs and could be indexed as spot patterns. The individual exposure time at each location was 10–40 ms. In this study, we used precession illumination (with a precession angle of 0.5°–1.0°) in the TEM, which allowed many more reflections to be seen in the diffraction pattern with intensities closer to the kinematical diffraction conditions. Diffraction patterns were collected with an external Stingray CCD camera that was pointed on the TEM phosphorous screen, and they were then stored in the computer memory for further indexation and post-processing. The diffraction patterns were collected at 144 × 144 pixels at a camera length of 89–97 mm (chosen so as to optimize the diffraction pattern for indexation). In the ASTAR system (NanoMEGAS, Forest, Belgium), electron diffraction spot patterns are indexed (providing the local crystal orientations) by comparing individually obtained patterns via cross-correlation matching techniques with precalculated electron diffraction templates generated every 0.5° (orientation resolution). For forsterite, templates were generated from the crystallographic data of Birle et al. [24]. From this indexation, we obtained orientation maps that displayed, with color coding (indexed here within the Pnma space group), the most probable orientation at each scanned beam position.
The quality of indexation (IQ in the figures) from template matching was quantified by the image correlation index, which was calculated for every template [25]:
I Q ( i ) = j = 1 m P ( x j , y j ) T i ( x j , y j ) j = 1 m P 2 ( x j , y j ) j = 1 m T i 2 ( x j , y j )
In this expression, the diffraction pattern is represented by the intensity function P ( x , y ) , and every template i is described by the function T i ( x , y ) . The highest IQ value corresponds to the solution retained. The reliability of this solution can be quantified by the ratio of the matching indexes for the two best solutions IQ1 and IQ2:
R = 100 ( 1 I Q 1 I Q 2 )
In reliability maps, the brighter the pixel (i.e., the higher the reliability index), the more reliable is the proposed indexation. In contrast, the darker the pixel, the less reliable is the solution. This is typically the case at GB, where two solutions of coexisting grains overlap, or when, for some reasons, the quality of the diffraction patterns is decreased.
The orientation dataset was a square-shaped grid with ASTAR, and it was transformed to channel text file (.ctf) to process the datasets using MTEX (free and open source MATLAB R2014b Toolbox (MathWorks, Natick, MA, USA) [26]. Grain boundaries were identified where the misorientation to the next pixel was higher than 15° [27]. Groups of pixels below a size of 10 points were ignored. To be able to detect deformation details in the microstructure, one must use other tools in addition to the inverse pole figure (IPF) color-coding. In this study, we used orientation maps to calculate local misorientations as developed recently by the electron backscatter diffraction (EBSD) community (e.g., [28]). As commonly used in EBSD, several quantities can be calculated from the orientation maps:
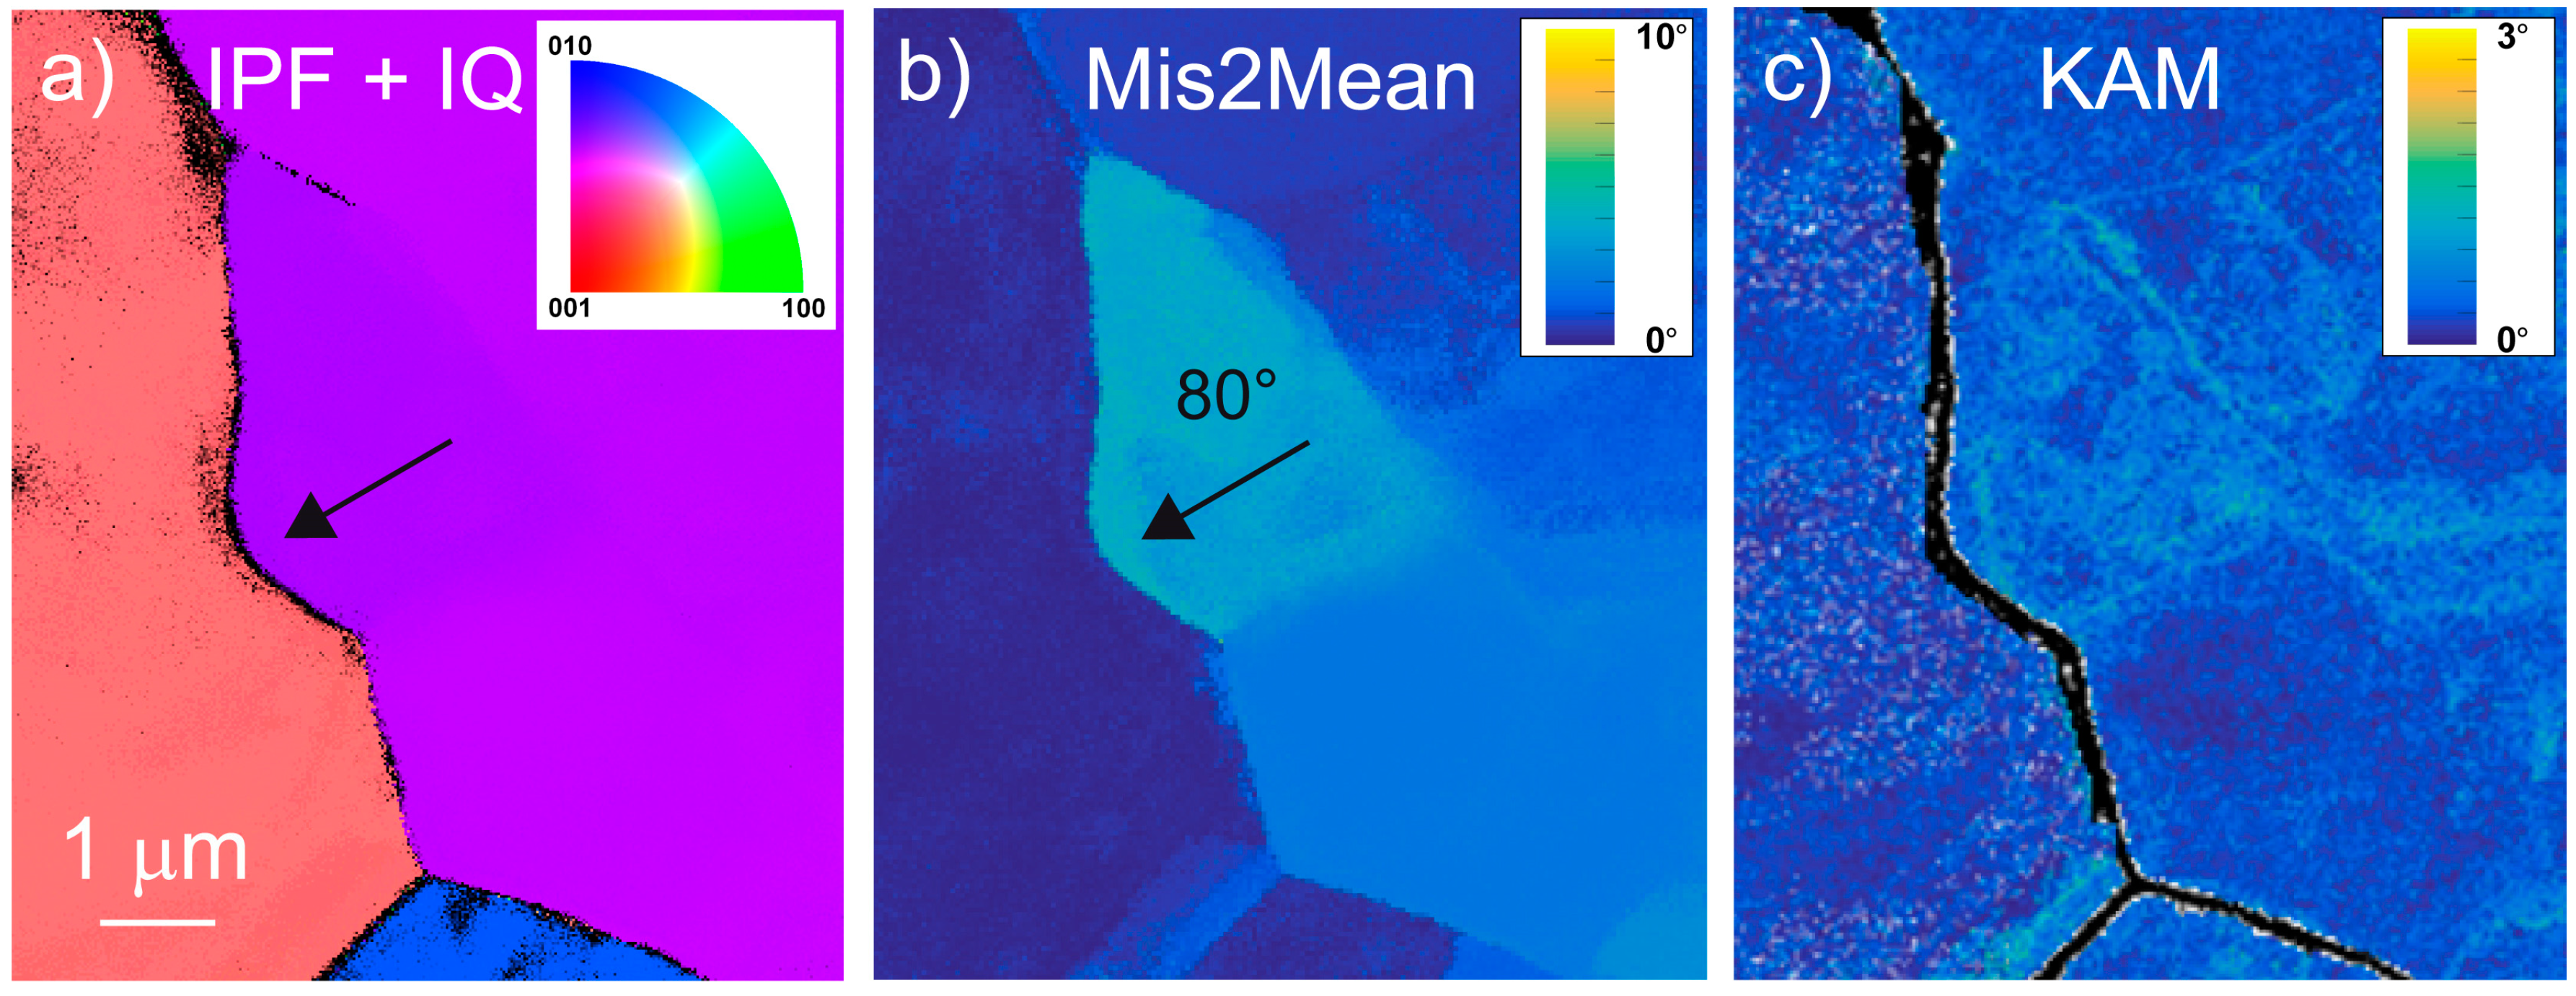
  • The kernel average misorientation (KAM) calculates the average misorientation between a pixel and its neighbors, provided that the misorientation does not exceed a predefined threshold value (e.g., 5°, which is the value chosen here for all figures). Hence, the incorporation of well-defined GB is avoided. A kernel is a set of points of prescribed size surrounding the scan point of interest. The size of the kernel is generally prescribed to the nth nearest neighbors. Hence, this parameter is sensitive to the step size of the measurement grid. If plastic deformation results from dislocation glide and crystal lattice rotation, this approach allows quantitative evaluation of the local plastic strain gradients [29]. KAM is consequently used as a proxy of the local plastic strain.
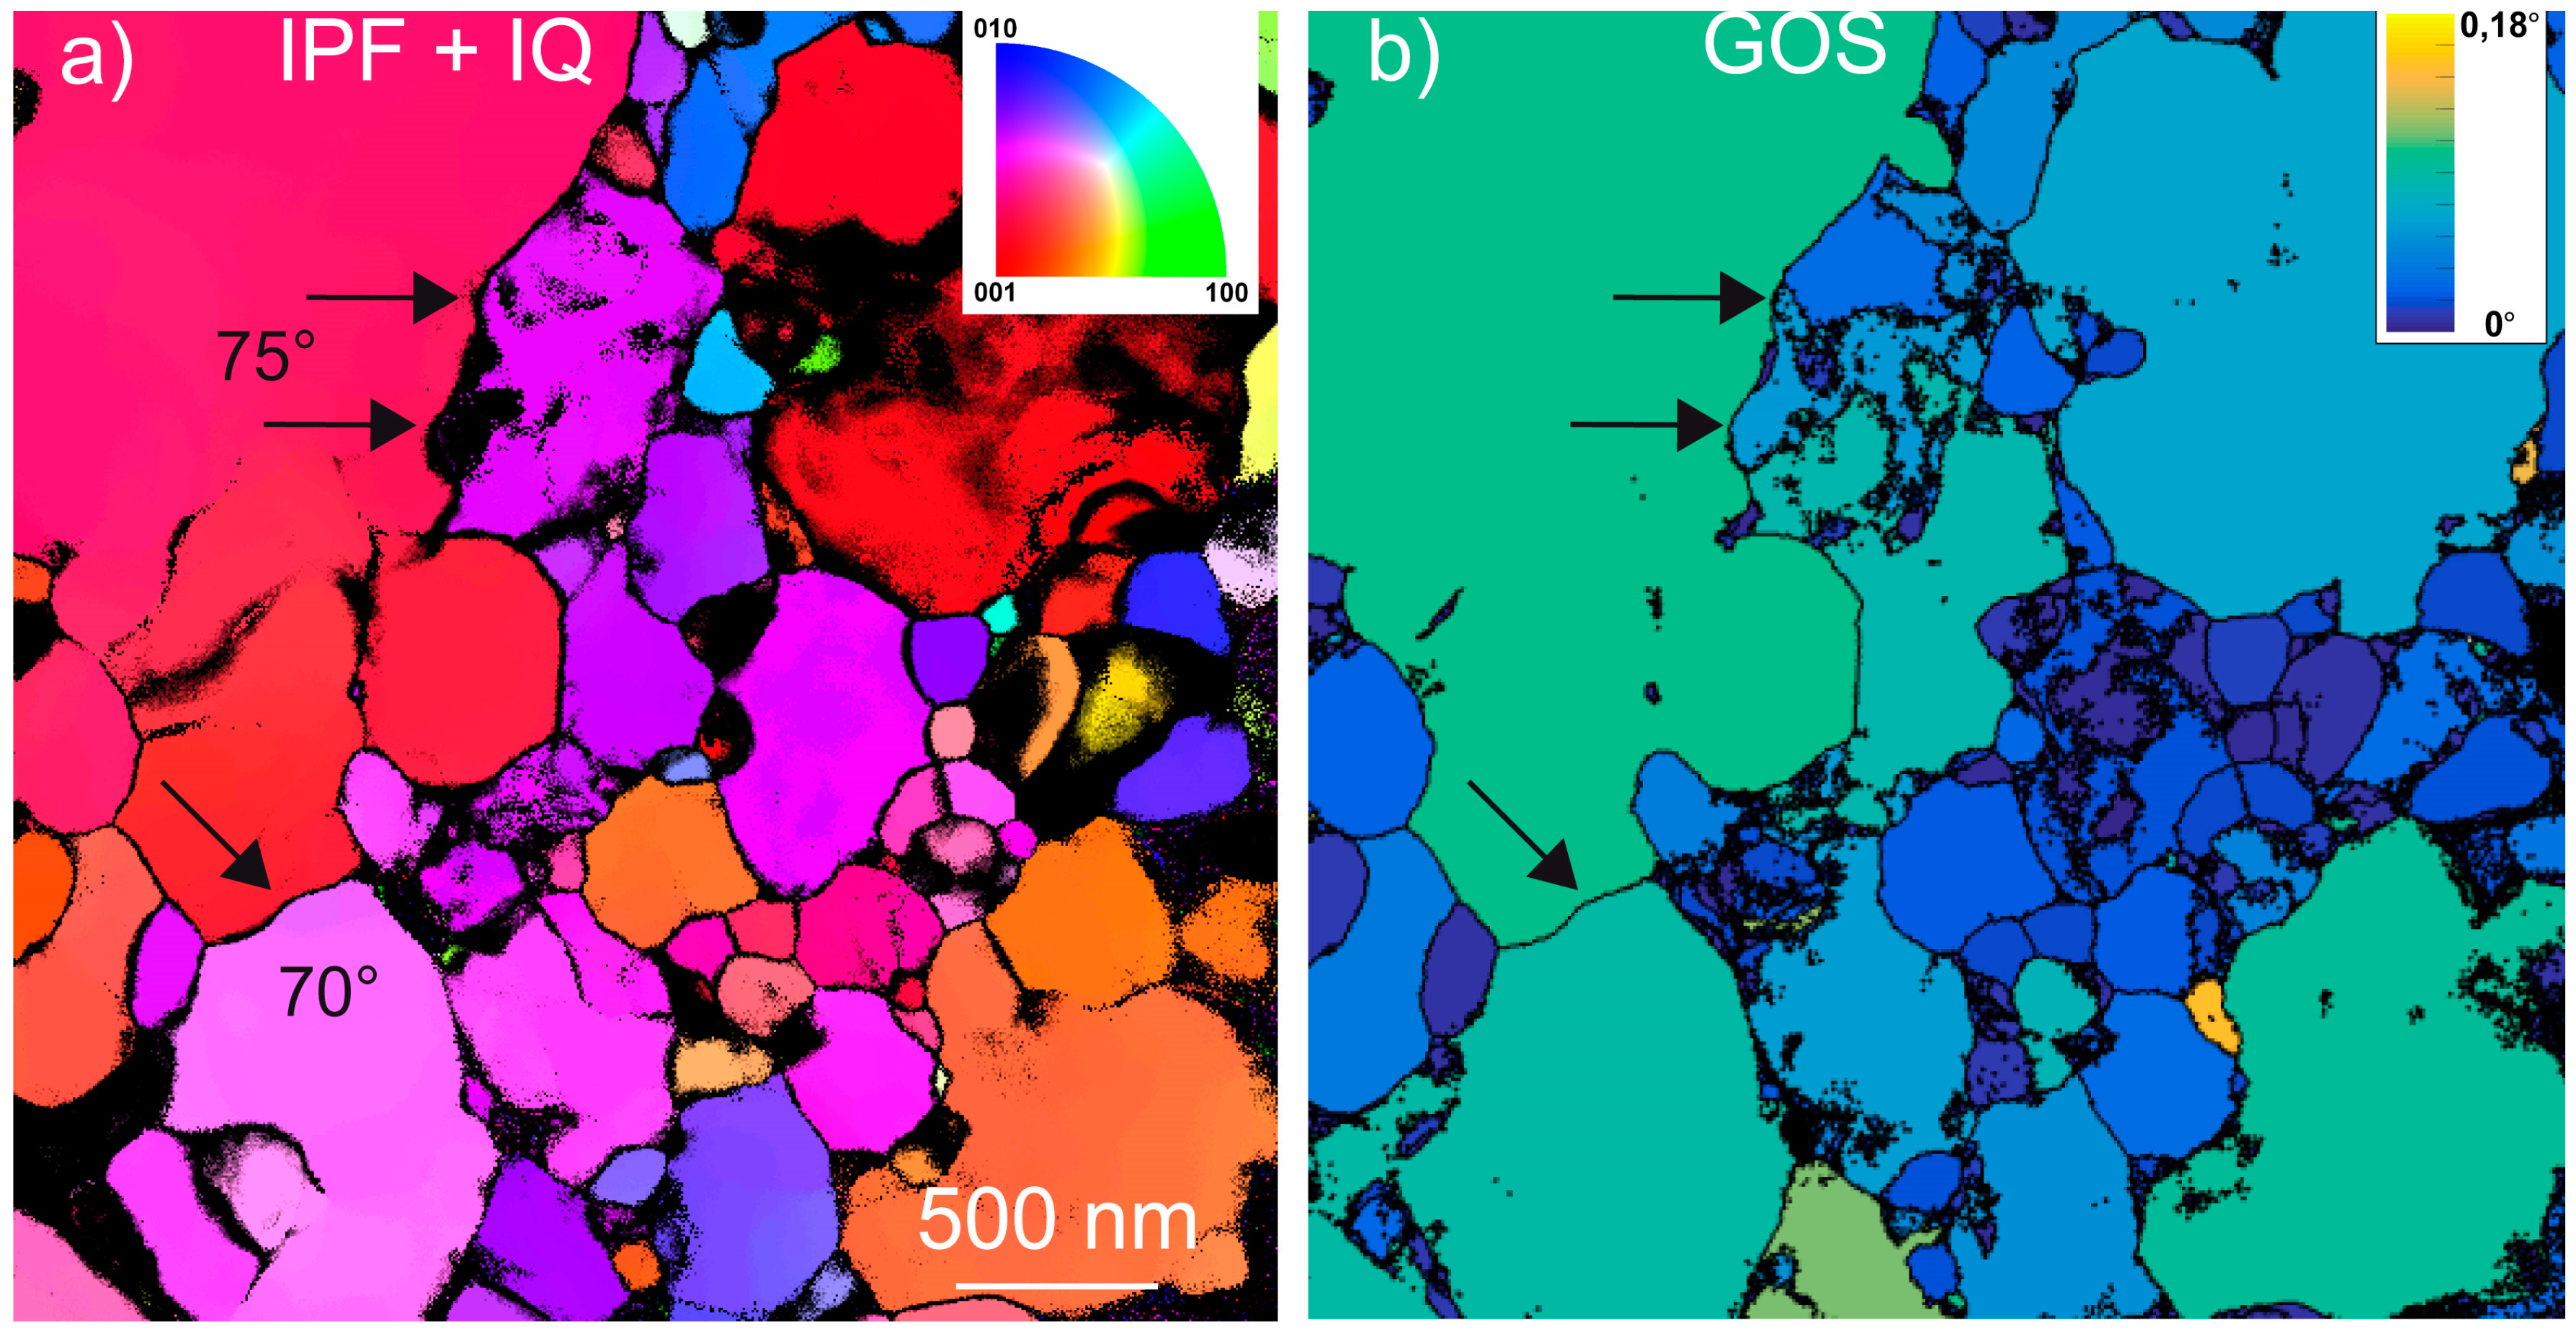
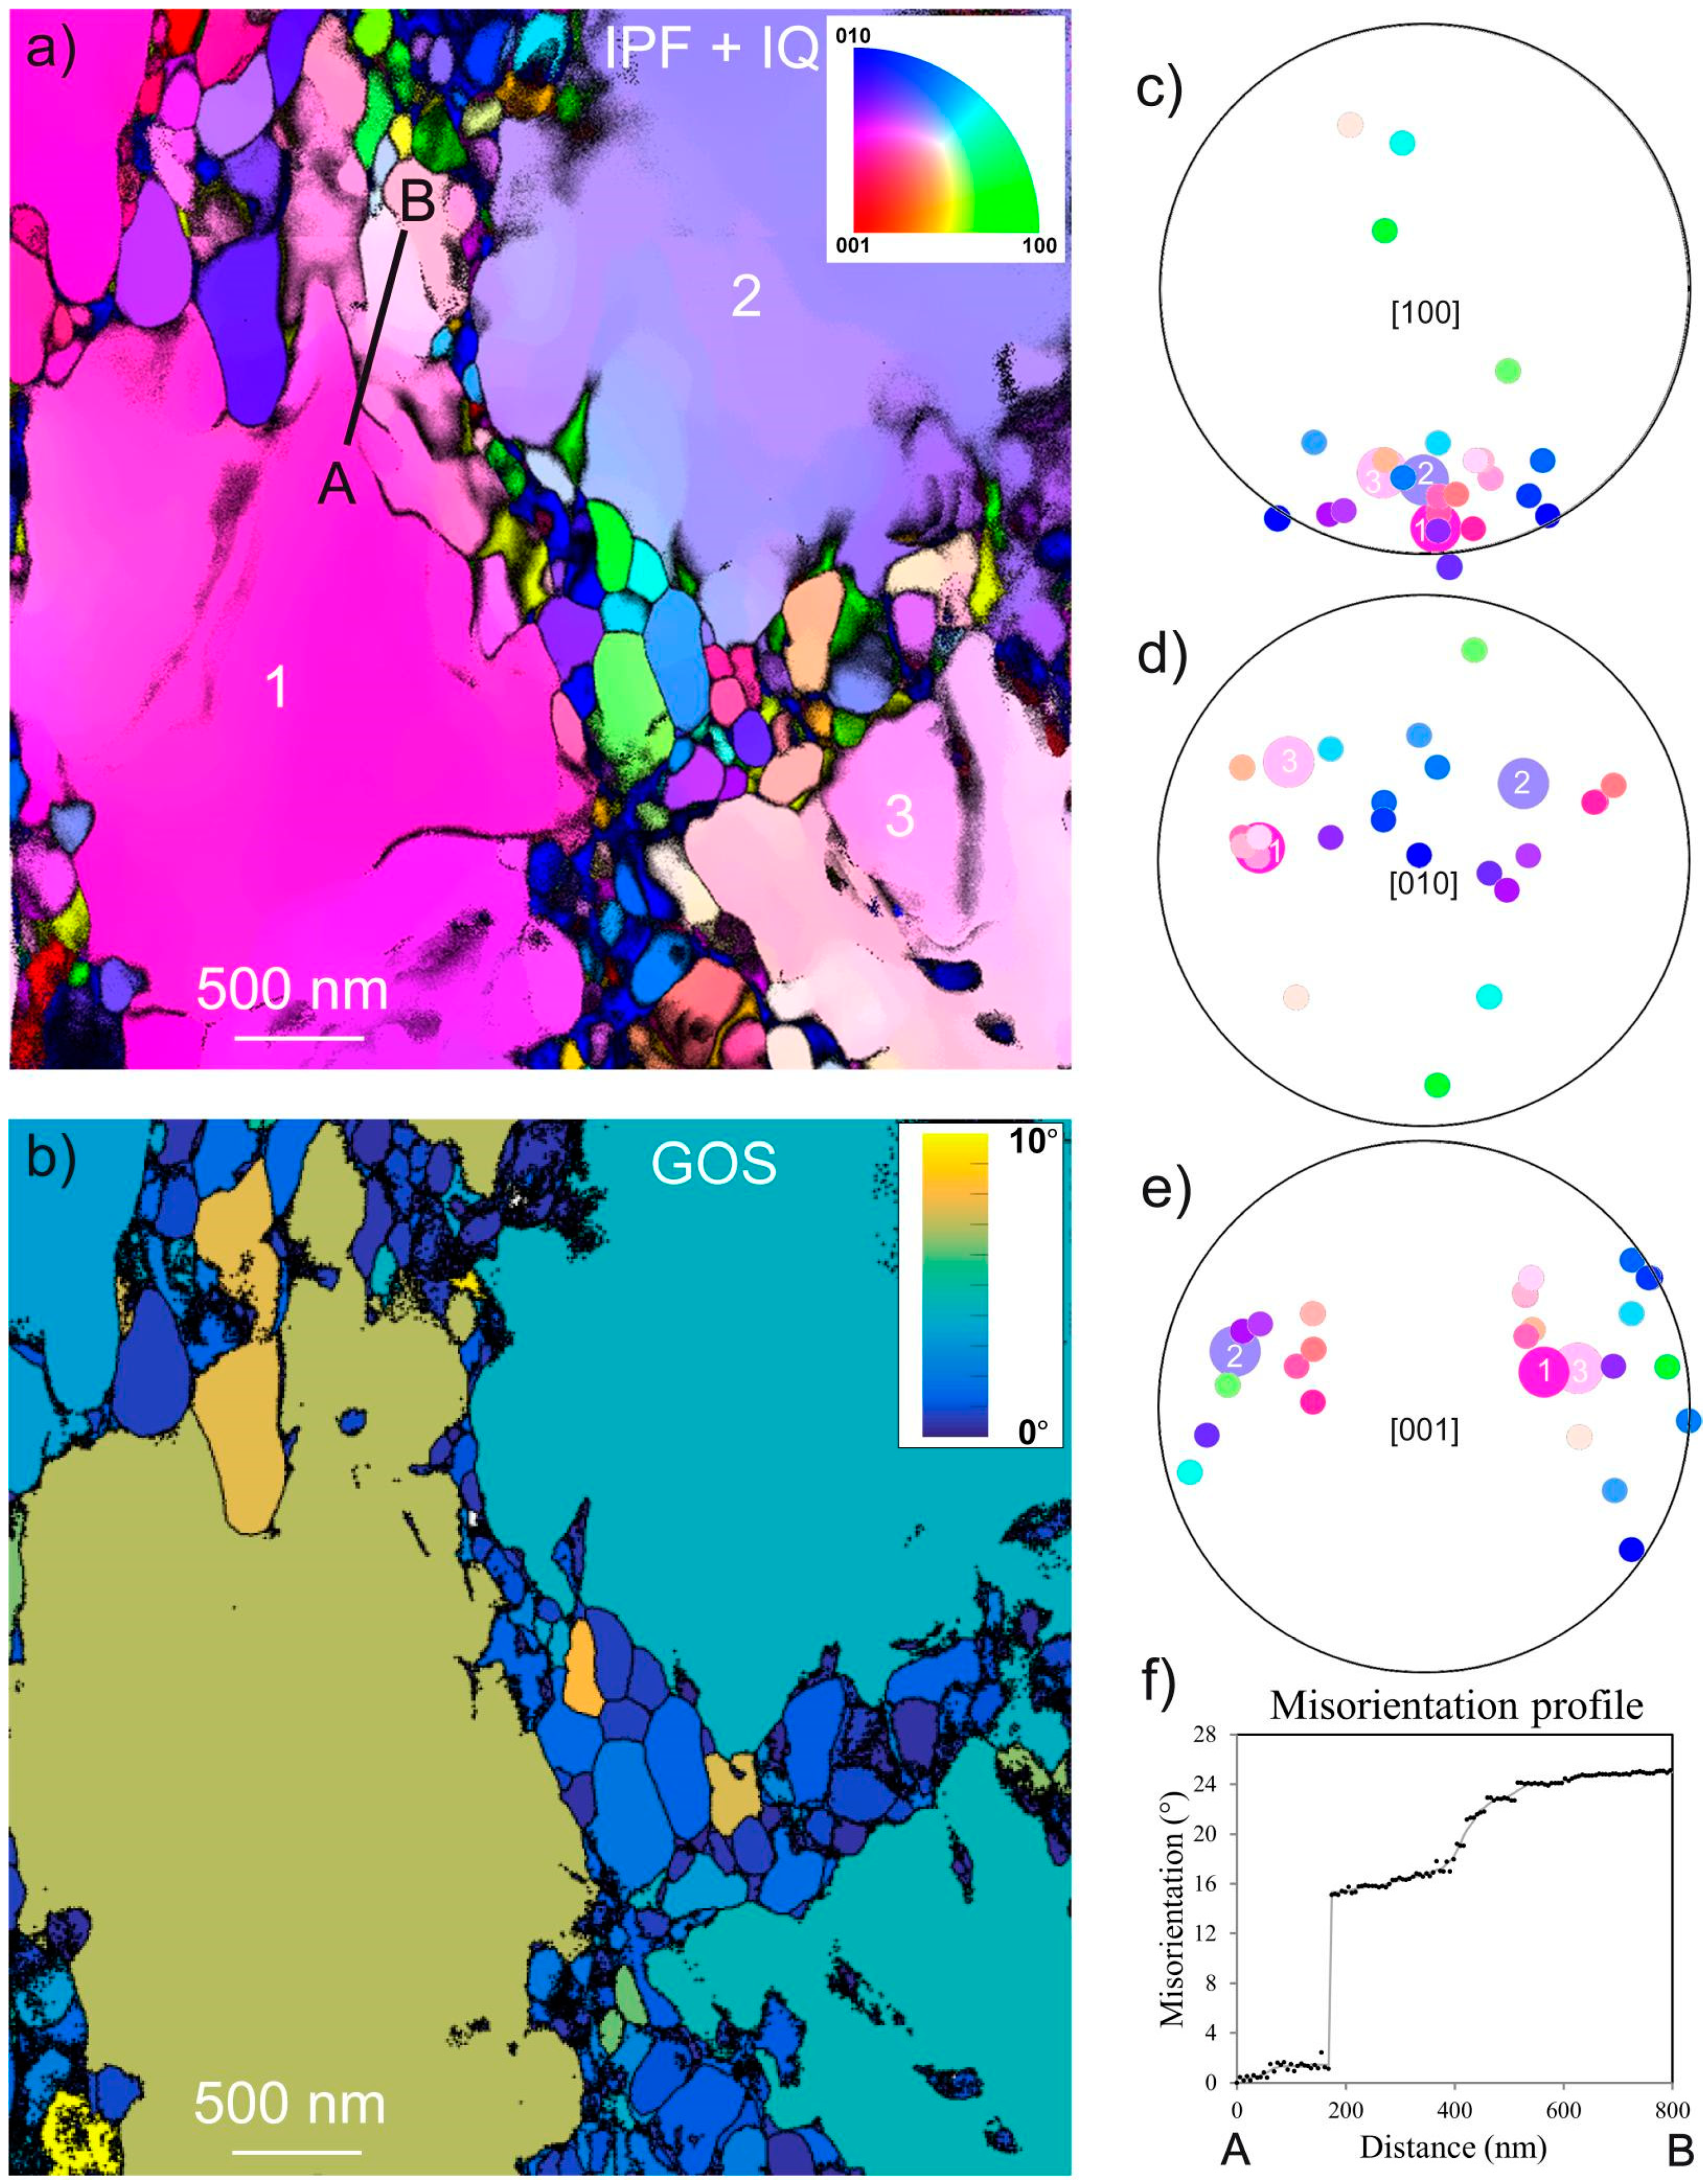
  • The grain orientation spread (GOS) is the average deviation in orientation between each point in a grain and the average orientation of the grain. This approach leads to assigning the same value of the GOS to every scan point contained within a grain.
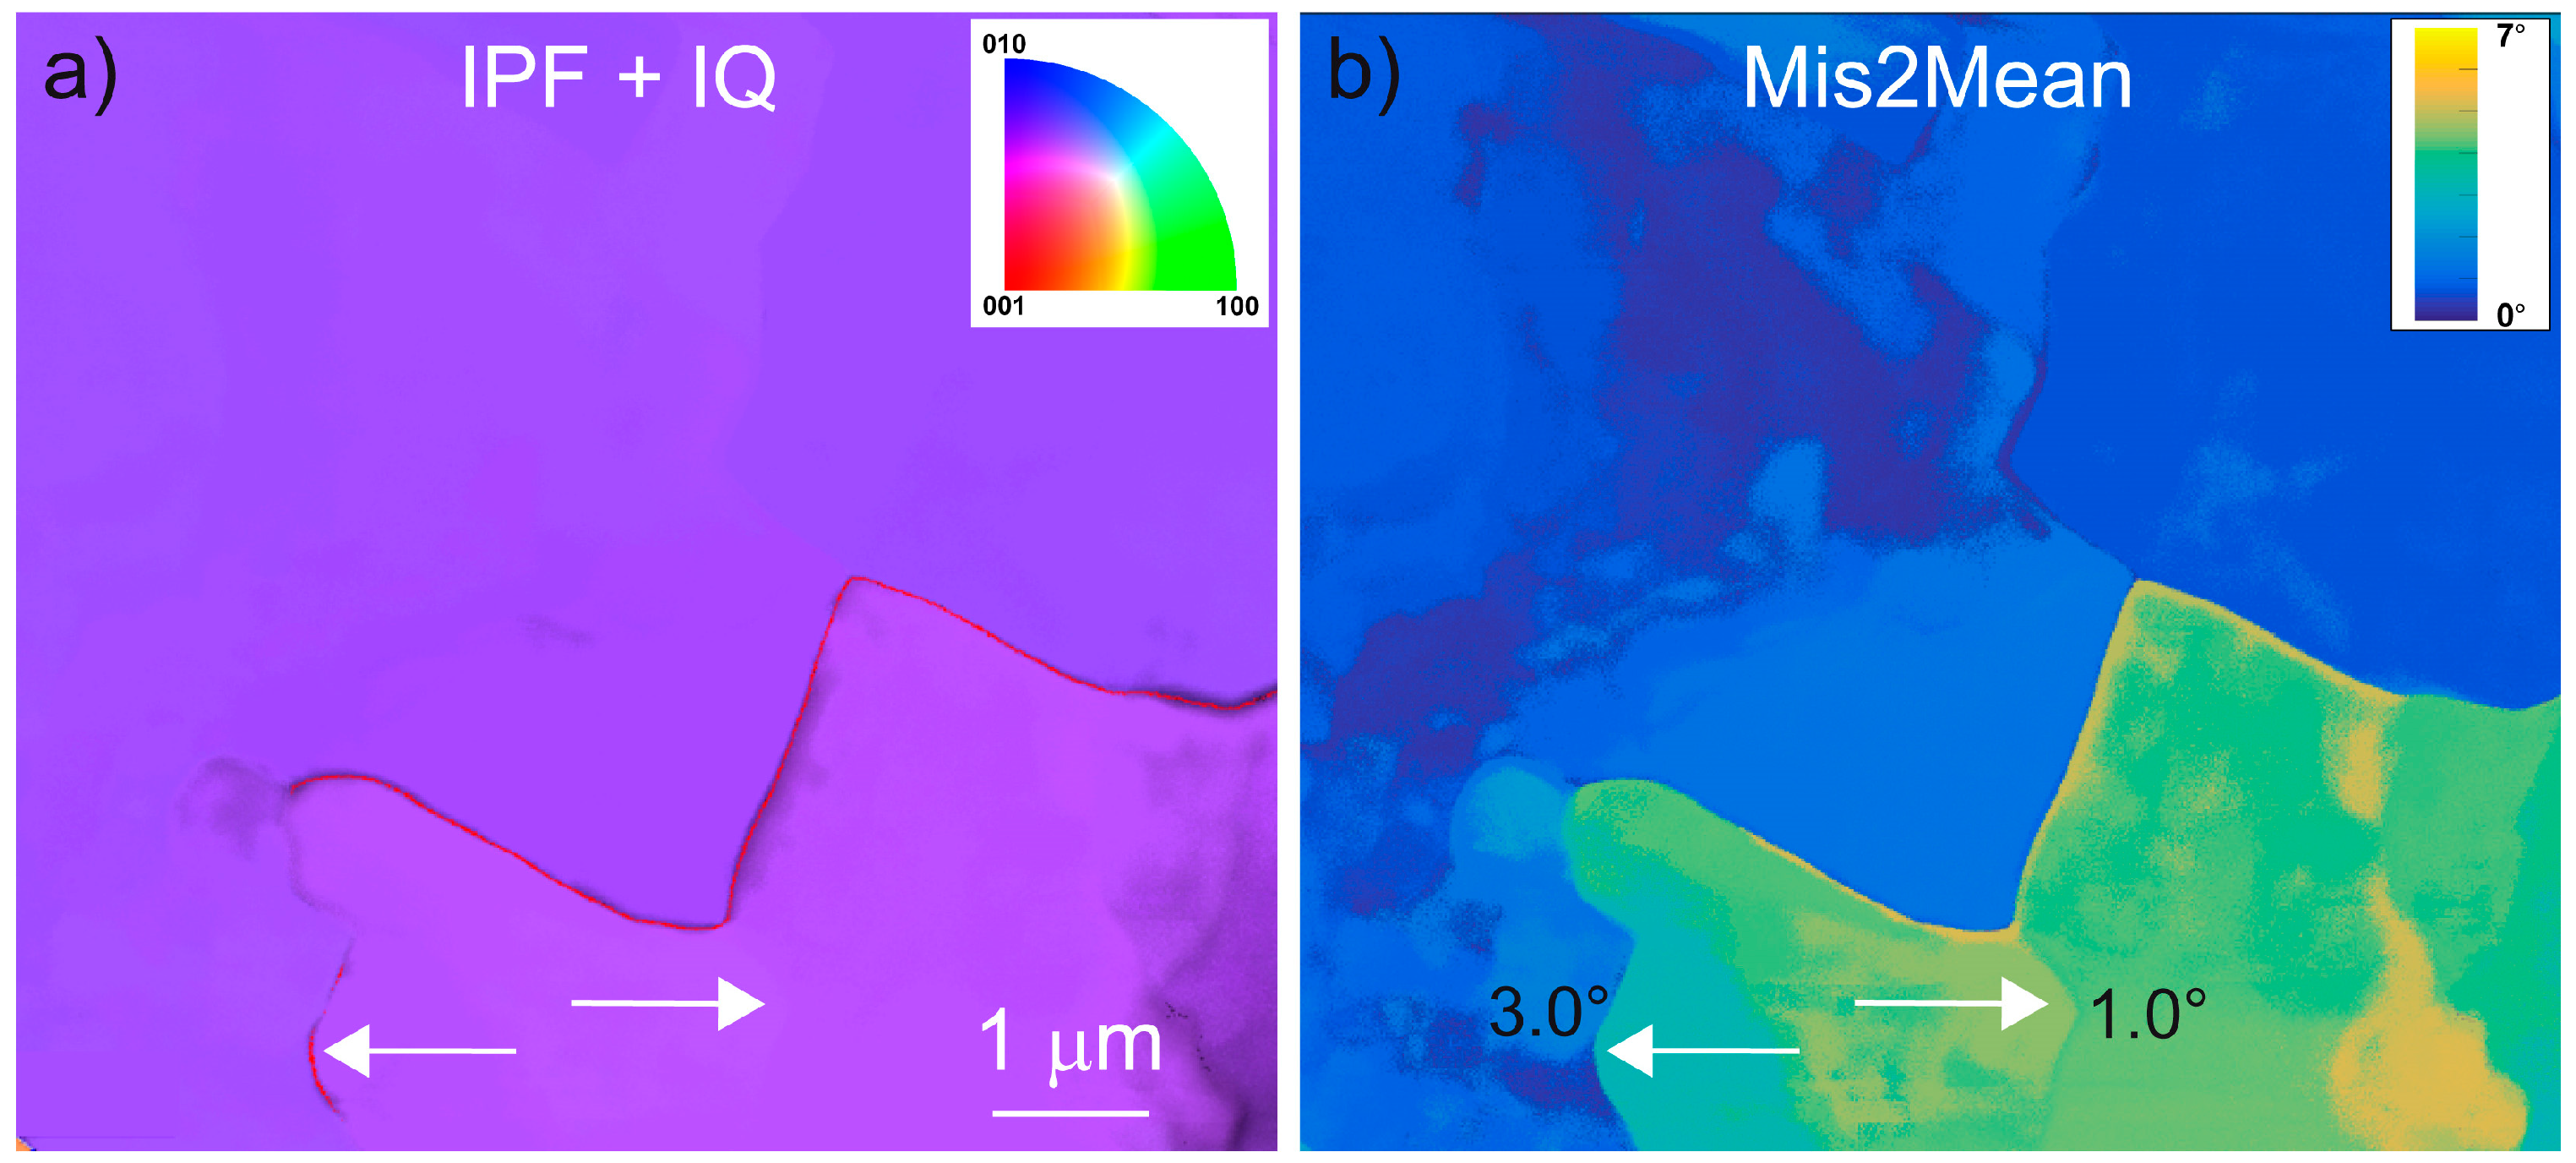
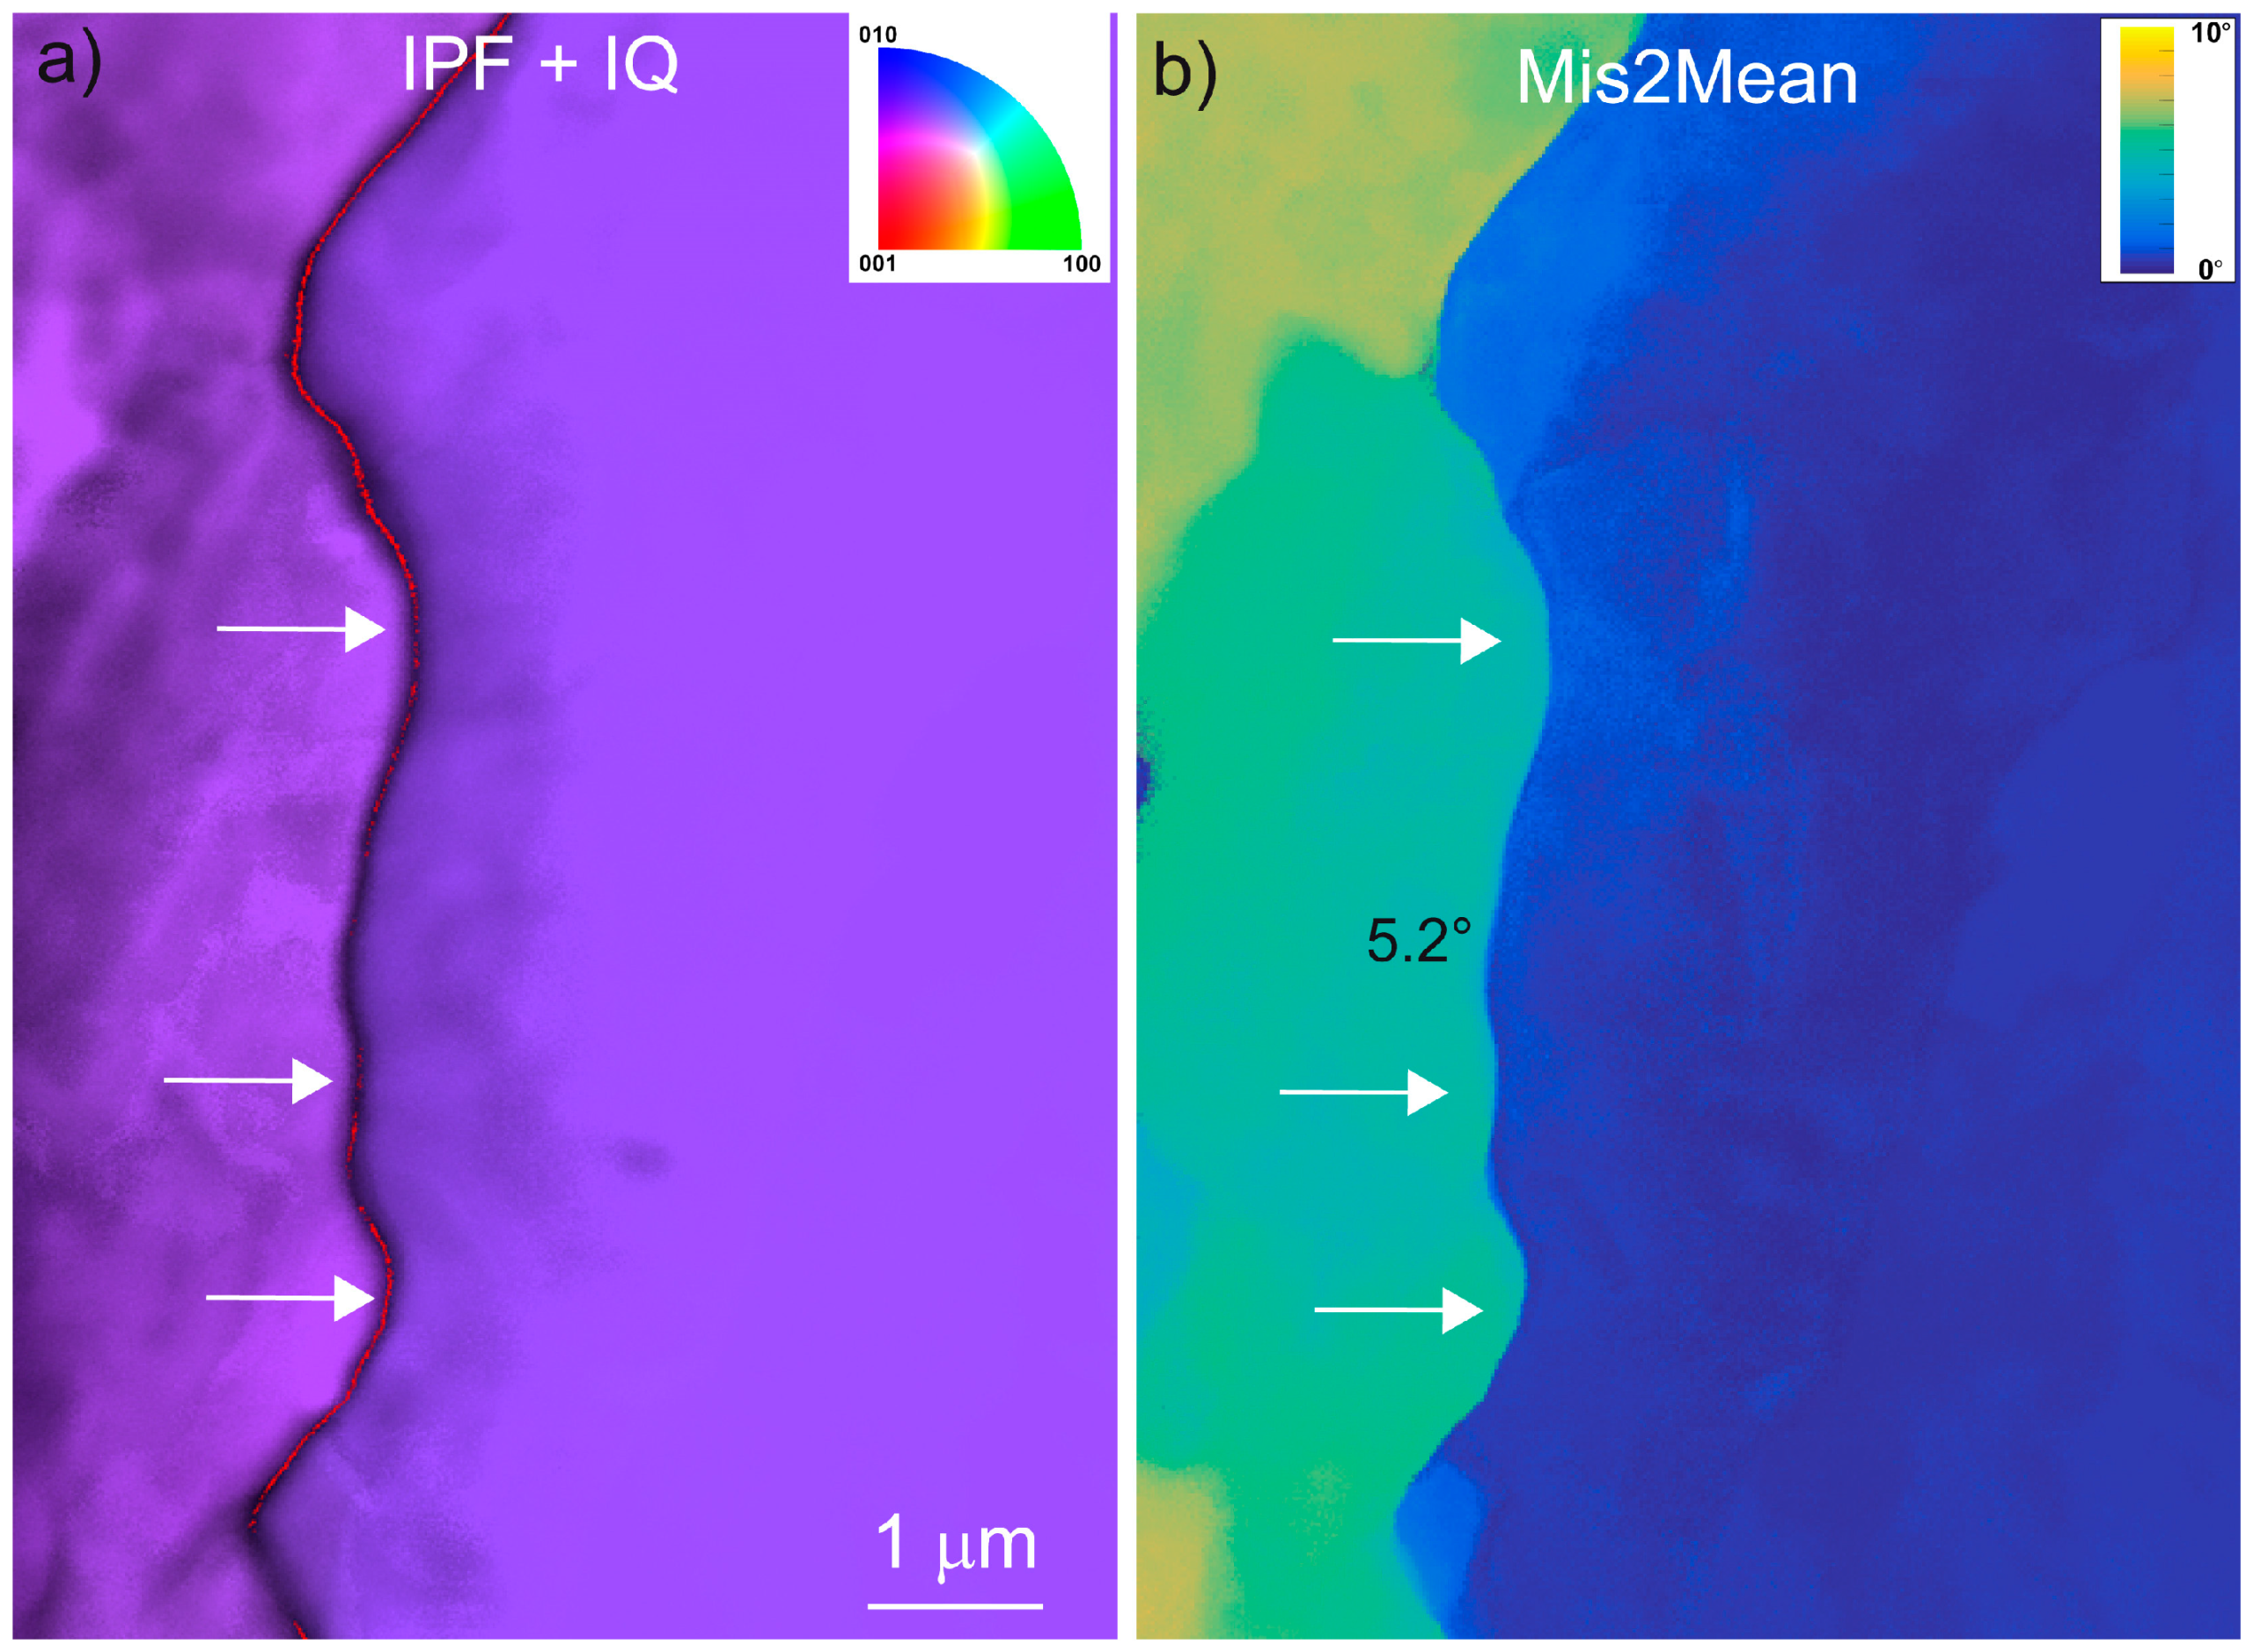
  • The grain reference orientation deviation (GROD) is based on the misorientation between a reference point of that grain and the other points. The reference point can be the mean misorientation of the grain (in this case and in MTEX, the GROD is called the Mis2Mean, as referred in this paper) or the point of the grain where the KAM is the lowest.
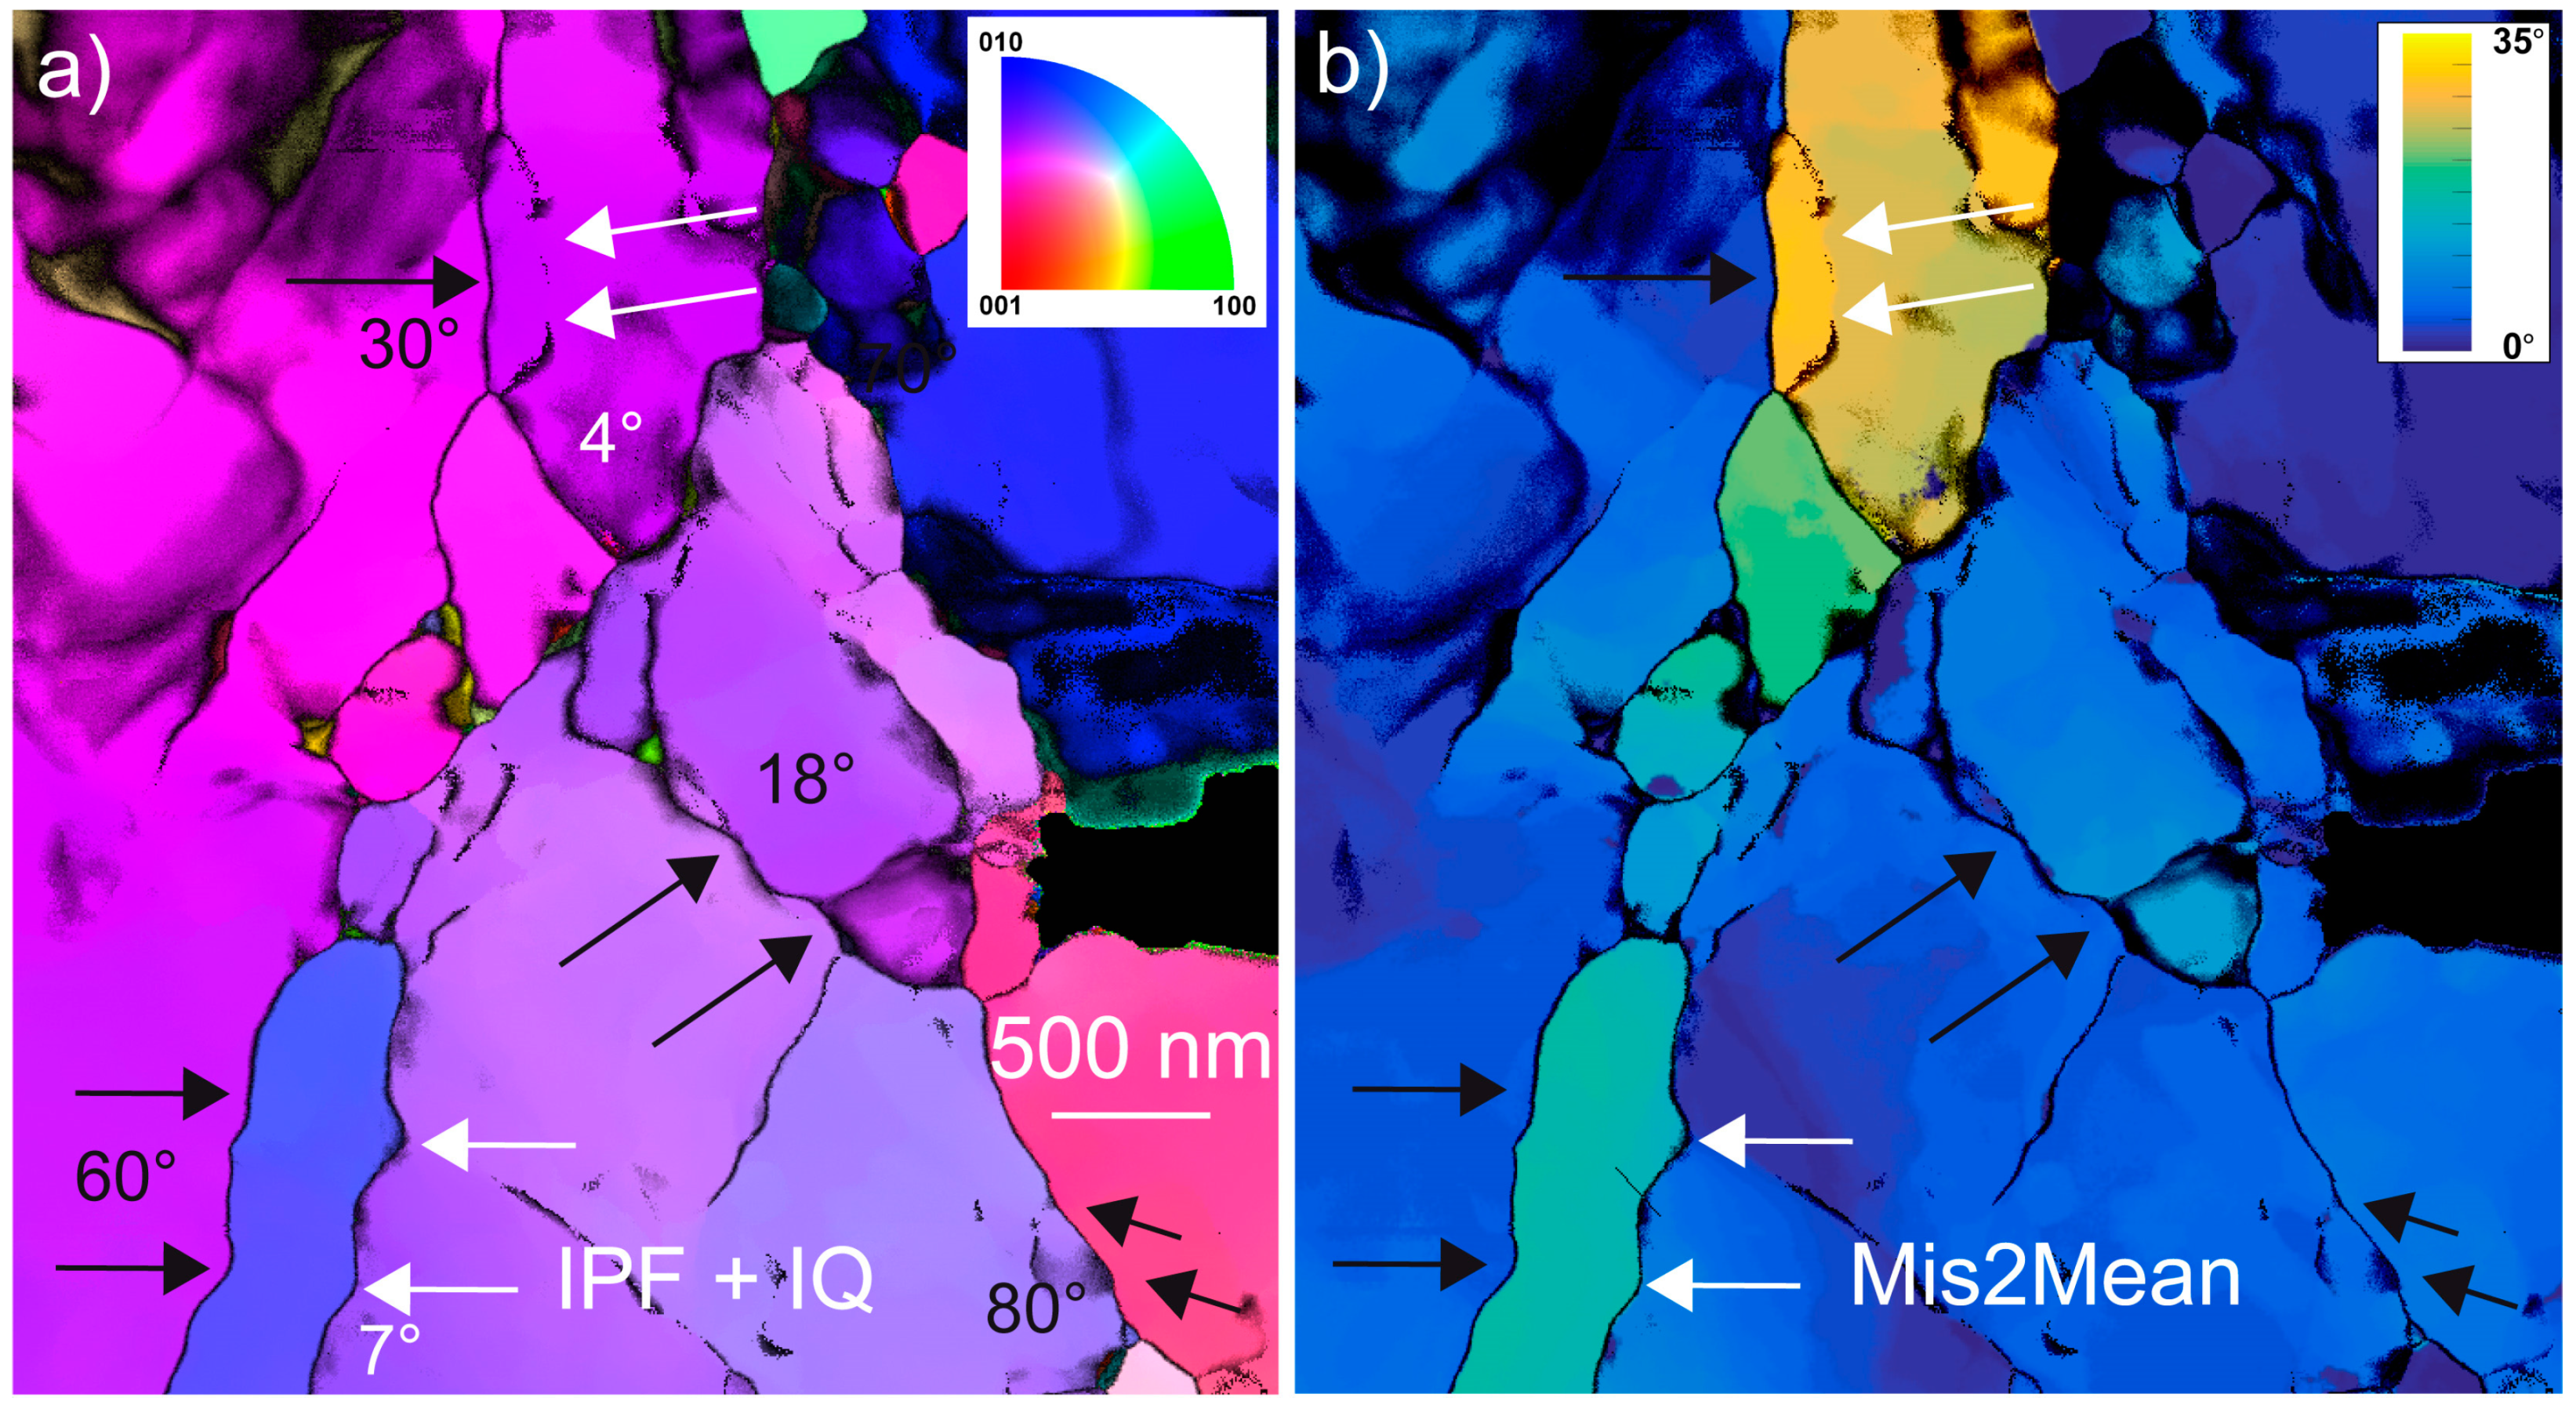
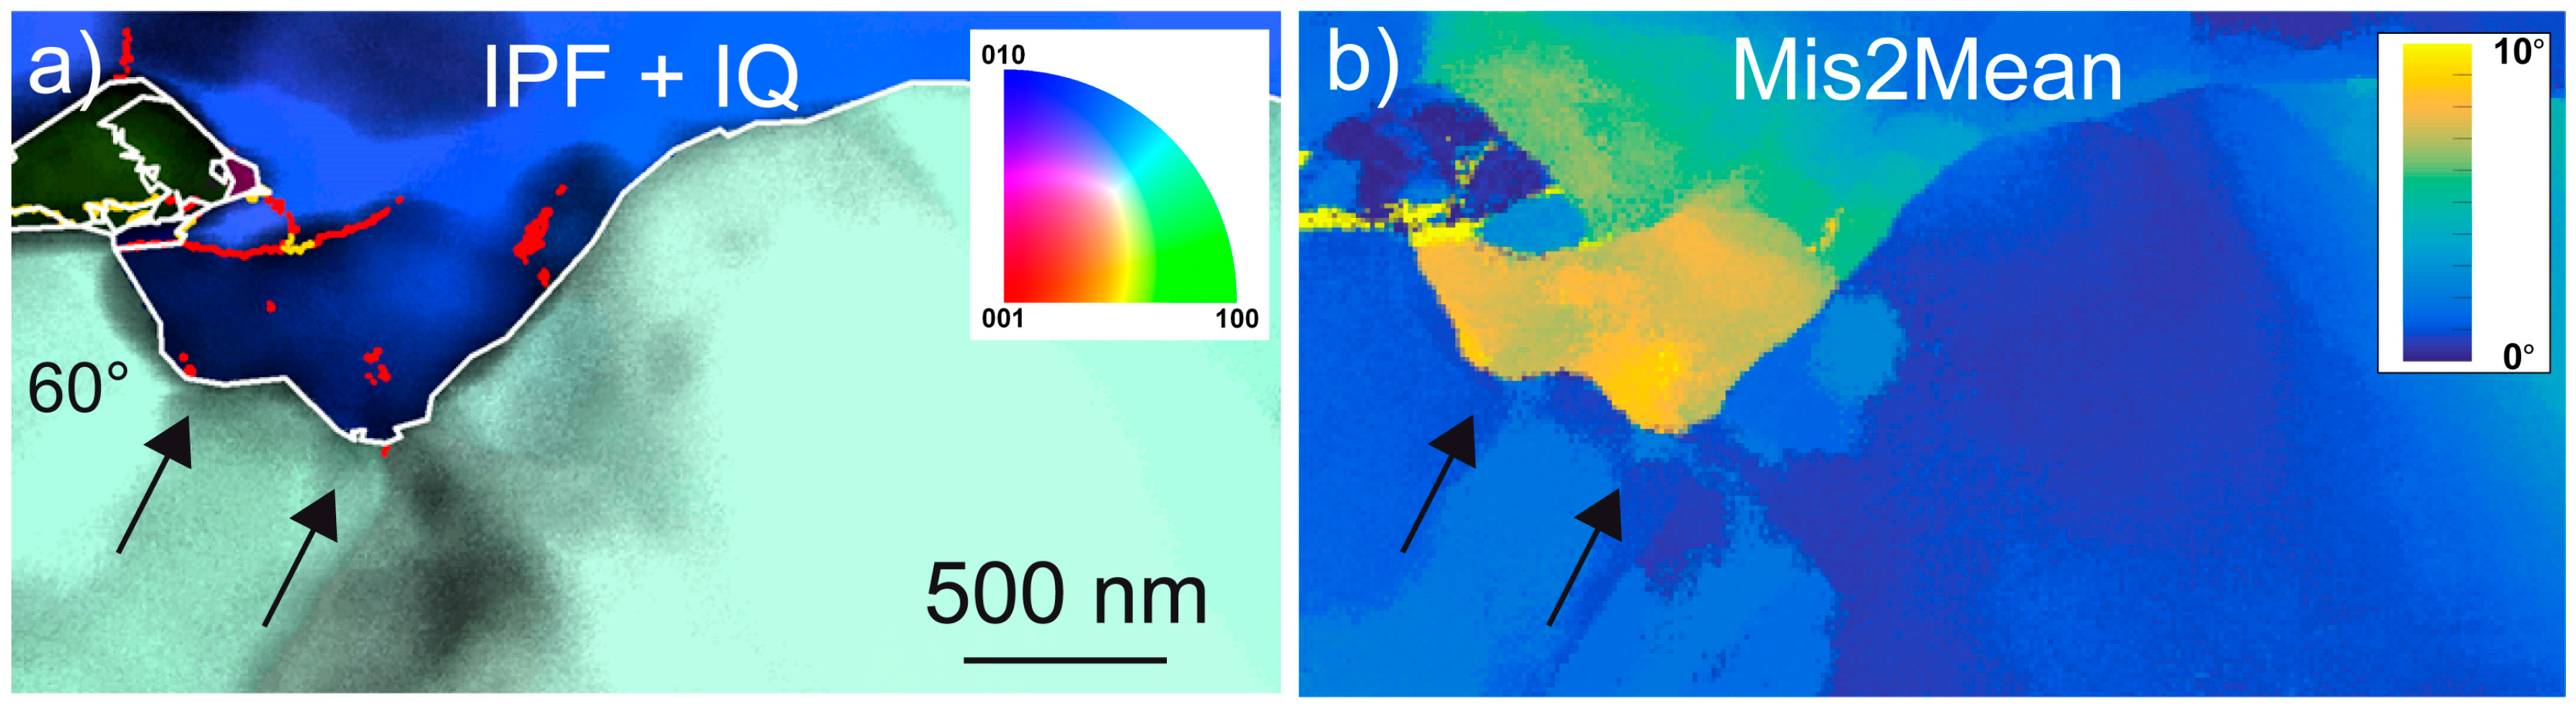
KAM, Mis2mean, and GOS approaches are complementary.

3. Results

It is first worth mentioning that the samples chosen for this study corresponded to rather large strains. For70B was deformed up to 40%. As deformation was performed in situ on a synchrotron beamline, the strain could be followed up and measured accurately in situ during deformation. M642 was not deformed at a beamline, and the plastic strain of 25% measured ex situ (Table 1) was an estimation from the measurement of the sample length in the capsule after deformation. In such samples, the dislocation density can be quite high and can give rise to multiple diffraction contrasts, which makes observation difficult on the TEM (Figure 1a). Here, we present an alternative approach based on scanning precession electron diffraction (SPED), which allows the orientation maps to be recorded with high resolution (6 nm in the present case). This technique has already been used by us to characterize highly deformed specimens from high-pressure experiments [30,31]. In those studies, we had shown that the microdiffraction spot patterns were very robust against the defect microstructure and that high-quality orientation maps could be obtained on deformed samples. In this study, the microstructure was imaged with this technique (Figure 1), allowing us to obtain information about intragranular misorientations.
Examples of the grain microstructure in M642 characterized by numerous subgrain/low-angle boundaries (SGB) with very curvy shapes are shown in Figure 2 and Figure 3. On the IPF (orientation maps in Figure 2a and Figure 3a), the single color corresponds to a single orientation and hence to a single grain each. However slight changes of colors in a grain indicate local misorientations, which correspond to SGBs (indicated by arrows in Figure 2 and Figure 3). A better visualization is obtained from the Mis2Mean maps, which enhances the contrast of intragranular misorientations (Figure 2b and Figure 3b).
A curved SGB (arrows in white) and a high angle (90°) grain boundary (arrows in black), which exhibited serration with a much smaller length scale, are presented in Figure 4. This observation was not unique as many other examples of curved GBs were found in M642. Another example of a curved high-angle GB is shown in Figure 5.
Sample For70B was more strained than M642 (40% strain versus 25%, respectively, as shown in Table 1), with a significantly different microstructure. The characteristic dislocation density was of the order of 1015 m−2 in For70B, while it was close to 1013 m−2 in M642 (values obtained from TEM measurement using the method of Ham [32]). However, pervasive occurrences of curved GBs and SGBs were still observed. Several examples can be seen in Figure 6, Figure 7 and Figure 8. A region where a curved grain boundary (60° misorientation) encloses a domain with a highest GROD, leading to the formation of a low-angle SGB (in red), is presented in Figure 8.
In addition, we found a lot of evidence for recrystallization in this sample (Figure 9 and Figure 10). New grains were found to nucleate at GBs, forming necklaces. The newly nucleated grains generally exhibited rather low GOS values, although some of them started to present some evidence for intragranular deformation (dislocations). To further establish the origin of those grains and decipher the mechanism responsible for the formation of those new grains, we compared their orientations with those of the parent grains (Figure 10c–e).

4. Discussion

The samples characterized here were highly strained at 1100 °C. Hence, they exhibited deformation microstructure with high dislocation density. After ca. 25% strain (M642), the dislocation density was in the order of 1013 m−2, which raised no particular problems for TEM observation. After 40% strain, the dislocation density reached 1015 m−2, which rendered TEM characterization more difficult because dislocation contrasts strongly overlap [17]. In this study, we used orientation maps obtained from ACOM-TEM, which is not very much affected by large dislocation densities. We focused our attention on grain and subgrain morphologies as well as on the formation of new grains to shed some light on the recovery and recrystallization mechanisms.
We observed that recrystallization involving the formation of new grains occurred in forsterite aggregates deformed at 1100 °C at 3.0–3.5 GPa confining pressure and a strain rate of ~5 × 10⁻⁵ s−1 after large strains. Indeed, recrystallized grains were abundant in For70B deformed up to 40% and much less common in M642 deformed up to 25%. The recrystallization origin for the small grains was suggested from their morphology (forming necklaces between highly deformed grains), from their orientations close to the surrounding grains as well as from their rather low internal strains. Trepmann et al. [12] observed microstructures comparable to ours, with necklaces of new grains mostly formed at GB. This suggests that, in olivine, discontinuous dynamic recrystallization (dDRX) dominates, as opposed to continuous dynamic recrystallization (cDRX), where new grains arise from the continuous increase in misorientation due to the continuous accumulation of dislocations in SGBs [15]. It is worth noting that, in dDRX, new grains, originally free of dislocations, nucleate at site of high-strain energy and orientation gradients, most often grain boundaries [14]. Meanwhile, in cDRX, “dislocations organize themselves into low-angle boundaries, leading to formation of subgrains (polygonization). Continuous dislocation accumulation results in progressive increase in the misorientation at the low-angle boundaries, which evolve into high-angle boundaries” [33].
However, the formation of new grains is not the only mechanism involved in dynamic recrystallization; the migration of grain boundaries is another important mechanism [4]. In olivine, this mechanism has been mostly documented at higher temperatures from the mechanical point of view and from rheological data analysis, with only few microstructural evidences reported. Indeed, performing static annealing experiments in olivine at 1240–1500°C, Toriumi [34] determined the average GB migration rates. Lee et al. [6] found clear evidence for modifications of crystal preferred orientations (CPO) by grain boundary migration in samples deformed in simple shear geometry in the temperature range of 1200–1300 °C. Later, Boneh et al. [8] described the effect of annealing at 1 GPa, 1250 °C, on a Fo50 olivine aggregate, which was previously deformed in torsion at a confining pressure of 0.3 GPa and 1200 °C in a Paterson apparatus. From the grain size evolution, they calculated a mean grain boundary mobility of 6.6 × 10⁻¹⁶ m3/N∙s at 1250 °C (a value that can be compared to 2 × 10⁻¹⁵ m3/N∙s, which was the grain mobility value found by Cooper and Kohlstedt [35] during secondary recrystallization after sintering at 1300–1400 °C). The shape of boundaries is usually the main source of post mortem information about grain boundary migration processes. In some cases, fractal analysis has been employed to quantify the serration of GB [36] and to correlate it to the strain rate or temperature. The curvature of boundaries is the most widely used morphological feature to infer GB mobility, especially in naturally deformed rocks [37,38,39]. Some examples of this can be observed in Figure 11. It is well known that GBs are nonequilibrium defects, and application of any equilibrium thermodynamics must always be done with care (see a careful discussion of these aspects in Gottstein and Shvindlerman [40]). Still, a GB or a SGB are characterized by their surface tension γ , and any increase in the surface area of the boundary will result in an increase in the Gibbs energy of the system. The SGBs observed in Figure 2 and Figure 3 can then hardly be interpreted as recovery features in the sense of dislocations rearranging into SGBs so as to minimize stored strain energy; this is because SGBs have lower long-range stress fields than isolated dislocations. In the absence of strong anisotropy of surface tension, an equilibrium shape of SGBs would correspond to a zero Laplace curvature. In contrast, (S)GB curvature results in a driving force to straighten the boundary. If this driving force is responsible for boundary migration, the boundary is expected to move toward its center of curvature [40,41]. However, in deformed samples, the boundary surface tension is not the only source of driving force for grain boundary motion. During DRX, another driving force comes from the reduction in elastically stored energy, which is strongly controlled by the density of dislocations. When observing curved SGBs, one can thus expect them to delimitate subgrains with different elastically stored energies. In metallurgy, that strain energy is usually considered the dominant driving force. To a first order and within a mean field approximation, the driving pressure due to stored dislocation produced by the plastic strain P ε p l a s t can be evaluated from the dislocation density through the following relation [14,40]:
P ε p l a s t = 1 2 μ b 2 ( ρ ( ε ) ρ 0 ) 1 2 μ b 2 ρ ( ε )
where ρ ( ε ) is the dislocation density caused by the plastic strain (compared to ρ 0 , which describes the undeformed state); μ is the shear modulus (65 GPa for olivine); and b the modulus of the Burgers vector (either 4.75 Å for [100] dislocations or 5.97 Å for [001] dislocations in olivine). With a dislocation density of the order of 1013 m−2, this gives an order of magnitude for the driving force arising from stored strain energy of 0.1 MPa. For a dislocation density of 1015 m−2, this driving force is of the order of 10 MPa (this is an upper bound because, in most cases, a boundary will separate domains that both contain dislocations). This can be compared with the surface tension/curvature driving force. The driving pressure due to boundary energy is given as follows:
P γ = 2 γ R
where γ is the surface energy of (sub)grain boundaries, and R is the local radius of curvature of the boundary. This driving force can be evaluated by utilizing the results of the work by Duyster and Stökhert [42]. According to their study, for high-angle GB, the boundary energy amounts to about 1.4 J∙m−2. For subgrain/low-angle boundaries, this value depends, of course, on the misorientation angle. This is ca. 0.5 J∙m−2 when the misorientation is 5° and increases up to ca. 1.3 J∙m−2 when the misorientation reaches 10°. The important parameter, however, is the length scale of boundary bending. The observations presented in the present paper were made using TEM, with a spatial resolution much higher than in EBSD. In Figure 2, for instance, the radius of curvature of the SGB arrows was in the range of 200–500 nm, which led to a surface tension driving force of slightly greater that 2 MPa. Similar values (1–3 MPa) were obtained for the SGB presented in Figure 3 and Figure 4. In Figure 4, it can be seen that the 90° GB exhibited undulations with very short radii of curvature (40–50 nm), leading to higher tension driving force (up to ca. 60 MPa). In Figure 5, the radius of curvature of the 80° grain boundary (200 nm) corresponded to a driving force of the order of 15 MPa. The first conclusion of this analysis is that, in samples deformed at relatively large strains (25–40%) at 1100 °C, GB surface tension represents a major, and probably dominant, driving force for GB migration. In this study, we used the KAM to visualize the local intragranular misorientations gradients as a proxy for the strain energy. Indeed, we can see in Figure 4 and Figure 5 that the boundaries separated domains with contrasting strain energies. Interestingly, in these figures, we can observe that the concave side of the curved boundaries corresponded to a high elastically stored energy. This means that both driving forces (surface tension and strain energies) were acting together in the same direction. Although our observations are static and performed post mortem on deformed samples, we think that they provide convincing evidence that SGB migration is an active process in forsterite deformed at 1100 °C and large strains and that SGB morphology (serrated boundaries) is a good indicator for this process.
Furthermore, we can see a significant evolution between the two samples, i.e., as a function of strain. In M642 (25% strain), GB migration seems to be the major recovery/softening process. Evidence for this mechanism can also be observed in For70B deformed to a higher extent (40%). However, another mechanism involving the formation of new, undeformed grains is now very active.
In copper, Miura and co-workers [43] showed how GB serration resulting from migration could assist nucleation of new grains and recrystallization. In that study, bulging followed by local boundary migration was accompanied by twinning, resulting in a small domain being the nucleus of a new grain. A similar mechanism was observed in ice [44], where, in the absence of twinning, formation of a SGB at the edges of the bulged part of the GB was the mechanism to close the domain. We found evidence for this mechanism in For70B, as illustrated in Figure 8. Here, a 60° GB bulged, leaving behind a misoriented domain that started to close through the formation of a SGB. The bulging mechanism is thus a potential mechanism to account for the nucleation of recrystallized grains. One way to test this hypothesis is to look at the relative misorientation between the recrystallized and the parent grains [44]. Unlike nucleation, which is likely to produce random texture (unless there are some preferential epitaxial relationships), the bulging mechanism is expected to yield orientations that cluster around the parent orientations because new grains are formed by continuous misorientations of domains of the parent grains. The new grain orientations are always in the vicinity of the parent ones, although it is not always the same orientation, which is the closest (Figure 10c–e). However, an alternative mechanism to bulging is suggested with Figure 10. At the top of grain 1, one can see a series of SGB, which locally produced a significant misorientation (along the short segment AB, the misorientation amplitude was 24°). On this observation, we can speculate that, upon further deformation, these misoriented domains could evolve to new grains. We did observe that, in our samples, SGB migration was a very active mechanism. We suggest that when these SGBs pile up at GB, they build up misoriented domains that leads to the formation of new grains as in the case of bulging.
Observation of naturally deformed olivine-rich rocks shows microstructures that are very similar to ours (Figure 11). One can observe much evidence of sinuous GB and interpenetrating olivine–olivine GB, indicating active grain boundary migration [37,38,39]. Only the length scales are different due to the differences in strain rates and stresses between natural and experimental deformation conditions. We thus conclude that the recovery and recrystallization mechanism evidenced in this study on forsterite also operate in olivine under natural conditions.

5. Conclusions

In this study, using orientation mapping of highly deformed forsterite samples, we carried out a detailed microstructural investigation using ACOM-TEM, which shed new light on the recovery and recrystallization mechanisms in forsterite. At the resolution of the TEM, we found pervasive evidence for wavy (S)GBs with radii of curvature less than a micron, which we interpreted as an indication of boundary migration being an active recovery mechanism. At larger strains (40% in our experimental conditions), we observed ubiquitous dDRX, which resulted from the formation of new, undeformed grains at GBs. The new grains did not exhibit random orientations; rather, they clustered in the vicinity of the orientations of the parent grains, supporting bulging as a potential formation mechanism. Indeed, we found some configurations supporting this hypothesis. However, there were other observations that support an alternative nucleation mechanism based on the accumulation of migrating SGBs at GBs. Thus, some questions remain unanswered. Grain boundary sliding is often invoked as a source of high strain gradients at the GBs. Microstructural evidence for sliding at GBs have indeed been reported in olivine, either deformed in the diffusion creep regime [45,46] or in the dislocation creep regime [18]. However, in the present post mortem study, we did not have a marker to confirm or dismiss the possible contribution of GBs in the nucleation of new grains.
We suggest that the recovery and recrystallization mechanism evidenced in this study on forsterite may also operate in olivine under natural conditions, given comparable observations have been made in naturally deformed olivine-rich rocks samples [37,38], which support our conclusions.

Author Contributions

C.B. and P.C. conceived the study; C.B. performed the deformation experiments; B.C.N., A.M., and P.C. performed TEM studies; B.C.N. and C.B. analyzed the data. All authors discussed and interpreted the results. C.B. and P.C. wrote the paper with contribution from all authors.

Acknowledgments

This work in Lille (France) was supported by funding from the European Research Council under the Seventh Framework Programme (FP7), ERC grant N°290424–RheoMan to P. Cordier. The TEM facility in Lille was supported by the Conseil Regional du Nord-Pas de Calais, and the European Regional Development Fund (ERDF). The deformation of sample M642 at the Bayerisches GeoInstitut was supported by the German Alexander von Humboldt Foundation and the Free State of Bavaria.

Conflicts of Interest

The authors declare no conflict of interest.

References

  1. Von Mises, R.V. Mechanik der plastischen Formänderung von Kristallen. Z. Angew. Math. Mech. 1928, 8, 161–185. [Google Scholar] [CrossRef]
  2. Taylor, G.I. Plastic strain in metals. J. Inst. Met. 1938, 62, 307–324. [Google Scholar]
  3. Demouchy, S.; Mussi, A.; Barou, F.; Tommasi, A.; Cordier, P. Viscoplasticity of polycrystalline olivine experimentally deformed at high pressure and 900 °C. Tectonophysics 2014, 623, 123–135. [Google Scholar] [CrossRef]
  4. Drury, M.R.; Urai, J.L. Deformation-related recrystallization processes. Tectonophysics 1990, 3–4, 235–253. [Google Scholar] [CrossRef]
  5. Wenk, H.R.; Tomé, C.N. Modeling dynamic recrystallization of olivine aggregates deformed in simple shear. J. Geophys. Res. 1999, 104, 25513–25527. [Google Scholar] [CrossRef] [Green Version]
  6. Lee, K.-H.; Jiang, Z.; Karato, S.-I. A scanning electron microscope study of the effects of dynamic recrystallization on lattice preferred orientation in olivine. Tectonophysics 2002, 351, 331–341. [Google Scholar] [CrossRef]
  7. Falus, G.; Tommasi, A.; Soustelle, V. The effect of dynamic recrystallization on olivine crystal preferred orientations in mantle xenoliths deformed under varied stress conditions. J. Struct. Geol. 2011, 33, 1528–1540. [Google Scholar] [CrossRef]
  8. Boneh, Y.; Wallis, D.; Hansen, L.N.; Krawczynski, M.J.; Skemer, P. Oriented grain growth and modification of ‘frozen anisotropy’ in the lithospheric mantle. Earth Planet. Sci. Lett. 2017, 474, 368–374. [Google Scholar] [CrossRef]
  9. Austin, N.J.; Evans, B. Paleowattmeters: A scaling relation for dynamically recrystallized grain size. Geology 2007, 35, 343–346. [Google Scholar] [CrossRef]
  10. Ricard, Y.; Bercovici, D. A continuum theory of grain size evolution and damage. J. Geophys. Res. 2009, 114, B01204. [Google Scholar] [CrossRef]
  11. Rozel, A.; Ricard, Y.; Bercovici, D. A thermodynamically self-consistent damage equation for grain size evolution during dynamic recrystallization. Geophys. J. Int. 2011, 184, 719–728. [Google Scholar] [CrossRef] [Green Version]
  12. Trepmann, C.A.; Renner, J.; Druiventak, A. Experimental deformation and recrystallization of olivine–processes and timescales of damage healing during postseismic relaxation at mantle depths. Solid Earth 2013, 4, 423–450. [Google Scholar] [CrossRef]
  13. Karato, S.; Toriumi, M.; Fuji, T. Dynamic recrystallization of olivine single crystals during high-temperature creep. Geophys. Res. Lett. 1980, 7, 649–652. [Google Scholar] [CrossRef]
  14. Humphreys, F.J.; Hatherly, M. Recrystallization and Related Annealing Phenomena, 2nd ed.; Elsevier: Oxford, UK, 2004; pp. xxi–xxii. ISBN 9780080441641. [Google Scholar]
  15. Sakai, T.; Belyakov, A.; Kaibyshev, R.; Miura, H.; Jonas, J.J. Dynamic and post-dynamic recrystallization under hot, cold and severe plastic deformation conditions. Prog. Mater. Sci. 2014, 60, 130–207. [Google Scholar] [CrossRef]
  16. Bollinger, C.; Raterron, P.; Cordier, P.; Merkel, S. Polycrystalline olivine rheology in dislocation creep: Revisiting experimental data to 8.1 GPa. Phys. Earth Planet. Inter. 2014, 228, 211–219. [Google Scholar] [CrossRef]
  17. Bollinger, C.; Merkel, S.; Cordier, P.; Raterron, P. Deformation of forsterite polycrystals at mantle pressure: Comparison with Fe-bearing olivine and the effect of iron on its plasticity. Phys. Earth Planet. Inter. 2015, 240, 95–104. [Google Scholar] [CrossRef] [Green Version]
  18. Bollinger, C.; Marquardt, K.; Ferreira, F. Intragranular plasticity vs. grain boundary sliding (GBS) in forsterite: Microstructural evidence at high pressures (3.5–5.0 GPa). Am. Min. 2018. [Google Scholar] [CrossRef]
  19. Guignard, J.; Bystricky, M.; Béjina, F. Dense fine-grained aggregates prepared by spark plasma sintering (SPS), an original technique in experimental petrology. Eur. J. Mineral. 2011, 23, 323–331. [Google Scholar] [CrossRef]
  20. Manthilake, M.A.G.M.; Walter, N.; Frost, D.J. A new multi-anvil press employing six independently acting 8 MN hydraulic rams. High. Press. Res. 2012, 32, 195–207. [Google Scholar] [CrossRef]
  21. Durham, W.B.; Weidner, D.J.; Karato, S.I.; Wang, Y. New developments in deformation experiments at high pressure. Rev. Mineral. Geochem. 2002, 51, 21–49. [Google Scholar] [CrossRef]
  22. Wang, Y.; Durham, W.B.; Getting, I.C.; Weidner, D.J. The deformation-DIA: A new apparatus for high temperature triaxial deformation to pressures up to 15 GPa. Rev. Sci. Instrum. 2003, 74, 3002–3011. [Google Scholar] [CrossRef]
  23. Rauch, E.F.; Véron, M. Automated crystal orientation and phase mapping in TEM. Mater. Charact. 2014, 98, 1–9. [Google Scholar] [CrossRef]
  24. Birle, J.D.; Gibbs, G.V.; Moore, P.B.; Smith, J.V. Crystal structures of natural olivines. Am. Mineral. 1968, 53, 807–824. [Google Scholar]
  25. Rauch, E.F.; Dupuy, L. Rapid diffraction patterns identification through template matching. Arch. Metall. Mater. 2005, 50, 87–99. [Google Scholar]
  26. Hielscher, R.; Schaeben, H. A novel pole figure inversion method: Specification of the MTEX algorithm. J. Appl. Cryst. 2008, 41, 1024–1037. [Google Scholar] [CrossRef]
  27. Bachmann, F.; Hielscher, R.; Schaeben, H. Grain detection from 2d and 3d EBSD data–Specification of the MTEX algorithm. Ultramicroscopy 2011, 111, 1720–1733. [Google Scholar] [CrossRef] [PubMed]
  28. Wright, S.I.; Nowell, M.M.; Field, D.P. A review of strain analysis using electron backscatter diffraction. Microsc. Microanal. 2011, 17, 316–329. [Google Scholar] [CrossRef]
  29. Godfrey, A.; Cao, W.Q.; Hansen, N.; Liu, Q. Stored energy, microstructure, and flow stress of deformed metals. Metall. Mater. Trans. A 2005, 36, 2371–2378. [Google Scholar] [CrossRef]
  30. Nzogang, B.C.; Bouquerel, J.; Cordier, P.; Mussi, A.; Girard, J.; Karato, S. Characterization by scanning precession electron diffraction of an aggregate of bridgmanite and ferropericlase deformed at HP-HT. Geochem. Geophys. Geosyst. 2018, 19, 582–594. [Google Scholar] [CrossRef]
  31. Nzogang, B.C.; Thilliez, S.; Mussi, A.; Kawazoe, T.; Miyajima, N.; Bouquerel, J.; Cordier, P. Application of Scanning Precession Electron Diffraction in the Transmission Electron Microscope to the Characterization of Deformation in Wadsleyite and Ringwoodite. Minerals 2018, 8, 153. [Google Scholar] [CrossRef]
  32. Ham, R.K. The determination of dislocation densities in thin films. Philos. Mag. 1961, 6, 1183–1184. [Google Scholar] [CrossRef]
  33. Signorelli, J.; Tommasi, A. Modeling the effect of subgrain rotation recrystallization on the evolution of olivine crystal preferred orientations in simple shear. Earth Planet. Sci. Lett. 2015, 430, 356–366. [Google Scholar] [CrossRef]
  34. Toriumi, M. Grain boundary migration in olivine at atmospheric pressure. Phys. Earth Planet. Inter. 1982, 30, 26–35. [Google Scholar] [CrossRef]
  35. Cooper, R.F.; Kohlstedt, D.L. Sintering of olivine and olivine-basalt aggregates. Phys. Chem. Miner. 1984, 11, 5–16. [Google Scholar] [CrossRef]
  36. Takahashi, M.; Nagahama, H.; Masuda, T.; Fujimura, A. Fractal analysis of experimentally, dynamically recrystallized quartz grains and its possible application as a strain rate meter. J. Struct. Geol. 1998, 20, 269–275. [Google Scholar] [CrossRef]
  37. Vauchez, A.; Dineur, F.; Rudnick, R. Microstructure, texture and seismic anisotropy of the lithospheric mantle above a mantle plume: Insights from the Labait volcano xenoliths (Tanzania). Earth Planet. Sci. Lett. 2005, 232, 295–314. [Google Scholar] [CrossRef]
  38. Tommasi, M.; Godard, M.; Coromina, G.; Dautria, J.M.; Barsczus, H. Seismic anisotropy and compositionally induced velocity anomalies in the lithosphere above mantle plumes: A petrological and microstructural study of mantle xenoliths from French Polynesia. Earth Planet. Sci. Lett. 2004, 227, 539–556. [Google Scholar] [CrossRef]
  39. Tommasi, A.; Baptiste, V.; Vauchez, A.; Holtzman, B. Deformation, annealing, reactive melt percolation, and seismic anisotropy in the lithospheric mantle beneath the southeastern Ethiopian rift: Constraints from mantle xenoliths from Mega. Tectonophysics 2016, 682, 186–205. [Google Scholar] [CrossRef]
  40. Gottstein, G.; Shvindlerman, L.S. Grain Boundary Migration in Metals, 2nd ed.; CRC Press, Taylor and Francis group: Boca Raton, FL, USA, 2010; p. 674. ISBN 978-1-4200-5436-1. [Google Scholar]
  41. Mullins, W.W. Two-dimensional motion of idealized grain boundaries. J. Appl. Phys. 1956, 27, 900–904. [Google Scholar] [CrossRef]
  42. Duyster, J.; Stöckhert, B. Grain boundaries energies in olivine derived from natural microstructures. Contrib. Mineral. Petrol. 2001, 140, 567–576. [Google Scholar] [CrossRef]
  43. Miura, H.; Sakai, T.; Mogawa, R.; Jonas, J.J. Nucleation of dynamic recrystallization and variant selection in copper bicrystals. Philos. Mag. 2007, 87, 4197–4209. [Google Scholar] [CrossRef]
  44. Chauve, T.; Montagnat, M.; Barou, F.; Hidas, K.; Tommasi, A.; Mainprice, D. Investigation of nucleation processes during dynamic recrystallization of ice using cryo-EBSD. Philos. Trans. R. Soc. A 2017, 375. [Google Scholar] [CrossRef] [PubMed]
  45. Maruyama, G.; Hiraga, T. Grain- to multiple-grain-scale deformation processes during diffusion creep of forsterite + diopside aggregate: 1. Direct observations. J. Geophys. Res. 2017, 122, 5890–5915. [Google Scholar] [CrossRef]
  46. Maruyama, G.; Hiraga, T. Grain- to multiple-grain-scale deformation processes during diffusion creep of forsterite + diopside aggregate: 2. Grain boundary sliding-induced grain rotation and its role in crystallographic preferred orientation in rocks. J. Geophys. Res. 2017, 122, 5916–5934. [Google Scholar] [CrossRef]
Figure 1. M642. (a) Conventional multibeam transmission electron microscopy (TEM) bright field. (b) Virtual bright field of the same area reconstructed from the intensity of the transmitted beams of the scanning precession electron diffraction (SPED) dataset (an example of a diffraction pattern acquired is presented). (c) Inverse pole figure (IPF) corresponding to the horizontal direction superimposed with the quality of indexation (IQ) (Equation (1)); color code inserted (Pnma). (d) Mis2Mean map, up to 7°.
Minerals 09 00017 g001
Figure 2. M642 subgrain boundaries (SGB; indicated by white arrows). (a) IPF corresponding to the direction perpendicular to the plane of view superimposed with the IQ (Equation (1)); color code inserted (Pnma). The subgrain boundary is highlighted by a red line. (b) Mis2Mean map corresponding to (a), up to 7°. Misorientation angles are indicated next to the boundary arrows.
Minerals 09 00017 g002
Figure 3. M642 SGB (indicated by white arrows). (a) IPF corresponding to the direction perpendicular to the plane of view superimposed with the IQ (Equation (1)); color code inserted (Pnma). White arrows point to a SGB (highlighted by a red line) with a misorientation of 5.2°. (b) Mis2Mean map corresponding to (a), up to 10°.
Minerals 09 00017 g003
Figure 4. M642 SGB (arrows in white) and GB (arrows in black). (a) IPF corresponding to the direction normal to the plane of representation, superimposed with the IQ (Equation (1)); color code inserted (Pnma). The SGB arrow in white has a misorientation of 5°, and the GB arrow in black has a misorientation of 90°. (b) Kernel average misorientation (KAM) map corresponding to (a), up to 7°.
Minerals 09 00017 g004
Figure 5. M642 GB. (a) IPF corresponding to the direction perpendicular to the plane of view superimposed with the IQ (Equation (1)); color code inserted (Pnma). The GB arrow in black has a misorientation of 80°. (b) Mis2Mean map corresponding to (a), up to 10 °. (c) KAM map corresponding to (a), up to 3°.
Minerals 09 00017 g005
Figure 6. For70B GB. (a) IPF corresponding to the direction perpendicular to the plane of view superimposed with the IQ (Equation (1)); color code inserted (Pnma). The GB arrow in black has a misorientation of 70°–80°. (b) Mis2Mean map corresponding to (a), up to 25°.
Minerals 09 00017 g006
Figure 7. For70B GB (arrows in black), SGB (arrows in white), and small grains. (a) IPF corresponding to the direction perpendicular to the plane of view superimposed with the IQ (Equation (1)); color code inserted (Pnma). The misorientation of some boundaries are indicated next to them. (b) Mis2Mean map corresponding to (a), up to 35°.
Minerals 09 00017 g007
Figure 8. For70B GB bulging. (a) IPF corresponding to the direction perpendicular to the plane of view superimposed with the IQ (Equation (1)); color code inserted (Pnma). The GB arrowed in black (and highlighted by a white line) has a misorientation of 60°. The SGB in formation is highlighted by a red line. (b) Mis2Mean map corresponding to (a), up to 10 °.
Minerals 09 00017 g008
Figure 9. For70B small grains. (a) IPF corresponding to the direction perpendicular to the plane of view superimposed with the IQ (Equation (1)); color code inserted (Pnma). The misorientation of some boundaries (arrowed in black) are indicated next to them. (b) Grain orientation spread (GOS) map corresponding to (a).
Minerals 09 00017 g009
Figure 10. For70B small grains. (a) IPF corresponding to the direction perpendicular to the plane of view superimposed with the IQ (Equation (1)); color code inserted (Pnma). (b) GOS map corresponding to (a). (ce) Orientations of the recrystallized grains (color coded as in (a)) compared to those of the parent grains (labeled 1, 2, and 3 as in (a)). (f) Misorientation profile along the segment A–B displayed in (a).
Minerals 09 00017 g010
Figure 11. Evidence for GB and SGB migration and GB bulging in natural samples (arrows). (a) Olivine grains within a coarse porphyroclastic harzburgite (ET72, see [39]) shown with well-developed (100) SGB and very sinuous GB; courtesy A. Tommasi. (b) Olivine grains in a dunite from French Polynesia (RP6, see [38]); courtesy A. Tommasi. (c) Olivine grains in a harzburgite from French Polynesia (RPA18A, see [38]); courtesy A. Tommasi. (d) Evidence for GB bulging in olivine within a peridotite from a Labait volcano xenolith (Tanzania, [37]); courtesy A. Vauchez.
Minerals 09 00017 g011
Table 1. Conditions of deformation of the samples characterized in this study.
Run #T (°C)P (GPa) ε ˙ (10−5 s−1)ε (%)Average Grain Size (µm)Def.Deformation PressReference Paper
M64211003.55.0~2520–100Pure shear6-ram MAVO press, BGI, Bayreuth, Germany[18]
For70B11003.14.5400.2–3.0UniaxialD-DIA, NSLS, NY, USA[17]

