Article

Influence of the Structure and Experimental Surfaces Modifications of 2:1 Clay Minerals on the Adsorption Properties of Methylene Blue

by
Laura Pardo
1,
Juan Antonio Cecilia
1,
Cristina López-Moreno
2,
Víctor Hernández
2,
Manuel Pozo
3,
María José Bentabol
1 and
Francisco Franco
1,*
1
Departamento de Química Inorgánica, Cristalografía y Mineralogía, Facultad de Ciencias, Campus de Teatinos s/n, Universidad de Málaga, 29071 Málaga, Spain
2
Departamento de Química Física, Facultad de Ciencias, Campus de Teatinos s/n, Universidad de Málaga, 29071 Málaga, Spain
3
Departamento de Geología y Geoquímica, Facultad de Ciencias, Universidad Autónoma de Madrid, Campus de Cantoblanco, 28049 Madrid, Spain
*
Author to whom correspondence should be addressed.
Minerals 2018, 8(8), 359; https://doi.org/10.3390/min8080359
Submission received: 4 July 2018 / Revised: 11 August 2018 / Accepted: 17 August 2018 / Published: 19 August 2018
(This article belongs to the Special Issue Authigenic Clay Minerals: Mineralogy, Geochemistry and Applications)

Abstract

:
In this work the adsorption capacities of methylene blue on Mg-smectite and sepiolite and its derived material obtained after acid treatment and/or the addition of Fe at its surfaces are studied. Natural smectite with high Mg-content in its octahedral sheet (Mg-smectite) displays higher adsorption capacity than the sepiolite due to the ability of Mg-smectite to expand the basal spacing to accommodate methylene blue cations between adjacent layers and the inability of sepiolite to adsorb these cations within the structural channels. The acid-activation of Mg-smectite causes a clear decrease in the adsorption capacity attributed to the partial loss of the interlayer positions by the loss of the octahedral sheet and subsequent formation of amorphous silica. Moreover, the adsorption of the Mg-smectite decreases even more when iron oxohydroxides species are incorporated in its interlayer spacing making inaccessible the interlayer active sites for the adsorption of methylene blue cations. On the contrary, the microwave-assisted acid treatment of sepiolite causes a slight increase in the adsorption capacity related with the dispersion of fibers. Nevertheless, contrary to that observed with Mg-smectite, higher increasing of adsorption capacities are obtained after the formation of new adsorption centers due to the incorporation of iron oxohydroxides species at the external surfaces of sepiolite.

1. Introduction

Water is an indispensable resource for the existence of life in the planet. Among several water pollutants, industrial dyes have been considered an important issue worldwide [1]. Nowadays, dyes are used in a large number of applications such as in the textile industry in wool, silk, acrylic, leather, or nylon. In addition, dyes are frequently employed in the field of cosmetics or in food. Among 10–15% of these dyes are discharged into the water without pretreatment causing damage to the environment and also to the human health even at low concentrations [2,3].
Several processes have been proposed to bring down the dumping of dyes into the water such as aerobic or anaerobic digestion, oxidation, ozonation, membrane separation, reverse osmosis, sedimentation, precipitation, or flotation. These treatments show a high efficiency for low scale or low proportion of dye; however, most of them are not competitive for larger proportions of dyes [4,5].
The use of inexpensive and available materials with high adsorption capacity is a sustainable alternative to retain pollutants coming from contaminated water [5]. Considering these premises, clay minerals have emerged as interesting materials owing to their high availability on the Earth´s surface and their thermochemical stability in a wide range of pH [6,7,8]. The capability of clay minerals to change their exchangeable cations by other cations more harmful to the environment, which are dissolved in the water, together with their ability to establish electrostatic interactions by hydrogen bonds between the clay mineral and the dye confers good adsorbent properties to these minerals, being adequate candidates to be used in many processes of environmental remediation [6].
Both smectite and sepiolite are clay minerals belonging to phyllosilicates group with many industrial applications. The physicochemical behavior on these materials depends of their structure and grain size, frequently smaller than 2 μm.
The smectite group of clay minerals consists of several species whose structure is based on the stacking of negatively charged 2:1 layers. These 2:1 layers are formed by two continuous tetrahedral sheets (T) with [SiO4]4− tetrahedral linked to adjacent tetrahedral molecules by sharing three corners, obtaining a bidimensional pattern with hexagonal structure along the a, b plane. An octahedral sheet (O) is located between these two T-sheets. They can be either dioctahedral or trioctahedral, depending on whether the octahedral sheet is fully filled with divalent (Mg2+ and Fe2+) or partially filled with trivalent cations (Al3+ and Fe3+). The negative charge of these 2:1 layers is balanced by hydrated exchangeable cations which are located in interlayer positions (mostly Ca2+, Mg2+, and Na+) [9].
The main species of dioctahedral smectites include aluminum smectites as montmorillonite (Mx/nn+[A14−xMgx][Si8]O20(OH)4·nH2O) [9] where the negative layer charge results from divalent cations replacing Al3+ cations in the octahedral sites. On the other hand the most important trioctahedral smectites are saponite, where the negative layer charge results from trivalent cations replacing Si4+ cations in the tetrahedral sites (Mx/nn+[Mg6][Si8−xAlx]O20(OH)4·nH2O), and stevensite, where the layer charge is interpreted as due to vacancies in octahedral positions (Mx/nn+[Mg6−xvacancyx][Si8]O20(OH)4·nH2O) [9].
Sepiolite is a fibrous phyllosilicate, whose chemical formula is Si12O30Mg8(OH)4(OH2)4·8H2O. Sepiolite structure is formed by sheets similar to those observed in the smectites, but the tetrahedra undergoes a periodic inversion (every 6 tetrahedra) along the b axis, leading to channels with a dimensions of 3.6 Å × 10.6 Å [10], which contains both physisorbed and zeolitic water [11,12]. The structure of sepiolite gives rise to materials with a high adsorption capacity both on the fiber surfaces as well as into the nanochannels.
The physicochemical properties of the clay minerals can be modified by several methods such as the insertion of polyoxocations and pillars [13,14] or by means of acid treatment [15,16,17,18,19], increasing the specific surface area and the pore volume of the clays minerals. Franco et al. have shown that, except for Hg(II), the Fe(III)-homoionic smectites display higher metal adsorption properties than that of activated carbon used previously [20]. Recently, it has been established the effectiveness of microwave-assisted acid treatment, obtaining a high modification in their textural properties in short irradiation times [17,18,19]. The use of microwave-assisted acid treatment (MAT) in the acid activation of clay minerals offers advantages over traditional methods including a higher heating rate that reduces the treatment time from 2 days to 16 min [17,18]. Recent studies on MAT of sepiolites and trioctahedral smectites point out the relevance of structural ordering and composition of octahedral sheet in the reactivity of these clay minerals to this type of acid treatment. In the case of sepiolite lower crystallinity and higher proportions of Mg2+ in the octahedral sheets increases the reactivity to MAT [17], whereas the chemical composition of the octahedral sheets, in the case of smectites, appears to be the main factor controlling the reactivity to MAT [18].
The aim of this work is assess the effect of microwave assisted acid treatment on the adsorption capacity of two clays with high Mg-content in the octahedral sheet (Mg-clays); one composed of Mg-smectite the other of sepiolite. The adsorption capacity of these clay materials have been evaluated using methylene blue. This cation is usually used to evaluate the sorption properties of clay minerals [21,22]. Nevertheless, in this work we use methylene blue in order to study the effect of the structure of starting clay minerals and its experimental modifications in the adsorption properties.

2. Materials and Methods

2.1. Materials

The study reported in the present work was carried out using a Mg-bentonite, supplied by TOLSA, with the commercial name ESMEGEL (Sm), and a raw sepiolite (Sp), both coming from the Madrid Basin deposits (Spain). The dye used in this research was methylene blue (C16H18ClN3S) (99%, Sigma-Aldrich). The gases evolved in the determination of the textural properties of the natural clay minerals and the obtained materials were He (Air Liquide 99.99%) and N2 (Air Liquide 99.9999%).

2.2. Microwave-Assisted Acid Treatment

The starting materials were modified by a microwave-assisted acid treatment following the methodology described previously [17,18]. In each microwave-assisted treatment, 5 g were treated with 50 mL of a nitric acid solution (0.2 N) for 8 min, using a microwave system EMS20100OX (Electrolux, Stockholm, Sweden), operating at 800 W and 2.45 GHz. In order to avoid exceeding a temperature higher than 100 °C in the system, the microwave irradiation was applied in a discontinuous form. Thus, after 1 min of microwave irradiation the suspensions were cooled for 5 min at room temperature. Then, samples were centrifuged and washed with deionized water until the complete removal of NO3 ions, as determined the Griess test. Finally, the samples modified by microwave-assisted acid treatment were dried overnight.

2.3. Iron Oxide Supported Clay Minerals

Fe(III) exchanged-smectite was prepared through the slow addition of a 0.2 M FeCl3·6H2O solution on the clay mineral dispersion in a proportion of 2 meq·g−1 of the starting smectites, stirring for 4 h at room temperature. After centrifugation, the Fe-smectites were washed by dialysis until chloride ions (AgNO3 test) elimination. Finally, samples were heated at 300 °C for 2 h.

2.4. Characterization

Powder patterns for the whole samples were collected on an X’Pert Pro MPD automated diffractometer (PANalytical B.V., Almelo, The Netherlands) equipped with a Ge(111) primary monochromator (strictly monochromatic CuKα1 radiation. PANalytical B.V., Almelo, The Netherlands) and an X’Celerator detector (PANalytical B.V., Almelo, The Netherlands). The overall measurement time was 33 min per pattern in order to obtain very good statistics over the 2θ range of 2–65° with 0.017° step size.
The X-ray fluorescence analysis (XRF) (major elements) of untreated and activated samples was performed using the MagiX X-ray fluorescence spectrometer of PANanytical (PANalytical B.V., Almelo, The Netherlands). Sodium was determined with an atomic absorption (AA) spectrophotometer (Varian 220-FS QU-106, Varian Inc., Palo Alto, CA, USA).
DRIFT spectra were collected on a Harrick HVC-DRP cell fitted to a Varian 3100 FT-IR spectrophotometer. The interferograms consisted of 200 scans with a resolution of 4 cm−1, and the spectra were collected using a KBr spectrum as a background. About 30 mg of finely ground clay-based materials were placed in the sample holder.
The textural parameters were evaluated from N2 adsorption–desorption isotherms at −196 °C, as determined by an automatic ASAP 2020 system from Micromeritics. Prior to the measurements, samples were outgassed at 120 °C and 10−4 mbar overnight. The specific surface areas (SBET) were determined through the BET equation [23], assuming a cross-section of 0.162 nm2 for the N2 molecule. The micropore area and micropore volume were determine from the t-plot method [24].
The shape and size of the starting samples were examined by scanning electron microscope (SEM) using a JEOL SM-6490 LV (Peabody, MA, USA). The samples for SEM observation were previously gold sputtered (10 nm thick) in order to avoid charging of the surface.

2.5. Batch Experiments

The kinetic adsorption experiments were carried out by stirring 0.1 g of sample in a solution of 100 mL with methylene blue (80 mg·L−1). The pH was maintained at 7 in all sorption experiments using small amounts of 0.1 N HNO3/NaOH in a beaker agitated vigorously by a magnetic stirrer at 400 rpm using a water bath maintained at a constant temperature 25 °C. After each experiment, samples were collected and centrifuged for 3 min at 5000 rpm and then measured by UV-Vis absorbance using a wavelength of 666 nm, using a UV-Vis spectrophotometer Agilent 8453. The kinetic experiments were carried out between 1 and 20 min for the Mg-bentonite, while adsorption times between 5 and 120 min were used to the kinetic studies for the sepiolite.
For the measurement of the adsorption isotherms, different initial concentrations of methylene blue were used (10 to 100 mg·L−1), using a clay weight of 0.03 g and equilibrium time of 10 min for Mg-bentonite and 0.1 g and equilibrium time of 1 h for sepiolite. In all experiments, after the contact time, aliquots were collected and centrifuged. In the supernatant the dye concentration was analyzed by UV-Vis absorbance, using a wavelength of 666 nm.

3. Results and Discussion

3.1. X-ray Diffraction

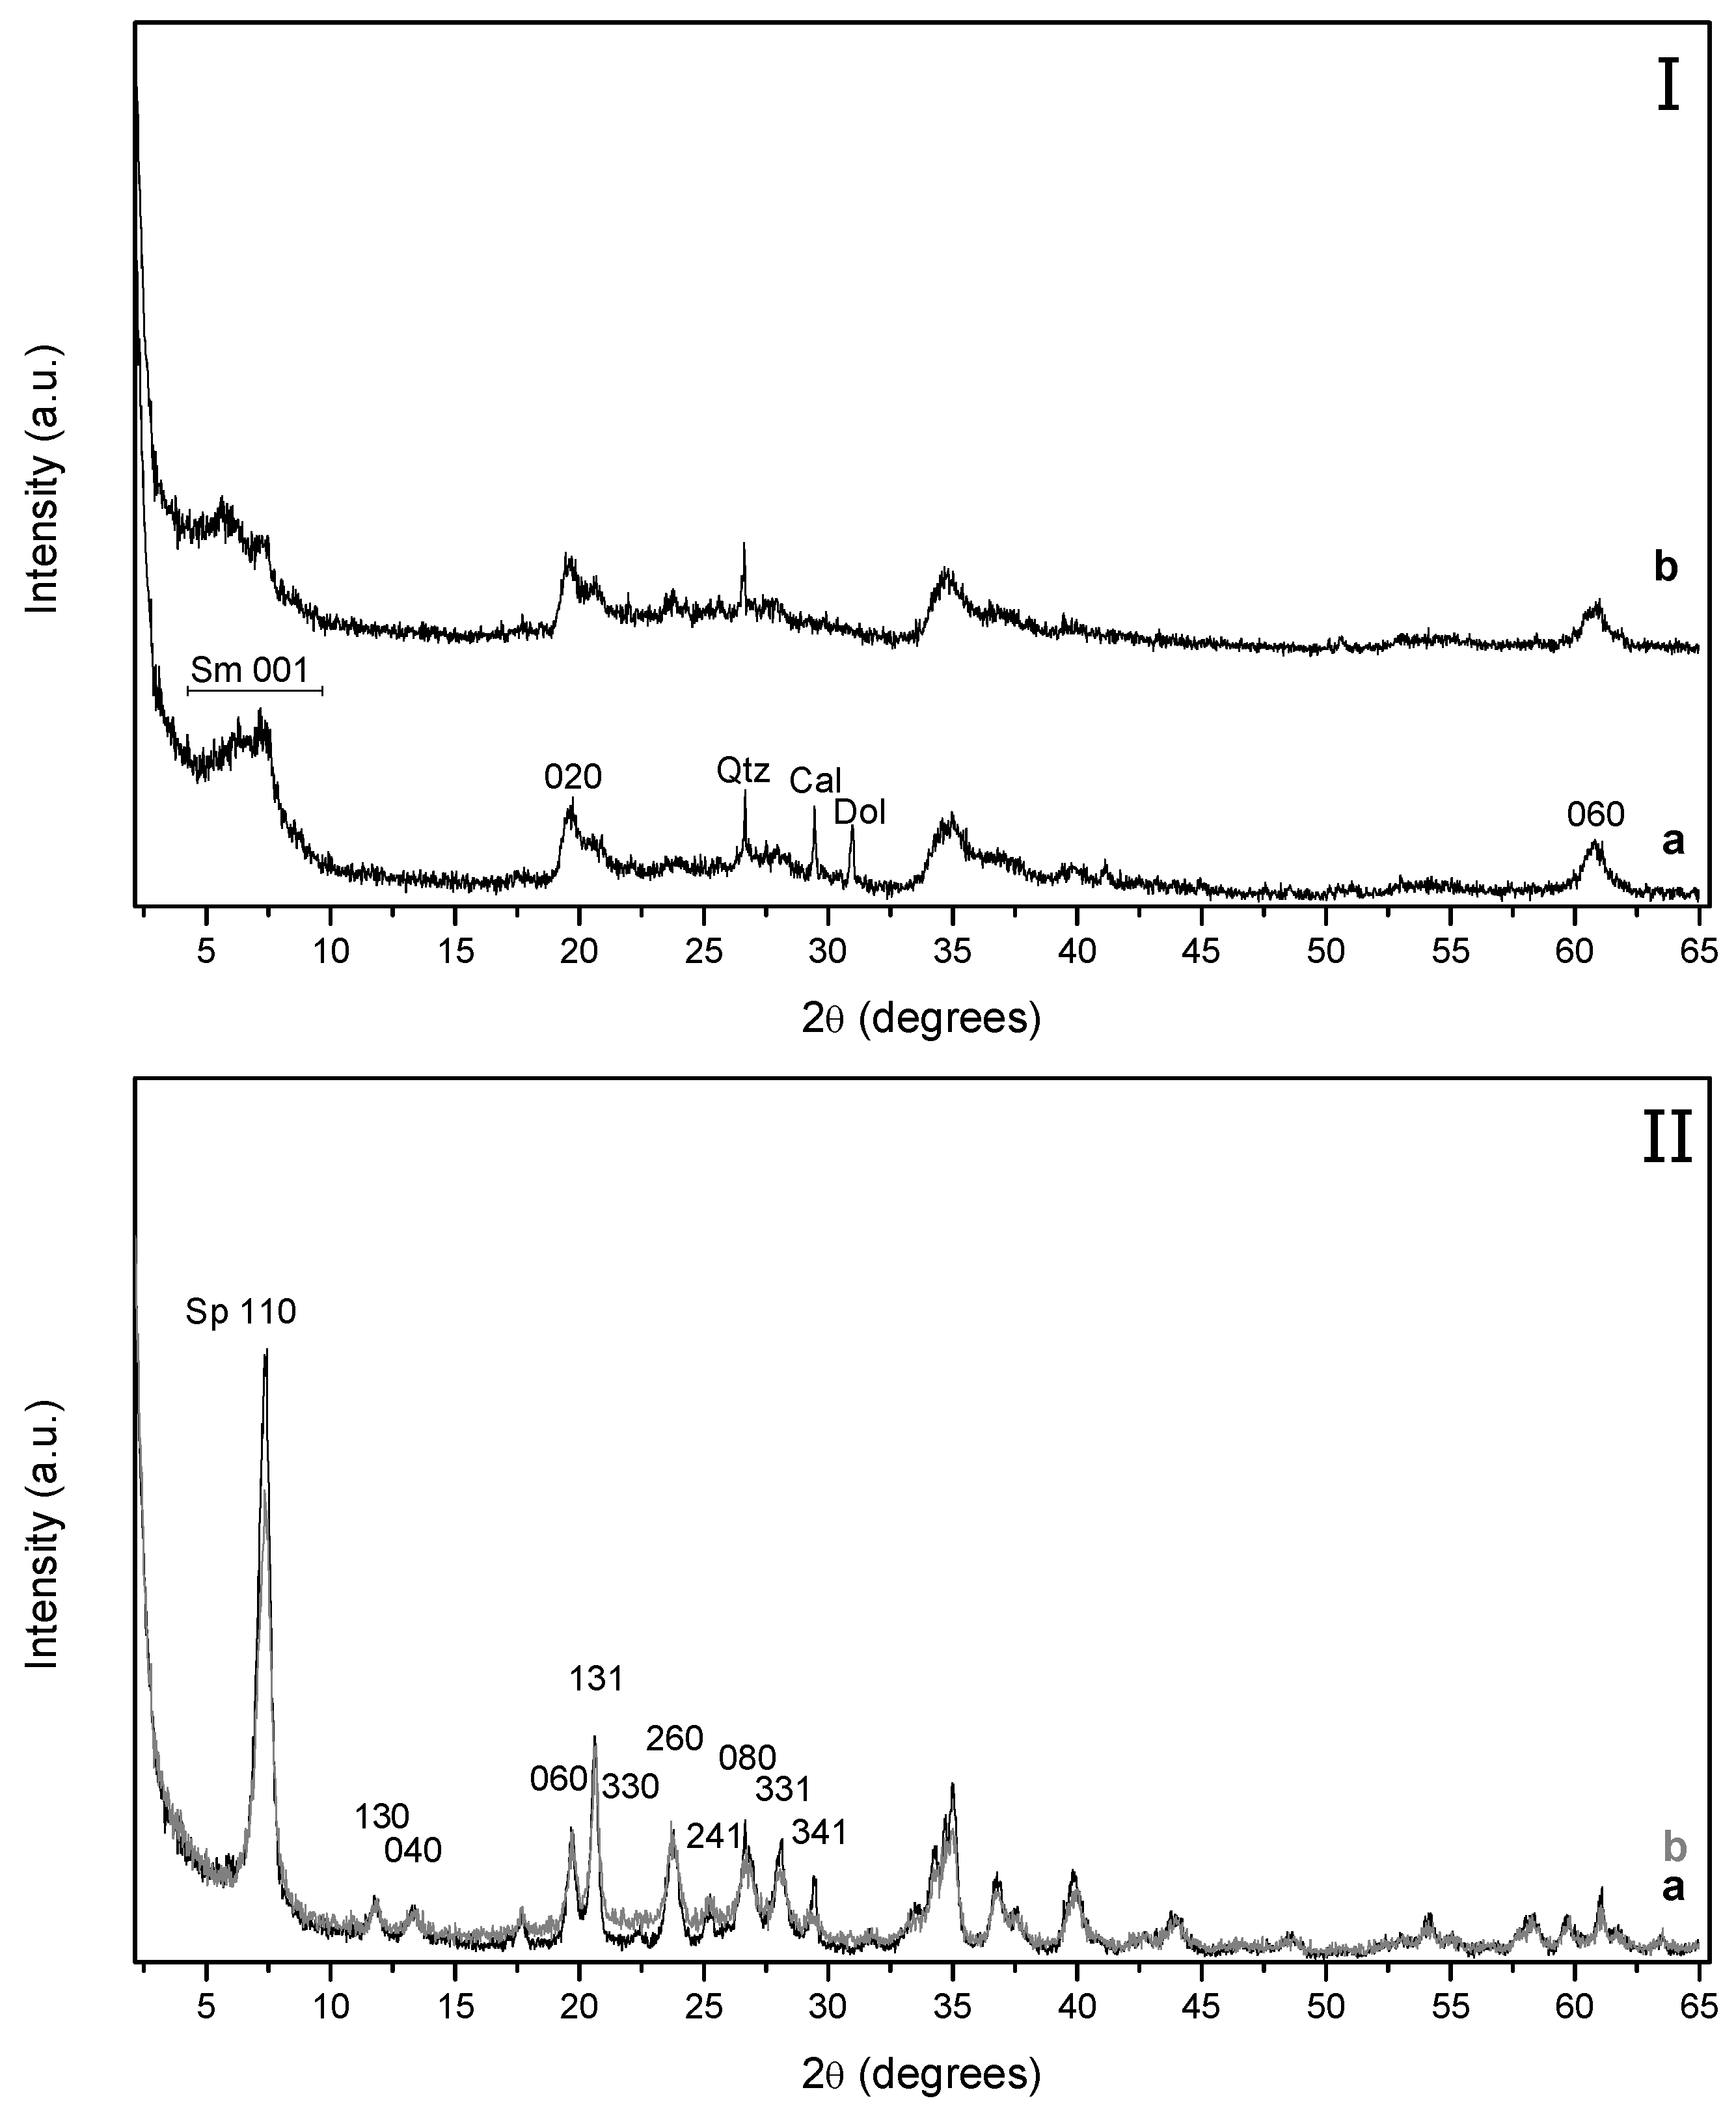
The X-ray diffraction patterns of the Mg-bentonite and sepiolite are shown in Figure 1. Mg-bentonite sample (Sm) (Figure 1a) shows the presence of minor proportions of quartz, calcite, and dolomite, whereas only traces of calcite are identified in sepiolite (Sp) (Figure 1b). Mg-bentonite shows a wide 001 reflection band with two maxima suggesting the presence of at least two types of interlayer cations and/or a great variability in the hydration degree in interlayer space. The XRD reflections of sepiolite are sharp and well-defined in comparison to those displayed by Mg-bentonite, indicating a higher ordered structure for the fibrous clay mineral. The study of the clay fraction of the Mg-bentonite (oriented aggregates method) indicates the predominance of Mg-smectite and traces of sepiolite.
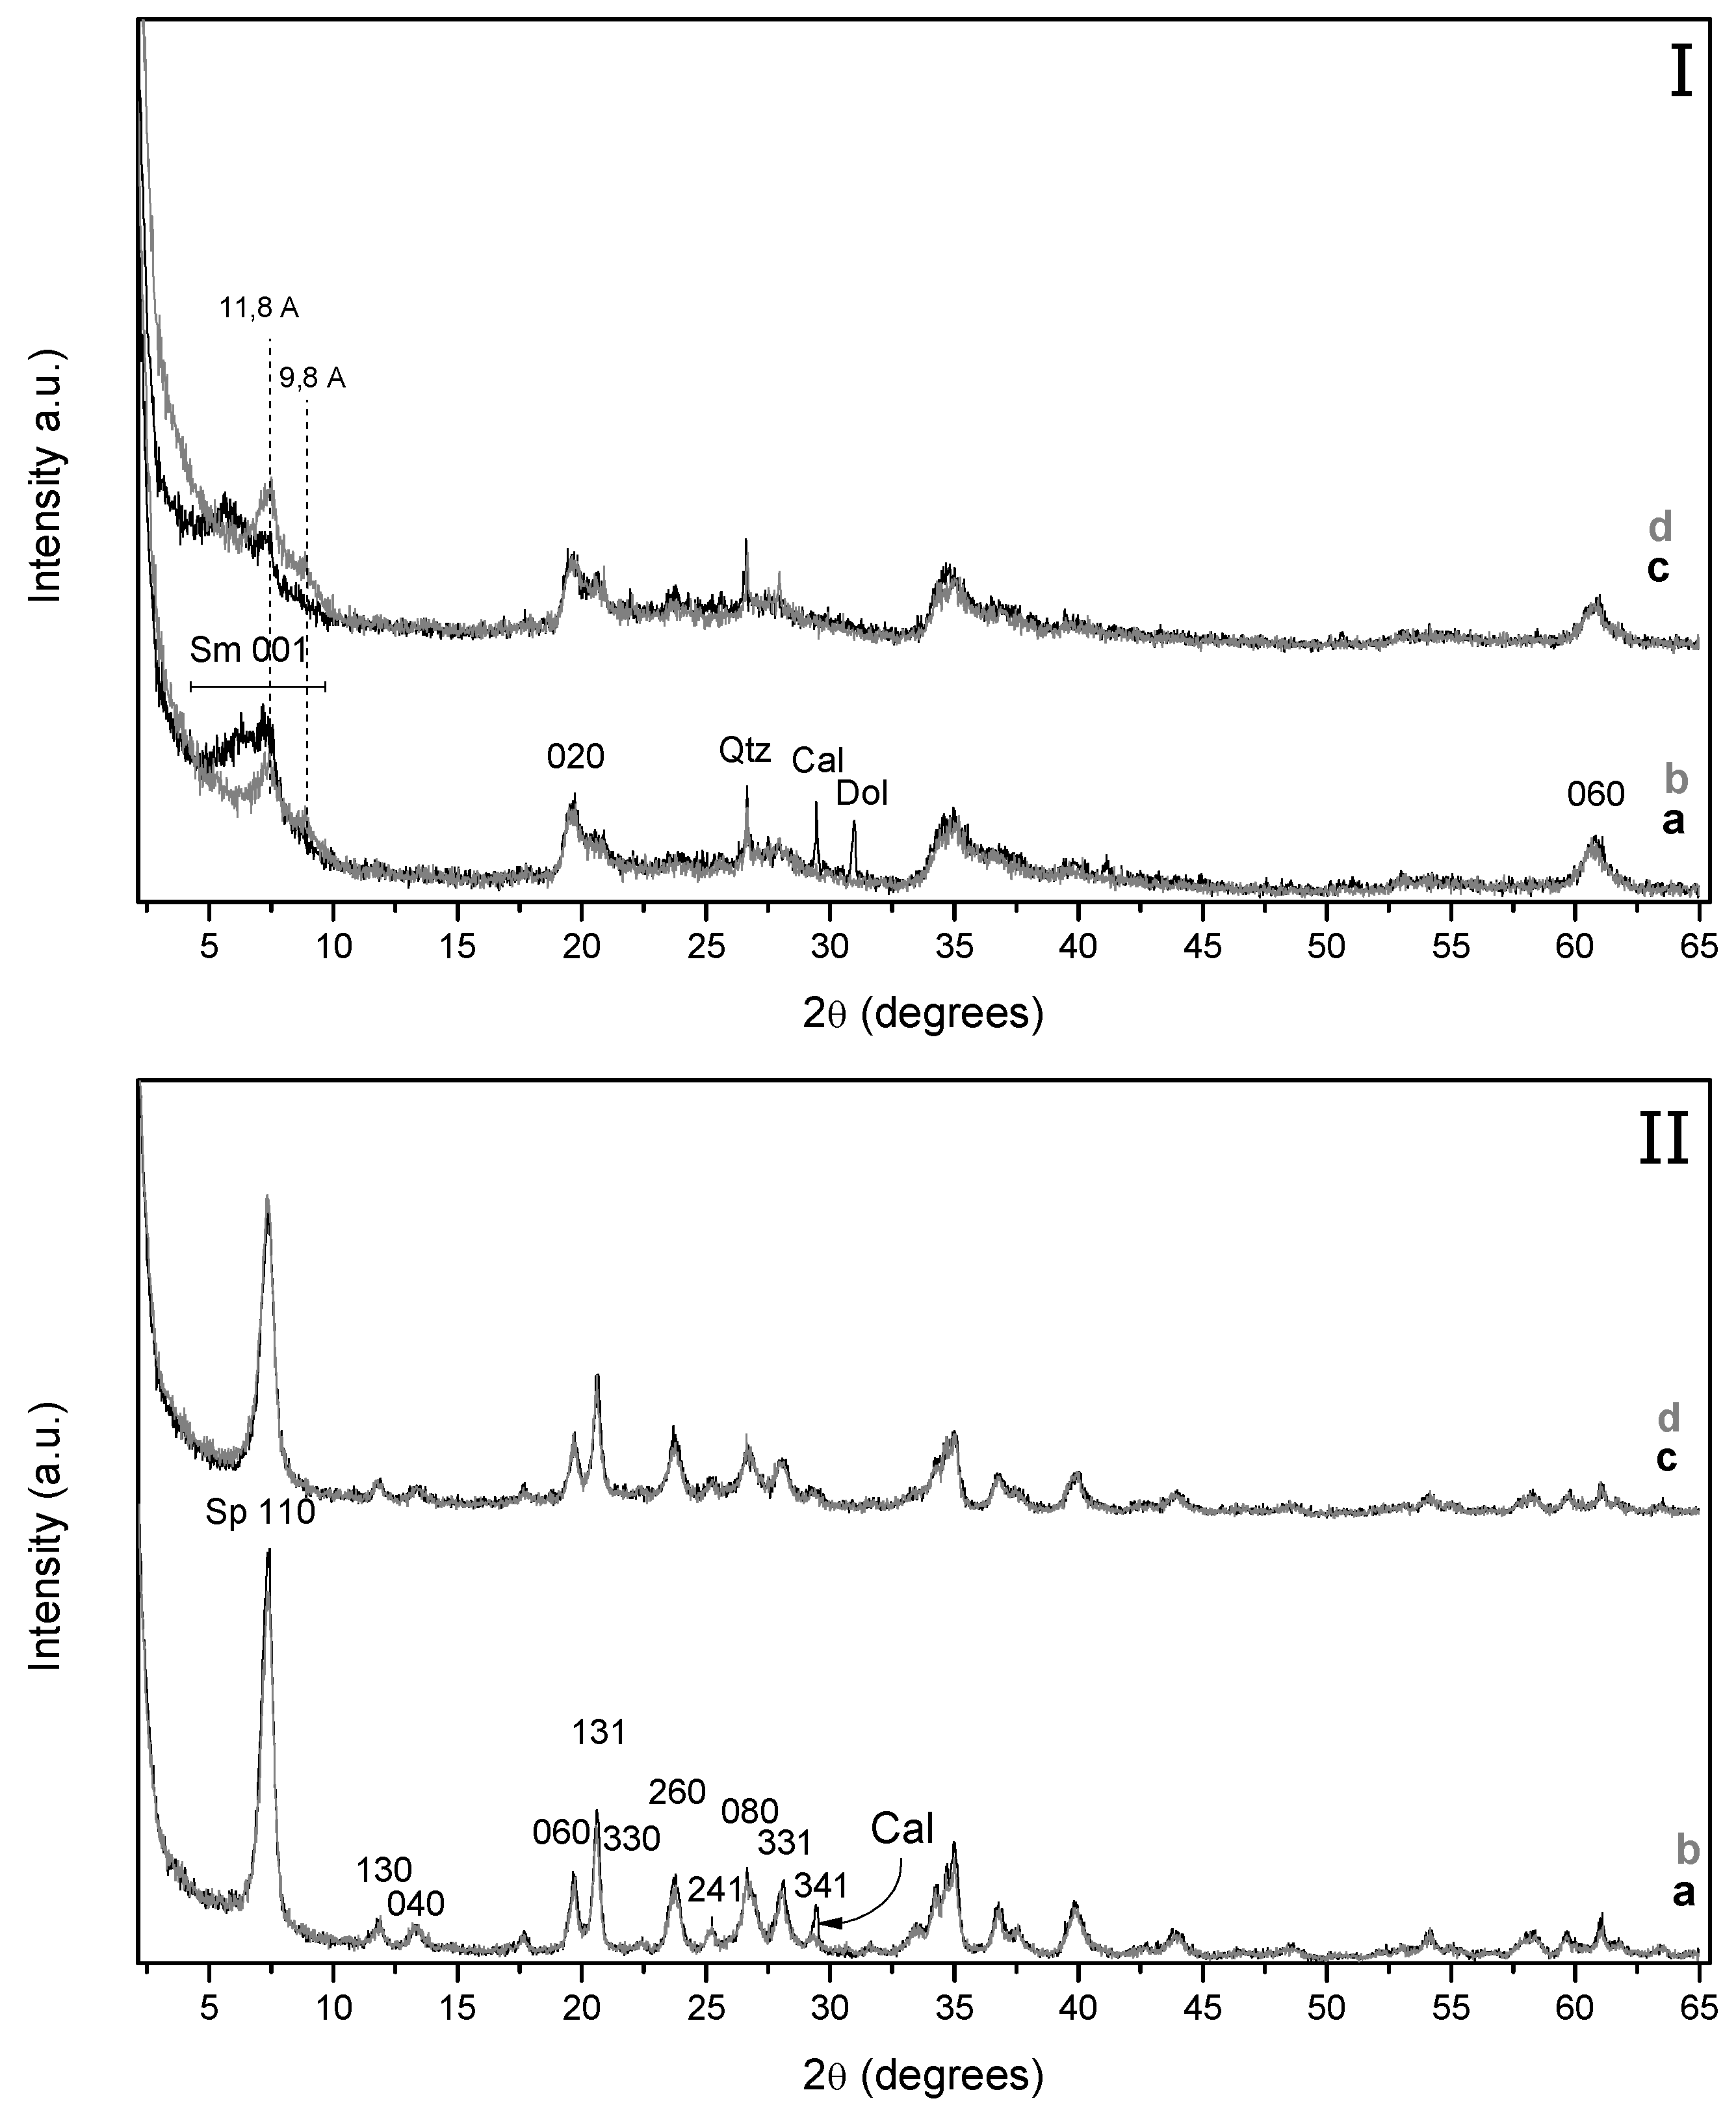
XRD profile of the Mg-bentonite after the microwave-assisted acid treatment (Sm–H) reveals the disappearance of the diffraction reflections (Figure 2(Ia,Ib)) attributed to calcite and dolomite due to the dissolution of these carbonates after 8 min of acid treatment. Moreover, the intensity of the (001) and (020) diffraction reflections notably decreases suggesting the partial alteration of the Mg-smectite structure. On the other hand, the crystallinity of the quartz seems to be maintained after the microwave-assisted acid treatment.
The comparison between the XRD patterns of the raw sepiolite (Sp) and the material obtained after the microwave acid treatment also shows modifications (Sp–H) (Figure 2(IIa,IIb)). Generally, a decrease in the intensity of the diffraction lines is noticeable, especially the (110) reflection. In addition, the occurrence of a broad band in the range of 15 to 33° (2θ) can be also observed. Both facts suggest that sepiolite structure is sensibly affected with the acid treatment and that the formation of an amorphous silica phase can take place [17].
The incorporation of iron species into the starting Mg-smectite (Fe–Sm) and that modified by acid treatment (Fe–Sm–H) also causes changes in the XRD profile (Figure 3I). As it took place for the sample modified by the microwave-assisted acid treatment, the diffraction peaks attributed to carbonate minerals disappears from the XRD diffraction patterns after the treatment with Fe3+ (Figure 3(Ia)), since the FeCl3 solution is enough acidic (pH ~ 1) to dissolve the carbonate species. In addition, the (001) diffraction displays two peaks located at 9.8 and 11.8 Å, which suggests the coexistence of a different hydration state and/or interlayer cations [18]. Moreover, we must take into account that the intensity of this last reflection is affected by the presence of minor amounts of sepiolite. On the contrary, the comparison of the XRD diffraction patterns of the Fe-treated sepiolites suggests that the incorporation of Fe3+ within the raw sepiolite (Fe–Sp) and in the acid activated sepiolite (Fe–Sp–H) has no noticeably effect on their structure (Figure 3II).

3.2. Chemical Analysis (XRF)

The chemical composition of the studied materials was determined by XRF. From data reported in Table 1, it can be observed the predominance of magnesium which is coherent with the trioctahedral character of the clay minerals. The content of K, Ca, and Na, must be related with the presence of exchangeable cations although the content of Ca in Mg-smectite is also due to carbonates. Chemical analysis data (Table 1) also reveal that microwave-assisted acid treatment produces a remarkable decrease of the magnesium content in both Mg-smectite and sepiolite, while the Si, Al, and Fe content are maintained after the acid treatment. This implies a partial dissolution of the octahedral sheet, releasing amorphous and insoluble silica, as was indicated for the XRD profile. In the same way, it is also noticeable the decrease of Ca content, which confirms the dissolution of the calcite phase as well as the Ca2+ species located in the interlayer space, which must be replaced by H+ species. With regard to potassium, the chemical data show similar values after the acid treatment, indicating that this cation remain in the interlayer space after the treatment.
The chemical analysis of the sample treated with FeCl3 solution shows little effect how the acid treatment does not seem to affect to the Fe3+ species incorporated, being in the same range for the raw Mg-smectite (4.56 wt % Fe2O3) and the Mg-smectite treated by acid treatment (4.18 wt % Fe2O3). In the case of sepiolite, the treatment of the raw sepiolite with the FeCl3 solution display higher Fe2O3 content (3.09 wt %) than that modified by acid treatment (1.58 wt %). The lower iron values could be ascribed to the formation of amorphous silica, which can cause a decrease in the adsorption capacity.

3.3. Scanning Electronic Microscopy (SEM)

SEM micrograph of starting Mg-smectite (Sm) (Figure 4a) shows that individual particles of this mineral have sizes ranging between 1 and 5 μm and are grouped into aggregates in the range between 4 and 10 μm. Figure 4b shows that 8 min of microwave assisted acid treatment (Sm–H) causes a strong dispersion of the aggregate in individual lamellar particles of sizes smaller than 1 μm. SEM images reveal that the starting Mg-smectite does not change after treating with Fe3+ solutions (Fe–Sm). Minor dispersions are observed compared with the acid activated Mg-smectite (Sm–H) (Figure 4c). Nevertheless, although the aggregates seem to be slightly larger than those observed in the Sm–H sample, the individual lamellar particles of Fe–Sm–H appears to be smaller than the previous ones.
Figure 5a, shows the typical fibrous habit of sepiolite forming aggregates with a maximum length of 40 μm. After the acid treatment, the fibers of sepiolite (Sp) (Figure 5b) appear more disaggregated (Figure 4c,d) with a length more homogeneous and slightly smaller when compared with those of the starting sepiolite. These similar observations can be made in the SEM micrograph of Fe–Sm (Figure 5c). On the other hand, the length of the fibers of the Fe–Sp–H are even smaller than those described above for the acid activated sepiolite and for the Fe–Sp.

3.4. Nitrogen Adsorption

The specific surface area was determined from the SBET equation [23] (Table 2). The natural sepiolite displays a SBET value of 308 m2·g−1, while the starting Mg-smectite displays a SBET of 182 m2·g−1. Sepiolite displays microporosity ascribed to the channels formed by the reversal of the tetrahedral layer [10]. The microporosity of Mg-smectite can be related with its low structural ordering, which can generate small cavities leading to this microporosity. In all cases, it can be observed an increase of the N
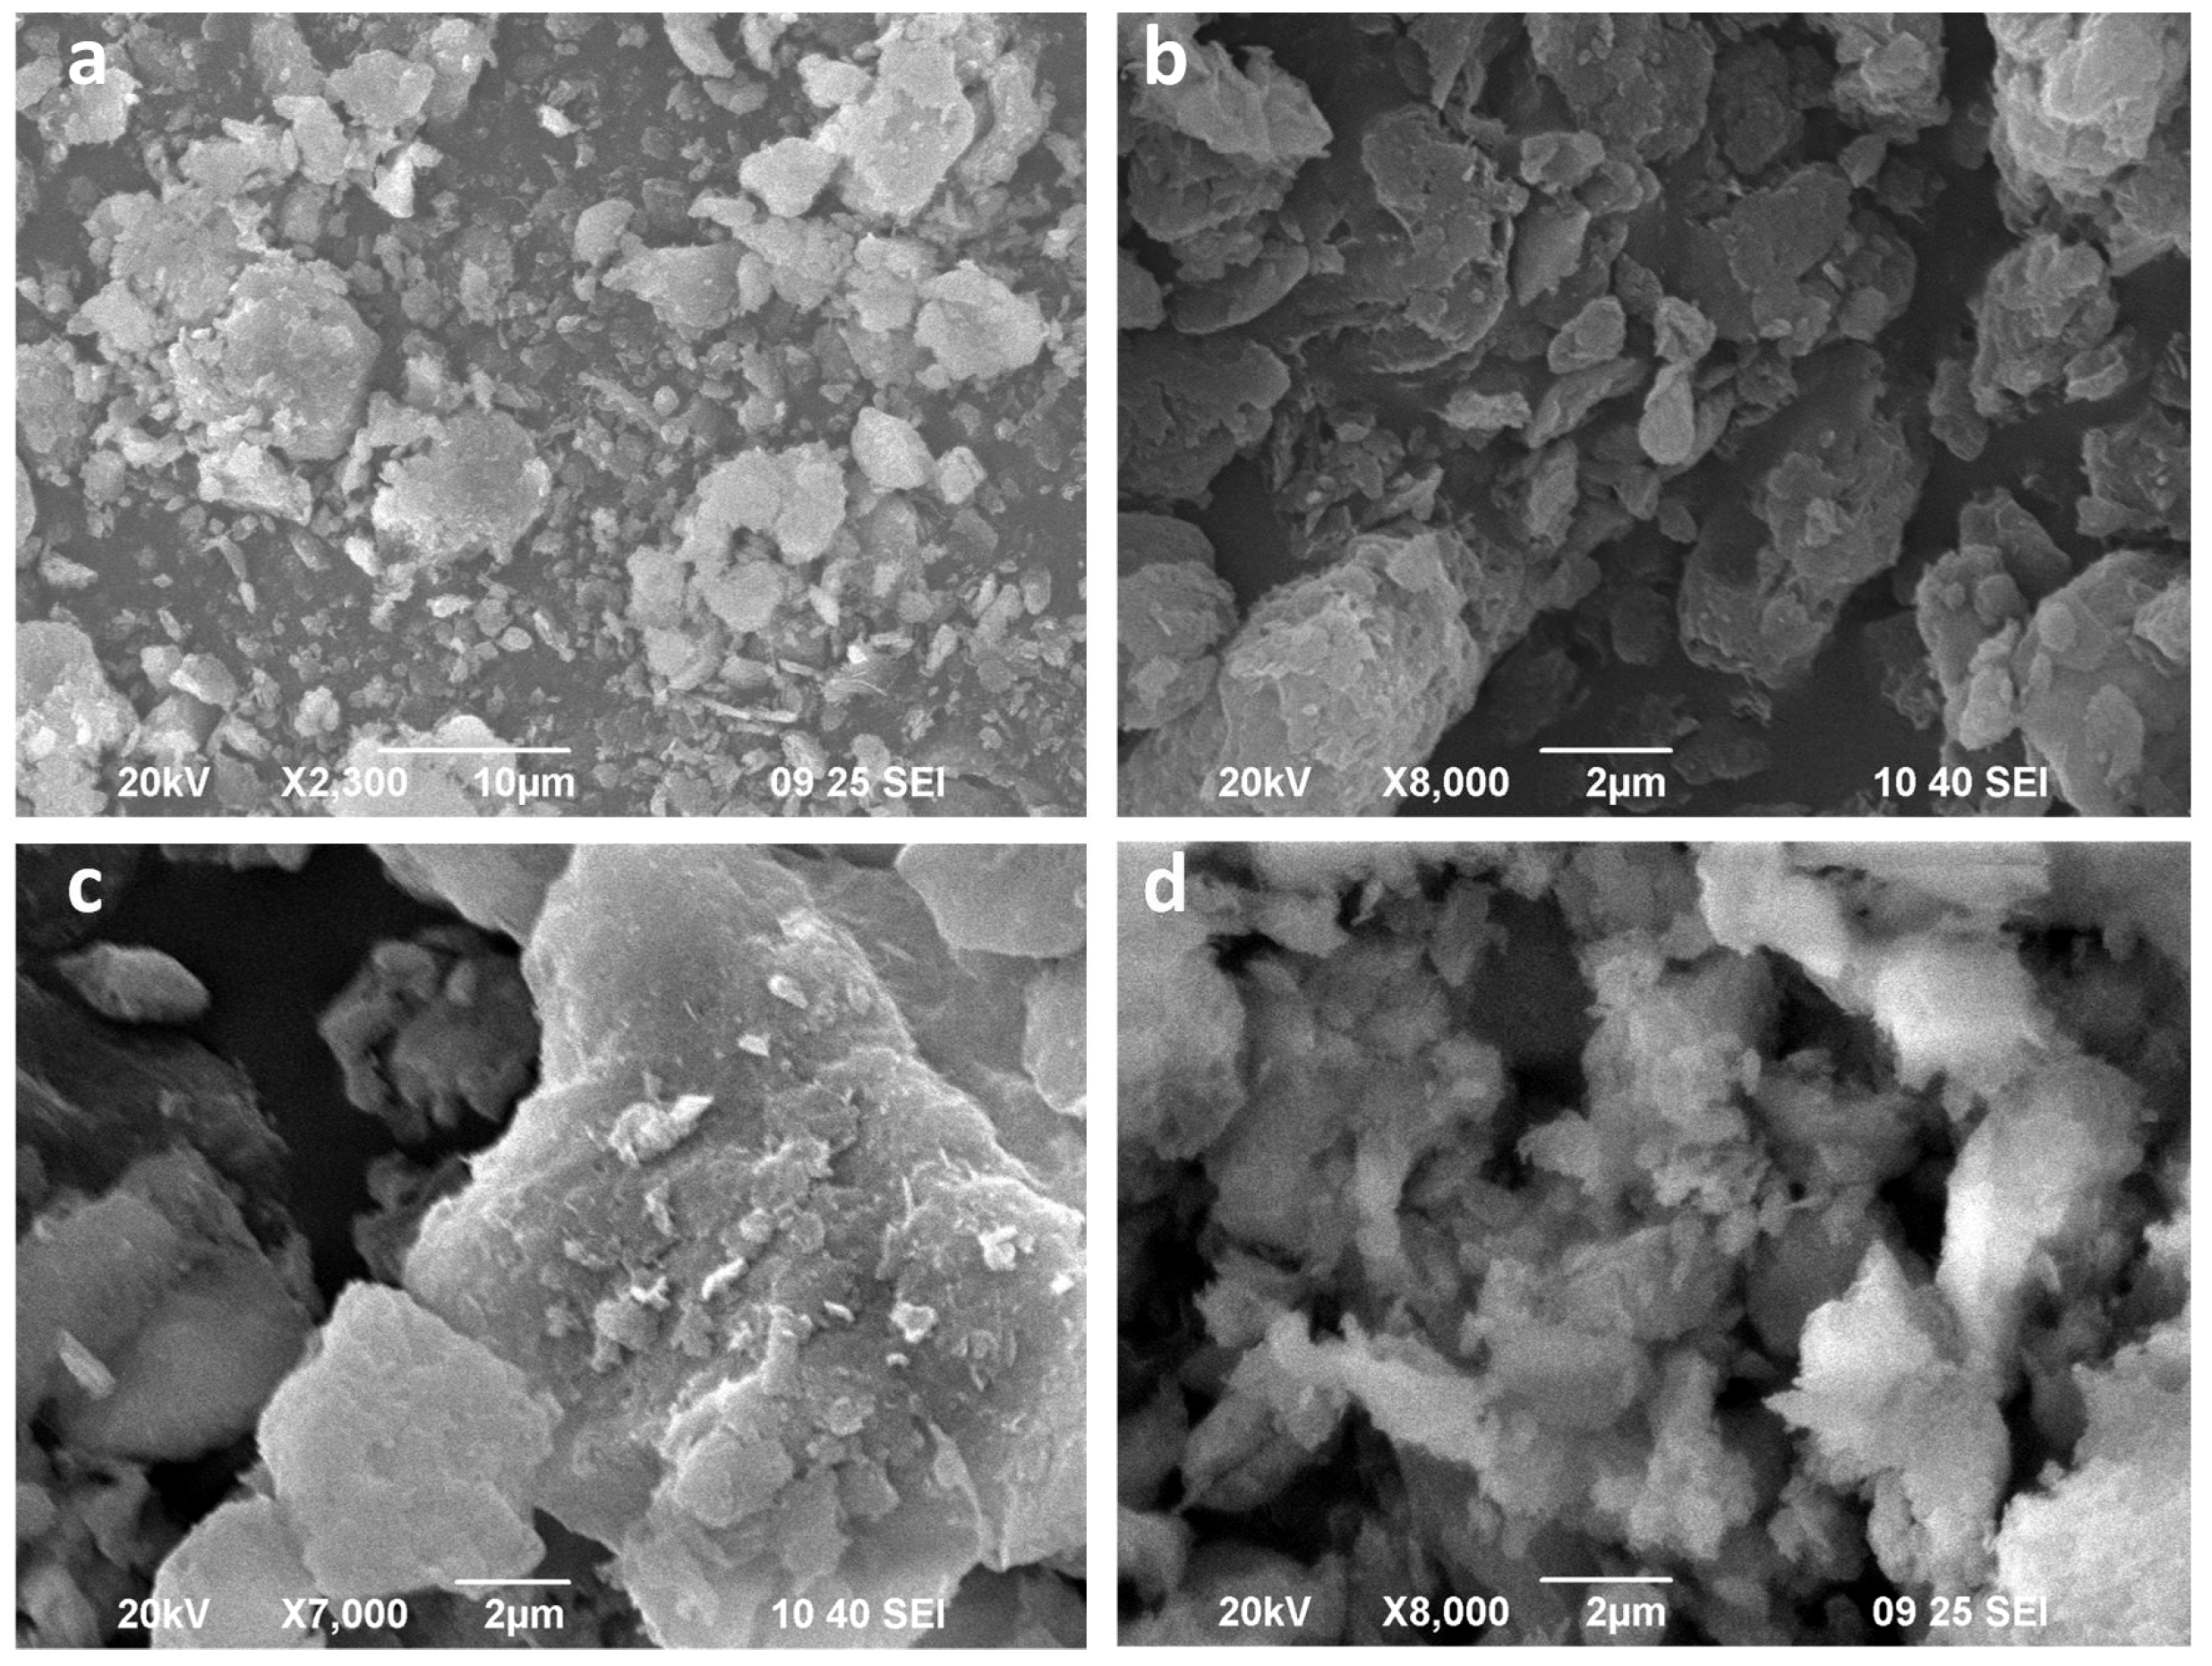
2 adsorbed at high relative pressure, indicating the presence of macroporosity ascribed to the presence of interparticle voids as was shown from the SEM images.
The acid treatment causes a clear increase of the SBET values, microporosity and mesoporosity, reaching a SBET value of 400 m2·g−1 for Sp–H and 327 m2·g−1 for Sm–H, respectively. This increase is directly related with the partial loss of the Mg2+ cations located in the octahedral sheet and the formation of amorphous silica along the microwave-assisted acid treatment, as indicated by the XRF data (Table 1).
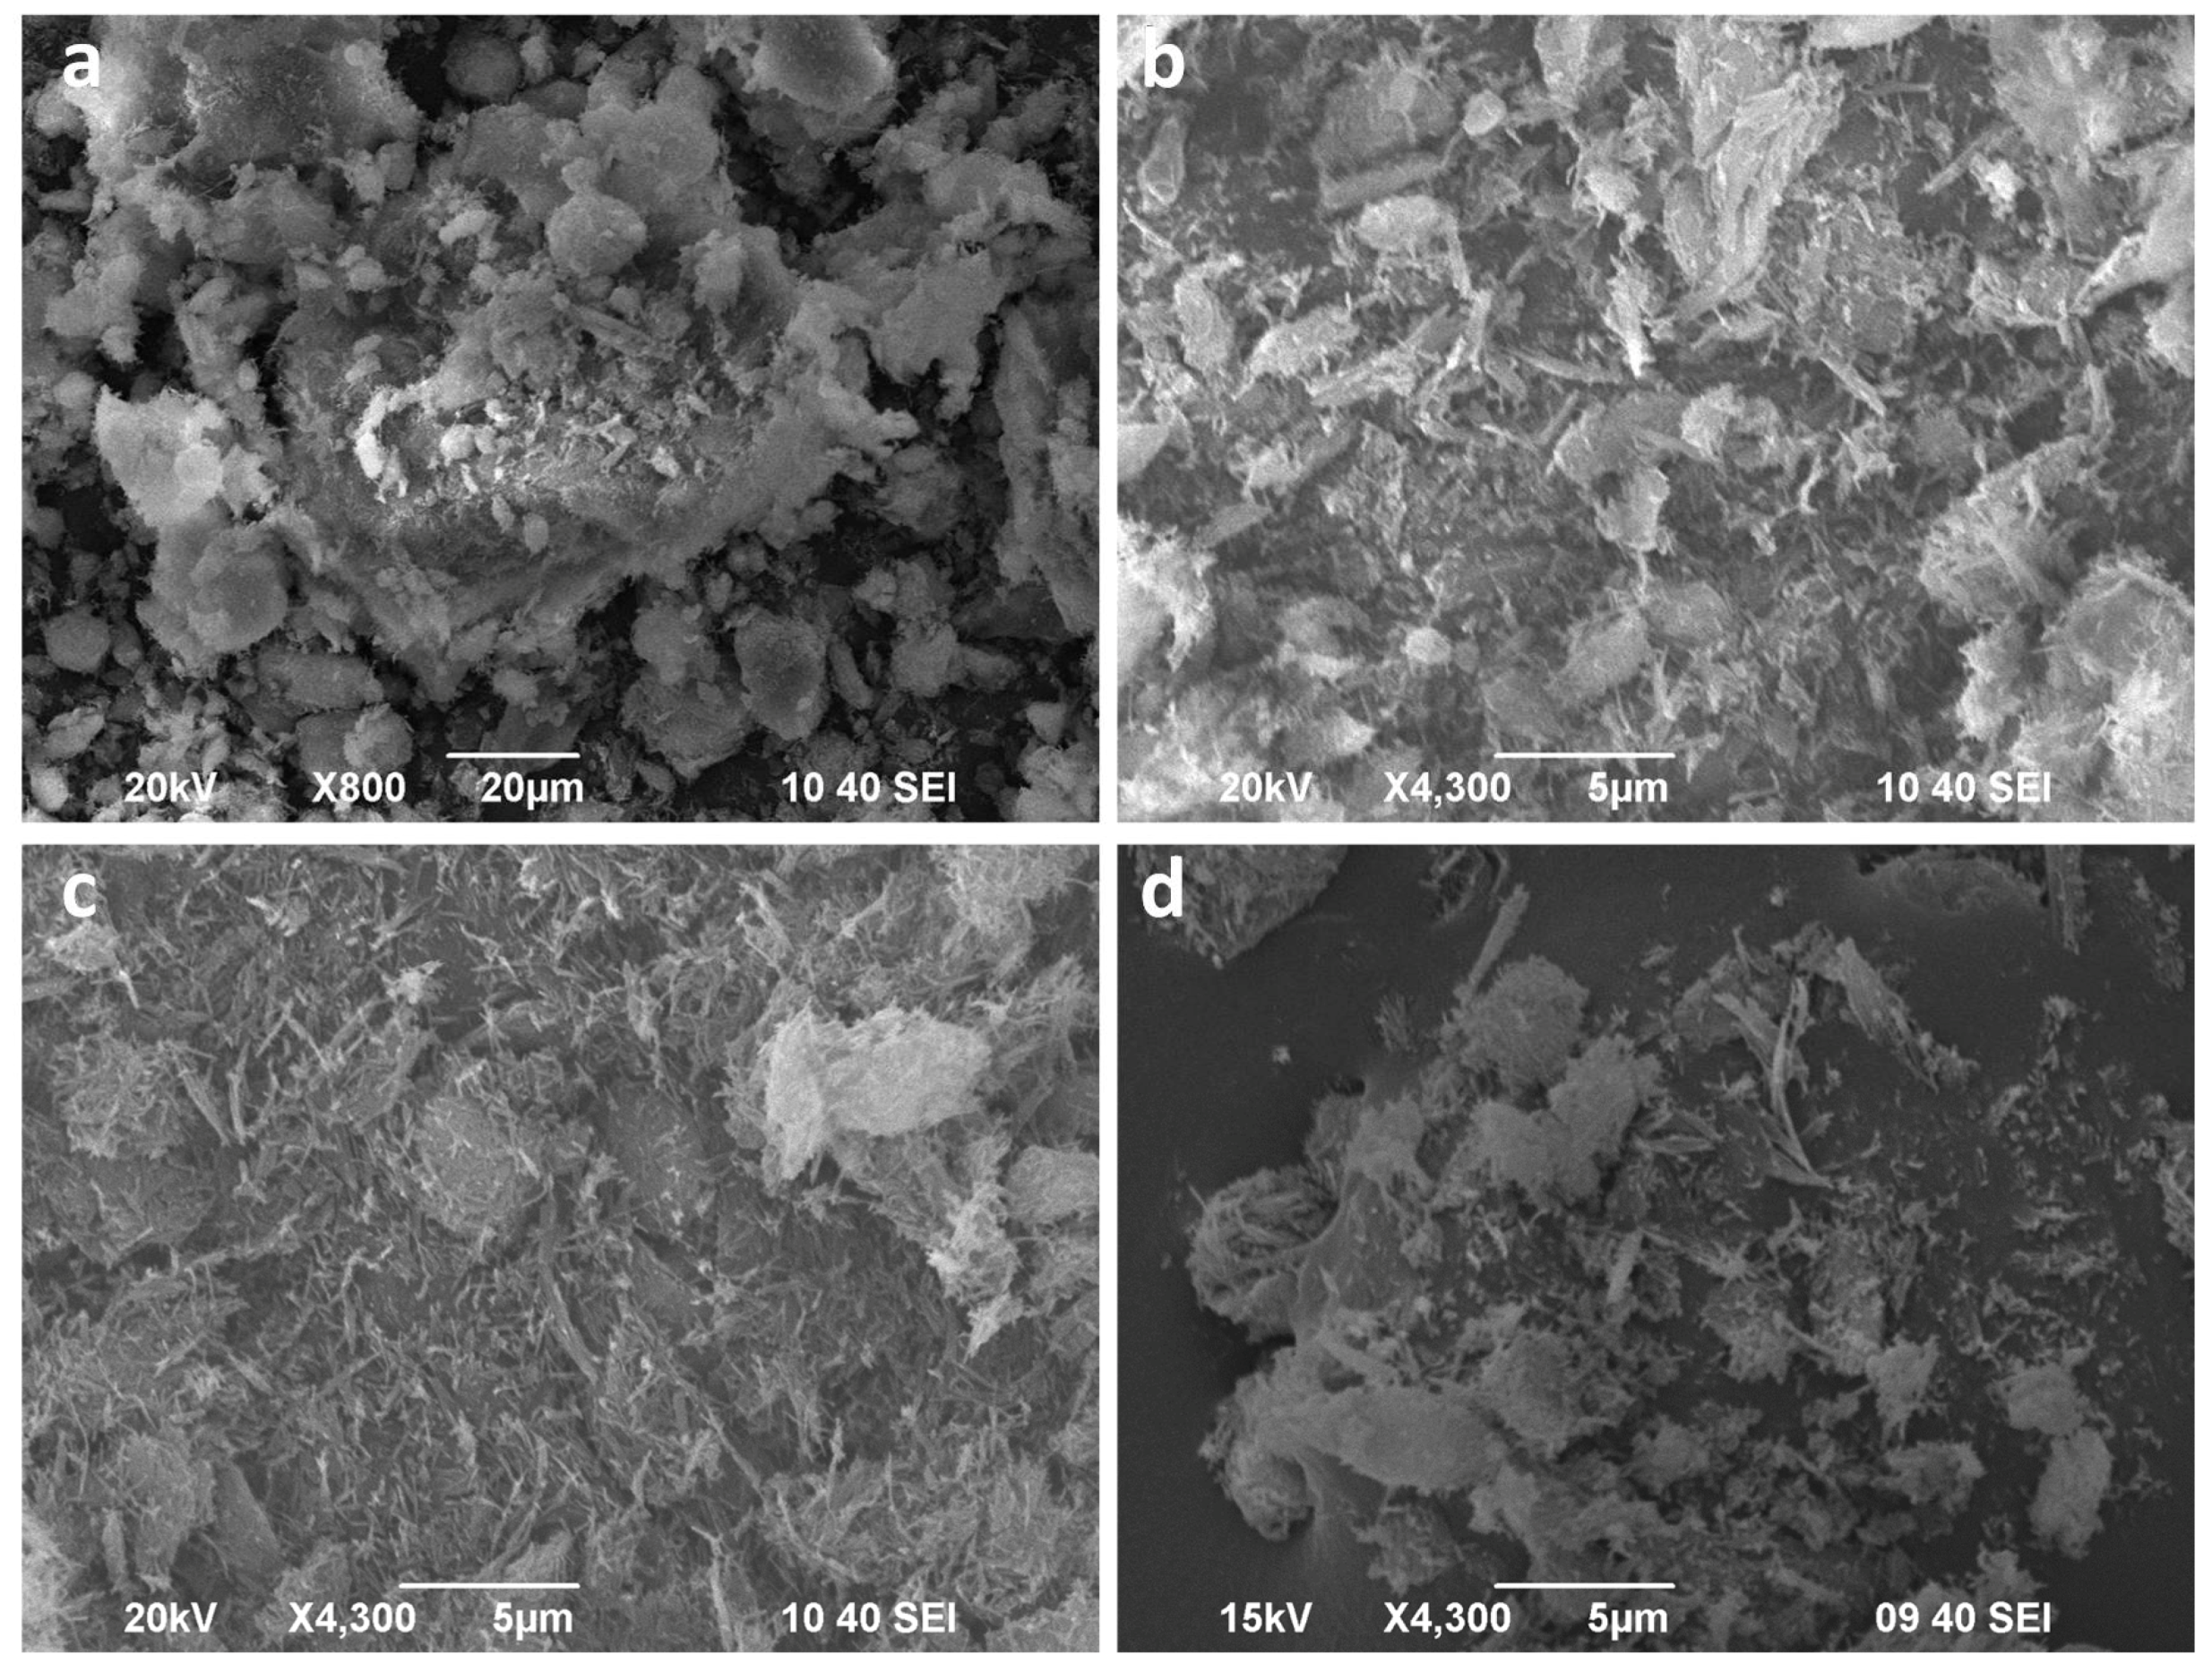
The incorporation of iron species from Fe3+ solution and subsequent calcination displays different behavior in Mg-smectite and sepiolite. Thus, both sepiolites (Sp and Sp–H) suffer a decrease in the SBET value attributed to a slight decrease of its microporosity, probably since iron species (in Fe–Sp and Fe–Sp–H) can be located within the channels of the sepiolite. In the case of the Mg-smectite, the incorporation of the iron species causes an increase of the surface attributed to the microporosity. This fact suggests that iron species are not blocking the porosity of the structure but rather favors the formation of higher proportion of micropores by the formation of a pillared structure, as was suggested by XRD data. The incorporation of iron species after the acid treatment in the Mg-smectite leads to a slightly higher microporosity and a slightly lower external surface probably due to the formation of larger aggregates, as was shown in the SEM images.

3.5. DRIFT Analysis

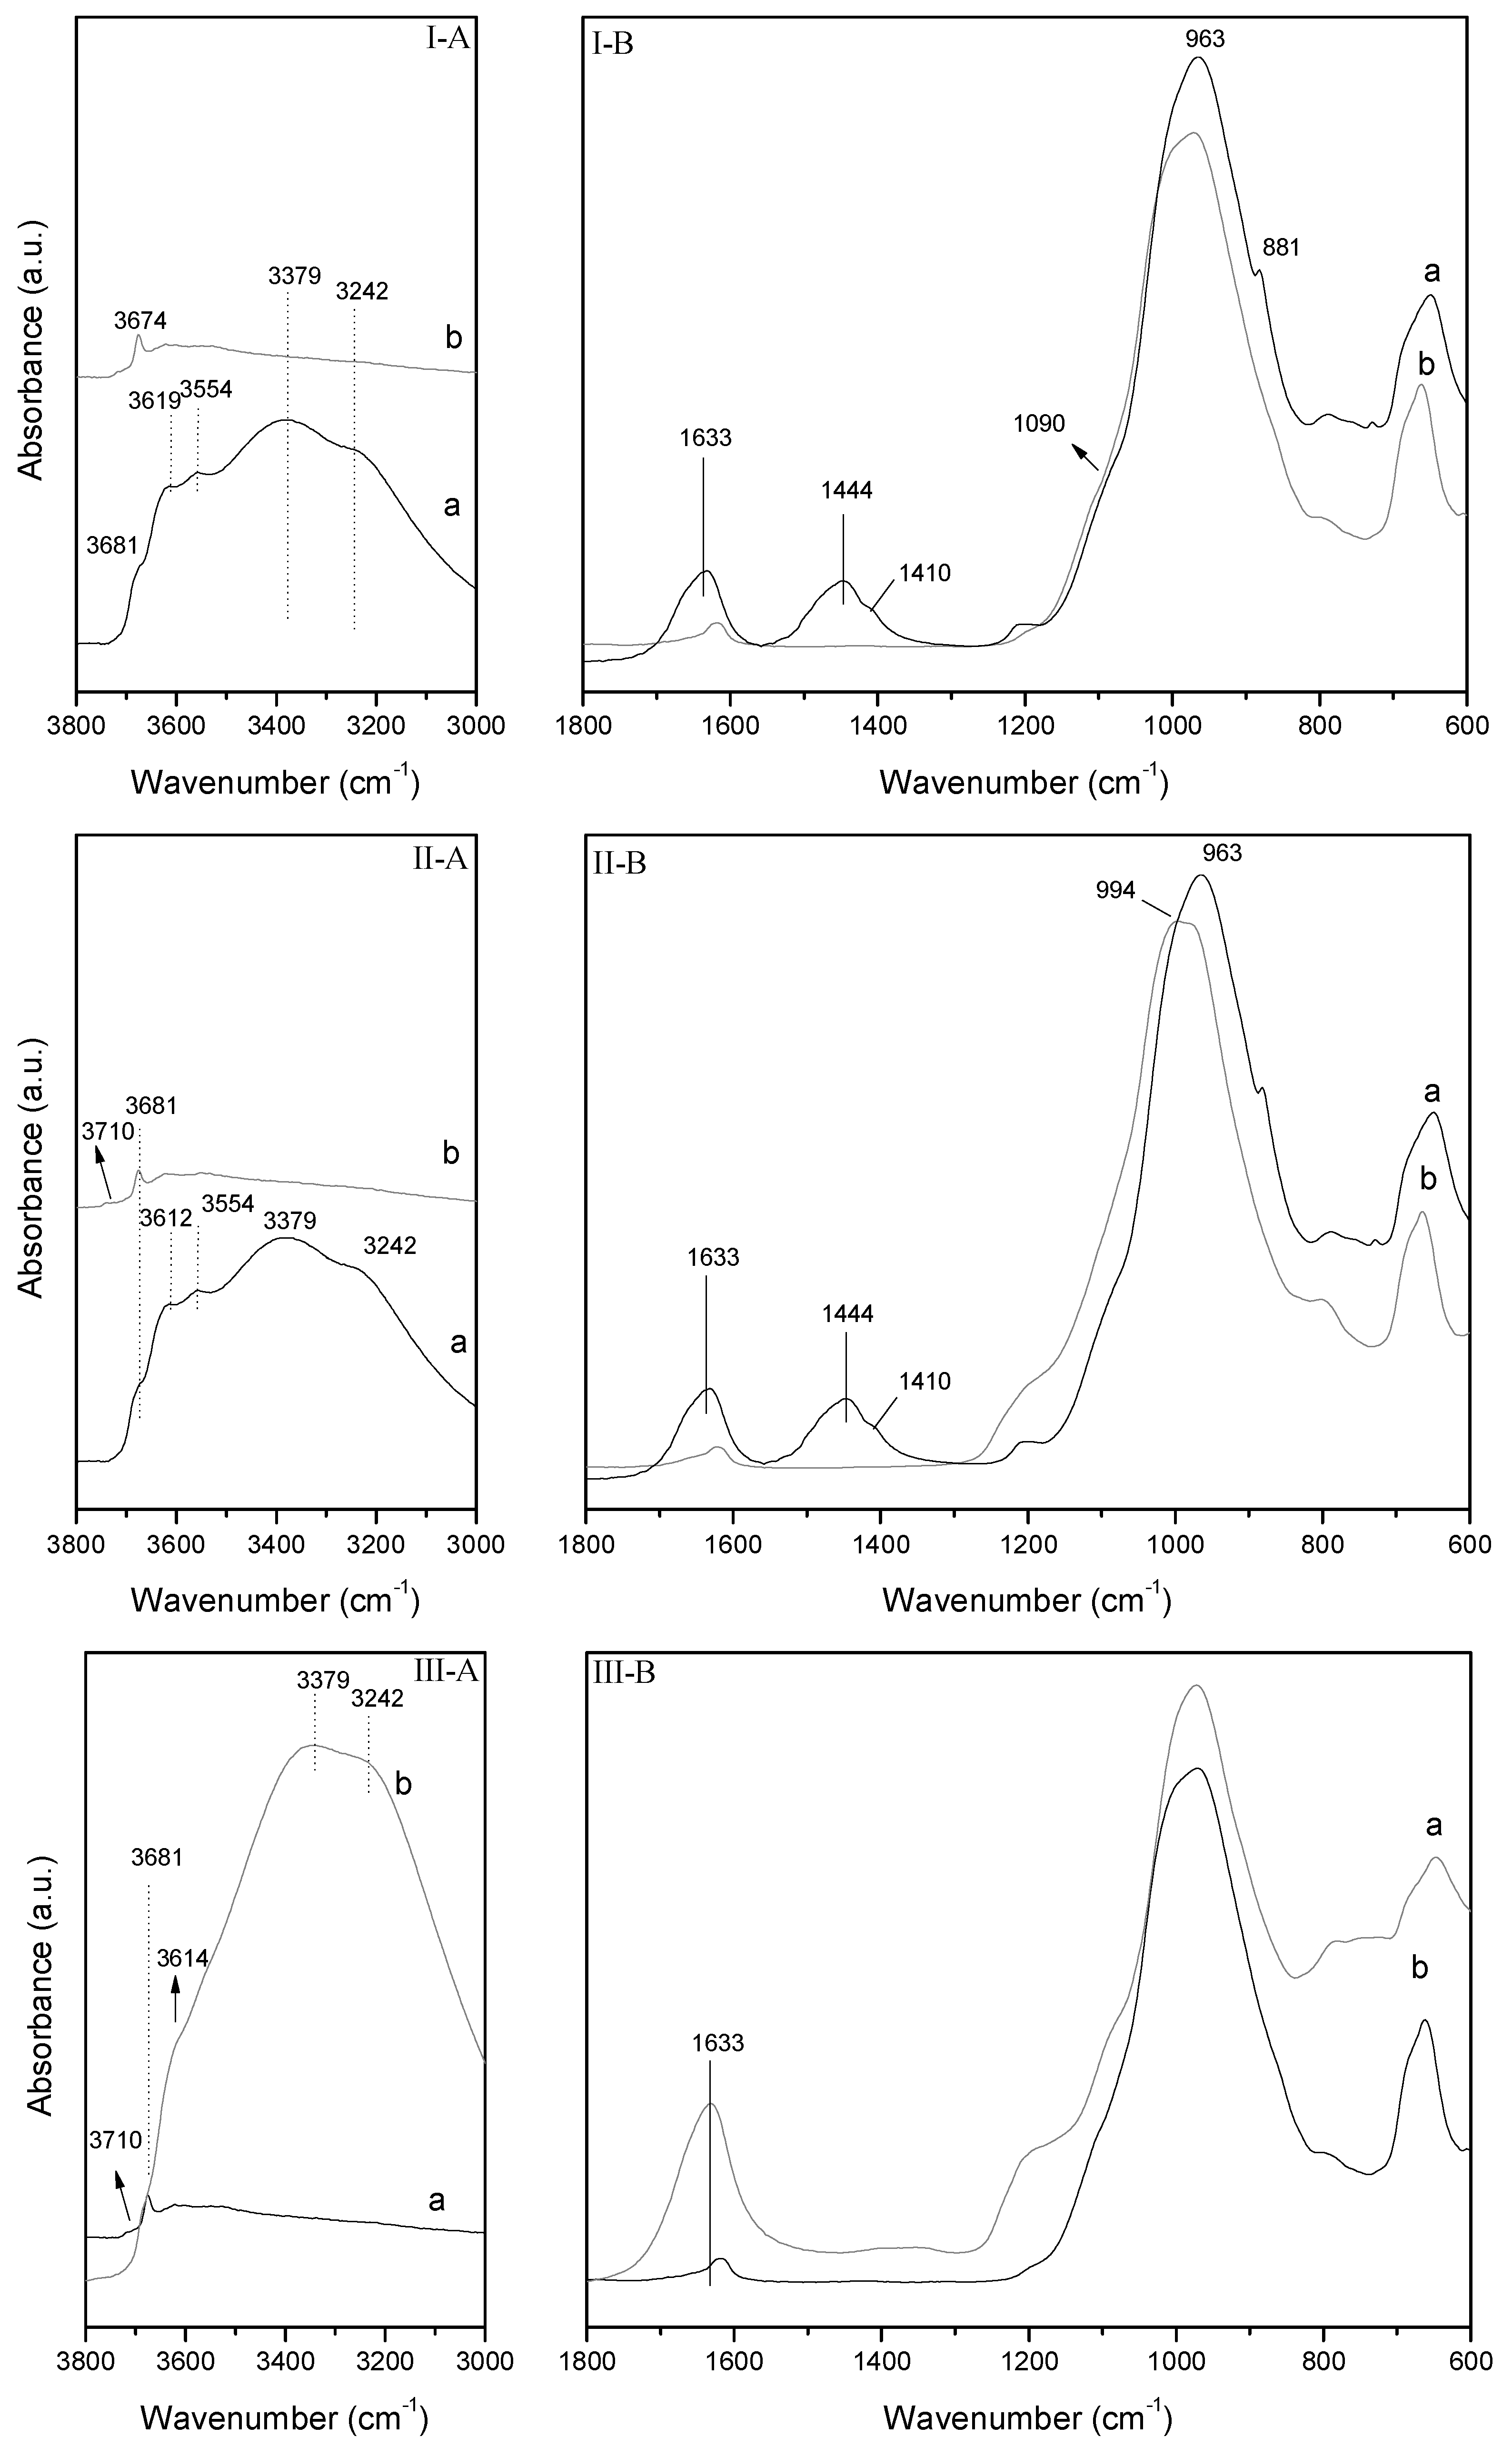
Figure 6I-A shows the 3750–3000 cm−1 region of the DRIFT spectra of the starting Mg-smectite (Sm). The position of the O–H stretching bands is notably influenced by the chemical compositions of the octahedral sheet [25]. For this reason, there are many differences related with both the number and the positions of the O–H stretching band in the DRIFT spectra of the natural di- and trioctahedral smectites. Regarding Sm (Figure 6I-A), the O–H stretching bands appear at higher wavenumbers compared to those of dioctahedral smectites. In this case, the O–H stretching region is characterized by the presence three overlapping bands centered at 3681, 3619, and 3554 cm−1.
The band at 3681 cm−1 is classically assigned to the O–H stretching mode of structural Mg(OH)2 groups in the octahedral sheet of Sm structure [26,27,28]. Regarding the band at 3619 cm−1, it can be assigned to the O–H stretching modes of AlOHSi groups formed by isomorphous substitutions of Si(IV) by Al(III) in the tetrahedral sheet of Sm [18]. Moreover, DRIFT the band at 3554 cm−1 can be assigned to the AlOHMg and MgOHFe stretching vibrations [29]. The DRIFT spectrum of the starting Sm also shows water-stretching vibrations bands at 3379 and 3242 cm−1 [26,30].
The Si–O stretching region of DRIFT spectra of the untreated Sm is shown in Figure 6II-B(a). The di- or trioctahedral nature of the starting mineral apparently influences the position of the Si–O stretching band in the DRIFT spectrum [26]. The Si–O stretching band appears centered at 963 cm−1 in the starting Mg-smectite. This band is classically assigned to the in-plane, ν(Si–O) mode [31]. Moreover, in both starting smectites the in-plane Si–O stretching band is accompanied by a small band at 1090 cm−1 which is ascribed to the out-of-plane Si–O stretching modes [29]. On the other hand, the band at 1632 cm−1 is related with the adsorbed water bending modes and the bands at 1644 and 1410 cm−1 to carbonates [30], while the band at 881 cm−1 is related with the deformation modes of OH-Mg [29]. The band located about 655 cm−1 is attributed to Mg3OH bending vibrations [26]. Moreover, the absence of bands located about 916 and 844 cm−1 assigned to (Al2OH) and (AlOHMg) [26], respectively, confirms the low content of Al-species in the clay mineral, which is in agreement with the chemical analysis, shown in Table 1.
The O–H stretching region of acid activated Mg-smectite (Sm–H) is shown in Figure 6I-A(b). A general decrease in the intensity of the O–H bands and water stretching bands (3379, 3242) is observed in the first 8 min of treatment and a new band appears at 3710 cm−1. This band is commonly observed in the DRIFT spectra of the acid activated smectites and related with the O–H stretching mode of Si-OH groups [32]. Moreover, the OH-Mg deformation band and carbonate bands disappear after 8 min of microwave-assisted acid treatment (Figure 6I-B(b)). The decrease of the bands attributed to Mg-species in less pronounced in the region 1800–600 cm−1, although it is noteworthy the slight shift of the Si–O stretching band at higher wavenumber, which confirms the formation of amorphous silica formed after the partial solution of the tetrahedral sheet [26].
Similar observations can be made in the O–H stretching region after the treatment of Mg-smectite with Fe3+ solutions (Fe–Sm) (Figure 6II-A,II-B). The unique difference is the displacements of the Si–O stretching band from 963 to 994 cm−1. This result suggests that the presence of oxohydroxides of Fe in the interlayer of Mg-smectite affect the Si–O stretching out-of-plane vibrational modes.
In the case of the sample Fe–Sm–H, the O–H stretching region of DRIFT spectra shown the appearance of a wide band from 3700 to 2700 cm−1 overlapping the small bands at 3681 and 3614 cm−1 observed in the DRIFT spectra of Sm–H. Moreover, and intense water bending band at 1633 cm−1 and the higher intensity of the spectra from 900 to 700 cm−1 suggest of a great amount of water molecules coordinated to oxohydroxides of Fe supported at the external surfaces of the lamellar particles.
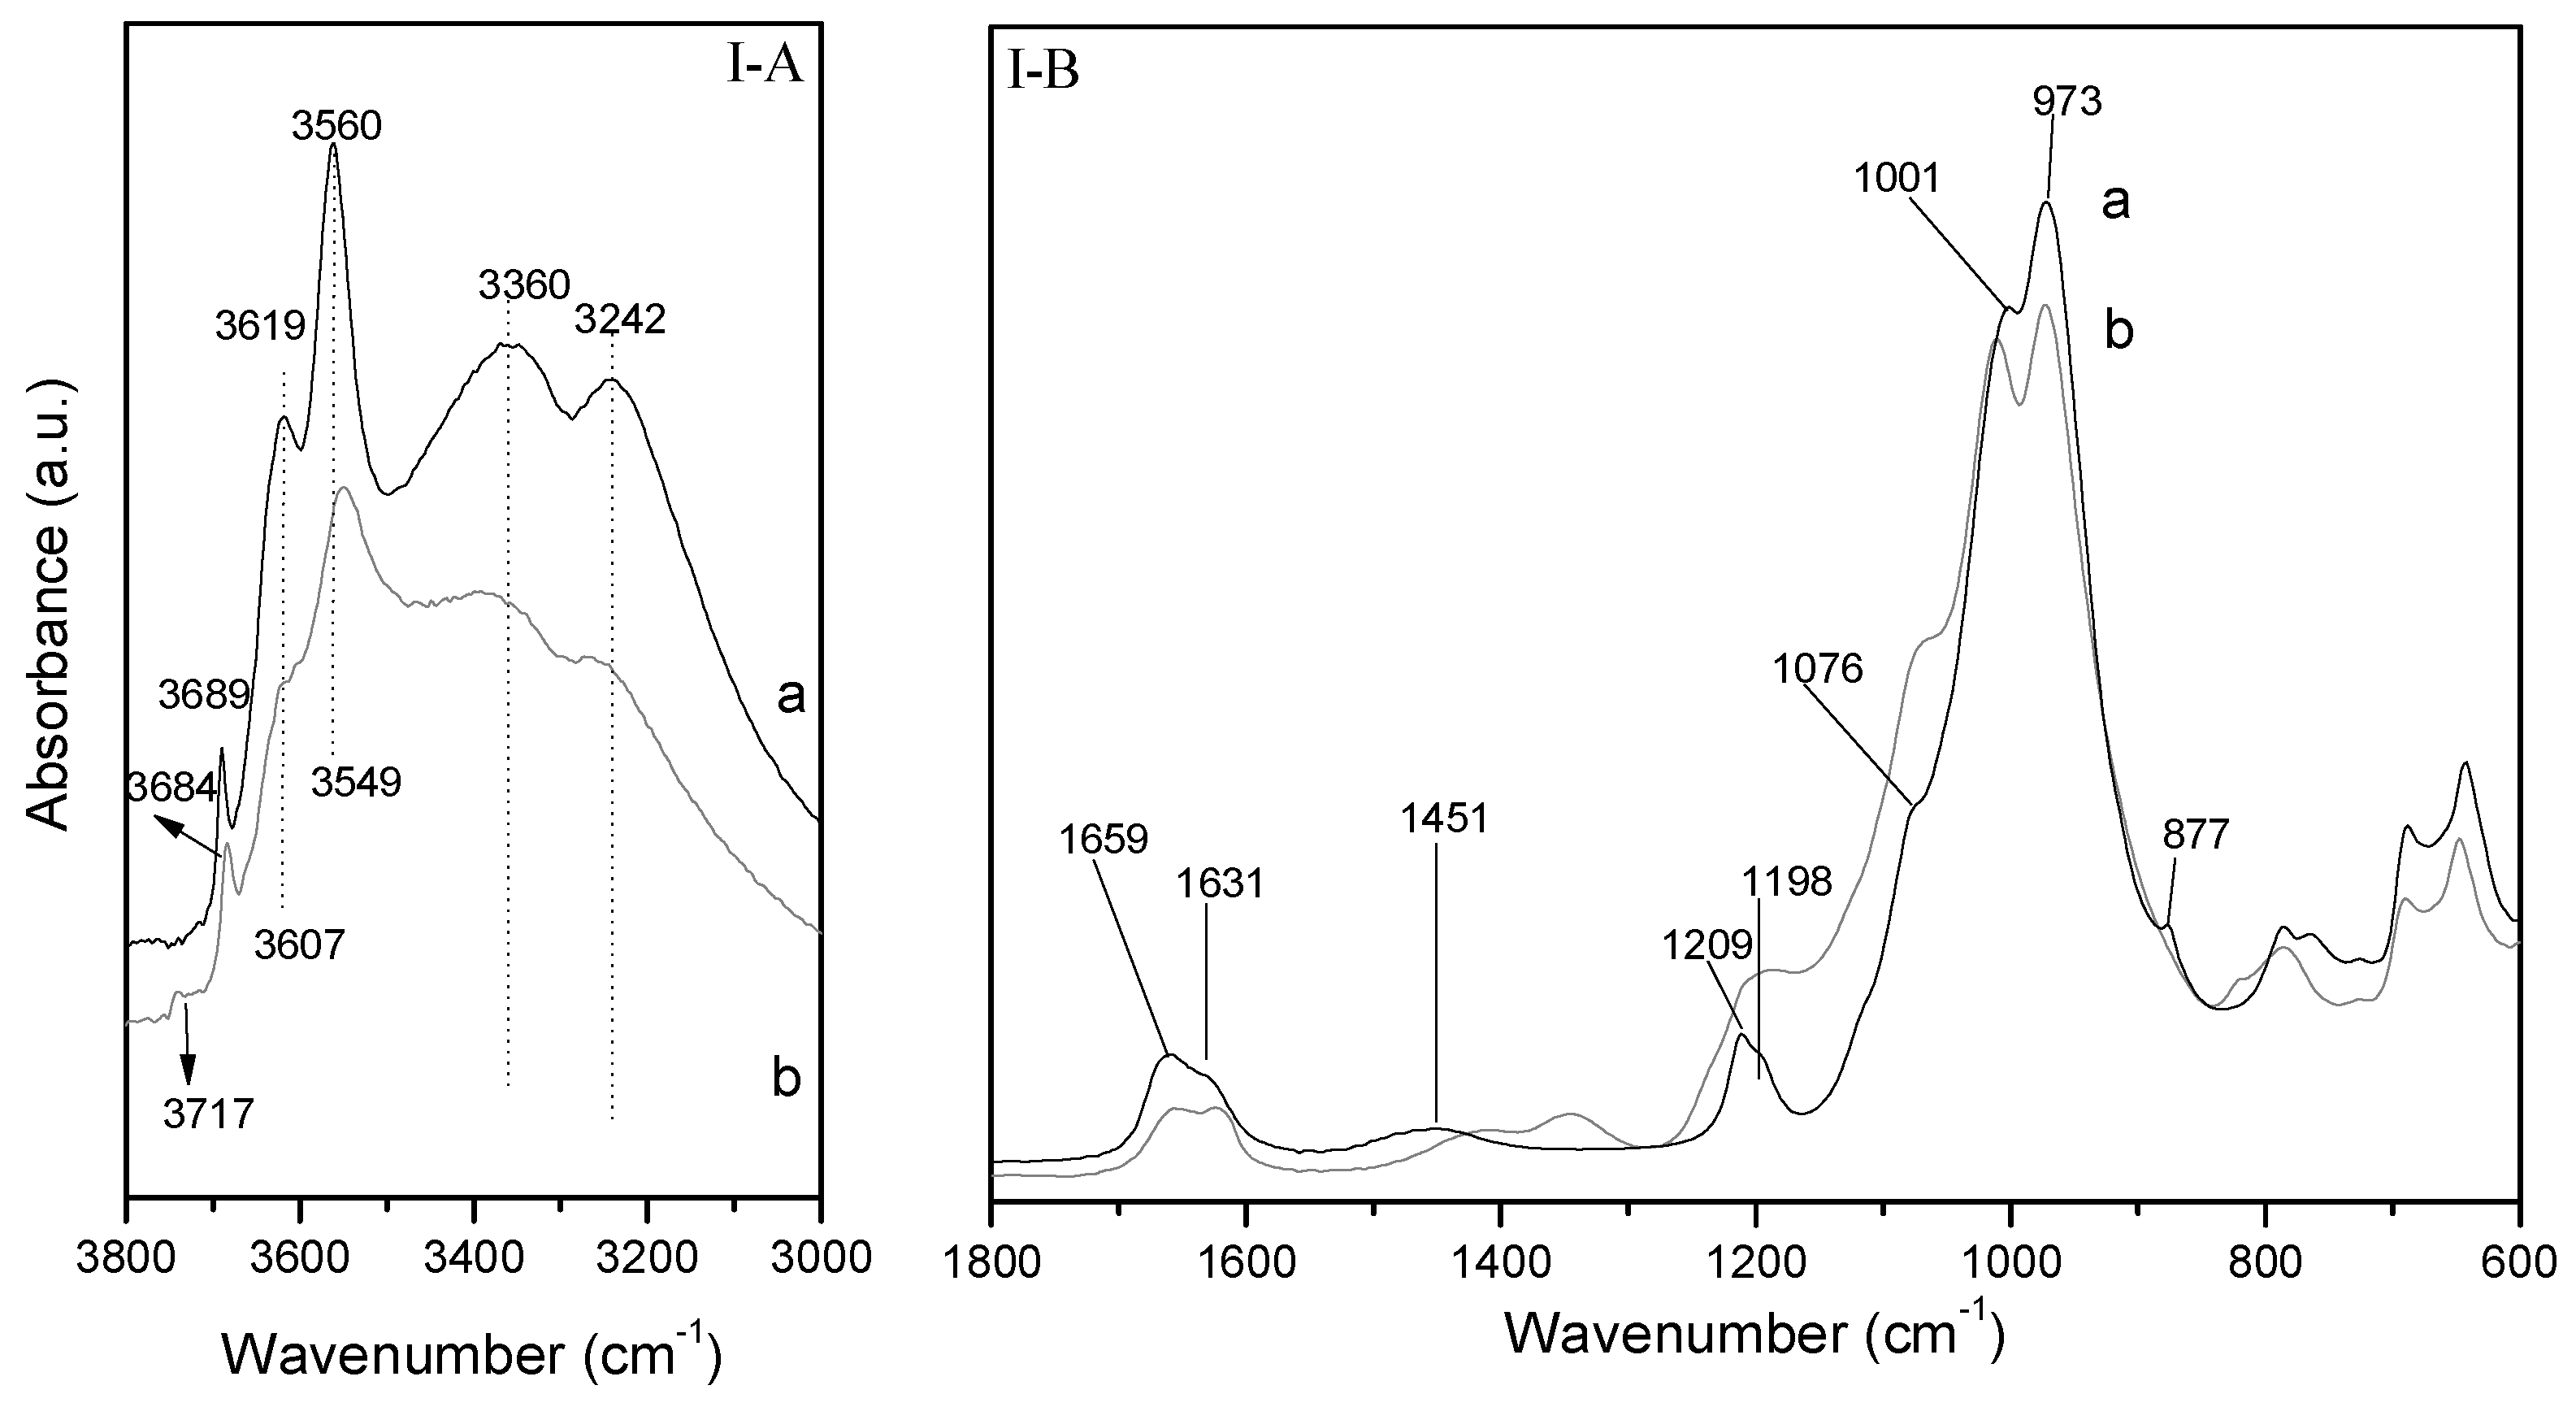
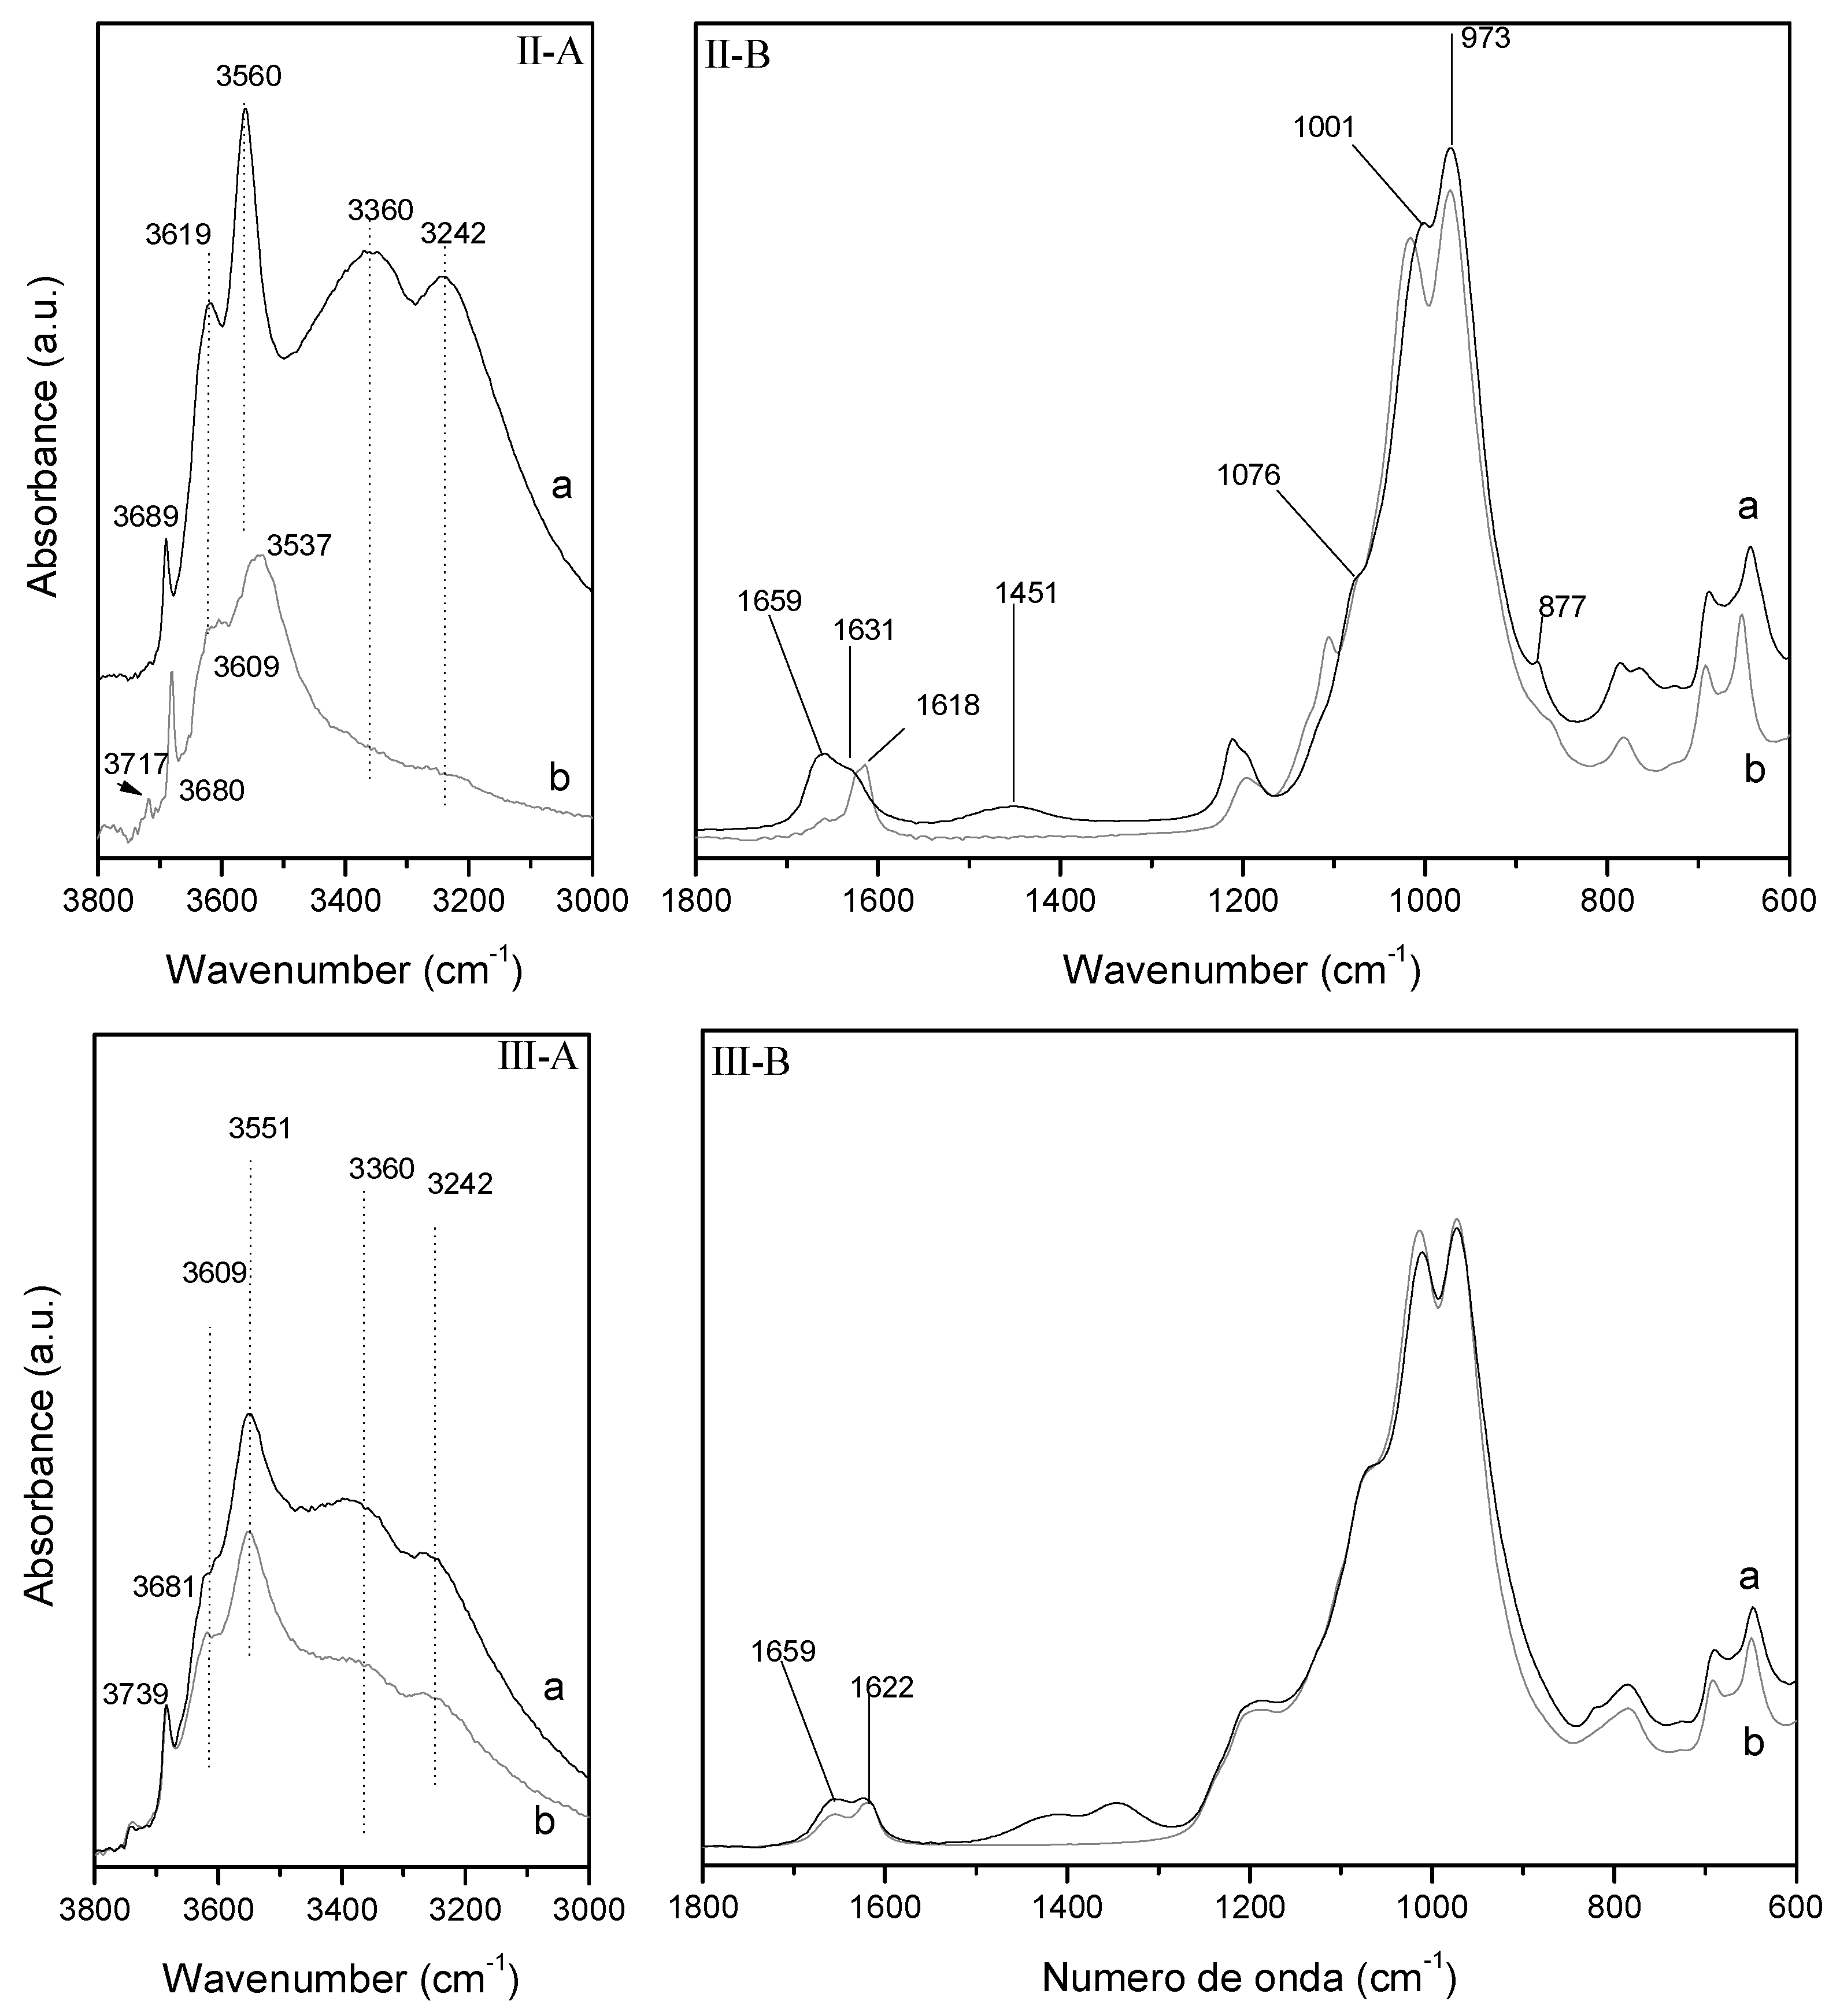
The hydroxyl-stretching region of the DRIFT spectra of the starting sepiolite sample (Sp) is shown in Figure 7I-A. In this region, sepiolite shows two bands at 3689 and 3619 cm−1 which are associated with the stretching vibration of the hydroxyls coordinated with magnesium; a band at 3560 cm−1 related with the stretching modes of molecular water coordinated with magnesium, and two bands at 3360 and 3242 cm−1 that have been attributed to zeolitic and coordinated water [33,34].
Figure 7I-B shows a comparison between the raw sepiolite and the sepiolite modified by microwave assisted acid treatment. The Si–O stretching region of the DRIFT spectra of natural sepiolite. According to Frost et al., bands at 1209, 1076, 1001, and 973 cm−1 are assigned to Si–O stretching modes, whereas band at 877 cm−1 are attributed to Mg–OH deformation and translation modes [32]. In other hand bands at 1659 and 1631 are attributed to these bands can be attributed to the zeolitic and adsorbed water, respectively [30], and band at 1451 cm−1 to the presence of carbonates [30].
The microwave assisted acid treatment (Sp–H) causes a drastic decreasing of the water stretching bands and O–H stretching bands (Figure 7I-B). These later are also broadened and shifted to lower wavenumbers. At the same time the Si–O bands are progressively widened to higher wavenumber causing a significant change in the profile of the DRIFT spectrum. In addition, it is noticeable the presence of a new band about 800 cm−1 as well as the shift of the Si–O stretching bands at higher wavenumber values, which confirms the formation of amorphous silica after the acid treatment, as other authors have previously indicated [26,35].
Similar observations can be made in the O–H stretching region after the treatment of sepiolite with Fe3+ solutions (Figure 7II-A,II-B). Nevertheless, in this case, despite the acidity of the Fe solution and the decrease in intensity of the O–H bands suggesting the partial dissolution of the octahedral sheets, a minor amount of amorphous silica is observed.
In the case of the sample Fe–Sp–H, the O–H stretching region of DRIFT spectra shows scarce modifications when compared with the DRIFT of Sp–H. The only observed modifications are those related with a new decreasing of O–H stretching and water stretching bands.

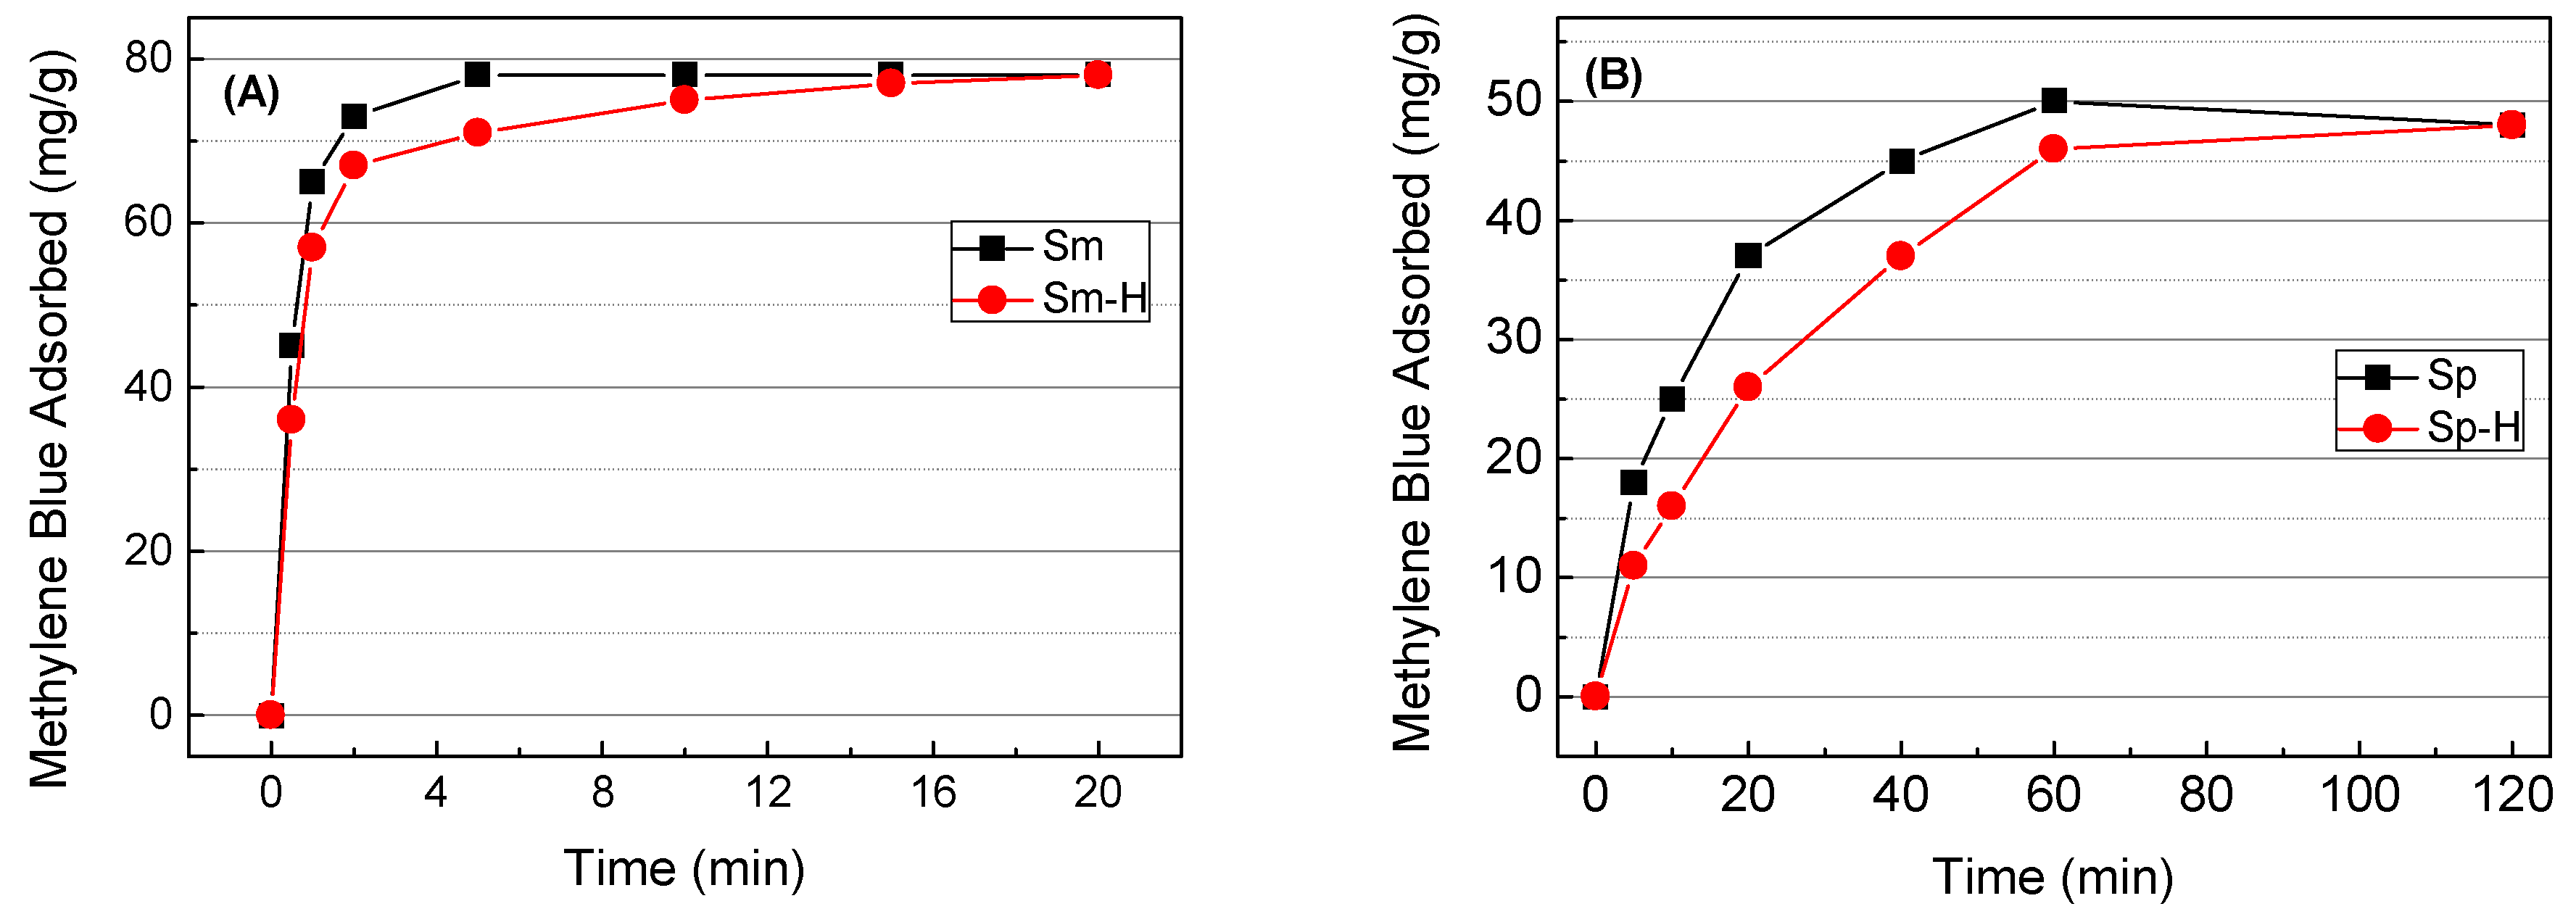
3.6. Batch Adsorption Results

The adsorption capacity of the clay mineral-based materials as a function of time is shown in Figure 8. These data reveals that the methylene blue adsorption on Mg-smectite-based materials is extremely fast, reaching equilibrium conditions after the first minutes. This result indicates the existence of a fast cationic exchange between the cations and methylene blue molecules. Although the adsorption on the external surface of the smectite particles plays an important role, the higher adsorption capacity of smectites compared with sepiolite suggests that a great proportion of methylene blue molecules are adsorbed between adjacent 2:1 layers of Mg-bentonite. These adsorption sites are very accessible since adjacent sheets are easily expanded in contact with the water molecules, favoring the introduction of the methylene blue in the interlayer space. Once the active sites are saturated, it has not been observed an increase of the methylene blue adsorption along the time.
In the case of the sepiolite-based materials (Figure 8), about 60 minutes are required to reach the equilibrium conditions. The absence on linearity in the adsorption process suggests the existence of several adsorption sites. Thus, methylene blue molecules are easily adsorbed on the external surface of the fibers, while the adsorption in fibers aggregates takes place slowly by the existence of lower porosity. The methylene blue adsorption in the structural microchannels must be discarded due to the dimensions of the methylene blue (17 Å × 7,6 Å × 3.25 Å), which are higher than the dimensions of the structural channels in the sepiolite (10.6 Å × 3.6 Å) [36].
The use of microwave-assisted acid treatment modifies the adsorption kinetics. Thus, Mg-smectite reveals that the acid treatment slightly slows the adsorption rate in the first minutes (Figure 9). This change in the adsorption kinetics suggests that some of the new adsorption sites, generated after the acid treatment, display H+ species adsorbed on the active sites, which slows the adsorption of methylene blue molecules, since H+ species have higher affinity by the active centers than methylene blue cations.
The microwave-assisted acid treatment of the raw sepiolite shows a similar effect in the adsorption kinetics to those observed in Mg-smectite (Figure 8) since the methylene adsorption is low at short and medium times, although after 120 min both materials reach similar values.
Considering the adsorption kinetics, an adsorption time of 20 min was chosen for the adsorption isotherms of Sm, while the adsorption isotherms were carried out after 120 min for the sepiolite-based materials.
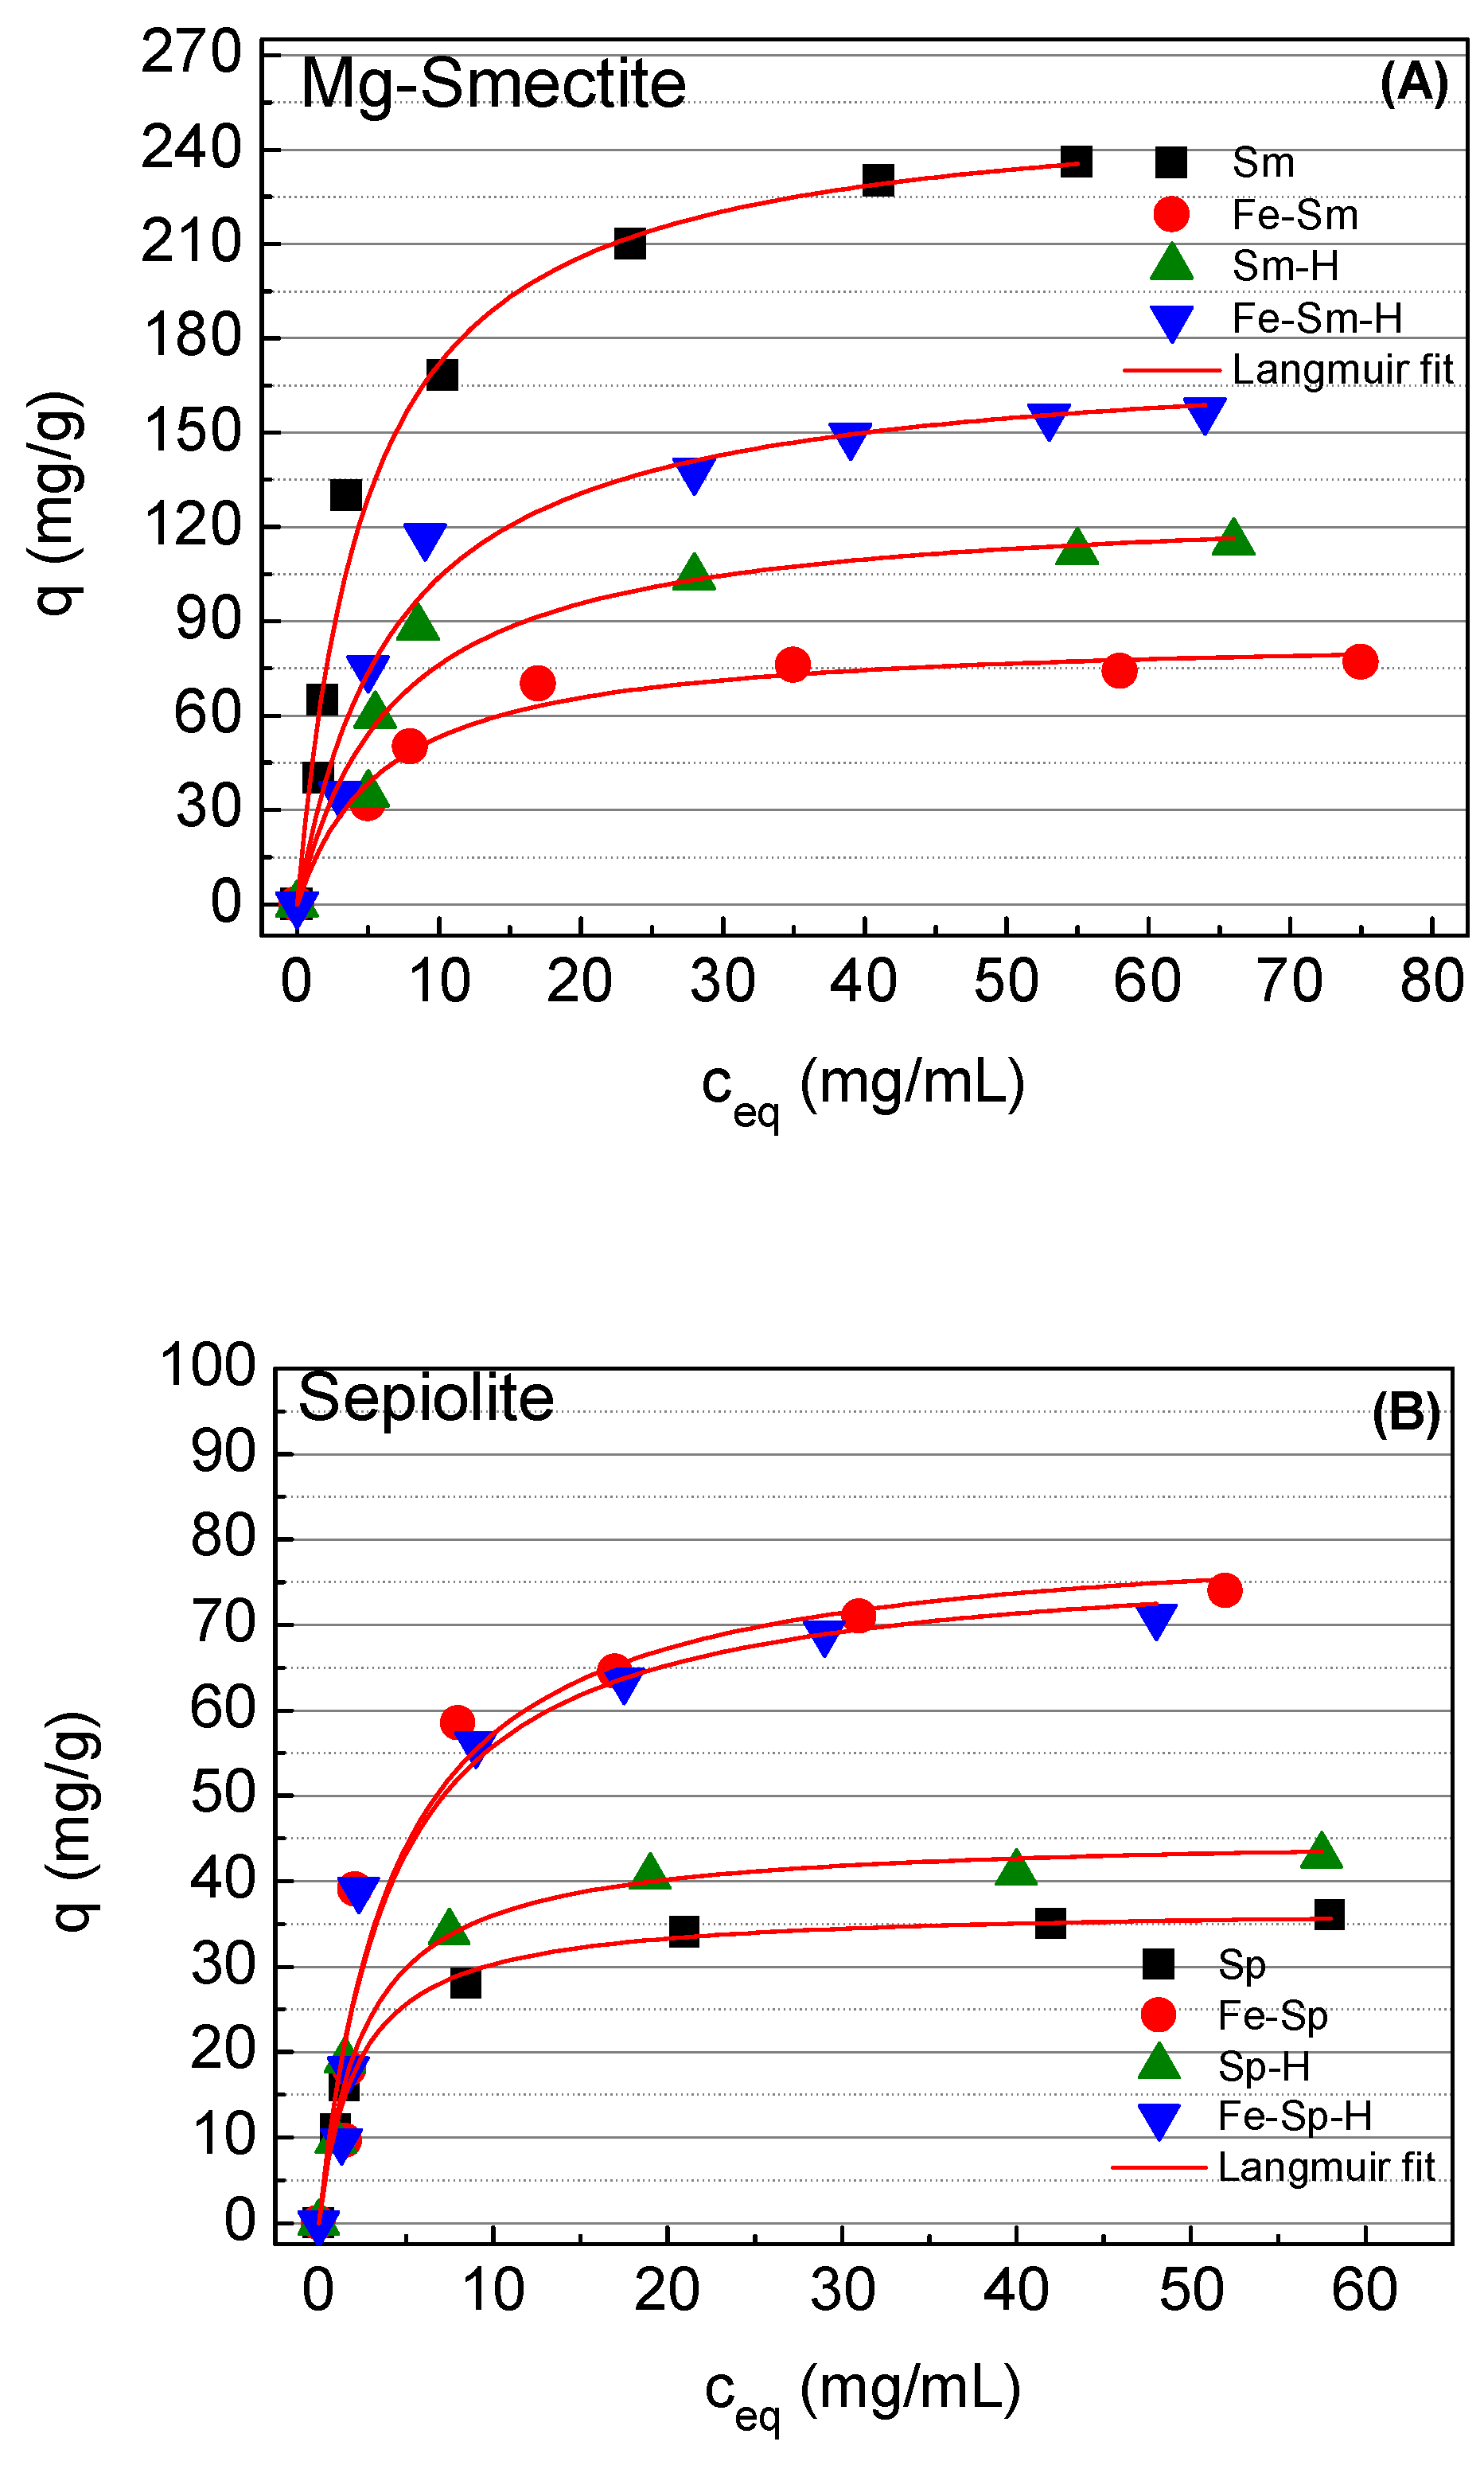
In all cases, the adsorption isotherms were well-fitted to the Langmuir model [37]. This elemental adsorption model assumes that occurs up to the formation of a monolayer, where a methylene blue molecule is adsorbed per each active site. In addition, these sites have the same binding energy, which supposes a homogeneous surface with no interactions between neighboring molecules. The Langmuir model is defined by the following equation:
  q =   q m × ( K L × c e q ) 1 + K L × c e q  
where q is the amount of methylene blue adsorbed per unit weight (mg·g−1), ceq is the concentration of methylene blue in the liquid phase at adsorption equilibrium (mg·mL−1), KL is the dissociation constant of Langmuir (mL·mg−1) that is associated with the energy of adsorption, and qm is the saturation capacity per unit weight (mg·g−1).
Although the Langmuir model [37] supposes that all adsorption sites have the same binding energy we must to take into account that this is a simplification of the reality since the starting minerals have different adsorption sites with different environments and, moreover, these differences are accentuated with the different treatments tested. However, we assume this simplification since it allows an adequate comparison of adsorbent properties. The adsorption data of the Sm-based material are compiled in Figure 9A. From this figure, it can be observed how the raw Sm displays the highest adsorption capacity, reaching a qm value of 256 mg methylene blue g−1 (0.80 mmol·g−1). Considering that the Mg-smectite displays a cationic exchange capacity (CEC) of 0.87 meq·g−1, the obtained values are slightly smaller to the theoretical one. The modification of the Sm by microwave-assisted acid treatment (Sm–H) cause a clear decrease in the adsorption capacity, obtaining a qm value of only 128 mg·g−1. This fact can be attributed to the acid treatment leads to loss of the active sites, by the disappearance of –OH groups coordinated with Mg species, which are leached in the acid treatment and the formation of amorphous silica. The decrease of the adsorption capacity after the acid treatment could also assigned to a proportion of cations located in the interlayer spacing can be replaced by H+ species, which have higher affinity by the active sites. In this sense, the KL data, that defines the interaction adsorbate–adsorbent, reveals that the KL data of the raw Mg-smectite is higher in comparison to the material treated with acid, which can confirm the presence of H+ that diminish the affinity with the methylene blue molecules.
The methylene blue adsorption of the Mg-smectite decreases even more when iron oxohydroxides species are incorporated in its interlayer spacing (Figure 9A), which led to the formation a pillared and rigid structure, as was suggested from the 001 reflection shown in the XRD data (Figure 3I). This fact limits the expansion of the interlayer spacing to retain methylene blue in aqueous medium, obtaining a qm value of 86 and 176 mg·g−1 for Sm–Fe and Fe–Sm–H, respectively (Table 3). With regard to the affinity defined by KL value, in both cases the affinity is lower to that observer for the raw material, probably due to the increase of rigidity of the pillared structure that avoids the expansion of the interlayer spacing, limiting the amount of available active sites.
The adsorption isotherms of the sepiolite-based adsorbents are shown in Figure 9B. In the case of the raw sepiolite (Sp) the qm adsorption is only of 37 mg of methylene blue g−1 (0.12 mmol·g−1) (Table 3). These values are well below the CEC (37 meq·g−1), which can be expected since the methylene blue molecular is too bulky to access the small zeolitic channels of sepiolite. From these data it can be inferred that the adsorption capacity is directly related with the structure of both materials since the adsorption capacity of the septiolite is five times lower to that observed for the raw Mg-smectite. On the one hand, Mg-smectite (Sm) can adsorb methylene blue on its external surface as well as in the interlayer space since the interlayer space can expand to accommodate the methylene blue cations. On the other hand, the rigid structure of sepiolite (Sp) and the cross-section of its channels, smaller than the dimension of the methylene blue cation. This limits the adsorption to the external surface of sepiolite fibers exclusively. The modification of the raw sepiolite by acid treatment causes a slight increase of the adsorption capacity, reaching a qm value of 45 mg·g−1, although the SBET value increases in higher proportion (from 308 to 400 m2·g−1) (Table 3). This increasing of the SBET value is related to both the dispersion of fibers making accessible new active centers for adsorption and the formation of amorphous silica phase without active centers. Thus, only a part of the new generated SBET has the ability to adsorb methylene blue cations. For this reason, the increasing of adsorption capacity is notably lower than the increasing of SBET.
Unlike to that observed in Mg-smectite, the incorporation of iron oxohydroxides species into both Sp and Sp–H clearly improves the methylene blue adsorption capacity, reaching a qm values of 82 and 79 mg·g−1 for Fe–Sp and Fe–Sp–H, respectively. Nonetheless, the isotherms report that the affinity of these sites are lower to those shown in the case of the starting sepiolite, as indicates the KL value (Table 3). This remarkable increasing in the adsorption capacities are not in line with the decreasing in SBET, mainly decreasing of micropore surface, observed with the Fe-treatment (Table 2). This decreasing the micropore surface is related to the steric impediment generated by iron species within the channels of Sepiolite. However, taking into account that the methylene blue adsorption in Sepiolite occurs exclusively at the external surface of fibers, the formation of new adsorption centers due to the presence of iron oxohydroxides species can explain the increasing of adsorption capacities.

4. Conclusions

The present study evaluates the adsorption capacity of two clay minerals with different morphologies. These clays are a Mg-smectite, which is formed by stacked sheets, and a sepiolite with fibrous structure and small channels inside of its structure.
This study have shown that, in the starting clay samples, the adsorption capacities of methylene blue is markedly related with the structural characteristics of both minerals. The higher adsorption capacity of the Mg-smectite compared with the sepiolite is related to the ability of Mg-smectite to expand basal spacing and accommodate methylene blue cations, whereas, in sepiolite, the lower cation exchange capacity, as well as the cross-section of the structural channels, prevents the entry of these cations. Thus in Mg-smectite the adsorption of methylene blue occurs in both the interlayer positions and at the external surface of lamellar particles. While, in sepiolite the adsorption of methylene blue is limited at the external surface of fibers exclusively.
The modification of the Mg-smectite by microwave-assisted acid treatment cause a clear decrease in the adsorption capacity attributed to the partial loss of the interlayer positions by the loss of the octahedral sheet and subsequent formation of amorphous silica without active centers. Moreover, the methylene blue adsorption of the Mg-smectite decreases even more when iron oxohydroxides species are incorporated in its interlayer spacing forming a rigid pillared structure with a fixed interlayer space which is smaller than the methylene blue cation size. Thus, this structural modification makes inaccessible the interlayer active sites for this cation.
On the contrary, the microwave-assisted acid treatment of sepiolite causes a slight increase in the adsorption capacity related with the dispersion of fibers. Nevertheless, contrary to that observed with Mg-Smectite, greater increases of adsorption capacities were obtained after the formation of new adsorption centers due to the incorporation of iron oxohydroxides species at the external surfaces of sepiolite.

Author Contributions

M.P. provided the samples for this work. F.F., M.P., and V.H. conceived and designed the experimental research and reviewed background research. C.L.M. and M.J.B. supervised data acquisition and compilation. L.P. and J.A.C. carried out the experiments, data reduction, and calculations. All authors contributed to the interpretation of the results as well as writing and editing of the paper. The authors have approved the submitted version and agree to be personally accountable for the author’s own contributions and for ensuring that questions related to the accuracy or integrity of any part of the work, even ones in which the author was not personally involved, are appropriately investigated, resolved, and documented in the literature.

Funding

This research received no external funding.

Acknowledgments

The authors are very grateful for the inestimable help of the reviewers who have significantly improved the article. The authors wish to thank the project BIA2017-82391-R for the financial support. The preparation of this paper is included within the activities of the RNM-199 (Universidad de Málaga) and C-144 (Universidad Autónoma de Madrid, Geomaterials and Geological Processes) Research Groups.

Conflicts of Interest

The authors declare no conflicts of interest. The founding sponsors had no role in the design of the study; in the collection, analyses, or interpretation of data; in the writing of the manuscript, and in the decision to publish the results.

References

  1. İyim, T.B.; Güçlü, G. Removal of basic dyes from aqueous solutions using natural clay. Desalination 2009, 249, 1377–1379. [Google Scholar]
  2. Kabra, A.N.; Khandare, R.V.; Waghmode, T.R.; Govindwar, S.P. Phytoremediation of textile effluent and mixture of structurally different dyes by Glandularia Pulchella (Sweet). Chemosphere 2012, 87, 265–272. [Google Scholar] [CrossRef] [PubMed]
  3. Auta, M.; Hameed, B.H. Coalesced chitosan activated carbon composite for batch and fixed-bed adsorption of cationic and anionic dyes. Colloids Surf. B 2013, 105, 199–206. [Google Scholar] [CrossRef] [PubMed]
  4. Leodopoulos, C.; Doulia, D.; Gimouhopoulos, K. Adsorption of cationic dyes onto bentonite. Sep. Purif. Rev. 2014, 44, 74–107. [Google Scholar] [CrossRef]
  5. Yagub, M.T.; Sen, T.K.; Afroze, S.; Ang, H.M. Dye and its removal from aqueous solution by adsorption: A review. Adv. Colloid Interface Sci. 2014, 209, 172–184. [Google Scholar] [CrossRef] [PubMed]
  6. Vaccari, A. Clays and catalysis: A promising future. Appl. Clay Sci. 1999, 14, 161–198. [Google Scholar] [CrossRef]
  7. Abbassi, R.; Yadav, A.K.; Kumar, N.; Huang, S.; Jaffe, P.R. Modeling and optimization of dye removal using “green” clay supported iron nanoparticles. Ecol. Eng. 2013, 61, 366–370. [Google Scholar] [CrossRef]
  8. Borisover, M.; Davis, J.A. Adsorption of inorganic and organic solutes by clay minerals. Dev. Clay Sci. 2015, 6, 33–70. [Google Scholar]
  9. Bailey, S.W. Structures of layer silicates. In Crystal Structures of Clay Minerals and their X-ray Identification; Mineralogical Society: London, UK, 1984; pp. 1–123. [Google Scholar]
  10. Benlikaya, R.; Alkan, M.; Kaya, I. Preparation and characterization of sepiolite-poly (ethyl methacrylate) and poly (2-hydroxyethyl methacrylate) nanocomposites. Polym. Compos. 2009, 30, 1585–1594. [Google Scholar] [CrossRef]
  11. Jones, B.F.; Galán, E. Sepiolite and Palygorskite. Miner. Soc. Am. 1988, 19, 631–674. [Google Scholar]
  12. Galán, E.; Carretero, M.I. A new approach to compositional limits for sepiolite and palygorskite. Clays Clay Miner. 1999, 47, 399–409. [Google Scholar]
  13. Galarneau, A.; Barodawalla, A.; Pinnavaia, T.J. Porous clay heterostructures formed by gallery, -templated synthesis. Nature 1995, 374, 529–531. [Google Scholar] [CrossRef]
  14. Cecilia, J.A.; García-Sancho, C.; Franco, F. Montmorillonite based porous clay heterostructures: Influence of Zr in the structure and acidic properties. Microporous Mesoporous Mater. 2013, 176, 95–102. [Google Scholar] [CrossRef]
  15. Al-Khatib, L.; Fraige, F.; Al-Hwaiti, M.; Al-Khashman, O. Adsorption from aqueous solution onto natural and acid activated bentonite. Am. J. Environ. Sci. 2012, 8, 510–522. [Google Scholar] [CrossRef]
  16. Toor, M.; Jin, B.; Daí, S.; Vimonses, V. Activating natural bentonite as a cost-effective adsorbent for removal of Congo-red in wastewater. J. Ind. Eng. Chem. 2015, 21, 653–661. [Google Scholar] [CrossRef]
  17. Franco, F.; Pozo, M.; Cecilia, J.A.; Benítez-Guerrero, M.; Pozo, E.; Martín-Rubí, J.A. Microwave assisted acid treatment of sepiolite: The role of composition and “crystallinity”. Appl. Clay Sci. 2014, 102, 15–27. [Google Scholar] [CrossRef]
  18. Franco, F.; Pozo, M.; Cecilia, J.A.; Benítez-Guerrero, M.; Lorente, M. Effectiveness of microwave assisted acid treatment on dioctahedral and trioctahedral smectites. The influence of octahedral composition. Appl. Clay Sci. 2016, 120, 70–80. [Google Scholar] [CrossRef]
  19. Vilarrasa-García, E.; Cecilia, J.A.; Bastos-Neto, M.; Cavalcante, C.L.; Azevedo, D.C.S.; Rodríguez-Castellón, E. Microwave-assisted nitric acid treatment of sepiolite and functionalization with polyethylenimine applied to CO2 capture and CO2/N2 separation. Appl. Surf. Sci. 2017, 410, 315–325. [Google Scholar]
  20. Franco, F.; Benítez-Guerrero, M.; Gonzalez-Triviño, I.; Pérez-Recuerda, R.; Assiego, C.; Cifuentes-Melchor, J.; Pascual-Cosp, J. Low-cost aluminum and iron oxides supported on dioctahedral and trioctahedral smectites: A comparative study of the effectiveness on the heavy metal adsorption from water. Appl. Clay Sci. 2016, 119, 321–332. [Google Scholar] [CrossRef]
  21. Hang, P.T.; Brindley, G.W. Methylene blue absorption by clay minerals. Determination of surface areas and cation exchange capacities (Clay-organic studies XVIII). Clays Clay Miner. 1970, 18, 203–212. [Google Scholar] [CrossRef]
  22. Küncek, I.; Şener, S. Adsorption of methylene blue onto sonicated sepiolite from aqueous solutions. Ultrason. Sonochem. 2010, 17, 250–257. [Google Scholar]
  23. Korichi, S.; Elias, A.; Mefti, A. Characterization of smectite after acid activation with microwave irradiation. Appl. Clay Sci. 2009, 42, 432–438. [Google Scholar] [CrossRef]
  24. Brunauer, S.; Emmett, P.H.; Teller, E. Adsorption of gases in multimolecular layers. J. Am. Ceram. Soc. 1938, 60, 309–319. [Google Scholar] [CrossRef]
  25. Madejová, J. FTIR techniques in clay mineral studies. Vib. Spectrosc. 2003, 31, 1–10. [Google Scholar]
  26. Lippens, B.C.; De Boer, J.H. Studies on pore systems in catalysts: V. The t method. J. Catal. 1965, 4, 319–323. [Google Scholar] [CrossRef]
  27. Van der Marel, H.W.; Beutelspacher, H. Atlas of Infrared Spectroscopy of Clay Minerals and Their Admixtures; Elsevier: Amsterdam, The Nertherlands, 1976. [Google Scholar]
  28. Kloprogge, J.T.; Frost, R.L. Thermal decomposition of Ferrianchamosite: An infrared emission spectroscopic study. Contrib. Mineral. Petrol. 2000, 138, 59–67. [Google Scholar] [CrossRef]
  29. Zviagina, B.B.; McCarty, D.K.; Srodon, J.; Drits, V.A. Interpretation of infrared spectra of dioctahedral smectites in the region of OH-stretching vibrations. Clay Clay Miner. 2004, 52, 399–410. [Google Scholar] [CrossRef]
  30. Farmer, V.C. The Layer Silicates. In The Infrared Spectra of Minerals; Mineralogical Society: London, UK, 1974; pp. 331–363. [Google Scholar]
  31. Johnston, C.T.; Premachandra, G.S. Polarized ATR-FTIR Study of Smectite in Aqueous Suspension. Langmuir 2001, 17, 3712–3718. [Google Scholar] [CrossRef]
  32. Komadel, P.; Madejová, J. Acid activation of clay minerals. Dev. Clay Sci. 2006, 1, 265–289. [Google Scholar]
  33. Frost, R.L.; Locos, O.B.; Ruan, H.; Kloprogge, J.T. Near-infrared and mid-infrared spectroscopic study of sepiolites and palygorskites. Vib. Spectrosc. 2001, 27, 1–13. [Google Scholar] [CrossRef]
  34. Frost, R.L.; Cash, G.A.; Kloprogge, J.T. “Rocky Mountain leather”, sepiolite and attapulgite-an infrared emission spectroscopic study. Vib. Spectrosc. 1998, 16, 173–184. [Google Scholar] [CrossRef]
  35. Valentín, J.L.; López-Manchado, M.A.; Rodríguez, A.; Posadas, P.; Ibarra, L. Novel anhydrous unfolded structure by heating of acid pre-treated sepiolite. Appl. Clay Sci. 2007, 36, 245–255. [Google Scholar]
  36. Raya, J.; Hirschinger, J.; Ovarlez, S.; Giulieri, F.; Chazeb, A.M.; Delamare, F. Insertion of indigo molecules in the sepiolite structure as evidenced by 1H–29Si heteronuclear correlation spectroscopy. Phys. Chem. Chem. Phys. 2010, 12, 14508–14514. [Google Scholar] [CrossRef] [PubMed]
  37. Langmuir, I. The adsorption of gases on plane surfaces of glass, mica and platinum. J. Am. Chem. Soc. 1918, 40, 1361–1403. [Google Scholar] [CrossRef]
Figure 1. XRD patterns of starting Sm (a) and Sp (b).
Minerals 08 00359 g001
Figure 2. (I): XRD patterns of starting Sm (a) and Sm–H (b). (II): Comparison of XRD patterns of starting Sp (a, black) and Sp–H (b, grey).
Minerals 08 00359 g002
Figure 3. (I) Comparison of XRD patterns of starting Sm (a, black), Fe–Sm (b, grey), Sm–H (c), and Fe–Sm–H (d, grey), (II) Comparison of XRD patterns of starting Sp (a, black), Fe–Sp (b, grey), Sp–H (c), and Fe–Sp–H (d, grey).
Minerals 08 00359 g003
Figure 4. SEM micrographs of natural Sm (a), Sm–H (b), Fe–Sm (c), and Fe–Sm–H (d).
Minerals 08 00359 g004
Figure 5. SEM micrographs of natural Sp (a), Sp–H (b), Fe–Sp (c), and Fe–Sp–H (d).
Minerals 08 00359 g005
Figure 6. (I) Comparison of DRIFT spectra of natural Sm (A) vs. Sm–H (B, grey); (II) comparison of DRIFT spectra of natural Sm (A) vs. Fe–Sm (B, grey) and (III) comparison of DRIFT spectra of Sm–H (A) vs. Fe–Sm–H (B, grey).
Minerals 08 00359 g006aMinerals 08 00359 g006b
Figure 7. (I) Comparison of DRIFT spectra of natural Sepiolite (A) vs. Sp–H (B, red); (II) comparison of DRIFT spectra of natural Sepiolite (A), Fe–Sp (B, grey) and (III) comparison of DRIFT spectra of Sp–H (A) vs. Fe–Sp–H (B, grey).
Minerals 08 00359 g007
Figure 8. Kinetics of methylene blue adsorption in natural Mg-smectite (Sm) (A) and sepiolite (Sp) (B), and in the acid activated materials.
Minerals 08 00359 g008
Figure 9. Experimental adsorption isotherms of methylene blue adsorption in Sm (A) and Sp (B), and in the obtained materials.
Minerals 08 00359 g009
Table 1. Chemical analysis of starting and treated Sm and Sp (wt %).
SampleSiO2Al2O3MgOFe2O3Na2OK2OCaOMnOP2O5TiO2
Sm56.064.8421.451.440.1460.7262.720.04420.110.156
Sm–H57.054.716.161.5500.7450.3660.03500.171
Fe–Sm57.995.8521.394.560.1540.8841.120.05850.1110.181
Fe–Sm–H64.655.0217.354.180.1370.780.08340.03380.05940.177
Sp61.671.6721.80.5370.2080.2220.9520.03180.00870.0617
Sp–H65.571.4616.440.5470.06270.2060.1040.026100.0637
Fe–Sp62.381.6421.413.0900.2040.03070.03050.02310.0634
Fe–Sp–H69.071.4616.431.5800.1990.01150.02110.00760.0645
Table 2. Specific surface areas (m2·g−1) of the natural clays and the obtained materials.
SampleSmFe–SmSm–HFe–Sm–HSpFe–SpSp–HFe–Sp–H
Smicro92138164170182169218199
Sext9096163131126130182180
SBET182234327301308299400379
Table 3. Adsorption data obtained from Langmuir Adsorption Isotherm.
Langmuir Langmuir
Spqm36.981 ± 4.310Smqm256.469 ± 12.197
KL0.450 ± 0.021KL0.203 ± 0.015
r20.99692r20.98004
Fe–Spqm81.543 ± 6.481Fe–Smqm85.914 ± 7.815
KL0.235 ± 0.012KL0.162 ± 0.009
r20.94195r20.97163
Sp–Hqm45.471 ± 4.415Sm–Hqm128.452 ± 6.489
KL0.3801 ± 0.024KL0.1458 ± 0.008
r20.98978r20.9297
Fe–Sp–Hqm78.651 ± 5.852Fe–Sm–Hqm175.902 ± 8.521
KL0.244 ± 0.011KL0.144 ± 0.007
r20.95833r20.96971
KL: mg·mL−1; qm: mg·g−1.

