Adsorption Structure and Mechanism of Styryl Phosphoric Acid at the Rutile–Water Interface

 ,
, 
 ,
, 
Abstract
1. Introduction
2. Materials and Methods
2.1. Materials and Reagents
2.2. Methods
2.2.1. Zeta Potential Measurements
2.2.2. Adsorption Experiments
2.2.3. FT-IR Spectroscopy of Rutile–SPA Complexes
2.2.4. XPS Measurements
3. Results and Discussion
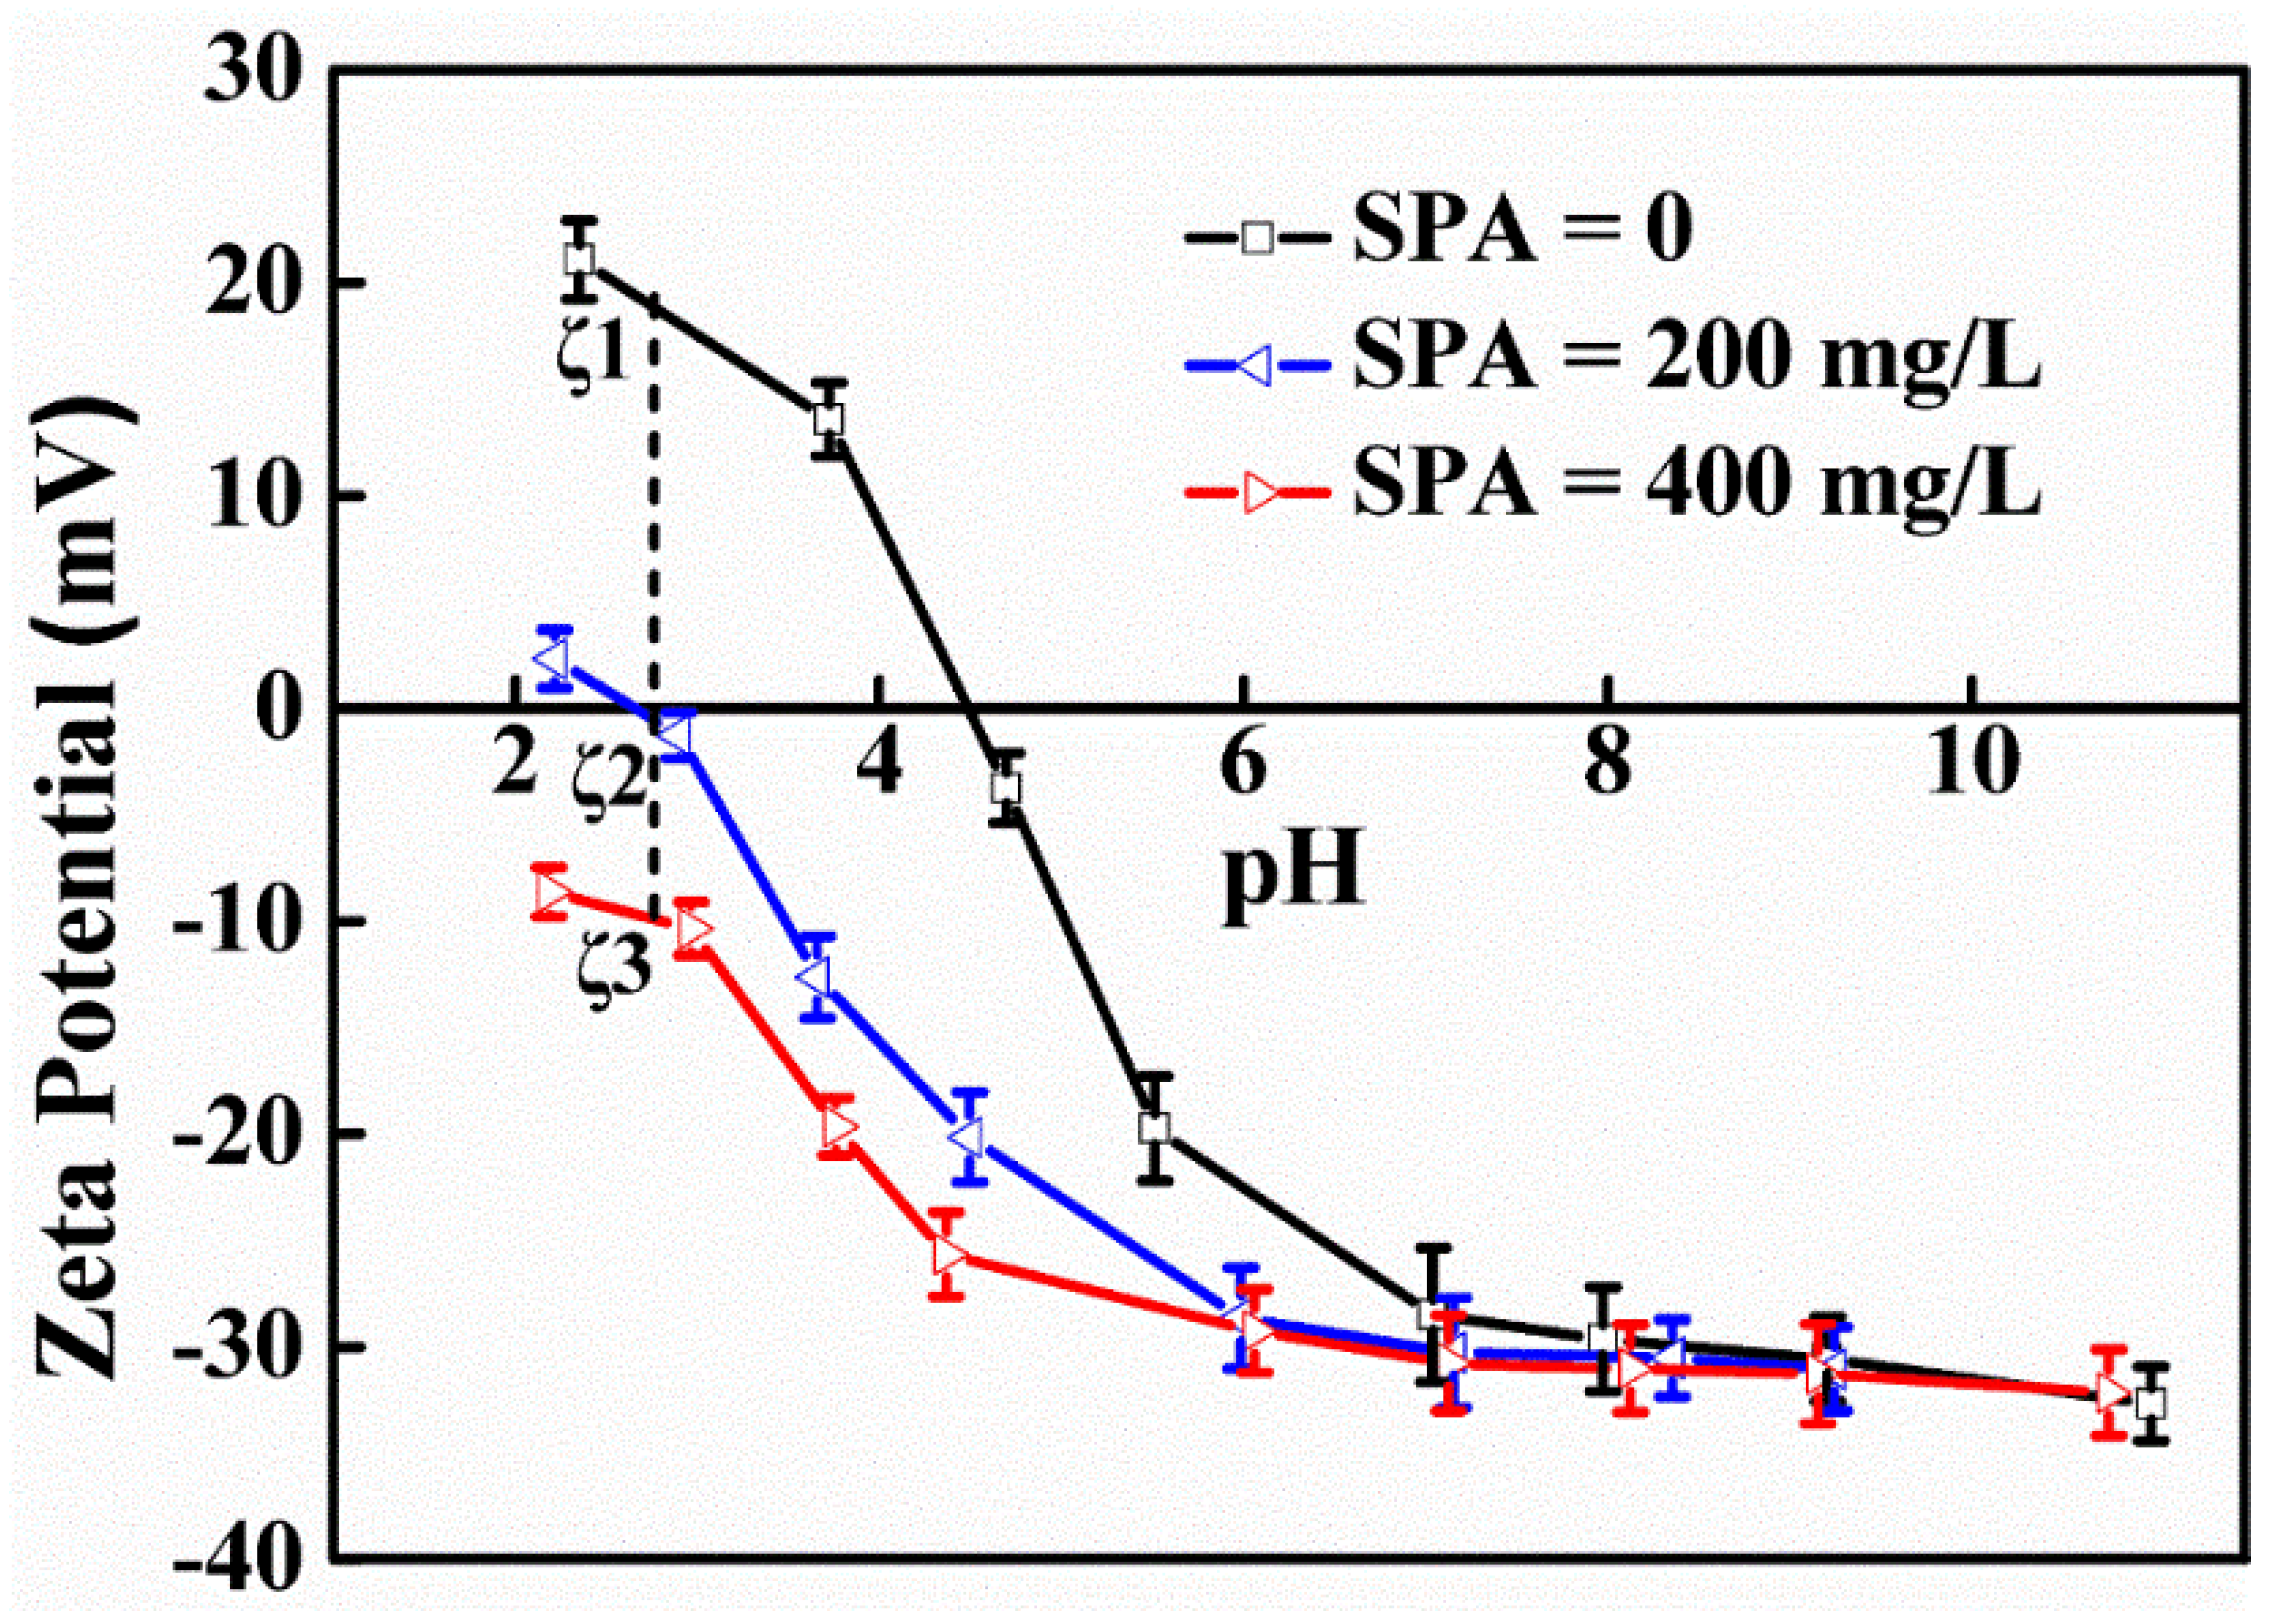
3.1. Zeta Potentials of the TiO2 Surface
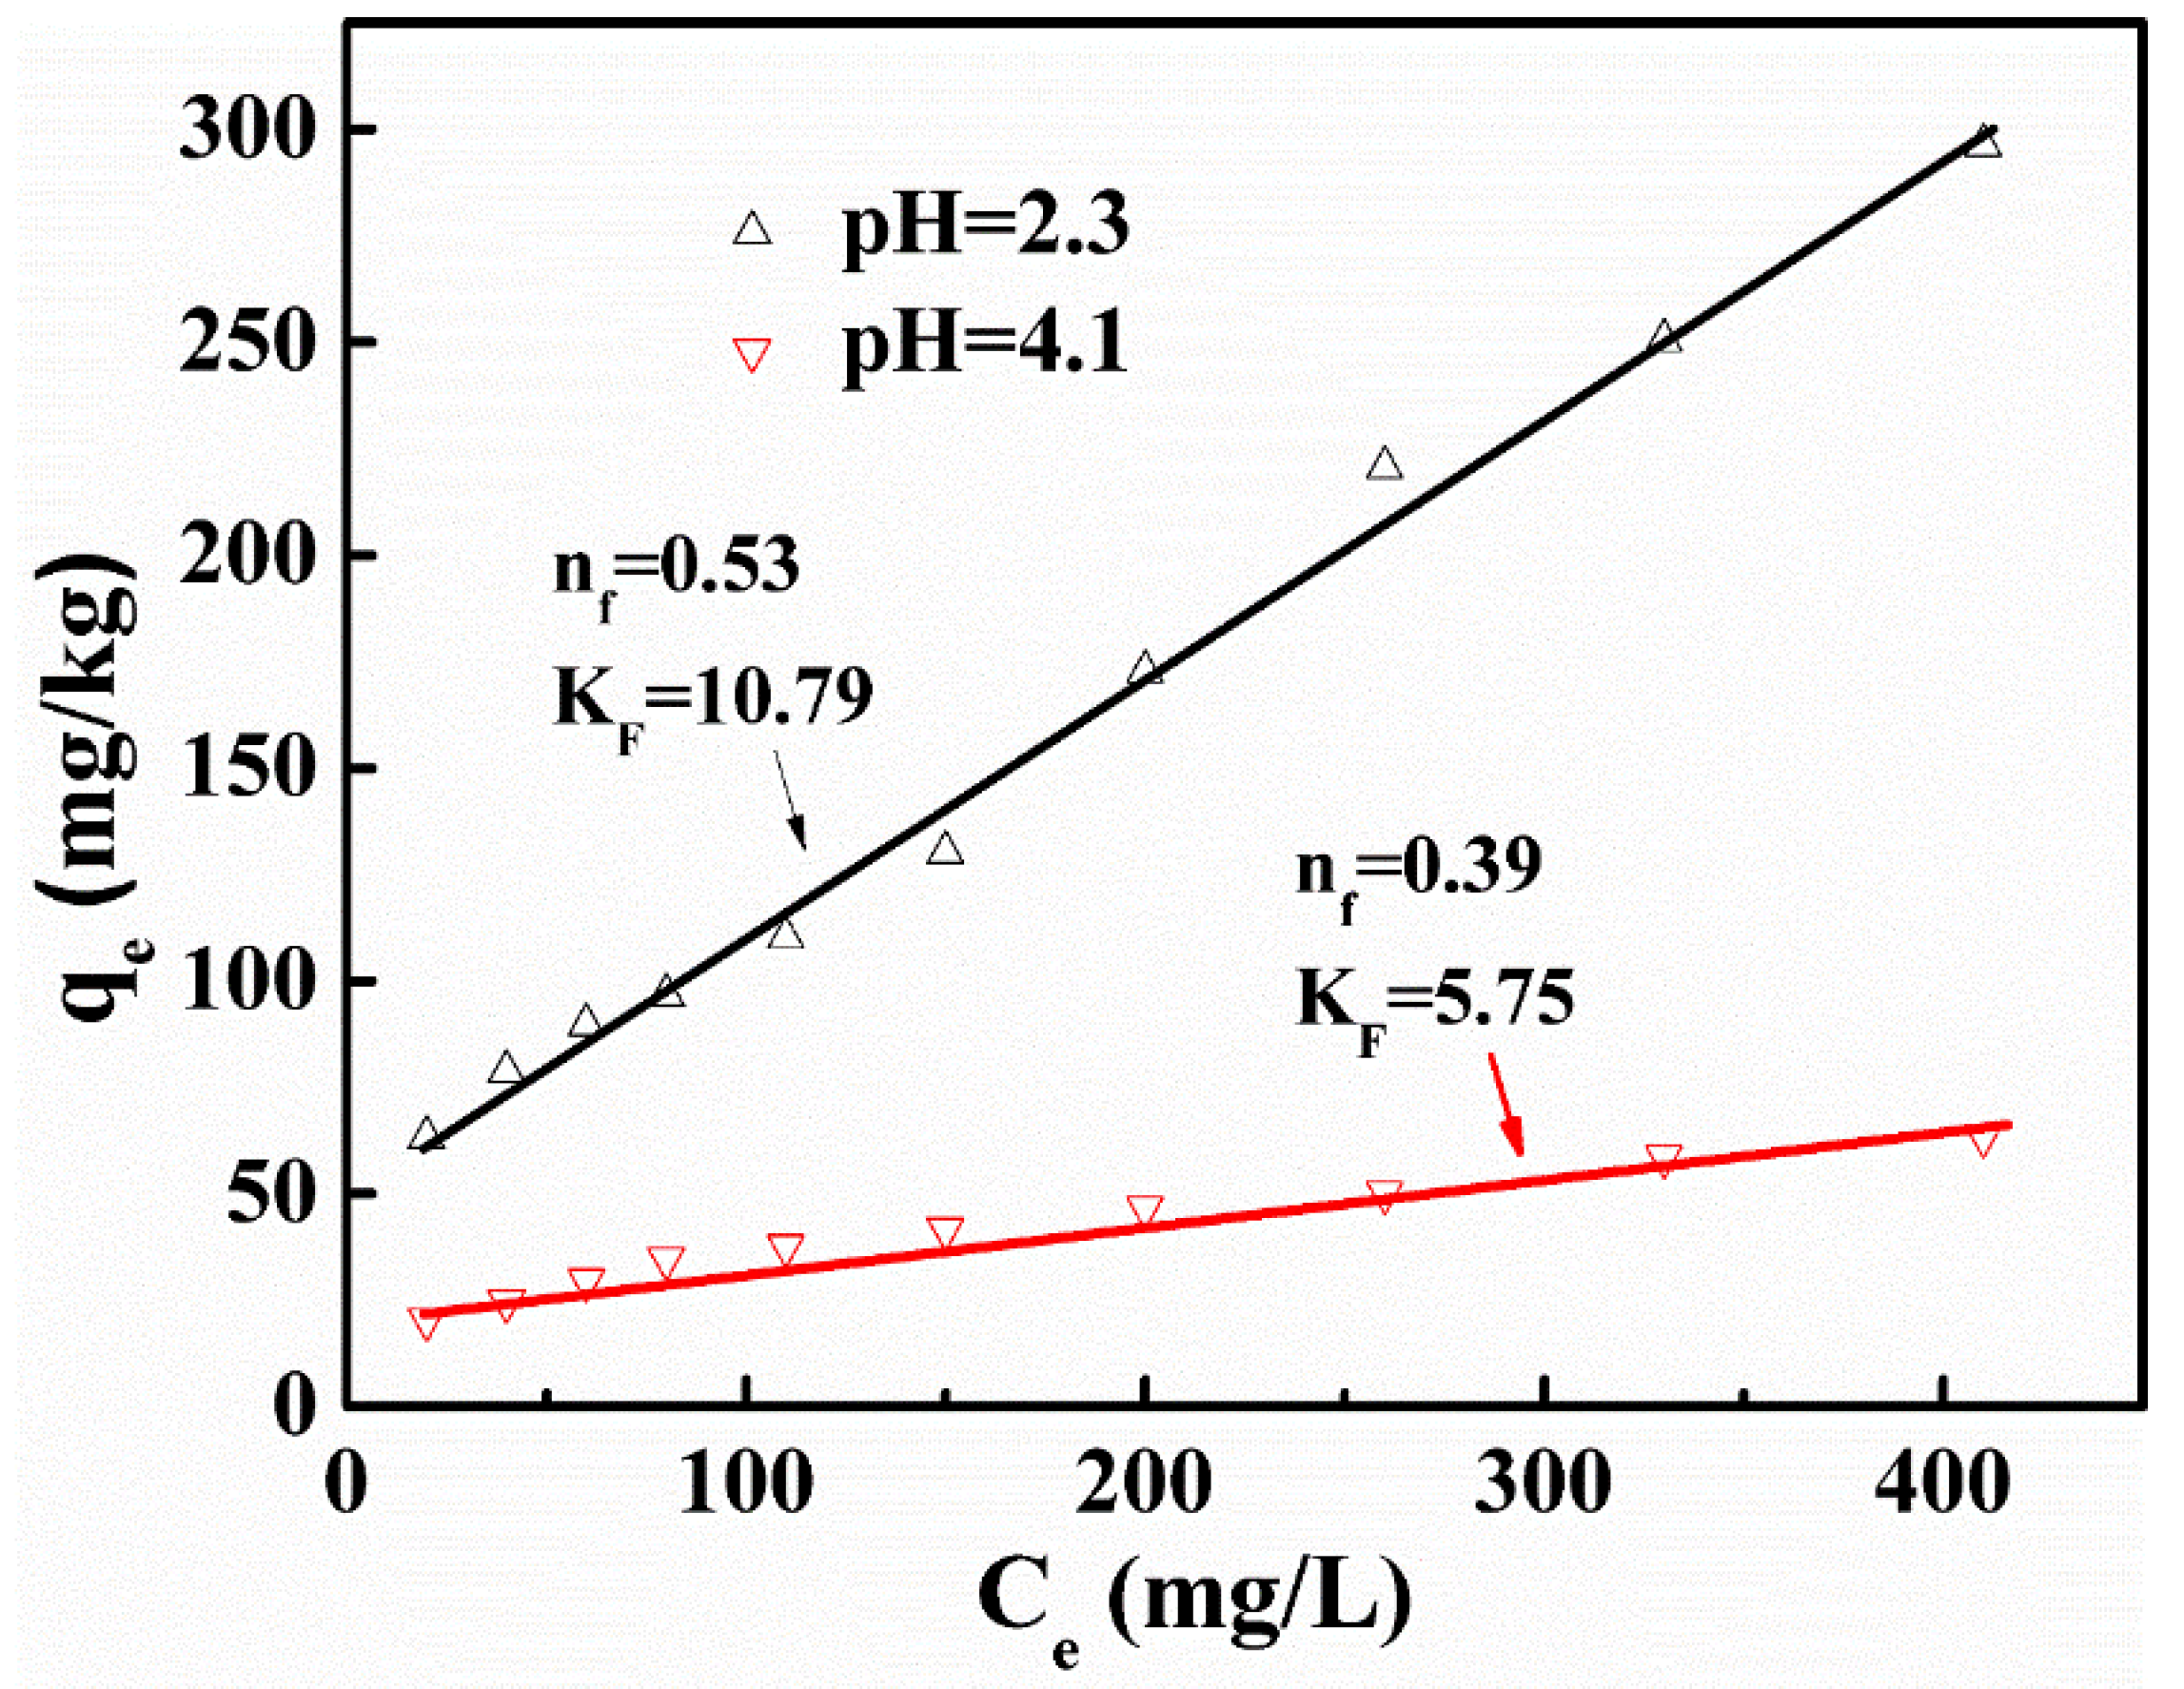
3.2. Adsorption Isotherms
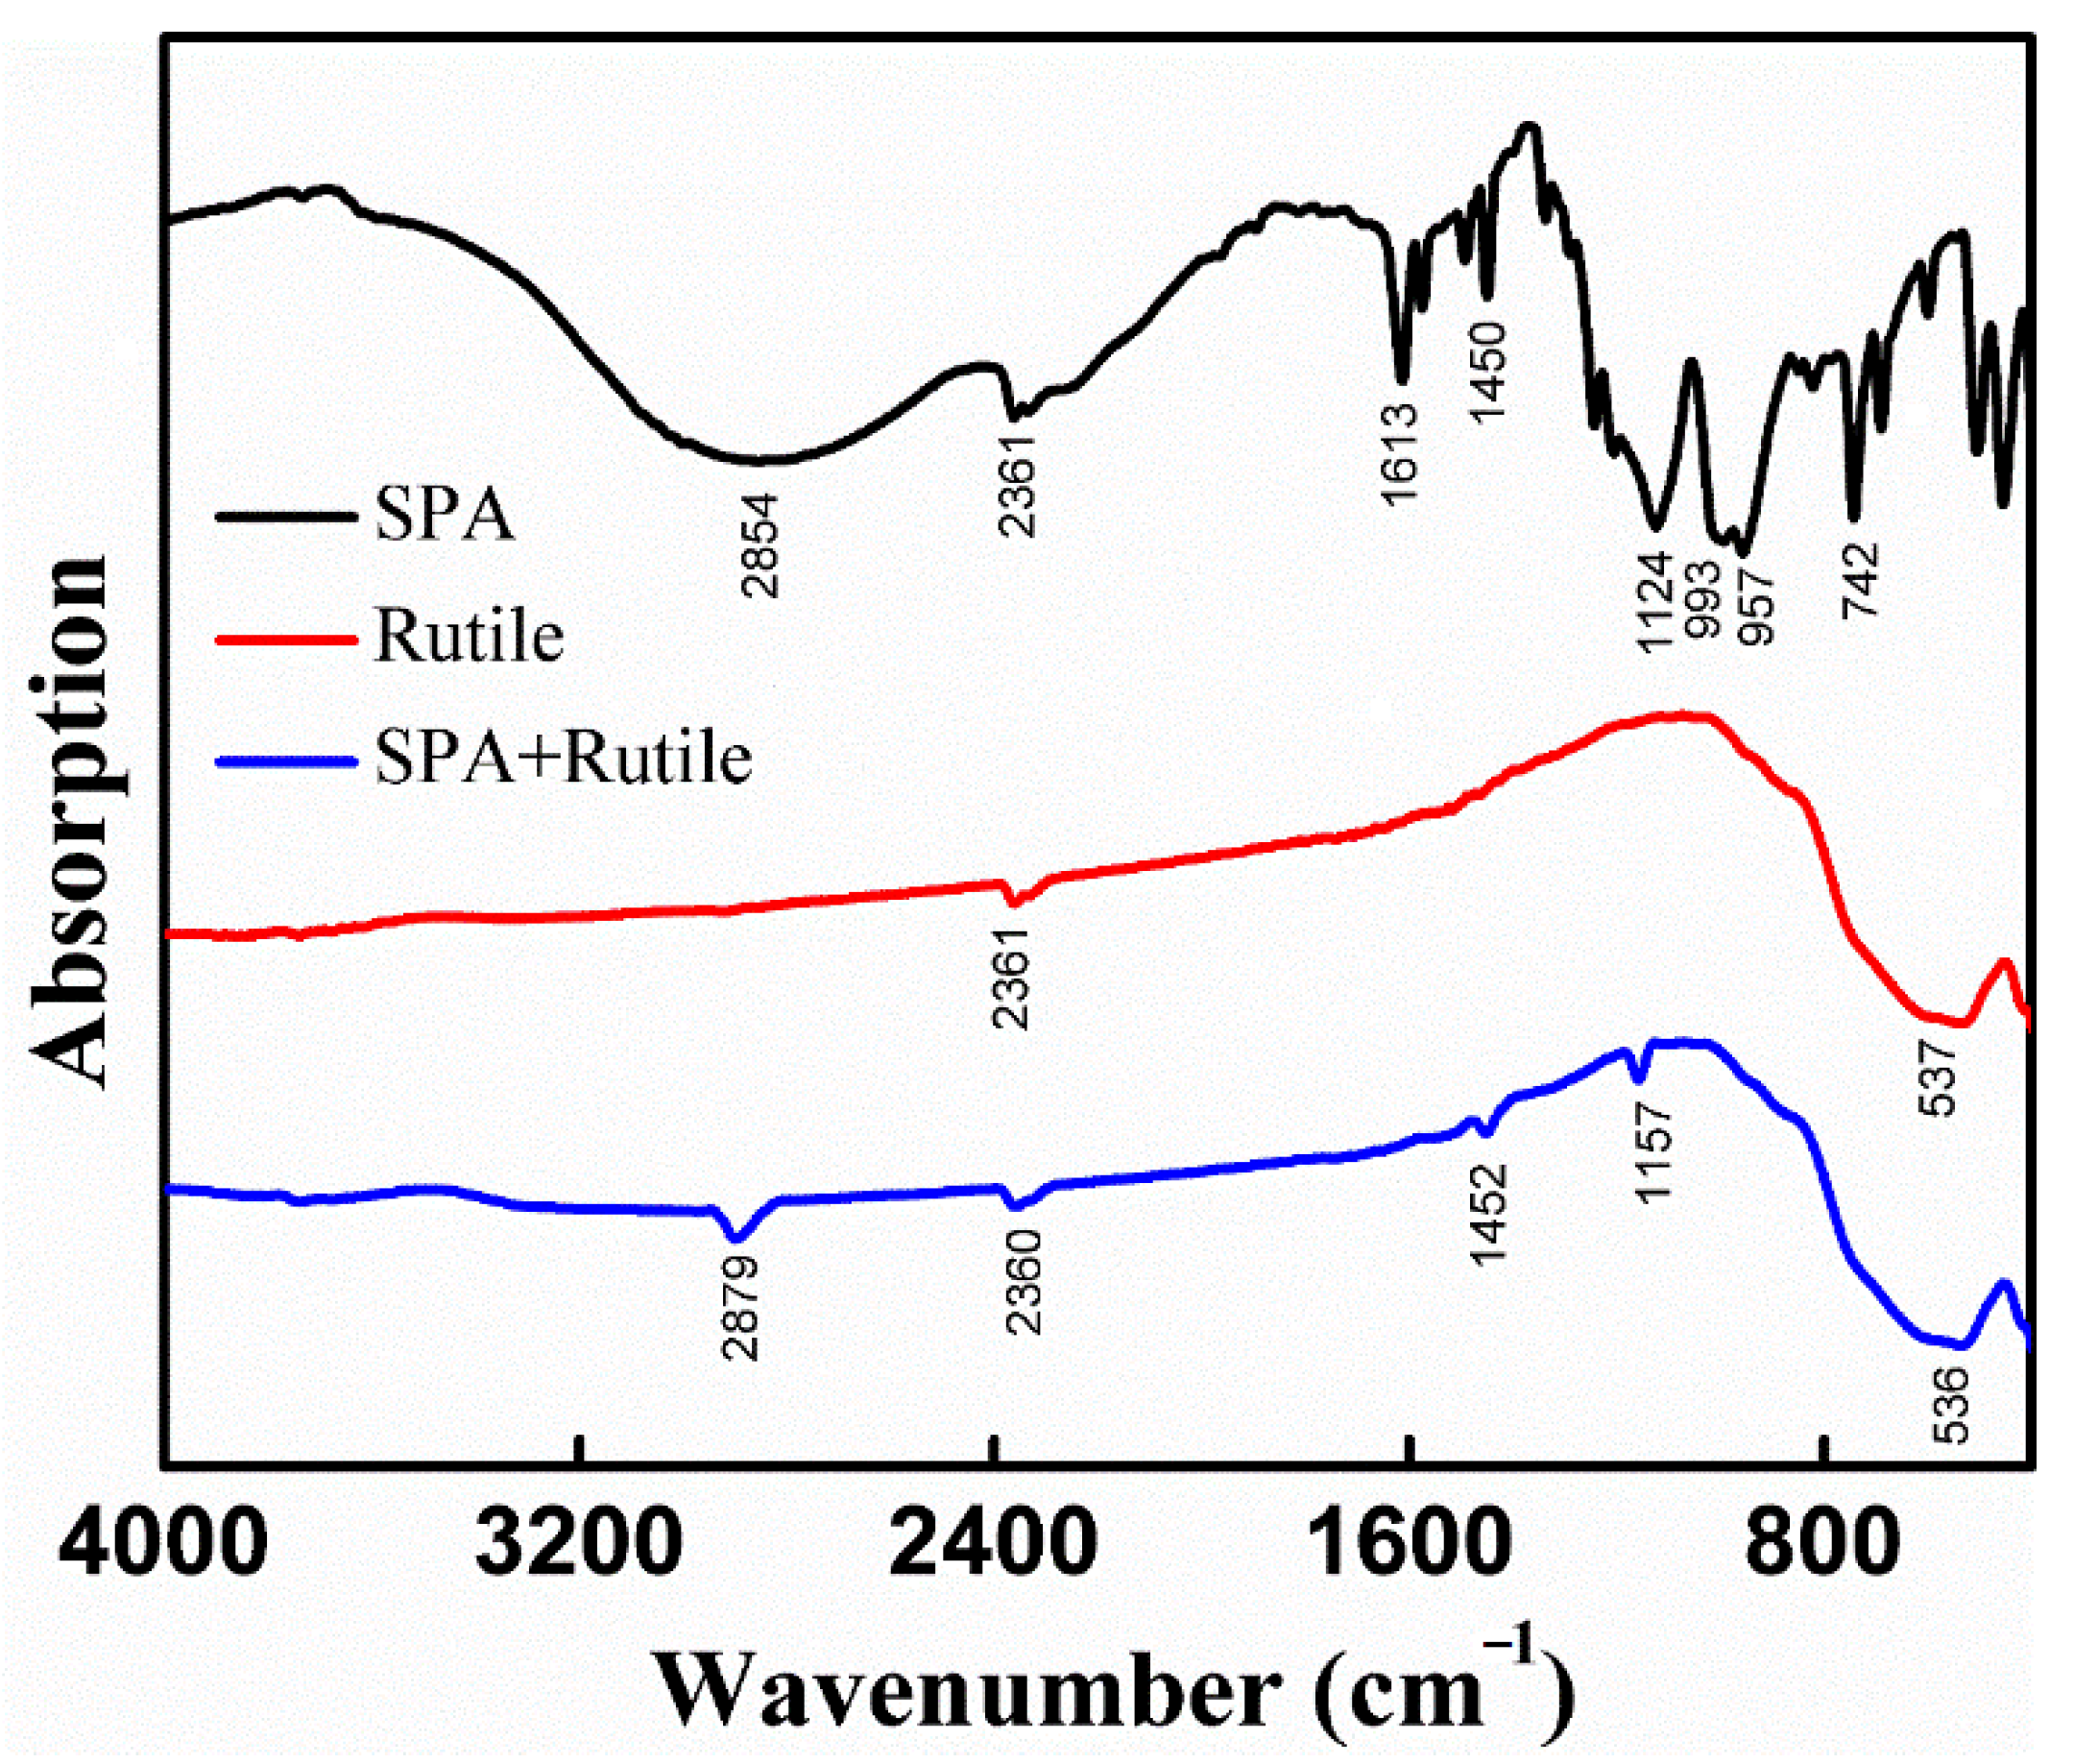
3.3. FT-IR
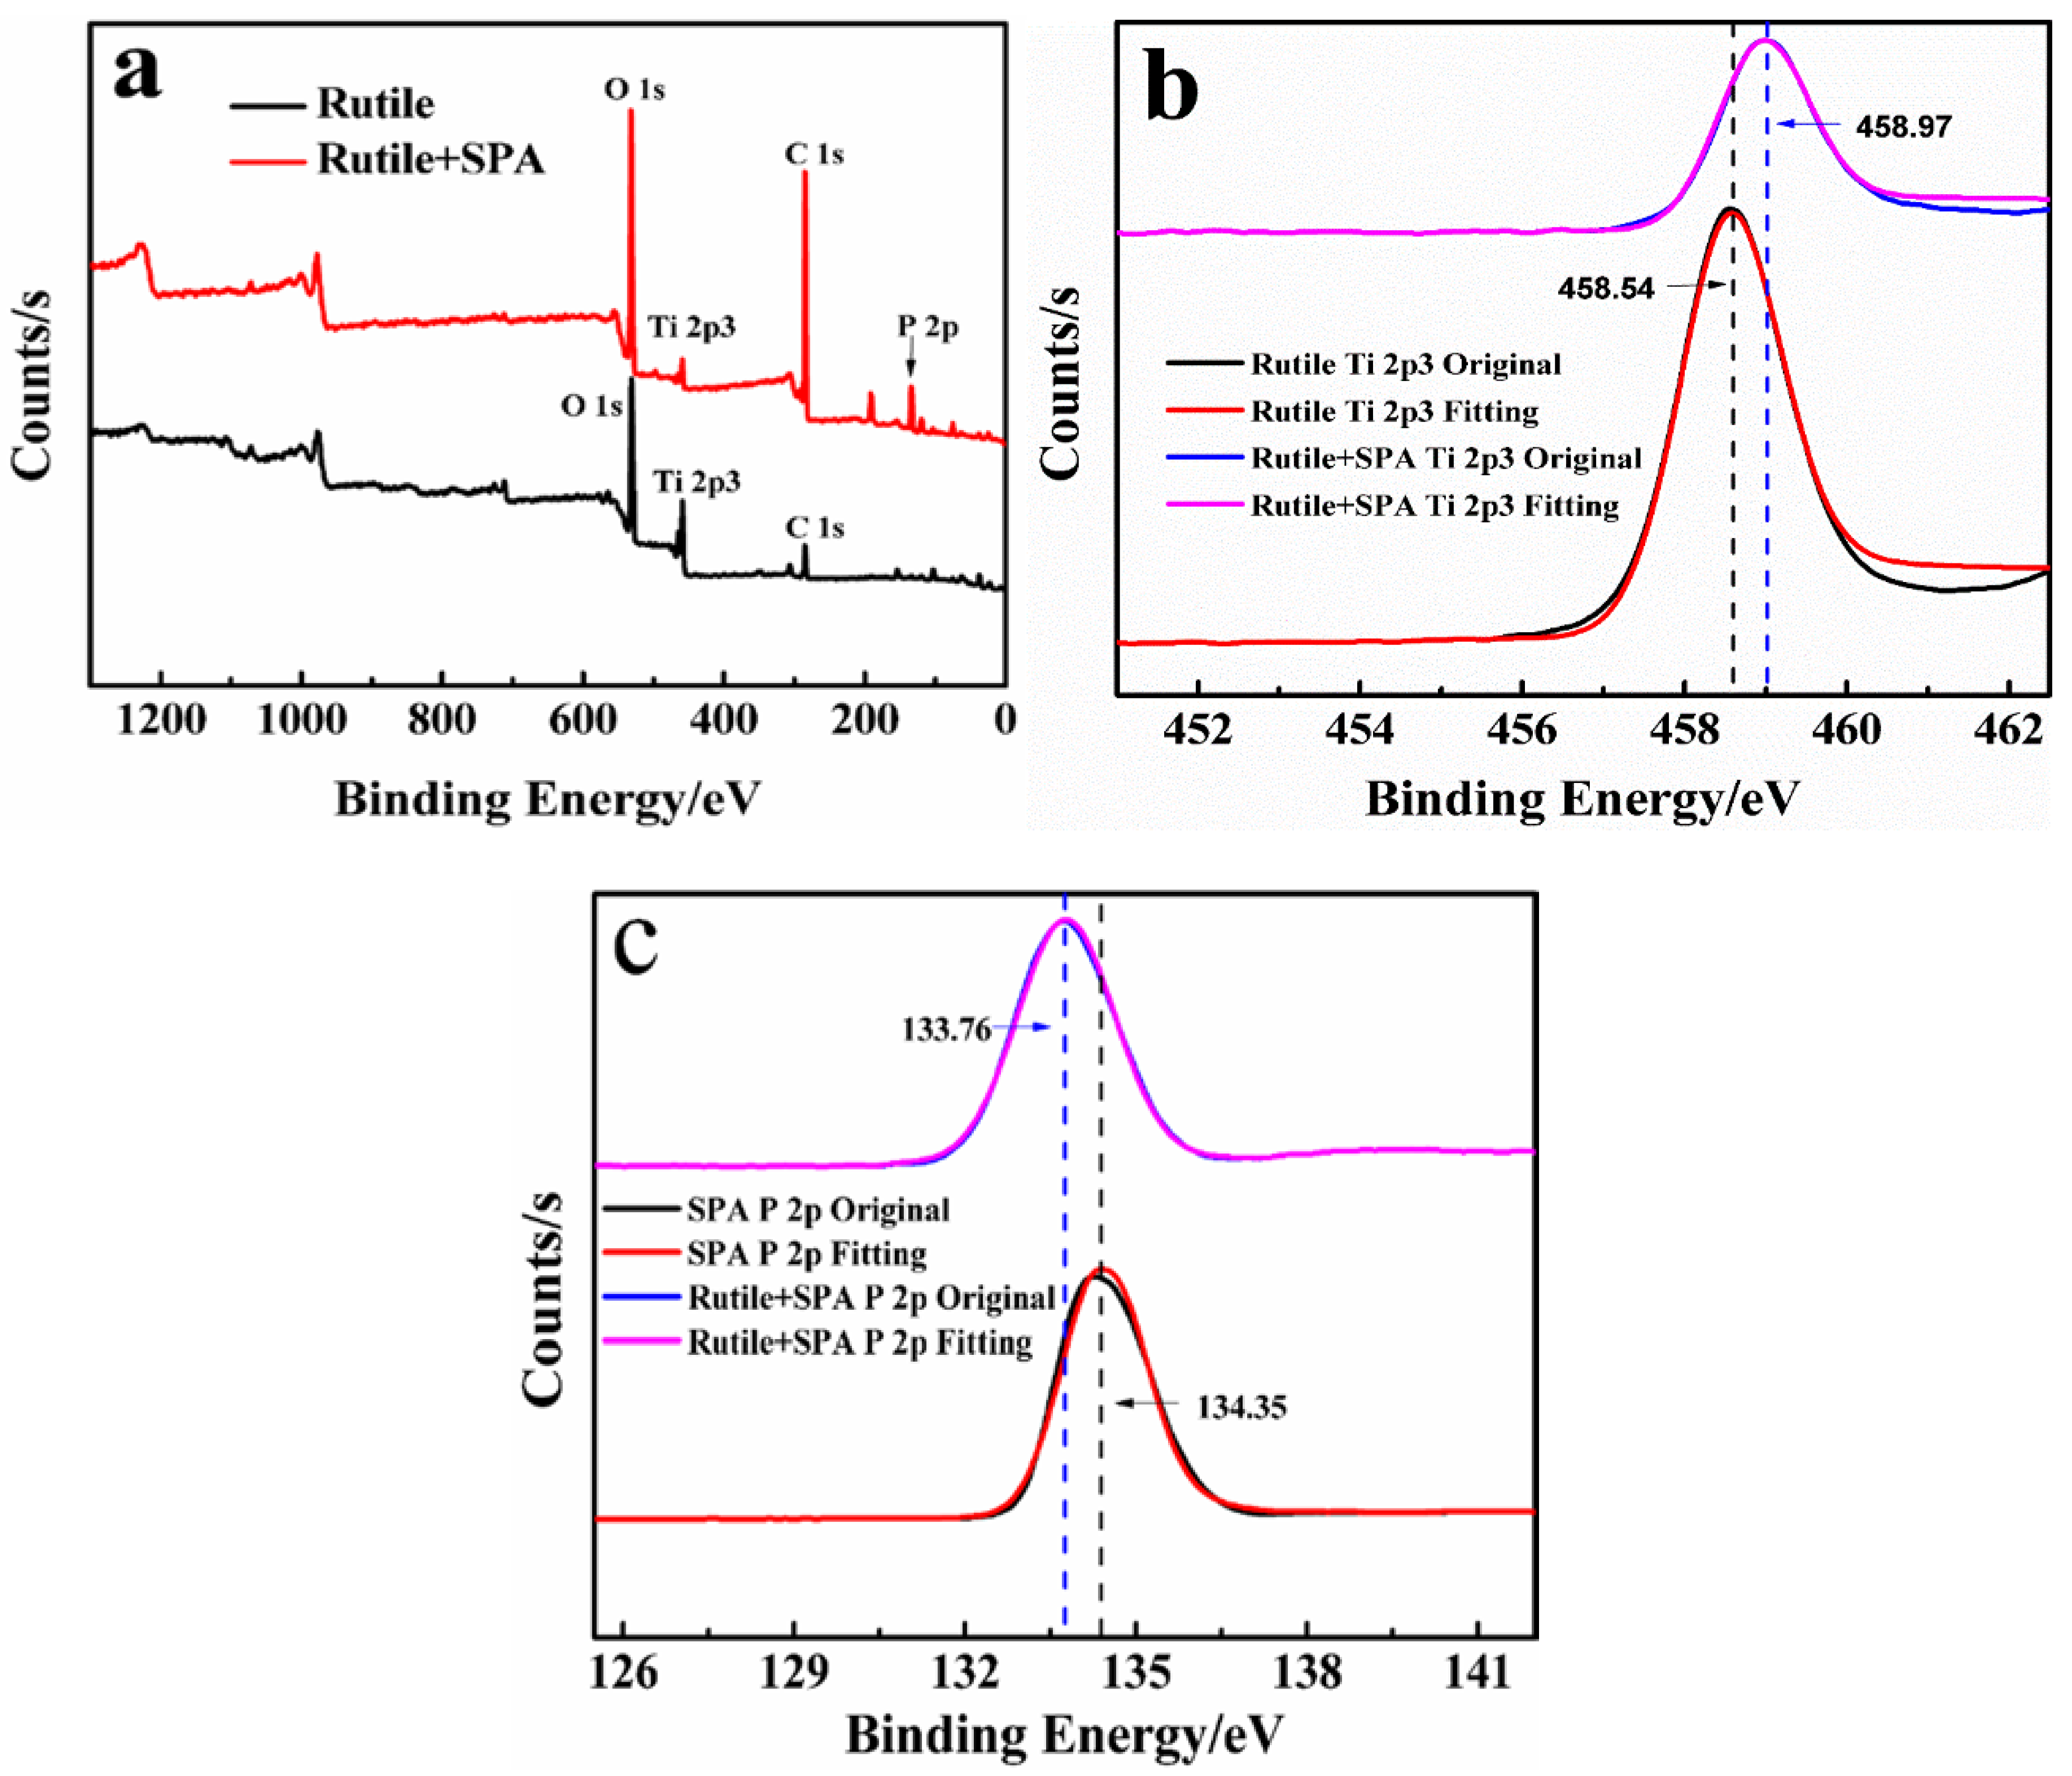
3.4. XPS Analysis
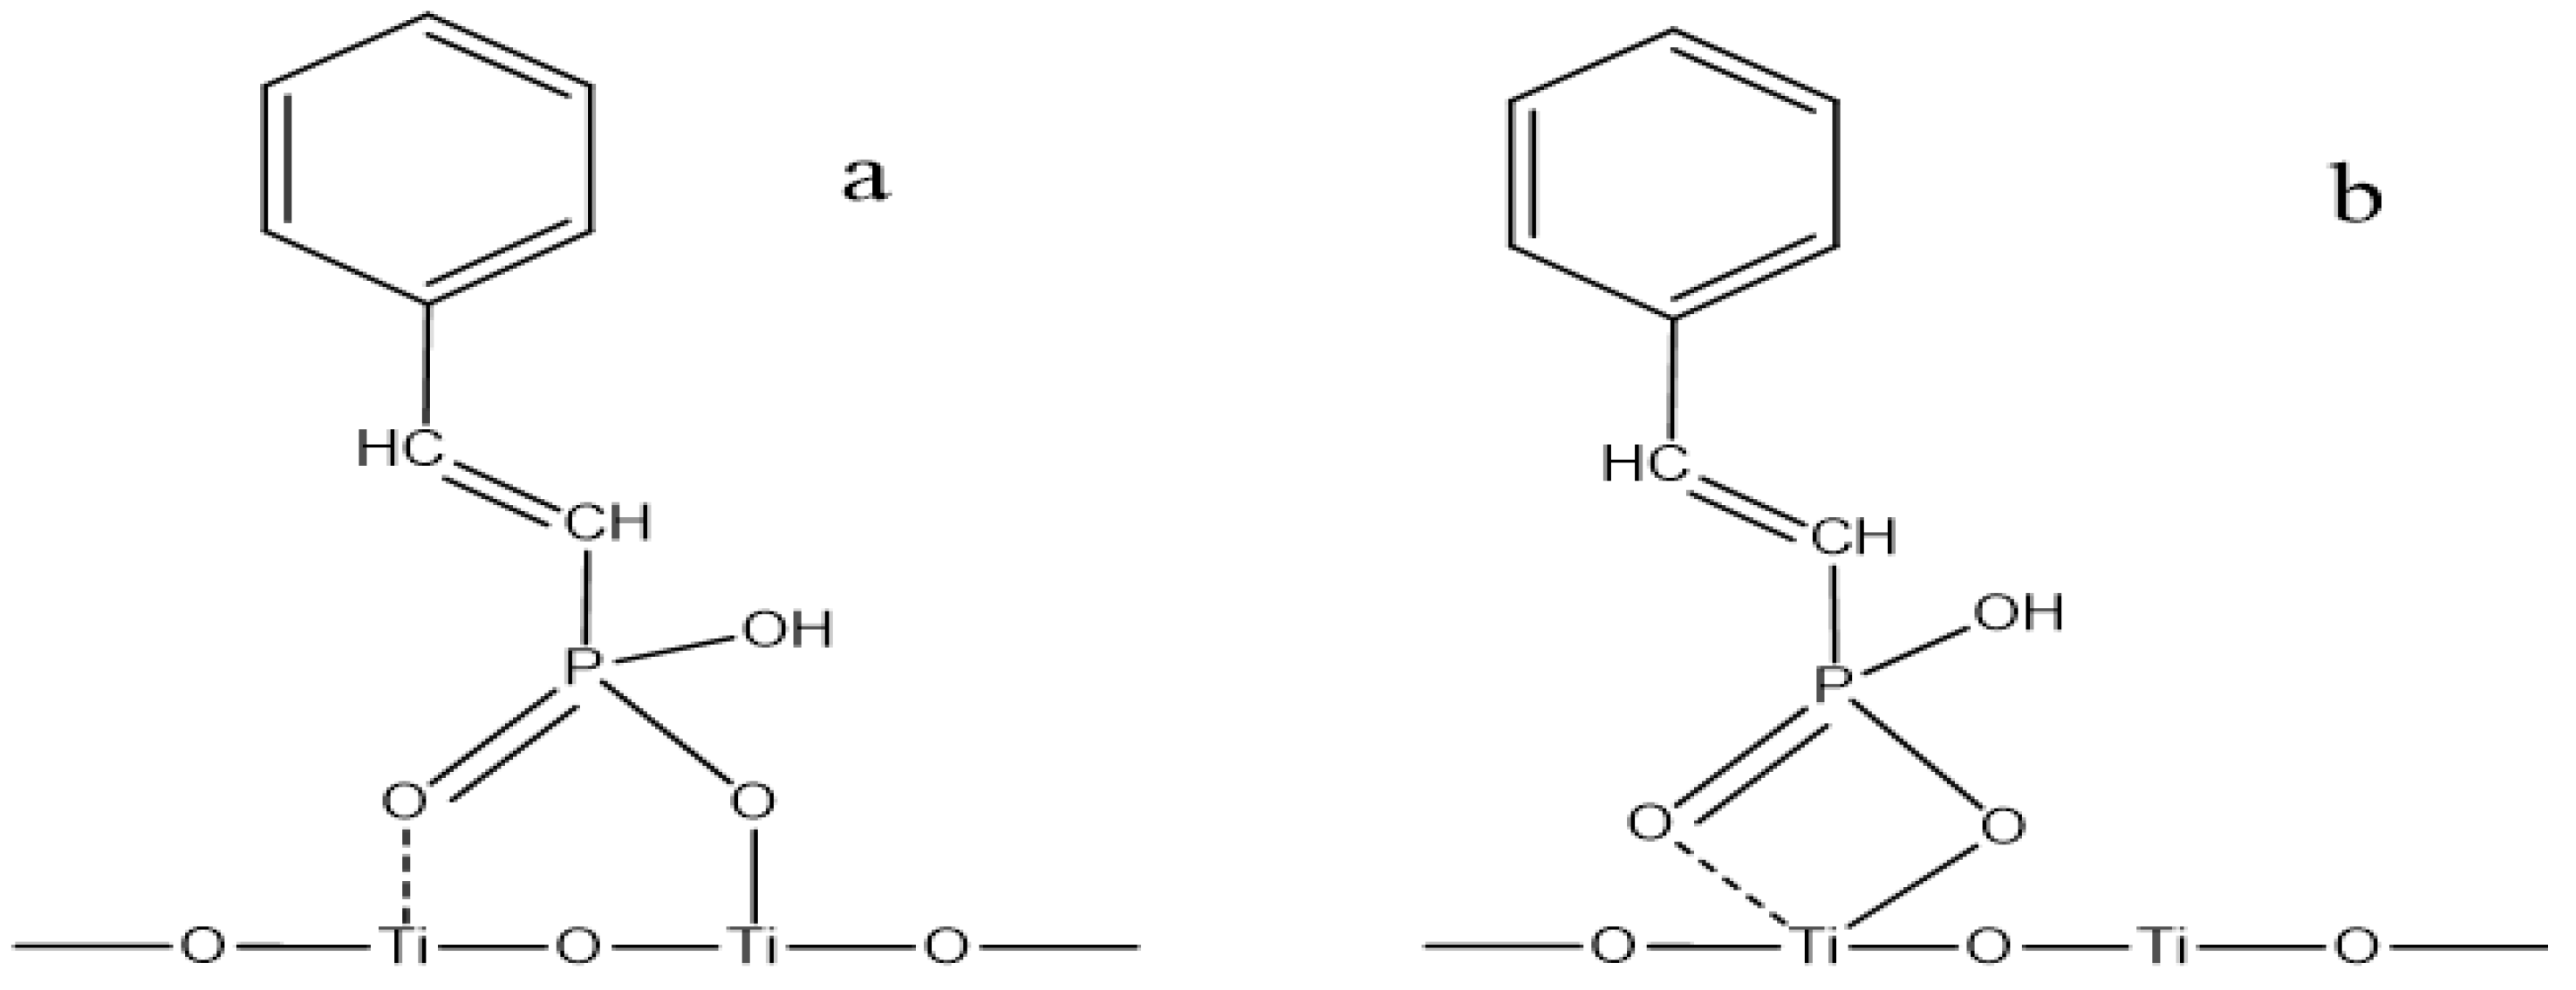
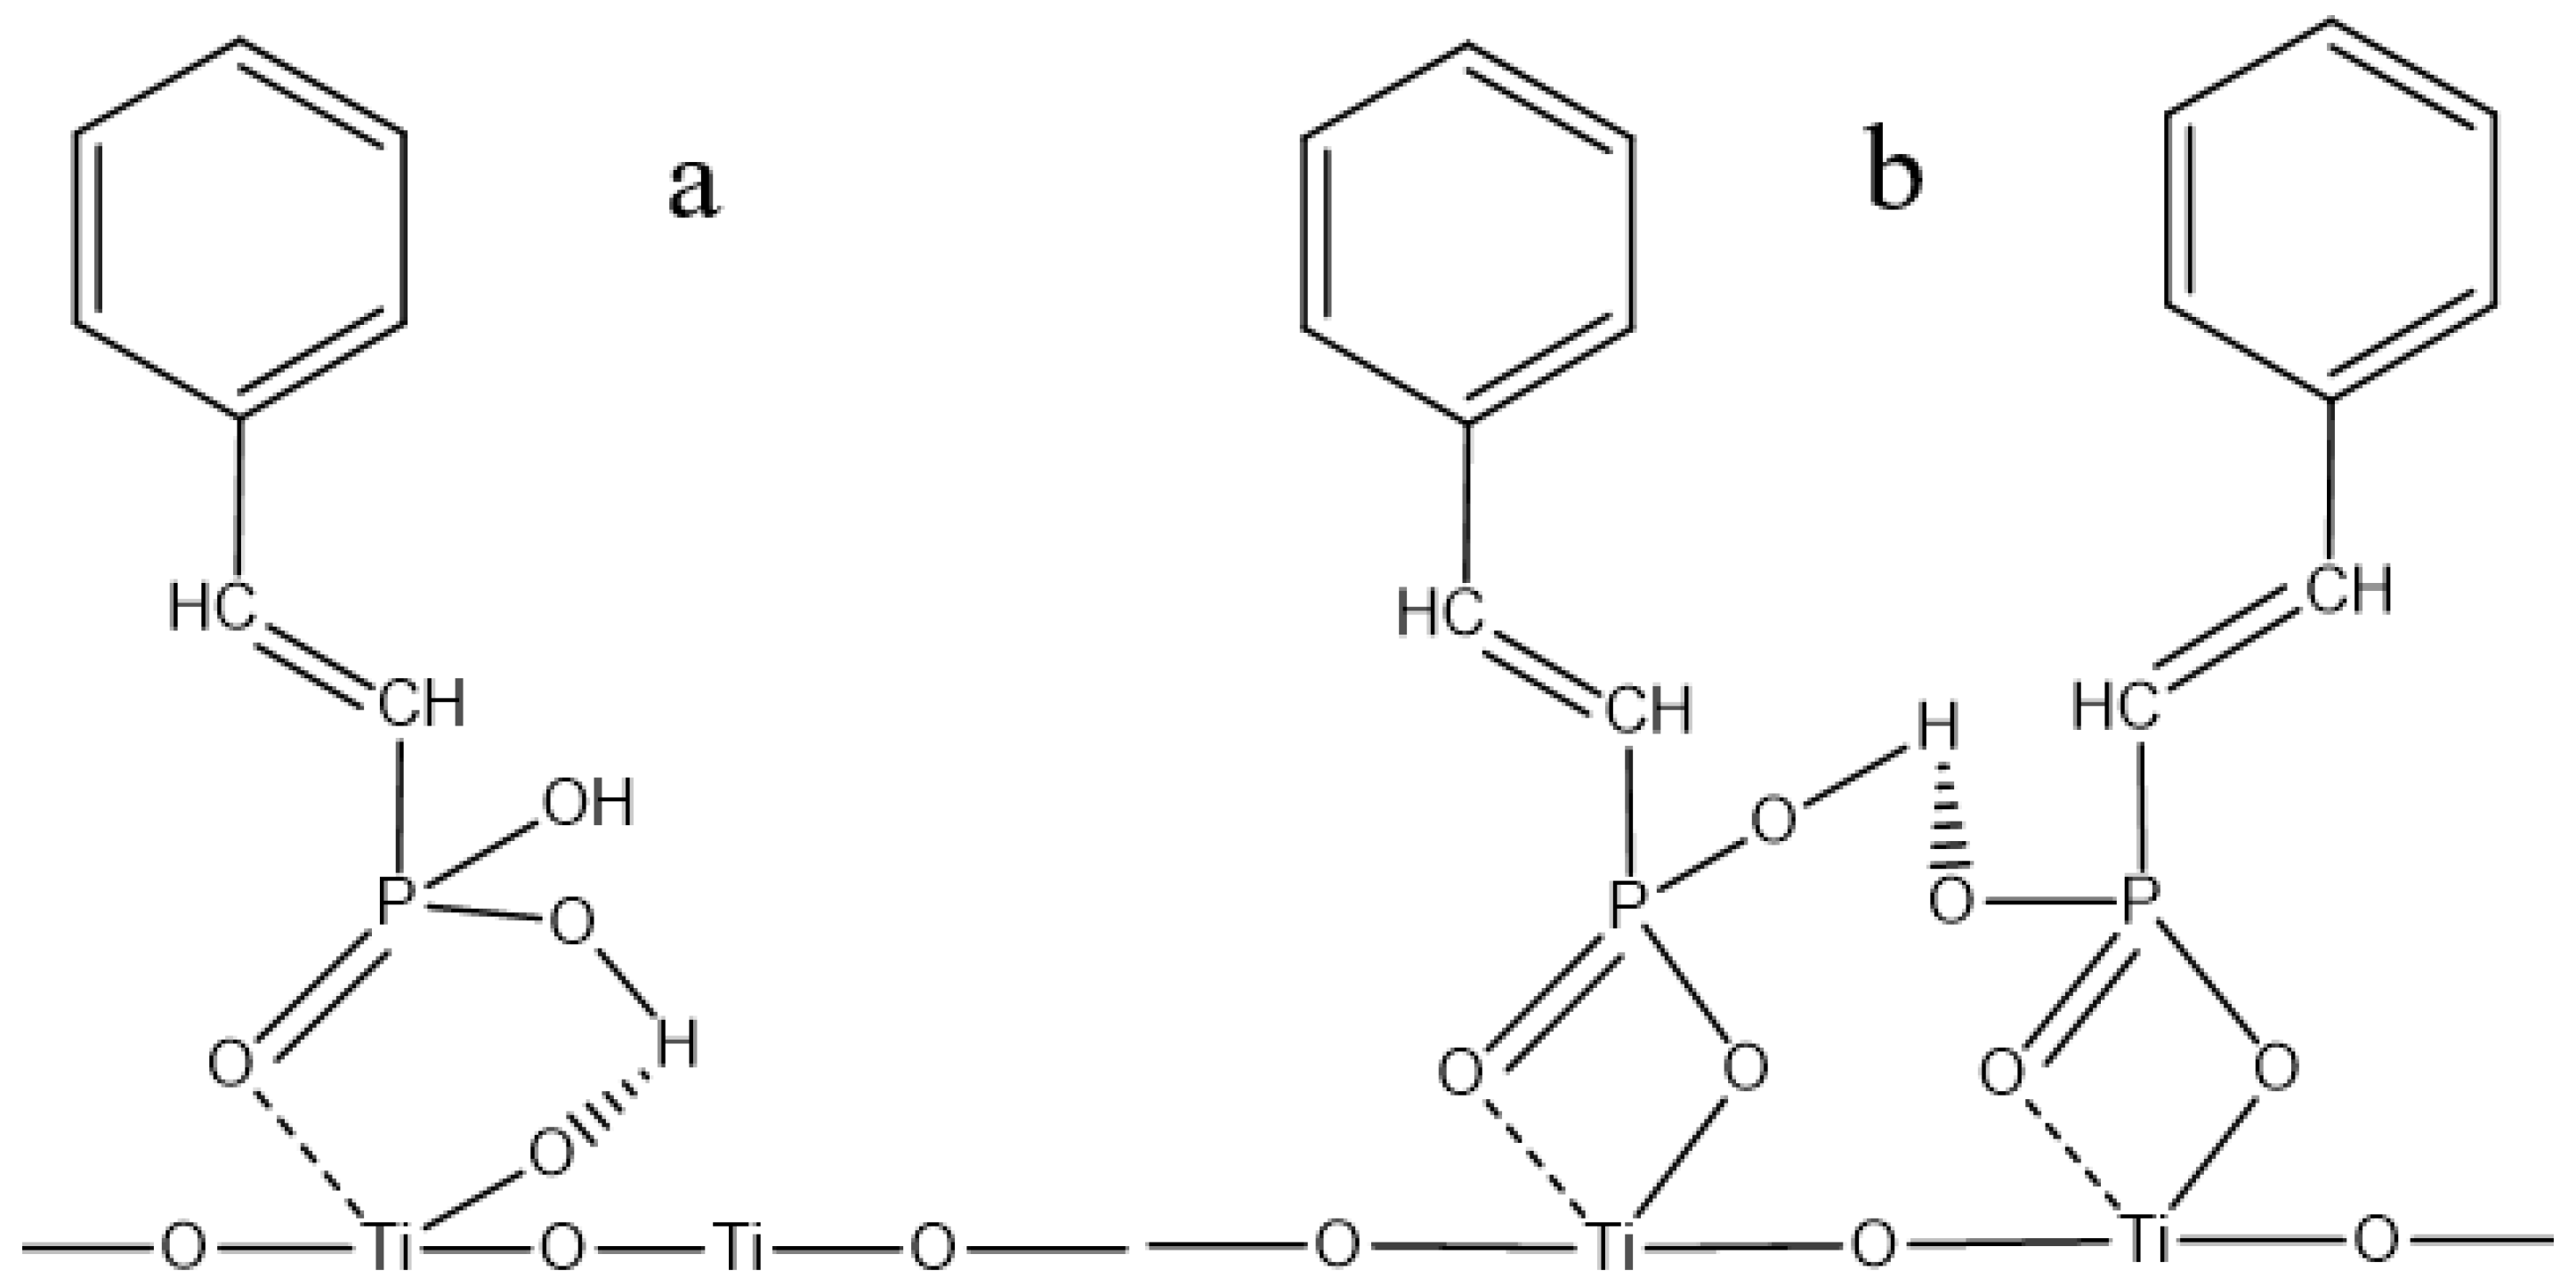
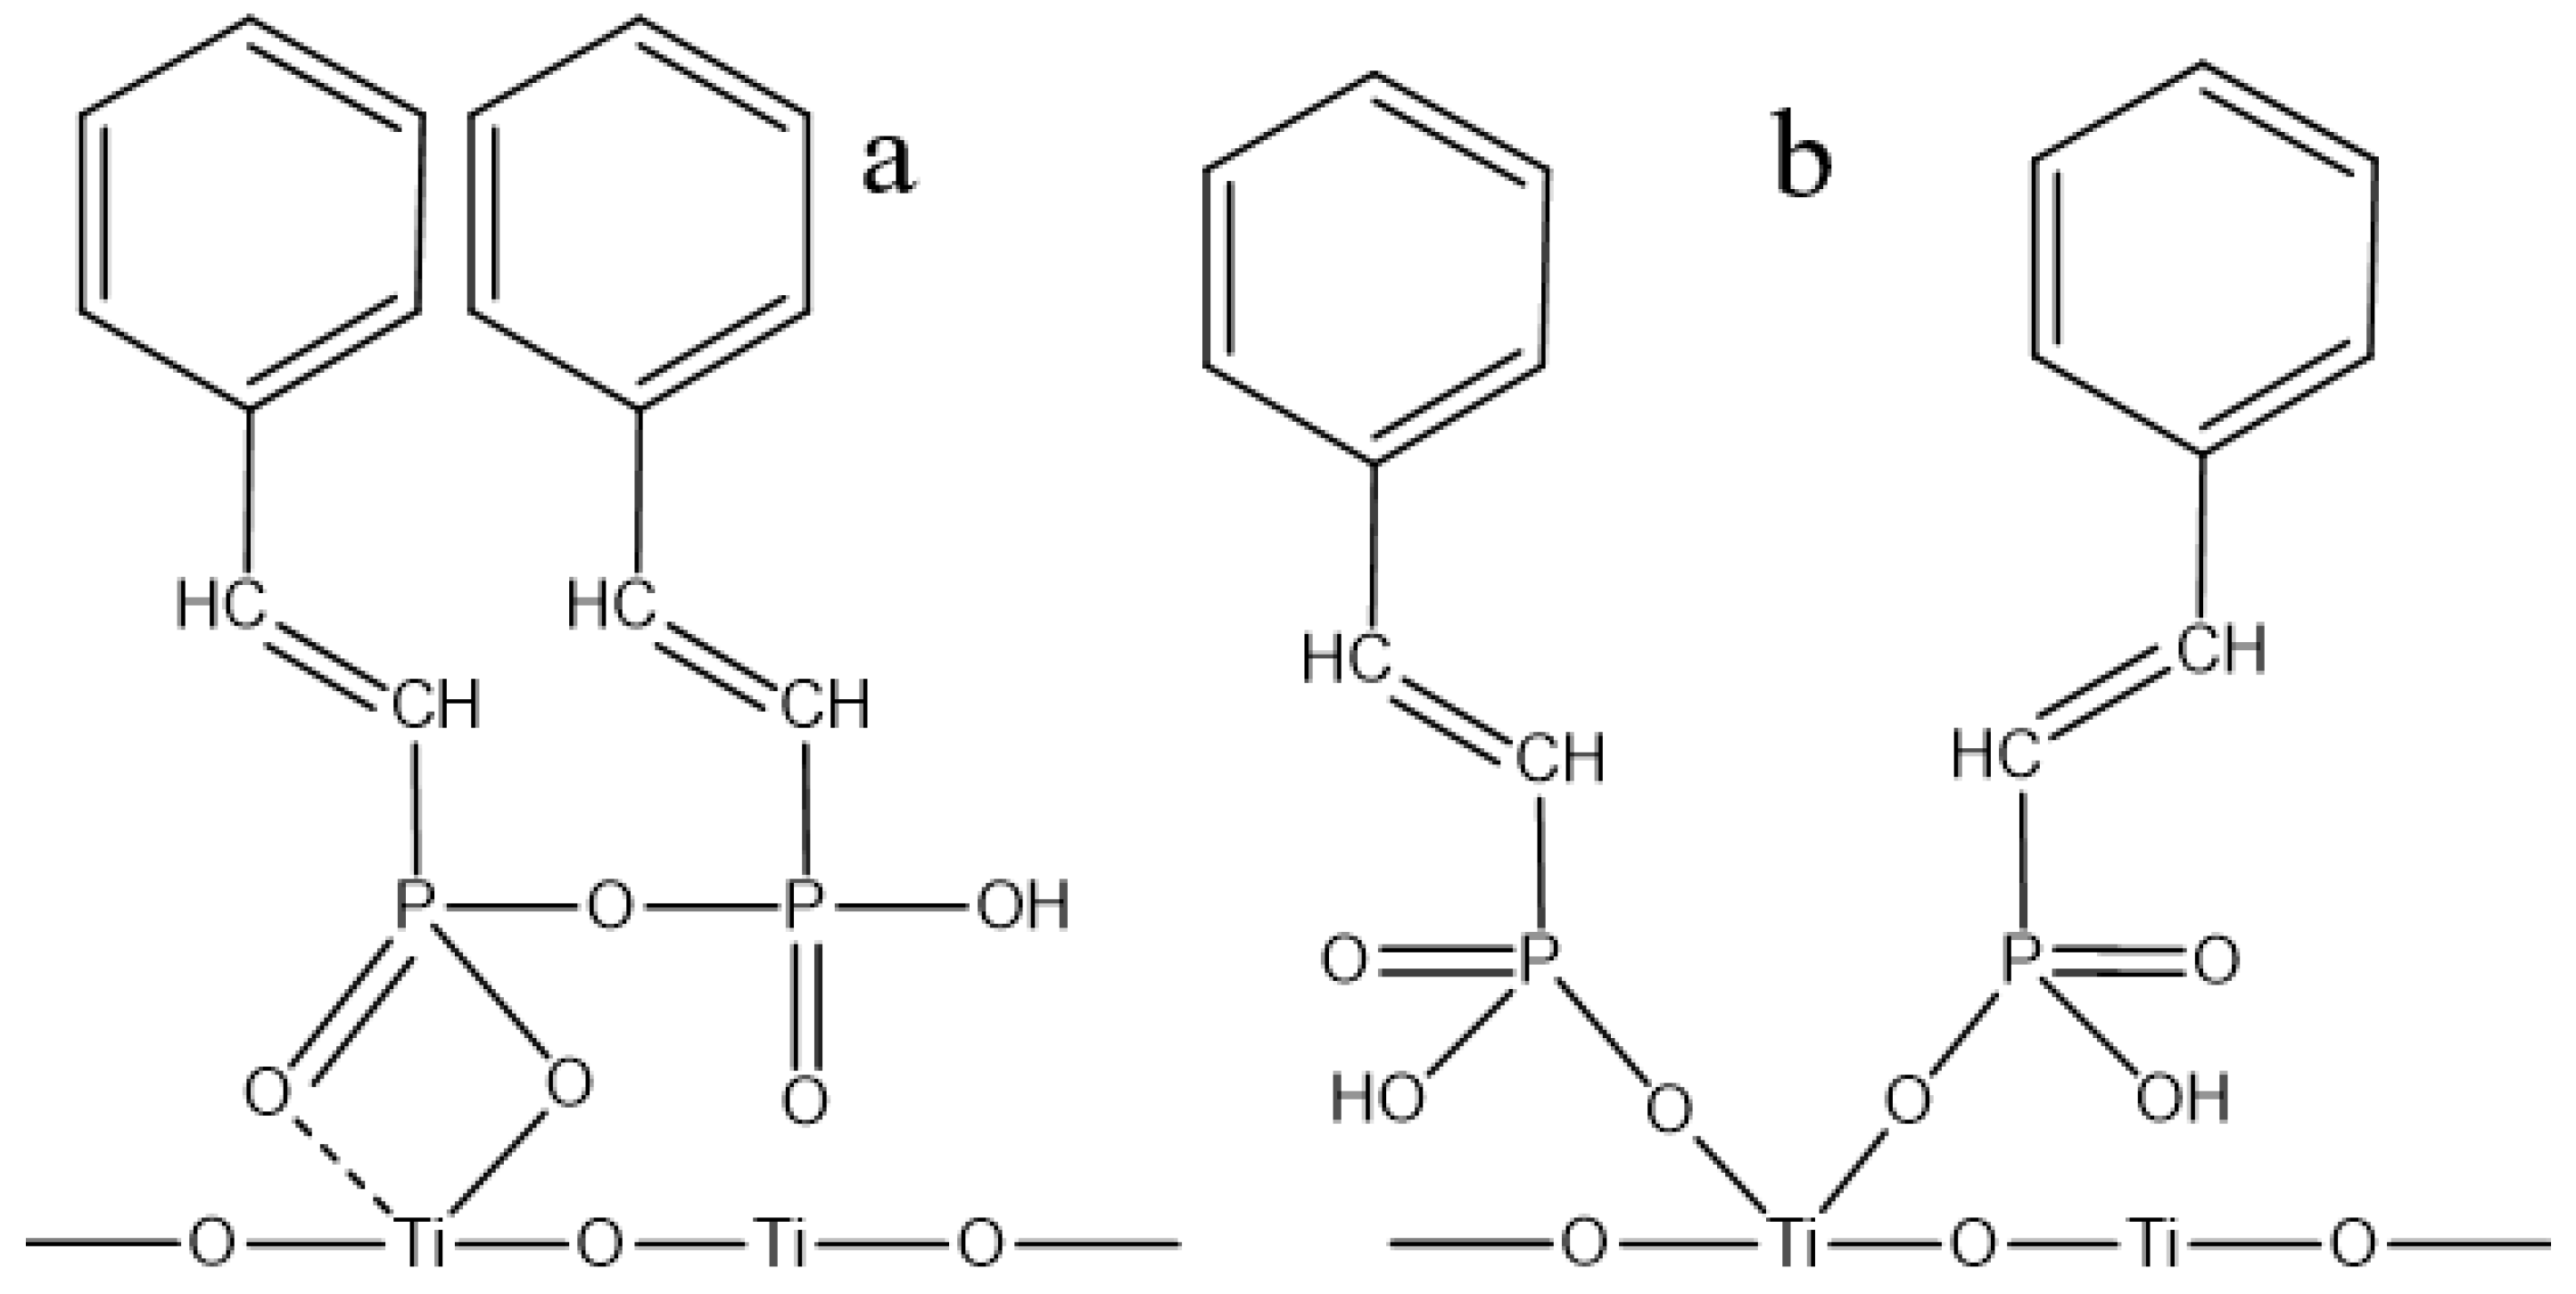
3.5. Establishment and Discussion of Adsorption Models
4. Conclusions
Author Contributions
Funding
Conflicts of Interest
References
- Monich, P.R.; Berti, F.V.; Porto, L.M.; Henriques, B.; de Oliveira, A.P.N.; Fredel, M.C.; Souza, J.C.M. Physicochemical and biological assessment of PEEK composites embedding natural amorphous silica fibers for biomedical applications. Mater. Sci. Eng. C 2017, 79, 354–362. [Google Scholar] [CrossRef] [PubMed]
- Liu, Y.T.; Zhang, S.Y.; Gao, Y.G. A high-temperature stable antenna array for the satellite navigation system. IEEE Antennas Wirel. Propag. Lett. 2017, 16, 1397–1400. [Google Scholar] [CrossRef]
- Song, J.; Liu, T.; Shi, H.; Yan, S.; Liao, Z.; Liu, Y.; Liu, W.; Peng, Z. Time-frequency analysis of the tribological behaviors of Ti6Al4V alloy under a dry sliding condition. J. Alloys Compd. 2017, 724, 752–762. [Google Scholar] [CrossRef]
- Ye, Z.; Tai, H.; Guo, R.; Yuan, Z.; Liu, C.; Su, Y.; Chen, Z.; Jiang, Y. Excellent ammonia sensing performance of gas sensor based on graphene/titanium dioxide hybrid with improved morphology. Appl. Surf. Sci. 2017, 419, 84–90. [Google Scholar]
- Kumara, N.T.R.N.; Lim, A.; Lim, C.M.; Petra, M.I.; Ekanayake, P. Recent progress and utilization of natural pigments in dye sensitized solar cells: A review. Renew. Sust. Energ. Rev. 2017, 78, 301–317. [Google Scholar] [CrossRef]
- Fontelles-Carceller, O.; Munoz-Batista, M.J.; Conesa, J.C.; Fernandez-Garcia, M.; Kubacka, A. UV and visible hydrogen photo-production using Pt promoted Nb-doped TiO2 photo-catalysts: Interpreting quantum efficiency. Appl. Catal. B Environ. 2017, 216, 133–145. [Google Scholar] [CrossRef]
- Xiao, W.; Cao, P.; Liang, Q.; Peng, H.; Zhao, H.; Qin, W.; Qiu, G.; Wang, J. The activation mechanism of Bi3+ ions to rutile flotation in a strong acidic environment. Minerals 2017, 7, 113. [Google Scholar] [CrossRef]
- Wang, J.; Cheng, H.; Zhao, H.; Qin, W.; Qiu, G. Flotation behavior and mechanism of rutile with nonyl hydroxamic acid. Rare Met. 2016, 35, 419–424. [Google Scholar] [CrossRef]
- Li, H.; Mu, S.; Weng, X.; Zhao, Y.; Song, S. Rutile flotation with Pb2+ ions as activator: Adsorption of Pb2+ at rutile/water interface. Colloid Surf. A Physicochem. Eng. Asp. 2016, 506, 431–437. [Google Scholar] [CrossRef]
- Terzi, M.; Kursun, I. Investigation of recovery possibilities of rutile minerals from the feldspar tailings with gravity separation methods. Russ. J. Non-Ferrous Metals 2015, 56, 235–245. [Google Scholar] [CrossRef]
- Chachula, F.; Liu, Q. Upgrading a rutile concentrate produced from Athabasca oil sands tailings. Fuel 2003, 82, 929–942. [Google Scholar] [CrossRef]
- Liu, Q.; Peng, Y. The development of a composite collector for the flotation of rutile. Miner. Eng. 1999, 12, 1419–1430. [Google Scholar] [CrossRef]
- Peng, Y.; Li, Y.; Xu, S. Effect of interactions between styryl phosphoric acid and aliphatic alcohol on rutile flotation. Chin. J. Nonferrous Met. 1999, 9, 358–362. (In Chinese) [Google Scholar]
- Madeley, J.D.; Graham, K. Flotation of rutile with anionic and cationic collectors. J. Appl. Chem. 1966, 16, 169–170. [Google Scholar] [CrossRef]
- Xiao, W.; Cao, P.; Liang, Q.; Huang, X.; Li, K.; Zhang, Y.; Qin, W.; Qiu, G.; Wang, J. Adsorption behavior and mechanism of Bi(III) ions on rutile–water interface in the presence of nonyl hydroxamic acid. Trans. Nonferrous Met. Soc. China 2018, 28, 348–355. [Google Scholar] [CrossRef]
- Xiao, W.; Fang, C.; Wang, J.; Liang, Q.; Cao, P.; Wang, X.; Zhang, L.; Qiu, G.; Hu, J. The role of EDTA on rutile flotation using Al3+ ions as an activator. RSC Adv. 2018, 8, 4872–4880. [Google Scholar] [CrossRef]
- Xiao, W.; Ke, S.; Quan, N.; Zhou, L.; Wang, J.; Zhang, L.; Dong, Y.; Qin, W.; Qiu, G.; Hu, J. The role of nanobubbles in the precipitation and recovery of organic-phosphine-containing beneficiation wastewater. Langmuir 2018, 34, 6217–6224. [Google Scholar] [CrossRef] [PubMed]
- Xiao, W.; Zhao, H.; Qin, W.; Qiu, G.; Wang, J. Adsorption mechanism of Pb2+ activator for the flotation of rutile. Minerals 2018, 8, 266. [Google Scholar] [CrossRef]
- Kang, J.; Hu, Y.; Sun, W.; Liu, R.; Yin, Z.; Tang, H.; Meng, X.; Zhang, Q.; Liu, H. A significant improvement of scheelite flotation efficiency with etidronic acid. J. Clean Prod. 2018, 180, 858–865. [Google Scholar] [CrossRef]
- Jin, S.; Shi, Q.; Li, Q.; Ou, L.; Ouyang, K. Effect of calcium ionic concentrations on the adsorption of carboxymethyl cellulose onto talc surface: Flotation, adsorption and AFM imaging study. Powder Technol. 2018, 331, 155–161. [Google Scholar] [CrossRef]
- Yin, Z.; Hu, Y.; Sun, W.; Zhang, C.; He, J.; Xu, Z.; Zou, J.; Guan, C.; Zhang, C.; Guan, Q.; et al. Adsorption mechanism of 4-amino-5-mercapto-1,2,4-triazole as flotation reagent on chalcopyrite. Langmuir 2018, 34, 4071–4083. [Google Scholar] [CrossRef] [PubMed]
- Jiang, H.; Sun, Z.; Xu, L.; Hu, Y.; Huang, K.; Zhu, S. A comparison study of the flotation and adsorption behaviors of diaspore and kaolinite with quaternary ammonium collectors. Miner. Eng. 2014, 65, 124–129. [Google Scholar] [CrossRef]
- Yang, F.; Sun, W.; Hu, Y.; Long, S. Cationic flotation of scheelite from calcite using quaternary ammonium salts as collector: Adsorption behavior and mechanism. Miner. Eng. 2015, 81, 18–28. [Google Scholar] [CrossRef]
- Gao, Z.; Bai, D.; Sun, W.; Cao, X.; Hu, Y. Selective flotation of scheelite from calcite and fluorite using a collector mixture. Miner. Eng. 2015, 72, 23–26. [Google Scholar] [CrossRef]
- Deng, L.; Wang, S.; Zhong, H.; Liu, G. N–(6-(hydroxyamino)-6-oxohexyl) decanamide collector: Flotation performance and adsorption mechanism to diaspore. Appl. Surf. Sci. 2015, 347, 79–87. [Google Scholar] [CrossRef]
- Wu, Z.; Wang, X.; Liu, H.; Zhang, H.; Miller, J.D. Some physicochemical aspects of water-soluble mineral flotation. Adv. Colloid Interface Sci. 2016, 235, 190–200. [Google Scholar] [CrossRef] [PubMed]
- Zhang, R.; Somasundaran, P. Advances in adsorption of surfactants and their mixtures at solid/solution interfaces. Adv. Colloid Interface Sci. 2006, 123–126, 213–229. [Google Scholar] [CrossRef] [PubMed]
- Gao, Z.; Li, C.; Sun, W.; Hu, Y. Anisotropic surface properties of calcite: A consideration of surface broken bonds. Colloid Surf. A Physicochem. Eng. Asp. 2017, 520, 53–61. [Google Scholar] [CrossRef]
- Li, C.; Gao, Z. Effect of grinding media on the surface property and flotation behavior of scheelite particles. Powder Technol. 2017, 322, 386–392. [Google Scholar] [CrossRef]
- Fuerstenau, D.W.; Jang, H.M. On the nature of alkylsulfonate adsorption at the rutile/water interface. Langmuir 1991, 7, 3138–3143. [Google Scholar] [CrossRef]
- Yu, Y.Y.; Gong, X.Q. Unique adsorption behaviors of carboxylic acids at rutile TiO2 (110). Surf. Sci. 2015, 641, 82–90. [Google Scholar] [CrossRef]
- Han, J.; Jiao, F.; Liu, W.; Qin, W.; Xu, T.; Xue, K.; Zhang, T. Innovative methodology for comprehensive utilization of spent MgO–Cr2O3 bricks: Copper flotation. ACS Sustain. Chem. Eng. 2016, 4, 5503–5510. [Google Scholar] [CrossRef]
- Park, S.J.; Yoon, T.I. Effects of iron species and inert minerals on coagulation and direct filtration for humic acid removal. Desalination 2009, 239, 146–158. [Google Scholar] [CrossRef]
- Zhang, L.; Luo, L.; Zhang, S. Adsorption of phenanthrene and 1,3-dinitrobenzene on cation-modified clay minerals. Colloid Surf. A Physicochem. Eng. Asp. 2011, 377, 278–283. [Google Scholar] [CrossRef]
- Guégan, R.; Giovanela, M.; Warmont, F.; Motelica-Heino, M. Nonionic organoclay: A “Swiss Army knife” for the adsorption of organic micro-pollutants? Adv. Colloid Interface Sci. 2015, 437, 71–79. [Google Scholar] [CrossRef] [PubMed]
- Gao, Y.; Gao, Z.; Sun, W.; Yin, Z.; Wang, J.; Hu, Y. Adsorption of a novel reagent scheme on scheelite and calcite causing an effective flotation separation. J. Colloid Interface Sci. 2017, 512, 39–46. [Google Scholar] [CrossRef] [PubMed]
- Jiang, W.; Gao, Z.; Khoso, S.A.; Gao, J.; Sun, W.; Pu, W.; Hu, Y. Selective adsorption of benzhydroxamic acid on fluorite rendering selective separation of fluorite/calcite. Appl. Surf. Sci. 2018, 435, 752–758. [Google Scholar] [CrossRef]
- Huang, X.; Xiao, W.; Zhao, H.; Cao, P.; Hu, Q.; Qin, W.; Zhang, Y.; Qiu, G.; Wang, J. Hydrophobic flocculation flotation of rutile fines in presence of styryl phosphonic acid. Trans. Nonferrous Met. Soc. China 2018, 28, 1424–1432. [Google Scholar] [CrossRef]
- Xu, L.; Tian, J.; Wu, H.; Lu, Z.; Yang, Y.; Sun, W.; Hu, Y. Effect of Pb2+ ions on ilmenite flotation and adsorption of benzohydroxamic acid as a collector. Appl. Surf. Sci. 2017, 425, 796–802. [Google Scholar] [CrossRef]
- Singh, B.K.; Mercier-Bion, F.; Lefevre, G.; Simoni, E. Effect of short chain aliphatic carboxylic acids for sorption of uranyl on rutile Zeta potential and in situ ATR-FTIR studies. J. Ind. Eng. Chem. 2016, 35, 325–331. [Google Scholar] [CrossRef]
- Gregory, J. Review of chemistry of the solid-water interface. Processes at the mineral–water and particle–water interface in natural systems, by Werner Stumm. J. Colloid Interface Sci. 1993, 159, 520. [Google Scholar] [CrossRef]
- Chen, P.; Zhai, J.; Sun, W.; Hu, Y.; Yin, Z.; Lai, X. Adsorption mechanism of lead ions at ilmenite/water interface and its influence on ilmenite flotability. J. Ind. Eng. Chem. 2017, 53, 285–293. [Google Scholar] [CrossRef]
- Acharya, S.; Nayak, A. Separtion of D2EHPA and M3EHPA. Hydrometallurgy 1988, 19, 309–320. [Google Scholar] [CrossRef]
- Koopal, L.K.; Lee, E.M.; Böhmer, M.R. Adsorption of cationic and anionic surfactants on charged metal oxide surfaces. J. Colloid Interface Sci. 1995, 170, 85–97. [Google Scholar] [CrossRef]
- Socrates, G. IR Characteristic Group Frequencies; Wiley: New York, NY, USA, 1994. [Google Scholar]
- Olu-Owolabi, B.I.; Unuabonah, E.I. Kinetic and thermodynamics of the removal of Zn2+ and Cu2+ from aqueous solution by sulphate and phosphate-modified bentonite clay. J. Hazard. Mater. 2010, 184, 731–738. [Google Scholar] [CrossRef] [PubMed]
- Brzezinski, B.; Wojciechowski, G.; Urjasz, H.; Zundel, G. FT-IR study of the proton polarizability of hydrogen bonds and of the hydrogen-bonded systems in a di-Mannich base of 5,5′-dimethoxy-2,2′-biphenol. J. Mol. Struct. 1998, 470, 335–339. [Google Scholar] [CrossRef]
- Deval, V.; Kumar, A.; Gupta, V.; Sharma, A.; Gupta, A.; Tandon, P.; Kunimoto, K.K. Molecular structure (monomeric and dimeric) and hydrogen bonds in 5-benzyl 2-thiohydantoin studied by FT-IR and FT-Raman spectroscopy and DFT calculations. Spectrochim. Acta Part A Mol. Biomol. Spectrosc. 2014, 132, 15–26. [Google Scholar] [CrossRef] [PubMed]
- Lin-Vien, D.; Colthup, N.B.; Fateley, W.G.; Grasselli, J.G. The Handbook of Infrared and Raman Characteristic Frequencies of Organic Molecules; Academic Press: London, UK, 1991; Chapter 1; pp. 1–7. [Google Scholar]
- Meng, X.; Li, L.; Zou, K.; Liu, J. The effect of SiO2 on TiO2 up-conversion photoluminescence film. Opt. Mater. 2014, 37, 367–370. [Google Scholar] [CrossRef]
- Aksakal, B.; Koç, K.; Yargı, Ö.; Tsobkallo, K. Effect of UV-light on the uniaxial tensile properties and structure of uncoated and TiO2 coated Bombyx mori silk fibers. Spectrochim. Acta Part A Mol. Biomol. Spectrosc. 2015, 152, 658–665. [Google Scholar] [CrossRef] [PubMed]
- Jiang, Z.; Zhang, W.; Jin, L.; Yang, X.; Xu, F.; Zhu, J.; Huang, X. Direct XPS evidence for charge transfer from a reduced rutile TiO2(110) surface to Au clusters. J. Phys. Chem. C 2007, 111, 12434–12439. [Google Scholar] [CrossRef]
- Lee, C.Y.; Gong, P.; Harbers, G.M.; Grainger, D.W.; Castner, D.G.; Gamble, L.J. Surface coverage and structure of mixed DNA/alkylthiol monolayers on gold: Characterization by XPS, NEXAFS, and fluorescence intensity measurements. Anal. Chem. 2006, 78, 3316–3325. [Google Scholar] [CrossRef] [PubMed]
- Mayer, J.T.; Diebold, U.; Madey, T.E.; Garfunkel, E. Titanium and reduced titania overlayers on titanium dioxide (110). J. Electron Spectrosc. Relat. Phenom. 1995, 7, 1–11. [Google Scholar] [CrossRef]
- Kurtz, R.L.; Henrich, V.E. Comparison of Ti 2p core-level peaks from TiO2, Ti2O3, and Ti metal, by XPS. Surf. Sci. Spectra 1998, 5, 179–181. [Google Scholar] [CrossRef]
- Atla, S.B.; Chen, C.C.; Chen, C.Y.; Lin, P.Y.; Pan, W.; Cheng, K.C.; Huang, Y.M.; Chang, Y.F.; Jean, J.S. Visible light response of Ag+/TiO2–Ti2O3 prepared by photodeposition under foam fractionation. J. Photochem. Photobiol. A Chem. 2012, 236, 1–8. [Google Scholar] [CrossRef]
- He, G.; Pan, G.; Zhang, M. Studies on the reaction pathway of arsenate adsorption at water–TiO2 interfaces using density functional theory. J. Colloid Interface Sci. 2011, 364, 476–481. [Google Scholar] [CrossRef] [PubMed]
- Pena, M.; Meng, X.; Korfiatis, G.P.; Jing, C. Adsorption mechanism of arsenic on nanocrystalline titanium dioxide. Int. J. Environ. Sci. Technol. 2006, 40, 1257–1262. [Google Scholar] [CrossRef]
- Leppinen, J.O. FT-IR and flotation investigation of the adsorption of ethyl xanthate on activated and non-activated sulfide minerals. Int. J. Miner. Process. 1990, 30, 245–263. [Google Scholar] [CrossRef]
- Gu, J.; Yuan, C.; Xiao, Z.; Xu, M.; Huang, D.; Lu, Z. Atomic force microscopic observation of local supramolecular structure in phosphatidic acid langmuir blodgett films. J. Chin. Electron. Microsc. Soc. 1997, 5, 791–794. (In Chinese) [Google Scholar]


| Element | TiO2 | FeO | Fe2O3 | SiO2 | CaO | MgO | Al2O3 |
| Content | 93.80 | 1.53 | 1.33 | 2.17 | 0.17 | 0.31 | 0.99 |
| Condition * | Δζ (mV) | Г (mol/L) | Δ |
|---|---|---|---|
| Δ1 | 20.62 | kC exp (0.000803) | −1.99 |
| Δ2 | 29.25 | kC exp (0.00114) | −2.82 |
| Δ3 | 8.63 | kC exp (0.000336) | −0.83 |
| Sample | Binging Energy (eV) | Chemical Shift (eV) | ||||||
|---|---|---|---|---|---|---|---|---|
| C(1s) | O(1s) | Ti(2p) | P(2p) | C(1s) | O(1s) | Ti(2p) | P(2p) | |
| Rutile | 284.8 | 531.10 | 458.54 | - | - | - | - | - |
| SPA | - | - | - | 34.35 | - | - | - | - |
| Rutile + SPA | 284.9 | 531.49 | 458.97 | 133.76 | +0.1 | +0.39 | +0.43 | −0.59 |
| Sample | Relative Contents (%) | |||
|---|---|---|---|---|
| C(1s) | O(1s) | Ti(2p) | P(2p) | |
| Rutile | 25.01 | 62.50 | 12.49 | - |
| Rutile + SPA | 51.61 | 36.06 | 4.67 | 6.77 |
© 2018 by the authors. Licensee MDPI, Basel, Switzerland. This article is an open access article distributed under the terms and conditions of the Creative Commons Attribution (CC BY) license (http://creativecommons.org/licenses/by/4.0/).
Share and Cite
Xiao, W.; Jiao, F.; Zhao, H.; Qin, W.; Qiu, G.; Wang, J. Adsorption Structure and Mechanism of Styryl Phosphoric Acid at the Rutile–Water Interface. Minerals 2018, 8, 360. https://doi.org/10.3390/min8080360
Xiao W, Jiao F, Zhao H, Qin W, Qiu G, Wang J. Adsorption Structure and Mechanism of Styryl Phosphoric Acid at the Rutile–Water Interface. Minerals. 2018; 8(8):360. https://doi.org/10.3390/min8080360
Chicago/Turabian StyleXiao, Wei, Fen Jiao, Hongbo Zhao, Wenqing Qin, Guanzhou Qiu, and Jun Wang. 2018. "Adsorption Structure and Mechanism of Styryl Phosphoric Acid at the Rutile–Water Interface" Minerals 8, no. 8: 360. https://doi.org/10.3390/min8080360
APA StyleXiao, W., Jiao, F., Zhao, H., Qin, W., Qiu, G., & Wang, J. (2018). Adsorption Structure and Mechanism of Styryl Phosphoric Acid at the Rutile–Water Interface. Minerals, 8(8), 360. https://doi.org/10.3390/min8080360