Breakage Characteristics of Heat-Treated Limestone Determined via Kinetic Modeling
Abstract
:1. Introduction
2. Theory
Specific Rate of Breakage and Primary Breakage Distribution
3. Experimental
3.1. Samples
3.2. Conventional Ball Milling Tests
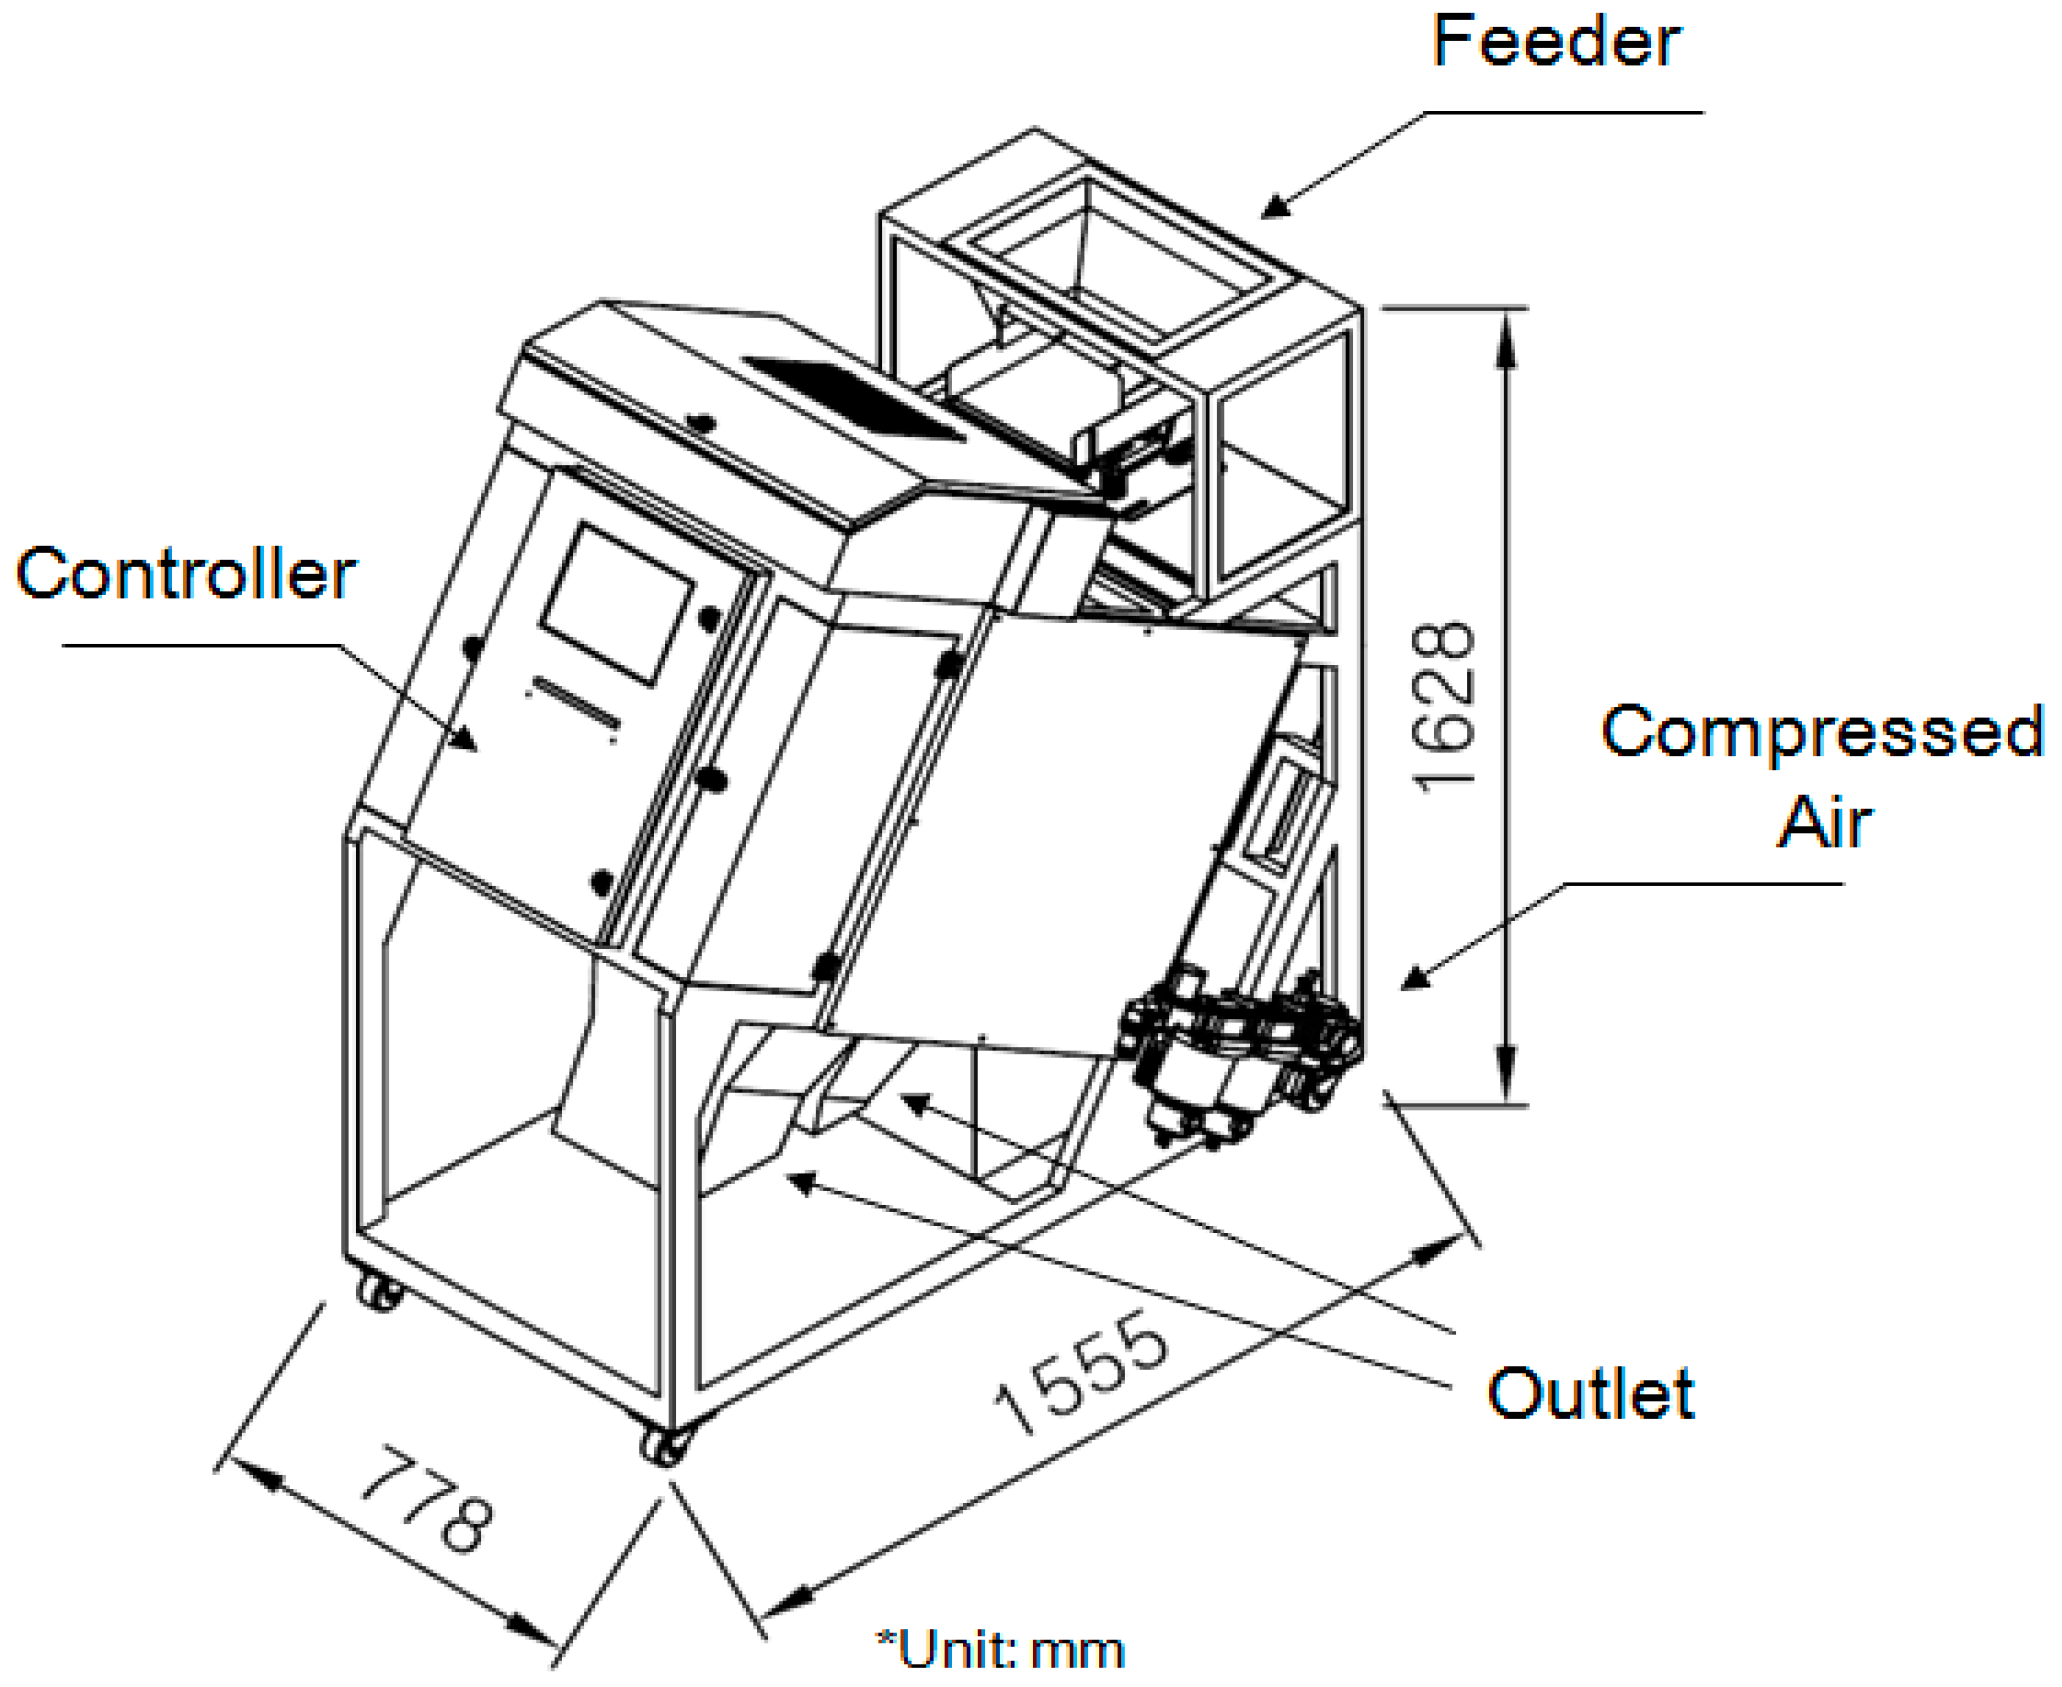
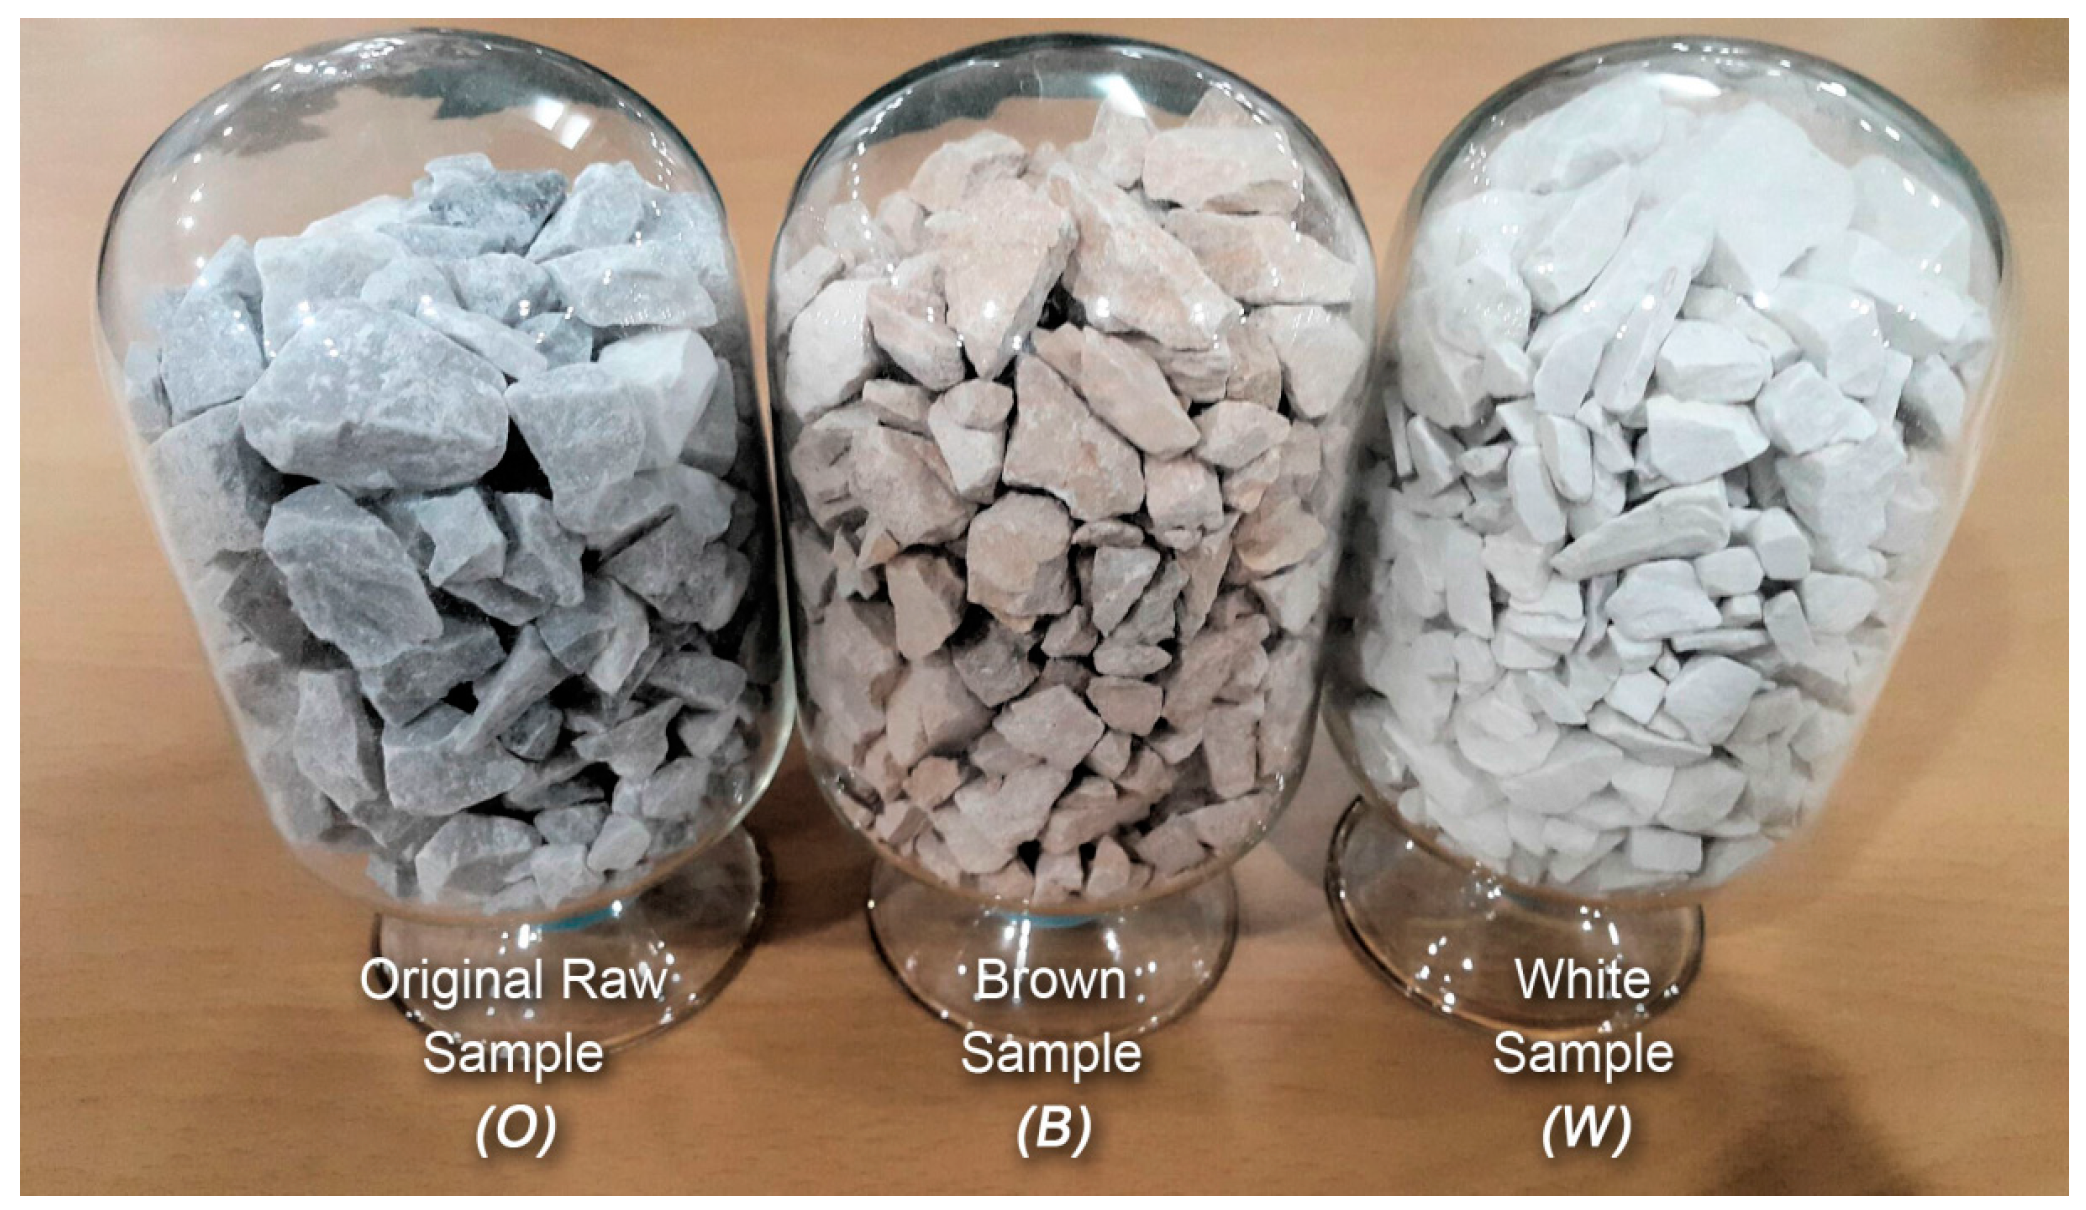
3.3. Heat Treatment and Optical Sorting
4. Results and Discussion
4.1. Effect of Heat Treatment on Limestone
4.2. Determination of Breakage Parameters by Experimental Methods
4.3. Determination of Breakage Parameters by Back-Calculation Methods
5. Conclusions
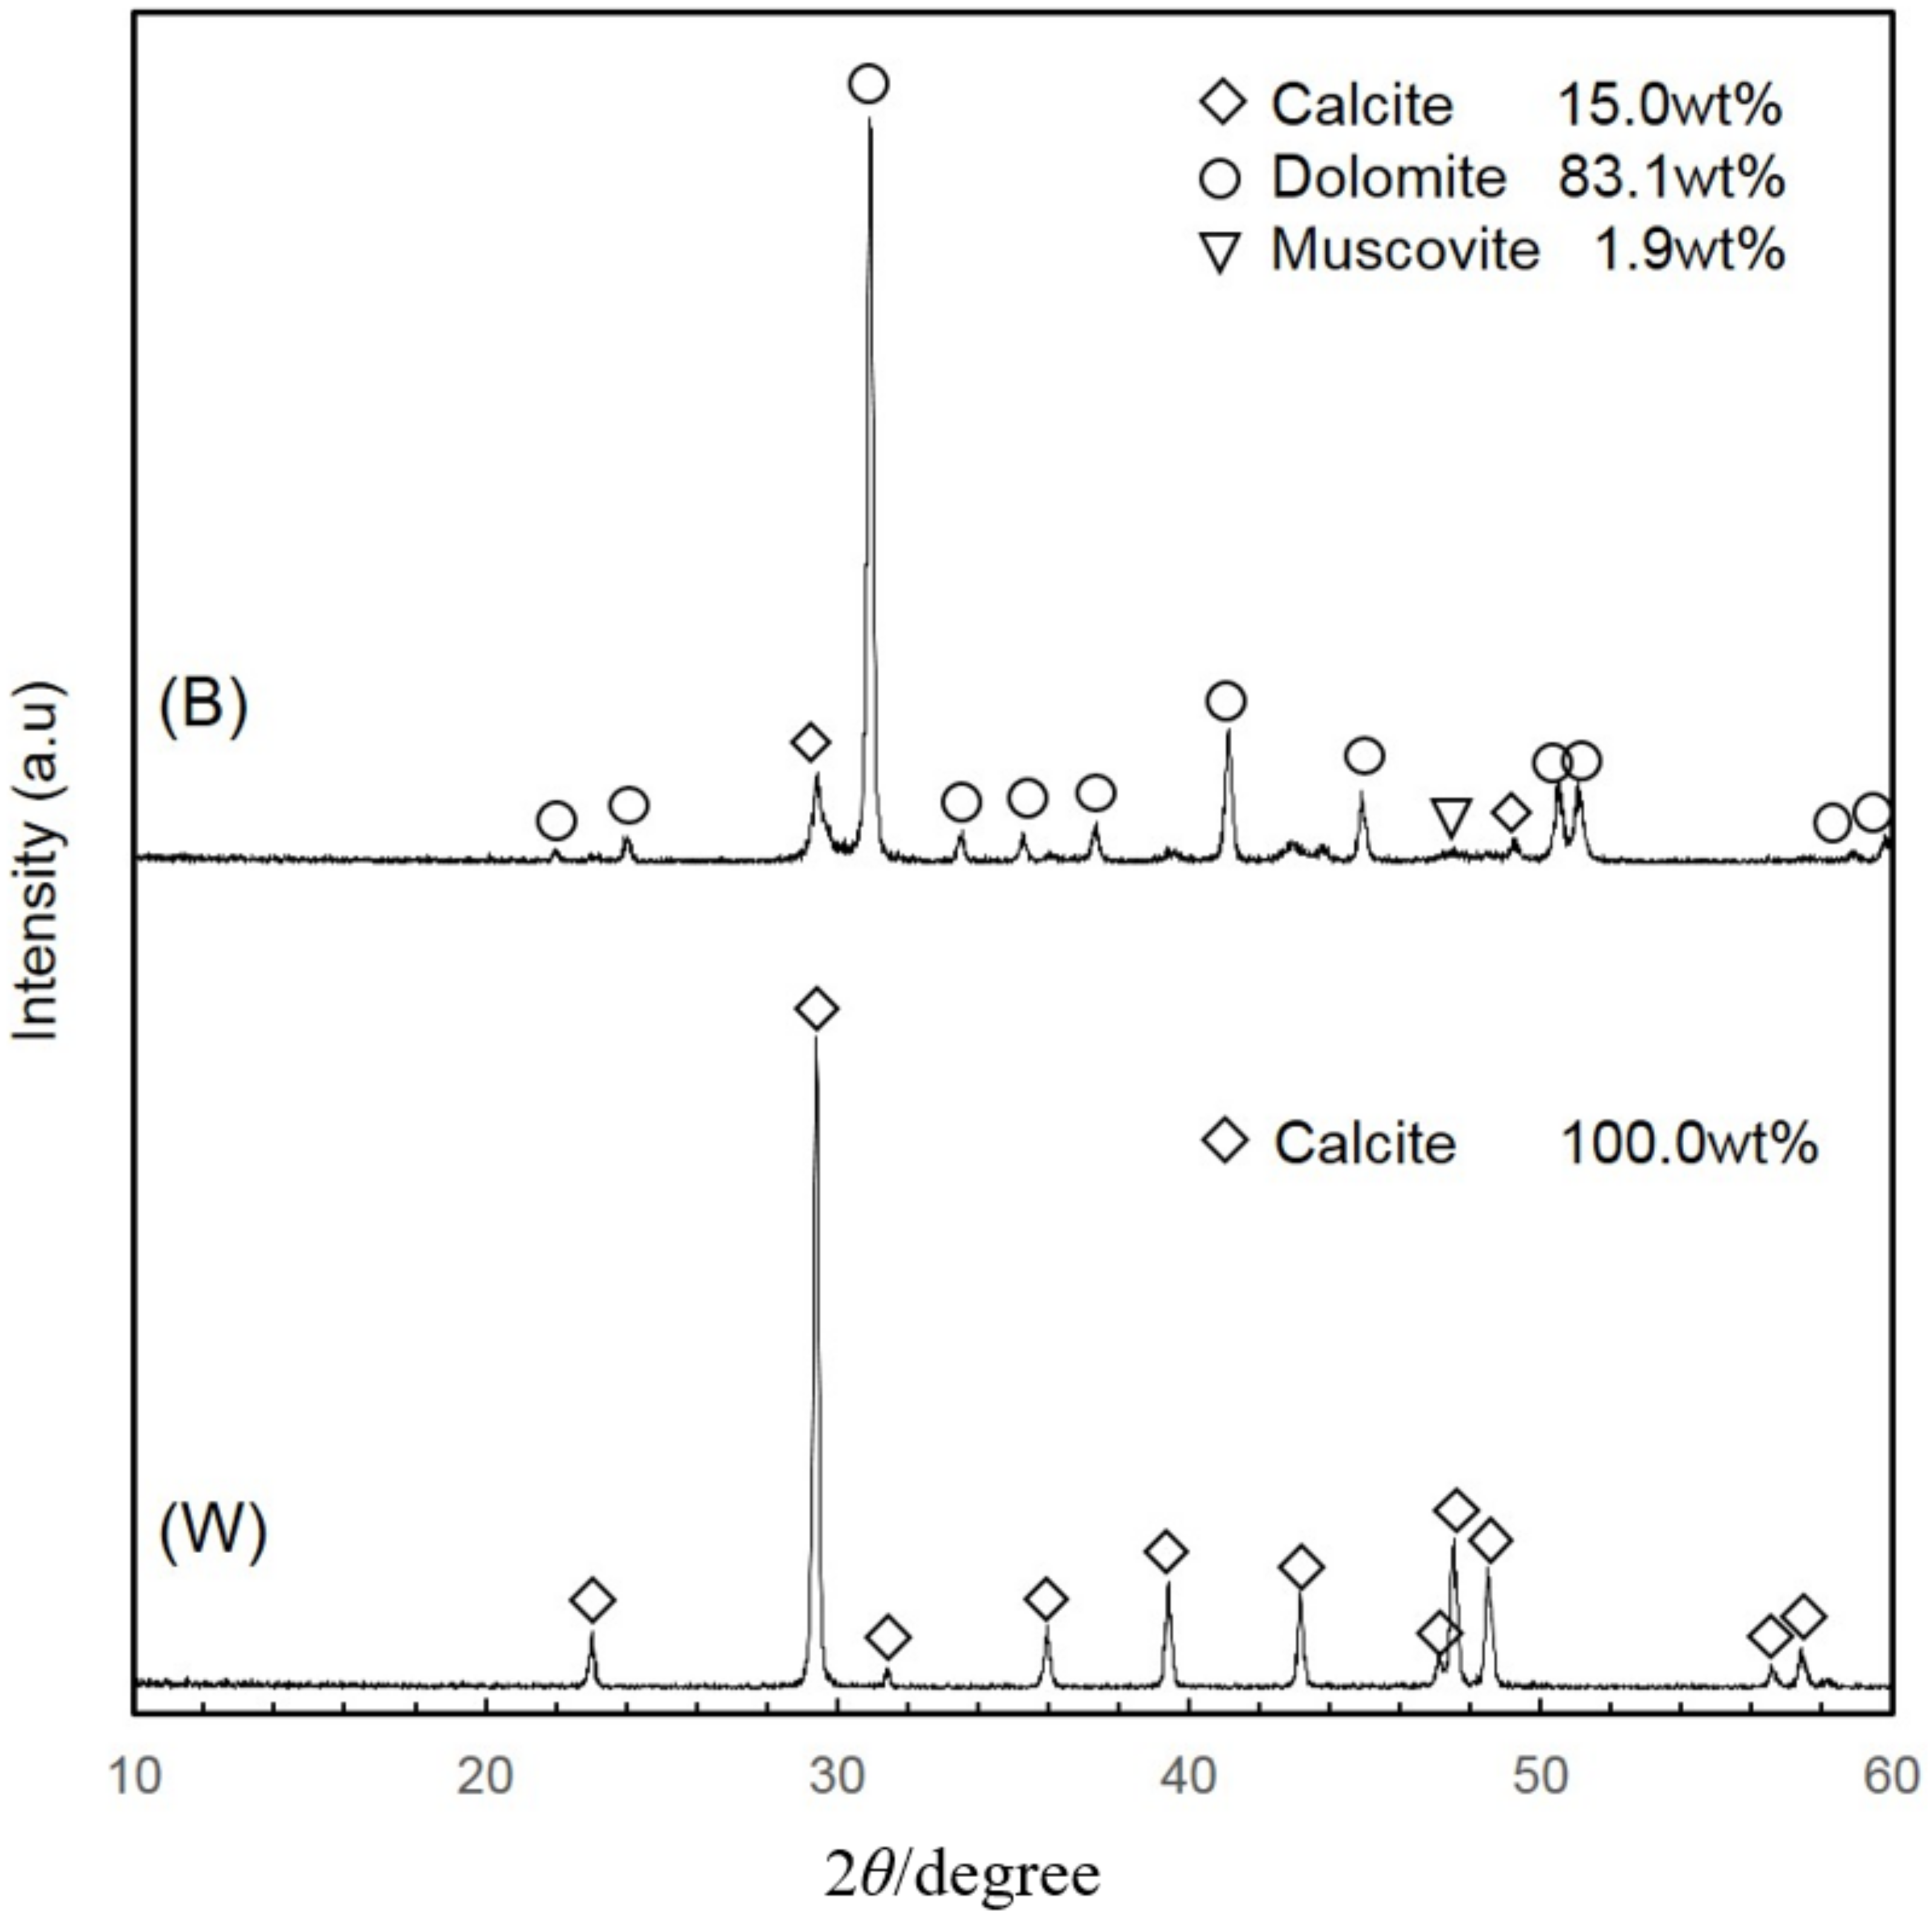
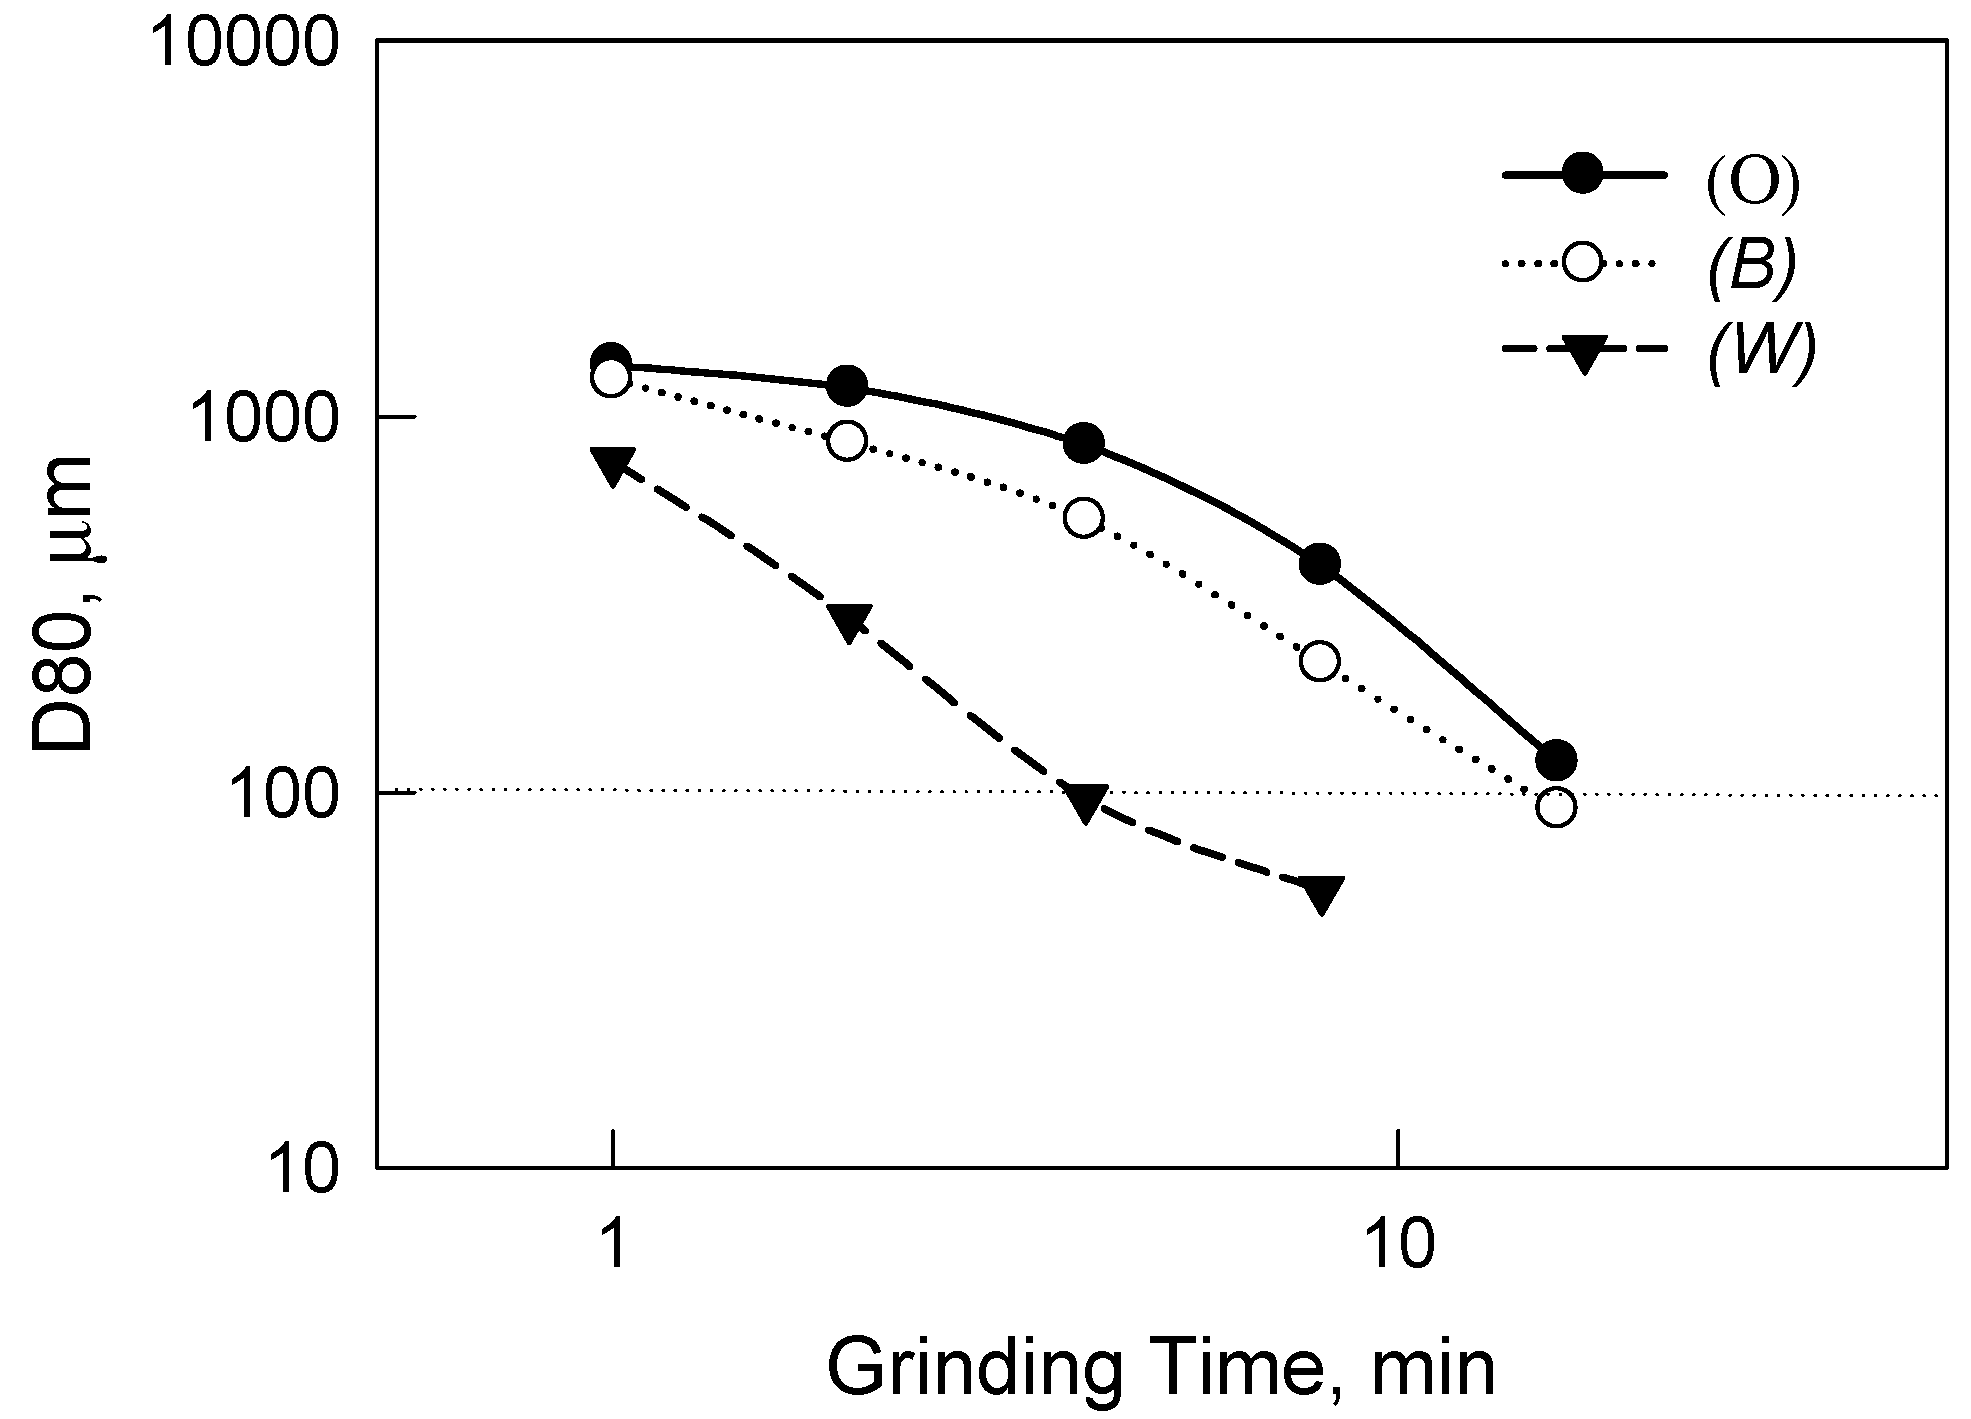
- After heat treatment at 600 °C for 1 h, low-grade limestone can be divided into brown and white groups. XRD analysis showed that the brown group consists of mainly dolomite while the white limestone is composed mainly of calcite. These were separated by the optical sorting process based on color differences, and each sample group as well as the original ore showed various grinding characteristics in the ball mill.
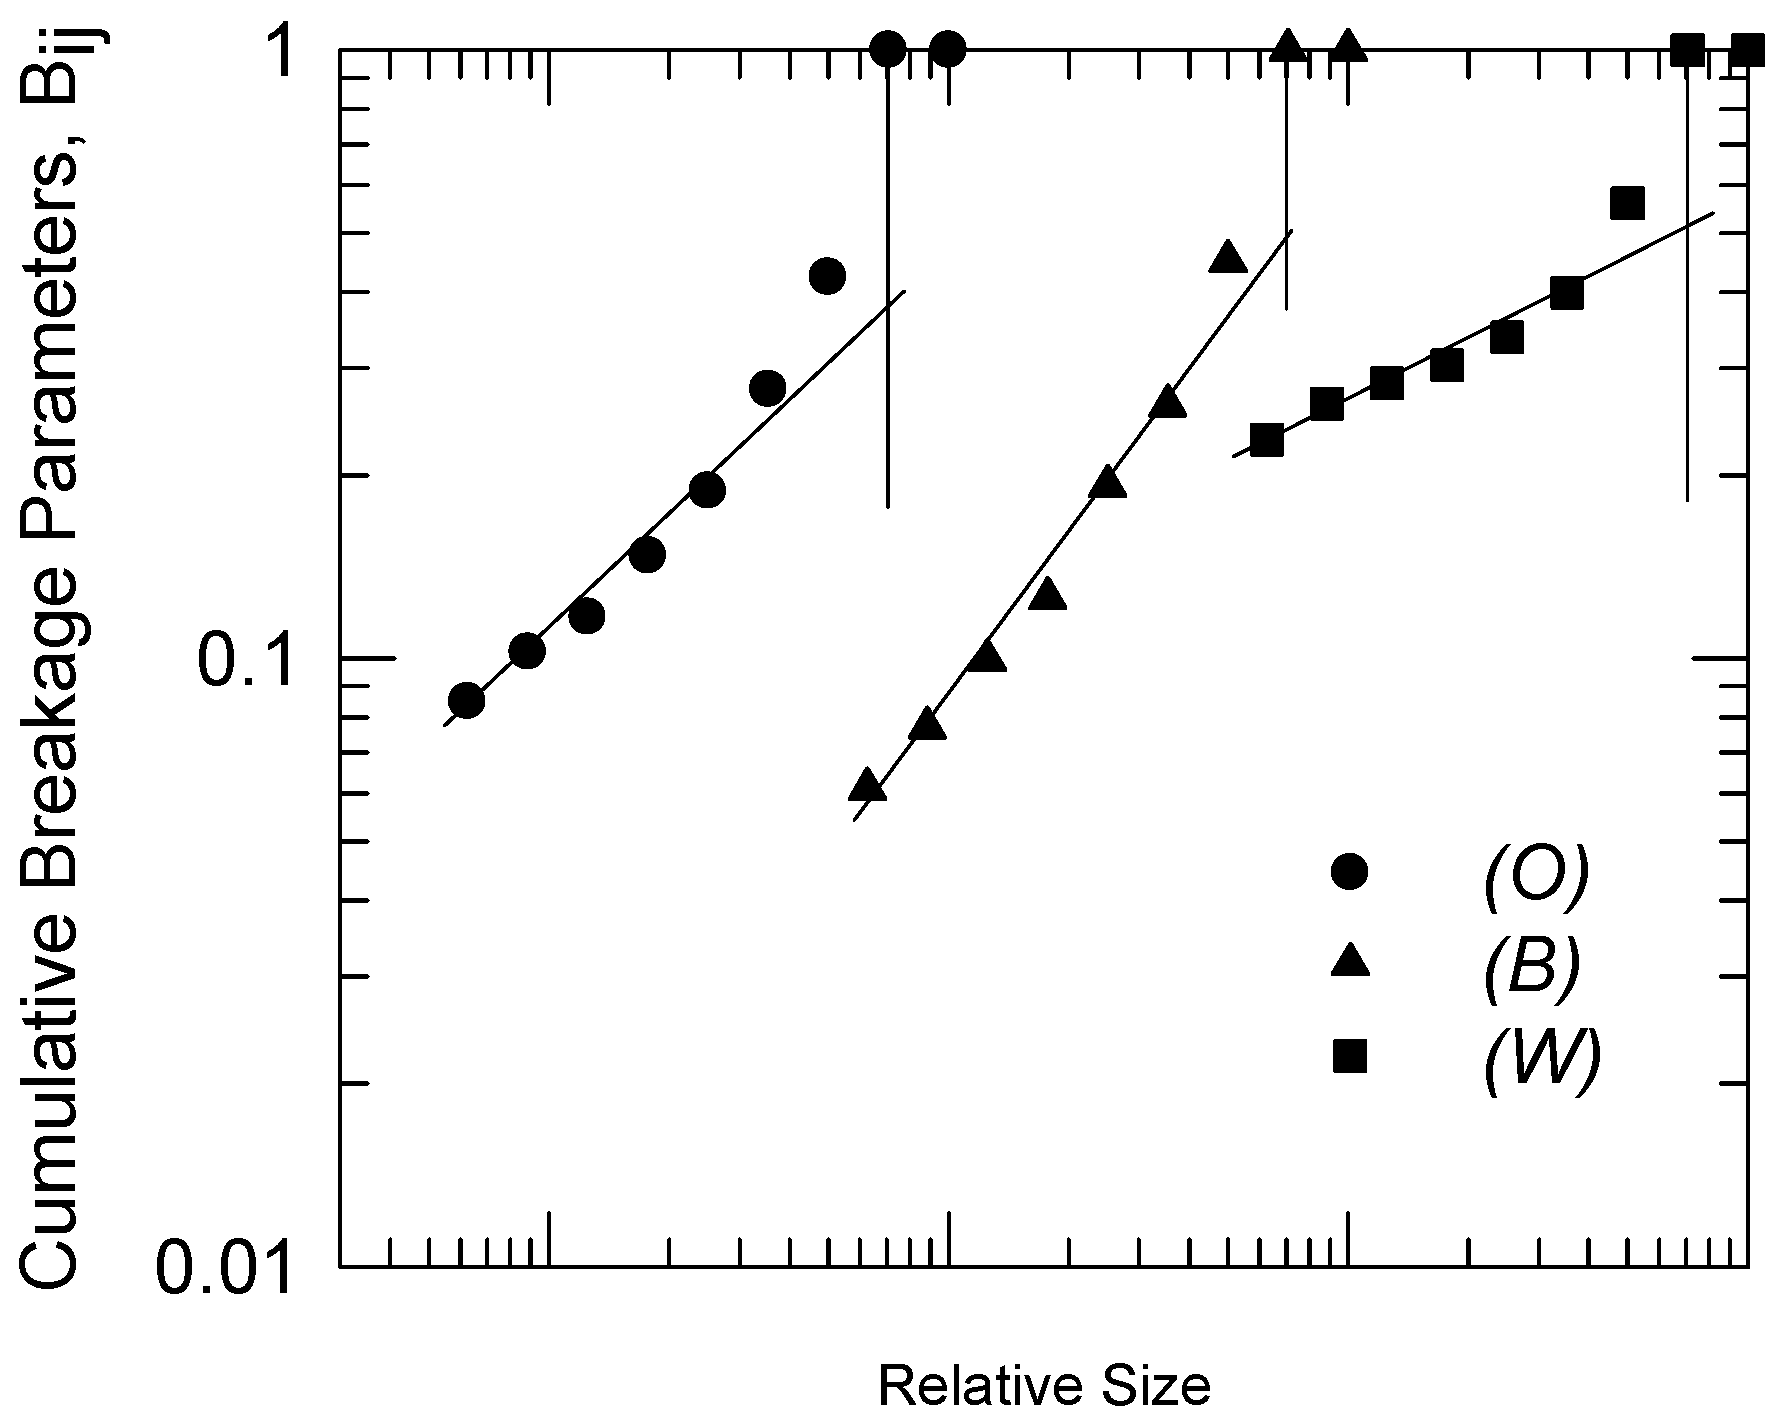
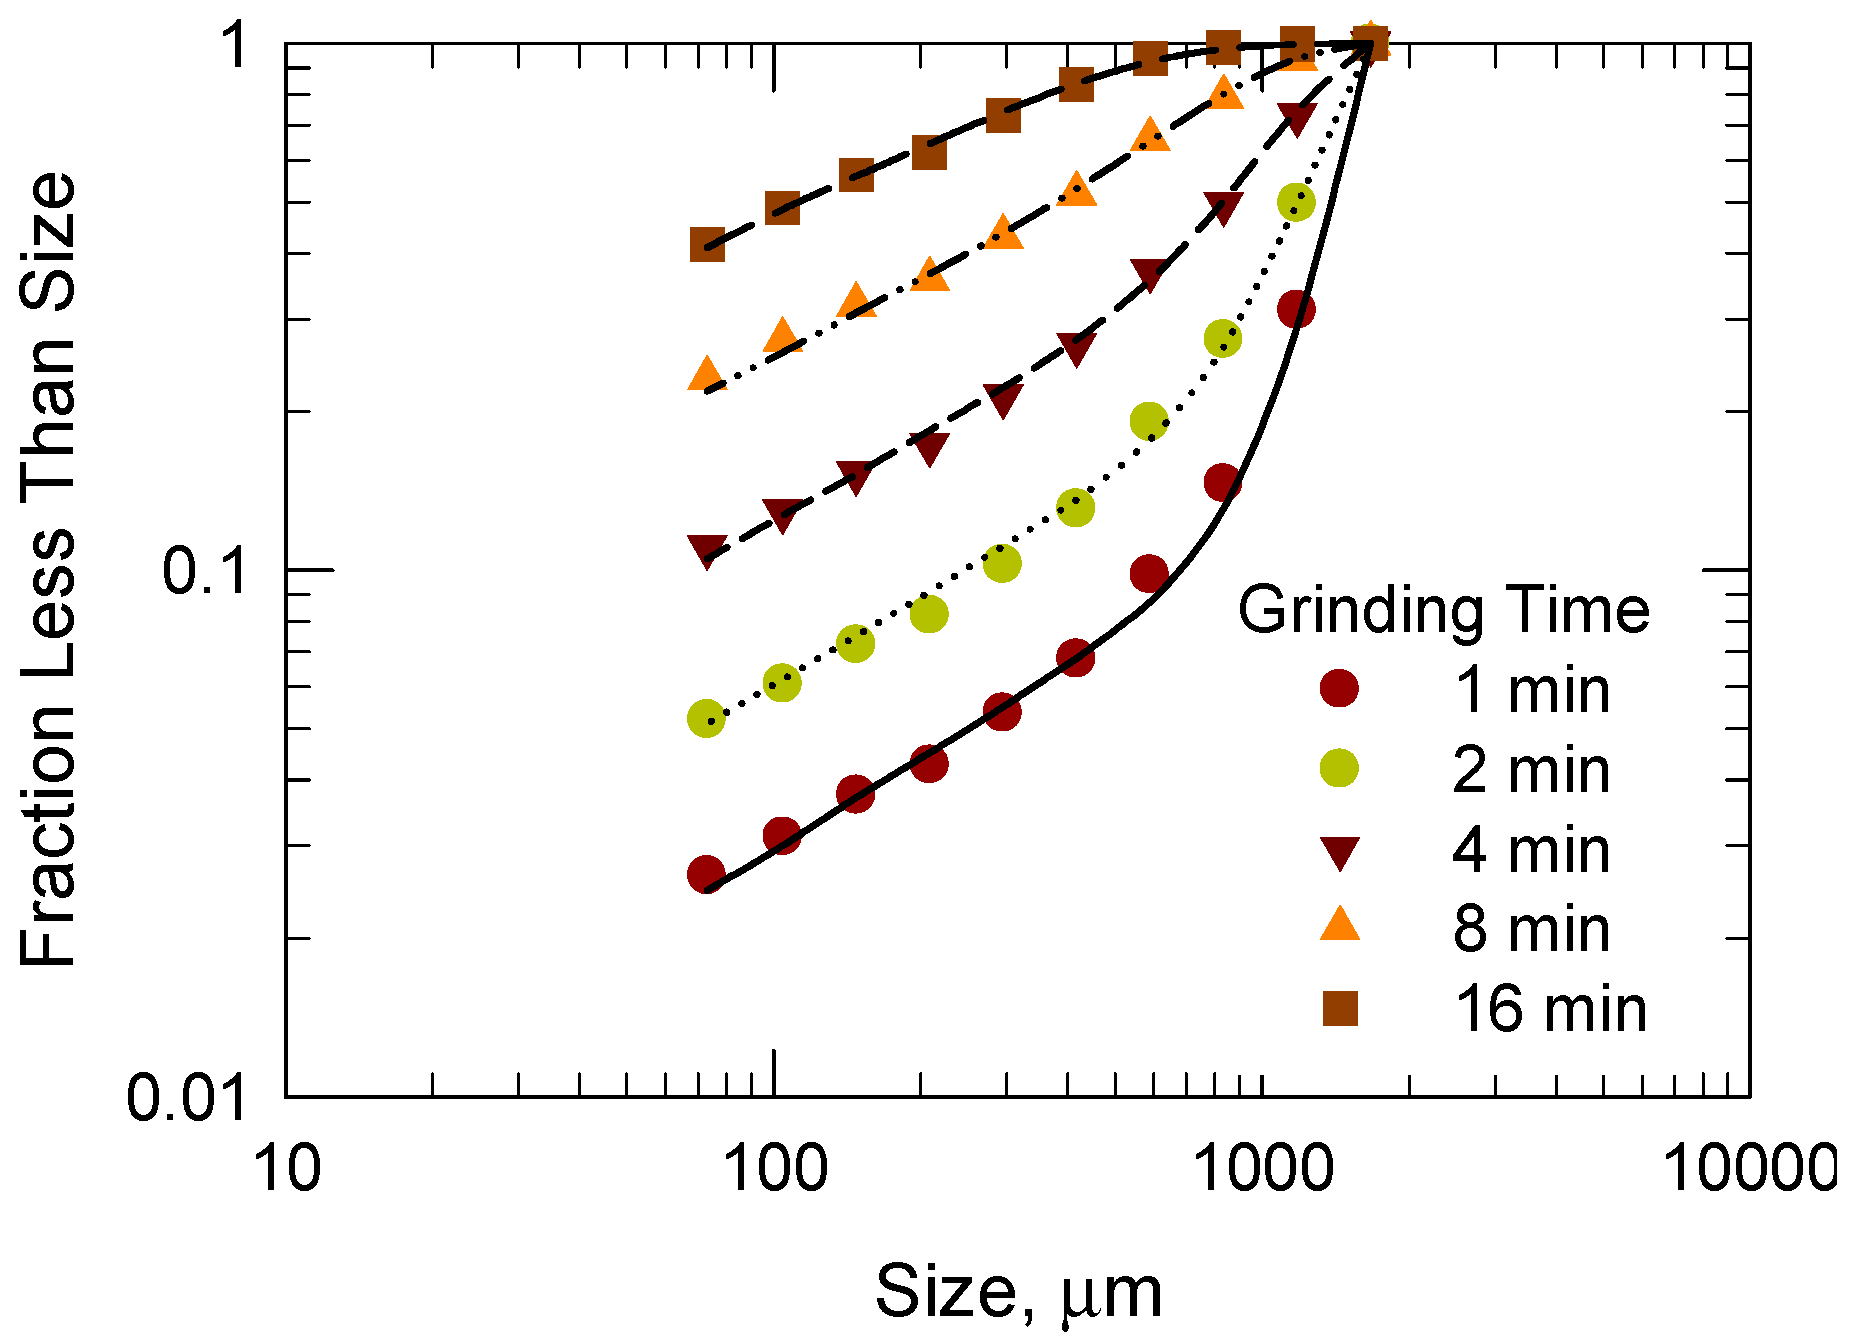
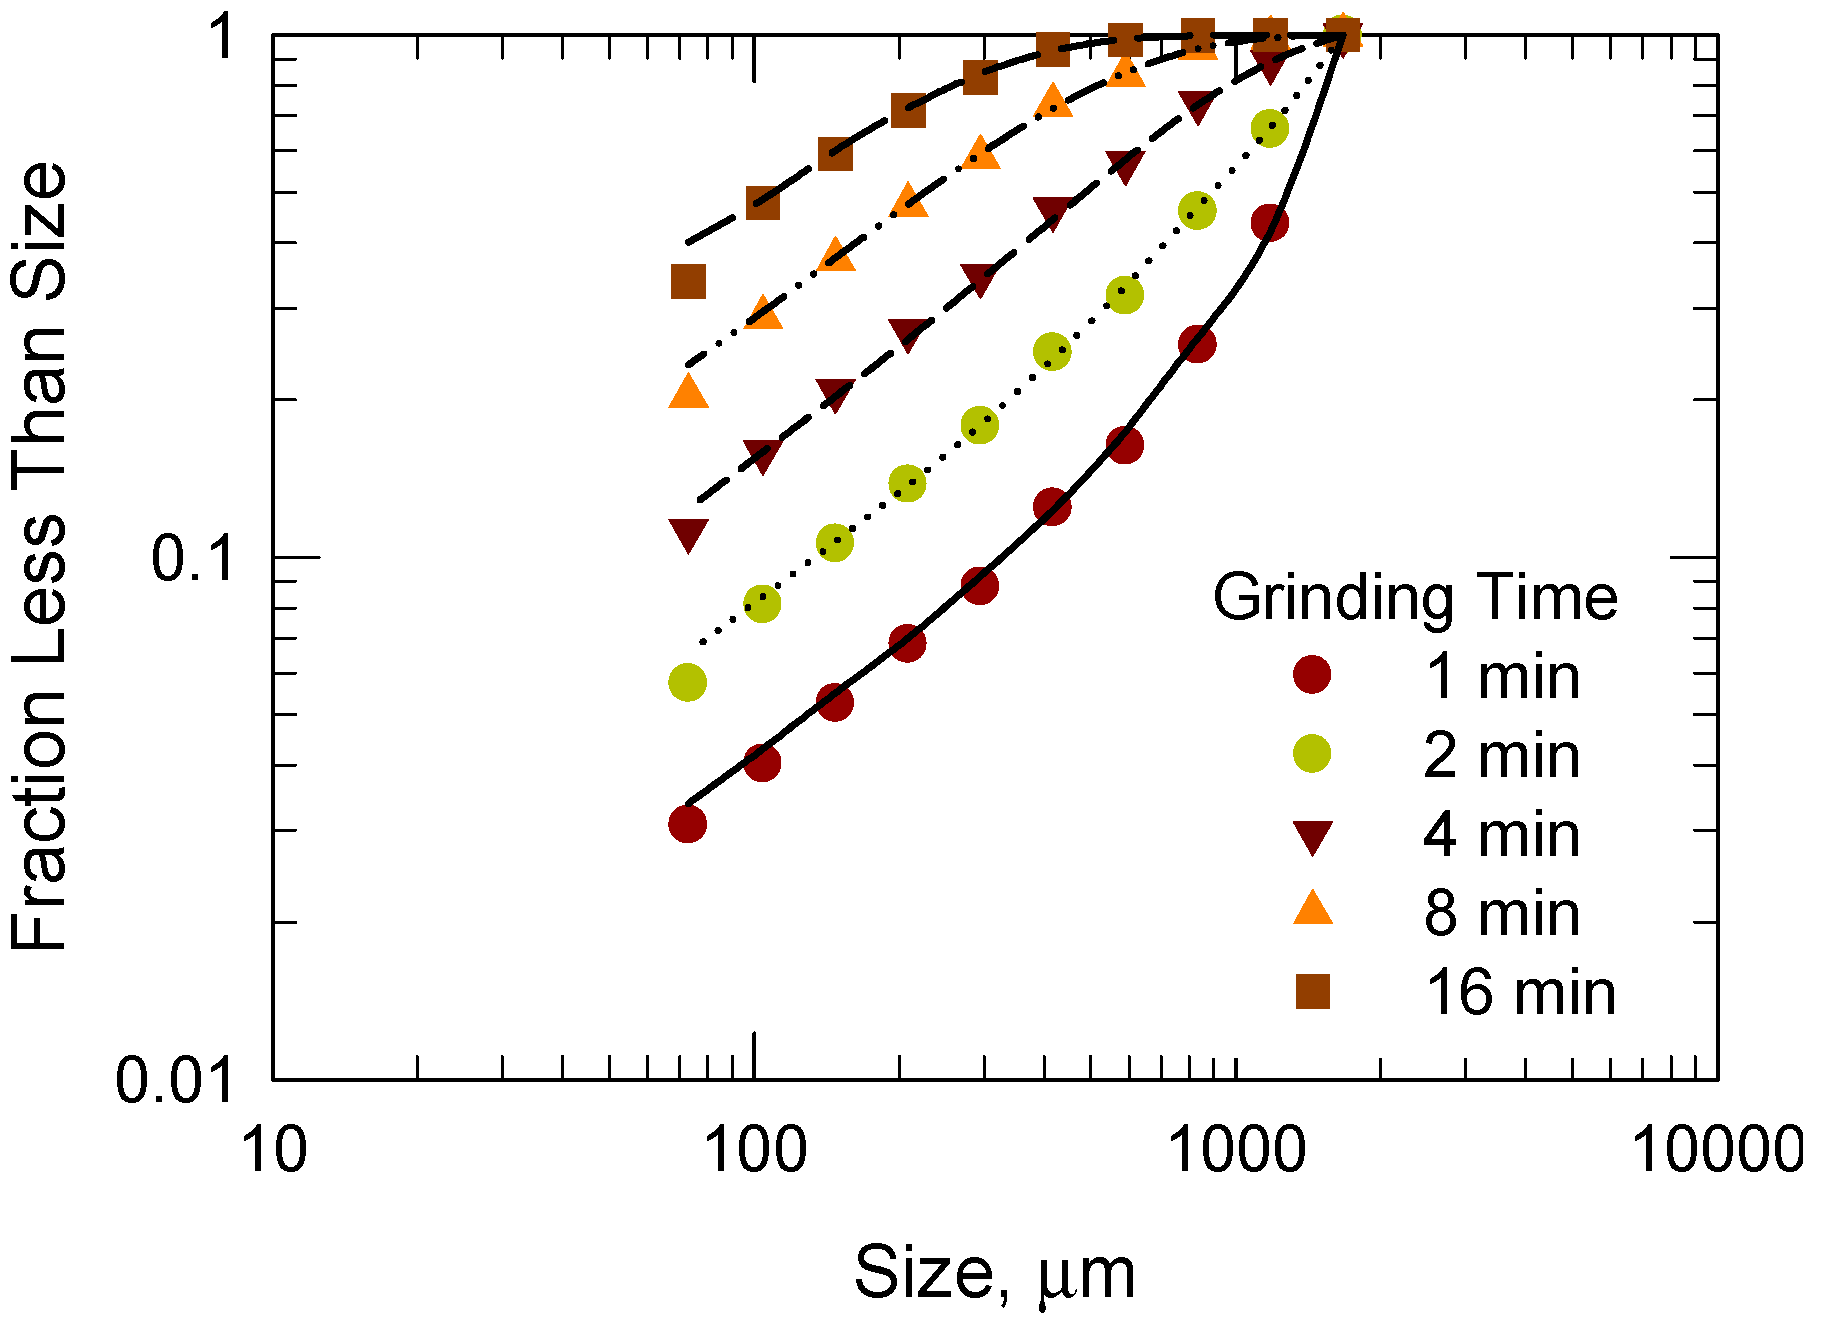
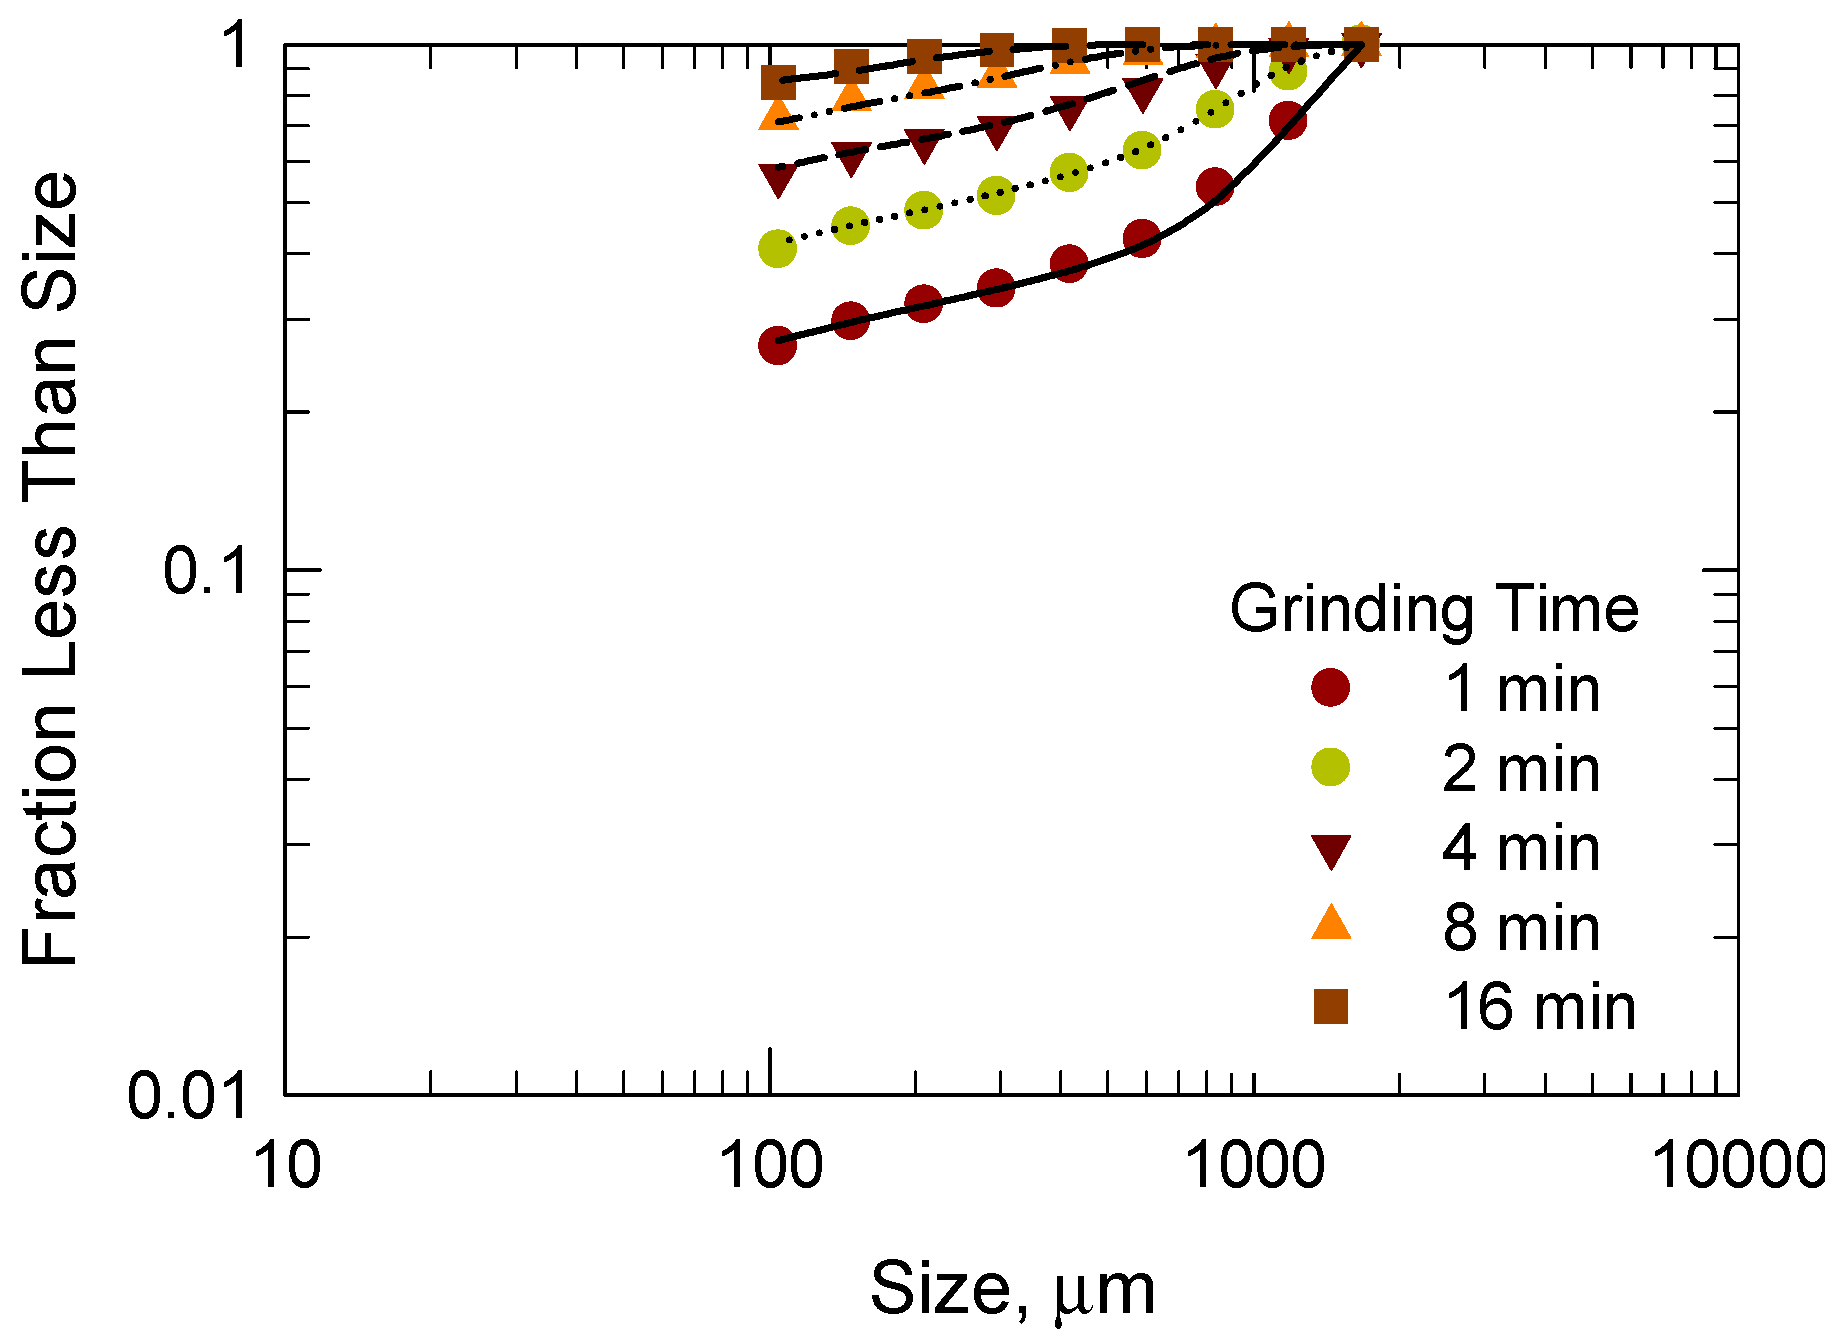
- The breakage parameters of the kinetic model (specific rate of breakage and primary breakage distribution) were calculated from the size distribution of the product samples, and the predicted values of the size distribution agree well with the experimental data.
- The results from this study indicate that ball mill grinding of limestone can be described based on the population-balance model. This kinetic model approach can provide a basis for the design of milling processes for the utilization of low-grade limestone. In addition, it is expected to play a major role in optimizing the grinding process and improving the efficiency of limestone production.
Acknowledgments
Author Contributions
Conflicts of Interest
References
- Cho, H.C.; Jeong, S. A characteristic study of ball mill and centrifugal mill using discrete element method. J. Miner. Energy Resour. 2005, 42, 393–402. [Google Scholar]
- Deniz, V. A new size distribution model by t-family curves for comminution of limestones in an impact crusher. Adv. Powder Technol. 2011, 22, 761–765. [Google Scholar] [CrossRef]
- Nitta, S.; Bissombolo, A.; Furuyama, T.; Mori, S. Relationship between bond’s work index (Wi) and uniformity constant (n) of grinding kinetics on tower mill milling limestone. Int. J. Miner. Process. 2002, 66, 79–87. [Google Scholar] [CrossRef]
- Deniz, V. Relationships between bond’s grindability (Gbg) and breakage parameters of grinding kinetic on limestone. Powder Technol. 2004, 139, 208–213. [Google Scholar] [CrossRef]
- Dündar, H.; Benzer, H. Investigating multicomponent breakage in cement grinding. Miner. Eng. 2015, 77, 131–136. [Google Scholar] [CrossRef]
- Sun, H.; Hohl, B.; Cao, Y.; Handwerker, C.; Rushing, T.S.; Cummins, T.K.; Weiss, J. Jet mill grinding of portland cement, limestone, and fly ash: Impact on particle size, hydration rate, and strength. Cem. Concr. Compos. 2013, 44, 41–49. [Google Scholar] [CrossRef]
- Guzzo, P.L.; Tino, A.A.; Santos, J.B. The onset of particle agglomeration during the dry ultrafine grinding of limestone in a planetary ball mill. Powder Technol. 2015, 284, 122–129. [Google Scholar] [CrossRef]
- Kwade, A. Mill selection and process optimization using a physical grinding model. Int. J. Miner. Process. 2004, 74, S93–S101. [Google Scholar] [CrossRef]
- Fuerstenau, D.; De, A.; Kapur, P. Linear and nonlinear particle breakage processes in comminution systems. Int. J. Miner. Process. 2004, 74, S317–S327. [Google Scholar] [CrossRef]
- Lai, H.-Y. A high-precision surface grinding model for general ball-end milling cutters. Int. J. Adv. Manuf. Technol. 2002, 19, 393–402. [Google Scholar] [CrossRef]
- Austin, L.G.; Klimpel, R.R.; Luckie, P.T. Process Engineering of Size Reduction: Ball Milling; American Institute of Mining, Metallurgical, and Petroleum Engineers: New York, NY, USA, 1984. [Google Scholar]
- Avriel, M. Nonlinear Programming: Analysis and Methods; Courier Corporation: North Chelmsford, MA, USA, 2003. [Google Scholar]
- Lee, H.; Kim, H.K.; Kim, W.T.; Kim, S.B. Determination of breakage parameters in mathematical grinding model by weight-adjustment modification. J. Miner. Energy Resour. 2013, 50, 80–87. [Google Scholar] [CrossRef]
- Lee, H.; Cho, H.C.; Kwon, J.H. Using the discrete element method to analyze the breakage rate in a centrifugal/vibration mill. Powder Technol. 2010, 198, 364–372. [Google Scholar] [CrossRef]

| Component | SiO2 | Al2O3 | Fe2O3 | CaO | MgO | K2O | Na2O | TiO2 | MnO | P2O5 | Ig loss |
|---|---|---|---|---|---|---|---|---|---|---|---|
| Content | 0.11 | 0.05 | 0.59 | 43.39 | 10.55 | 0.03 | 0.03 | <0.01 | 0.11 | 0.02 | 45.26 |
| Sample Parameter | Value |
|---|---|
| Sample size (mesh) | 16 × 20 |
| Mill diameter, D (cm) | 21 |
| Mill length, L (cm) | 22 |
| Ball type | Alumina |
| Ball diameter, d (cm) | 2.5 |
| Ball Charge, J | 0.3 |
| Powder filling, U | 1.0 |
| Rotation speed, φc | 69 rpm (70% of critical speed) |
| Sample | Calcite | Dolomite | Periclase | Muscovite | Whiteness | wt % |
|---|---|---|---|---|---|---|
| (B) | 15 | 83.1 | 1.9 | - | 63.4 | 45 |
| (W) | 100 | - | - | - | 85.7 | 55 |
| Parameters | (O) | (B) | (W) |
|---|---|---|---|
| γ | 0.6 | 0.7 | 0.3 |
| Φ | 0.4 | 0.6 | 0.5 |
| β | 6.0 | 3.5 | 5.0 |
| Breakage function | Parameters | Value | ||
|---|---|---|---|---|
| (O) | (B) | (W) | ||
| Specific rate of breakage | A (1 mm) | 0.28 | 0.35 | 0.51 |
| α | 0.37 | 0.85 | 1.39 | |
| Primary distribution of breakage | γ | 0.58 | 0.67 | 0.15 |
| Φ | 0.36 | 0.41 | 0.50 | |
| β | 6.5 | 3.0 | 4.0 | |
© 2018 by the authors. Licensee MDPI, Basel, Switzerland. This article is an open access article distributed under the terms and conditions of the Creative Commons Attribution (CC BY) license (http://creativecommons.org/licenses/by/4.0/).
Share and Cite
Lee, H.; Kim, K.; Kim, J.; You, K.; Lee, H. Breakage Characteristics of Heat-Treated Limestone Determined via Kinetic Modeling. Minerals 2018, 8, 18. https://doi.org/10.3390/min8010018
Lee H, Kim K, Kim J, You K, Lee H. Breakage Characteristics of Heat-Treated Limestone Determined via Kinetic Modeling. Minerals. 2018; 8(1):18. https://doi.org/10.3390/min8010018
Chicago/Turabian StyleLee, Hoon, Kwanho Kim, Jeongyun Kim, Kwangsuk You, and Hansol Lee. 2018. "Breakage Characteristics of Heat-Treated Limestone Determined via Kinetic Modeling" Minerals 8, no. 1: 18. https://doi.org/10.3390/min8010018
APA StyleLee, H., Kim, K., Kim, J., You, K., & Lee, H. (2018). Breakage Characteristics of Heat-Treated Limestone Determined via Kinetic Modeling. Minerals, 8(1), 18. https://doi.org/10.3390/min8010018


