Article

Integrated Approach to Paleontological and Geochemical Data of the Upper Campanian–Maastrichtian Harami Formation (Elazığ, Eastern Türkiye)

by
Sibel Kayğılı
1,*,
Ercan Aksoy
1 and
Mehmet Özkul
2
1
Department of Geological Engineering, Faculty of Engineering, Fırat University, Elazığ 23119, Türkiye
2
Department of Geological Engineering, Pamukkale University, Denizli 20070, Türkiye
*
Author to whom correspondence should be addressed.
Minerals 2026, 16(8), 848; https://doi.org/10.3390/min16080848
Submission received: 16 June 2026 / Revised: 7 August 2026 / Accepted: 13 August 2026 / Published: 17 August 2026

Abstract

The aim of this study is to determine the age and depositional environment of the Harami Formation through an integrated interpretation of XRF, ICP-MS, SEM-EDS, stable isotope, and radioactive isotope analysis results and findings of larger benthic foraminifera. Findings from the authors’ previous studies regarding the characteristics of larger benthic foraminifera were utilized; geochemical analysis results were obtained for the first time in this study. The mean 87Sr/86Sr values are generally consistent with the ages determined from the larger benthic foraminifera. The analysis results and Y/Ho values indicate that CaO is the dominant component, while negative Ce and positive Eu anomalies are indicative of a low-grade diagenetic effect. The absence of hydrothermal activity in the depositional environment and the proximity of the values to those of seawater are supported by the Y/Ho and Eu/Sm ratios. Similarly, to the larger benthic foraminifera content that indicates the Harami Formation was deposited in a shallow, oxic environment, the trace element ratios (V/Cr and V/V+Ni) and slightly negative Ce anomalies also support deposition in an oxic environment, while the Sr/Ba and Sr/Rb analysis results indicate a shallow marine environment. The analysis results further indicate that the depositional environment ranged from warm-temperate to arid conditions. A decrease in mean temperature is observed from the late Campanian to the early Maastrichtian, with an increase from the early Maastrichtian to the late Maastrichtian.

1. Introduction

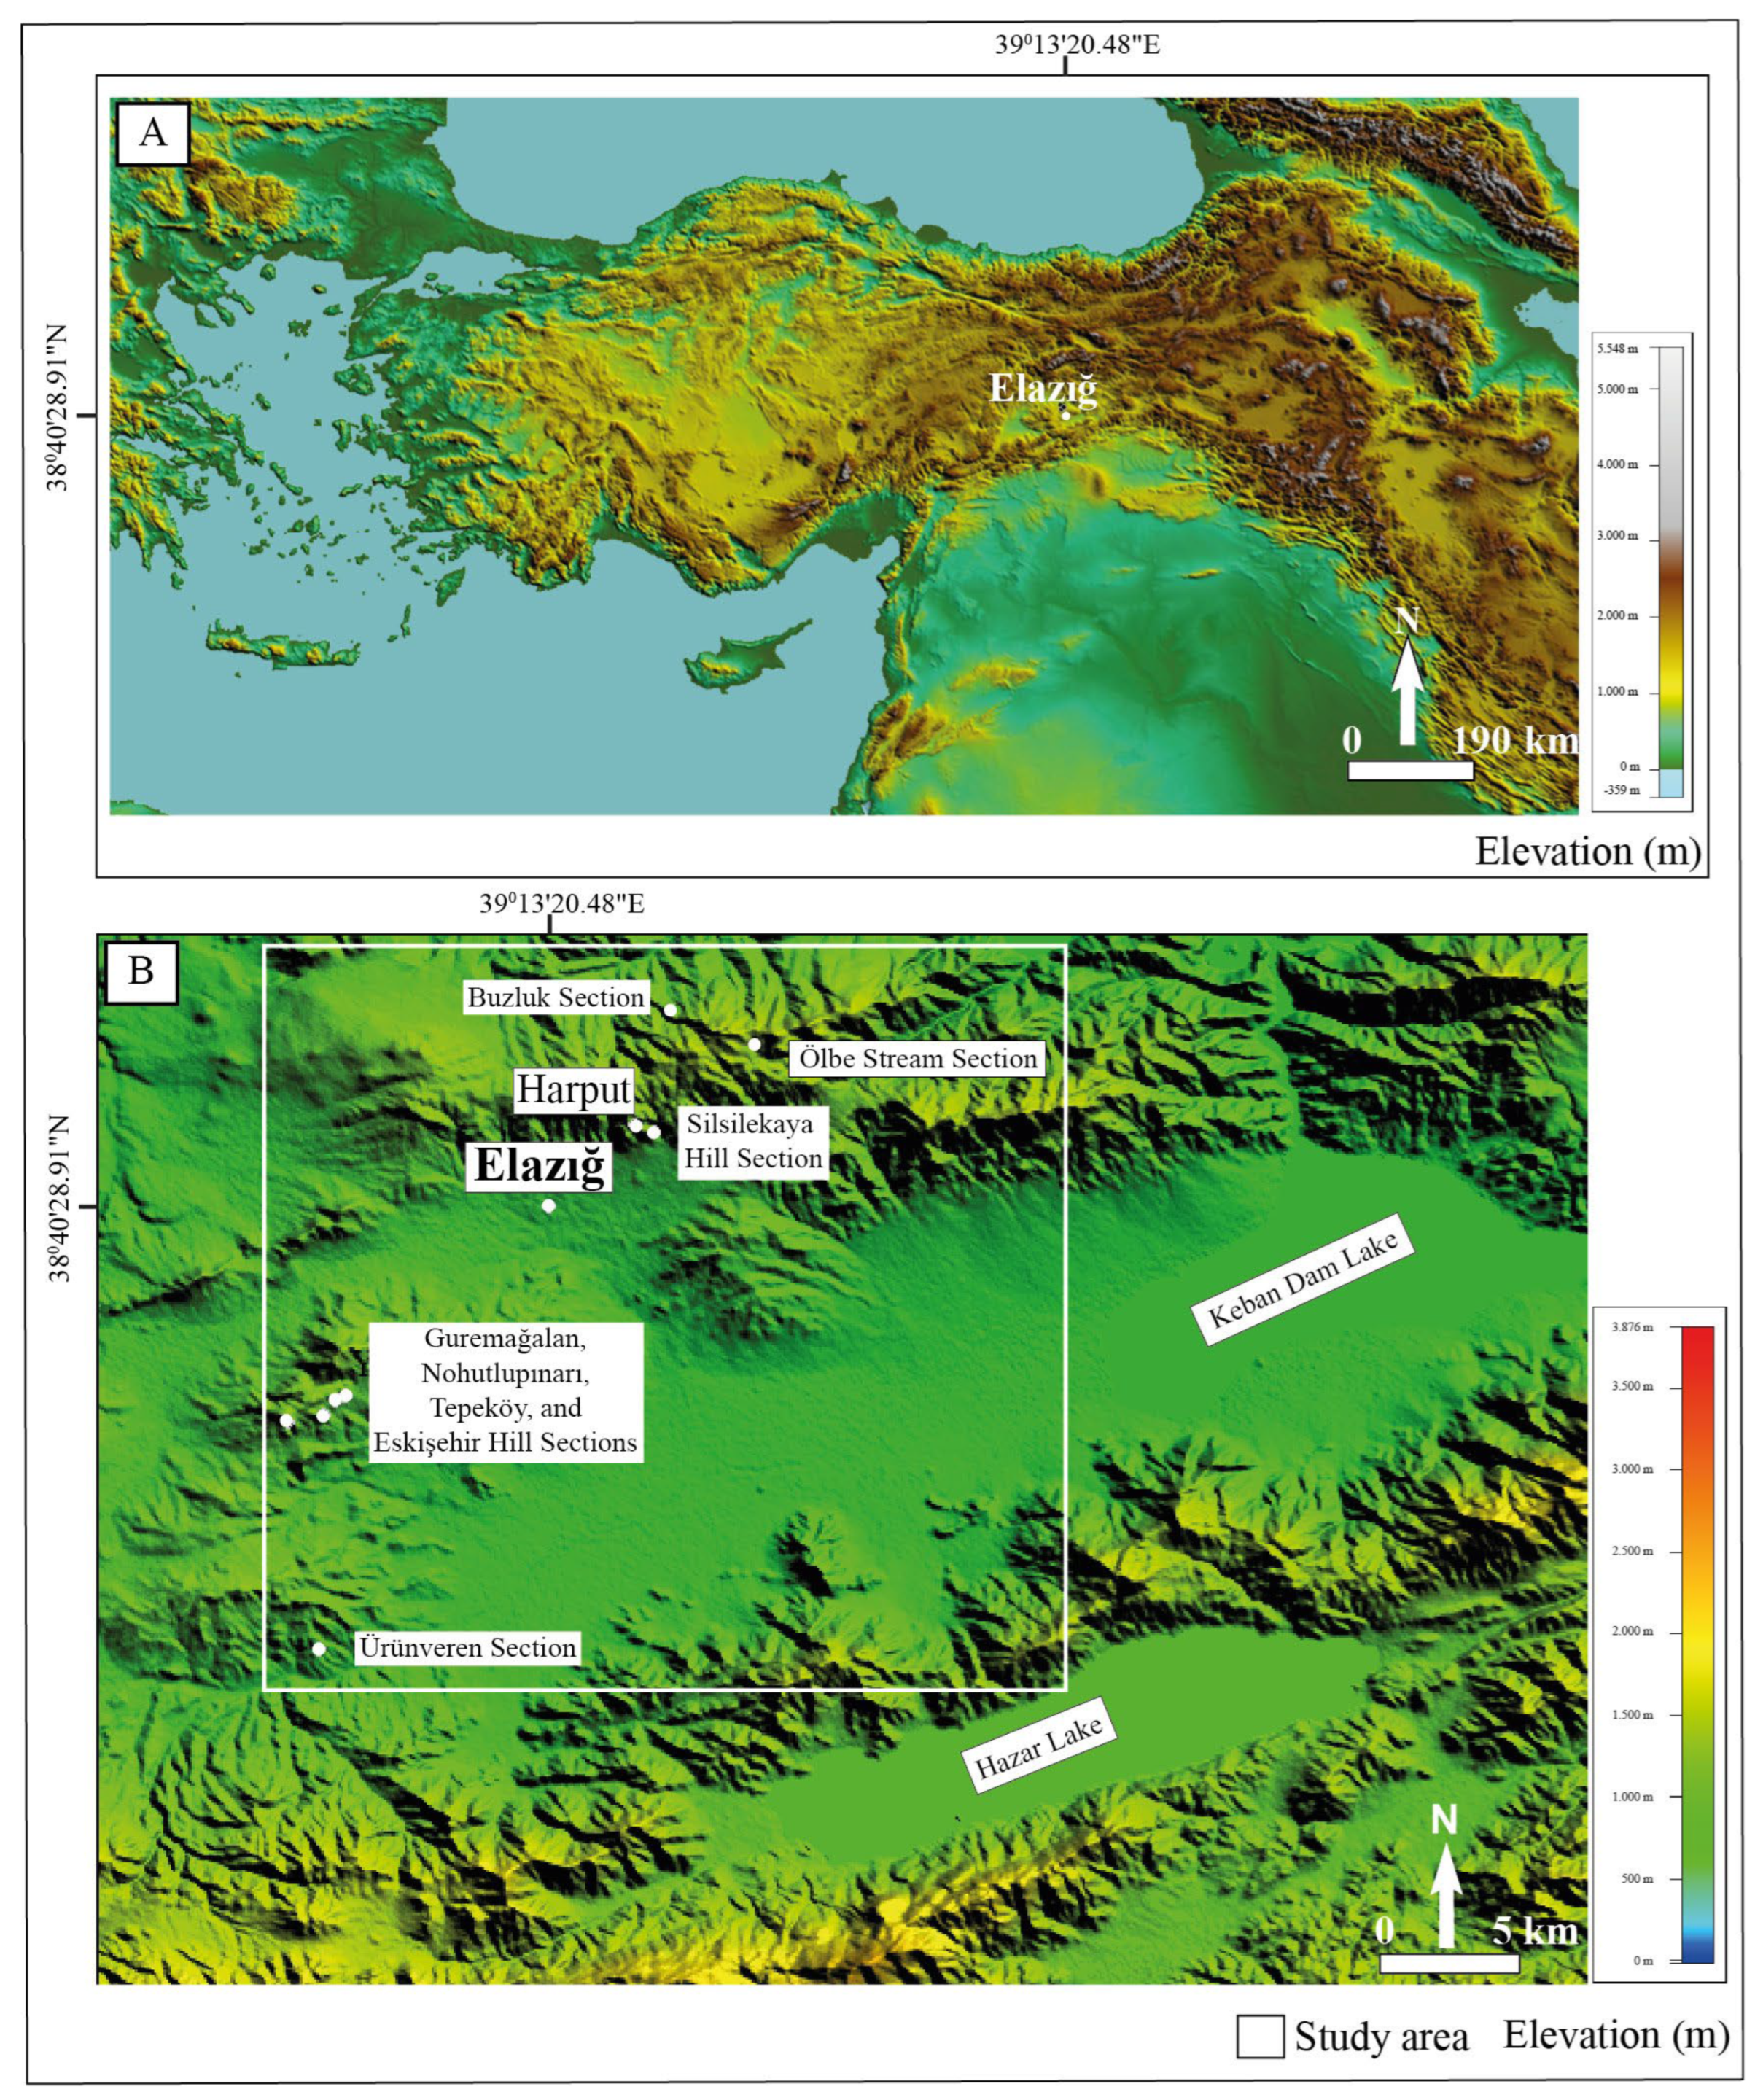
The Harami Formation was first described by Erdoğan [1] in the vicinity of Harami village, north of Gölbaşı district, Adıyaman province. This formation crops out in very limited areas around the Elazığ province in the eastern part of the Taurus Orogenic Belt due to the depositional environmental conditions and the extensive post-late Cretaceous tectonism in the region (Figure 1A,B).
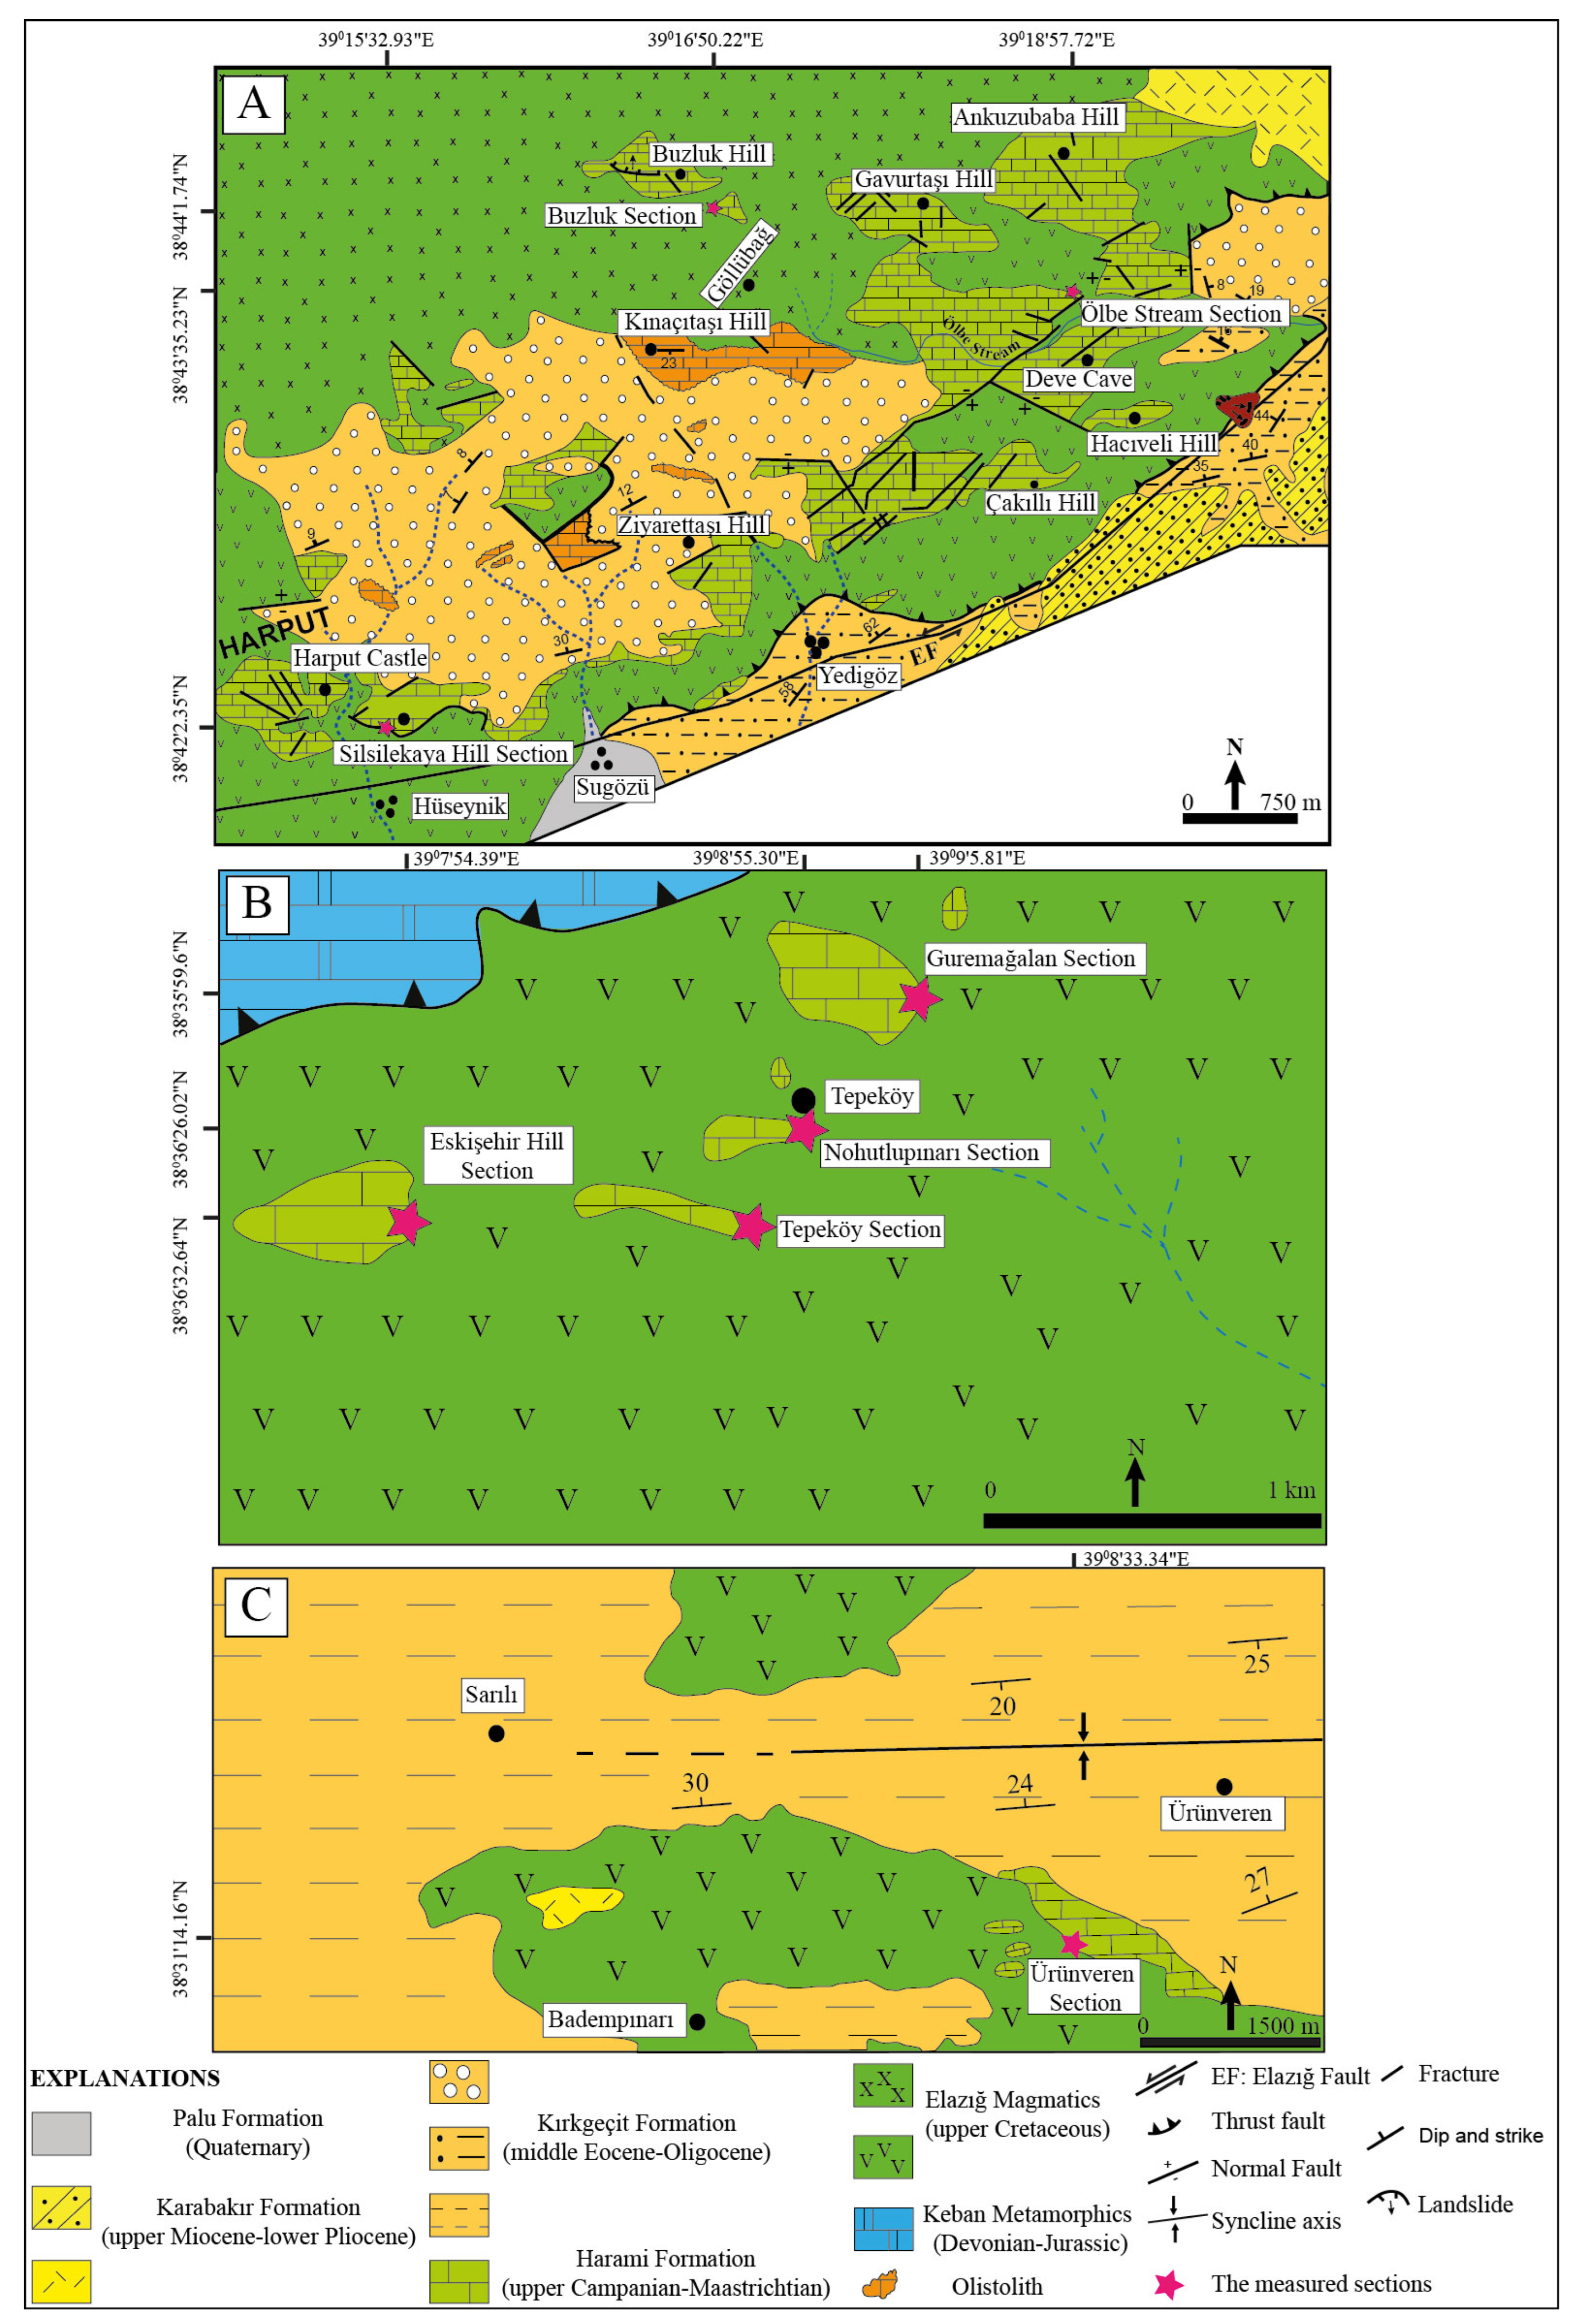
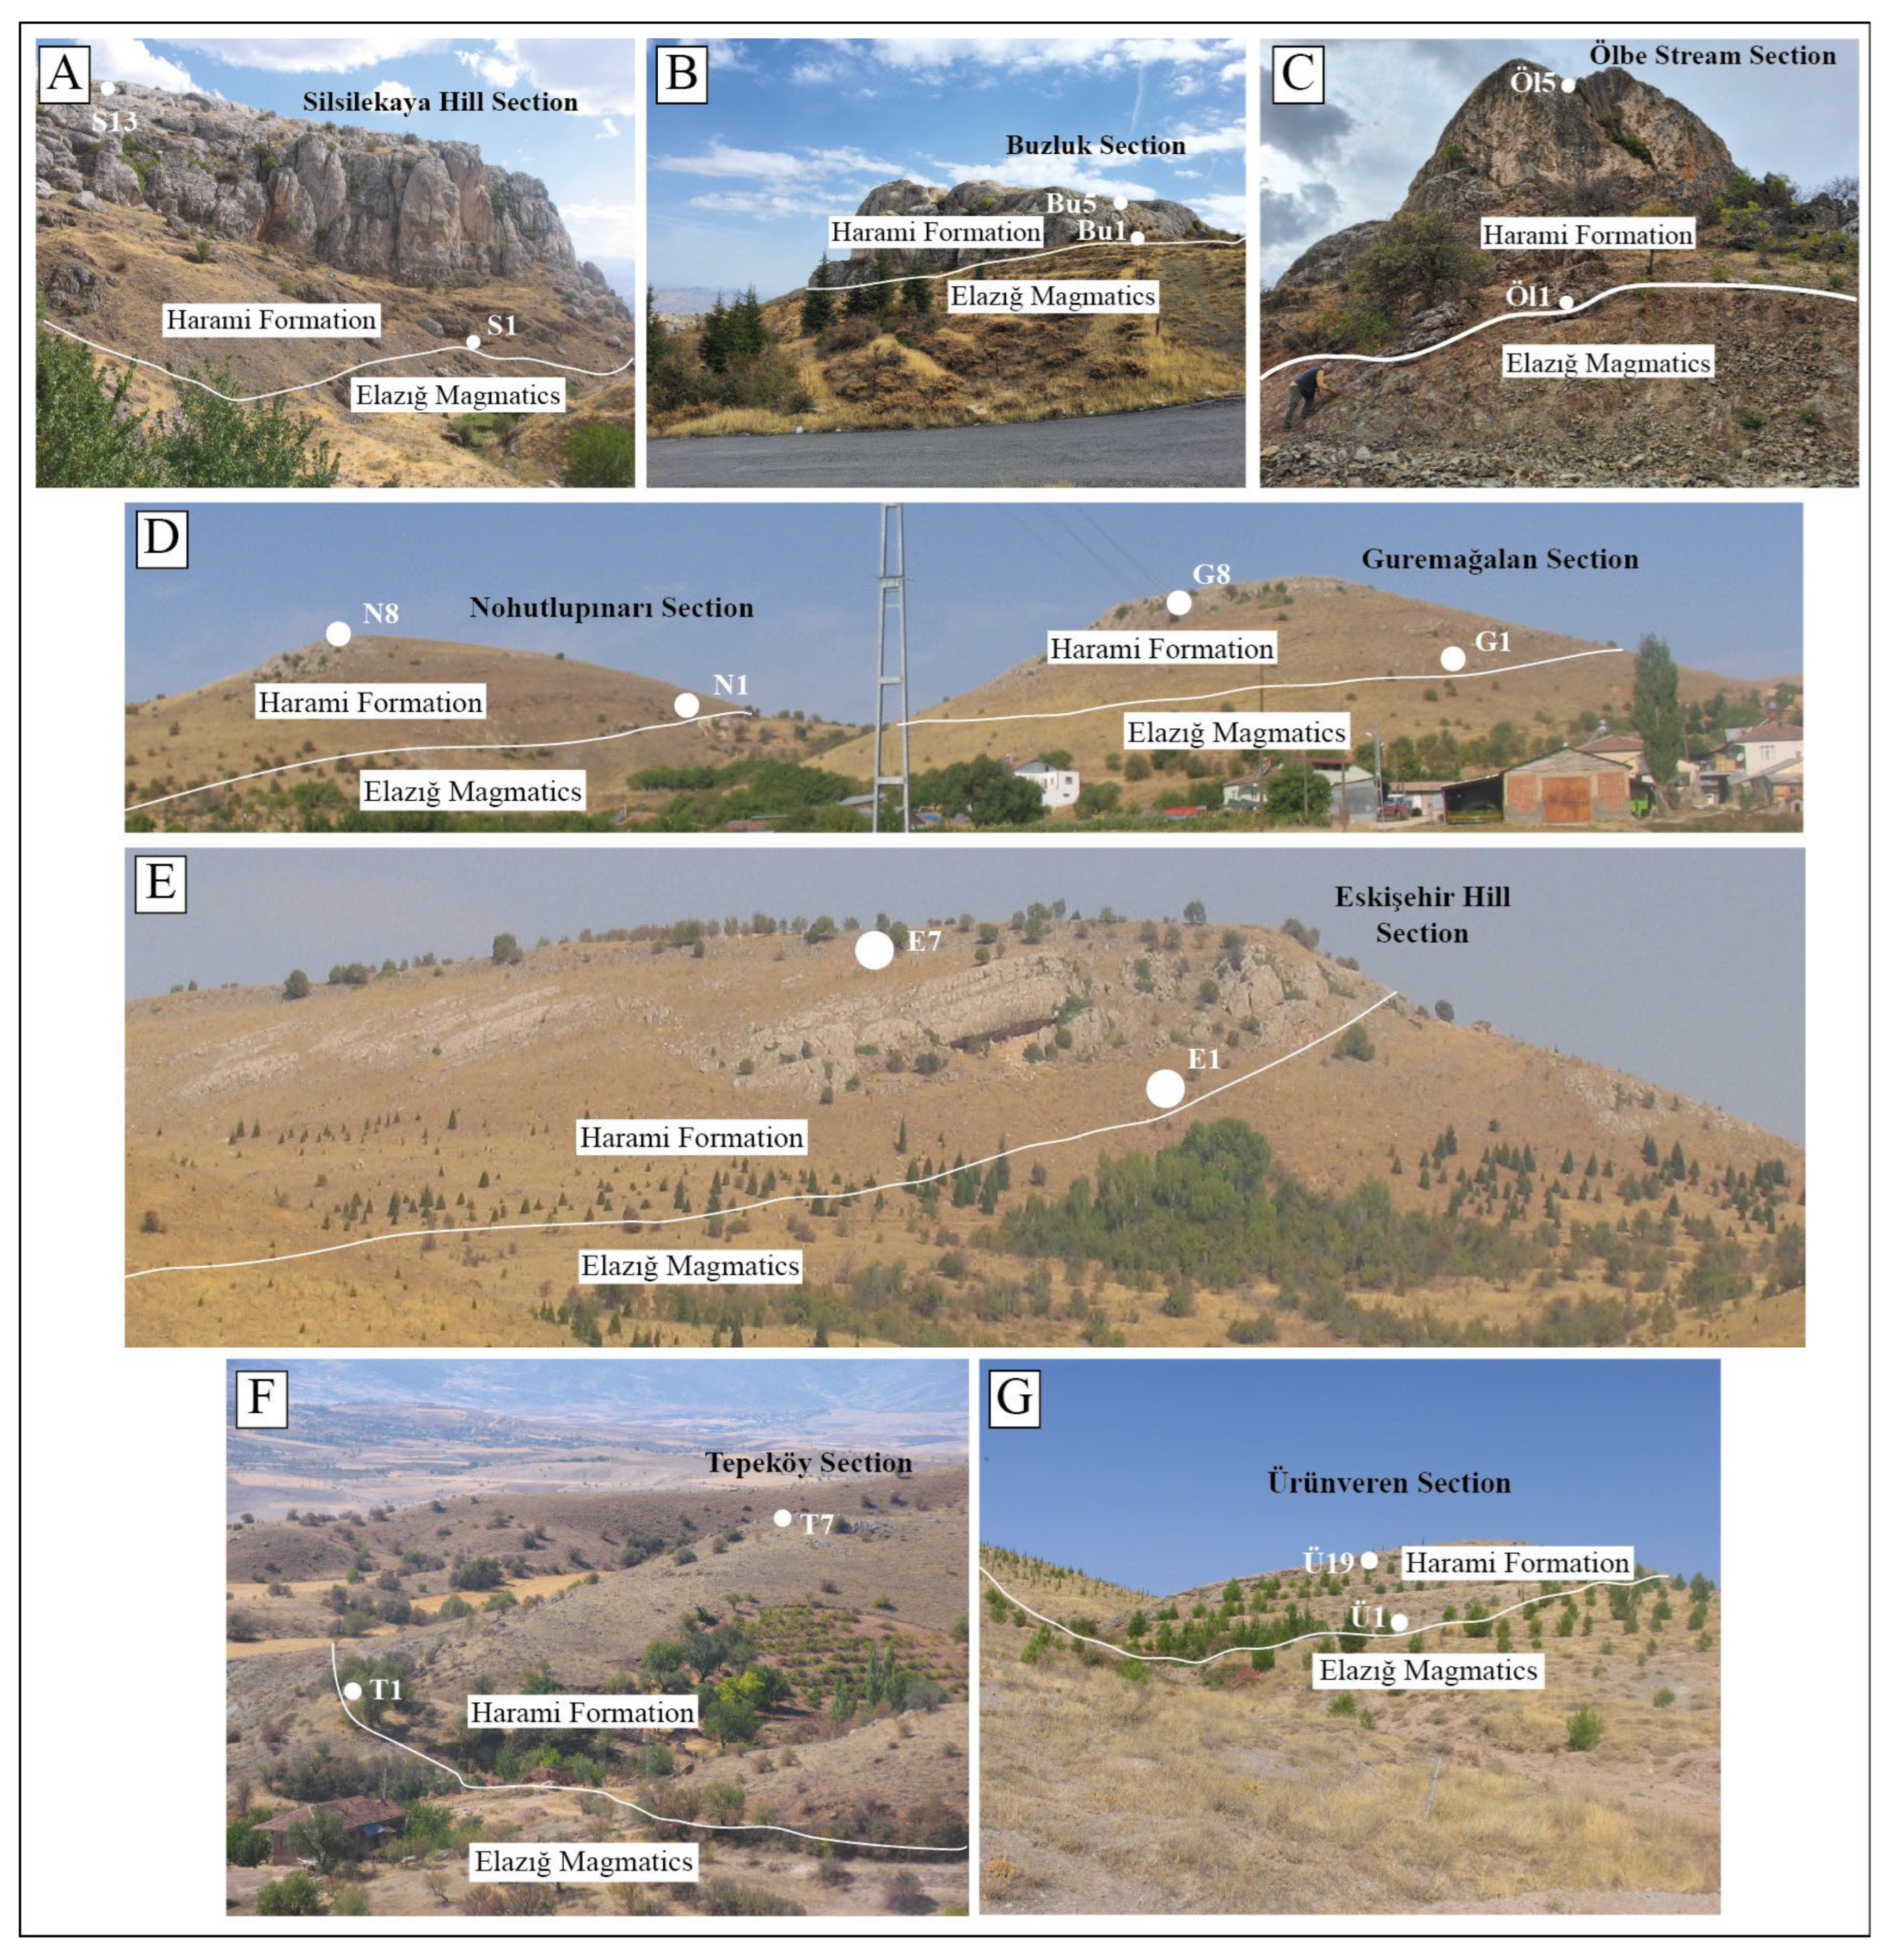
In the study area and its immediate surroundings, units with different lithologies and ages, from the Paleozoic to the Cenozoic, crop out [2,3,4,5,6] (Figure 2A–C). The outcrops of the Harami Formation around Elazığ lie on top of the Elazığ Magmatics, which are a product of an island arc. The formation consists mostly of layered, reddish sandy limestone and limestone in the lower levels and massive limestone in the upper levels; very limited areas of reddish conglomerates and sandstones deposited in a fan delta environment can be observed in very limited areas at its base (Figure 3A–G). While some researchers [4,5], taking into account the limited areas of conglomerate and sandstone, state that the Harami Formation is unconformably overlying the Elazığ Magmatics, there are also studies suggesting that the boundary between the two units is conformable [6].
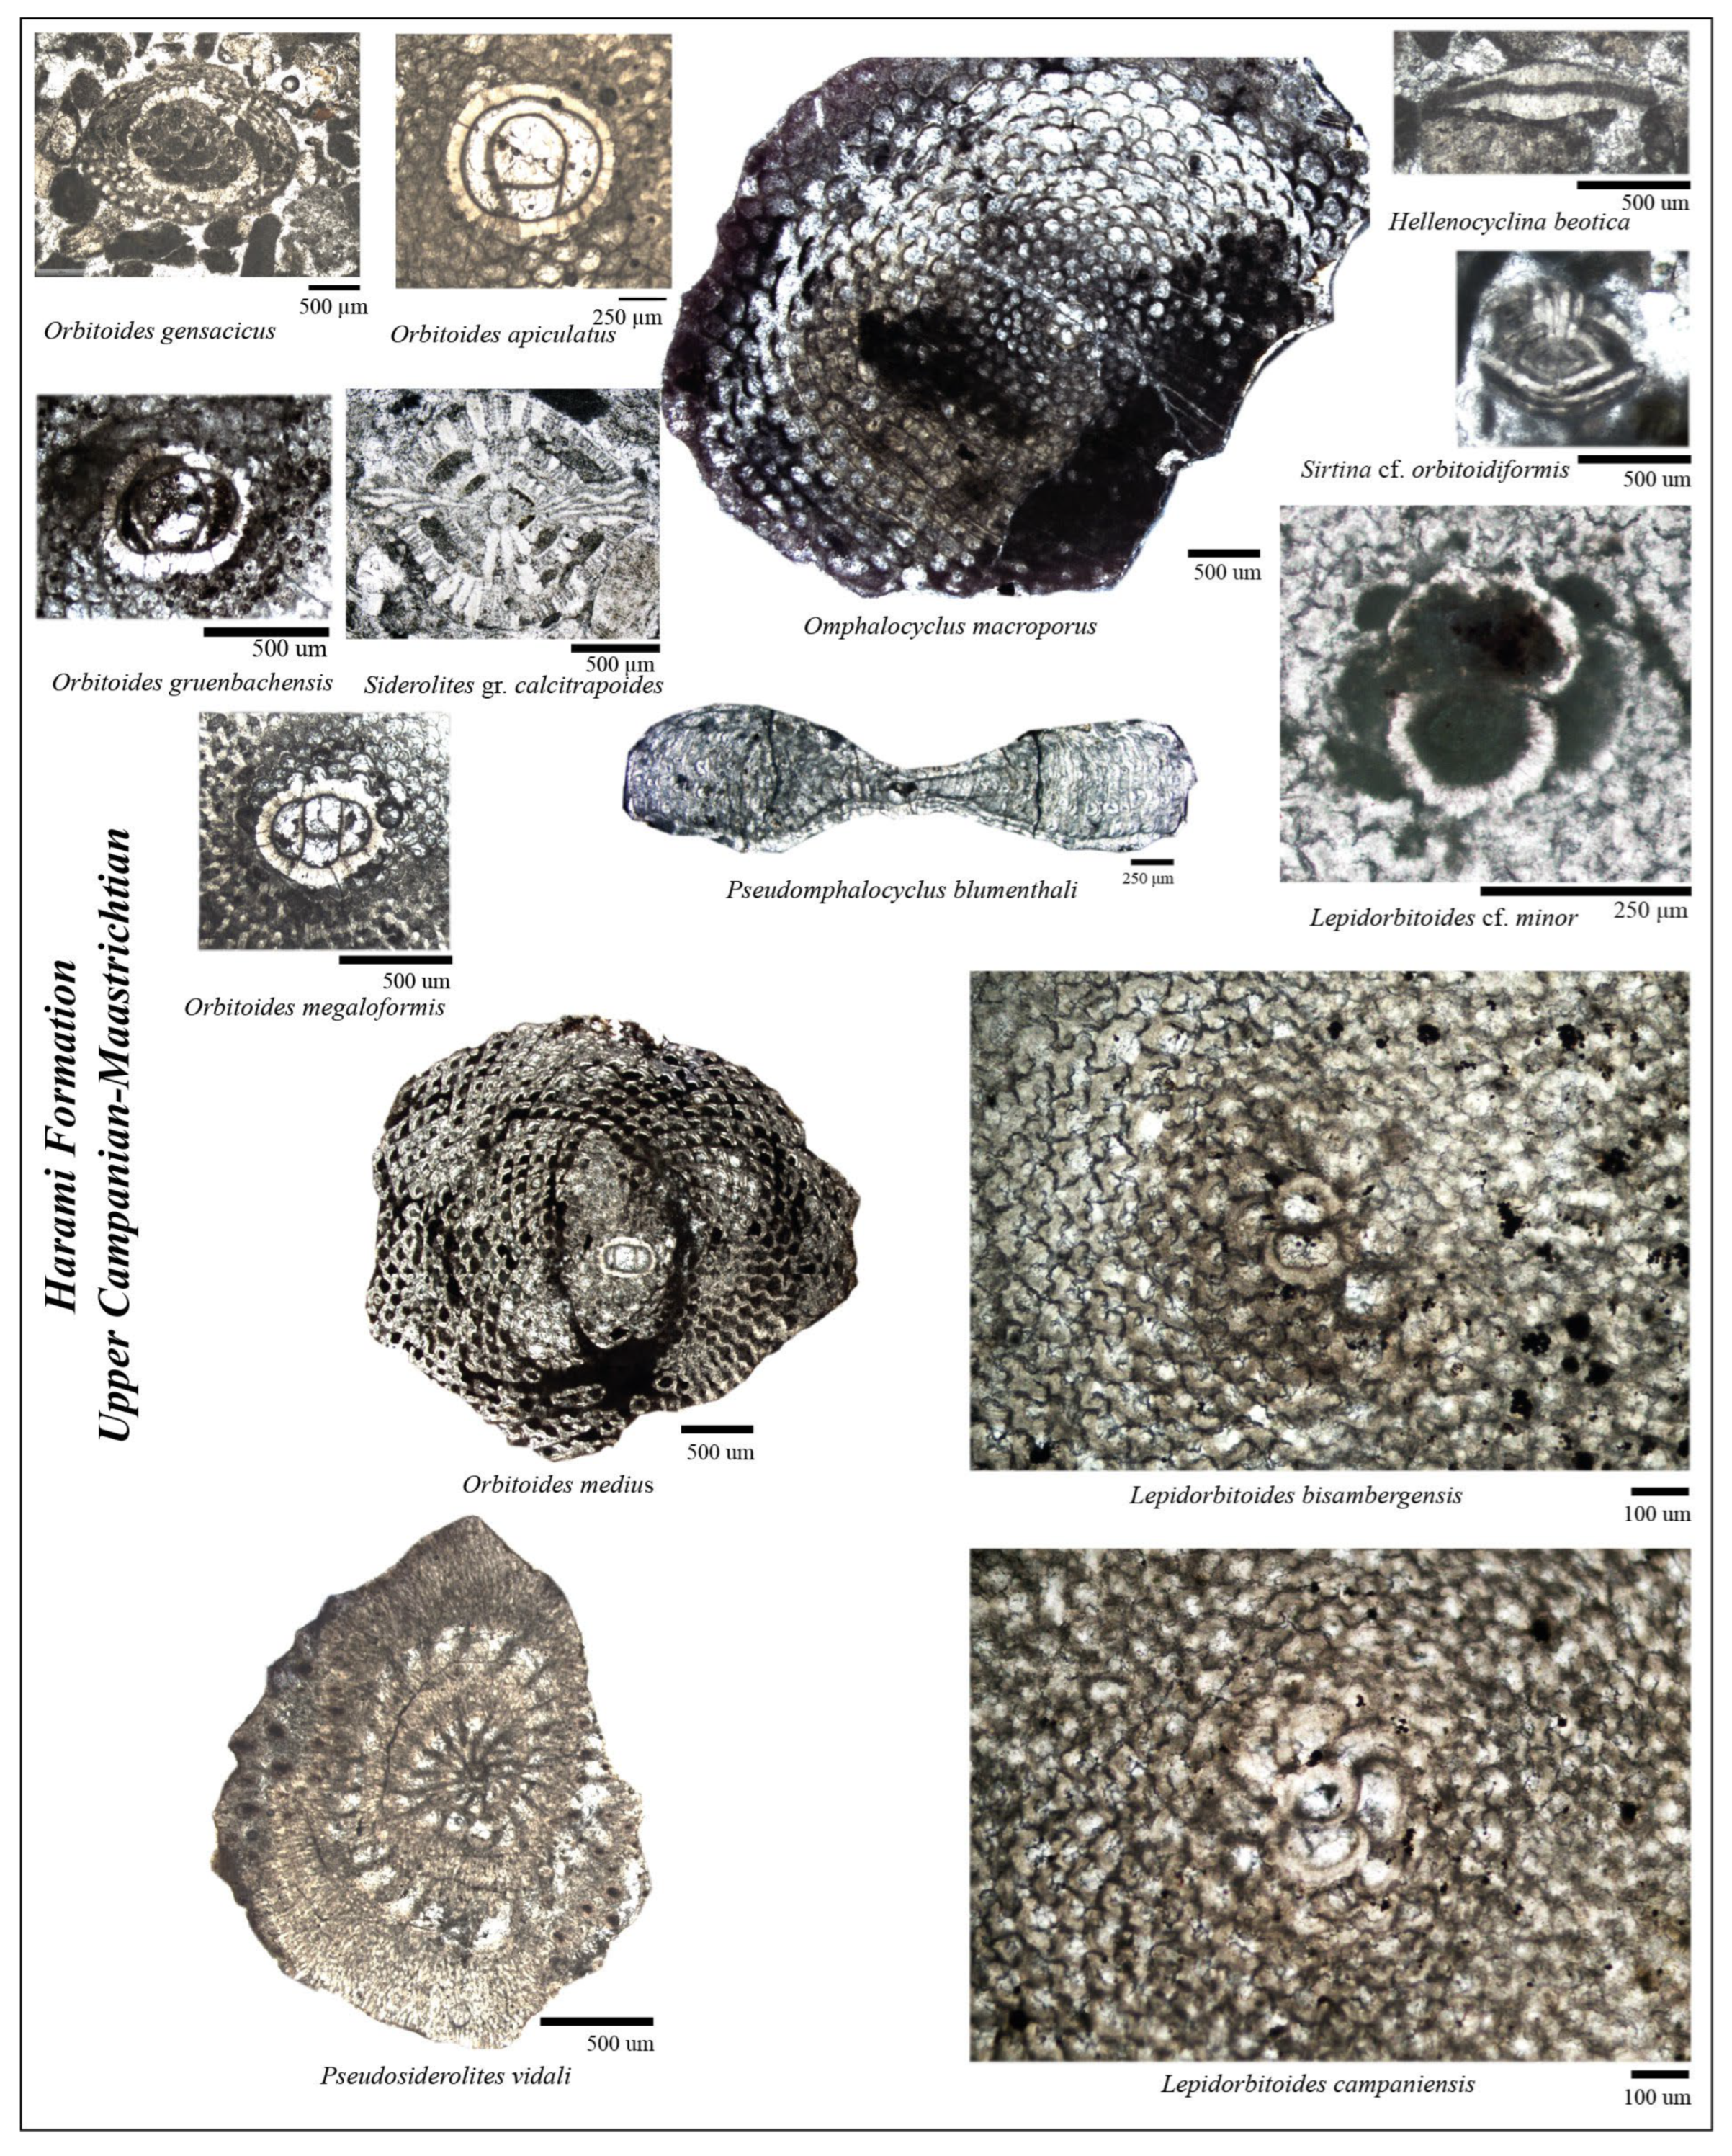
Although research has been conducted on the larger benthic foraminifera content of the Harami Formation outcrops around Elazığ [5,6,7,8,9,10], no study based on geochemical characteristics has been carried out. The formation’s outcrops around Elazığ have been studied under different names, and their ages have been determined based on their benthic foraminifera contents. Data on this subject is summarized in Table 1. According to benthic foraminifera such as Orbitoides medius, O. megaloformis, O. gruenbachensis, O. apiculatus, O. gensacicus, Lepidorbitoides campaniensis, L. bisambergensis, L. cf. minor, Omphalocyclus macroporus, Pseudomphalocyclus blumenthali, Siderolites gr. calcitrapoides, Pseudosiderolites vidali, Hellenocyclina beotica, and Sirtina cf. orbitoidiformis, the age of the Harami Formation is late Campanian–Maastrichtian [9,10] (Figure 4). Late Campanian–Maastrichtian larger benthic foraminifera (LBF) are of great importance from biostratigraphic and evolutionary perspectives on carbonate platforms [11,12,13,14,15,16,17,18,19]. The presence of L. campaniensis indicates a late Campanian age, whereas L. bisambergensis indicates an early Maastrichtian age, and Orbitoides apiculatus, O. gensacicus, Omphalocyclus macroporus, and Pseudomphalocyclus blumenthali indicate a late Maastrichtian age. This study differs from other studies conducted on this unit by presenting both paleontological and geochemical data together, thus offering an integrated perspective on the unit. Previous findings regarding the age and depositional environment of the unit were based on paleontological and sedimentological data. In this study, geochemical analysis results were also utilized to elucidate the formation’s age and the characteristics of the depositional environment in greater detail, and the conclusions drawn from the paleontological data were compared with those derived from the analyses. Thus, the existing gap in the literature has been addressed by obtaining more detailed information regarding the unit’s age and depositional environment. Multidisciplinary studies integrating stratigraphy, biostratigraphy, and geochemistry have been conducted in other regions [20,21,22].
Figure 1. (A) Location of the study area in Türkiye. (B) The locations of the measured sections in the study area (modified from [9]).
Minerals 16 00848 g001
Figure 2. (A) Geological map of the area containing the measured sections at Silsilekaya Hill, Buzluk, and Ölbe Stream (modified from [5]). (B) Geological map of the area containing the measured sections at Guremağalan, Nohutlupınarı, Tepeköy, and Eskişehir Hill (modified from [4]). (C) Geological map of the area containing the measured section at Ürünveren (modified from [6]).
Minerals 16 00848 g002
Figure 3. (AG) Field view of the locations of the measured sections and the boundary relationship between the Elazığ Magmatics and the Harami Formation. (A) Silsilekaya Hill section. (B) Buzluk section. (C) Ölbe Stream section. (D) Nohutlupınarı and Guremağalan sections. (E) Eskişehir Hill section. (F) Tepeköy section. (G) Ürünveren section. Some of the measured section views (A,C,DG) are from Kayğılı [9] and Kayğılı et al. [10] [CC by 4].
Minerals 16 00848 g003
Figure 4. Larger benthic foraminifera of the Harami Formation. Views of some larger benthic foraminifera are from Kayğılı [9] and Kayğılı et al. [10] [CC by 4].
Minerals 16 00848 g004

2. Materials and Methods

Fieldwork in this study involved measuring stratigraphic sections, such as Eskişehir Hill (E), Tepeköy (T), Nohutlupınarı (N), Guremağalan (G), Silsilekaya Hill (S), Ürünveren (Ü), Buzluk (Bu) and Ölbe Stream (Öl) in the upper Campanian–Maastrichtian Harami Formation outcrops located northeast and southwest of Elazığ city, and collecting rock, Orbitoides, and rudist samples along the same sections (Table 2). Thin sections were prepared from loose and rock samples were also gathered from the same sites. The genus/species determination of benthic foraminifera in thin sections prepared from rock and loose samples was carried out in previous studies [9,10].
Radiogenic isotope analysis was conducted to determine the age of the Harami Formation; ICP-MS and stable isotope analyses were performed to obtain information regarding the depositional environment and climate, and ICP-MS, XRF, and SEM-EDS analyses were carried out to indirectly determine the mineralogical composition of the unit’s fossil content.
Radiogenic isotope (87Sr/86Sr), ICP-MS, and XRF analyses require samples of a specific weight (5–10 g). Due to the lack of a sufficient quantity of samples for Orbitoides and rudist, these analyses could only be performed on 10 samples. However, as the sample weight was suitable for stable isotope analyses, they were conducted on 50 samples from along the measured sections.
Orbitoides, rudist, and rock samples taken along the measured stratigraphic sections were selected and ground in the laboratory, and stable (δ13C and δ18O), radioactive isotope (87Sr/86Sr), ICP-MS, XRF, and SEM-EDS analyses were performed on these samples at the METU, WSS, and MTA laboratories. Information regarding the analysis methods applied in these laboratories is provided below.
The determination of δ13C and δ18O isotope ratios in carbonate samples was carried out at the METU laboratory using the Gas Bench-Continuous Flow Isotope Ratio Mass Spectrometry technique (Delta Plus XP Isotope Ratio Mass Spectrometer–Thermo Finnigan, Thermo Fisher Scientific, Waltham, MA, USA). Samples weighing 0.2–0.6 mg were placed in the sample vials. The samples were allowed to react with 99% ortho-phosphoric acid (Merck, Darmstadt, Germany) (approximately 0.1 mL) at a temperature of approximately 70 °C on the auto-sampler tray for about two hours. The CO2 gas released as a result of this reaction was purified by the Gas Bench interface and then sent to the mass spectrometer for isotope separation. Ion ratios for CO2 gas were converted into raw isotopic ratios by the ISODAT software (version 3.0). In the analyses, the “NBS19 Limestone (NIST)” standard (δ13C: 1.95‰ and δ18O: −2.20‰) was analyzed alongside the samples for every experimental set and used to convert the raw isotope ratios determined by the instrument into true isotopic values.
In stable isotope analyses conducted at the WSS laboratory, carbon and oxygen isotopes of carbonate rocks were measured using a Gas Bench II coupled with a DELTA™ Q mass spectrometer (Thermo Scientific™, Waltham, MA, USA) via the phosphoric acid digestion method. Approximately 0.2 mg of 200-mesh carbonate powder was placed in a 12 mL headspace vial. After purging air with high-purity helium (He, 99.999%), 0.1 mL of anhydrous phosphoric acid (H3PO4, 100% purity) was injected. Following an 8-h reaction at 70 °C, the generated CO2 was extracted by an auto-sampler (Triplus, Thermo Fisher Scientific, Waltham, MA, USA), separated using a gas chromatography column (GC column at 50 °C), and then analyzed with the DELTA™ Q mass spectrometer to obtain carbon and oxygen isotope ratios relative to the laboratory reference gas. Linear calibration was performed using international and national reference standards including NBS-18, IAEA-603, GBW04405, GBW04406, GBW04416 and GBW04417. The standard deviations of δ13C-VPDB and δ18O-VPDB were better than 0.2‰.
The method specified in [23] was followed for the strontium analyses conducted at METU. For this analysis, approximately 80 milligrams of each sample were weighed and transferred into PFA vials. The samples were first placed in deionized water and, following the dissolution process, dried to near-dryness. Subsequently, they were kept in 4 mL of 14 N HNO3 for one day and completely dissolved on a hot plate. Following evaporation, the samples were completely dissolved on a hot plate by keeping them in 4 mL of 6 N HCl for one day. The samples were then evaporated to near-dryness on the hot plate, taken up in 1 mL of 2.5 N HCl, and prepared for chromatography. Strontium was separated in Teflon columns using Bio-Rad AG50 W-X8 (Bio-Rad Laboratories, Hercules, CA, USA) (100–200 mesh) resin and 2.5 N HCl eluent (2 mL volume). The strontium sample was loaded onto a single Re filament using a Ta activator and 0.005 N H3PO4, and measurements were performed in static mode. 87Sr/86Sr data were normalized to 87Sr/86Sr = 0.1194. During measurement, the Sr NBS 987 standard yielded a value of 0.710260 ± 10 (n = 9). No bias correction was applied to the strontium isotope ratio measurement results. Isotope ratio measurements were performed using multi-collection on a Triton Thermal Ionization Mass Spectrometer (Thermo Fisher Scientific, Waltham, MA, USA). Analytical uncertainties are at the 2-sigma level.
Sr isotope analyses were performed on a Neptune Plus MC-ICP-MS (Thermo Fisher Scientific, Dreieich, Germany) at the WSS. The Neptune Plus, a double-focusing MC-ICP-MS, was equipped with seven fixed electron-multiplier ICs, and nine Faraday cups fitted with 1011 Ω resistors. The faraday collector configuration of the mass system was composed of an array from L4 to H3 to monitor 83Kr+, 167Er++, 84Sr+, 85Rb+, 86Sr+, 173Yb++, 87Sr+, 88Sr+. The large dry interface pump (120 m3 h−1 pumping speed), the newly designed H skimmer cone and the standard sample cone were used to increase the instrumental sensitivity. A Sr single element solution from Alfa (Alfa Aesar, Karlsruhe, Germany) was used to optimize the instrument’s operating parameters. An aliquot of the international standard solution of 200 μg L−1 NIST SRM 987 was regularly used to evaluate the reproducibility and accuracy of the instrument. Typically, the signal intensities of 88Sr in NIST 987 were >~7.0 V. The Sr isotopic data were acquired in the static mode at low resolution. The routine data acquisition consisted of ten blocks of 10 cycles. The total time of one measurement lasted about 7 min.
Trace element and REE analysis of whole rocks was conducted on an Agilent 7700e ICP-MS (Agilent Technologies, Santa Clara, CA, USA) at the WSS. The detailed sample-digesting procedure was as follows: (1) sample powder (200 mesh) was placed in an oven at 105 °C for drying for 12 h; (2) 50 mg of sample powder was accurately weighed and placed in a Teflon bomb; (3) 1 mL HNO3 and 1 mL HF were slowly added into the Teflon bomb; (4) the Teflon bomb was placed in a stainless steel pressure jacket and heated to 190 °C in an oven for >24 h; (5) after cooling, the Teflon bomb was opened, placed on a hot plate at 140 °C and evaporated to incipient dryness, and then 1 mL of HNO3 was added and evaporated to dryness again; (6) 1 mL of HNO3, 1 mL of MQ water and 1 mL of an internal standard solution of 1 ppm was added, and the Teflon bomb was resealed and placed in the oven at 190 °C for >12 h; and (7) the final solution was transferred to a polyethylene bottle and diluted to 100 g by the addition of 2% HNO3.
In the XRF analysis conducted at the WSS laboratory, sample pretreatment of whole rock for major element analysis was performed via the melting method. The flux was a mixture of lithium tetraborate, lithium metaborate, and lithium fluoride (45:10:5). Ammonium nitrate and lithium bromide were used as oxidants and release agents, respectively. The melting temperature was 1050 °C, and the melting time was 15 min. A Zsx Primus II wavelength dispersive X-ray fluorescence spectrometer (XRF) produced by RIGAKU (Tokyo, Japan), was used to analyze major elements in the whole rock. The X-ray tube had a 4.0 Kw end window Rh target, and the test conditions were a voltage of 50 kV and a current of 60 mA; all major element analysis lines were kα, and the standard curve used the national standard material rock standard sample GBW07101-14, soil standard sample GBW07401-08 and stream sediment standard sample GBW07302-12. The data were corrected using the theoretical α coefficient method. The relative standard deviation (RSD) was less than 2%.
In the SEM-EDS analysis conducted at the MTA laboratory, the samples were first coated with gold. Under high vacuum conditions, secondary electron, backscattered electron, or mixed signal images were taken from the sample surface and photographed. Non-standard semi-quantitative point analysis or line analysis was performed at the desired location. Photographs and EDS analysis results were recorded.

3. Results

3.1. Stable Isotope Analysis Findings

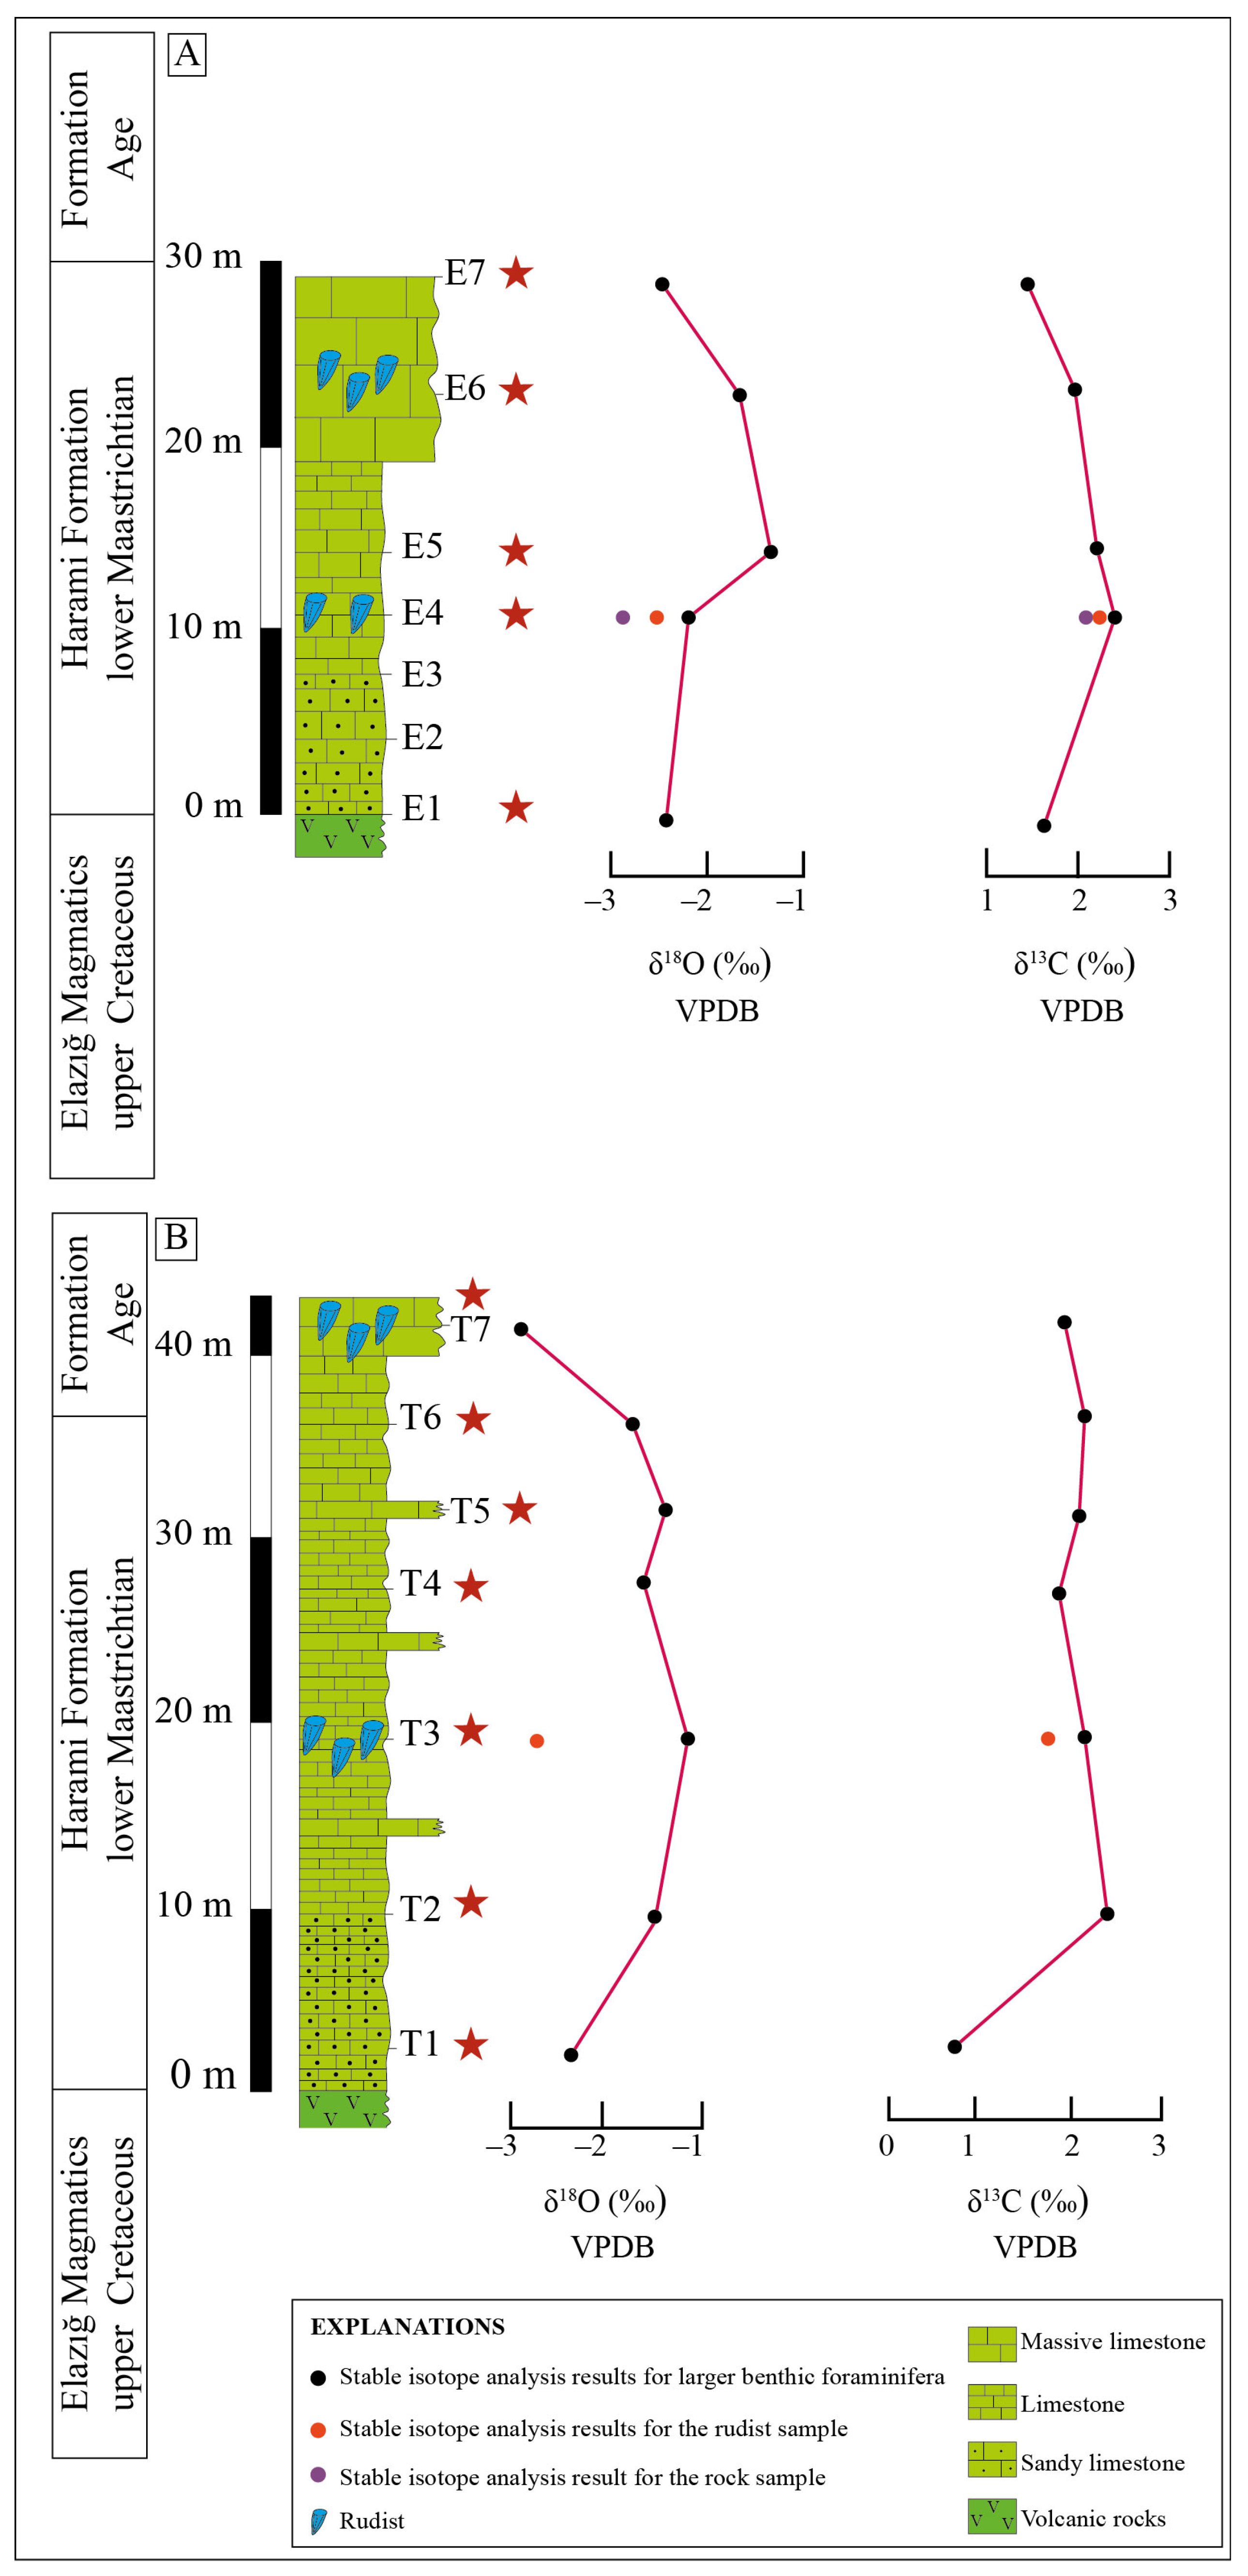
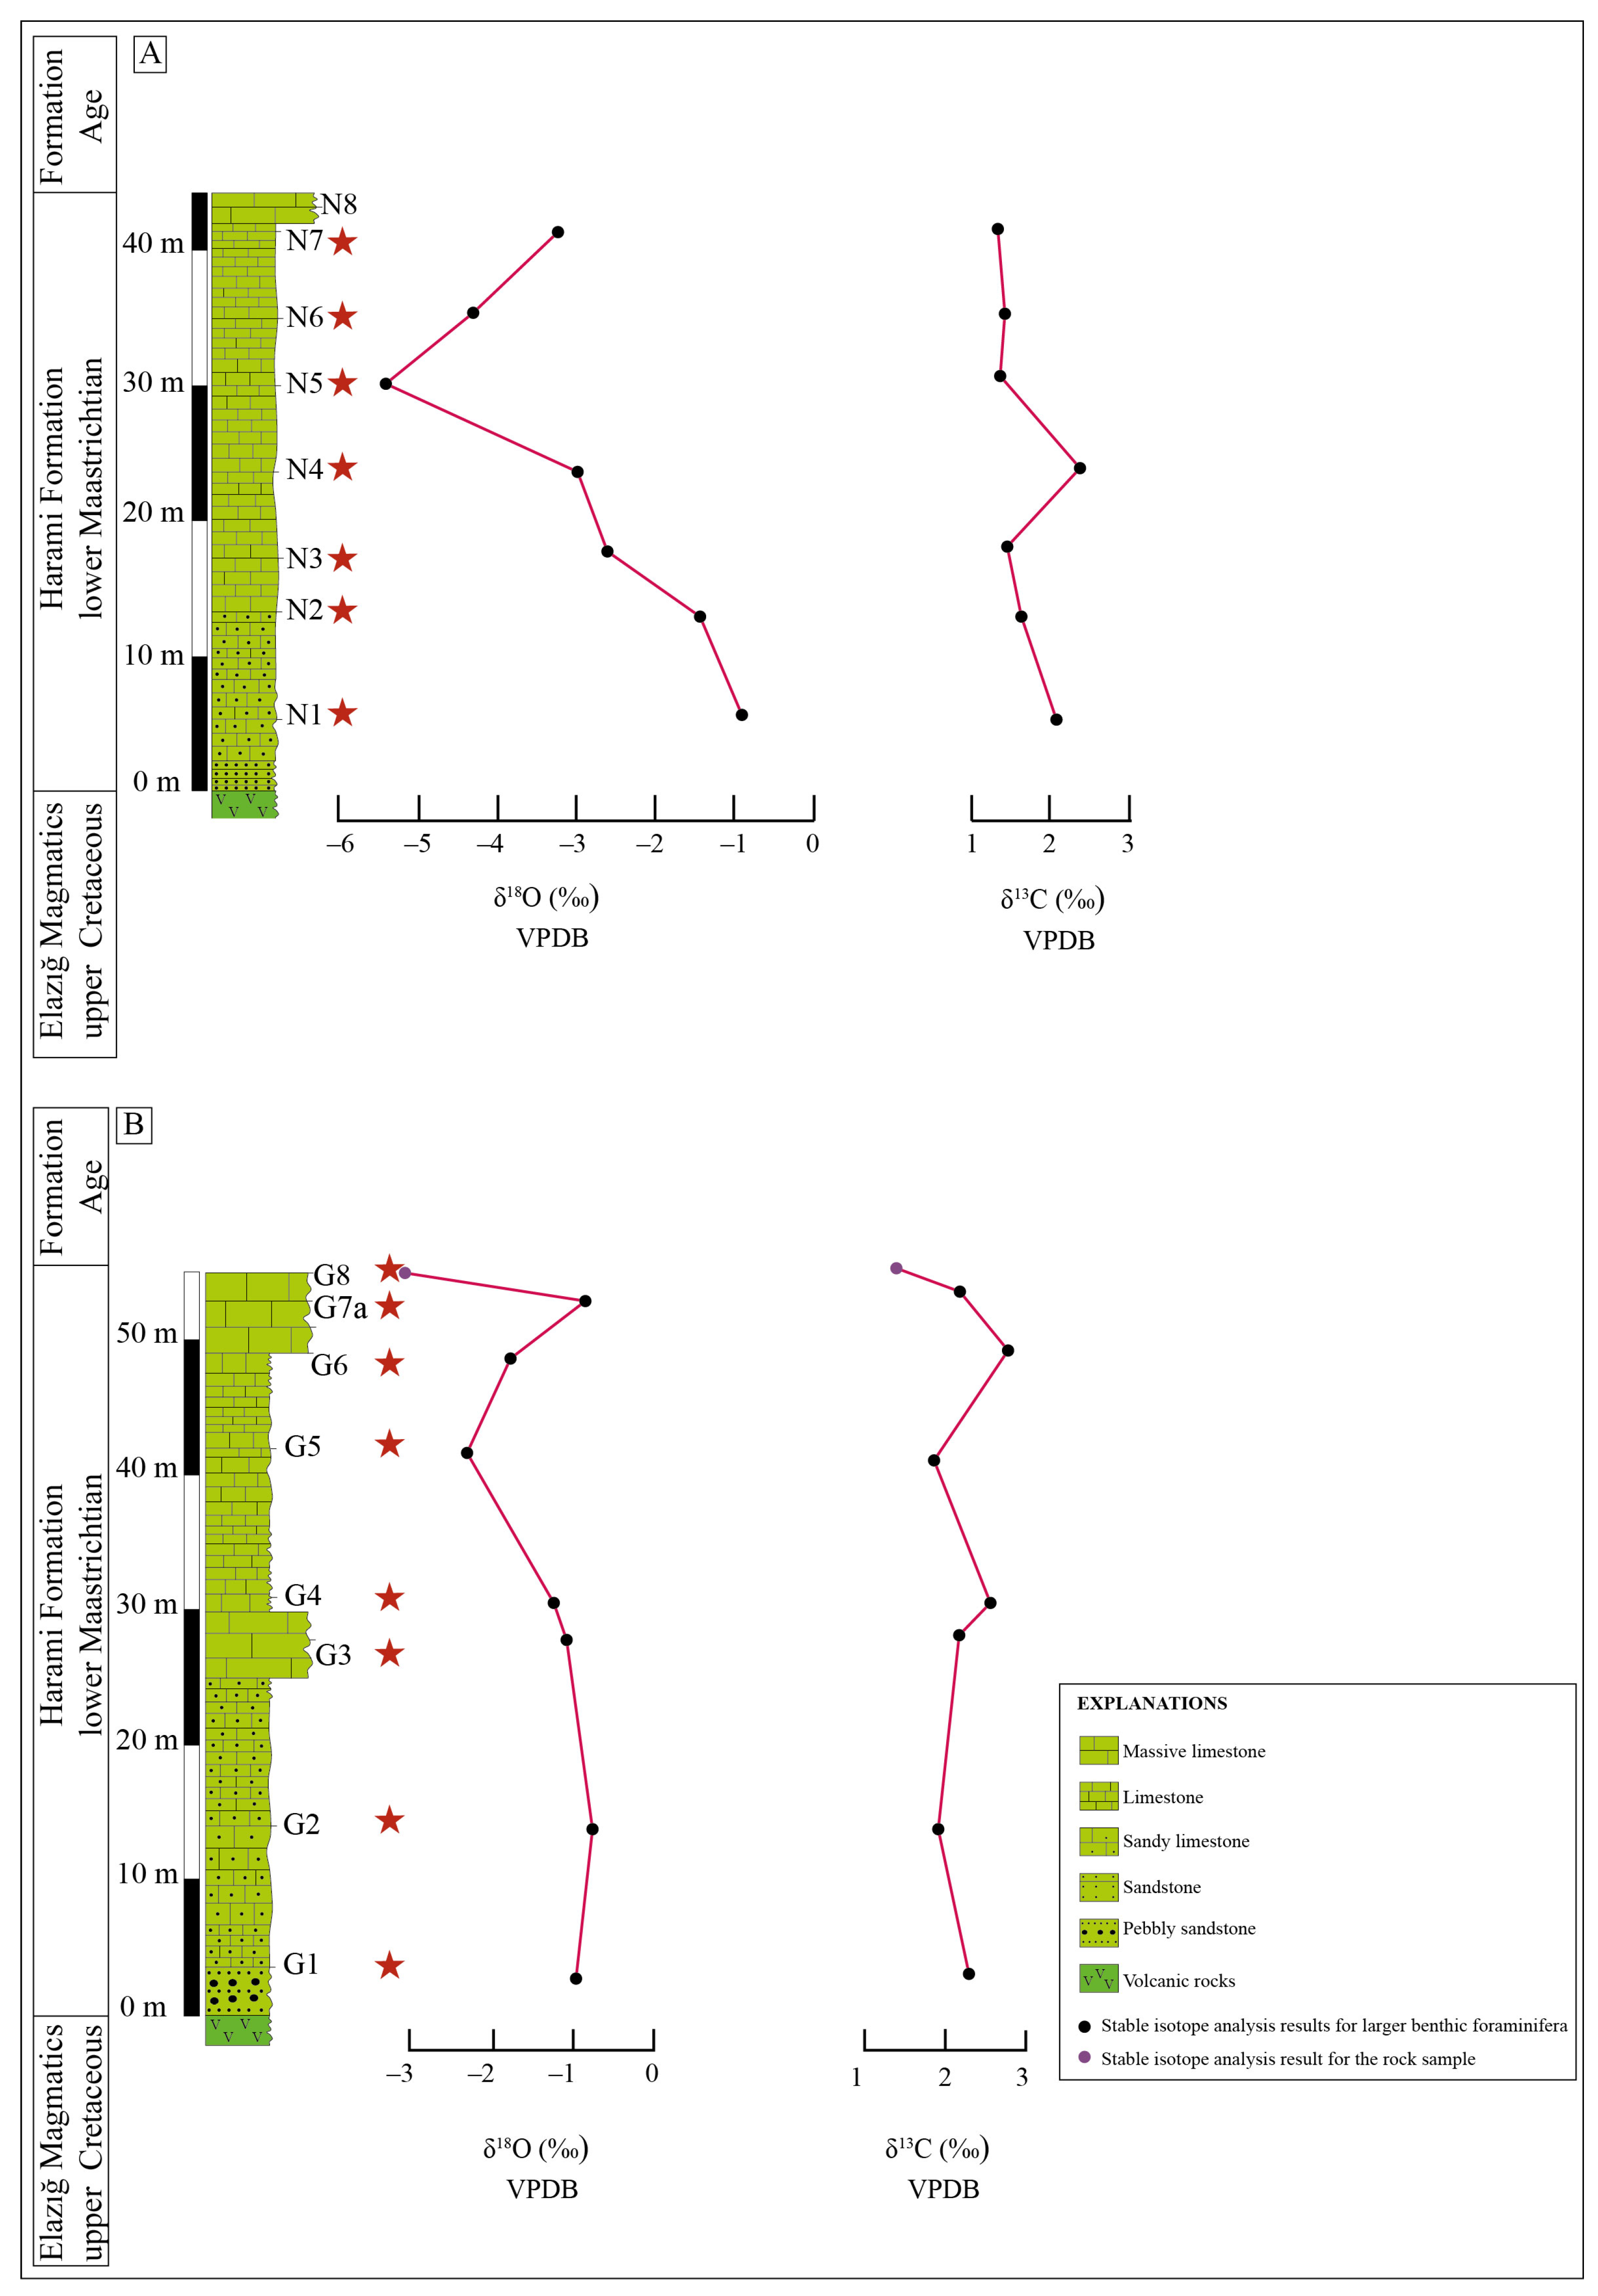
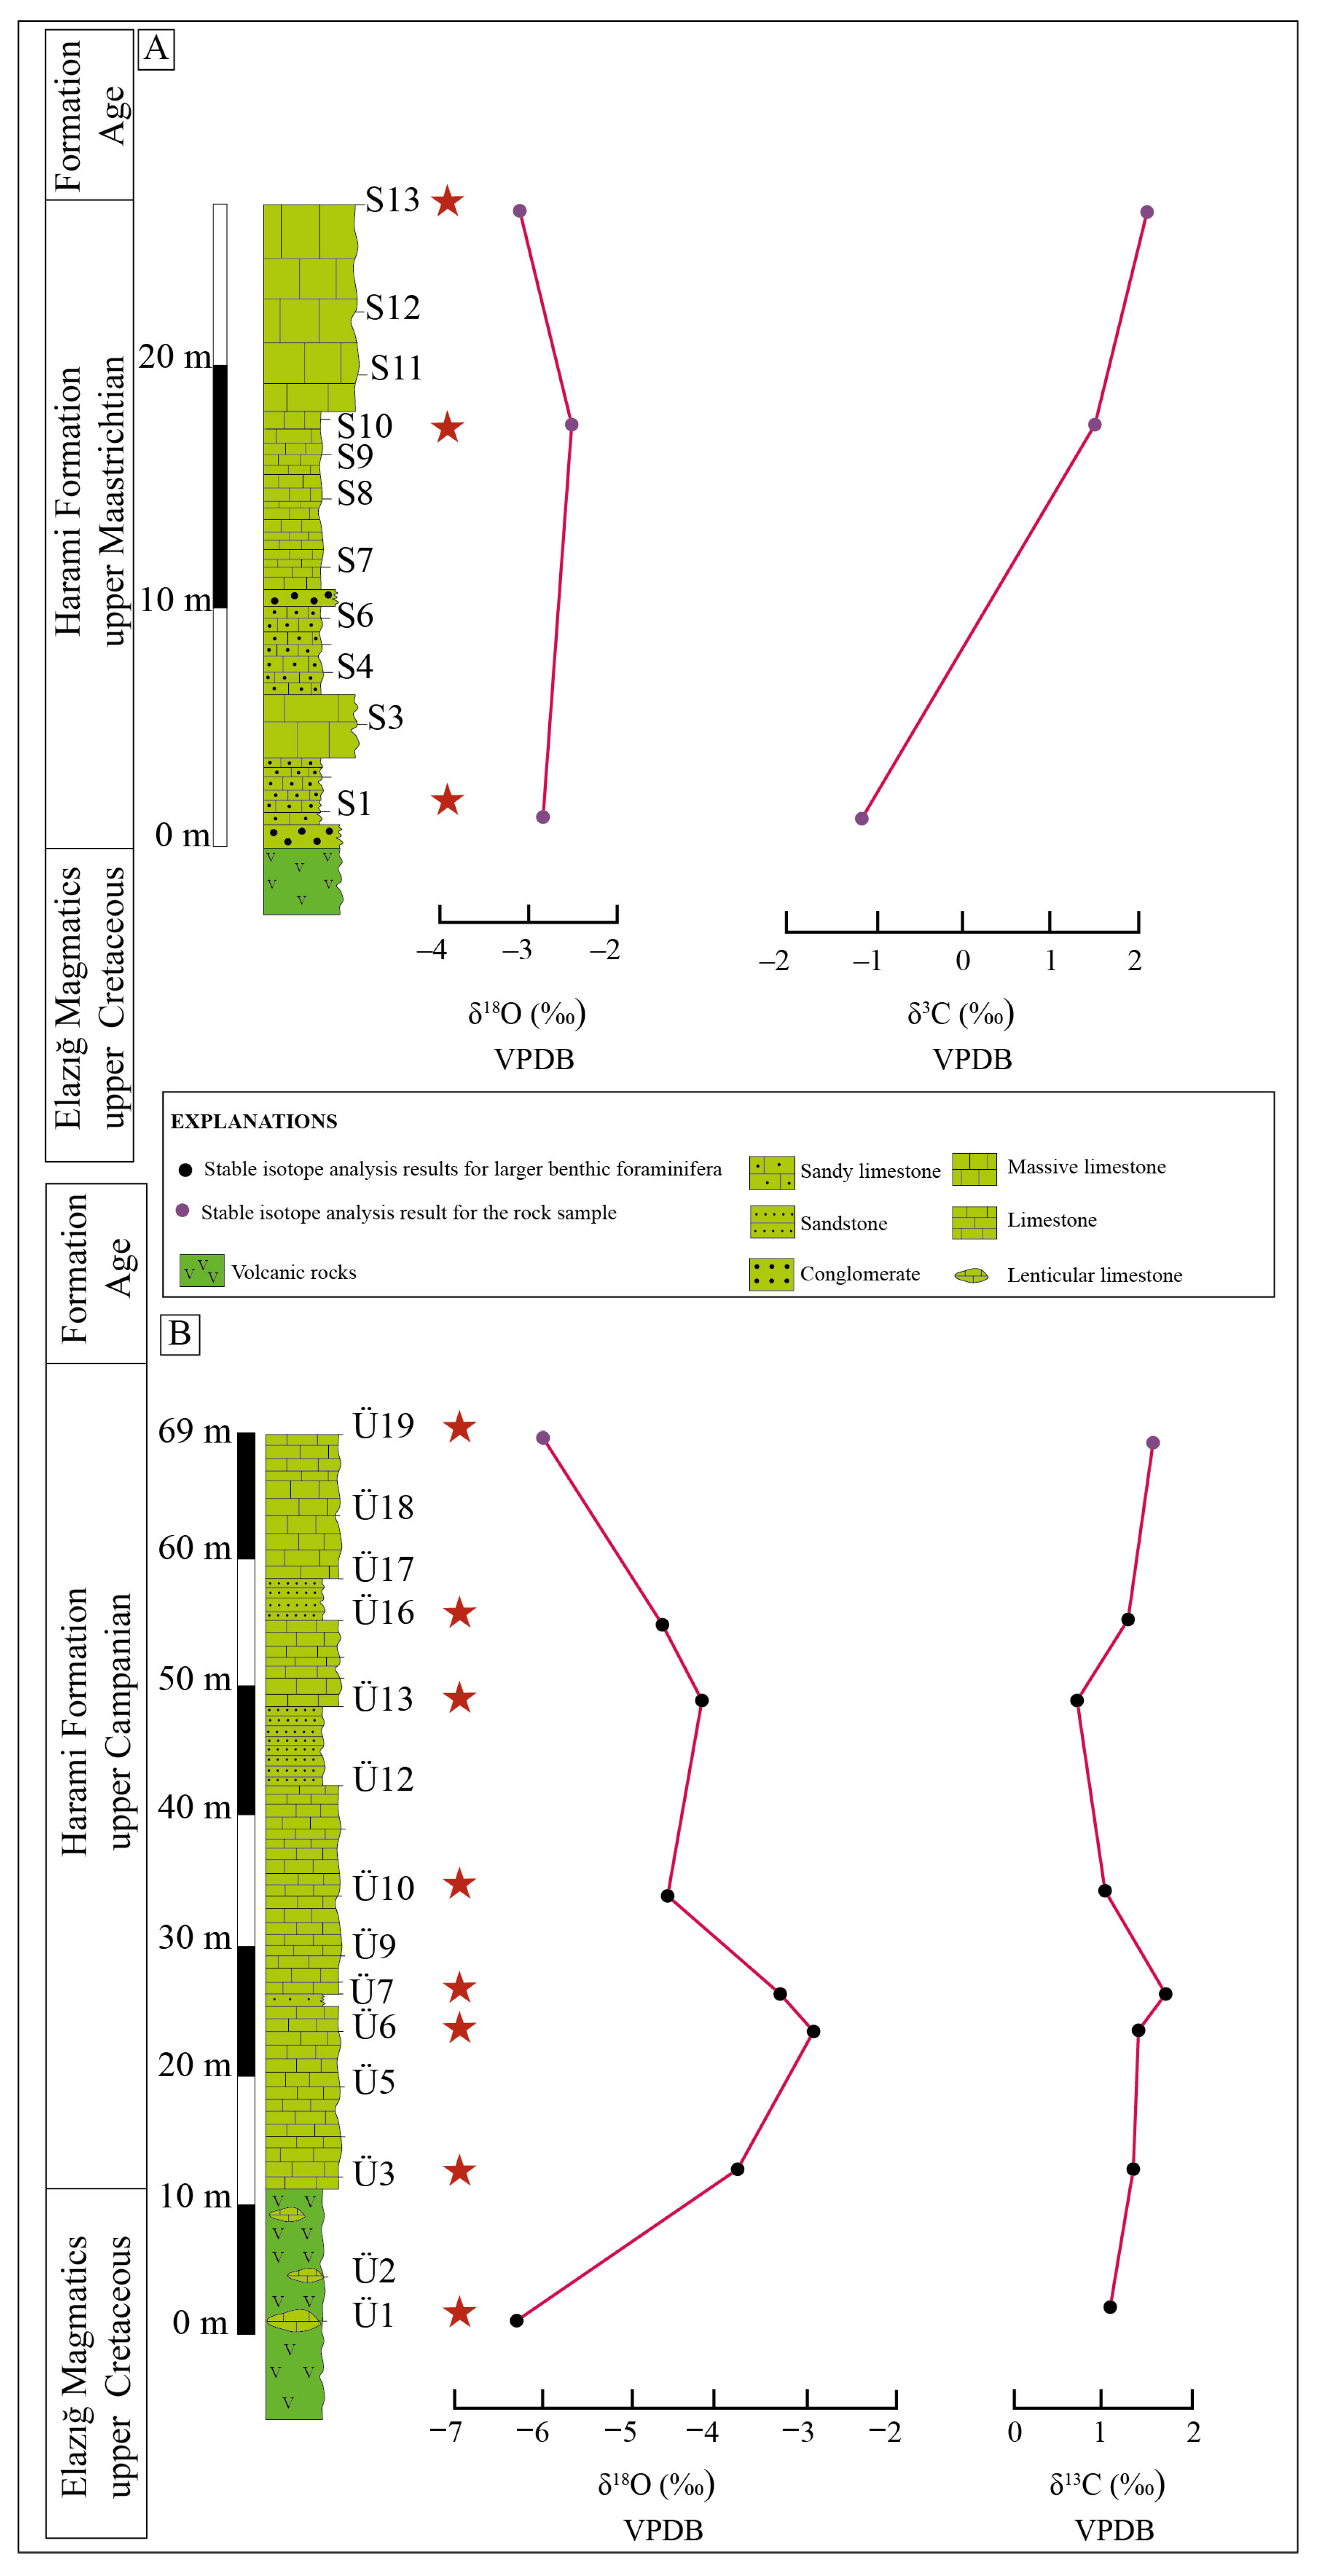
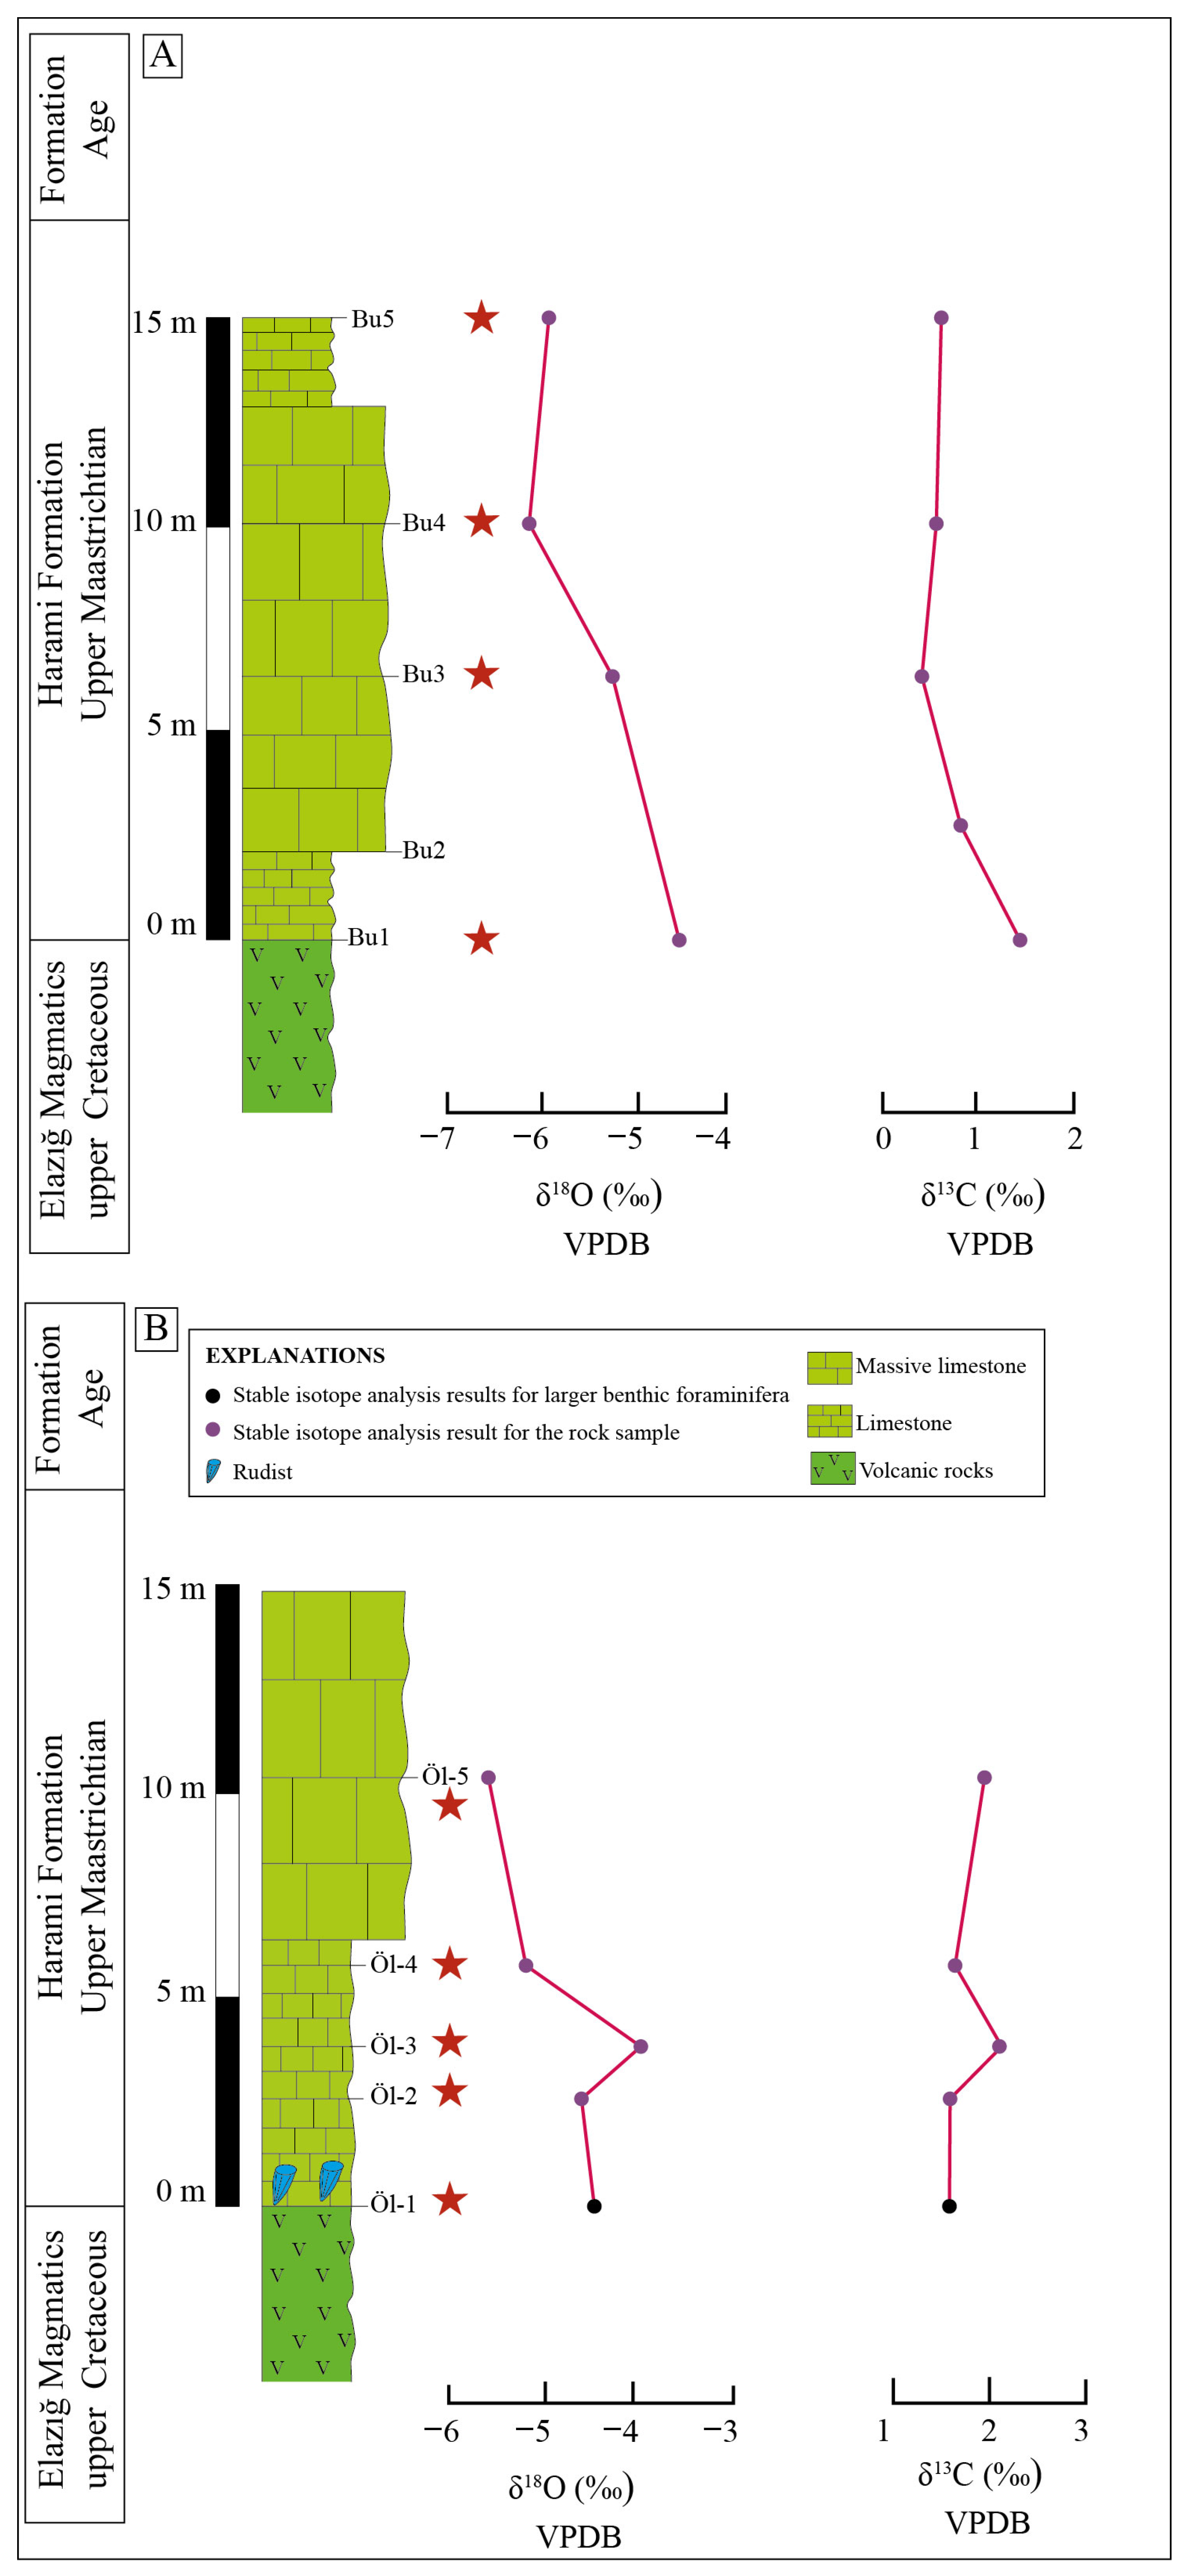
Stable isotope analysis (δ13C and δ18O) was performed on a total of 50 samples taken along eight measured stratigraphic sections at METU and WSS (Table 3, Table 4 and Table 5, Figure 5, Figure 6, Figure 7 and Figure 8).
The mean value of δ13C is 1.36 in the late Campanian, 1.98 in the early Maastrichtian, and 1.22 in the late Maastrichtian. The mean δ18O values are −4.27 in the late Campanian, −1.95 in the early Maastrichtian, and −4.48 in the late Maastrichtian. Based on all measured sections, a positive correlation (0.59) is observed between δ13C values and δ18O values (Table 3, Table 4 and Table 5, Figure 5, Figure 6, Figure 7 and Figure 8).
Paleotemperature values were calculated based on different formulas and coefficients for benthic foraminifera and rudist, according to the studies and equations given in Table 6 [24,25,26,27,28,29].
Different formulas and different coefficients for δ18Osw are used in the calculation of paleotemperature values [24,25,26,27,28,29]. For the late Cretaceous period, although values between −1 and −1.2 are used for δ18Osw, a value of −1 is widely assumed (Table 6). In the calculation of paleotemperature values in this study, δ18Osw values of −1 and −1.2 were used for benthic foraminifera, while a value of −1 was used for rudist. The results obtained for the −1 and −1.2 values for benthic foraminifera are presented below, separated by a slash (/).
Based on paleotemperature calculations using only δ18O values from larger benthic foraminifera, the mean temperatures were 29.43/28.48 °C in the late Campanian, 18.85/17.90 °C in the early Maastrichtian, and 31/30.05 °C in the late Maastrichtian. When considering only the rock samples, the mean temperatures were 37.09/36.14 °C in the late Campanian, 23.31/22.36 °C in the early Maastrichtian, and 31.40/30.45 °C in the late Maastrichtian. Based on rudist, the mean temperature in the early Maastrichtian was 22.49 °C (Table 5).

3.2. Radiogenic Isotope Analysis Findings

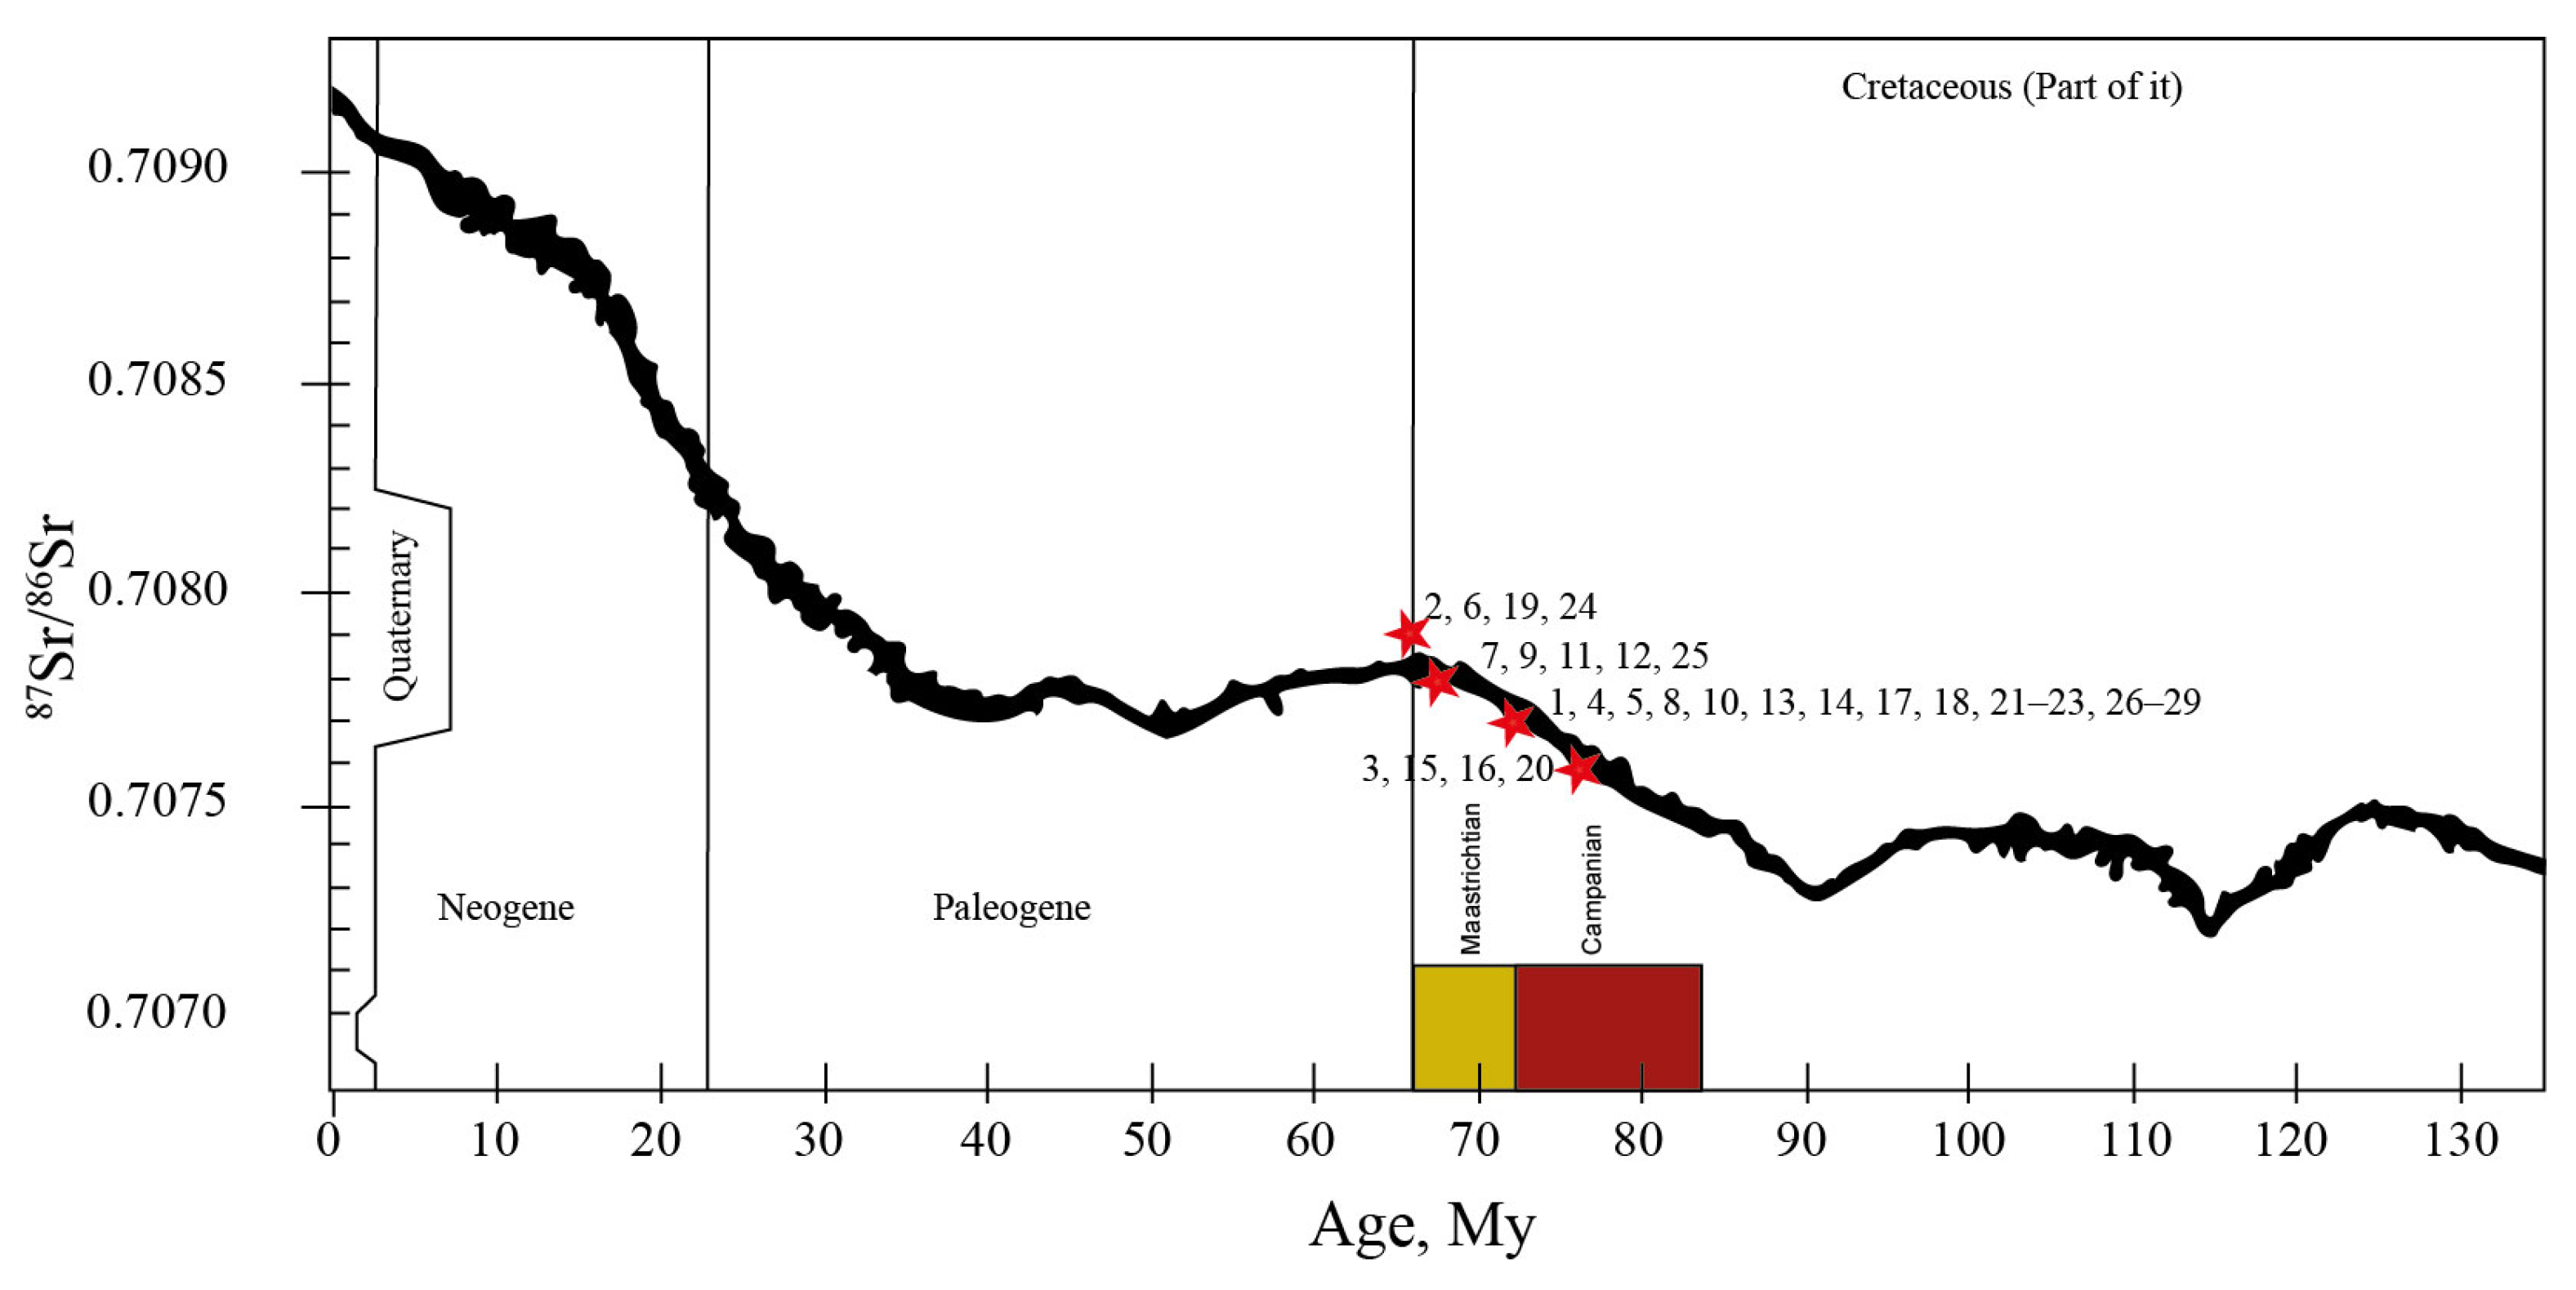
Radiogenic isotope analyses (87Sr/86Sr) were performed on a total of 37 samples at the METU and WSS. Analyses of the same samples (E4-rudist and T7-rudist) in different laboratories (Türkiye and China) served as an external check of the accuracy of the data. Radiogenic isotope analyses were performed on 29 rudist, Orbitoides, and rock samples (Table 7, Figure 9). The analysis results for eight samples were excluded from the evaluation because a very strong diagenesis effect was observed. Radiogenic isotope (87Sr/86Sr) values varied between 0.707577 and 0.707923 (Table 7, Figure 9). Ages corresponding to the mean of the 87Sr/86Sr values in the measured sections were evaluated by comparing with ages given according to the larger benthic foraminifera content. Considering the means of the other sections, the mean of the 87Sr/86Sr values is consistent with the ages given by the larger benthic foraminifera (Table 7, Figure 9).

3.3. ICP-MS Analysis Findings

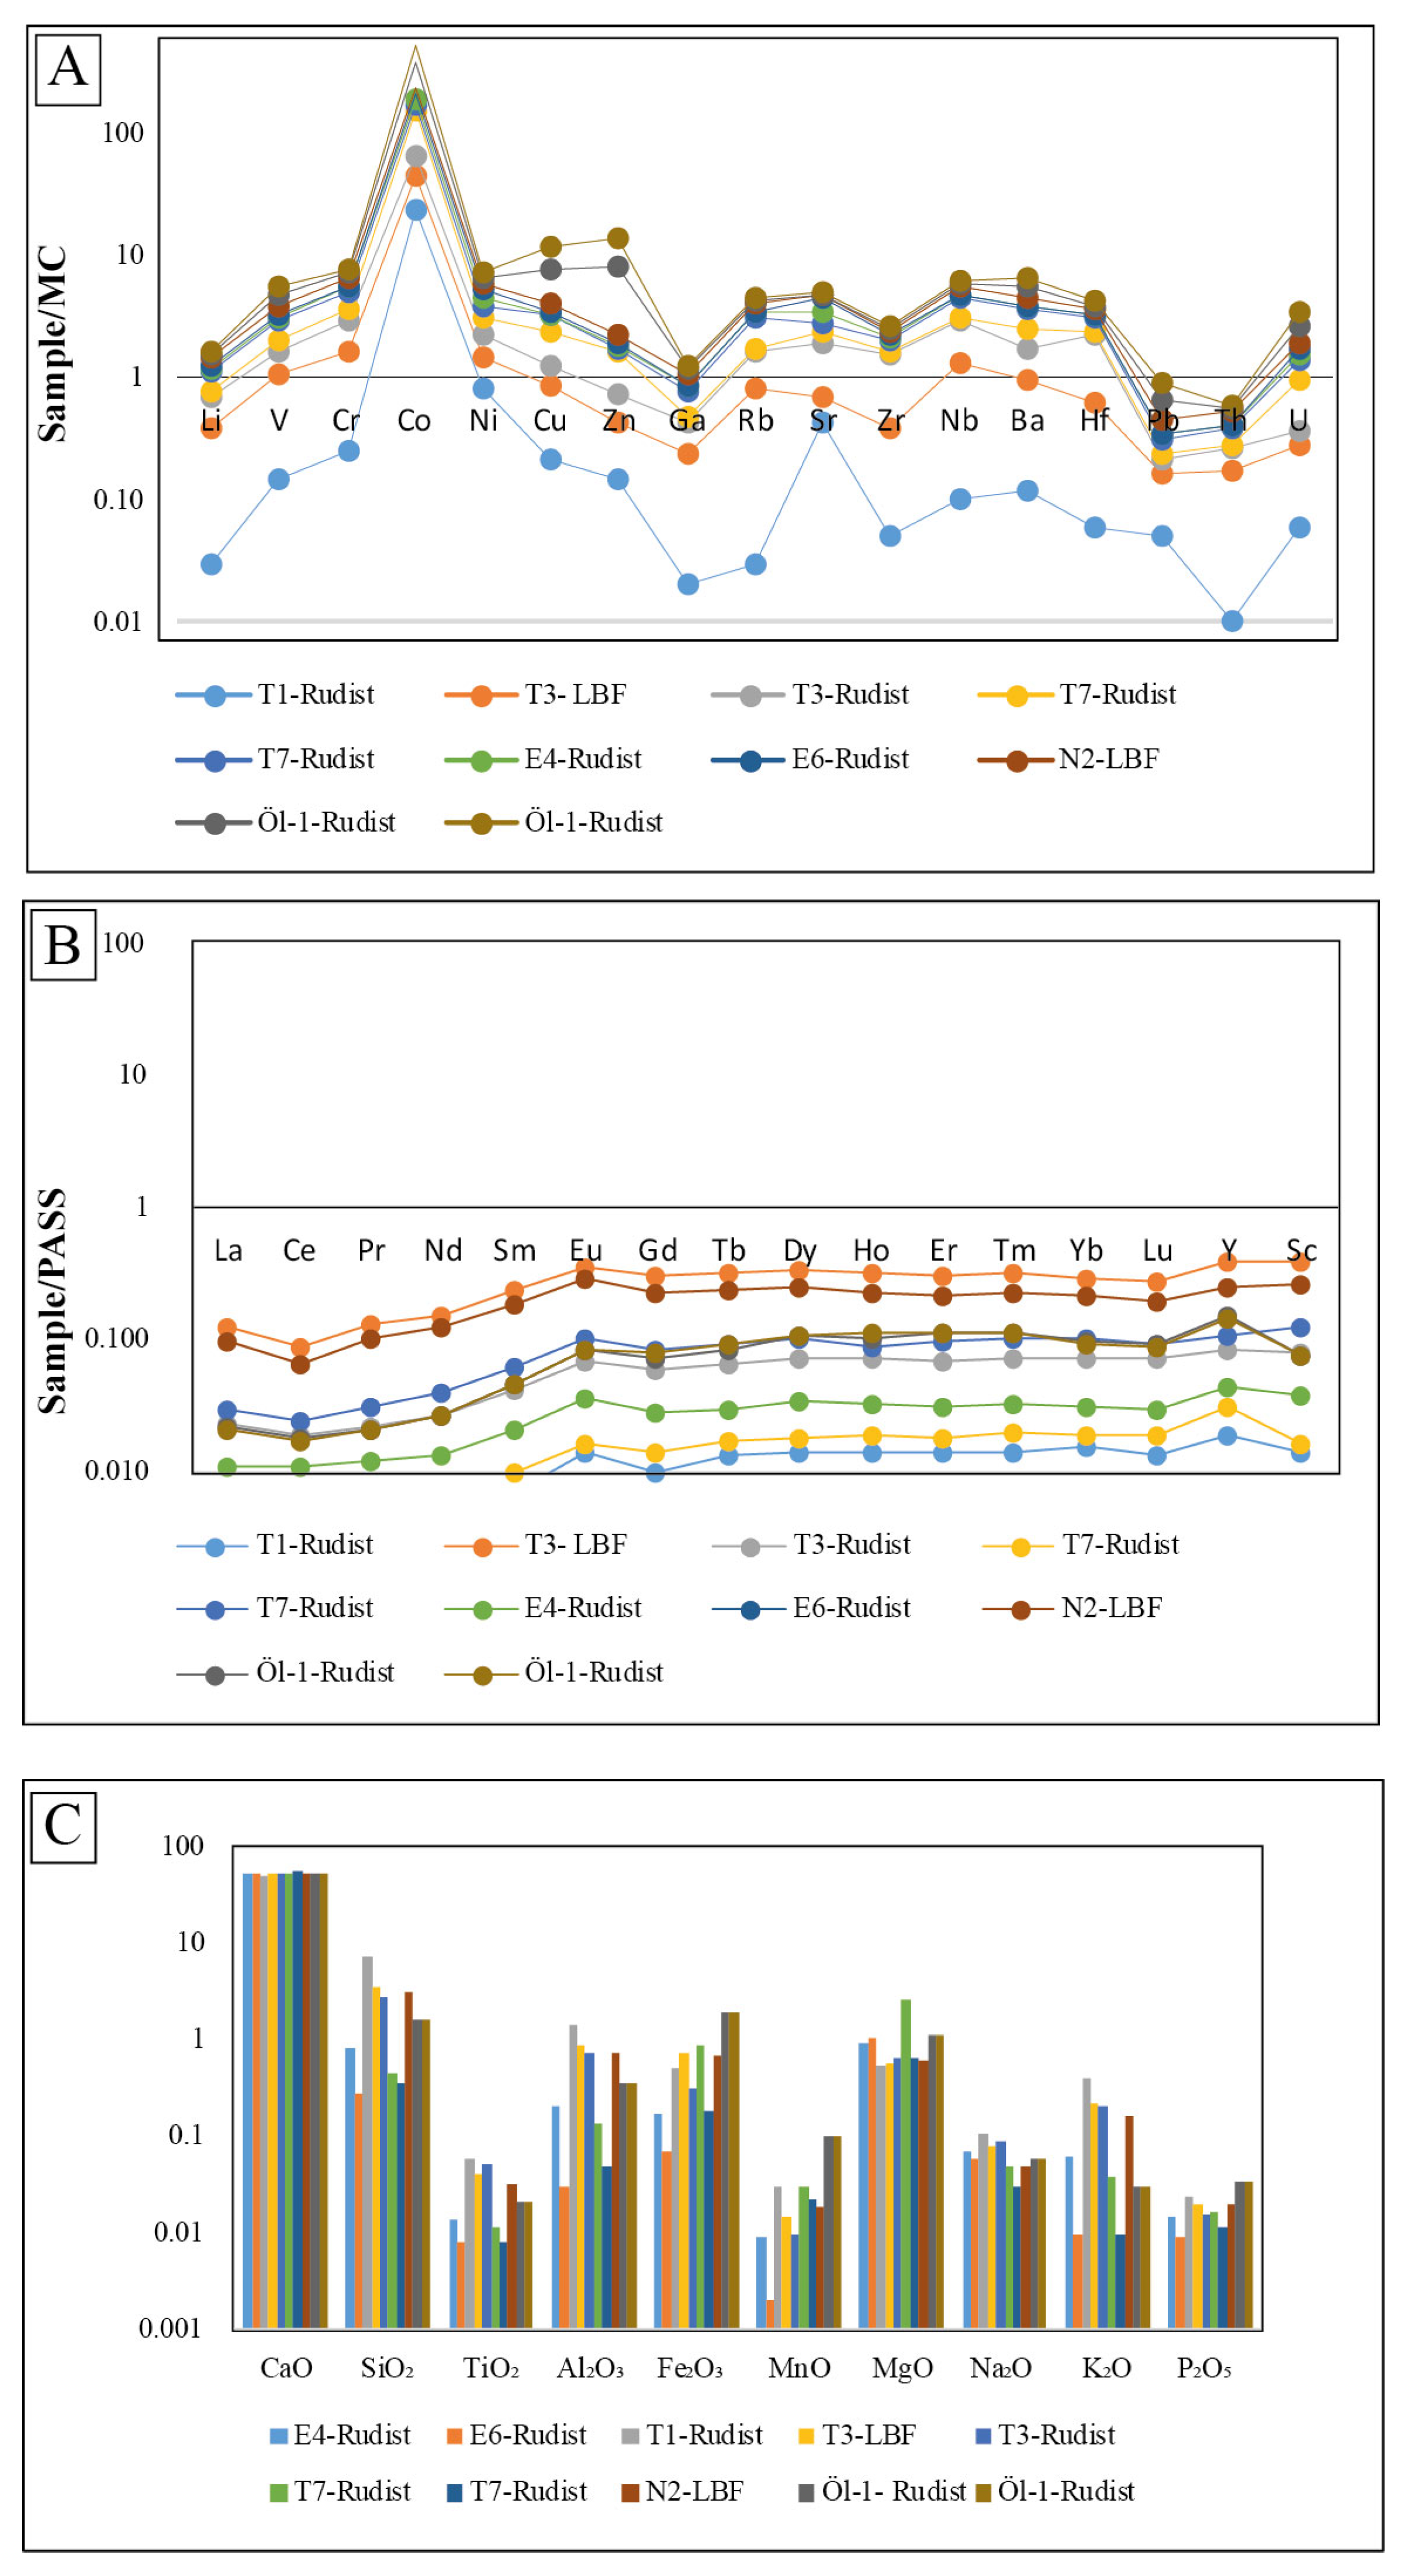
ICP-MS analyses of 10 LBF and rudist samples were performed at WSS; the value of trace elements and rare earth elements determined by the analyses are shown in Tables S1 and S2 and Figure 10A,B. Table 6 shows the trace element contents of Li, Be, V, Cr, Co, Ni, Cu, Zn, Ga, Rb, Sr, Zr, Nb, Sn, Cs, Ba, Hf, Ta, Tl, Pb, Th, and U, and trace element ratios such as V/Cr, V/V+Ni, Sr/Cu, Rb/Sr, Sr/Rb, Sr/Ba, and Ga/Rb. The rare earth element contents for La, Ce, Pr, Nd, Sm, Eu, Gd, Tb, Dy, Ho, Er, Tm, Yb, Lu, Y, and Sc, and the rare earth element rates for Y/Ho, Eu/Sm, La/Yb, Er/Nd, Eu/Eu*, and Ce/Ce* are reported in Table S2. These rare earth element values were normalized according to PASS [31] (Table S2). The ratios of trace and rare earth elements such as V/Cr, V/V+Ni, Sr/Cu, Rb/Sr, Sr/Rb, Sr/Ba, Ga/Rb, Y/Ho, and Eu/Sm, which are important in interpreting paleoenvironmental conditions, are given in Table 8 and Table 9, S1, and S2 and Figure 10A,B. The trace element concentrations were normalized to marine carbonate (MC) [32].

3.4. XRF Analysis Findings

XRF analysis of 10 LBF and rudist samples was performed at WSS. According to the results, CaO is the dominant component, ranging from 49.49% to 54.87% (Table 10, Figure 10C). The major oxide contents of the samples ranged from 0.28 to 7.29% for SiO2, 0.01 to 0.06% for TiO2, 0.03 to 1.40% for Al2O3, 0.07 to 1.97% for Fe2O3, 0.00 to 0.10% for MnO, 0.55 to 2.56% for MgO, 0.03 to 0.11% for Na2O, 0.01 to 0.41% for K2O, and 0.01 to 0.04% for P2O5 (Table 10, Figure 10C). The mean major oxide contents of the samples is as follows: CaO (52.65%) > SiO2 (2.18%) > MgO (0.98%) > Fe2O3 (0.75%) > Al2O3 (0.49%) > K2O (0.12%) > Na2O (0.07%) > MnO = TiO2 (0.03%) > P2O5 (0.02%).

3.5. SEM-EDS Analysis Findings

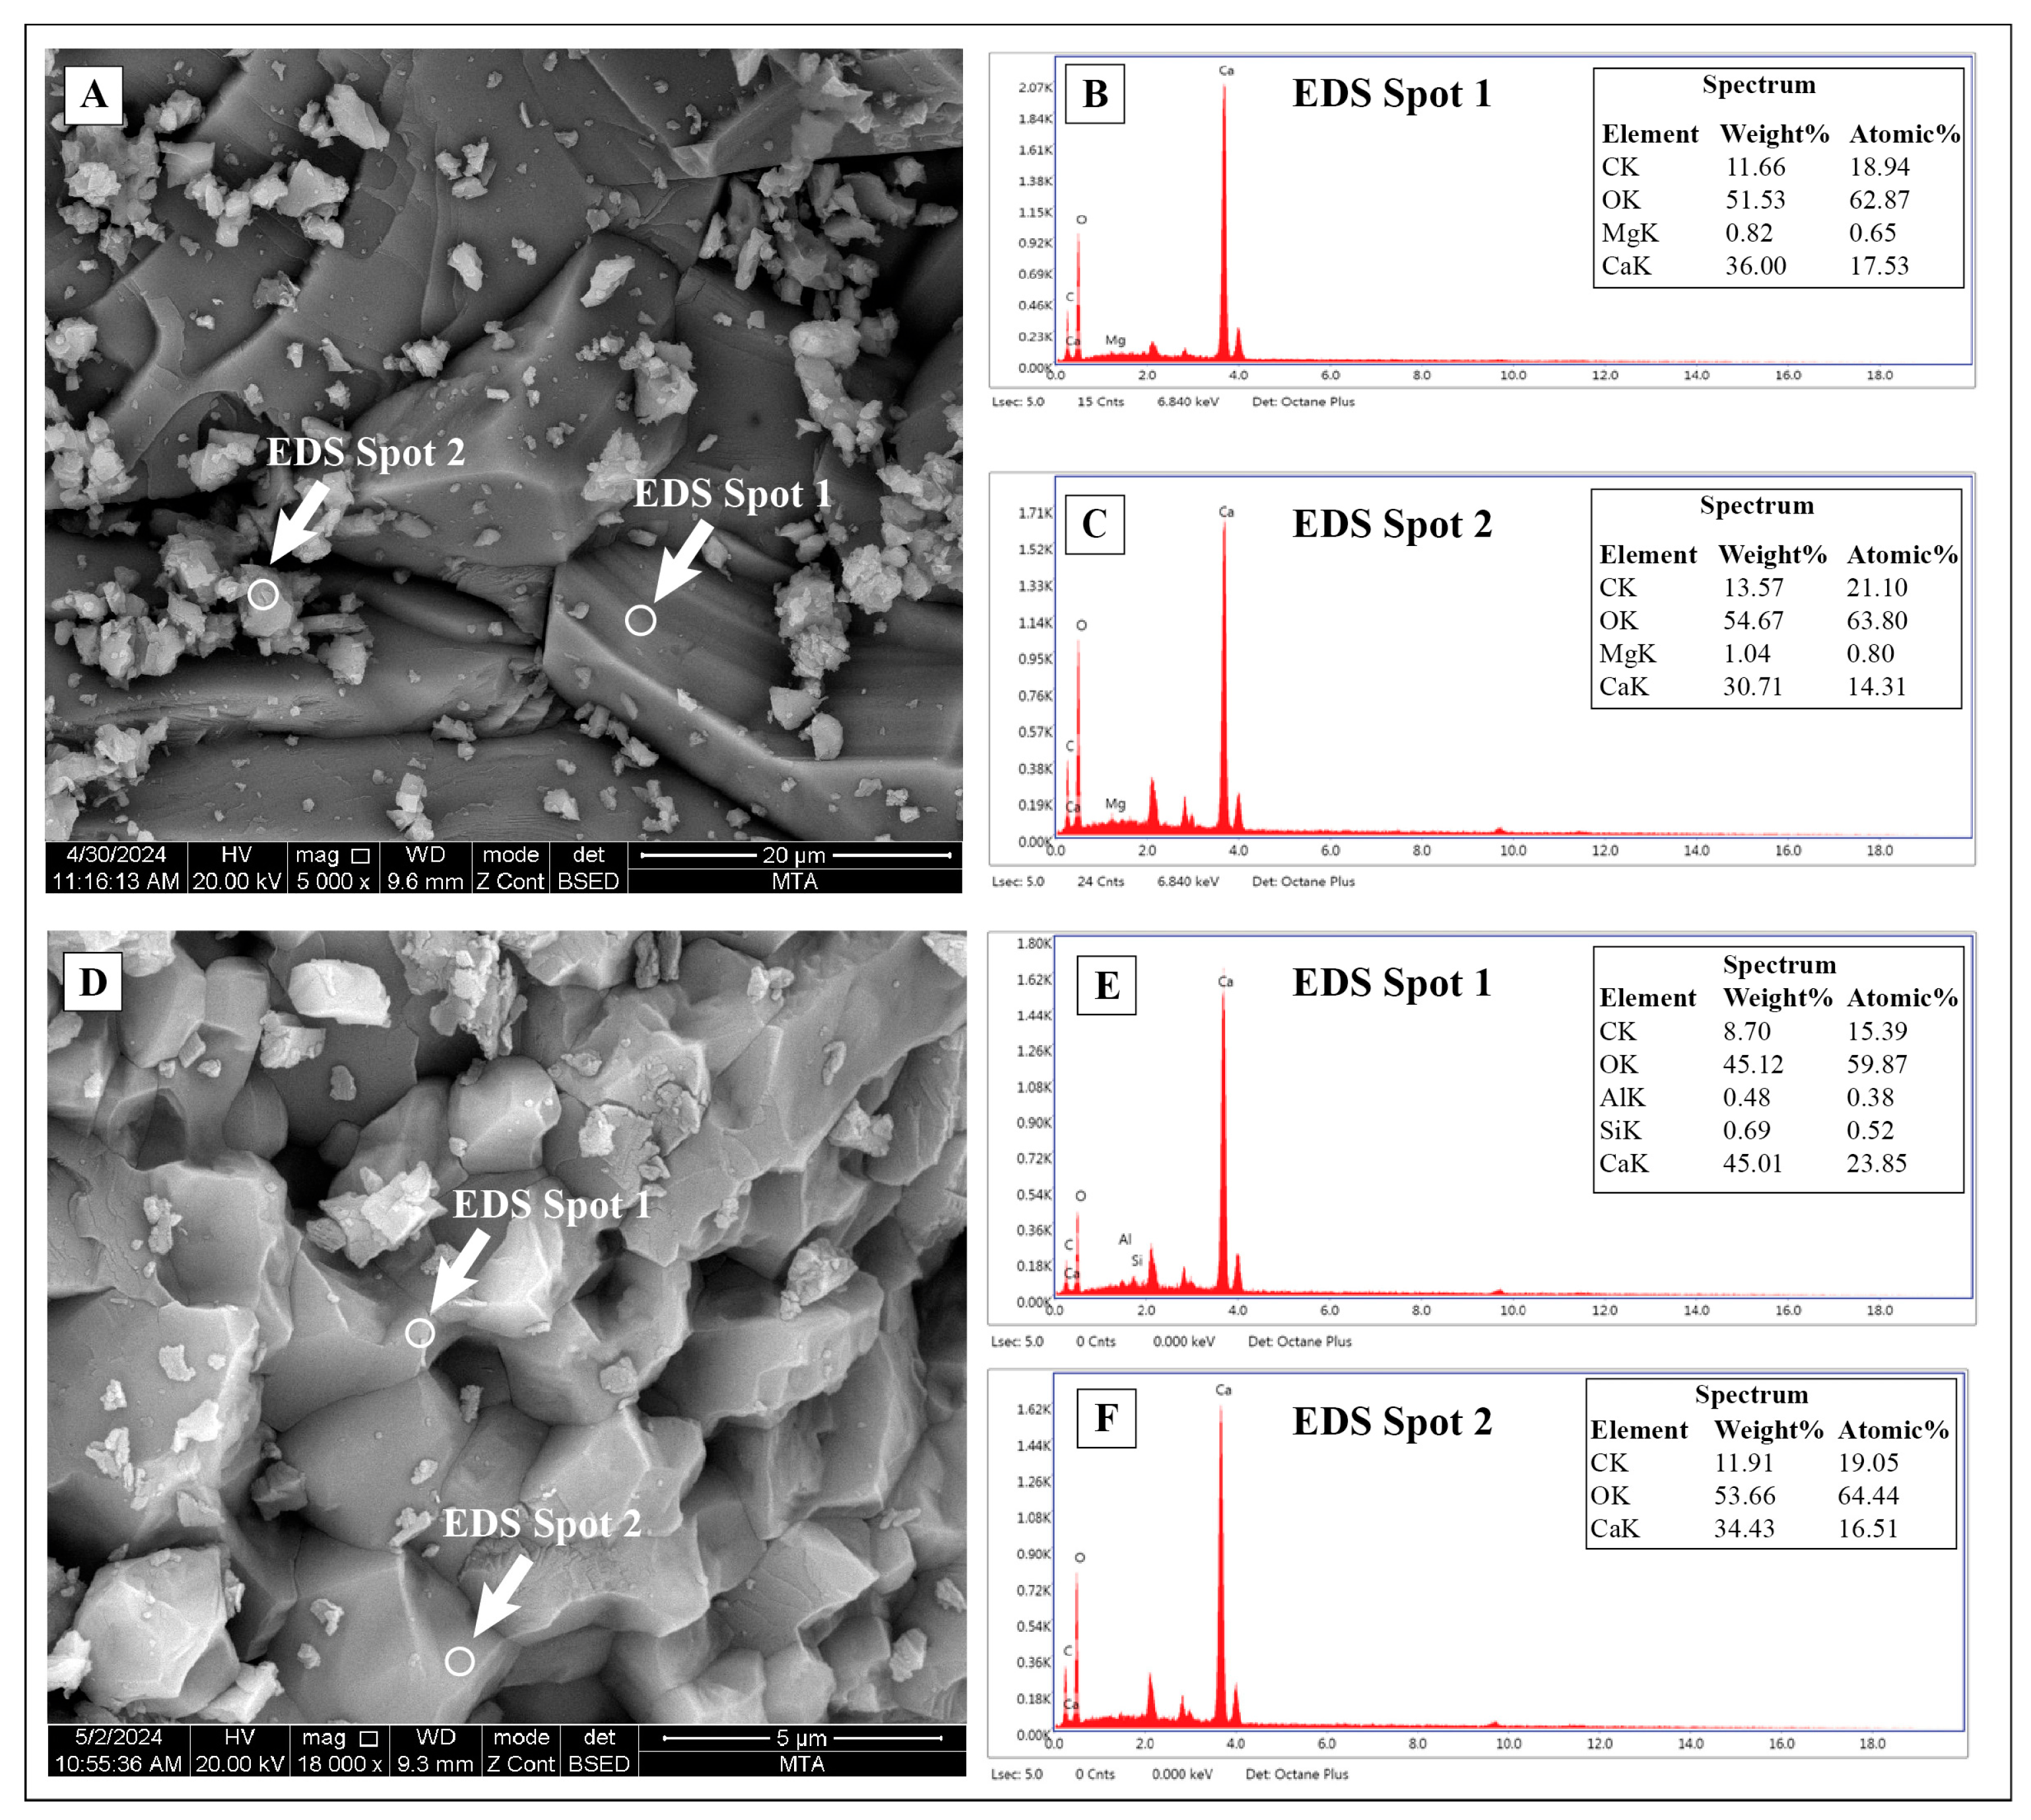
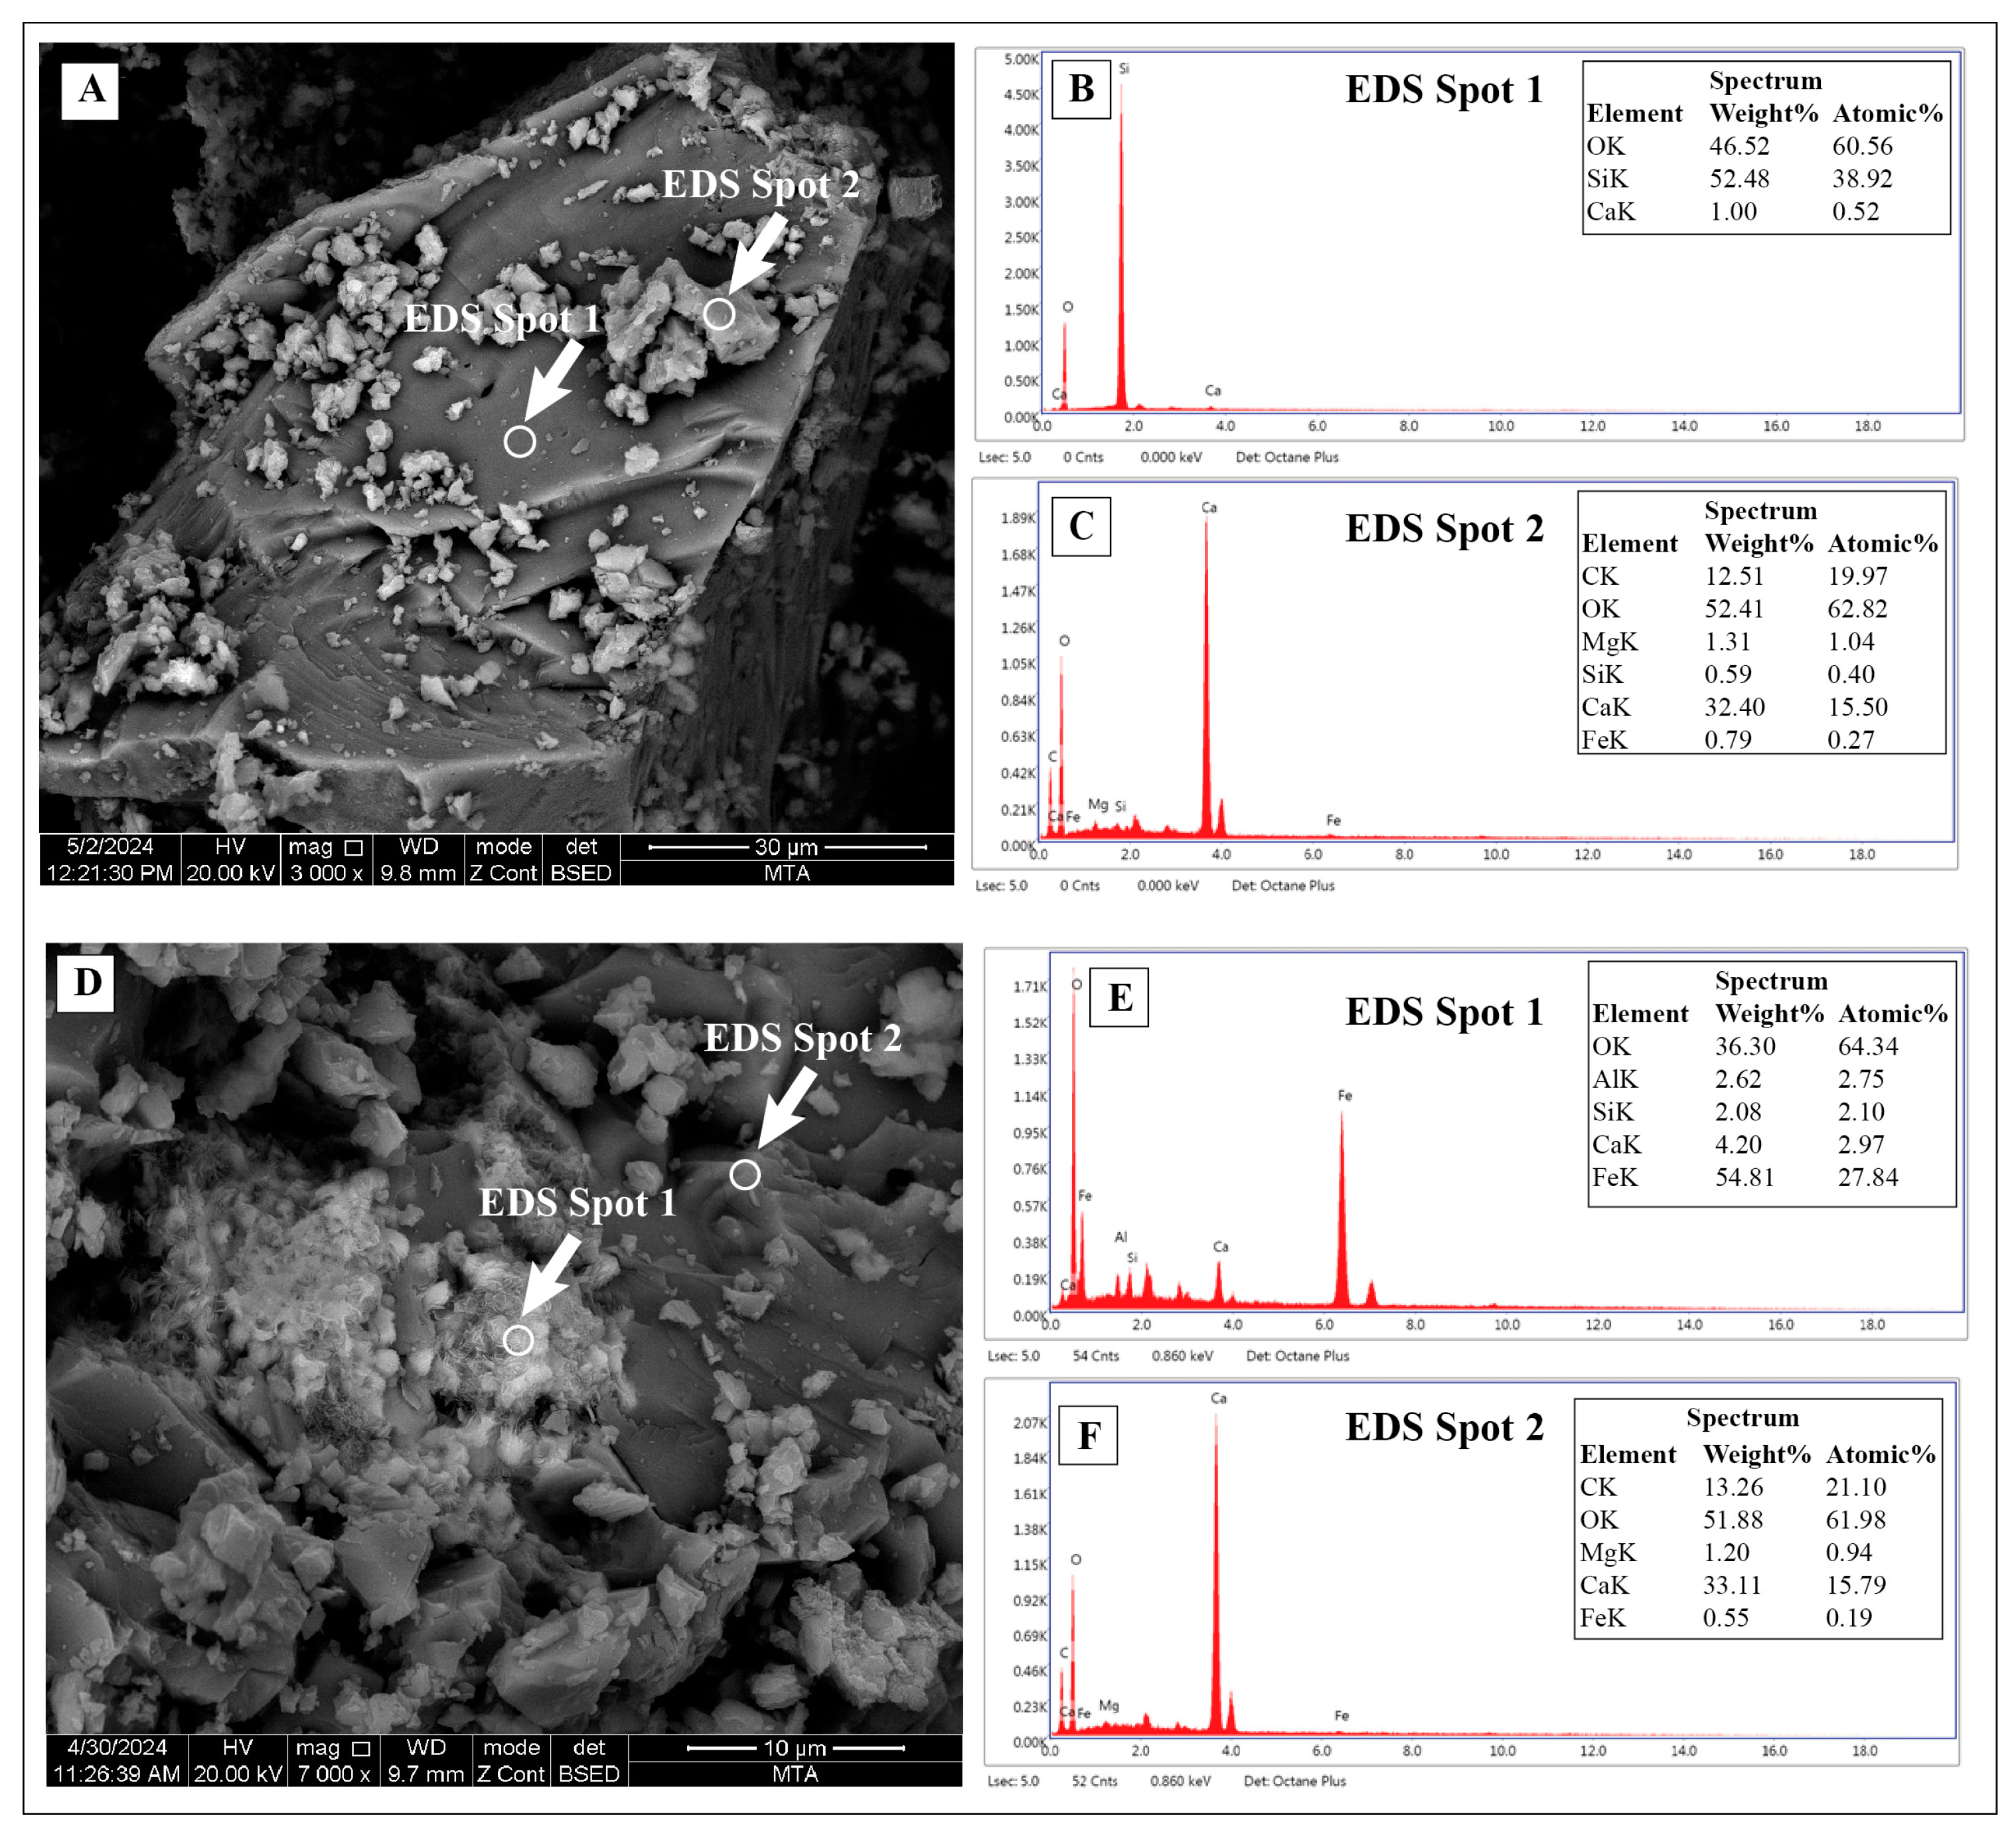
SEM-EDS analysis was performed on six samples (Table 2) at the MTA laboratory. Table 11 shows the percentage weight variations and means of the elements along the measured sections. EDS analyses revealed that the samples predominantly contained O (45.87%–50.79%), Ca (21.17%–36.06%), Fe (8.84%–20.78%), Si (2.94%–14.67%), and C (10.35%–12.97%). Al (0.70%–3.64%), Mg (0.76%–3.05%), S (3.15%), N (8.33%), Na (1.18%–6.13%), S (3.15%), K (0.29%–2.14%), Ti (0.64%–2.03%), Mn (0.31%), V (0.43%), Cr (1.47%), and Cl (0.44%) were also found (Table 11, Figure 11 and Figure 12). These values are similar to the major oxide values.

4. Discussion

The latest Cretaceous was characterized by a long-term cooling trend of several degrees [43,44,45] that followed the warm mid-Cretaceous super-greenhouse climate with tropical sea-surface temperatures that were about 10 °C higher than today (e.g., [46]) and intermediate-to-deep-water temperatures above 20 °C (e.g., [43]).
The late Cretaceous period is well known for its general greenhouse conditions, characterized by relatively high atmospheric pCO2 concentrations, a high global mean sea level, and largely absent ice sheets [43,47,48]. The Campanian–Maastrichtian interval witnessed a general global downward trend in temperatures, accompanied by anomalies in the carbon cycle [49,50]. The combination of lower pCO2 levels and the opening of ocean passages has been proposed as possible triggers for paleoclimatic events [44,51]. This cooling trend during the late Cretaceous was not monotonous, and the late Campanian climate optimum was interrupted by a series of warming events such as cooling in the early Maastrichtian, warming in the mid-Maastrichtian, and warming in the late Maastrichtian [52].
An integrated interpretation of the micropaleontological and geochemical characteristics of the Harami Formation outcrops northeast and southwest of Elazığ city provides a detailed reconstruction of paleoenvironmental evolution during the late Campanian–Maastrichtian period.
The dissolved Sr content in the world’s oceans has changed over time from 87Sr/86Sr [30,53,54]. Strontium isotope stratigraphy is a good chronostratigraphic method, and 87Sr/86Sr isotopic compositions are widely used in radiometric dating [53,55,56,57,58]. Chronostratigraphic interpretations have been made using this isotope ratio [59,60,61,62,63]. While the Sr isotope ratio of the ocean is generally considered homogeneous during all geological periods, variations can occur over short periods [55]. The 87Sr/86Sr value data from well-preserved and well-dated limestones has been used to create a marine reference curve of geological history and is continuously updated [30,53,54,56,57]. A geological time interval characterized by a steep Sr isotope curve can be accurately dated chronostratigraphically and globally correlated using Sr isotope stratigraphy [30,53,54,56,57].
The mean analysis values of 87Sr/86Sr obtained from larger benthic foraminifera, rudist, and rock samples taken from the Maastrichtian sequence of the Harami Formation are between 0.707686 and 0.707788. Except for the Ölbe Stream section, the ages obtained from the larger benthic foraminifera content in the Eskişehir Tepe, Nohutlupınarı, Tepeköy, and Silsilekaya Tepe sections (early/late Maastrichtian) support the ages obtained using the 87Sr/86Sr data. In the Ölbe Stream section, while larger benthic foraminifera data indicate the late Maastrichtian, the analysis results (0.707686) show the early Maastrichtian; this difference is thought to be due to diagenesis.
Table 5 presents the mean temperature values calculated based on samples of larger benthic foraminifera, rudist, and rock in this study. Based on these values, it can be inferred that there was a decrease in mean temperature from the late Campanian to the early Maastrichtian, followed by an increase from the early Maastrichtian to the late Maastrichtian; this result is consistent with those of previous studies [43,44,47,48,49,50,51,52,64]. The stable isotope results obtained from the larger benthic foraminifera, rudist, and rock samples in this study suggest that the larger benthic foraminifera samples were relatively less affected by diagenesis compared to the rock and rudist samples. Paleotemperature calculations are controversial, and various studies employ different δ18Osw coefficients and formulas [24,25,26,27,28,29]. In this study, two paleotemperature values were calculated for benthic foraminifera using δ18Osw coefficients of −1 and −1.2, revealing a difference of 0.95 °C between them. This difference is negligible when interpreting mean temperatures.
Although diagenetic processes can alter stable isotope ratios, foraminifera and other organisms can maintain their initial isotope ratio for millions of years [65,66]. However, since recrystallization occurs at the sea bottom temperature where the benthic foraminifera are buried, the benthic foraminifera are not significantly affected by recrystallization [65,67]. Studies on Eocene benthic foraminifera have concluded that δ18O values obtained from rocks are lower than those obtained from larger benthic foraminifera [66].
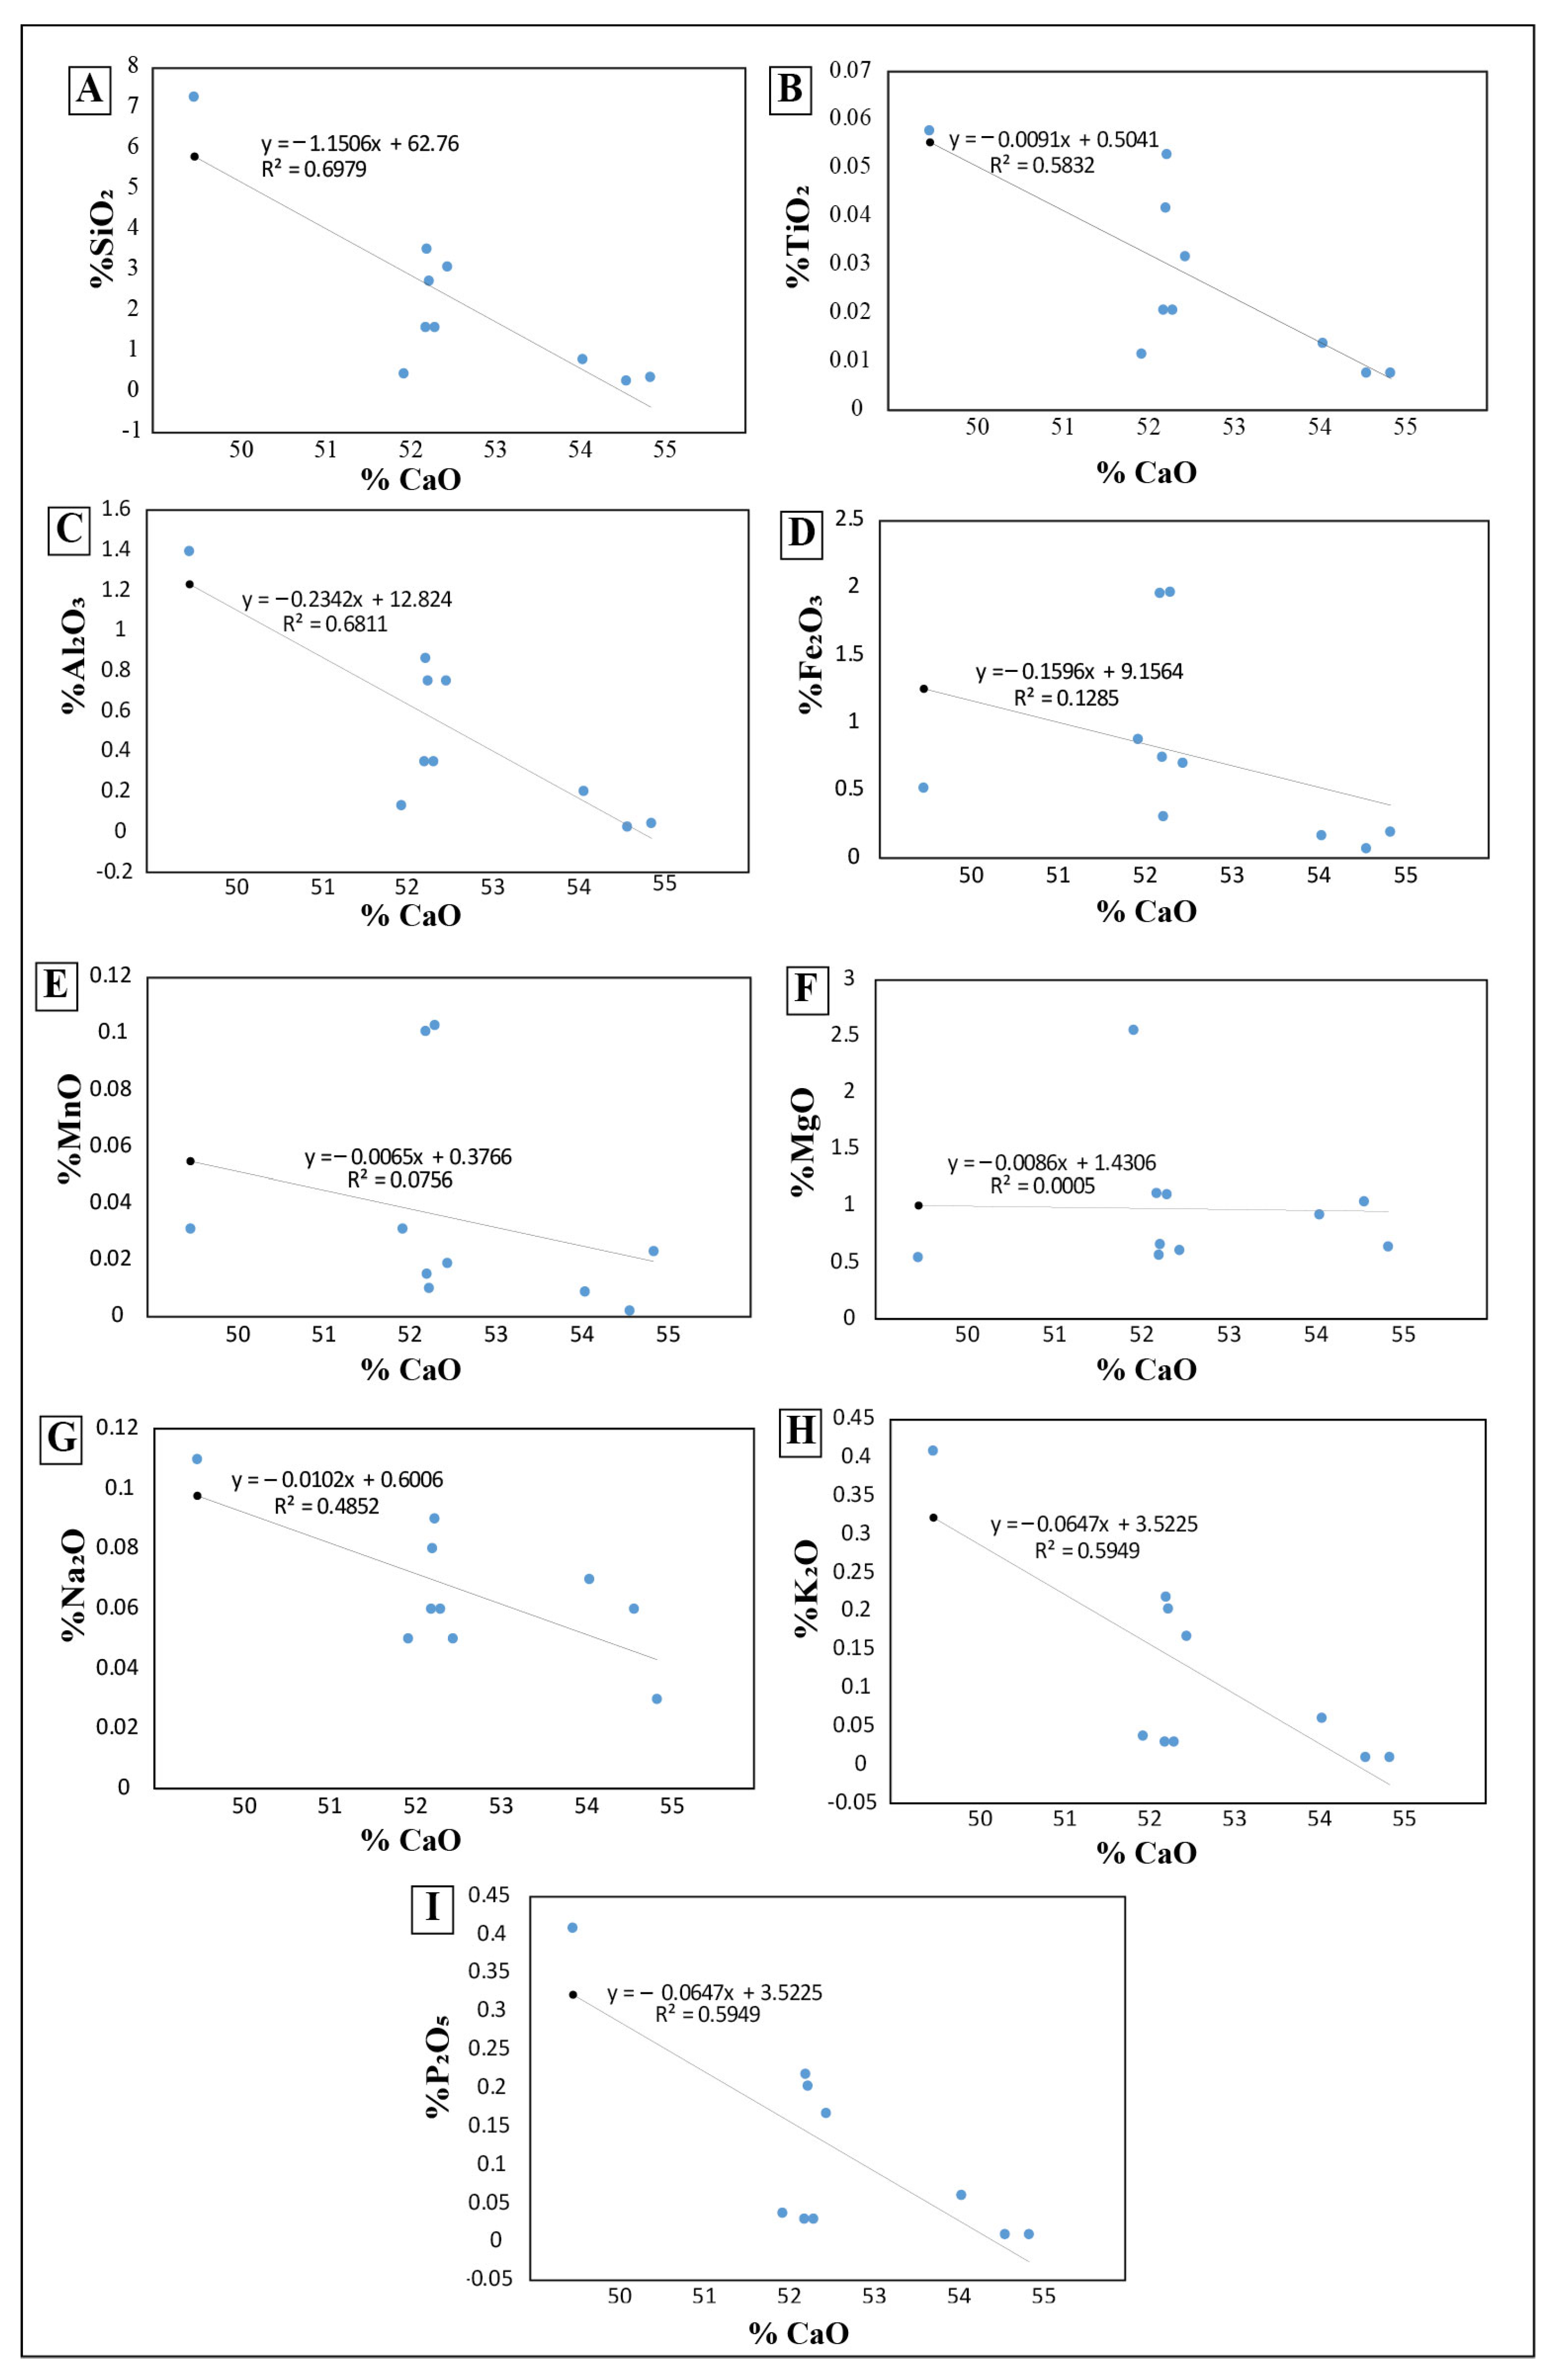
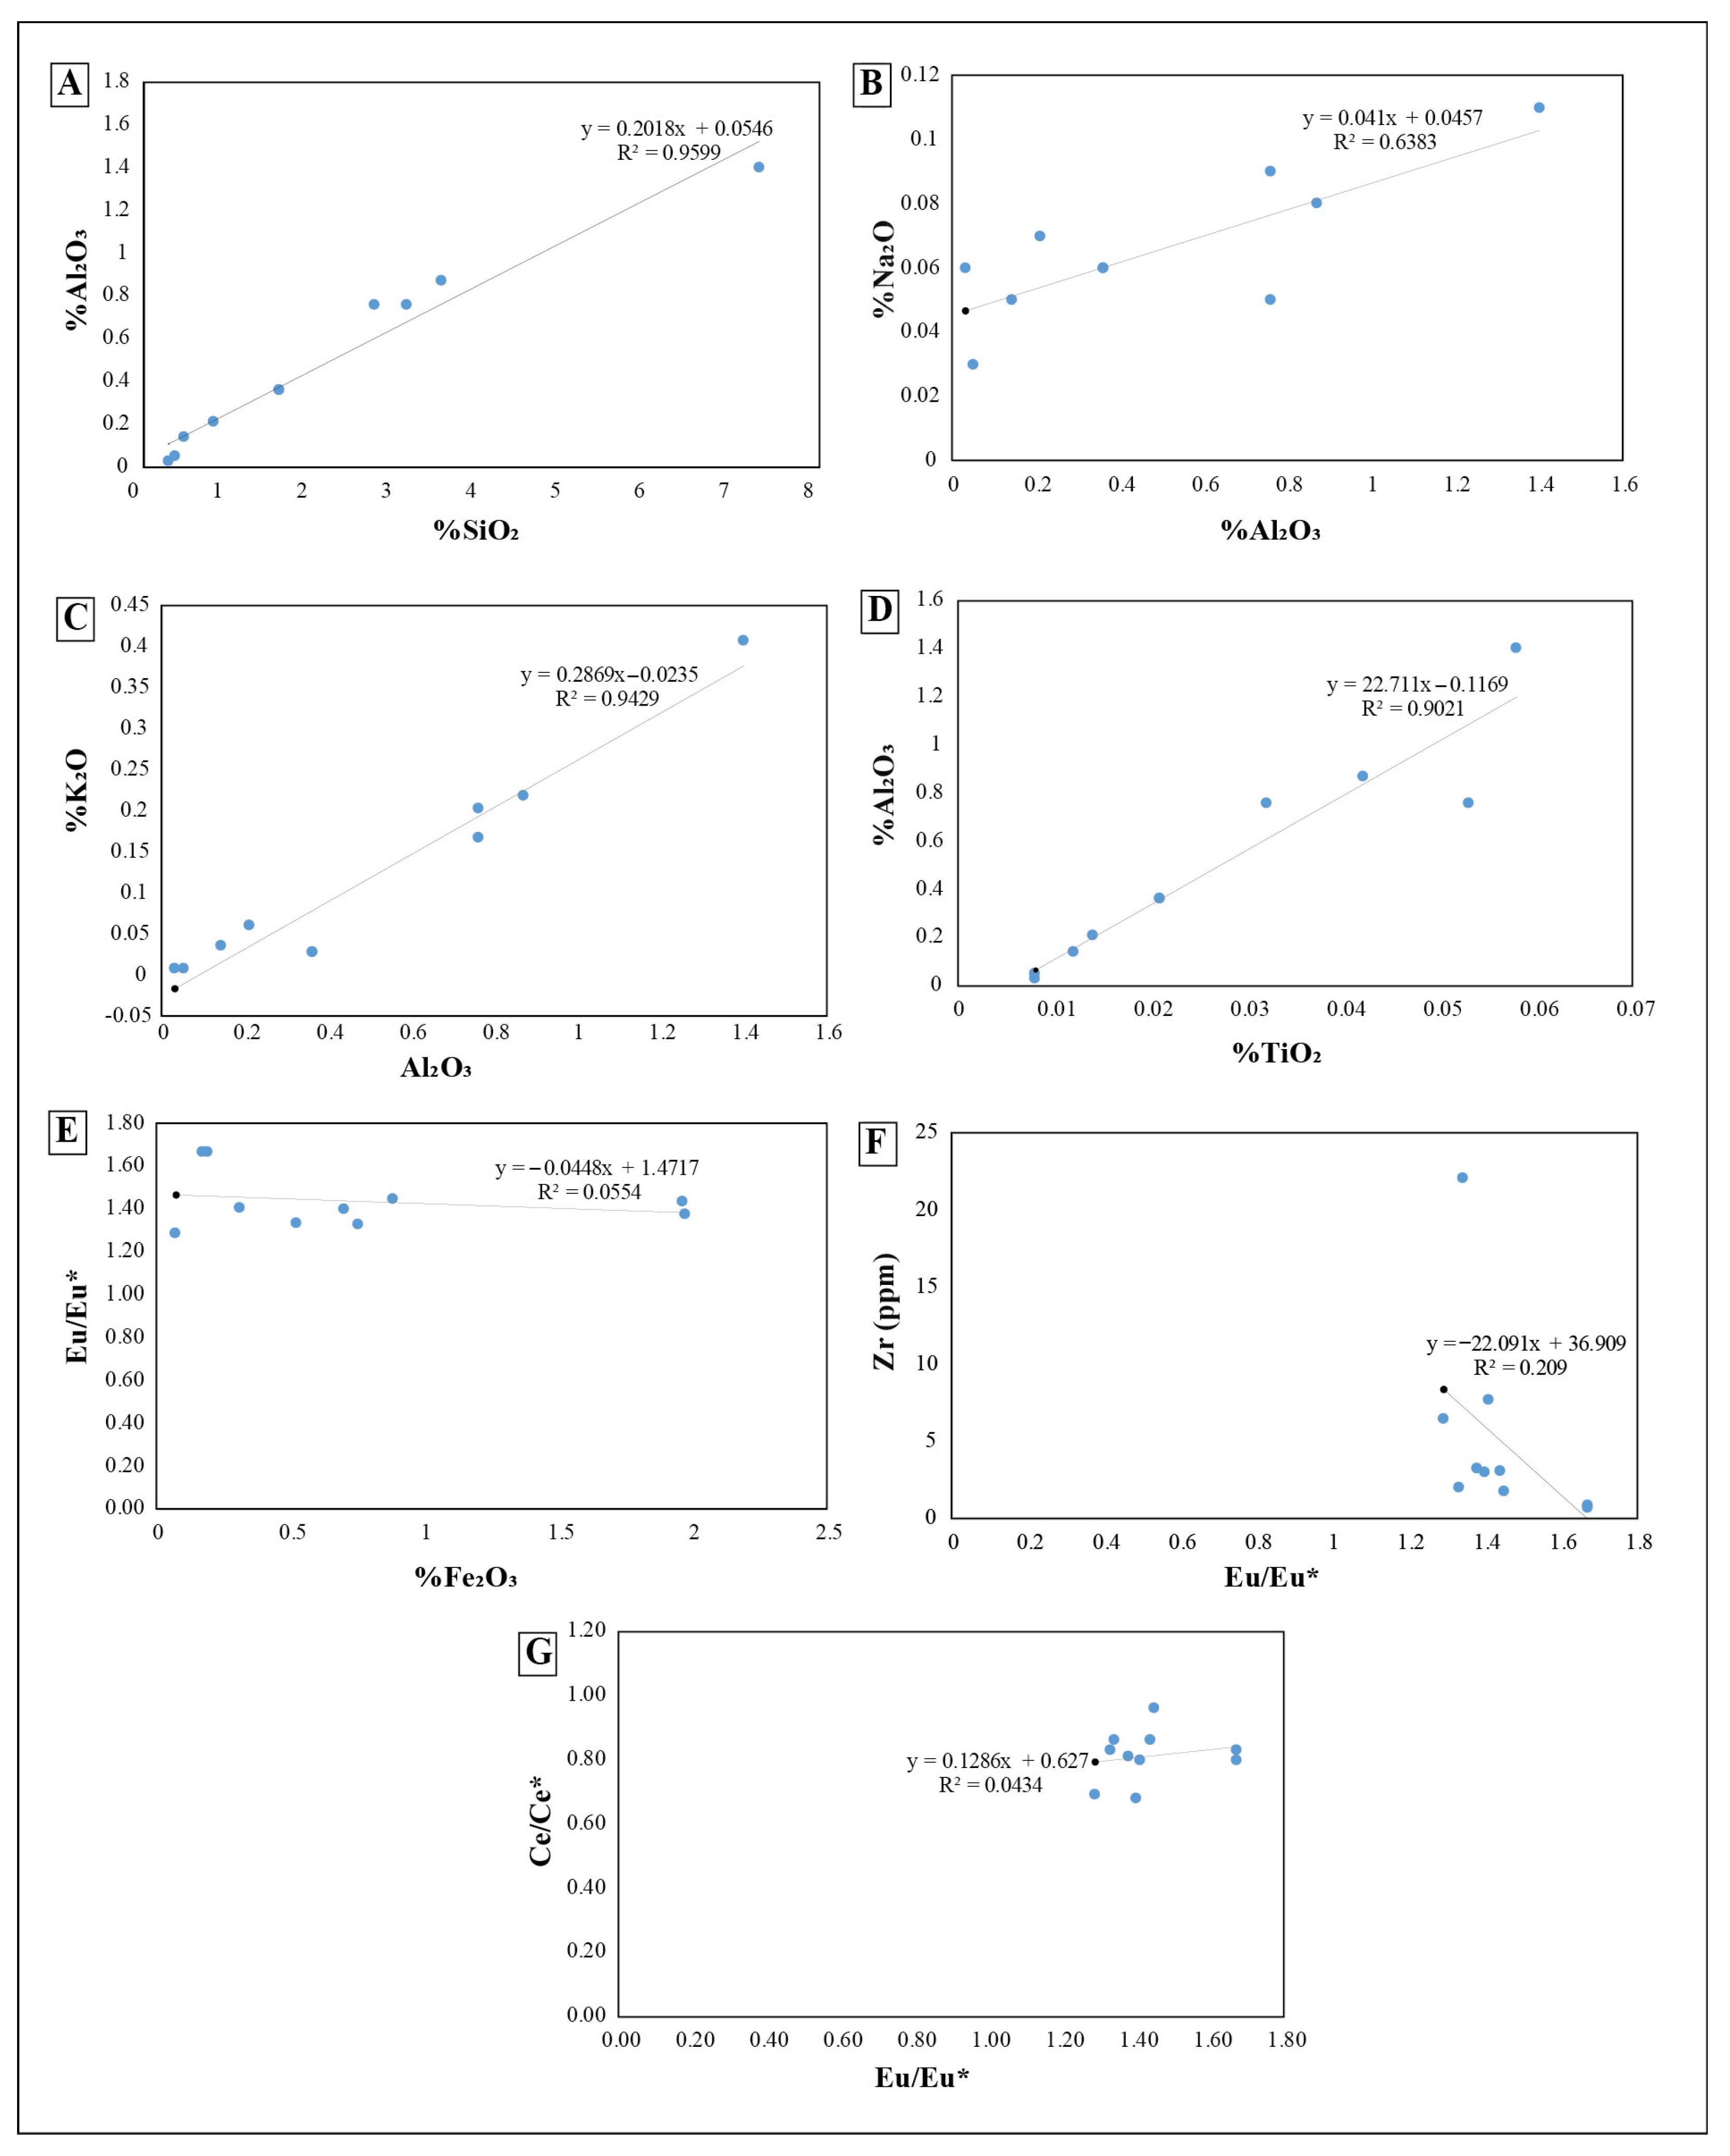
The major oxide and elemental compositions of the samples are compatible. The negative correlation observed between CaO and major oxides such as SiO2 (−0.83), TiO2 (−0.76), Al2O3 (−0.82), Fe2O3 (−0.36), MnO (−0.27), MgO (−0.02), Na2O (−0.70), K2O (−0.77), and P2O5 (−0.55) indicates that CaO is dominant and the other components have a diluting effect, as also stated by Zhang et al. [68] and Tribovillard et al. [69] (Figure 13). Depositional implications are consistent with a shallow platform/ramp setting in which alternation between more carbonate-rich and more marly intervals may result both from changes in terrigenous supply and from variability in carbonate production/preservation linked to energy, turbidity, and nutrient availability [70,71]. The strong positive correlation observed between Al2O3 and SiO2 (0.98), Na2O (0.80), K2O (0.97), and TiO2 (0.95) indicates that Si, Na, K, and Ti are largely obtained from clay minerals. The strong (r = 0.98) positive correlation between SiO2 and Al2O3 suggests that feldspar and quartz are derived from the same source area (Figure 14A–D).
The negative correlation between Fe2O3 and Eu/Eu* (−0.23) and Zr and Eu/Eu* (−0.46) (Figure 14E,F) indicates that iron is largely of terrestrial origin and that the Eu anomaly decreases due to increasing terrestrial material [72]. The high Fe concentration implies that the marine environment is close to land and rather shallow. The red color, particularly seen in the larger benthic foraminifera and rudist, is due to the Fe content. In the Silsilekaya Hill section, the larger benthic foraminifera are white and, as can be seen from the EDS analysis, do not contain Fe. In the Ürünveren section, the fact that the shells are not red compared to the shells in other sections is due to the presence of other elements aside from Fe. As Muray [73] and Boudagher-Fadel [74] have also noted, the high Fe content indicates that the environment is very close to land and quite shallow.
The means of V/Cr and V/V+Ni are 1.44 and 0.40 respectively. Redox-sensitive trace element ratios (V/Cr and V/V+Ni) indicate oxic condition [33,34,39,75,76].
Paleoclimate proxies (Sr/Cu, Rb/Sr, Sr/Ba) consistently point to arid climatic conditions, with fluctuating salinity [35,36,37,38,39,40,41,42,77]. The increases and decreases in the Sr/Cu and Sr/Ba ratios in the Harami Formation indicate that the salinity in the basin is controlled by climate changes [78]. When the paleoclimate was warm–humid, the salinity of the water was fresh/brackish, and when paleoclimate conditions were hot–arid, saline water prevailed in the basin [78].
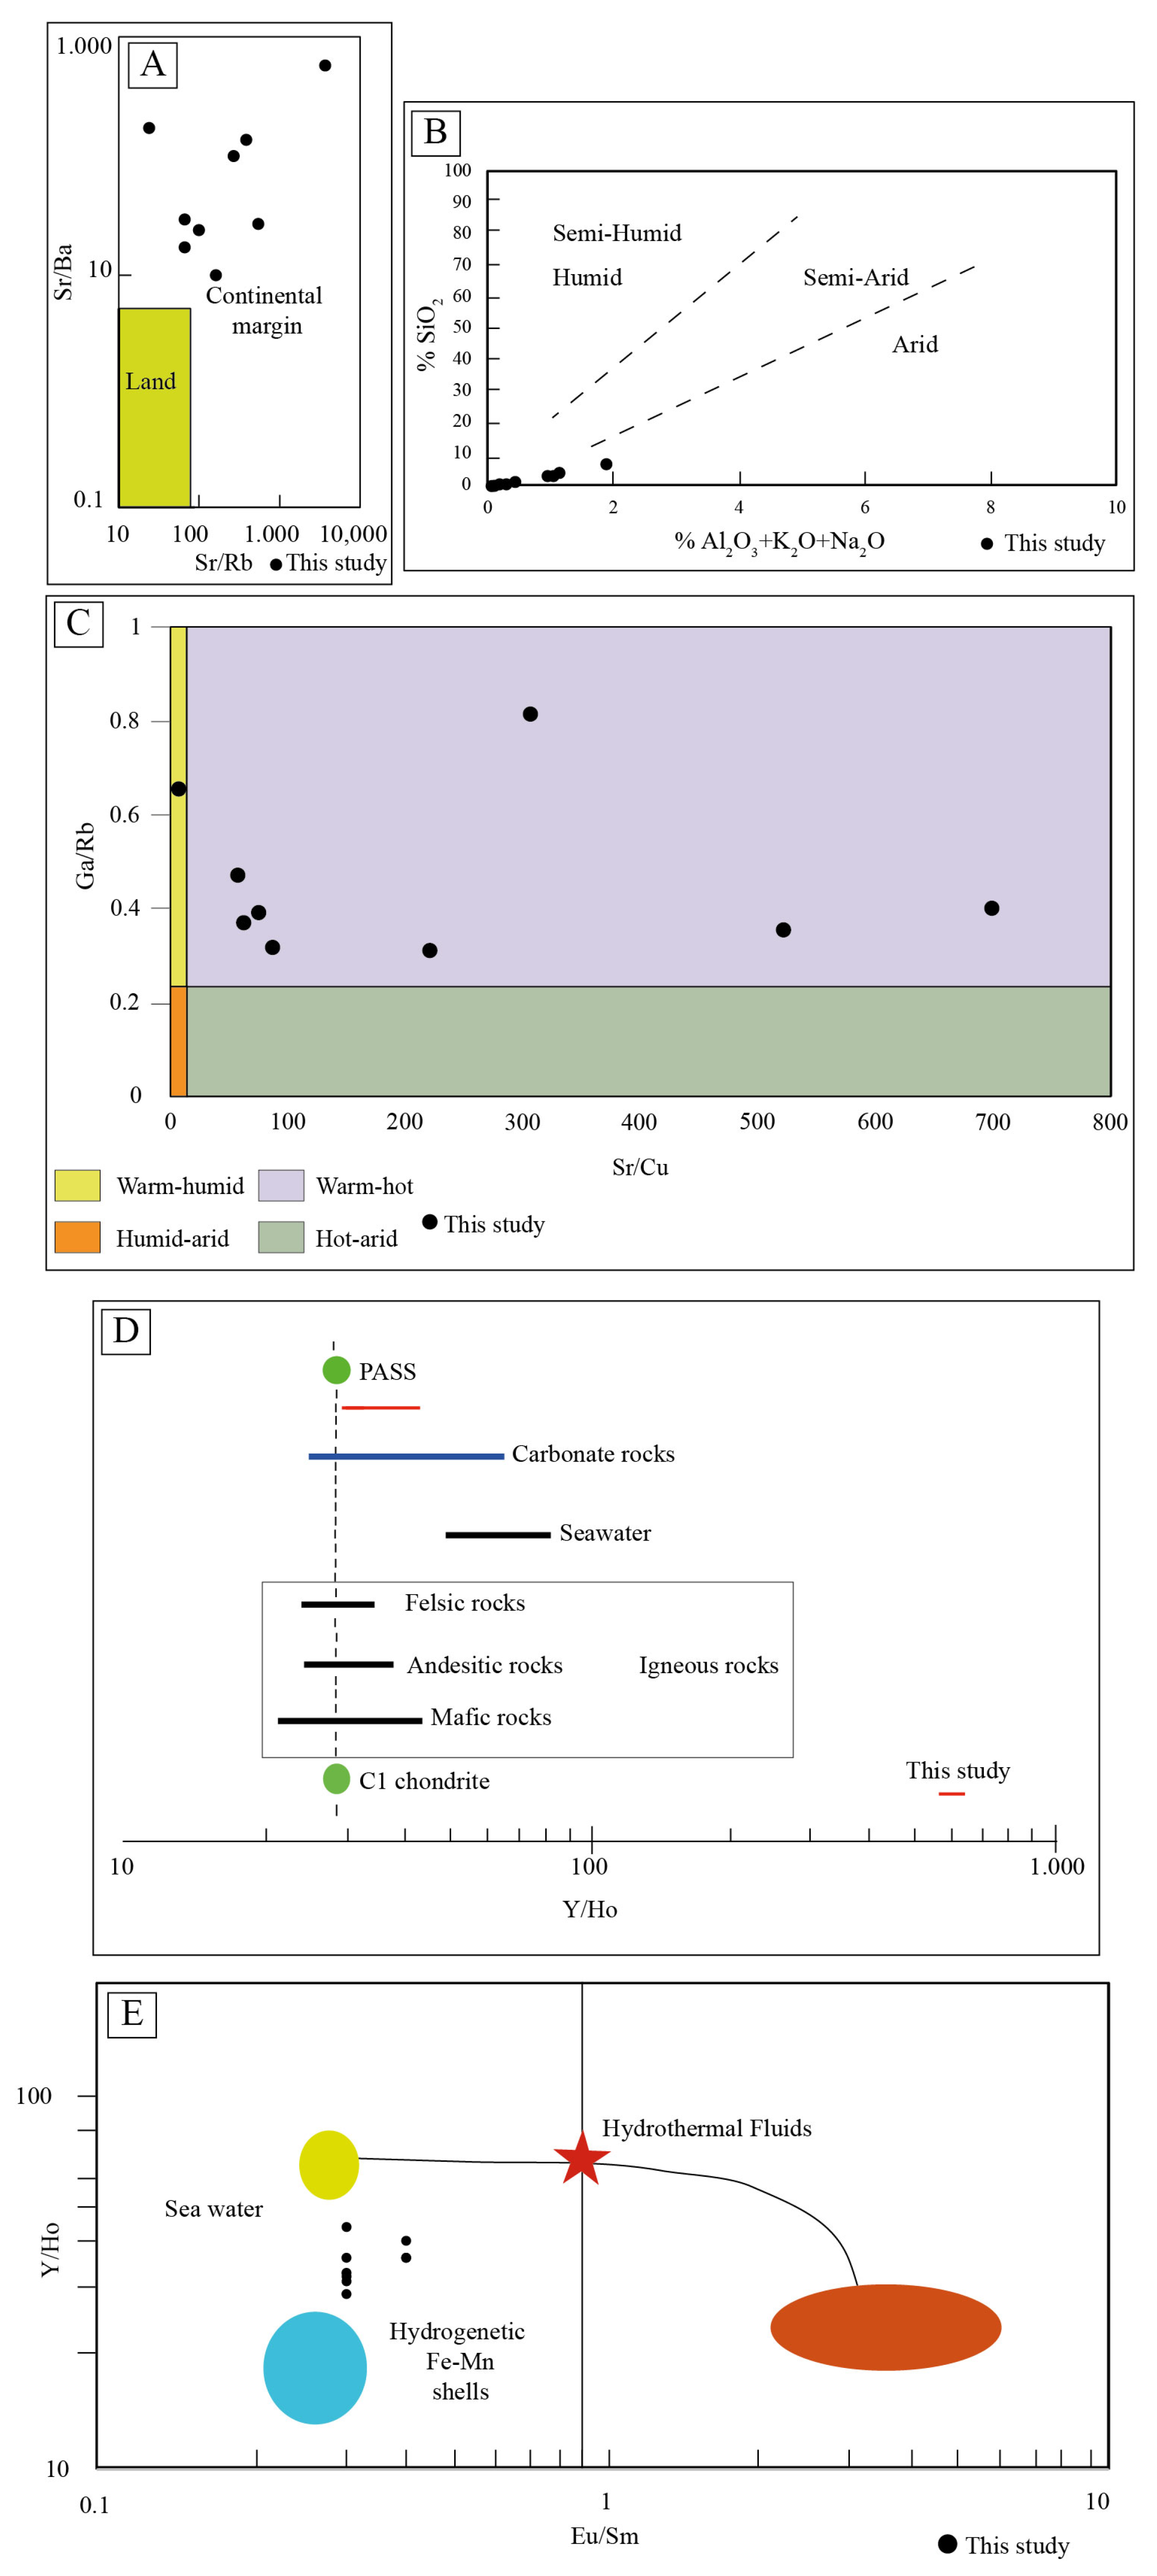
The Sr/Ba ratio can be used to distinguish marine and terrestrial environments. Overall, ratios exceeding 1 indicate sea or saline water, and ratios lower than 1 represent freshwater conditions [35,38]. In this study, Sr/Ba ratios exceeding 1 indicate sea or saline water.
As a result of the evaluation of the samples on the Sr/Ba–Sr/Rb diagram [79], all the samples exhibited deposition in a continental margin shallow marine environment (Figure 15A). According to the SiO2 and Al2O3+K2O+Na2O diagram (modified from [80]), except for one example, the samples were generally considered to be from arid regions (Figure 15B). According to the Ga/Rb and Sr/Cu diagram (modified from [39,75]), all but two of the samples generally fall into warm–hot regions (Figure 15C). Based on these two graphs, it can be said that the environment is warm–hot to arid.
The Y/Ho values vary between 29 and 44 and the mean value is 35. These values are close to those of carbonate rocks and seawater for the depositional environment and source rocks (Figure 15D). According to the Y/Ho and Eu/Sm diagram (modified from [81,82,83]), there is no hydrothermal effect, and the values are close to seawater composition (Figure 15E).
Ce anomalies (Ce/Ce*) are often used as indicators of depositional conditions [75,77]. Ce anomalies are associated with transgression and regression [84]. Ce anomaly values observed in marine limestones are important in determining redox conditions with terrestrial input [39,75,85,86]. Although Ce anomalies are commonly used to reconstruct past seawater redox conditions, there is currently no complete compilation of sedimentary Ce anomaly data [87]. The use of this data is controversial [84]. Generally, shallower water environments present more oxic conditions [39,75,88]. Limestones showing weak negative Ce anomalies indicate deposition in an oxic environment with low terrestrial input [81]. Therefore, the combination of trace element ratios and slightly negative Ce anomalies indicates an oxic environment in the Harami Formation during the early Maastrichtian.
In this study, the Eu anomaly (Eu/Eu*) values are 1.29–1.67 and the mean value is 1.44 (Table 7, Figure 10B). A positive Eu anomaly in the larger benthic foraminifera shows that it is associated with one or more parameters such as increases in O2 and pH or increases in temperature [77,89]. Positive Eu anomalies are mostly due to hydrothermal fluids, a slight increase in detrital feldspar components, and diagenesis [85,90]. Positive Eu anomalies can result not only from hydrothermal fluids but also from the input of detrital feldspars and diagenesis. The fact that the Harami Formation samples have not undergone hydrothermal alteration is shown in the Y/Ho and Eu/Sm diagram in Figure 15E.
Strong correlations can exist between Ce/Ce* and Eu/Eu* in the diagenetic process, and changes in the values of these anomalies can be observed [89,91]. In this study, the low positive correlation of 0.21 between Ce/Ce* and Eu/Eu* indicates a low diagenetic effect (Figure 14G).
Figure 15. (A) Sr/Ba and Sr/Rb ratios indicating shallow marine environment for the Harami Formation (modified from [79]). (B) %SiO2 and %Al2O3+K2O+Na2O indicating paleoclimatic conditions (modified from [80]). (C) Bivariate cross-plot of Sr/Cu and Ga/Rb ratios indicating paleoclimatic conditions for the Harami Formation (modified from [39,75]). (D) Comparison of the Y/Ho ratios in the study area (modified from [92]). (E) Y/Ho and Eu/Sm diagram showing no hydrothermal activity in the study area (modified from [82,83,93]).
Minerals 16 00848 g015

5. Conclusions

The conclusions obtained via the integrated interpretation of previously established micropaleontological characteristics of the Harami Formation and geochemical data obtained first for the same unit—derived in the present study—are described below.
The mean values of 87Sr/86Sr obtained from larger benthic foraminifera, rudist, and rock samples from the Maastrichtian sequence of the Harami Formation were determined to range between 0.707686 and 0.707788. Except for the Ölbe Stream section, the ages derived from the larger benthic foraminifera content in the other sections (early/late Maastrichtian) support the dates found with the 87Sr/86Sr data. In the Ölbe Stream section, while larger benthic foraminifera data indicate the late Maastrichtian period, analytical results (0.707686) correspond to the early Maastrichtian period; this difference is thought to be due to diagenesis.
Mean paleotemperature values calculated from the δ18O analysis results of larger benthic foraminifera, rudist, and rock samples of Harami Formation indicate a decline from the late Campanian to the early Maastrichtian, and an increase from the early Maastrichtian to the late Maastrichtian.
Comparing stable isotope data from larger benthic foraminifera, rudist, and rock samples from the late Campanian–Maastrichtian period revealed that larger benthic foraminifera samples were less affected by diagenesis than rock and rudist samples.
Geochemical findings regarding major elements indicate that the majority of Si, Na, K, and Ti originated from clay minerals, while feldspar and quartz were derived from the same source area. These findings also suggest a terrestrial origin for Fe, with high Fe concentrations implying the proximity of the terrestrial source area and a relatively shallow marine depositional environment.
Redox-sensitive trace element ratios (V/Cr and V/V+Ni) indicate an oxic environment. Paleoclimatic proxies (Sr/Cu, Rb/Sr, Sr/Ba) are indicative of persistent arid climate conditions and fluctuating salinity. An Sr/Ba ratio exceeding 1 indicates a marine or saline water environment. Similar variations in the Sr/Cu and Sr/Ba ratios in the Harami Formation samples indicate that salinity in the basin is controlled by climate changes. Some geochemical analysis results (i.e., SiO2 and Al2O3+K2O+Na2O; Ga/Rb and Sr/Cu ratios) support the interpretation that the Harami Formation was deposited in a shallow marine environment within a region characterized by warm-hot to arid climatic conditions.
Although positive Eu anomalies can result from hydrothermal fluids, detrital feldspars introduced into the environment, or diagenesis, the Y/Ho and Eu/Sm values in Figure 15E indicate that the Harami Formation was deposited in a marine environment where there was no hydrothermal activity.
The weak negative Ce anomalies and trace element ratios of Harami Formation’s limestones indicate deposition in an oxic environment with low terrestrial input.
The positive Eu anomaly in larger benthic foraminifera can be explained by multiple parameters, such as an increase in O2 and pH or an increase in temperature in the environment. Although positive Eu anomalies can result from hydrothermal fluids, detrital feldspars input into the environment, or diagenesis, the Y/Ho and Eu/Sm values in Figure 15E indicate the absence of hydrothermal activity in the environment.
Strong correlations can be observed between Ce/Ce* and Eu/Eu* due to diagenetic processes, and the value of these ratios may vary depending on the degree of diagenesis. In this study, the low positive correlation of 0.21 between Ce/Ce* and Eu/Eu* indicates a low diagenetic effect.
Consequently, the paleontological age assessment (late Campanian–Maastrichtian) of the carbonate-dominated Harami Formation depended on radiometric data on larger benthic foraminifera, rudist, and rock samples from five outcrops around Elazığ (Eastern Türkiye). Using the geochemical data (stable isotopes, XRF, ICP-MS, SEM-EDS), the depositional environment in an oxic, shallow-marine carbonate platform setting characterized by climate-controlled variations in salinity, no hydrothermal activity, low terrestrial input, and warm-to-hot, arid climatic conditions was also assessed. The diagenetic alteration is limited except for the Ölbe Stream.
The stable isotopes confirmed the general cooling trend from the late Campanian to the early Maastrichtian, followed by a renewed warming during the late Maastrichtian.

Supplementary Materials

The following supporting information can be downloaded at: https://www.mdpi.com/article/10.3390/min16080848/s1, Table S1: Trace element values (ppm) obtained from ICP-MS analysis of the samples; Table S2: Rare earth element values (ppm) obtained from ICP-MS analysis of the samples.

Author Contributions

Conceptualization, S.K., E.A. and M.Ö.; methodology, S.K., E.A. and M.Ö.; formal analysis, S.K. and E.A.; investigation, S.K., E.A. and M.Ö.; resources, S.K., E.A. and M.Ö.; data curation, S.K., E.A. and M.Ö.; visualization, S.K. and E.A.; writing—original draft preparation, S.K., E.A. and M.Ö.; writing—review and editing, S.K., E.A. and M.Ö.; validation, S.K., E.A. and M.Ö.; supervision, S.K., E.A. and M.Ö.; project administration, S.K. All authors have read and agreed to the published version of the manuscript.

Funding

This study was financially supported by the Scientific and Technological Research Council of Turkey (TUBITAK) and the Fırat University Scientific Research Projects Support Program (FUBAP) under the Grant Numbers TUBITAK 123Y221, MF.24.77, MF.24.78, MF.25.81, and MF.26.17.

Data Availability Statement

The original contributions presented in this study are included in the article. Further inquiries can be directed to the corresponding author.

Acknowledgments

The authors thank TUBITAK and FUBAP for their support.

Conflicts of Interest

The authors declare no conflicts of interest.

References

  1. Erdoğan, T. Gölbaşı civarının jeolojisi. TPAO Raporu 1975, 929, 1–18. (In Turkish) [Google Scholar]
  2. Perinçek, D. The Geology of Hazro-Korudağ, Çüngüş-Maden-Ergani-Hazar-Elazığ-Malatya Region; Geological Society of Turkey: Ankara, Turkey, 1979; pp. 3–33. (In Turkish) [Google Scholar]
  3. Sungurlu, O.; Perinçek, D.; Kurt, G.; Tuna, E.; Dülger, S.; Çelikdemir, E.; Naz, H. Geology of the Elazığ-Hazar-Palu Area. TPAO Raporu 1985, 29, 83–191. [Google Scholar]
  4. Aksoy, E. Elazığ batı ve güneyinin genel jeolojik özellikleri. Doğa-Türk Yerbilim. Derg. 1993, 2, 113–123. (In Turkish) [Google Scholar]
  5. İnceöz, M. Elazığ yakın kuzeyinde Harami Formasyonu’nun (Üst Maastrihtiyen) stratigrafisi ve çökelme ortamları. TPAO Bül. 1996, 8, 130–136. (In Turkish) [Google Scholar]
  6. Aksoy, E.; Türkmen, İ.; Turan, M.; Meriç, E. Harami Formasyonu’nun (Üst Kampaniyen-Maastrihtiyen) stratigrafik konumu ve çökelme ortamıyla ilgili yeni bulgular, Elazığ güneyi. TPAO Bül. 1999, 11, 1–15. (In Turkish) [Google Scholar]
  7. Özgen, N.; İnan, N.; Akyazı, M. Harabekayış Formasyonu’nun (Elazığ) tanımlanması. Türkiye Jeol. Bül. 1993, 8, 135–147. (In Turkish) [Google Scholar]
  8. Kaya, M.; İnceöz, M. Elazığ çevresinde Harami Formasyonu’nun foraminifer içeriği ve fasiyes özellikleri. Geosound 2001, 39, 143–154. (In Turkish) [Google Scholar]
  9. Kayğılı, S. Foraminiferal micropaleontology of the Harami Formation (Elazığ, Eastern Türkiye), and reassessment of its age based on larger benthic foraminifera. Turk. J. Earth Sci. 2023, 32, 487–509. [Google Scholar] [CrossRef] [Scilit]
  10. Kayğılı, S.; Özkul, M.; Aksoy, E. Geological and cultural heritages of Harput old city (Elazığ, Eastern Türkiye). Geoheritage 2026, 18, 24. [Google Scholar] [CrossRef] [Scilit]
  11. Erdem, M.E.; Özcan, E.; Yücel, A.O.; Okay, A.I.; Erbay, S.; Kayğılı, S.; Yılmaz, İ. Late Campanian larger benthic foraminifera from the Zekeriyaköy Formation (İstanbul, NW Turkey): Taxonomy, stratigraphy and paleogeography. Turk. J. Earth Sci. 2021, 30, 1–21. [Google Scholar] [CrossRef] [Scilit]
  12. Görmüş, M.; Meriç, E.; Avşar, N. Pazarcık (K. Maraş) yöresi Maastrihtiyen bentik foraminiferlerinin sistematik incelemesi, paleoekolojisi ve Hekimhan (KB Malatya) Malatya yöresi ile karşılaştırılması. SDÜ Fen Bilim. Enstitüsü Derg. 1995, 1, 65–84. (In Turkish) [Google Scholar]
  13. Meriç, E. An aspect of Omphalocyclus macroporus (Lamarck). Micropaleontology 1967, 13, 369–380. [Google Scholar] [CrossRef] [Scilit] [PubMed]
  14. Meriç, E. Pseudomphalocyclus blumenthali, a new genus and species from the upper Maastrichtian of Southern Turkey. Micropaleontology 1980, 26, 84–89. [Google Scholar] [CrossRef] [Scilit]
  15. Meriç, E.; Görmüş, M.; Luger, P.; İnan, N.; Çoruh, T. Palaeogeographical distribution of Pseudomphalocyclus blumenthali Meriç (foraminiferida) in the Maastrichtian of the eastern central Tethys with a short taxonomical review of some orbitoidid foraminifera. Rev. Esp. Micropaleontol. 2010, 42, 119–127. [Google Scholar]
  16. Özcan, E.; Özkan Altıner, S. The genera Lepidorbitoides and Orbitoides: Evolution and stratigraphic significance in some anatolian basins. Geol. J. 1999, 34, 275–286. [Google Scholar] [CrossRef] [Scilit]
  17. Özcan, E.; Özkan Altıner, S. Description of an early ontogenetic evolutionary step in Lepidorbitoides: Lepidorbitoides bisambergensis asymmetrica subsp. n. early Maastrichtian (Central Turkey). Riv. Ital. Paleontol. Stratigr. 2001, 107, 137–144. [Google Scholar] [CrossRef] [Scilit] [PubMed]
  18. Özcan, E.; Yücel, A.O.; Catanzariti, R.; Kayğılı, S.; Okay, A.I.; Simmons, M.D.; Pignatti, J.; Abbasi, İ.A.; Erbil, Ü. Multiple Orbitoides d’Orbigny lineages in the Maastrichtian? Data from the Central Sakarya Basin (Turkey) and Arabian platform successions (Southeastern Turkey and Oman). Swiss J. Palaeontol. 2021, 140, 8. [Google Scholar] [CrossRef] [Scilit]
  19. Özcan, E.; Abbasi, İ.A.; Yücel, A.O.; Aşcı, S.Y.; Erkızan, L.S.; El-Ghali, M.A.K.; Çalışkan, D.; Gültekin, M.N.İ.; Kayğılı, S. First record of the foraminiferal genera Clypeorbis Douvillé and Ilgazina Erdoğan from the Maastrichtian of the Arabian Peninsula (Simsima Formation, North Oman): Paleobiogeographic implications. Cret. Res. 2022, 138, 105290. [Google Scholar] [CrossRef] [Scilit]
  20. Sanità, E.; Lardeaux, J.M.; Marroni, M.; Pandolfi, L. Kinematics of the Helminthoid Flysch-Marguareis Unit tectonic coupling: Consequences for the tectonic evolution of Western Ligurian Alps. Comptes Rendus. Géosci. 2022, 354, 141–157. [Google Scholar] [CrossRef] [Scilit]
  21. Sanità, E.; Conconi, R.; Lorenzon, S.; Di Rosa, M.; Capitani, G.; Mugnaioli, E. Application of an improved TEM-EDS protocol based on charge balance for accurate chemical analysis of sub-micrometric phyllosilicates in low-grade metamorphic rocks. Clays Clay Mineral. 2024, 72, e31. [Google Scholar] [CrossRef] [Scilit]
  22. Sanità, E.; Di Rosa, M.; Della Porta, G.; Catanzariti, R.; Pandolfi, L.; Marroni, M. Trench sediment heterogeneity controls accretion mechanisms in subduction zone. Sci. Rep. 2025, 15, 34793. [Google Scholar] [CrossRef] [Scilit] [PubMed]
  23. Köksal, S. The upper Cretaceous intrusive rocks with extensive crustal contribution in Hacımahmutuşağı area (Aksaray/Turkey). Geol. Carpathica 2019, 70, 261–276. [Google Scholar] [CrossRef] [Scilit]
  24. Anderson, T.F.; Arthur, M.A. Stable isotopes of oxygen and carbon and their applicaiton to sedimentologic and paleoenvironmental problems, stable isotopes in sedimentary geology. SEPM Short Course 1983, 10, 1–151. [Google Scholar]
  25. Lynch-Stieglitz, J.; Curry, W.B.; Slowey, N.A. Geostrophic transport estimate for the Florida current from the oxygen isotope composition of benthic foraminifera. Paleoceanography 1999, 14, 360–373. [Google Scholar] [CrossRef] [Scilit]
  26. Steuber, T. Cretaceous rudists of Boeotia, central Greece. Spec. Pap. Palaeontol. 1999, 61, 1–229. [Google Scholar]
  27. Steuber, T. Isotopic and chemical intra-shell variations in low-Mg calcite of rudist bivalves (Mollusca: Hippuritacea)-disequilibrium fractionations and late Cretaceous seasonality. Int. J. Earth Sci. 1999, 88, 551–570. [Google Scholar] [CrossRef] [Scilit]
  28. Cramer, B.S.; Miller, K.G.; Barrett, P.J.; Wright, J.D. Late Cretaceous-Neogene trends in deep ocean temperature and continental ice volume: Reconciling records of benthic foraminiferal geochemistry (d18O and Mg/Ca) with sea level history. J. Geophys. Res. 2011, 116, C12023. [Google Scholar] [CrossRef] [Scilit]
  29. El-Shazly, S.; Kostak, M.; Gawad, G.A.; Klouckova, B.; Saber, S.G.; Salama, Y.F.; Mazuch, M.; Zak, K. Carbon and oxygen stable isotopes of selected Cenomanian and Turonian rudists from Egypt and Czech Republic, and a note on changes in rudist diversity. Bull. Geosci. 2011, 86, 2. [Google Scholar] [CrossRef] [Scilit]
  30. McArthur, J.M.; Howarth, R.J.; Shields, G.A.; Zhou, Y. Strontium isotope stratigraphy. Geol. Time Scale 2020, 2, 211–238. [Google Scholar] [CrossRef] [Scilit]
  31. Taylor, S.R.; McLennan, S.M. The Continental Crust: Its Composition and Evolution; Blackwell Scientific Publications: Oxford, UK, 1985; 312p. [Google Scholar]
  32. Turekian, K.K.; Wedepohl, K.H. Distribution of the elements in some major units of the earth’s crust. GSA Bull. 1961, 72, 175–192. [Google Scholar] [CrossRef] [Scilit]
  33. Hatch, J.R.; Leventhal, J.S. Relationship between inferred redox potential of the depositional environment and geochemistry of the upper Pennsylvanian (Missourian) Stark Shale Member of the Dennis limestone, Wabaunsee County, Kansas, USA. Chem. Geol. 1992, 99, 65–82. [Google Scholar] [CrossRef] [Scilit]
  34. Jones, B.; Manning, D.A.C. Comparison of geochemical indices used for the interpretation of palaeoredox conditions in ancient mudstones. Chem. Geol. 1994, 111, 111–129. [Google Scholar] [CrossRef] [Scilit]
  35. Wang, A.H. Discriminant effect of sedimentary environment by the Sr/Ba ratio of different existing forms. Acta Sedimentol. Sin. 1996, 14, 168–173, (In Chinese with English Abstract). [Google Scholar]
  36. Meng, Q.T.; Liu, Z.J.; Bruch, A.A.; Liu, R.; Hu, F. Palaeoclimatic evolution during Eocene and its influence on oil shale mineralisation, Fushun basin, China. J. Asian Earth Sci. 2012, 45, 95–105. [Google Scholar] [CrossRef] [Scilit]
  37. Jia, J.L.; Liu, Z.J.; Bechtel, A.; Strobl, S.A.I.; Sun, P.C. Tectonic and climate control of oil shale deposition in the upper Cretaceous Qingshankou Formation (Songliao basin, NE China). Int. J. Earth Sci. 2013, 102, 1717–1734. [Google Scholar] [CrossRef] [Scilit]
  38. Peng, S.; Hao, Q.; Wang, L.; Ding, M.; Zhang, W.; Wang, Y.; Guo, Z. Geochemical and grain-size evidence for the provenance of loess deposits in the central Shandong Mountains region, northern China. Quat. Res. 2016, 85, 290–298. [Google Scholar] [CrossRef] [Scilit]
  39. Ding, J.; Zhang, J.; Tang, X.; Huo, Z.; Han, S.; Lang, Y.; Zheng, Y.; Li, X.; Liu, T. Elemental geochemical evidence for depositional conditions and organic matter enrichment of black rock series strata in an inter-platform basin: The lower Carboniferous Datang Formation, Southern Guizhou, Southwest China. Minerals 2018, 8, 509. [Google Scholar] [CrossRef] [Scilit]
  40. Dai, S.; Bechtel, A.; Eble, C.F.; Flores, R.M.; French, D.; Graham, I.T.; Hood, M.M.; Hower, J.C.; Korasidish, V.A.; Moore, T.A.; et al. Recognition of peat depositional environments in coal: A review. Int. J. Coal Geol. 2020, 219, 103383. [Google Scholar] [CrossRef] [Scilit]
  41. Zou, C.; Mao, L.; Tan, Z.; Zhou, L.; Liu, L. Geochemistry of major and trace elements in sediments from the Lubei plain, China: Constraints for paleoclimate, paleosalinity, and paleoredox environment. J. Asian Earth Sci. 2021, 6, 100071. [Google Scholar] [CrossRef] [Scilit]
  42. Eric, B.E.; Adama, A.; Etutu, M.E.M.M.; Kwankam, F.N.; Betrant, B.S.; Esue, M.F. Paleoclimate characteristics of source area weathering and metallogenic implication of cretaceous black shales in the Mamfe basin, (SW Cameroon): Evidence from lithogeochemistry. Heliyon 2023, 9, e17142. [Google Scholar] [CrossRef] [Scilit] [PubMed]
  43. Huber, B.T.; Norris, R.D.; MacLeod, K.G. Deep-sea paleotemperature record of extreme warmth during the Cretaceous. Geology 2002, 30, 123–126. [Google Scholar] [CrossRef] [Scilit]
  44. Friedrich, O.; Norris, R.D.; Erbacher, J. Evolution of middle to late Cretaceous oceans-a 55 m.y. record of earth’s temperature and carbon cycle. Geology 2012, 40, 107–110. [Google Scholar] [CrossRef] [Scilit]
  45. Koch, M.C.; Friedrich, O. Campanian-Maastrichtian intermediate-to deep-water changes in the high latitudes: Benthic foraminiferal evidence. Paleoceanography 2012, 27, PA2209. [Google Scholar] [CrossRef] [Scilit]
  46. Bornemann, A.; Norris, R.D.; Friedrich, O.; Beckmann, B.; Schouten, S.; Damsté, J.S.S.; Vogel, J.; Hofmann, P.; Wagner, T. Isotopic evidence for glaciation during the Cretaceous supergreenhouse. Science 2008, 319, 189–192. [Google Scholar] [CrossRef] [Scilit] [PubMed]
  47. O’Brien, C.L.; Robinson, S.A.; Pancost, R.D.; Sinninghe Damst’e, J.S.; Schouten, S.; Lunt, D.J.; Alsenz, H.; Bornemann, A.; Bottini, C.; Brassell, S.C.; et al. Cretaceous sea-surface temperature evolution: Constraints from TEX86 and planktonic foraminiferal oxygen isotopes. Earth Sci. Rev. 2017, 172, 224–247. [Google Scholar] [CrossRef] [Scilit]
  48. Miller, K.G.; Schmelz, W.J.; Browning, J.V.; Kopp, R.E.; Mountain, G.S.; Wright, J.D. Ancient sea level: As key to the future. Oceanography 2020, 33, 32–41. [Google Scholar] [CrossRef] [Scilit]
  49. Abramovich, S.; Keller, G.; Stüben, D.; Berner, Z. Characterization of late Campanian and Maastrichtian planktonic foraminiferal depth habitats and vital activities based on stable isotopes. Palaeogeogr. Palaeoclimatol. Palaeoecol. 2003, 202, 1–29. [Google Scholar] [CrossRef] [Scilit]
  50. Linnert, C.; Robinson, S.A.; Lees, J.A.; P’erez Rodríguez, I.; Jenkyns, H.C.; Rose Petrizzo, M.; Arz, J.A.; Bown, P.R.; Falzoni, F. Did late Cretaceous cooling trigger the Campanian-Maastrichtian boundary event? News. Stratigr. 2017, 51, 145–166. [Google Scholar] [CrossRef]
  51. Linnert, C.; Robinson, S.A.; Lees, J.A.; Bown, P.R.; P’erez-Rodríguez, I.; Petrizzo, M.R.; Falzoni, F.; Littler, K.; Arz, J.A.; Russell, E.E. Evidence for global cooling in the late Cretaceous. Nat. Commun. 2014, 5, 4194. [Google Scholar] [CrossRef] [Scilit] [PubMed]
  52. Thibault, N.; Schovsbo, N.; Harlou, R.; Stemmerik, L.; Surlyk, F. An age-calibrated record of opper Campanian-Maastrichtian climate change in the Boreal Realm. In Proceedings of the Abstract PP21C-1810, Fall Meeting, AGU, San Francisco, CA, USA, 5–9 December 2011. [Google Scholar]
  53. McArthur, J.M.; Howarth, R.J.; Shields, G.A. Strontium isotope stratigraphy. In A Geological Timescale; Gradstein, F., Ogg, J., Schmitz, M., Ogg, G., Eds.; Elsevier: Amsterdam, The Netherlands, 2012. [Google Scholar]
  54. McArthur, J.M.; Howarth, R.J. Strontium isotope stratigraphy of the Cretaceous. Geol. Soc. Spec. Publ. 2025, 544, 343–366. [Google Scholar] [CrossRef] [Scilit]
  55. İslamoğlu, Y.; Taner, G. 87Sr/86Sr izotop kronostratigrafisi, yöntem ve yorumları. Jeol. Mühendisliği Derg. 1997, 50, 59–70. (In Turkish) [Google Scholar]
  56. McArthur, J.M.; Howarth, R.J.; Bailey, T.R. Strontium isotope stratigraphy: Lowess version 3: Best fit to the marine Sr-isotope curve for 0–509 Ma and accompanying look-up table for deriving numerical age. J. Geol. 2001, 109, 155–170. [Google Scholar] [CrossRef] [Scilit]
  57. McArthur, J.M.; Howarth, R.J. Sr Isotope Stratigraphy. In A Geological Timescale; Gradstein, F.M., Ogg, J.G., Smith, A.G., Eds.; Cambridge University Press: Cambridge, UK, 2004. [Google Scholar]
  58. Mokadem, F.; Parkinson, I.J.; Hathorne, E.C.; Anand, P.; Allen, J.T.; Burton, K.W. High precision radiogenic strontium isotope measurements of the modern and glacial ocean: Limits on glacial-interglacial variations in continental weathering. Earth Planet. Sci. Lett. 2015, 415, 111–120. [Google Scholar] [CrossRef] [Scilit]
  59. Korbar, T.; Tešovıć, B.C.; Radovanovıć, I.; Krızmanıć, K.; Steuber, T.; Skelton, P.W. Campanian Pseudosabinia from the Pučišća Formation on the İsland of Hvar (Adriatic Sea, Croatia). Turk. J. Earth Sci. 2010, 19, 721–731. [Google Scholar] [CrossRef] [Scilit]
  60. Boix, C.; Frijia, G.; Vicedo, V.; Bernaus, J.M.; Lucia, M.D.; Parente, M.; Caus, E. Larger foraminifera distribution and strontium isotope stratigraphy of the La Cova limestones (Coniacian-Santonian, “Serra del Montsec”, Pyrenees, NE Spain). Cretac. Res. 2011, 32, 806–822. [Google Scholar] [CrossRef] [Scilit]
  61. Steuber, T.; Schlüter, M. Strontium-isotope stratigraphy of upper Cretaceous rudist bivalves: Biozones, evolutionary patterns and sea-level change calibrated to numerical ages. Earth Sci. Rev. 2012, 114, 42–60. [Google Scholar] [CrossRef] [Scilit]
  62. Frijia, G.; Parente, M.; Lucia, M.D.; Mutti, M. Carbon and strontium isotope stratigraphy of the upper Cretaceous (Cenomanian-Campanian) shallow-water carbonates of southern Italy: Chronostratigraphic calibration of larger foraminifera Biostratigraphy. Cretac. Res. 2015, 53, 110–139. [Google Scholar] [CrossRef] [Scilit]
  63. Villalonga, R.; Boix, C.; Frijia, G.; Parente, M.; Bernaus, J.M.; Caus, E. Larger foraminifera and strontium isotope stratigraphy of middle Campanian shallow-water lagoonal facies of the Pyrenean Basin (NE Spain). Facies 2019, 65, 20. [Google Scholar] [CrossRef] [Scilit]
  64. Farouk, S.; Bazeen, Y.S.; Ahmad, F.; Elamri, Z.; Al-Kahtany, K.; Frontalini, F.; Zaky, A.S. The Campanian-Maastrichtian benthic foraminiferal assemblages at the Elles section (Tunisia): A perspective for paleoenvironmental, paleobathymetric and sea-level fluctuation reconstruction. Palaeogeogr. Palaeoclimatol. Palaeoecol. 2024, 654, 112453. [Google Scholar]
  65. Katz, M.E.; Cramer, B.S.; Franzese, A.; Honisch, B.; Miller, K.G.; Rosenthal, Y.; Wright, J.D. Traditional and emerging geochemical proxies in foraminifera. J. Foraminifer. Res. 2010, 40, 165–192. [Google Scholar] [CrossRef] [Scilit]
  66. Dinçer, F. Eocene benthic foraminiferal assemblages from Central Anatolia (Turkey): Biostratigraphy, stable isotope data, paleoenvironmental and paleontological interpretations. J. Afr. Earth Sci. 2016, 114, 143–157. [Google Scholar] [CrossRef] [Scilit]
  67. Pearson, P.N. Oxygen isotopes in foraminifera: Overview and historical review. Paleontol. Soc. Pap. 2012, 18, 1–38. [Google Scholar] [CrossRef] [Scilit]
  68. Zhang, K.J.; Li, Q.H.; Yan, L.L.; Zeng, L.; Lu, L.; Zhang, Y.X.; Hui, J.; Jin, X.; Tang, X.C. Geochemistry of limestones deposited in various plate tectonic settings. Earth Sci. Rev. 2017, 167, 26–47. [Google Scholar] [CrossRef] [Scilit]
  69. Tribovillard, N.; Algeo, T.J.; Lyons, T.; Armelle Riboulleau, A. Trace metals as paleoredox and paleoproductivity proxies: An update. Chem. Geol. 2006, 232, 12–32. [Google Scholar] [CrossRef] [Scilit]
  70. Hottinger, L. Shallow benthic foraminiferal assemblages as signals for depth of their deposition and their limitations. Bull. Soc. Géol. Fr. 1997, 168, 491–505. [Google Scholar]
  71. Flügel, E. Microfacies of Carbonate Rocks, Analysis, Interpretation and Application; Springer: Berlin, Germany, 2010; 976p. [Google Scholar]
  72. Frimmel, H.E. Trace element distribution in Neoproterozoic carbonates as paleoenvironmental indicator. Chem. Geol. 2009, 258, 338–353. [Google Scholar] [CrossRef] [Scilit]
  73. Murray, J.W. Distribution and ecology of living benthic foraminiferids. Crane Russak Co. 1973, Xiii, 24–75. [Google Scholar]
  74. Boudagher Fadel, M.K. Evolution and geological significance of larger benthic foraminifera. Dev. Palaeontol. Stratigr. 2008, 21, 544. [Google Scholar]
  75. Xie, G.; Shen, Y.; Liu, S.; Hao, W. Trace and rare earth element (REE) characteristics of mudstones from Eocene Pinghu Formation and Oligocene Huagang Formation in Xihu Sag, East China Sea Basin: Implications for provenance, depositional conditions and paleoclimate. Mar. Pet. Geol. 2018, 92, 20–36. [Google Scholar] [CrossRef] [Scilit]
  76. Bozkurt, A.; Görmüş, M.; Bozkurt, T.B. Middle Eocene Alveolina-dominated benthic foraminiferal assemblages of the western flank of the Isparta Angle (SW Türkiye): Taxonomy, biostratigraphy, microfacies analysis, and paleoenvironmental implications. Turk. J. Earth Sci. 2023, 32, 854–879. [Google Scholar] [CrossRef] [Scilit]
  77. Sinanoğlu, D.; Şaşmaz, A. Geochemical evidence on the depositional environment of Nummulites accumulations around Elazığ, Sivas, and Eskişehir (Turkey) in the middle Eocene sub-epoch. Arab. J. Geosci. 2019, 12, 759. [Google Scholar] [CrossRef] [Scilit]
  78. Yan, K.; Wang, C.L.; Mischke, S.; Wang, J.Y.; Shen, L.J.; Yu, X.C.; Meng, L.Y. Major and trace-element geochemistry of late Cretaceous clastic rocks in the Jitai Basin, southeast China. Sci. Rep. 2021, 11, 13846. [Google Scholar] [CrossRef] [Scilit] [PubMed]
  79. Mirza, T.A.; Karim, K.H.; Ridha, S.M.; Fatah, C.M. Major, trace, rare earth element, and stable isotope analyses of the Triassic carbonates along the northeastern Arabian Plate margin: A key to understanding paleotectonics and paleoenvironment of the Avroman (Biston) limestone formation from Kurdistan region, northeastern Iraq. Carbonates Evaporites 2021, 36, 66. [Google Scholar] [CrossRef] [Scilit]
  80. Suttner, L.J.; Dutta, P.K. Alluvial sandstone composition and palaeoclimate framework mineralogy. J. Sediment. Petrol. 1986, 56, 329–345. [Google Scholar] [CrossRef] [Scilit]
  81. Song, C.; Herong, G.; Linhua, S. Geochemical characteristics of REE in the late neo-proterozoic limestone from the northern Anhui Province, China. Chin. J. Geochem. 2014, 33, 187–193. [Google Scholar] [CrossRef] [Scilit]
  82. Wang, L.S.; Hu, S.Y.; Yu, G.; Ma, M.M.; Qing, Z. Magnetic characteristics of sediments from a radial sand ridge field in the South Yellow Sea, Eastern China, and environmental implications during the mid-to late-Holocene. J. Asian Earth Sci. 2018, 163, 224–234. [Google Scholar] [CrossRef] [Scilit]
  83. Khalil, R. Sedimentological and geochemical evaluation of the lower Cretaceous Yamama Formation, Riyadh, Saudi Arabia: An integrated tool for paleoenvironmental interpretation. Minerals 2024, 14, 1275. [Google Scholar] [CrossRef] [Scilit]
  84. Wilde, P.; Quinby-Hunt, M.S.; Erdtmann, B.D. The Whole-rock cerium anomaly: A potential indicator of eustatic sea-level changes in shales of the anoxic facies. Sediment. Geol. 1996, 101, 43–53. [Google Scholar] [CrossRef] [Scilit]
  85. Madhavaraju, J.; González-León, C.M.; Lee, Y.I.; Armstrong-Altrin, J.S.; Reyes Campero, L.M. Geochemistry of the Mural Formation (Aptian-Albian) of the Bisbee Group, Northern Sonora, Mexico. Cretac. Res. 2010, 31, 400–414. [Google Scholar] [CrossRef] [Scilit]
  86. Mao, L.J.; Mo, D.W.; Yang, J.H.; Guo, Y.Y.; Lv, H.Y. Rare earth elements geochemistry in surface floodplain sediments from the Xiangjiang River, middle reach of Changjiang River, China. Quat. Int. 2014, 336, 80–88. [Google Scholar] [CrossRef] [Scilit]
  87. Zhang, K.; Shields, G.A. Sedimentary Ce anomalies: Secular change and implications for paleoenvironmental evolution. Earth Sci. Rev. 2022, 229, 104015. [Google Scholar] [CrossRef] [Scilit]
  88. Zhou, L.; Algeo, T.J.; Shen, J.; Hu, Z.; Gong, H.; Xie, S.C.; Huang, J.H.; Gao, S. Changes in marine productivity and redox conditions during the late Ordovician Hirnantian glaciation. Palaeogeogr. Palaeoclimatol. Palaeoecol. 2015, 420, 223–234. [Google Scholar] [CrossRef] [Scilit]
  89. Tobia, F.H. Stable isotope and rare earth element geochemistry of the Baluti carbonates (Upper Triassic), Northern Iraq. Geosci. J. 2018, 22, 975–987. [Google Scholar] [CrossRef] [Scilit]
  90. Brand, U.; Veizer, J. Chemical diagenesis of a multi-component carbonate system: Trace elements. J. Sediment. Petrol. 1980, 50, 1219–1236. [Google Scholar] [CrossRef] [Scilit]
  91. Liu, S.; Liu, Y.; Lin, G.; Zhou, Y.; Gong, F.; Zhang, D. REE geochemical characteristics and geological significance of mudstones from Neogene, Nanpu Sag, Bohai Basin. Geoscience 2006, 20, 449–456. [Google Scholar]
  92. Bau, M.; Dulski, P. Comparative study of yttrium and rare-earth element behaviours in fluorine-rich hydrothermal fluids. Contrib. Mineral. Petrol. 1995, 119, 213–223. [Google Scholar] [CrossRef]
  93. Bau, M.; Dulski, P. Comparing Yttrium and rare earths in hydrothermal fluids from the Mid-Atlantic Ridge: Implications for Y and REE behaviour during near vent mixing and for the Y/Ho ratio of Proterozoic seawater. Chem. Geol. 1999, 155, 77–90. [Google Scholar] [CrossRef] [Scilit]
Figure 5. (A) Stable isotope analysis results of the samples taken from measured sections of Eskişehir Hill and (B) Tepeköy. The star symbol represents the location of the analyzed samples collected.
Minerals 16 00848 g005
Figure 6. (A) Stable isotope analysis results of the samples from measured sections of Nohutlupınarı and (B) Guremağalan. The star symbol represents the location of the analyzed samples collected.
Minerals 16 00848 g006
Figure 7. (A) Stable isotope analysis results of the samples from measured sections of Silsilekaya Hill and (B) Ürünveren. The star symbol represents the location of the analyzed samples collected.
Minerals 16 00848 g007
Figure 8. (A) Stable isotope analysis results of the samples from the Buzluk section and (B) Ölbe Stream measured sections. The star symbol represents the location of the analyzed samples collected.
Minerals 16 00848 g008
Figure 9. 87Sr/86Sr variation throughout the Phanerozoic (modified from [30]). 1–29: 87Sr/86Sr analysis results in this study (these numbers correspond to the numbers in the leftmost column in Table 7).
Minerals 16 00848 g009
Figure 10. (A) Trace elements contents of LBF and rudist. (B) PAAS normalized REE of LBF and rudist and PAAS values from Taylor and McLennan [31]. (C) Major oxide contents of LBF and rudist.
Minerals 16 00848 g010
Figure 11. (A,D) SEM images and (B,C,E,F) EDS spectrum of larger benthic foraminifera.
Minerals 16 00848 g011
Figure 12. (A,D) SEM images and (B,C,E,F) EDS spectrum of larger benthic foraminifera.
Minerals 16 00848 g012
Figure 13. (AI) Graphs showing negative correlations between certain major oxides.
Minerals 16 00848 g013
Figure 14. Graphs showing the positive correlation between certain major oxides (AD), the negative correlation between Eu/Eu* and Fe2O3 (E), the negative correlation between Zr and Eu/Eu* (F), and the positive correlation between Ce/Ce*and Eu/Eu* (G).
Minerals 16 00848 g014
Table 1. The ages determined for the Harami Formation in previous studies based on the larger benthic foraminifera (modified from [9]).
Author(s)Study AreaFormationLarger Benthic Foraminifera ContentsAge
Özgen et al. [7]Southwest, northeast, and west of ElazığHarabekayış FormationOrbitoides medius
O. apiculatus
Omphalocyclus macroporus
Lepidorbitoides minor
Siderolites calcitrapoides
Hellenocyclina beotica
Smoutina cruysi
Scandonea aff. samnitica
Rotalia perovalis
Rotalia sp.
Anomalina sp.
Eponides sp.
Mississipina sp.
Idalina sinjarica
Mississipina binkhorsti
Daviesina danieli
Cuvillierina sireli
Rotalia trocidiformis
Kathina selveri
Miscellanea miscella
Planorbulina aff. antiqua
Orbitoclypeus seunesi
late Maastrichtian-Thanetian
İnceöz [5]Northeast of ElazığHarami FormationOrbitoides medius
O. apiculatus
Orbitoides spp.
Omphalocyclus macroporus
Lepidorbitoides spp.
Siderolites calcitrapoides
Hellenocyclina beotica
Sirtina orbitoidiformis
Smoutina cruysi
Scandonea samnitica
Triloculina sp.
Quinqueloculina sp.
Rotaliidae
Textulariidae
late Maastrichtian
Aksoy et al. [6]Southwest of ElazığHarami FormationOrbitoides cf. medius
Orbitoides sp.
Lepidorbitoides spp.
Pseudosiderolites vidali
Pseudosiderolites sp.
Praesiderolites dordoniensis
late Campanian–early Maastrichtian
Kaya and İnceöz
[8]
The northeast, southwest, and west of ElazığHarami FormationOrbitoides medius
O. apiculatus
Omphalocyclus macroporus
Sirtina orbitoidiformis
Hellenocyclina beotica
Lepidorbitoides minor
L. cf. socialis
Lepidorbitoides sp.
Pseudorbitoides trechmanni
Siderolites calcitrapoides
Smoutina sp.
middle–late Maastrichtian
Kayğılı [9], Kayğılı et al. [10]Northeast and southwest of ElazığHarami FormationOrbitoides medius
O. megaloformis
O. gruenbachensis
O. apiculatus
O. gensacicus
Lepidorbitoides campaniensis
L. bisambergensis
L. cf. minor
Omphalocyclus macroporus
Pseudomphalocyclus blumenthali
Siderolites gr. calcitrapoides
Pseudosiderolites vidali
Hellenocyclina beotica
Sirtina cf. orbitoidiformis
late Campanian–Maastrichtian
Table 2. Information on the analyzed samples.
Analysis Type Number of SamplesSample Number
Stable Isotope Analysis50E1-LBF, E4-LBF, E4-Rudist E5-LBF, E6-LBF, E7-LBF, E4-rock sample, T1-LBF, T2-LBF, T3-LBF, T3-Rudist, T4-LBF, T5-LBF, T6-LBF, T7-LBF, N1-LBF, N2-LBF, N3-LBF, N4-LBF, N5-LBF, N6-LBF, N7-LBF, G1-LBF, G2-LBF, G3-LBF, G4-LBF, G5-LBF, G6-LBF G7a-LBF, G8-rock sample, S1-rock sample, S10a-rock sample, S13-rock sample, Ü1-LBF, Ü3-LBF, Ü6-LBF, Ü7-LBF, Ü10-LBF, Ü13-LBF, Ü16-LBF, Ü19-rock sample, Bu1-rock sample, Bu3-rock sample, Bu4-rock sample, Bu5-rock sample, Öl-1-LBF, Öl-2-rock sample, Öl-3-rock sample, Öl-4-rock sample, Öl-5-rock sample
Radiogenic Isotope Analysis29E4-rock sample, E4-Rudist (4 samples), E6-rock sample, T1-Rudist (2 samples), T1-rock sample, T3-LBF (2 samples), T3-Rudist (4 samples), T3-rock sample, T7-Rudist (4 samples), T7-rock sample, S1-rock sample, N1-rock sample, N2-LBF, S10-rock sample, S13-rock sample, Öl-1-Rudist (3 samples)
ICP-MS Analysis10E4-Rudist, E6-Rudist, T1-Rudist, T3-LBF, T3-Rudist, T7-Rudist (2 samples), N2-LBF, Öl-1-Rudist (2 samples)
XRF Analysis10E4-Rudist, E6-Rudist, T1-Rudist, T3-LBF, T3-Rudist, T7-Rudist (2 samples), N2-LBF, Öl-1-Rudist (2 samples)
SEM-EDS Analysis6E1, T1, N1, G3, S10, Ü1
Table 3. Stable isotope analysis results of LBF and rock samples. The first letters of the sample numbers in the table represent the names of the measured stratigraphic sections to which they belong. The Eskişehir Hill section is indicated by E, the Tepeköy section by T, the Nohutlupınarı section by N, the Guremağalan section by G, the Silsilekaya Hill section by S, the Ürünveren section by Ü, the Buzluk section by Bu, and the Ölbe Stream section by Öl.
NumberSample Name‰ δ13C (VPDB)‰ δ18O (VPDB)T (°C)
δ18Osw: −1.2
T (°C)
δ18Osw: −1
Laboratory
1E1-LBF1.73−2.3620.3421.29METU
2E4-LBF2.54−1.9618.4319.38METU
3E5-LBF2.38−1.1814.7215.67METU
4E6-LBF2.14−1.4415.9616.91METU
5E7-LBF1.48−2.3320.1921.14METU
6E4-rock sample2.20−2.7722.2923.24METU
7T1-LBF0.78−2.1919.5320.48METU
8T2-LBF2.40−1.3215.3916.34METU
9T3-LBF2.08−1.0113.9114.86METU
10T4-LBF2.03−1.2214.9115.86METU
11T5-LBF2.06−1.0514.1115.06METU
12T6-LBF2.14−1.5316.3917.34METU
13T7-LBF2.00−2.4020.5321.48METU
14N1-LBF2.16−0.8513.1514.10METU
15N2-LBF1.79−1.4015.7716.72METU
16N3-LBF1.66−2.5221.1022.05METU
17N4-LBF2.36−2.7622.2423.19METU
18N5-LBF1.41−5.2634.1435.09METU
19N6-LBF1.59−4.0228.2429.19METU
20N7-LBF1.42−3.0323.5324.48METU
21G1-LBF2.34−0.9213.4814.43METU
22G2-LBF2.03−0.7912.8613.81METU
23G3-LBF2.21−0.9313.5314.48METU
24G4-LBF2.35−1.0213.9614.91METU
25G5-LBF2.03−2.0718.9619.91METU
26G6-LBF2.55−1.5916.6717.62METU
27G7a-LBF2.19−0.8713.2414.19METU
28G8-rock sample1.28−2.8022.4323.38METU
29S1-rock sample−1.19−2.8122.4823.43METU
30S10a-rock sample1.47−2.3620.3421.29METU
31S13-rock sample1.93−3.0123.4324.38METU
32Ü1-LBF1.07−6.2038.6239.57METU
33Ü3-LBF1.39−3.7226.8127.76METU
34Ü6-LBF1.53−2.9523.1524.10METU
35Ü7-LBF1.83−3.1824.2425.19METU
36Ü10-LBF1.21−4.4230.1431.09METU
37Ü13-LBF0.97−3.8827.5728.52METU
38Ü16-LBF1.27−4.1428.8129.76METU
39Ü19-rock sample1.63−5.6836.1437.09METU
40Bu1-rock sample1.42−4.4830.4331.38WSS
41Bu3-rock sample0.28−5.2133.934.85WSS
42Bu4-rock sample0.67−6.0637.9538.90WSS
43Bu5-rock sample0.73−5.9537.4238.37WSS
44Öl-1-LBF1.74−4.4030.0531WSS
45Öl-2-rock sample1.75−4.7431.6632.61WSS
46Öl-3-rock sample2.08−3.8927.6228.57WSS
47Öl-4-rock sample1.77−5.1833.8734.82WSS
48Öl-5-rock sample1.96−5.6235.8536.80WSS
Table 4. Stable isotope analysis results of rudist samples. E represents samples taken from the Eskişehir Hill measured stratigraphic section, and T represents samples taken from the Tepeköy measured stratigraphic section.
NumberSample Name‰ δ13C (VPDB)‰ δ18O (VPDB)T (°C)
δ18Osw:
−1.00
Laboratory
49E4-Rudist2.28−2.3521.84METU
50T3-Rudist1.88−2.6423.14METU
Table 5. Statistical values for stable isotope results and paleotemperature calculations of different sample types (Minimum: Min., Maximum: Max., Standard Deviation: SD).
Sample TypeAge
Sample Number/
Number
‰ δ13C
(VPDB)
‰ δ18O (VPDB)T (°C)
δ18Osw: −1.2
T (°C)
δ18Osw: −1
LBFlate Campanian
Ü/7
Min: 0.97
Max: 1.83
Mean: 1.32
SD: 0.27
Min: −6.20
Max: −2.95
Mean: −4.07
SD: 0.99
Min: 23.15
Max: 38.62
Mean: 28.48
SD: 4.72
Min: 24.10
Max: 39.57
Mean: 29.43
SD: 4.72
early Maastrichtian
E, T, N, G/26
Min: 0.78
Max: 2.55
Mean: 1.99
SD: 0.41
Min: −5.26
Max: −0.79
Mean: −1.85
SD: 1.05
Min: 12.86
Max: 34.14
Mean: 17.90
SD: 4.98
Min: 13.81
Max: 35.09
Mean: 18.85
SD: 4.98
late Maastrichtian
Öl/1
1.74−4.4030.0531
Rock late Campanian
Ü/1
1.63−5.6836.1437.09
early Maastrichtian
E, G/2
Min: 1.28
Max: 2.20
Mean: 1.74
SD: 0.46
Min: −2.80
Max: −2.77
Mean: −2.79
SD: 0.01
Min: 22.29
Max: 22.43
Mean: 22.36
SD: 0.07
Min: 23.24
Max: 23.38
Mean: 23.31
SD: 0.07
late Maastrichtian
S, Bu, Öl/11
Min: −1.19
Max: 2.08
Mean: 1.17
SD: 0.94
Min: −6.06
Max: −2.36
Mean: −4.48
SD: 1.24
Min: 20.34
Max: 37.95
Mean: 30.45
SD: 5.89
Min: 21.29
Max: 38.90
Mean: 31.40
SD: 5.89

Rudist
early Maastrichtian
E, T/2
Min: 1.88
Max: 2.28
Mean: 2.08
SD: 0.20
Min: −2.64
Max: −2.35
Mean: −2.50
SD: 0.15
-Min: 21.84
Max: 23.14
Mean: 22.49
SD: 0.65
Table 6. Equations used in calculating paleotemperature.
ReferenceMaterialCalibration Range (°C)Equation
Lynch-Stieglitz et al. [25] reorganized by Cramer et al. [28].In situ Cibicidoides and Planulina (Benthic foraminifera)4–26T (°C) = 16.1 − 4.76 [δ18Occ − (δ18Osw − 0.27)]
δ18Osw: −1.2
Anderson and
Arthur [24]
Rudist-T (°C) = 16.0 − 4.14 (δ18Occ − δ18Osw) +
+ 0.13 (δ18Occ − δ18Osw)2
δ18Osw: −1 [27]
Table 7. Evaluation of radiogenic isotope (87Sr/86Sr) analysis results in terms of age (see Table 2 for explanations of the sample numbers) (Minimum: Min., maximum: Max., standard deviation: SD).
NumberSample Name87Sr/86SrAge According to the Analysis Results and Larger Benthic ForaminiferaLaboratory
1E4-rock sample0.707694 METU
2E4-Rudist0.707866METU
3E4-Rudist0.707593METU
4E4-Rudist0.707694WSS
5E4-Rudist0.707692WSS
6E6-rock sample0.707923METU
Eskişehir HillMin.:
0.707593
Max.: 0.707923
SD: 0
Mean: 0.707744
Number: 6
early Maastrichtian
7T1-Rudist0.707827 METU
8T1-Rudist0.707685WSS
9T1-rock sample0.707771METU
10T3-LBF0.707854METU
11T3-LBF0.707715WSS
12T3-Rudist0.707716 WSS
13T3-Rudist0.707596 METU
14T3-Rudist0.707589 METU
15T3-Rudist0.707664 WSS
16T3-rock sample0.707672 METU
17T7-Rudist0.707870 METU
18T7-Rudist0.707577 WSS
19T7-Rudist0.707699 WSS
20T7-Rudist0.707697 WSS
21T7-rock sample0.707746 METU
TepeköyMin.: 0.707577
Max.: 0.707870
SD: 0
Mean: 0.707712
Number: 15
early Maastrichtian
22N1-rock sample0.707808 METU
23N2-LBF0.707703WSS
NohutlupınarıMin.: 0.707703
Max.: 0.707808
SD: 0
Mean: 0.707756
Number: 2
early Maastrichtian
24S1-rock sample0.707904 METU
25S10-rock sample0.707804METU
26S13-rock sample0.707656METU
Silsilekaya HillMin.: 0.707656
Max.: 0.707904
SD: 0
Mean: 0.707788
Number: 3
late Maastrichtian
27Öl-1-Rudist0.707670 WSS
28Öl-1-Rudist0.707701WSS
29Öl-1-Rudist0.707687WSS
Ölbe StreamMin.: 0.707670
Max.: 0.707701
SD: 0
Mean: 0.707686
Number: 3
According to analysis result: early Maastrichtian (diagenesis effect)

According to the larger benthic foraminifera: late Maastrichtian
Table 8. Trace element values used in the interpretation of paleoredox conditions [33,34] and the values in this study (Minimum: Min, maximum: Max., standard deviation: SD).
Element RatioOxicDysoxicAnoxicEuxinicAuthorsThis Study
V/Cr<22–4.5>4.5 Jones and Manning [34]Min.: 0.71
Max.: 2.56
SD: 0.68
Mean: 1.44
Number: 10
Oxic
V/V+Ni<0.460.46–0.600.54–0.82>0.84Hatch and Leventhal [33]Min.: 0.15
Max.: 0.59
SD: 0.16
Mean: 0.40
Number: 10
Oxic
Table 9. Trace element values used in the interpretation of paleoclimate [35,36,37,38,39,40,41,42] and the values in this study.
Element RatioAuthorsThis Study
Sr/Cu>5 Arid and <5 Humid [36,37,39,42]Min.: 7
Max.: 698
SD: 225.67
Mean: 205
Number: 10
Arid
Rb/Sr<0.5 Arid and >0.5 Humid [41,42]Min.: 0.0002
Max.: 0.0145
SD: 0.01
Mean: 0.0058
Number: 10
Arid
Sr/Ba>1 Arid and <1 Humid [40,42]
>1 Sea or Saline Water [35,38]
Min.: 10
Max.: 530
SD: 154
Mean: 110
Number: 10
Arid and Sea or Saline Water
Table 10. Major oxide values (%) obtained from XRF analysis of the samples (Minimum: Min, maximum: Max., standard deviation: SD).
Sample NumberCaOSiO2TiO2Al2O3Fe2O3MnOMgONa2OK2OP2O5LOISUM
E4-Rudist54.080.82 0.0140.21 0.170.0090.930.070.0620.01543.40 99.77
E6-Rudist54.590.280.0080.030.070.0021.040.060.0100.00943.6299.73
T1-Rudist49.497.29 0.0581.400.520.0310.550.110.4090.02439.8299.70
T3-LBF52.243.520.0420.870.750.0150.570.080.2200.02041.4499.76
T3-Rudist52.262.730.0530.760.310.0100.660.090.2040.01642.3699.45
T7-Rudist51.960.470.0120.140.880.0312.560.050.0380.01743.5699.71
T7-Rudist54.870.360.0080.050.190.0230.640.030.0100.01243.5999.79
N2-LBF52.483.100.0320.760.700.0190.610.050.1690.02041.7799.71
Öl-1-Rudist52.221.600.0210.361.960.1011.120.06 0.03 0.034 42.52 100
Öl-1-Rudist52.331.60 0.021 0.36 1.97 0.103 1.11 0.06 0.03 0.035 42.54 100
Min.49.490.280.0080.030.070.0020.550.030.0100.00939.8299.45
Max.54.877.290.0581.401.970.1032.560.110.4090.03543.62100
SD.120010.030.570.020.120.011.150.15
Mean52.652.180.030.490.750.030.980.070.120.0242.4699.76
Number101010101010101010101010
Table 11. EDS analysis results of samples taken along the measured sections.
Percentage of Elements by Weight (Weight %)
ElementsNohutlupınarı Section (1)
Range
Mean
Ürünveren Section (2)
Range
Mean
Silsilekaya Hill Section (3)
Range
Mean
Eskişehir Hill Section (4)
Range
Mean
Guremağalan Section (5)
Range
Mean
Tepeköy Section
(6)
Range
Mean
OK26.72–54.67
45.87
23.64–54.40
46.31
43.53–56.93
49.82
25.79–54.47
46.86
37.49–59.86
50.79
32.24–54.69
46.08
CaK4.20–45.83
34.36
0.32–44.75
24.94
2.76–47.17
36.06
0.85–44.08
28.50
2.29–42.61
29.03
0.75–45.42
21.17
CK5.64–42.48
12.97
6.89–13.02
10.35
7.06–13.76
10.88
8.04–13.63
11.27
6.90–13.51
11.60
9.28–12.63
10.97
FeK0.48–54.81
11.82
0.40–67.39
11.77
-0.57–65.46
15.93
0.55–47.68
8.84
0.67–60.44
20.78
SiK0.26–10.96
2.94
0.33–40.35
8.27
0.08–51.56
8.05
0.28–52.48
7.55
0.24–56.27
10.26
0.20–54.62
14.67
AlK0.26–6.47
2.06
0.35–13.81
3.64
0.04–1.44
0.70
0.28–10.32
2.07
0.30–6.27
1.93
0.15–12.70
2.99
MgK0.48–1.43
0.83
0.52–7.60
1.70
0.15–1.11
0.76
0.47–7.25
1.37
0.35–2.77
1.20
0.42–13.37
3.05
NK8.33-----
NaK1.18
-
0.44–12.74
6.13
---3.47
-
SK3.15-----
KK0.75
-
0.20–0.59
0.29
-0.19–5.21
2.04
0.28–0.31
0.30
0.21–4.69
2.14
TiK-1.20–2.82
2.03
-0.30–1.98
0.9
0.34–0.93
0.64
-
MnK-0.31----
VK---0.43--
CrK----1.47-
ClK-----0.44
Disclaimer/Publisher’s Note: The statements, opinions and data contained in all publications are solely those of the individual author(s) and contributor(s) and not of MDPI and/or the editor(s). MDPI and/or the editor(s) disclaim responsibility for any injury to people or property resulting from any ideas, methods, instructions or products referred to in the content.