Article

Geochemical, REE and Multivariate Statistical Constraints on Fe–Mn Mineralization in Durmuştepe Area (Maden, Elazığ, Türkiye)


Department of Geological Engineering, Faculty of Engineering and Natural Sciences, Konya Technical University, 42250 Konya, Türkiye
*
Author to whom correspondence should be addressed.
Minerals 2026, 16(7), 687; https://doi.org/10.3390/min16070687
Submission received: 1 June 2026 / Revised: 20 June 2026 / Accepted: 26 June 2026 / Published: 30 June 2026

Abstract

In this study, we examined the mineralogy, geochemistry and origin of Fe–Mn mineralization occurring as lenses within siliceous mudstones of the Middle Eocene Maden Complex (Durmuştepe, Elazığ, Türkiye) using multivariate statistical methods and Compositional Data Analysis (CoDA). Major-oxide, trace-element and REE analyses were performed on 21 samples (n = 21), comprising 11 ore and 10 host-rock samples. Ore microscopy, discrimination diagrams, PAAS-normalized REE patterns, Principal Component Analysis (PCA), Hierarchical Cluster Analysis (HCA), factor analysis, Kendall correlation and CLR-transformed CoDA-PCA were applied. The ore consists of pyrolusite, braunite, manganite, magnetite and hematite. Massive and felty textures indicate rapid precipitation linked to abrupt physicochemical changes near the vents. Fe/Mn ≈ 1.62 and Co/Ni = 0.03–0.04 support an exhalative origin; Ce/Ce* = 0.10–0.15 (mean 0.11) records a pronounced negative Ce anomaly; and Eu/Eu* = 1.06–1.18 suggests vent-fluid temperatures below ~250 °C. CoDA-PCA shows that Ce is decoupled from the other lanthanides; HCA separates ore from host-rock populations; and factor analysis indicates that Ti–Al–K detrital input diluted ore accumulation. Integrating these results, we interpret Durmuştepe as a proximal volcano-sedimentary hydrothermal-exhalative Fe–Mn system that formed during magmatism in the Maden marginal basin under oxic seawater mixing and contemporaneous detrital sedimentation. The multivariate workflow also provides a reproducible approach for source characterization in similar mixed-origin deposits.

1. Introduction

Manganese deposits are divided into three main groups according to their mineralogical composition and tectonic setting: hydrogenetic (precipitation from seawater), diagenetic (precipitation from sedimentary pore water) and hydrothermal (precipitation from low- to medium-temperature hydrothermal fluids) [1,2,3]. Early models for Fe–Mn accumulations in oceanic and active-ridge settings emphasized seafloor volcanism and ridge sedimentary processes [4,5]. These deposits are also classified as oceanic or sedimentary in origin, depending on geological processes such as surface weathering, sedimentation, volcanism, plutonism and metamorphism [6,7,8,9,10,11,12]. In general, manganese deposits are systems that contain various oxide minerals and vary over a wide range in terms of grade, size and genetic origin [13,14]. On a global scale, manganese deposits are also systematically classified into sedimentary, volcano-sedimentary, hydrothermal-exhalative and similar genetic types [15]. Large industrial-scale manganese deposits are concentrated in particular stratigraphic and tectonic belts worldwide. These include the Nikopol deposit in Ukraine and the Chiatura deposit in Georgia, the Groote Eylandt deposit in northern Australia [16,17], the hydrothermal manganese deposits of Japan [18], the Tethyan deposits of Türkiye [19]—such as the limestone-hosted hydrothermal manganese mineralizations with hydrogenic contributions in Gümüşhane [20]—and the deposits of India [21]. In addition, global-scale manganese ore provinces such as the Kalahari Basin in the Republic of South Africa, the Oligocene basins of the Paratethys (Ukraine, Georgia, Kazakhstan and Bulgaria), the Northern Ural region of Russia and the Gulf of Carpentaria are well known in the literature [22,23].
Manganese precipitates on the ocean floor show distinct mineralogical differences depending on the oxidation potential of the environment. In oxygenated (oxic) pelagic settings, manganese is in the +4 oxidation state (Mn4+) and precipitates in oxide form as polymetallic nodules or crusts. By contrast, under reducing, restricted-basin conditions with low oxidation potential, manganese is in the +2 oxidation state (Mn2+) and, together with the Fe2+ form of dissolved iron, may be deposited in carbonate or silicate phases (rhodochrosite and rhodonite, respectively). Sedimentary deposits, on the other hand, form when manganese is transported as carbonate, chloride or sulfate complexes in neutral to slightly acidic waters under suitable redox/pH conditions and precipitates upon oxidation of the environment. Such deposits may have very large reserves but can contain high iron grades and clastic impurities. The main ore minerals in sedimentary-hydrothermal deposits are pyrolusite, psilomelane and rhodochrosite [24]. The most reliable approach to the genetic classification of manganese deposits is the integrated evaluation of the mineralization process and paleo-genetic environmental conditions together with mineralogical and multivariate geochemical data. The fundamental aim of this approach is to establish the genetic link between the depositional environment and the identified manganese oxide/carbonate mineralogy, and to quantitatively explain trace-element (REE and noble-metal) enrichments of hydrothermal, diagenetic or hydrogenetic origin [25,26].
Volcano-sedimentary hydrothermal-exhalative Fe–Mn deposits represent a distinct class of marine mineralizations associated with high-heat-flow volcano-tectonic systems, such as mid-ocean ridges, back-arc basins, intra-continental rifts, and island arc environments [27,28,29,30]. These deposits typically form where convective seawater circulation through the oceanic crust is driven by underlying magmatic heat sources, leaching transition metals from the basement basaltic rocks. Upon discharge onto the oxygenated seafloor, the hydrothermal fluids mix with cold seawater, triggering the rapid precipitation of Fe and Mn oxides and oxyhydroxides [31]. Morphologically, volcano-sedimentary Fe–Mn orebodies typically occur as stratabound lenses, stratiform beds, or irregular massive bodies intercalated with volcaniclastic sediments, radiolarian cherts, and pelagic mudstones [32]. At the macro scale, the ores display typical textures such as massive, layered, banded, colloform, and botryoidal structures, which are indicative of rapid deposition under fluctuating physical–chemical conditions. Microscopically, they are characterized by micro-colloform, cryptocrystalline, felty, and dendritic textures, reflecting colloid precipitation and low-temperature diagenetic recrystallization within seafloor sediments [32,33].
Geochemically, volcano-sedimentary hydrothermal Fe–Mn deposits are characterized by extreme fractionation between iron and manganese, low concentrations of cobalt, nickel, and copper (due to rapid accumulation rates preventing scavenging from seawater), and diagnostic rare earth element (REE) signatures [27,28,29]. Hydrothermal Fe–Mn precipitates typically exhibit strongly fractionated chondrite-normalized REE patterns, characterized by light REE (LREE) depletion or enrichment depending on clastic contribution, weak-to-strong negative cerium (Ce) anomalies under oxic bottom waters, and distinct positive europium (Eu) anomalies indicating high-temperature (>250 °C) fluid–rock interactions [31,32]. In contrast, hydrogenetic crusts are enriched in Co, Ni, and Cu, and exhibit strong positive Ce anomalies and negative Eu anomalies [27,28]. To distinguish between these genetic types, binary and ternary discrimination diagrams (e.g., Fe–Mn–(Co + Ni + Cu) and Fe/Ti vs. Al/(Al + Fe + Mn)) are widely applied as robust metallogenic indicators [27,33]. These geochemical signatures are often modified by suboxic diagenesis in restricted basins, leading to mineral dissolution, recrystallization, and migration of critical metals within pores and fractures [28,33].
On a global scale, manganese is primarily consumed in the iron and steel sector, followed by the chemical and battery industries [34,35,36,37,38]. Ores with high manganese dioxide content, particularly high-grade pyrolusite, serve as crucial raw materials for these metallurgical and industrial applications [34].
The Maden Complex, which lies on the Southeast Anatolian Thrust Belt in Türkiye and forms the upper part of the ophiolitic sequence, hosts numerous manganese deposits of metallogenic significance. These deposits lie within a broad tectonostratigraphic belt that extends from Kahramanmaraş in the west, through Adıyaman, Malatya and Elazığ, to Bingöl in the east, and many of them are sites that were mined in the past or still hold economic potential [3,39,40]. Consequently, characterizing the mineralogical and geochemical features of the Fe–Mn mineralizations within the Maden Complex by modern analytical methods is important not only for understanding the evolution of regional mineralization, but also for elucidating metallogenic processes in similar ophiolitic/hydrothermal systems. New approaches such as geological big data and transfer learning are also increasingly being used in manganese exploration [41].
The main aim of this study is to determine the formation mechanism, depositional environment and regional metallogenic position of the Fe–Mn mineralization within the Maden Complex (Durmuştepe, Elazığ). Within this scope, whether the mineralization is the product of a hydrothermal-exhalative system is discussed, and the roles of hydrogenetic, diagenetic and hydrothermal processes in ore formation were assessed using geochemical data. To this end, major-oxide, trace-element and rare earth element (REE) data (PAAS-normalized patterns, Ce and Eu anomalies) were evaluated together to investigate fluid temperature, redox conditions and the degree of seawater interaction. As part of the statistical evaluation of the geochemical dataset, box plots, PCA and dendrogram analyses were applied, as well as Compositional Data Analysis (CoDA)-based PCA, Kendall correlation, regression and factor analyses. The statistical and geochemical results obtained were integrated with the field-geology findings to propose a genetic model explaining the temporal–spatial evolution of the Durmuştepe deposit.

2. Geological Setting

2.1. Regional Geological Setting

Two parallel, NE–SW-trending ophiolite belts crop out in Southeast Anatolia [42,43]. The northern belt lies between the Keban–Malatya metamorphics of the Tauride platform and the Bitlis–Pütürge massifs, and comprises the Göksun–Berit (Kahramanmaraş), Meydan (Kahramanmaraş), İspendere (Malatya), Kömürhan–Guleman (Elazığ) and Killan (Diyarbakır) ophiolites [42,43,44]. These Late Cretaceous ophiolite slices accreted to the Tauride platform are reported to have supra-subduction zone (SSZ)-type oceanic lithosphere characteristics [45]. The southern ophiolite belt is located between the Bitlis–Pütürge massifs and the Arabian Platform and, towards the west, comprises the Koçali (Adıyaman) Complex—which also includes the Troodos (Cyprus) and Tekirova ophiolites—together with the Amanos, Kızıldağ (Hatay) and Baer-Bassit (Syria) ophiolites [42].
The final continent–continent collision between the Arabian and Anatolian plates occurred during the late Serravalian (end of the Middle Miocene) [46]. During this period, the Late Cretaceous Kömürhan ophiolite, the Paleozoic Pütürge metamorphics, the Late Permian–Late Cretaceous Bodrum nappe, and the Early–Middle Eocene Maden Complex, all belonging to the Tauride belt, were sliced and emplaced as nappe structures onto the northern margin of the Southeast Anatolian Autochthon [46], while similar Late Cretaceous ophiolites were emplaced onto the Arabian Platform [45,47]. These slices are considered to be remnants of the Berit Ocean [42] or the Pamphylia–Bitlis Ocean [48]. Within this tectonic framework, the Eocene Maden Complex volcanics were generated [49], and their geochemical signatures can be analyzed using trace-element discrimination approaches [50] to support the interpretation of the hydrothermal-exhalative processes that controlled the Fe–Mn mineralizations [39].
The Guleman ophiolite and the unconformably overlying flysch-type Hazar Formation represent the pre-Eocene basement and cover sequences in the region, containing various ophiolitic mélange units and volcanic intercalations [47,51,52]. Within the Maden Complex, ophiolitic slices occur as tectonic blocks [53,54,55], and their genetic origin and accretionary history have been widely discussed in the literature [56,57,58].

2.2. Local Geological Setting

The study area lies within the Eastern Taurus Orogenic Belt, where units of the Maden Complex together with the Guleman and Hazar groups crop out predominantly. From oldest to youngest, the stratigraphic succession in the study area consists of the Jurassic–Cretaceous Guleman Group, the Maastrichtian–Early Eocene Hazar Group, the Middle Eocene Maden Complex, and Pliocene–Quaternary deposits together with recent alluvium. The Simaki Formation overlies the Guleman Group along a tectonic contact in the vicinity of Hatun Köy in the northeast of the study area. The recent alluvium, the youngest unit in the region, unconformably overlies all of these sequences (Guleman, Hazar and Maden).
The Hazar Group, which transgressively overlies the Guleman Group, generally consists of a sandstone–shale–marl–limestone alternation. Conglomerates occur at the base of the unit, passing upward into sandstone, mudstone, claystone, marl, argillaceous limestone, silexite, radiolarite and pink-to-red limestones. This fossiliferous unit, referred to as the ‘lower flysch’, also contains volcanic intercalations such as basalt, diabase, melaphyre, tuff and andesite [59].
The Maden Complex covers a broad tectonic zone that extends in an approximately NE–SW direction, parallel to the East Anatolian Fault (EAF). This zone extends from the northern parts of the Palu and Arıcak districts in the east to the south of Malatya and the northern parts of Adıyaman. The Maden Complex shows more extensive outcrops in the southern parts of the fault between Palu and Lake Hazar, whereas from the southwest of Lake Hazar onward it becomes dominant in the northern blocks of the fault.
The Maden Complex in the study area shows a lithologically highly heterogeneous structure. The unit generally consists of red, green and grey silicified mudstones, maroon limestones with volcanic intercalations, a sandstone–shale–marl alternation, conglomerates, green limestone blocks, and basalts and/or spilites. The ferruginous manganese (Fe–Mn) mineralizations examined here also crop out, like the other volcanic and sedimentary units, directly as part of the lithological assemblage within the Maden Complex.
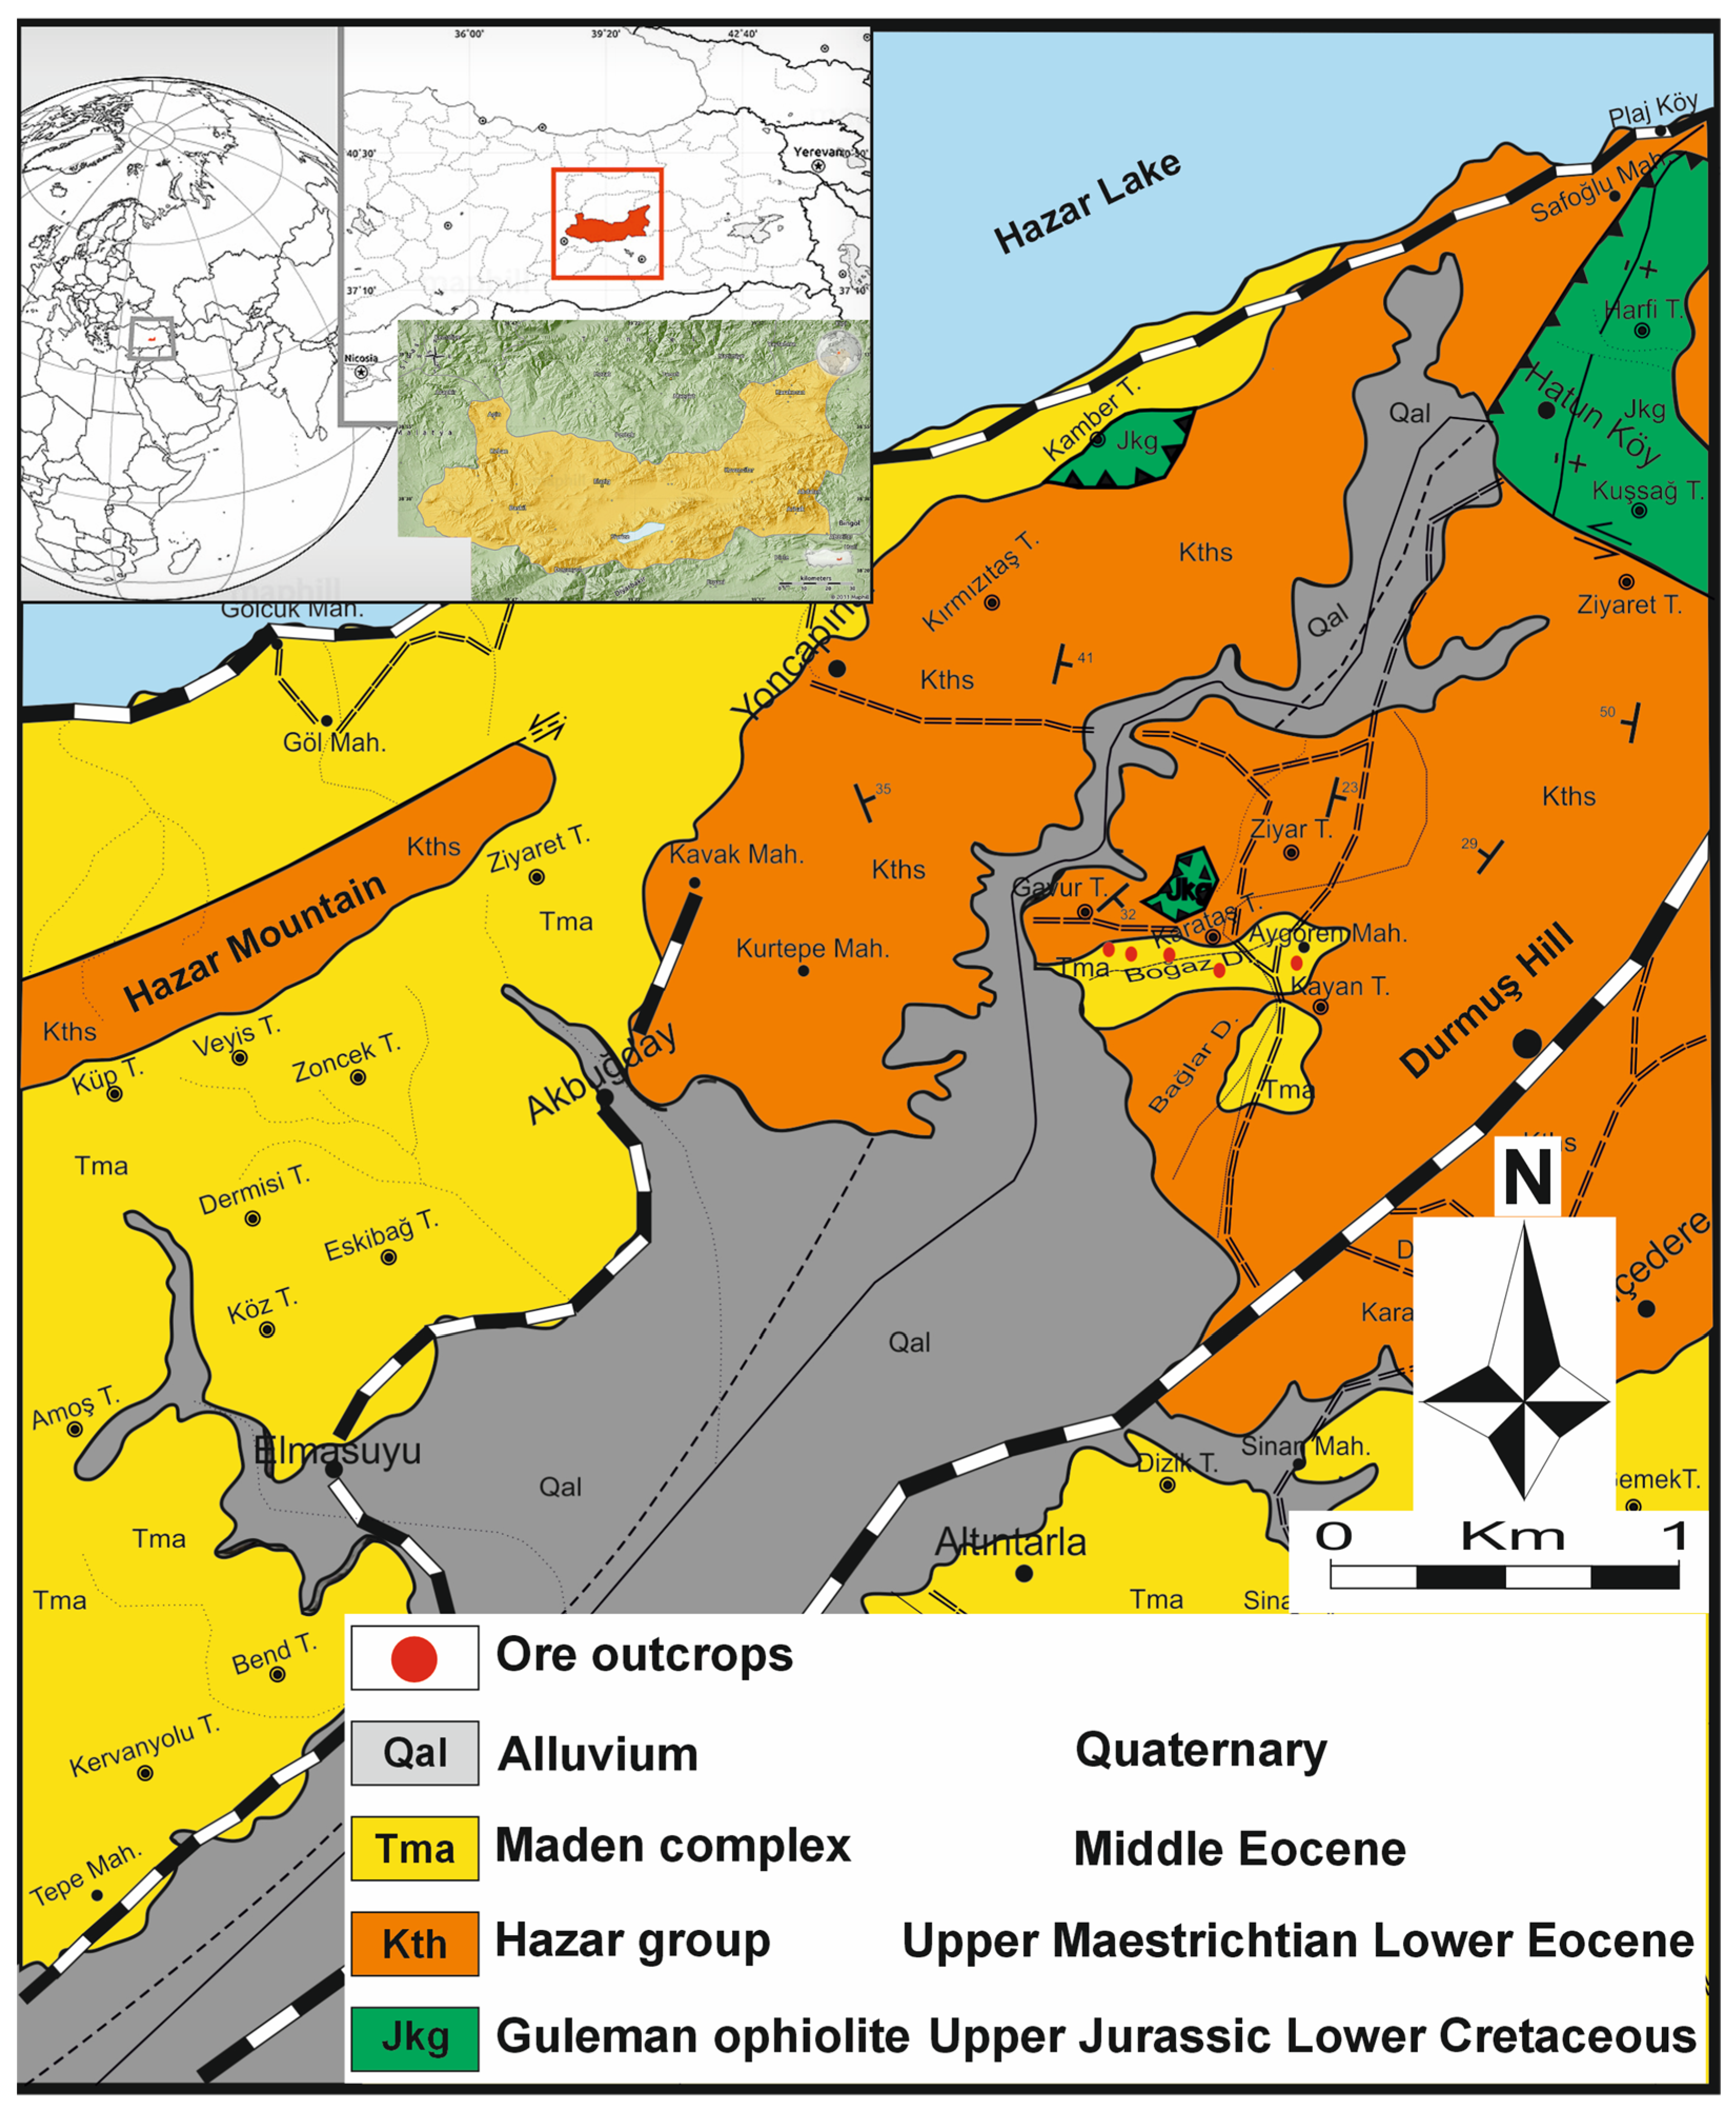
The regional tectonic positions of these units and a location map of the study area are presented in Figure 1. This map shows the tectonic relationships between the Maden Complex and the ophiolitic units and the locations of the Fe–Mn mineralizations in the region.

3. Materials and Methods

3.1. Sampling, Petrography, and Geochemical Analysis

Major-oxide, trace-element and rare earth element (REE) analyses were carried out on a total of 21 rock samples collected from the ore outcrops and host rocks in the study area. Thin sections were prepared to determine the petrographic characteristics of the geological units in the field, and polished sections to identify the mineral paragenesis and the opaque minerals. The polished sections were examined under the microscope at the laboratories of the MTA Central Anatolia Regional Directorate (Konya), and the thin sections at Fırat University. Through ore microscopy, the mineral assemblages, paragenetic relationships, and the structural and textural characteristics of the ore were described in detail.
Eleven ore samples were collected from accessible exposures of the mineralized horizon shown in Figure 1. Although approximately ten distinct outcrop/locality points are visible on the map, systematic grid sampling was not feasible because the ore occurs as discontinuous lenses within siliceous mudstones and access was limited to outcrop-scale exposures. The sampling design therefore targeted representative ore and host-rock geochemistry rather than spatial geostatistical interpolation.
Prior to the geochemical analyses, the rock samples were crushed, quartered and ground to a fineness of 125 mesh (120 µm) and homogenized. All analytical measurements were carried out at Acme Analytical Laboratories Ltd. (Vancouver, BC, Canada) in September 2013. Major-oxide analyses were performed by the 4A-4B (ICP-ES) method, trace-element and REE analyses by the 1DX (ICP-MS) method, and total carbon and sulfur analyses by the 2A (LECO) method. The accuracy and precision of the analytical data were monitored within the laboratory’s standard quality assurance/quality control (QA/QC) procedures using certified reference materials (CRM), blank samples and internal duplicates. The analytical results obtained were confirmed to lie within the laboratory’s accepted analytical error limits (relative error < ±5%).
Stable-isotope analyses (δ18O, δ13C) and radiogenic Sr–Nd isotope measurements were not performed in this study. The present dataset comprises whole-rock major-oxide, trace-element and REE analyses obtained from Acme Labs (September 2013). Fluid-source constraints are therefore based on trace-element and REE proxies (including Ce/Ce*, Eu/Eu*, PAAS-normalized patterns and discrimination diagrams) rather than direct isotopic fingerprinting. Isotopic work on comparable Maden Complex Fe–Mn systems remains a worthwhile direction for future research but was beyond the scope and analytical budget of the present reconnaissance-scale sampling program.

3.2. Geochemical and Statistical Methods

In evaluating the geochemical data obtained, graphical modeling and multivariate statistical analyses were used in a mutually supporting manner. First, in order to better understand the geochemical anomalies and redox conditions in the region, the rare earth element (REE) concentrations were normalized to and evaluated against the Post-Archean Australian Shale [60]. In addition, trace-element discrimination diagrams (Zn–Pb, (Co + Ni)–(As + Cu + Mo + Pb + Zn + V), Al/(Al + Fe + Mn)–Fe/Ti and Ni/Co–V/(V + Ni)) were used to determine the detrital input to the environment, to reveal the redox (oxic/anoxic) conditions during deposition, and to identify whether the origin of the mineralization involved hydrothermal, hydrogenetic or diagenetic processes.
The statistical investigations of the geochemical dataset of the Durmuştepe Fe–Mn mineralization were carried out in a two-stage process.
Descriptive statistics and box plots were generated using XLSTAT (v19.2.2) and CorelDraw software (Graphics Suite v26.2.0.170). Hierarchical Cluster Analysis (HCA) and Principal Component Analysis (PCA) were performed using SPSS v26 software to identify sample groups and distinguish ore from host rocks. Prior to PCA, variables were normalized using Z-score standardization because the dataset contains variables measured in different units and scales (major oxides in wt.% and trace elements/REEs in ppm). Without standardization, elements with high concentrations (e.g., SiO2 and Fe2O3) would dominate the variance. Z-score standardization scales each variable to a mean of 0 and a variance of 1 using the formula:
Zi = (Xi − μ)/σ,
where Xi is the raw concentration, μ is the mean, and σ is the standard deviation.
HCA was performed using Euclidean distance and Ward’s method. For PCA, a Pearson correlation matrix was computed from the standardized variables (equivalent to the covariance matrix of Z-scores). Eigenvalues and eigenvectors were extracted to obtain the principal components and variable loadings; component scores and loading vectors were displayed together in a biplot. Principal components were retained according to Kaiser’s rule (eigenvalues > 1), cumulative explained variance, and inspection of the scree plot. This standardization and PCA approach follows methods described for geochemical classification and mineral characterization [61,62].
In the second stage, evaluations were carried out on the ore samples (n = 11). The Shapiro–Wilk test, applied to determine the distribution characteristics of the elements in these samples, revealed that the elements were not normally distributed (p < 0.05). Therefore, in the correlation analyses, the Kendall correlation—which does not require an assumption of normality and is insensitive to outliers—was preferred. Kendall’s correlation was selected over Spearman’s rank correlation because it is mathematically more robust for small sample sizes (n = 11), exhibits smaller gross-error sensitivity, and provides more reliable p-values and confidence intervals under non-normal distributions with extreme values [63]. Because the number of ore samples was limited (n = 11), the statistical results were evaluated at a descriptive and interpretive level.
Given the limited number of ore samples (n = 11), all multivariate analyses (PCA, HCA, factor analysis, Kendall correlation, and CoDA-PCA) were treated as exploratory tools rather than confirmatory models. With more than 30 geochemical variables and only 11 observations, the ratio of observations to variables is low; therefore, the extracted components and factors should not be interpreted as statistically robust, independent end-members. Instead, they were used to identify broad geochemical trends and to support—qualitatively—the interpretations derived from ore microscopy, discrimination diagrams, and REE patterns. Interpretive statements based on multivariate outputs were deliberately framed in non-causal terms (e.g., “suggests”, “is consistent with”) and were not used as standalone proof of genetic processes.
Compositional Data Analysis (CoDA) was performed using CoDaPack version 2.03.11 software on the compositional geochemical data [64,65]. A centered log-ratio (CLR) transformation was applied to the ore data; prior to the transformation, zero and very low values were replaced with positive values. Correlation and regression analyses were carried out using OriginPro 2025b v10.2.5.212 software, and factor analyses were also carried out for the major-oxide, trace-element and REE groups. Varimax rotation was applied to improve the interpretability of the factor loadings. Varimax orthogonal rotation was preferred over oblique rotation to identify clear, independent geochemical end-members (e.g., pure hydrothermal-exhalative inputs versus detrital dilution processes). Oblique rotations (such as Promax) were also tested and yielded highly consistent factor groupings, supporting the exploratory use of the orthogonal model in isolating these distinct processes [66].
For the revised factor analysis, all 44 geochemical variables (major oxides, trace elements and REEs) were used for the eleven ore samples (Fe-4, Fe-5a/b, Fe-7a/b, Fe-9a, Fe-11, Fe-12a/b, Fe-13, Fe-14). Variables were Z-score standardized prior to extraction. Factors were extracted using principal-component-based factor analysis with Varimax rotation, consistent with the original SPSS/OriginPro workflow. Although the Kaiser criterion initially suggested six factors (eigenvalues > 1), inspection of the scree plot and parsimony for small-n exploratory interpretation led to retention of four factors (cumulative explained variance = 99.8%; see Section 4.5.3).
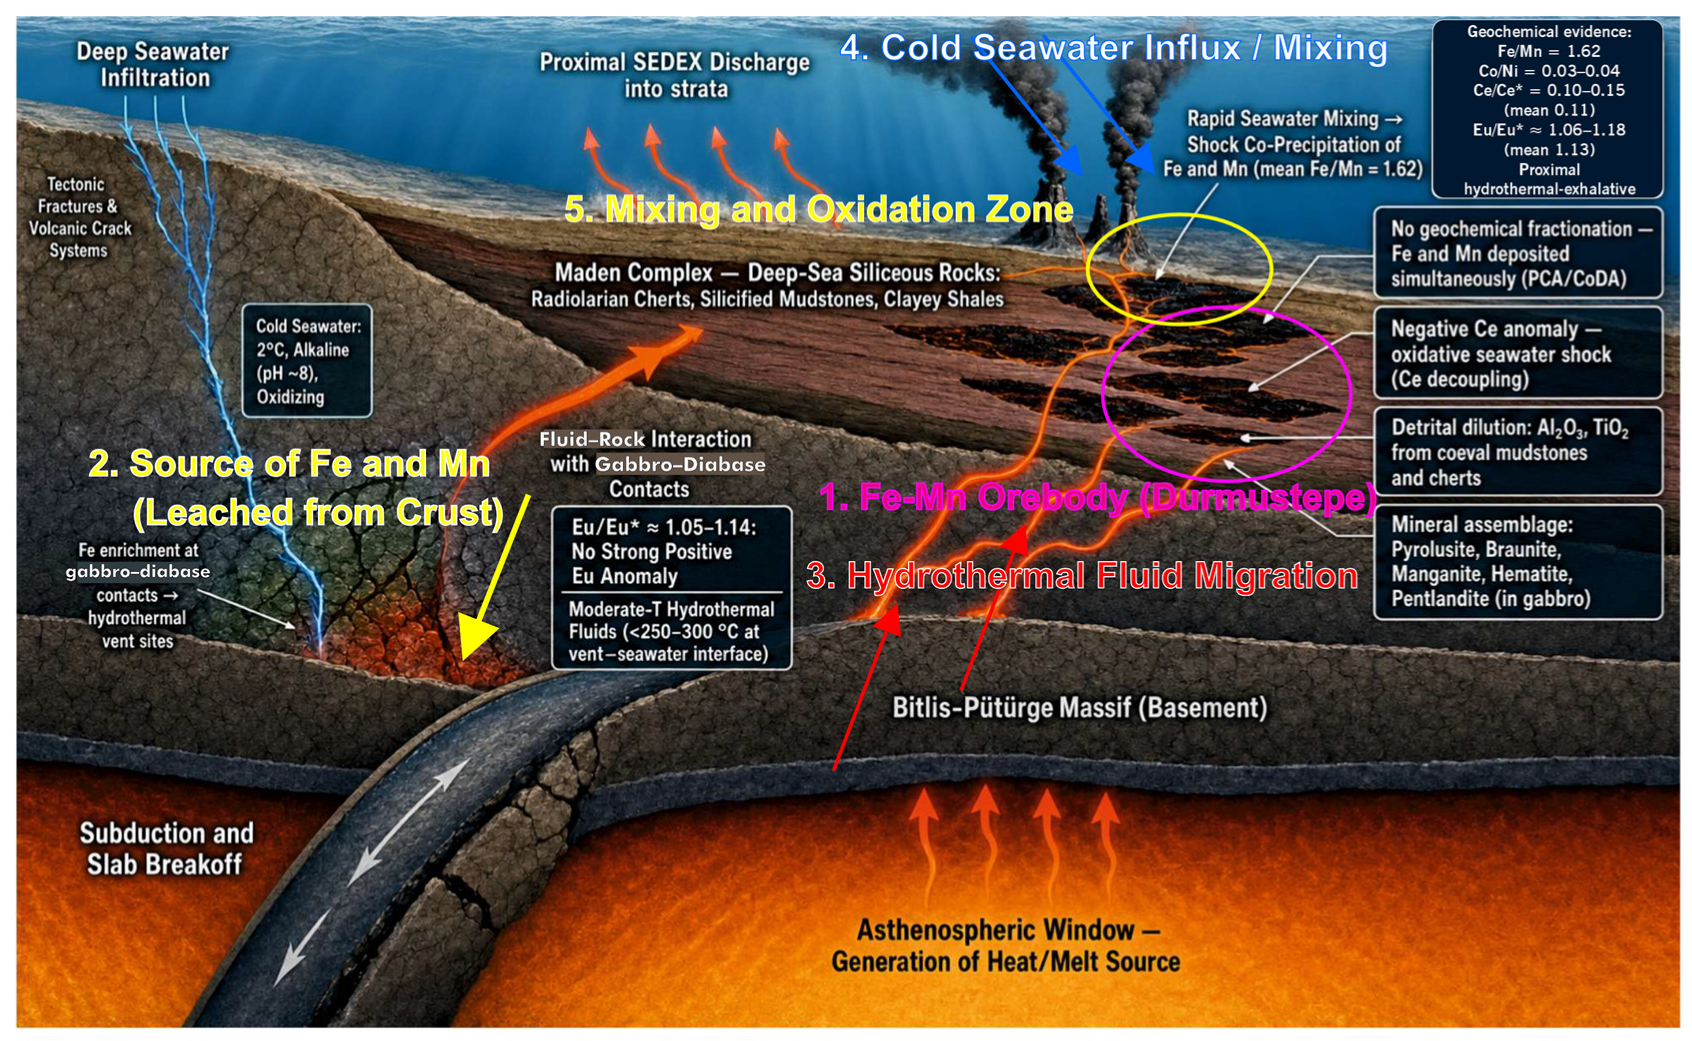
The conceptual genetic model figure was prepared by the authors. During the preparation of this work, the authors used Google NotebookLM solely to assist with the initial graphical layout and schematic visualization of this figure. The authors’ own manuscript data and selected regional geological publications were used as input. The final vector drafting, process pathways, flow arrows, annotations and geological interpretation were completed manually by the authors in Corel Draw. Generative artificial intelligence tools were also used to assist with English-language editing and reference formatting. All AI-assisted outputs were reviewed, corrected, and approved by the authors. No generative artificial intelligence tools were used for geochemical data analysis or statistical processing.

4. Results

4.1. Ore Mineralogy and Petrography

In order to determine the textural relationships and mineralogical paragenesis observed in the Durmuştepe Fe–Mn mineralization, polished-section studies were carried out on samples collected from the ore outcrops and the surrounding host rocks. The microscopic examinations showed that pyrolusite, braunite, manganite, magnetite and hematite constitute the main ore phases, while pentlandite [(Ni,Fe)9S8] and copper minerals (cubanite, malachite, azurite) were detected locally.
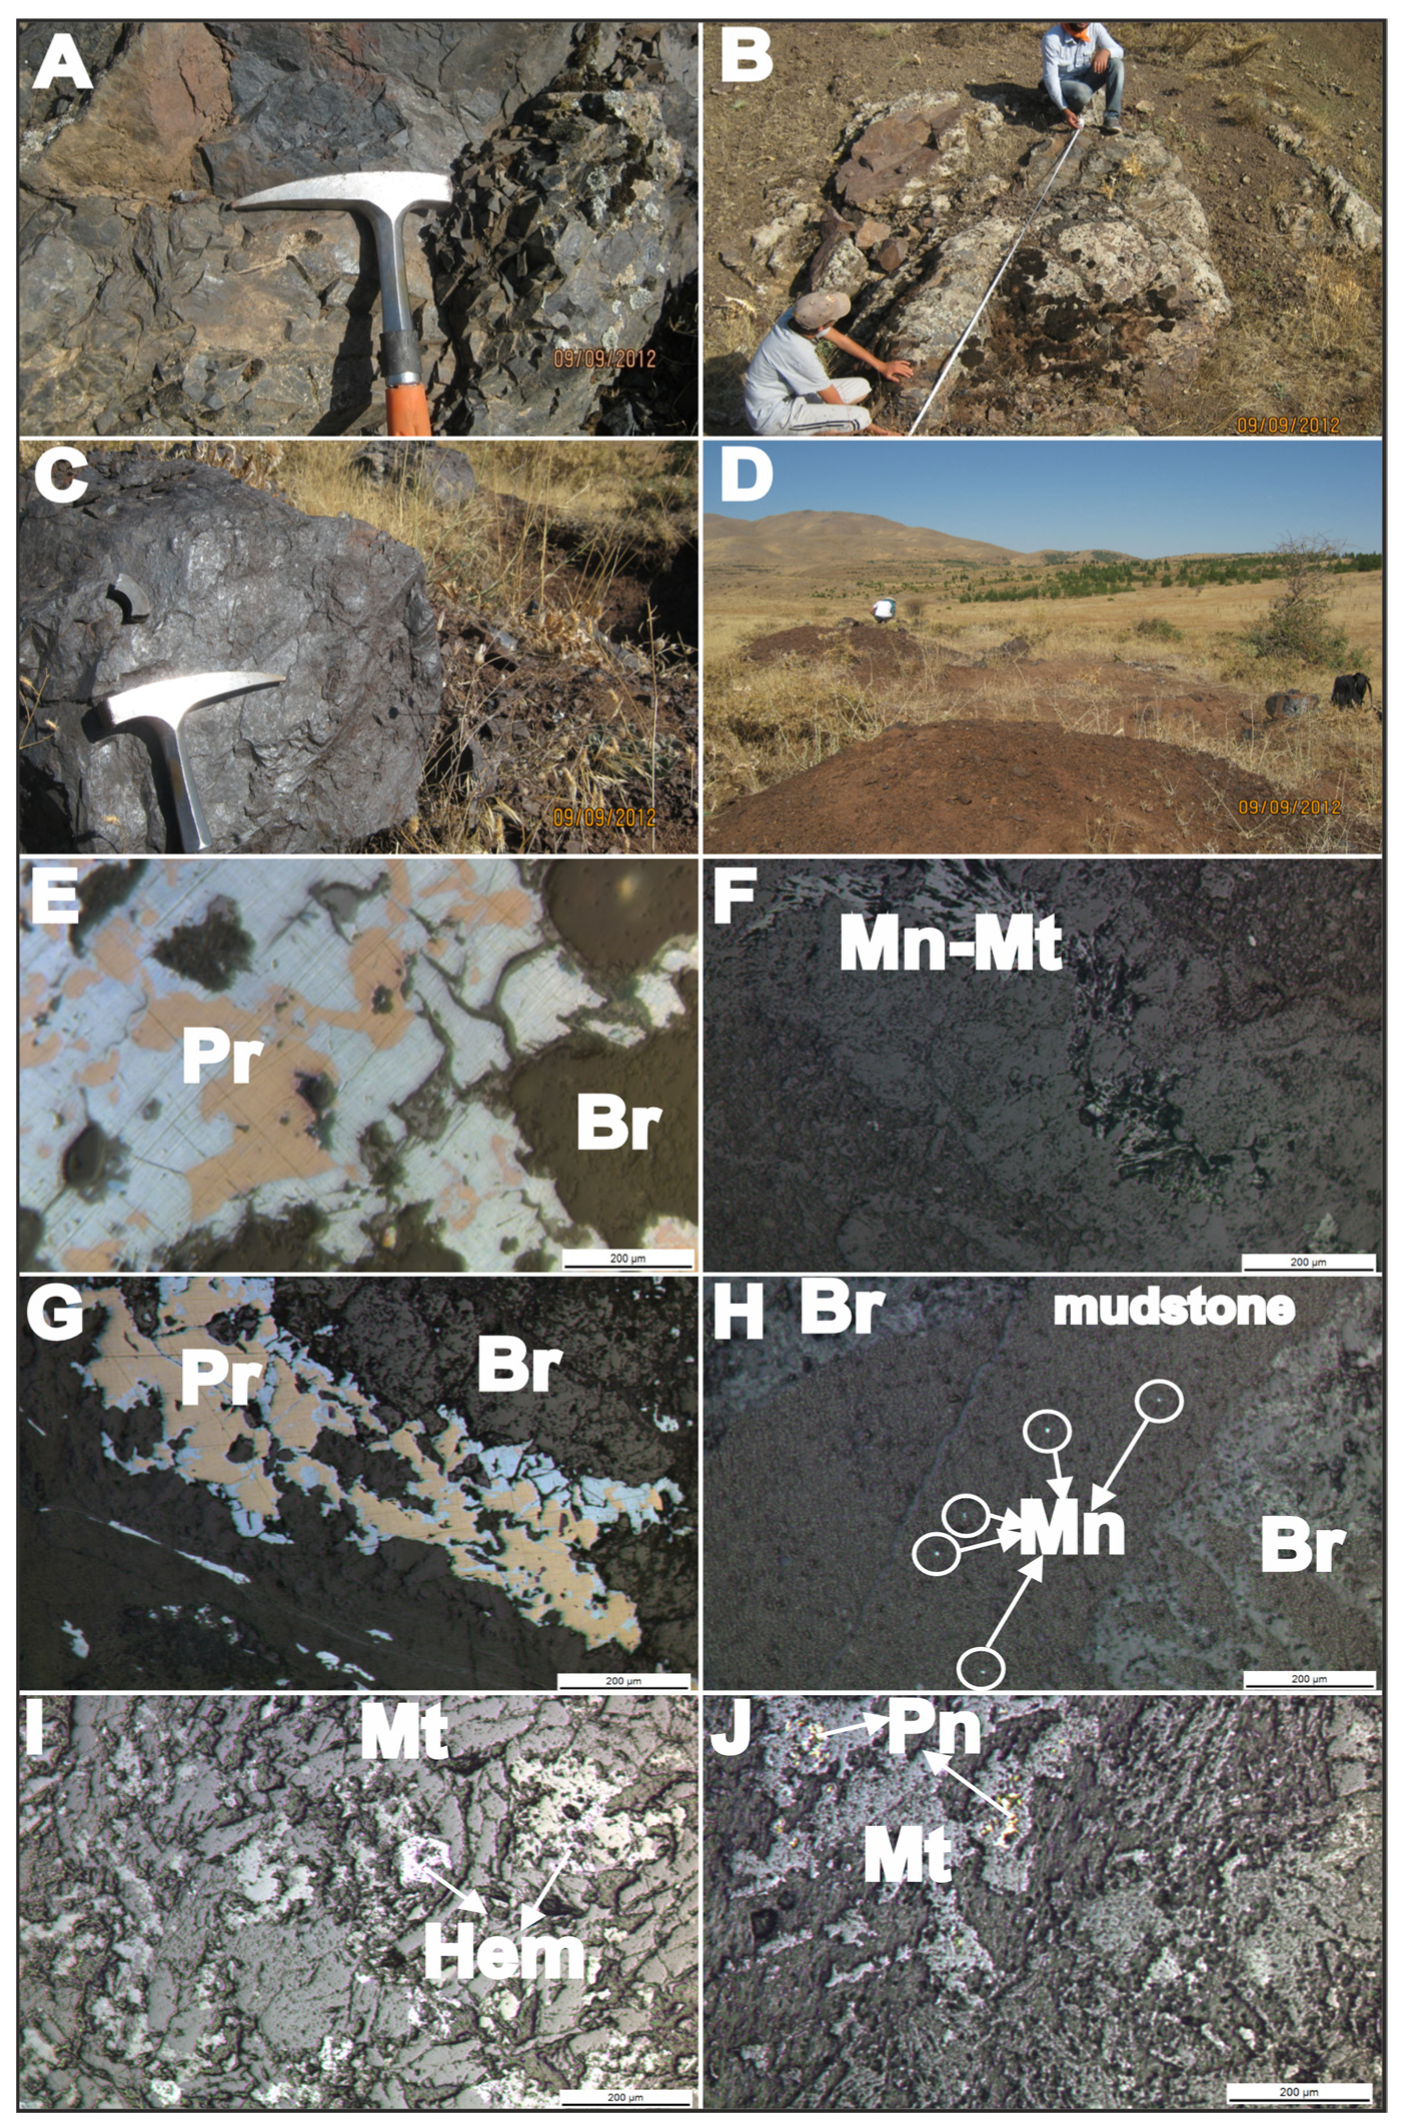
At the outcrop scale, the stratabound Fe–Mn mineralization occurs in sharp contact with the host mudstone (Figure 2A), showing clear thickness variations along a fault-controlled structural contact (Figure 2B). Hand specimens of the high-grade, massive manganese ore display a characteristic steel-grey metallic luster and a dense, blocky structure (Figure 2C), contrasting with the highly weathered, reddish-brown limonitic clay and silica-cemented mudstone host rocks that border the mineralization zone (Figure 2D). Observations at the macroscopic and microscopic scales indicate that the mineralization generally displays a massive character, while in some zones fractured–cracked, porous and felty textures have developed. The oxide phases that make up the ore consist mostly of subhedral and anhedral crystals and display a pervasive intergrown texture. Particularly in the fine-grained (15–20 μm) zones with felty texture, it becomes difficult to distinguish the manganese minerals individually under the microscope. This fine-grained, porous matrix is interpreted to consist of an intimate mixture of pyrolusite, psilomelane, rhodochrosite and silicate phases. In the massive parts, by contrast, manganite, braunite and pyrolusite were found to be clustered as coarser-grained aggregates.
The most commonly observed phase among the manganese minerals in the paragenesis is pyrolusite (MnO2). This mineral is readily distinguished from the other phases by its cream-white color, high reflectance and distinct anisotropy (Figure 2E,G). The pyrolusite crystals, whose sizes vary considerably, range from millimeter-scale (~2 mm) grains to micron-scale fine components. The coarse-crystalline pyrolusite that forms the felty aggregates is thought to represent the primary mineralization stage, whereas the fine-grained pyrolusite filling the cracks and fractures (locally accompanied by psilomelane) is thought to have developed through secondary processes. Braunite (3Mn2O3·MnSiO3), characterized by its low anisotropy and brownish-grey color tones, mostly occurs in paragenetic association with manganite (MnO(OH)) and pyrolusite and is among the main components of the massive matrix. Manganese-magnetite (Mn-Mt) phases are also observed locally, emplaced within microcrack and vein systems cutting the massive matrix (Figure 2F). These Mn-Mt phases do not represent the main ore phase, which is dominated by braunite and pyrolusite, but rather reflect a transitional or late-stage hydrothermal deposition. Furthermore, fine-grained secondary manganese oxides occur as disseminations filling voids within the silica-cemented mudstone matrix (Figure 2H), demonstrating secondary mineral enrichment during post-depositional fluid circulation.
Among the iron-oxide phases accompanying the mineralization, magnetite and hematite were observed intensely, especially in the gabbro-type host rocks belonging to the Guleman Group. At the margins and in the microcracks of the magnetites in the gabbros, conversion to hematite (martitization texture) developed under the influence of oxidation processes is clearly observed (Figure 2I). In these mafic units, yellow-brown, metallic-lustered pentlandite crystals representing the sulfide phase display a close paragenetic relationship with magnetite (Figure 2J). When the microscopic data are evaluated as a whole, it was determined that the Fe–Mn mineralization in the study area underwent a multi-stage evolution, with secondary fracture fillings and disseminated phases developing in the silicified mudstones after the main massive mineralization stage.

4.2. Whole-Rock Geochemistry and Descriptive Statistics

The statistical evaluations in this study were carried out on the trace-element (Au, Co, Hf, Nb, Ta, V, Zr, Y, Mo, Cu, Pb, Zn, Ni, As, Hg, Ba), rare earth element (La, Ce, Pr, Nd, Sm, Eu, Gd, Tb, Dy, Ho, Er, Tm, Yb, Lu) and major-oxide (SiO2, Al2O3, Fe2O3, MgO, CaO, Na2O, K2O, TiO2, MnO, Cr2O3) analytical results of 11 ore and 10 host-rock/alteration samples (total n = 21) collected from the Durmuştepe Fe–Mn mineralization area (Table 1, Table 2, Table 3 and Table 4).
LREE/HREE = (La + Ce + Pr + Nd + Sm + Eu)/(Gd + Tb + Dy + Ho + Er + Tm + Yb + Lu); ∑Ce/∑Y (LREE/YREY) = (La + Ce + Pr + Nd + Sm + Eu)/(Gd + Tb + Dy + Ho + Er + Tm + Yb + Lu + Y); Eu/Eu* = shale-normalized (PAAS) [Eu_SN/(Sm_SN * Gd_SN)0.5]; Ce/Ce* = shale-normalized (PAAS) [Ce_SN/(La_SN × Pr_SN)0.5] (Note: the SN subscript in the equations denotes values normalized to the Post-Archean Australian Shale (PAAS) based on [62]. The LREE/HREE and anomaly formulations were calculated based on the standards of [67,68,69,70]). In Table 4, the columns labeled δ Ce and δ Eu report the PAAS-normalized Ce/Ce* and Eu/Eu* values, respectively. The column Ce(anom) denotes the cerium anomaly calculated as log10[3 × Ce_SN/(2 × La_SN + Nd_SN)] (values < 0 indicate a negative Ce anomaly), following the REE anomaly conventions summarized in [67,70].

4.3. Trace-Element Geochemistry and Discrimination Diagrams

Trace-element data and discrimination diagrams play an important role in the genetic interpretation of manganese deposits. The high adsorption capacity of manganese oxides allows many elements in the depositional environment to be retained by these phases. In order to interpret these elemental enrichments—which are particularly pronounced in marine manganese occurrences—correctly, the geochemical data were evaluated together with field observations and mineralogical analyses [71,72].
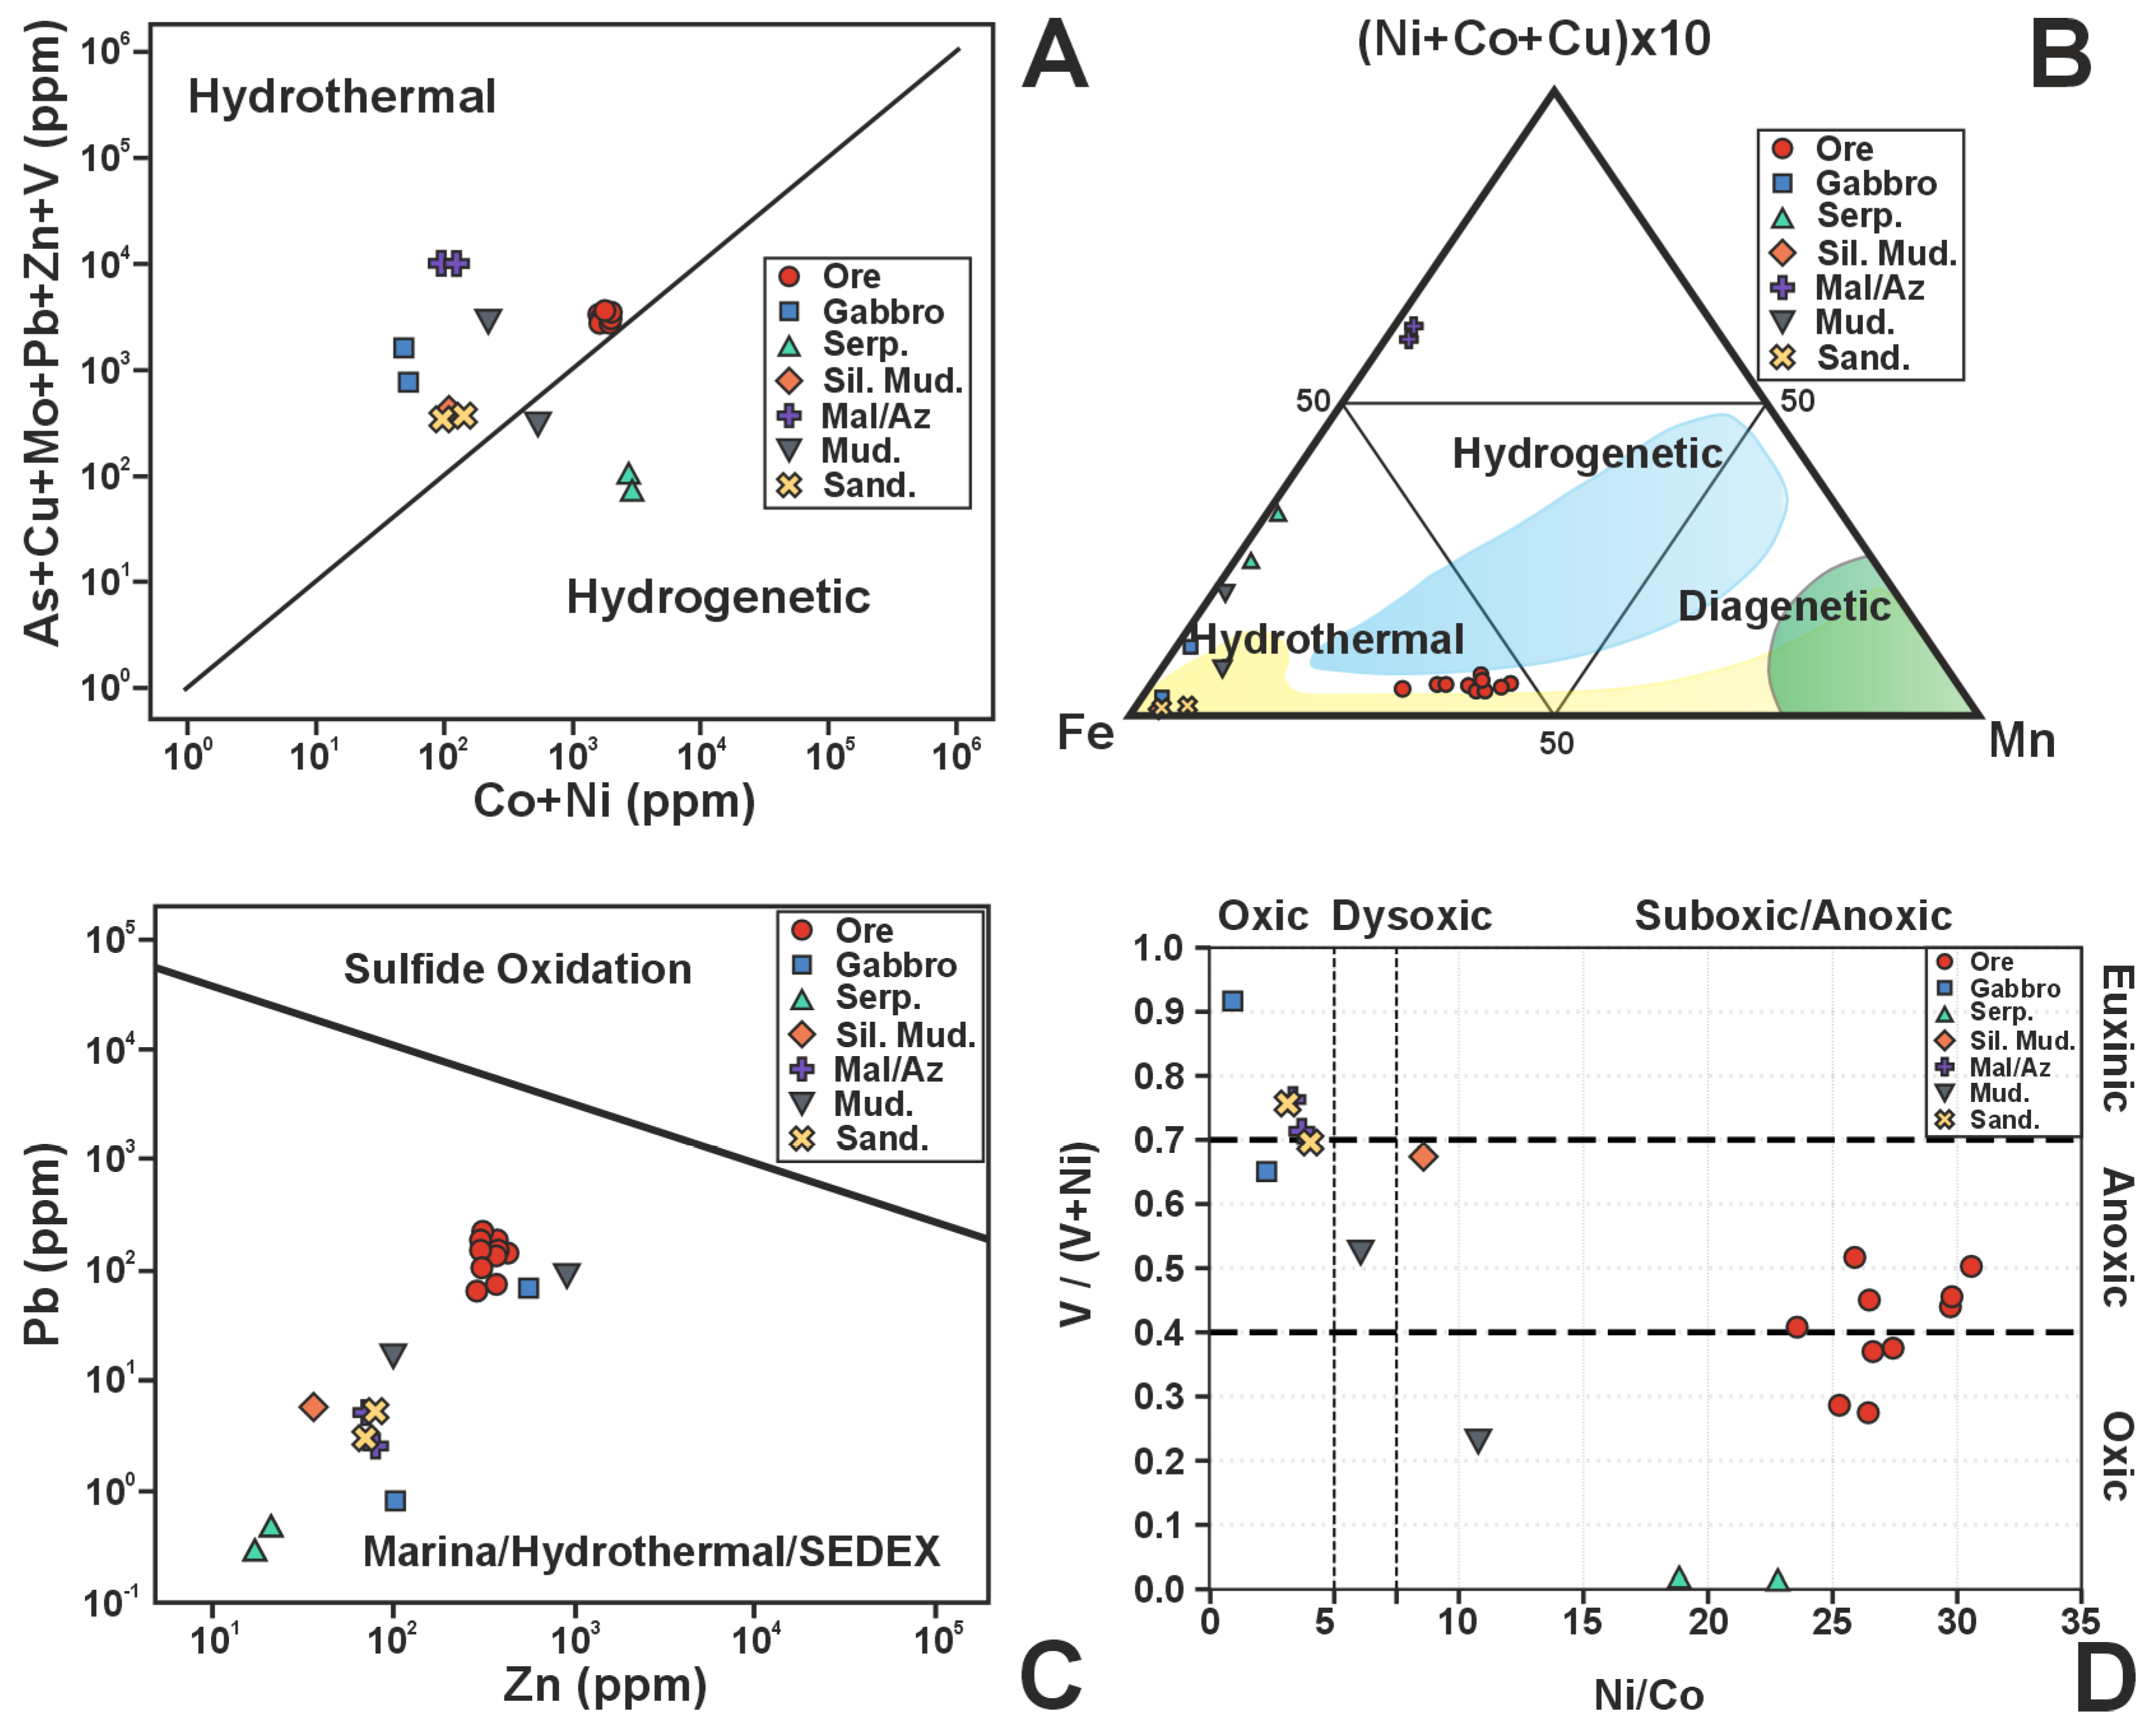
On the multi-metal (As + Cu + Mo + Pb + Zn + V) versus (Co + Ni) diagram (Figure 3A), which separates hydrothermal and hydrogenetic fields [73], most of the data plot in the hydrothermal field. On the Pb–Zn diagram (Figure 3C), which separates submarine hydrothermal/marine-SEDEX fields from sulfide oxidation fields (modified after [73]), the analyzed samples cluster below the oxidation boundary. Because deciding on the origin of Fe–Mn occurrences from a single diagram can yield misleading results, multi-parametric approaches are emphasized in the literature [1,26,74].
Indeed, the Fe–Mn–(Ni + Co + Cu) × 10 ternary discrimination diagram and redox-sensitive trace-element ratios are frequently used to detect hydrothermal fluid input and reconstruct paleoredox conditions in oceanic-crust-related Tethyan manganese deposits [75,76,77] and sedimentary basins [78,79,80]. Within this framework, the samples of the Durmuştepe Fe–Mn mineralization were evaluated on four different diagrams (Figure 3): (A) (As + Cu + Mo + Pb + Zn + V)–(Co + Ni), (B) Fe–Mn–(Ni + Co + Cu) × 10, (C) Pb–Zn, and (D) V/(V + Ni)–Ni/Co. In the ternary diagram (Figure 3B; after [81,82]), the ore samples cluster clearly in the hydrothermal field, reflecting a dominant exhalative signature. On the redox diagram (Figure 3D; after Rimmer [83] and Amiewalan and Lucas [84]), the ore samples cluster at high Ni/Co ratios (23–31) in the suboxic–anoxic field of the horizontal axis, whereas their V/(V + Ni) ratios (0.28–0.52) span the oxic–anoxic transition on the vertical axis. By contrast, the siliceous mudstone, mudstone, gabbro and sandstone samples plot more dispersedly, with several host samples showing higher V/(V + Ni) but lower Ni/Co than the ore cluster. This contrast reflects the difference between the bulk geochemical signature of hydrothermally precipitated Fe–Mn oxides—strongly enriched in Ni and other elements scavenged during exhalative accumulation—and the redox-sensitive ratios of the fine-grained siliceous and clastic host succession. The elevated Ni/Co of the ore samples is therefore interpreted primarily as a hydrothermal-exhalative overprint, not as evidence of uniformly anoxic bottom waters during ore formation. The negative Ce anomaly and oxide-dominated mineralogy nevertheless indicate mixing with oxygenated seawater at the seafloor exhalative interface (Section 4.4 and Section 5), consistent with the proposed proximal volcano-sedimentary hydrothermal model. The HFSE–REE discrimination schemes proposed for oceanic Fe–Mn deposits [26] and similar diagram applications [85] form the basis of this framework.
Figure 3. Geochemical discrimination diagrams of the Durmuştepe Fe–Mn mineralization and associated rock samples. (A) Hydrothermal/hydrogenetic origin discrimination using the multi-metal (As + Cu + Mo + Pb + Zn + V)–(Co + Ni) relationship [75]. (B) Hydrothermal and detrital field boundaries on the Fe–Mn–(Ni + Co + Cu) × 10 diagram [76,77]. (C) Distinction between sulfide oxidation and submarine marine–hydrothermal–SEDEX fields using the Pb–Zn relationship (modified after [75]). (D) Redox-sensitive V/(V + Ni) versus Ni/Co relationships showing oxic–dysoxic–suboxic/anoxic (Ni/Co) and oxic–anoxic–euxinic [V/(V + Ni)] fields (modified after Rimmer [83]; Amiewalan and Lucas [84]). Ore and host-rock samples are distinguished by symbol and color. The plotted data points represent the authors’ own original analytical data (this study); the classification fields and boundaries are adapted/redrawn from the cited publications.
Minerals 16 00687 g003

4.4. Rare Earth Element (REE) Geochemistry

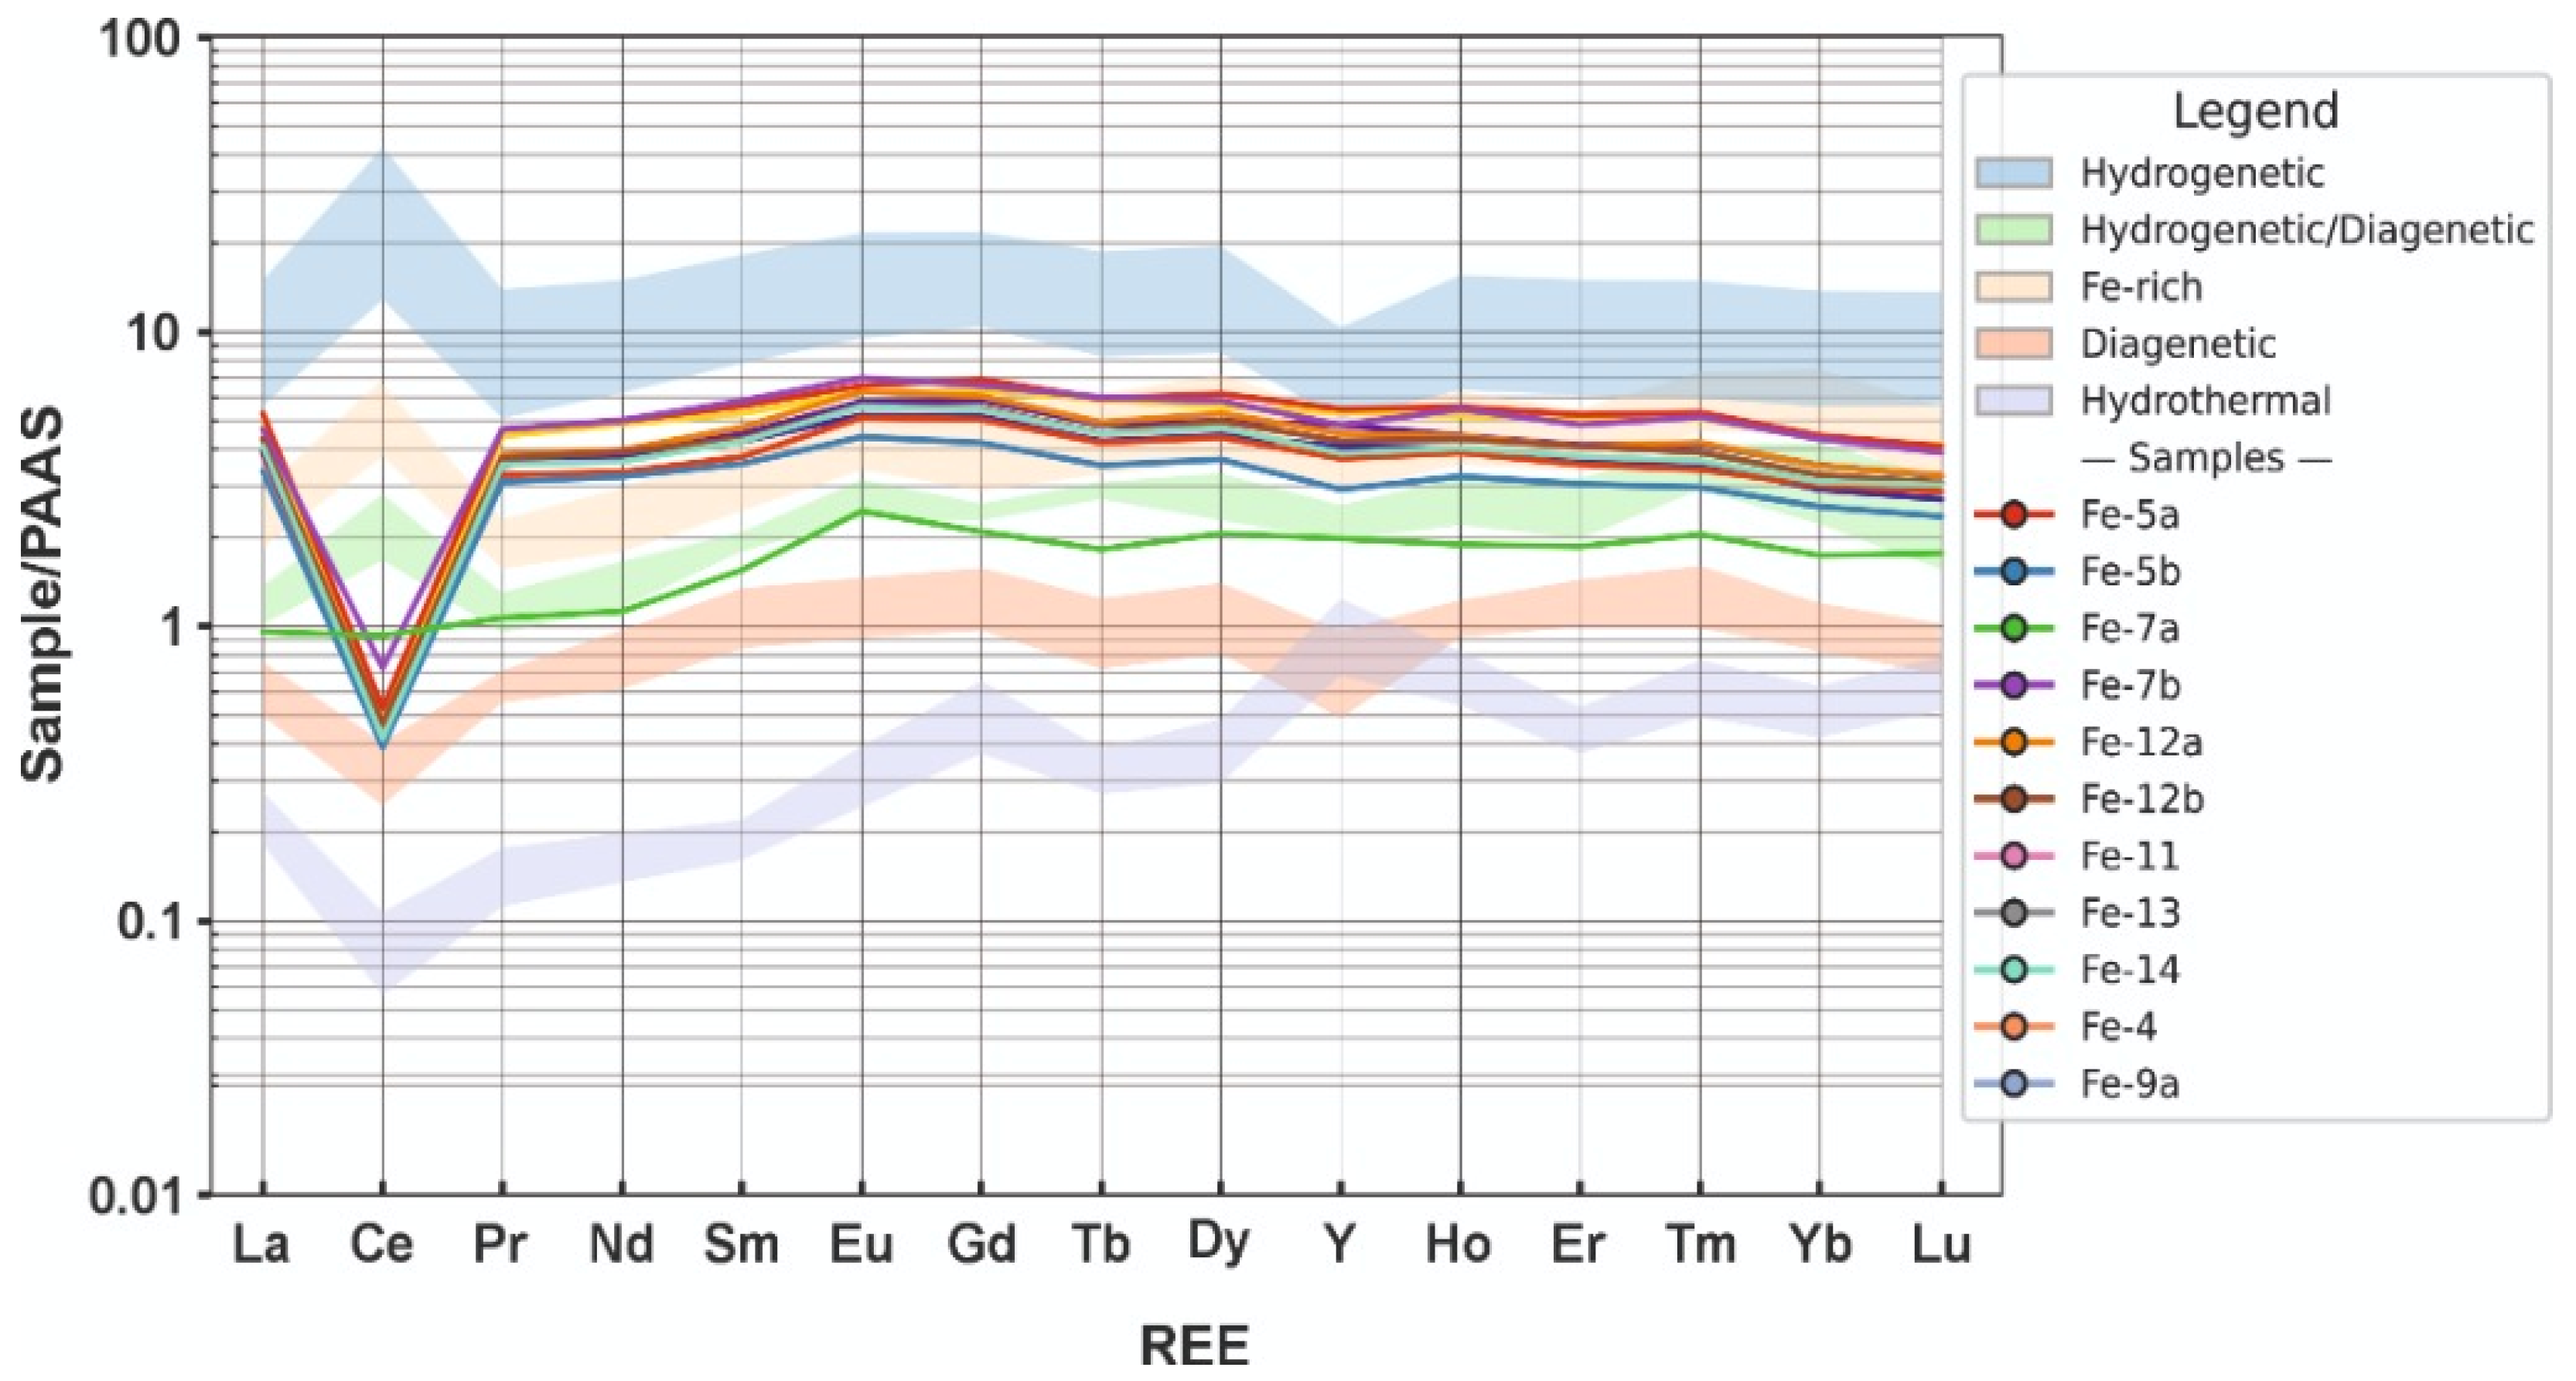
Rare earth elements (REEs) are among the indicators frequently used to determine the genetic processes and depositional environments of Fe–Mn mineralizations [1,74,86,87]. The total REE (∑REE) contents of the Durmuştepe ore samples were found to range between 355.48 ppm and 558.81 ppm, with a mean value of 455.15 ppm (Table 4; details of all rock analyses are presented in Table 3). The REE concentrations obtained were normalized to PAAS [60] values to construct the distribution patterns (Figure 4).
PAAS-normalized REE distributions are used to distinguish hydrogenetic, diagenetic and hydrothermal origins from one another [26,88]. While a distinct positive Ce anomaly (Ce/Ce* > 1) is observed in typical hydrogenetic crust formations, strong negative Ce anomalies (Ce/Ce* < 0.5) and generally a positive Eu anomaly (Eu/Eu* > 1) are seen in hydrothermal deposits that develop through the mixing of high-temperature reducing fluids with seawater [1,74]. The redox-sensitive behavior and isotopic fractionation of cerium in marine environments are also being examined in more detail using the high-precision MC-ICP-MS analytical techniques developed in recent years [89]. Systems dominated by diagenetic processes, on the other hand, generally display more horizontal profiles and limited Ce fluctuations [74].
Moreover, the abrupt mixing and oxidation of hydrothermal fluids spreading onto the seafloor with seawater (seawater shock) leads to the fractionation of cerium, producing pronounced negative Ce anomalies (Ce/Ce* < 0.5) of the type commonly observed in deep-sea cherts. This has previously been reported as an indicator of hydrothermal solution–seawater interaction in the Vezirler oceanic manganese deposit [75], the Permian deposits of the Zunyi region [78], the Kumluca Mn occurrences [77] and the Dongping sedimentary Mn deposit [80].
When the PAAS-normalized [60] REE distribution patterns of the ore samples are examined (Figure 4), profiles that run parallel to one another and display a distinct negative Ce anomaly (Ce/Ce* ≈ 0.10–0.15; Table 4) stand out. On the multi-field distribution diagram (Figure 4; modified after [88]), the analyzed Fe–Mn samples cluster in a tight band situated between the hydrogenetic/diagenetic transition field and the Fe-rich field, confirming a mixed genetic origin for the mineralization. The negative Ce anomaly is consistent with rapid precipitation and deposition from seawater-influenced hydrothermal fluids. The Eu/Eu* values range between 1.06 and 1.18 and do not show a distinct positive Eu anomaly, which suggests that the fluid temperature remained below 250–300 °C [86,87].
In the literature, rare earth elements are generally divided into two main groups: the light REEs (LREEs) between La and Sm, and the heavy REEs (HREEs) between Gd and Lu. The element Eu is additionally treated as a transition element between these two groups [60,90]. The LREE/HREE values and the related parametric ratios in this study are compiled in detail in Table 4.

4.5. Multivariate Statistical Analysis of Geochemical Data

The statistical evaluations were carried out in accordance with the two-stage methodological framework detailed in Section 3.2. In the first stage, box plots, Principal Component Analysis (PCA) and Hierarchical Cluster Analysis (HCA) were applied to all samples (n = 21), and it was determined that the ore and host-rock samples were geochemically well distinguished from one another. This finding demonstrated the methodological validity of restricting the subsequent statistical analyses to the ore samples only (n = 11), in order to eliminate the lithology-derived background noise (background effect) and to focus directly on the mineralization mechanism.

4.5.1. Descriptive Distribution Analysis (Box Plots)

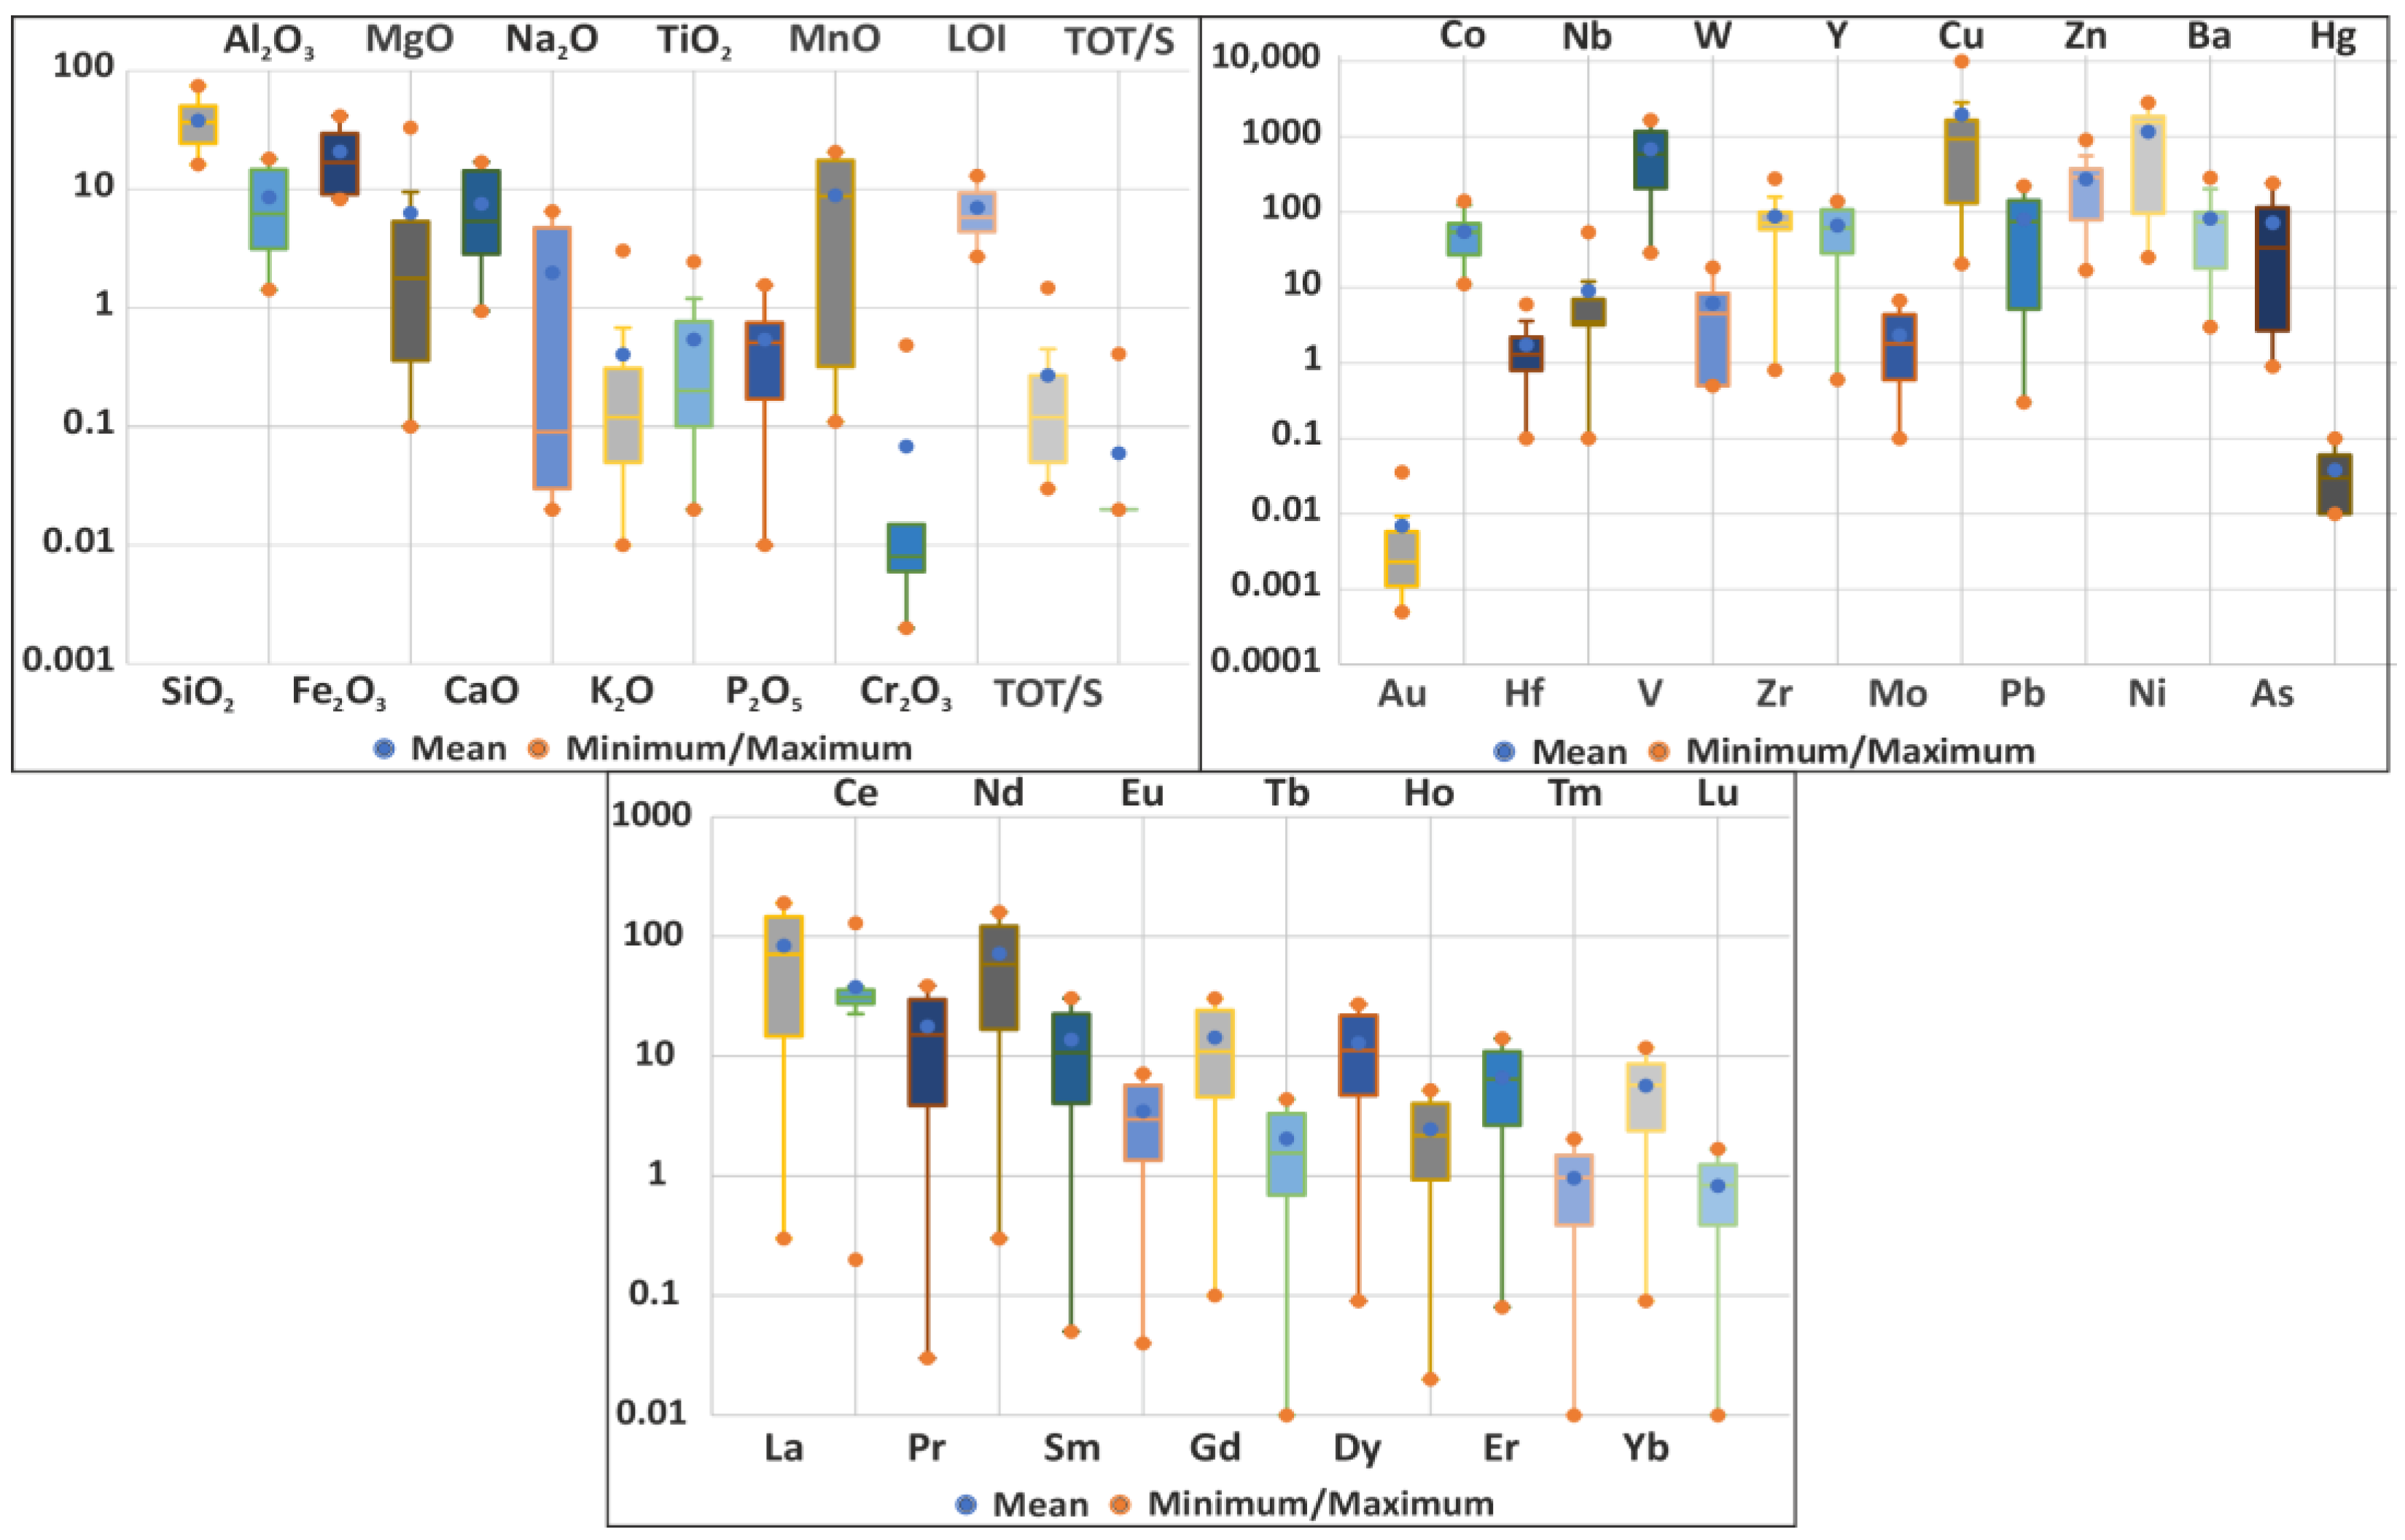
The data distributions of the major oxides, trace elements and rare earth elements (REEs), together with possible outliers, were summarized using box plots on a base-10 logarithmic scale (Figure 5). In exploratory geochemical data analysis, this non-parametric graphical approach is widely used to separate background values from anomalies [63,91].
Among the major oxides, the highest variability and the widest distribution range are observed in SiO2. Fe2O3 also shows a wide distribution, revealing the marked iron enrichment in the system. Al2O3, CaO and MnO display a moderate distribution, whereas the concentrations of MgO, Na2O, K2O and TiO2 lie within a narrow range. These distribution characteristics point to a heterogeneous environment controlled simultaneously by detrital-material input and Fe–Mn oxy-hydroxide precipitation.
Among the trace elements, an extreme (outlier) value of copper (Cu) reaching about 10,000 ppm was detected in samples Ma-1 and Ma-2 (Table 2). These malachite- and azurite-bearing specimens were collected within the mineralization zone and are characterized by secondary Cu-carbonate mineralization (Figure 2) rather than the primary pyrolusite–braunite Fe–Mn ore assemblage; their low MnO contents (0.47–0.57 wt.%) support this interpretation. We therefore regard Ma-1 and Ma-2 as supergene/alteration products linked to the same broader hydrothermal system that formed the Fe–Mn lenses, but not as representative primary ore samples. Accordingly, they were retained in the full geochemical dataset (n = 21) for PCA, HCA and discrimination diagrams to illustrate contrast with the Fe–Mn ore cluster, but were excluded from the ore-only factor analysis (n = 11) and ore-based CoDA-PCA so that the multivariate models would not be dominated by the extreme Cu outlier.
Ni, Pb and V show wider distribution ranges and higher maximum values than the other trace elements. When the extreme Cu values of Ma-1 and Ma-2 are excluded, the narrower distribution of the other trace elements reflects the differences in the mechanisms by which the elements were incorporated into the system.
Among the rare earth elements (REEs), La and Nd from the light REE (LREE) group show high concentrations and wide distribution ranges. Although Ce displays a narrow range, it has distinct extreme values at the upper limit. The heavy REEs (HREEs) such as Er, Tm, Yb and Lu, on the other hand, are represented by low concentrations and very narrow distributions.
The box plots show the heterogeneous nature of the geochemical dataset in terms of both major oxides and trace elements, particularly the high fluctuations in the base metals and mobile elements. These data indicate that more than one lithological unit, alteration processes and/or different fluid systems were simultaneously effective in the study area.

4.5.2. Principal Component Analysis (PCA) and Hierarchical Cluster Analysis (HCA)

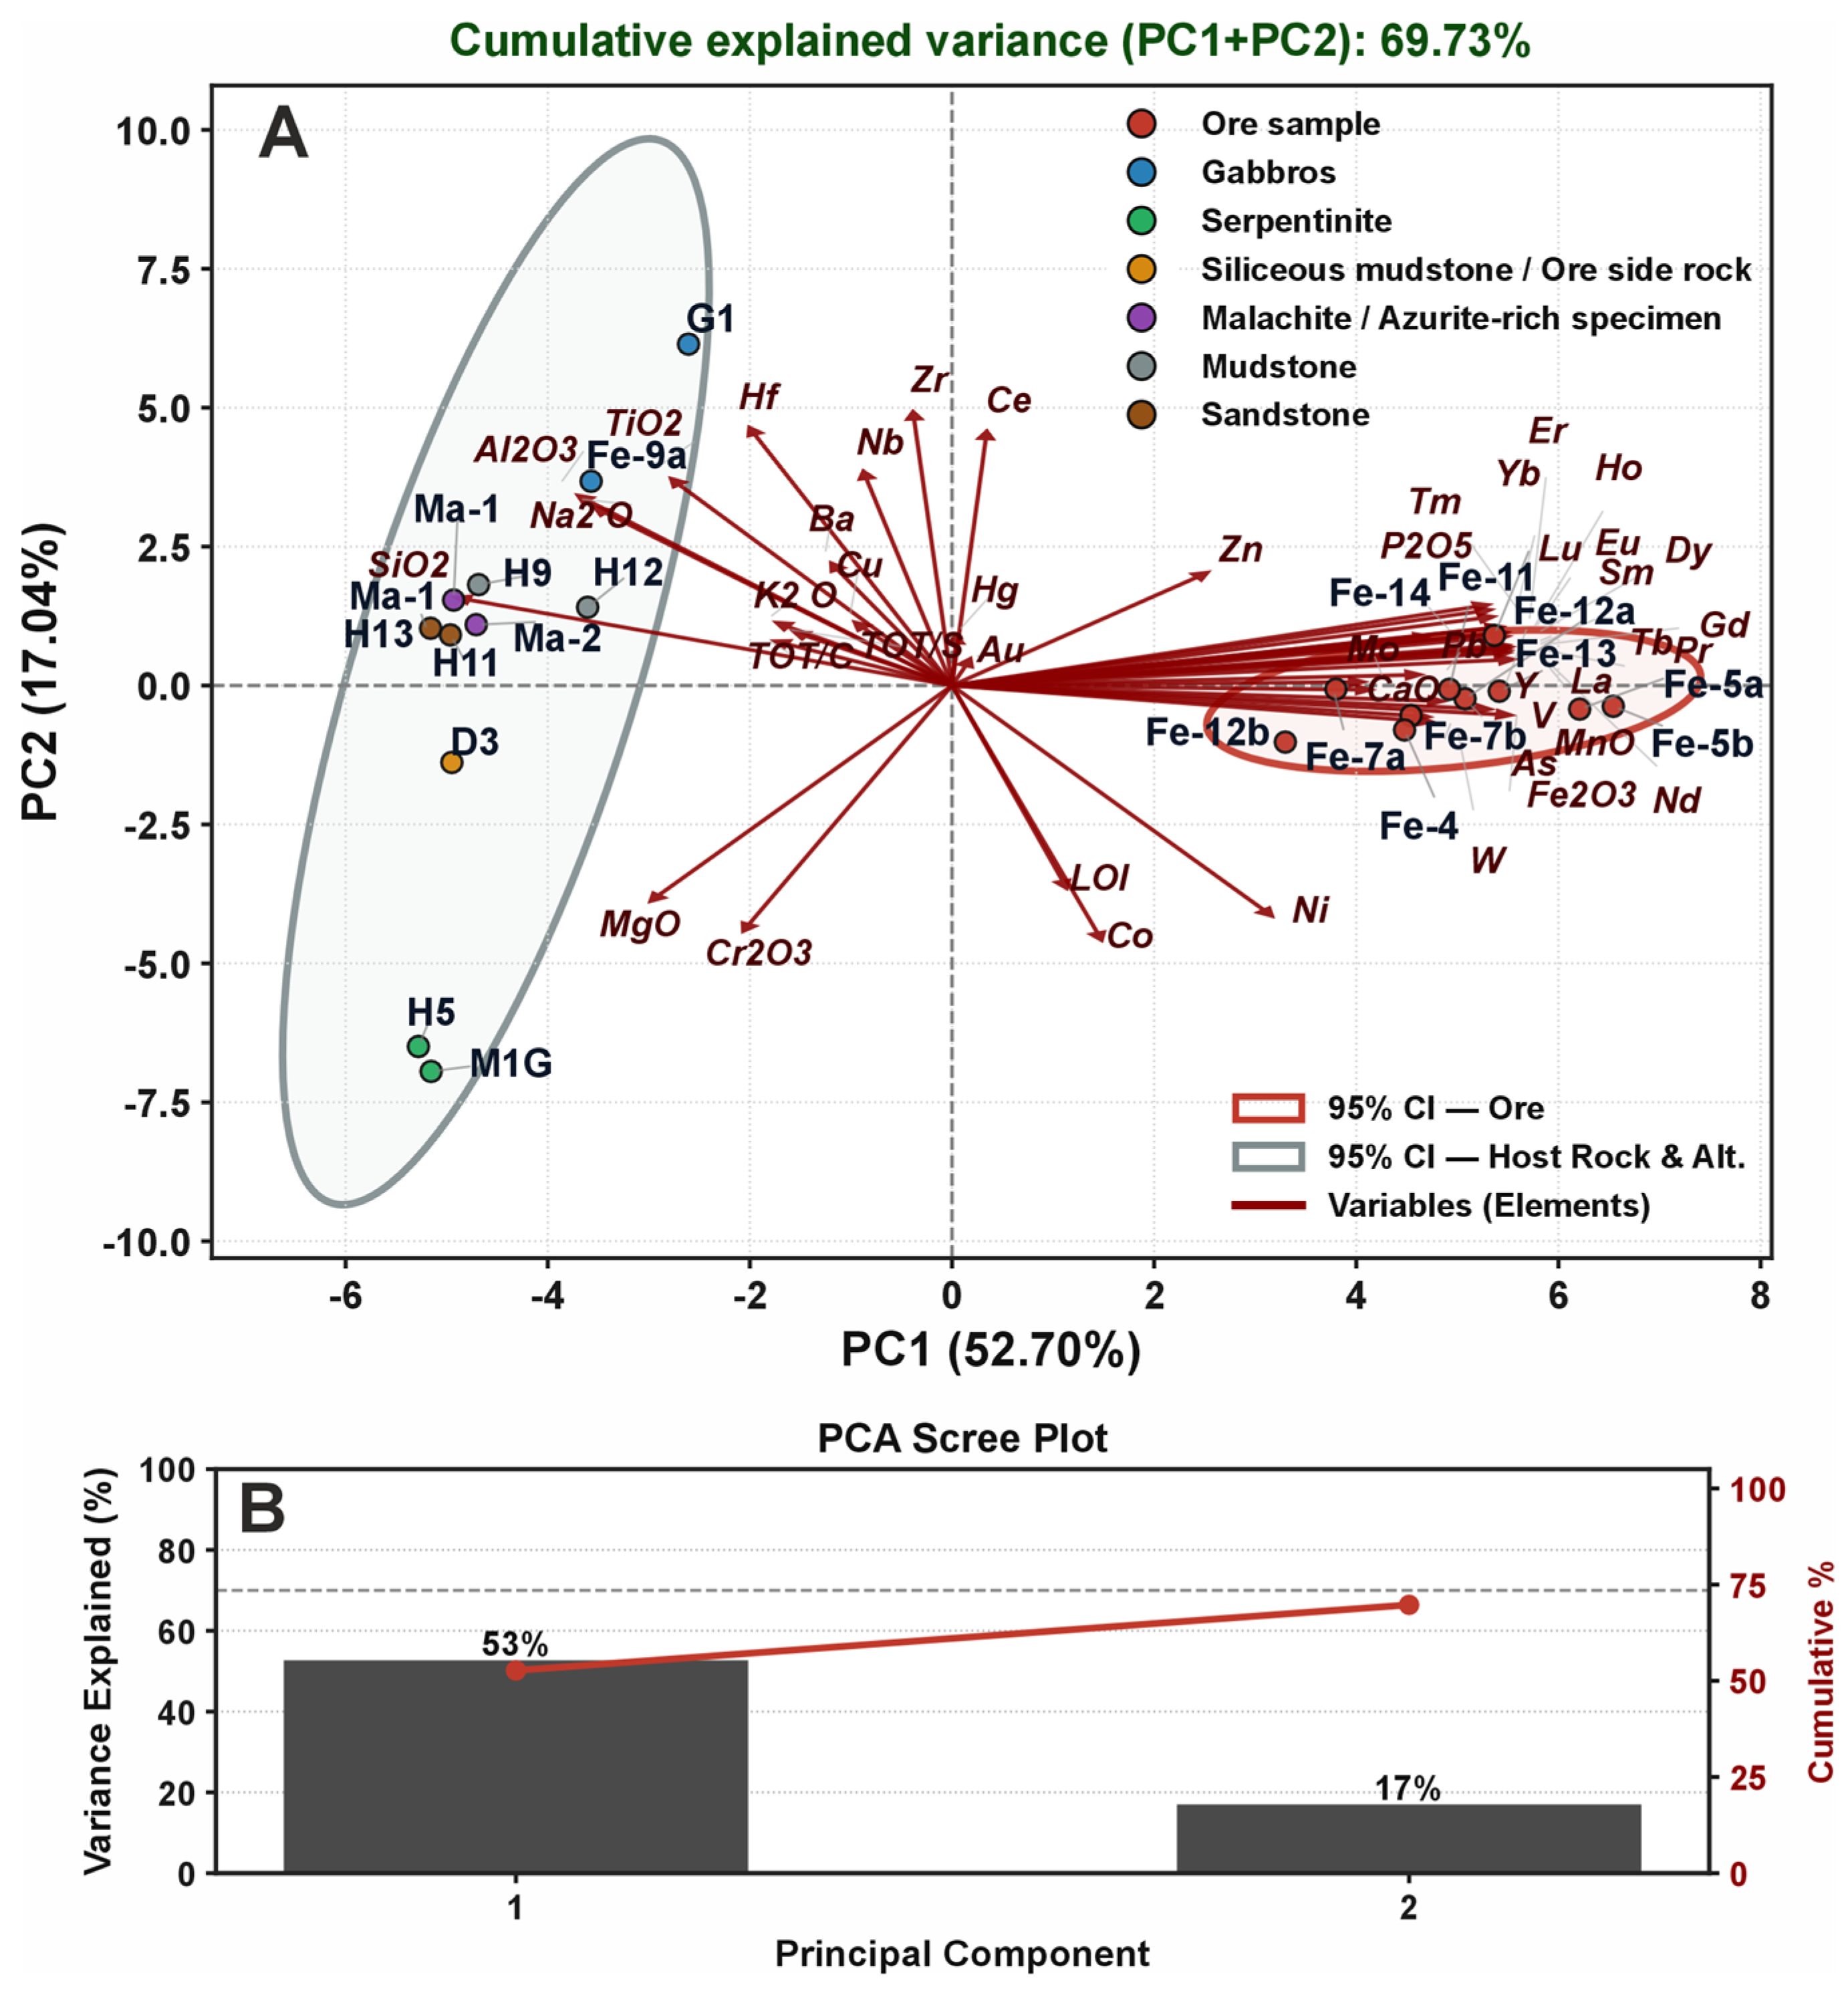
PCA was applied to the entire geochemical dataset collected from the Durmuştepe license area (n = 21; including ore and host-rock/alteration samples) in order to determine the distribution behavior of the elements and the relationships between the lithogenic background and the mineralization [63,66,91,92,93]. The first principal component (PC1) explains 52.70% of the total variance obtained from the analysis, and the second principal component (PC2) explains 17.04%. The biplot prepared for the PC1–PC2 plane shows that the sample groups and the element vectors are well separated from one another (Figure 6).
PC1 separates the mineralization from the host-rock/detrital input. On the positive side are the ore samples and Fe2O3, MnO, CaO, P2O5, trace metals and the REEs; on the negative side are the host-rock samples and SiO2, Al2O3, TiO2, K2O, Na2O and Ba. The positive side reflects oxy-hydroxide precipitation and the negative side detrital dilution.
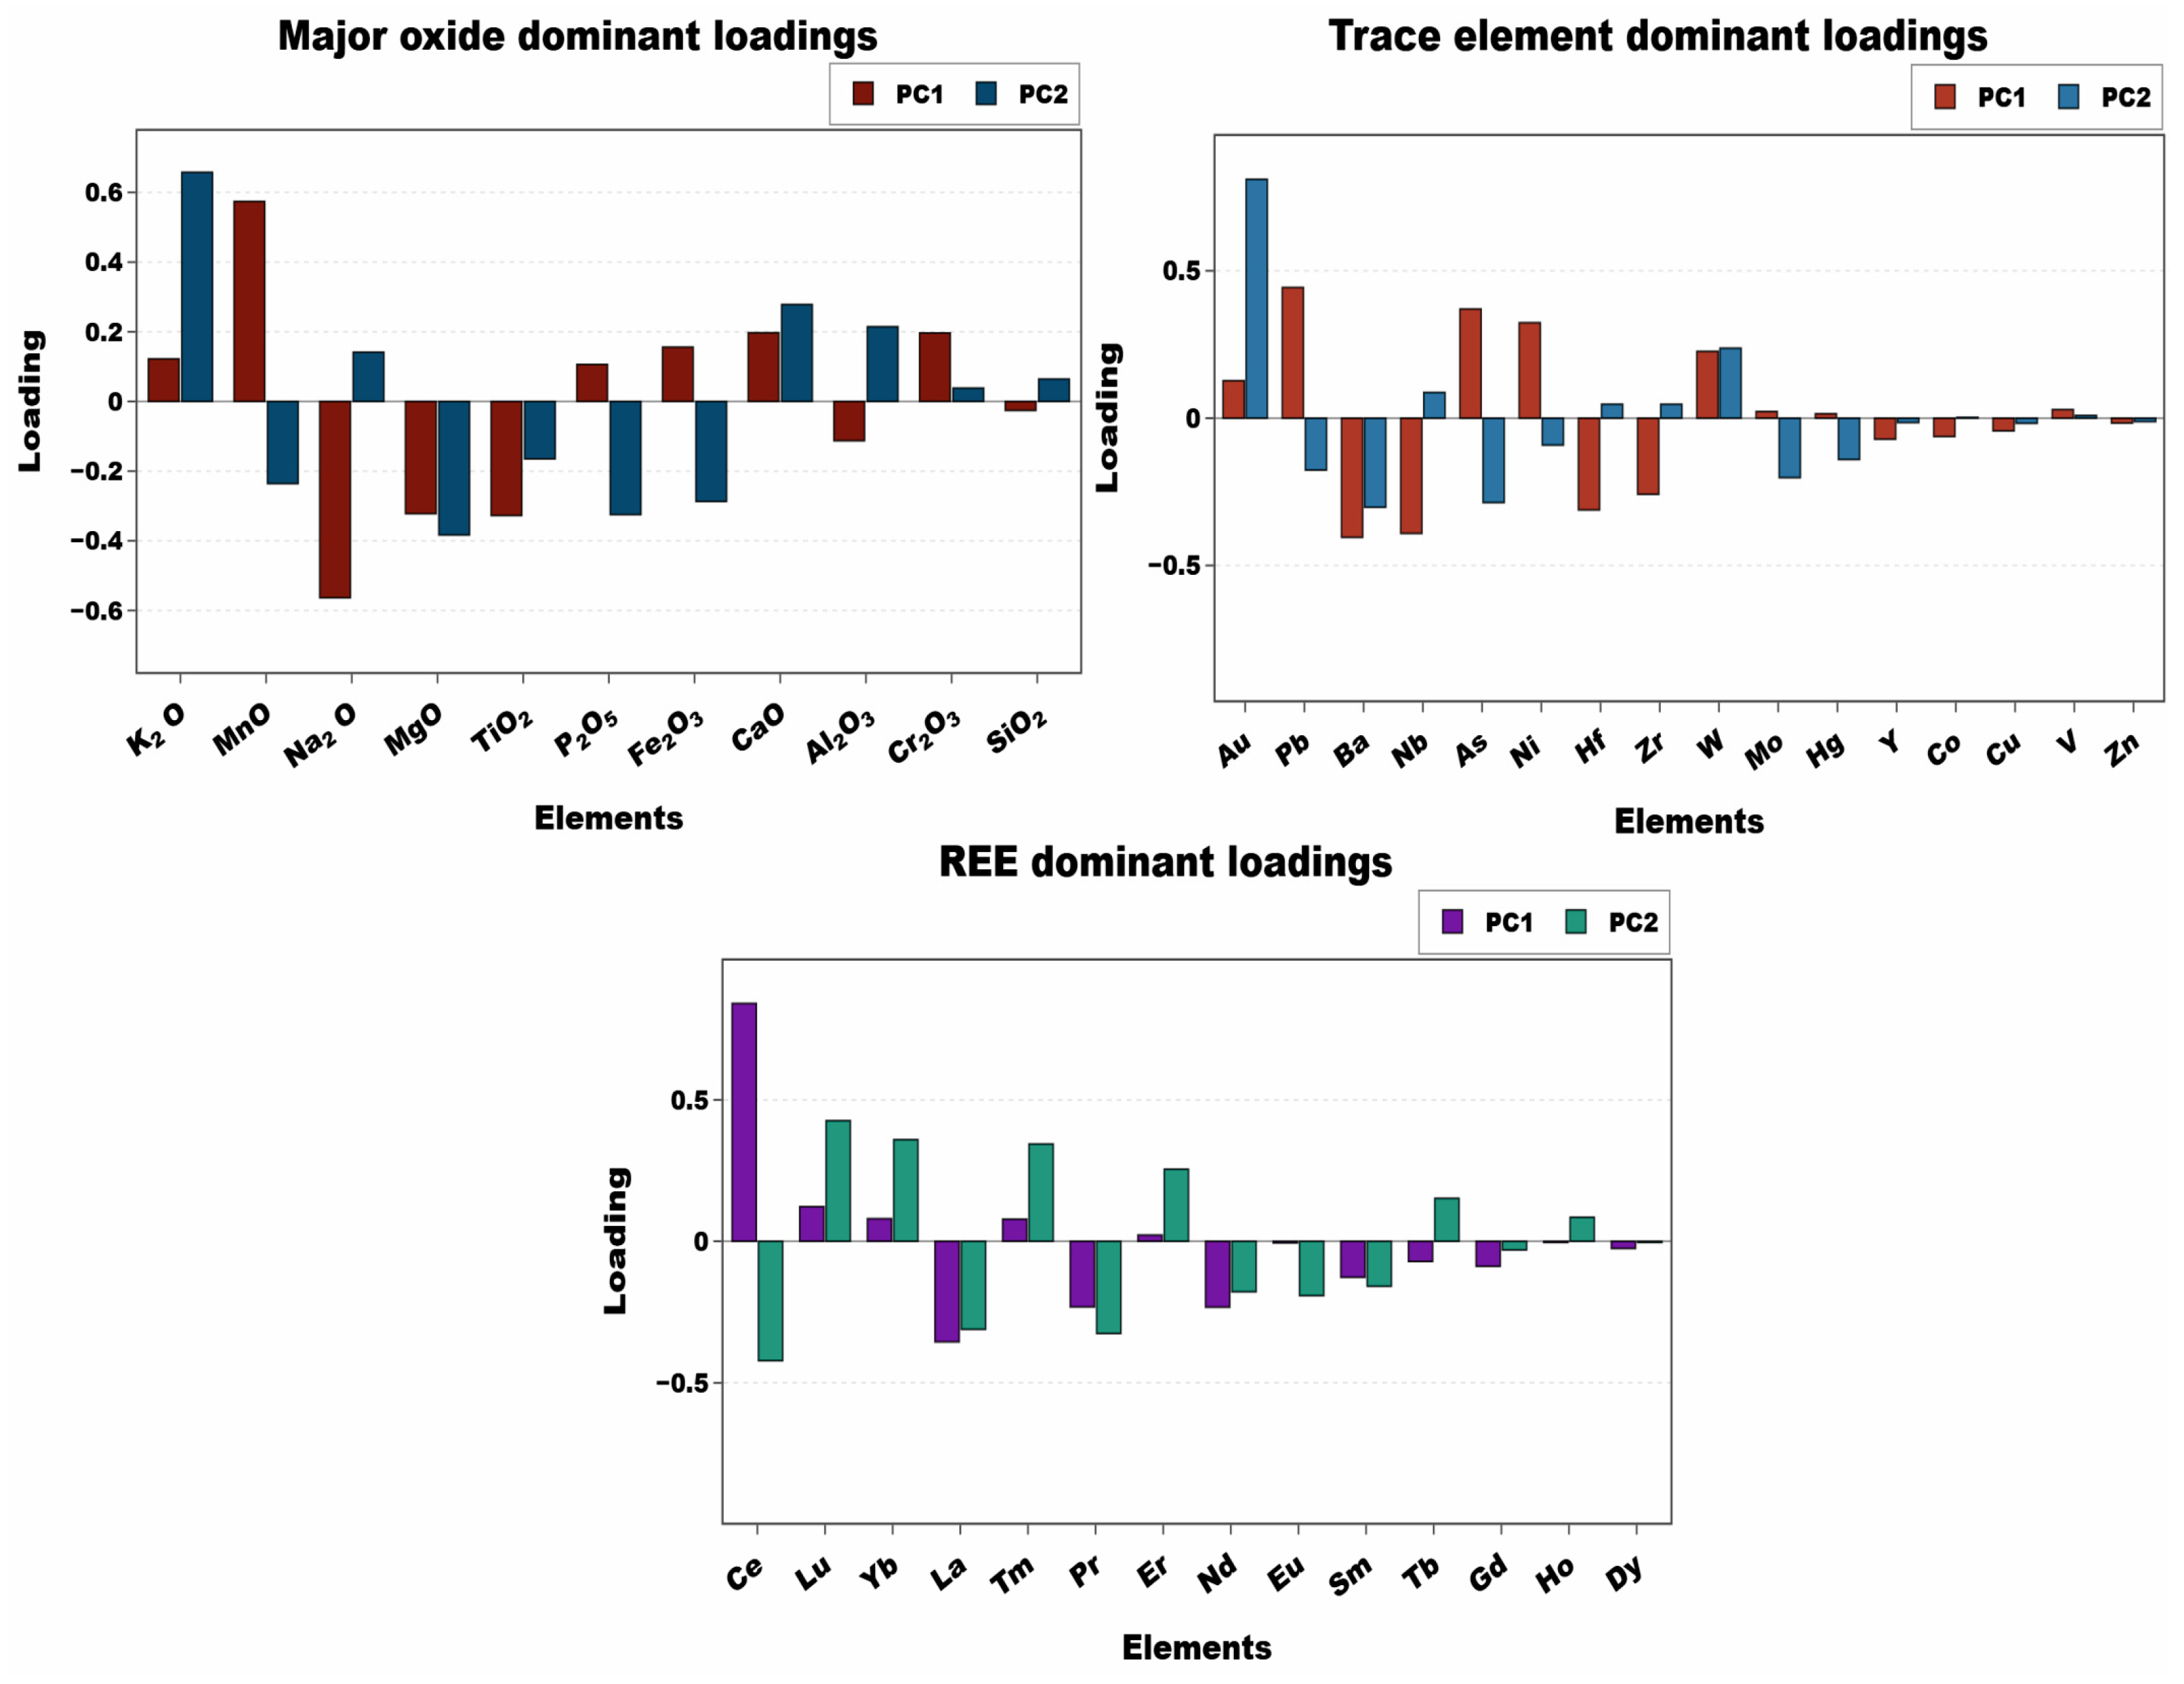
On the positive part of PC2 are stable elements such as Zr, Hf and Nb, together with Ce. The decoupling of Ce from the other REEs and its concentration in this field indicate Ce fractionation developed under the redox conditions of the environment. On the negative side are MgO, Cr2O3, Ni, Co and the serpentinite samples (‘M1G’, ‘H5’). This distribution reflects the geochemical influence of the ophiolitic/ultramafic host rocks in the Maden Complex. While PC1 controls the distinction between mineralization and host rock, PC2 indicates the influence of the mafic–ultramafic rocks and the redox/stable-element (Ce, Zr, Hf, Nb) fractionation.
Serpentinite samples M1G and H5 record the highest absolute Ni concentrations in the dataset (2639 and 2829 ppm, respectively; Table 2), reflecting the ophiolitic ultramafic component of the Maden Complex host succession. In PCA and HCA, however, these samples cluster with other host rocks and are clearly separated from the Fe–Mn ore group on PC1. Ore samples show comparable to slightly higher Ni/Co ratios (23–31) than M1G (~19) despite similar absolute Ni levels, consistent with preferential Ni (and Co) scavenging during hydrothermal Fe–Mn oxide precipitation rather than simple mechanical mixing with serpentinite. We therefore interpret ore Ni–Co enrichment as an exhalative-hydrothermal overprint superimposed on, but not dominated by, local ultramafic input.
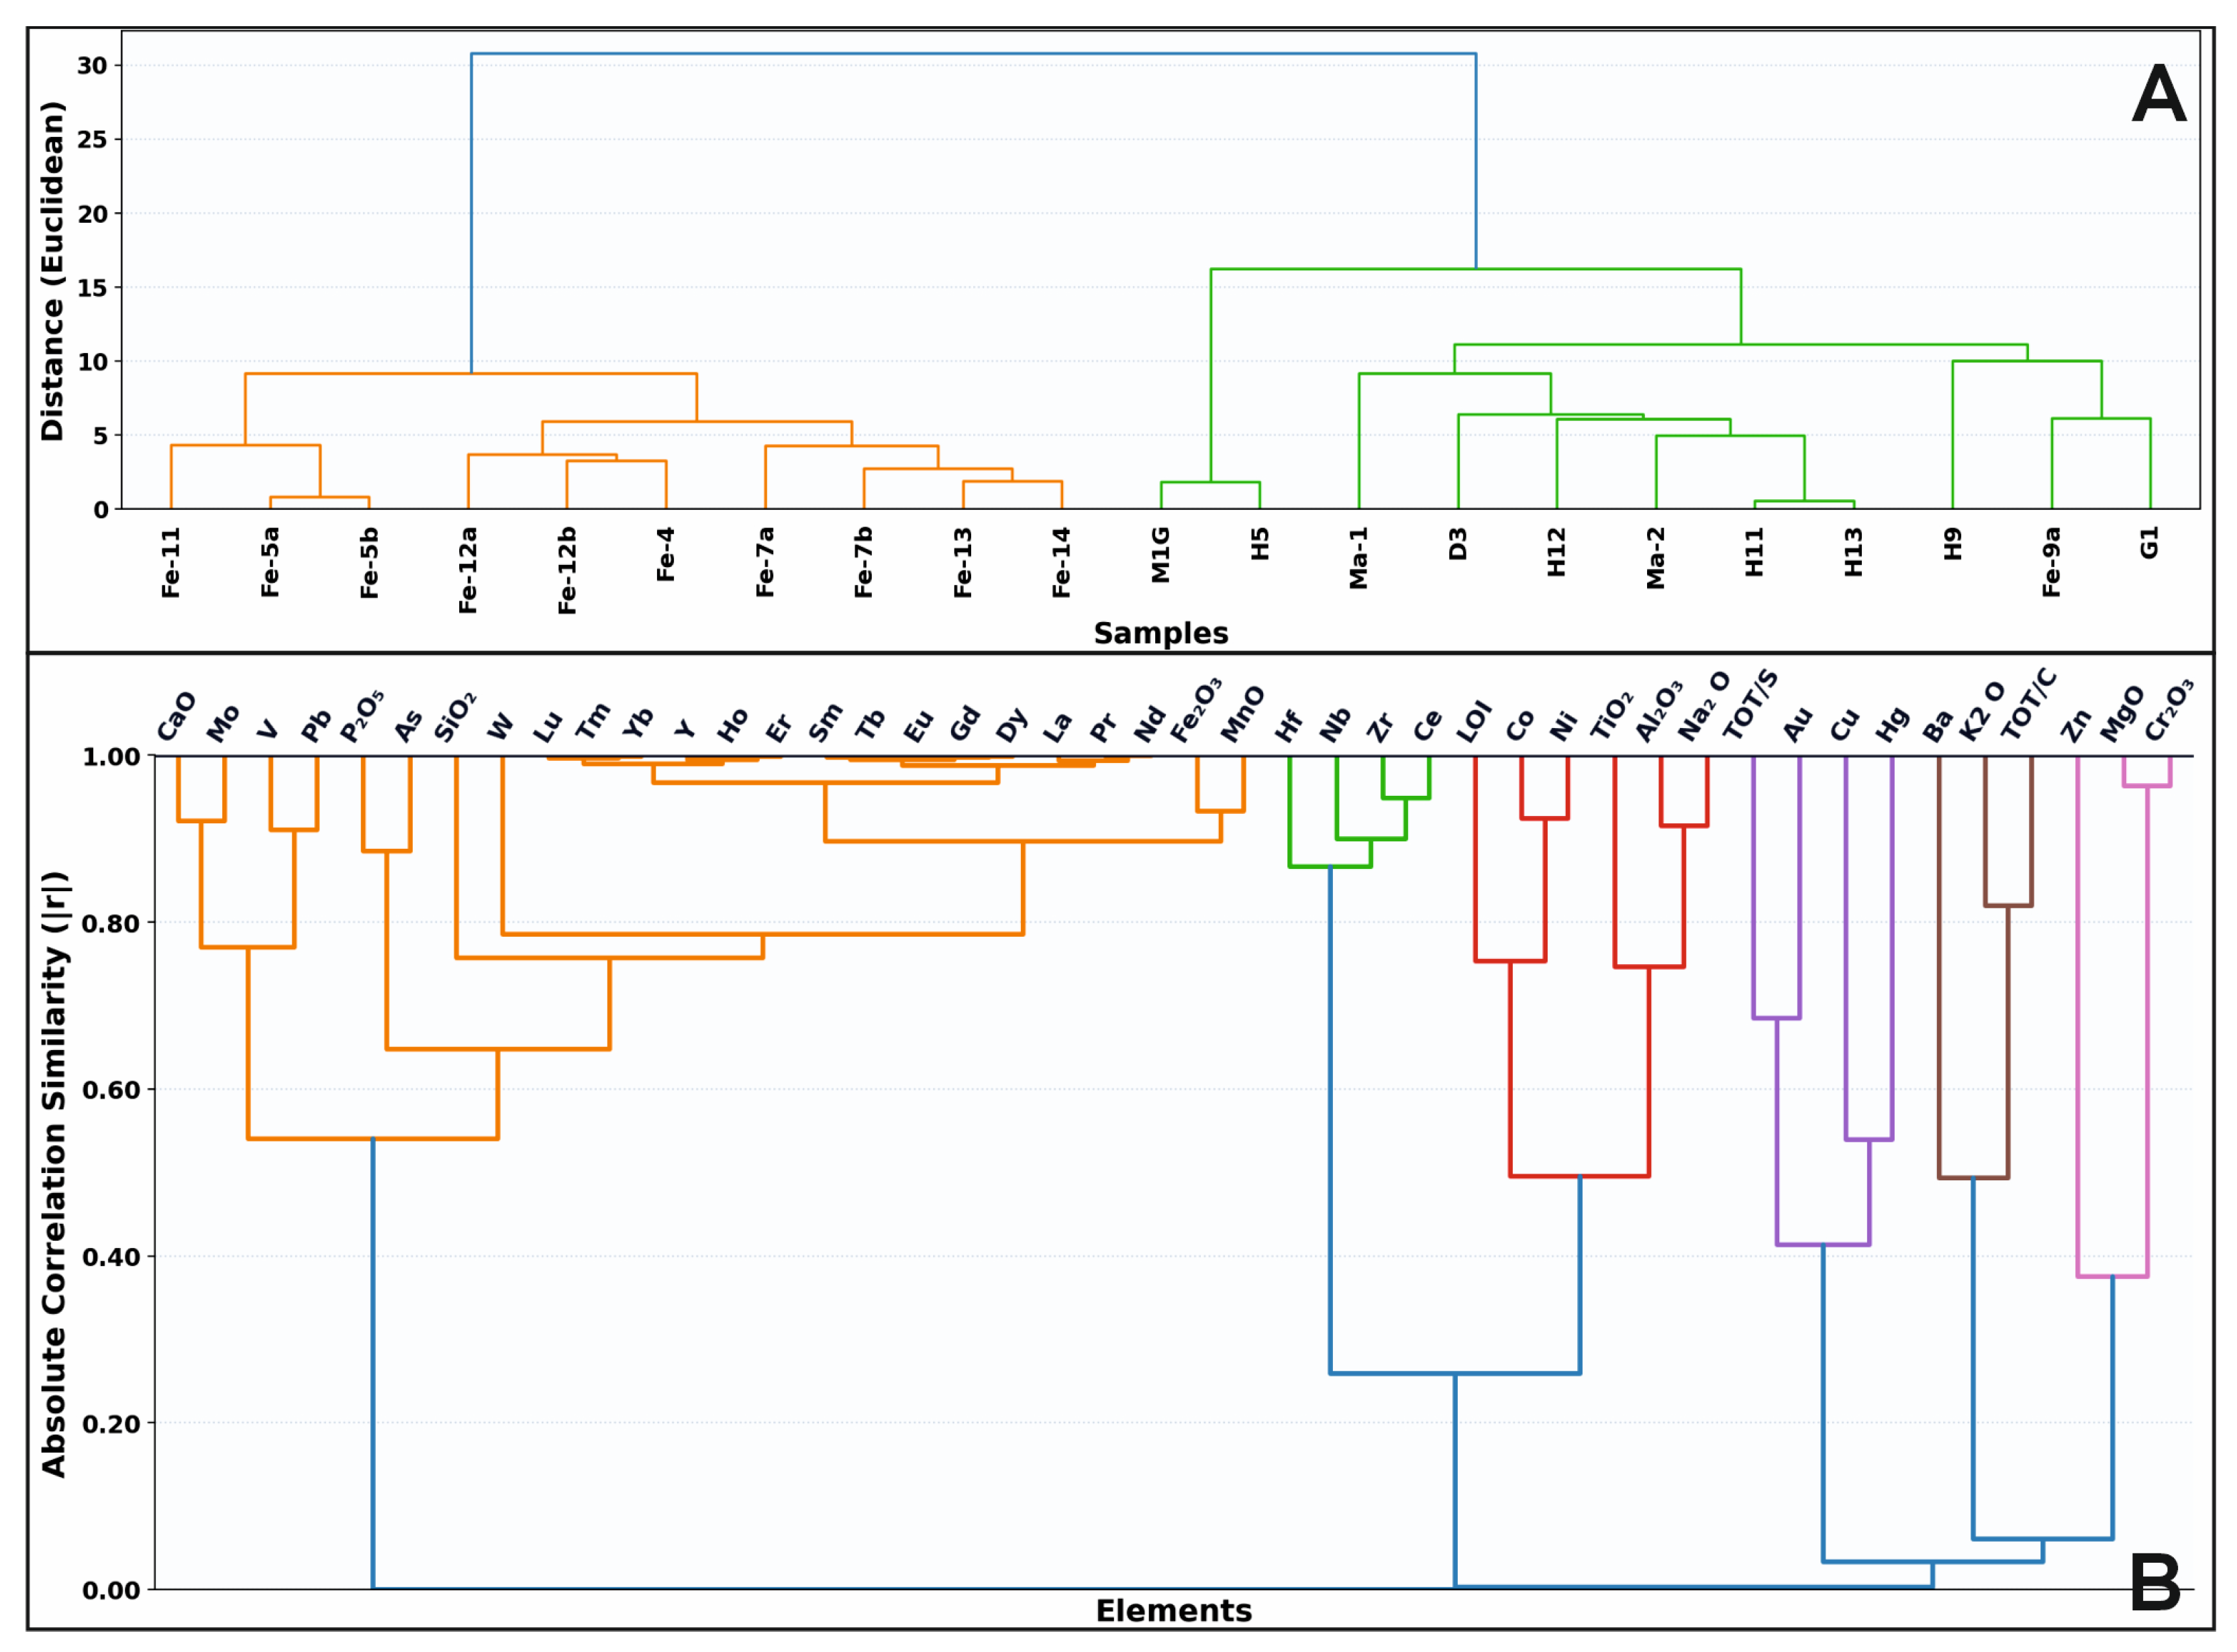
Hierarchical Cluster Analysis (HCA) was applied to classify the sample and element groups [66,91,94]. The clustering was carried out in two directions, for the samples and for the elements (Figure 7).
The sample dendrogram (Figure 7A) is divided into two main groups. The first group (orange) comprises the ‘Fe-‘-coded ore samples, and the second group (green) the host-rock and alteration samples (M1G, H5, Ma-1/2, D3, H9–H13, Fe-9a, G1). This bimodal distribution is consistent with the PC1 contrast in the PCA and indicates that the mineralization and the host rocks are geochemically of a completely different character.
The element dendrogram (Figure 7B) is divided into three main groups. The first main group (orange) comprises Fe2O3, MnO and the rare earth elements (REEs) other than Ce, together with Y, As, W, V, CaO, Mo, Pb and P2O5. This association may reflect elements that co-vary with Fe–Mn oxy-hydroxide precipitation; on its own it does not demonstrate contemporaneous precipitation. In the second group (green), the stable elements (Zr-Hf-Nb) are clustered with Ce. The decoupling of Ce from the other REEs is consistent with cerium fractionation. The other element groups (Al2O3, TiO2, Na2O, Ba, K2O, TOT/C and MgO-Cr2O3-Zn) separate from these clusters with low similarity and represent the lithogenic and mafic–ultramafic components entering the system.

4.5.3. Correlation Matrix, Regression and Factor Analysis

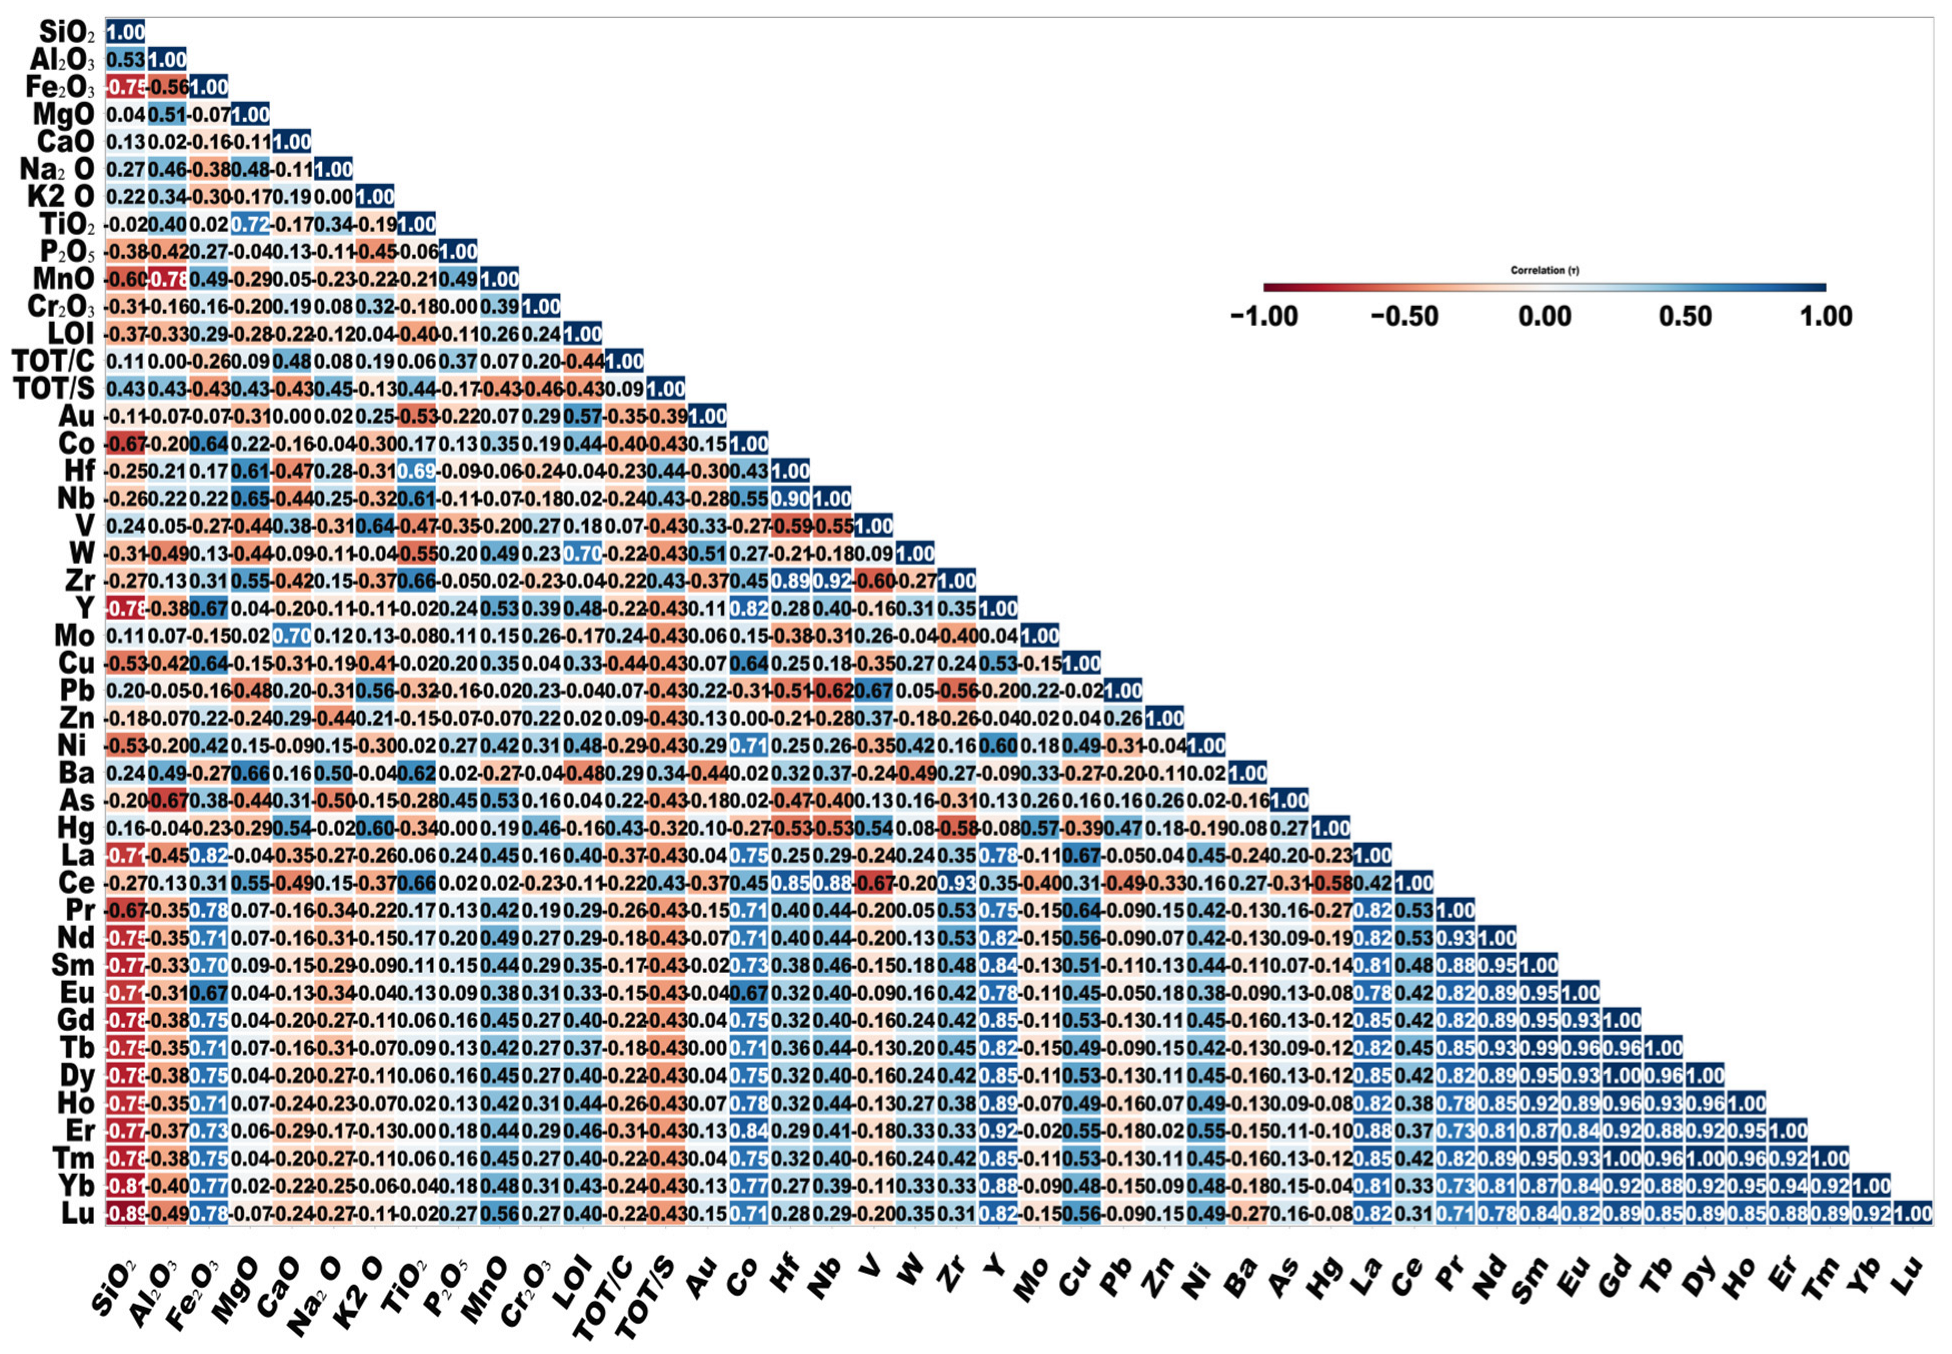
Correlation analysis was carried out to define the relationships and paragenetic associations among the elements. Because the dataset did not meet the parametric assumptions and contained outliers, non-parametric methods were preferred [63].
The Shapiro–Wilk test determined that the data were not normally distributed (p < 0.05), and in order to avoid distributional [64,95] and mathematical biases, the element relationships were evaluated through the Kendall correlation matrix (Figure 8; [94]). The correlation coefficients obtained indicate that the elements precipitated contemporaneously under similar Eh–pH conditions or underwent isomorphic substitution in the crystal lattices of the minerals [94,96].
In the correlation matrix, a positive relationship (τ = 0.49) was found between Fe2O3 and MnO. As (MnO, τ = 0.53), Y (Fe2O3, τ = 0.67), Co (Fe2O3, τ = 0.64), as well as La (τ = 0.82) and Nd (τ = 0.71), also show positive covariation with the Fe–Mn components; it may be considered that the trace elements and REEs were enriched together with these phases. The relationships between Cr (τ = 0.16) and Ni (τ = 0.42) are weaker than those of the Fe–Mn components. While CaO shows no clear relationship with Fe2O3 (τ = −0.16) or MnO (τ = 0.05), it gives a positive relationship with TOT/C (τ = 0.48), which suggests that the Ca enrichment may be related to a later process, distinct from the primary Fe–Mn mineralization.
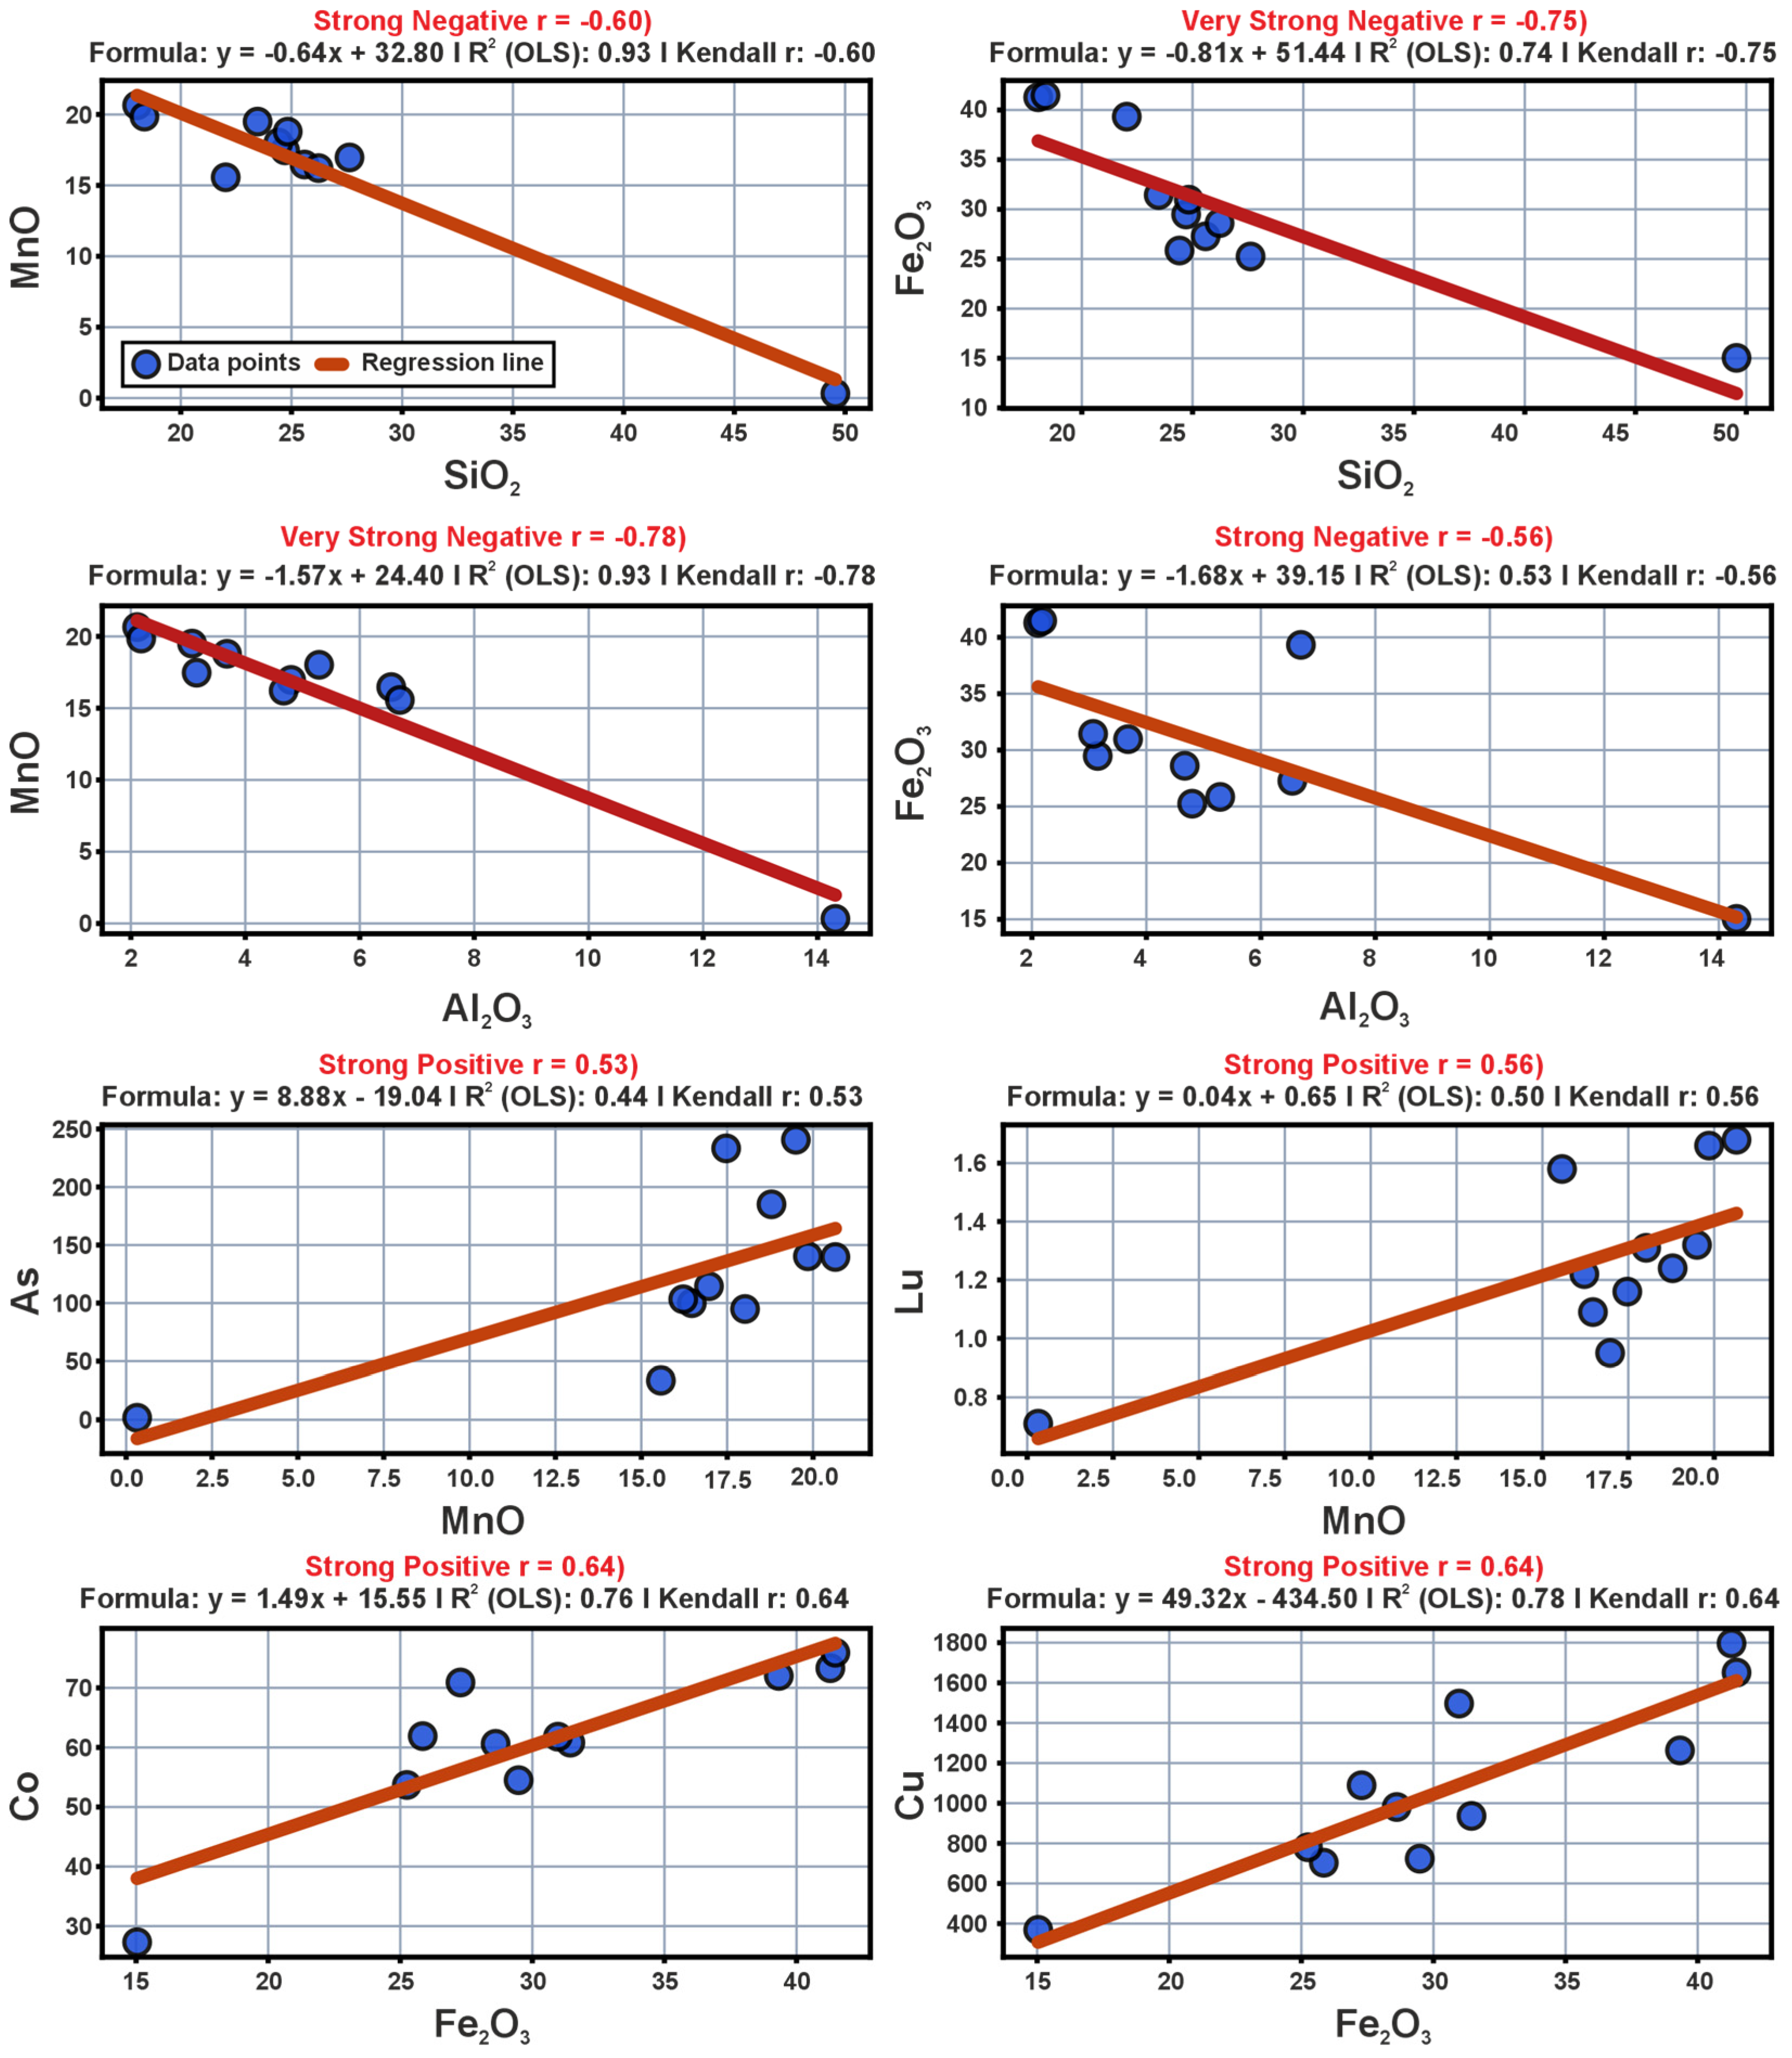
Binary scatter diagrams and regression analyses were plotted to determine the geochemical origin and enrichment trends (Figure 9).
The scatter diagrams and the regression parameters (R2) indicate that the geochemical structure is controlled by two opposing processes—detrital dilution and element scavenging:
In the regression diagrams, the negative relationship of SiO2 and Al2O3 with the Fe and Mn oxides (R2 = 0.53–0.93) indicates a binary mixing (dilution) model. The strong inverse relationship of Al2O3 with MnO (R2 = 0.93) shows that terrestrial detrital material reduced the primary oxy-hydroxide accumulation [97].
The positive relationships of Lu (R2 = 0.50) and As (R2 = 0.44) with MnO support the retention of REEs and arsenic compounds by adsorption on manganese-oxide surfaces [86,87,98]. The strong positive relationship of Co (R2 = 0.76) and Cu (R2 = 0.78) with Fe2O3 indicates that iron oxy-hydroxides may be one of the likely carrier phases. The Co enrichment is explained by the oxidation of Co2+ ions to the Co3+ form on the iron-oxide surface and their incorporation into the lattice structure [81,99].
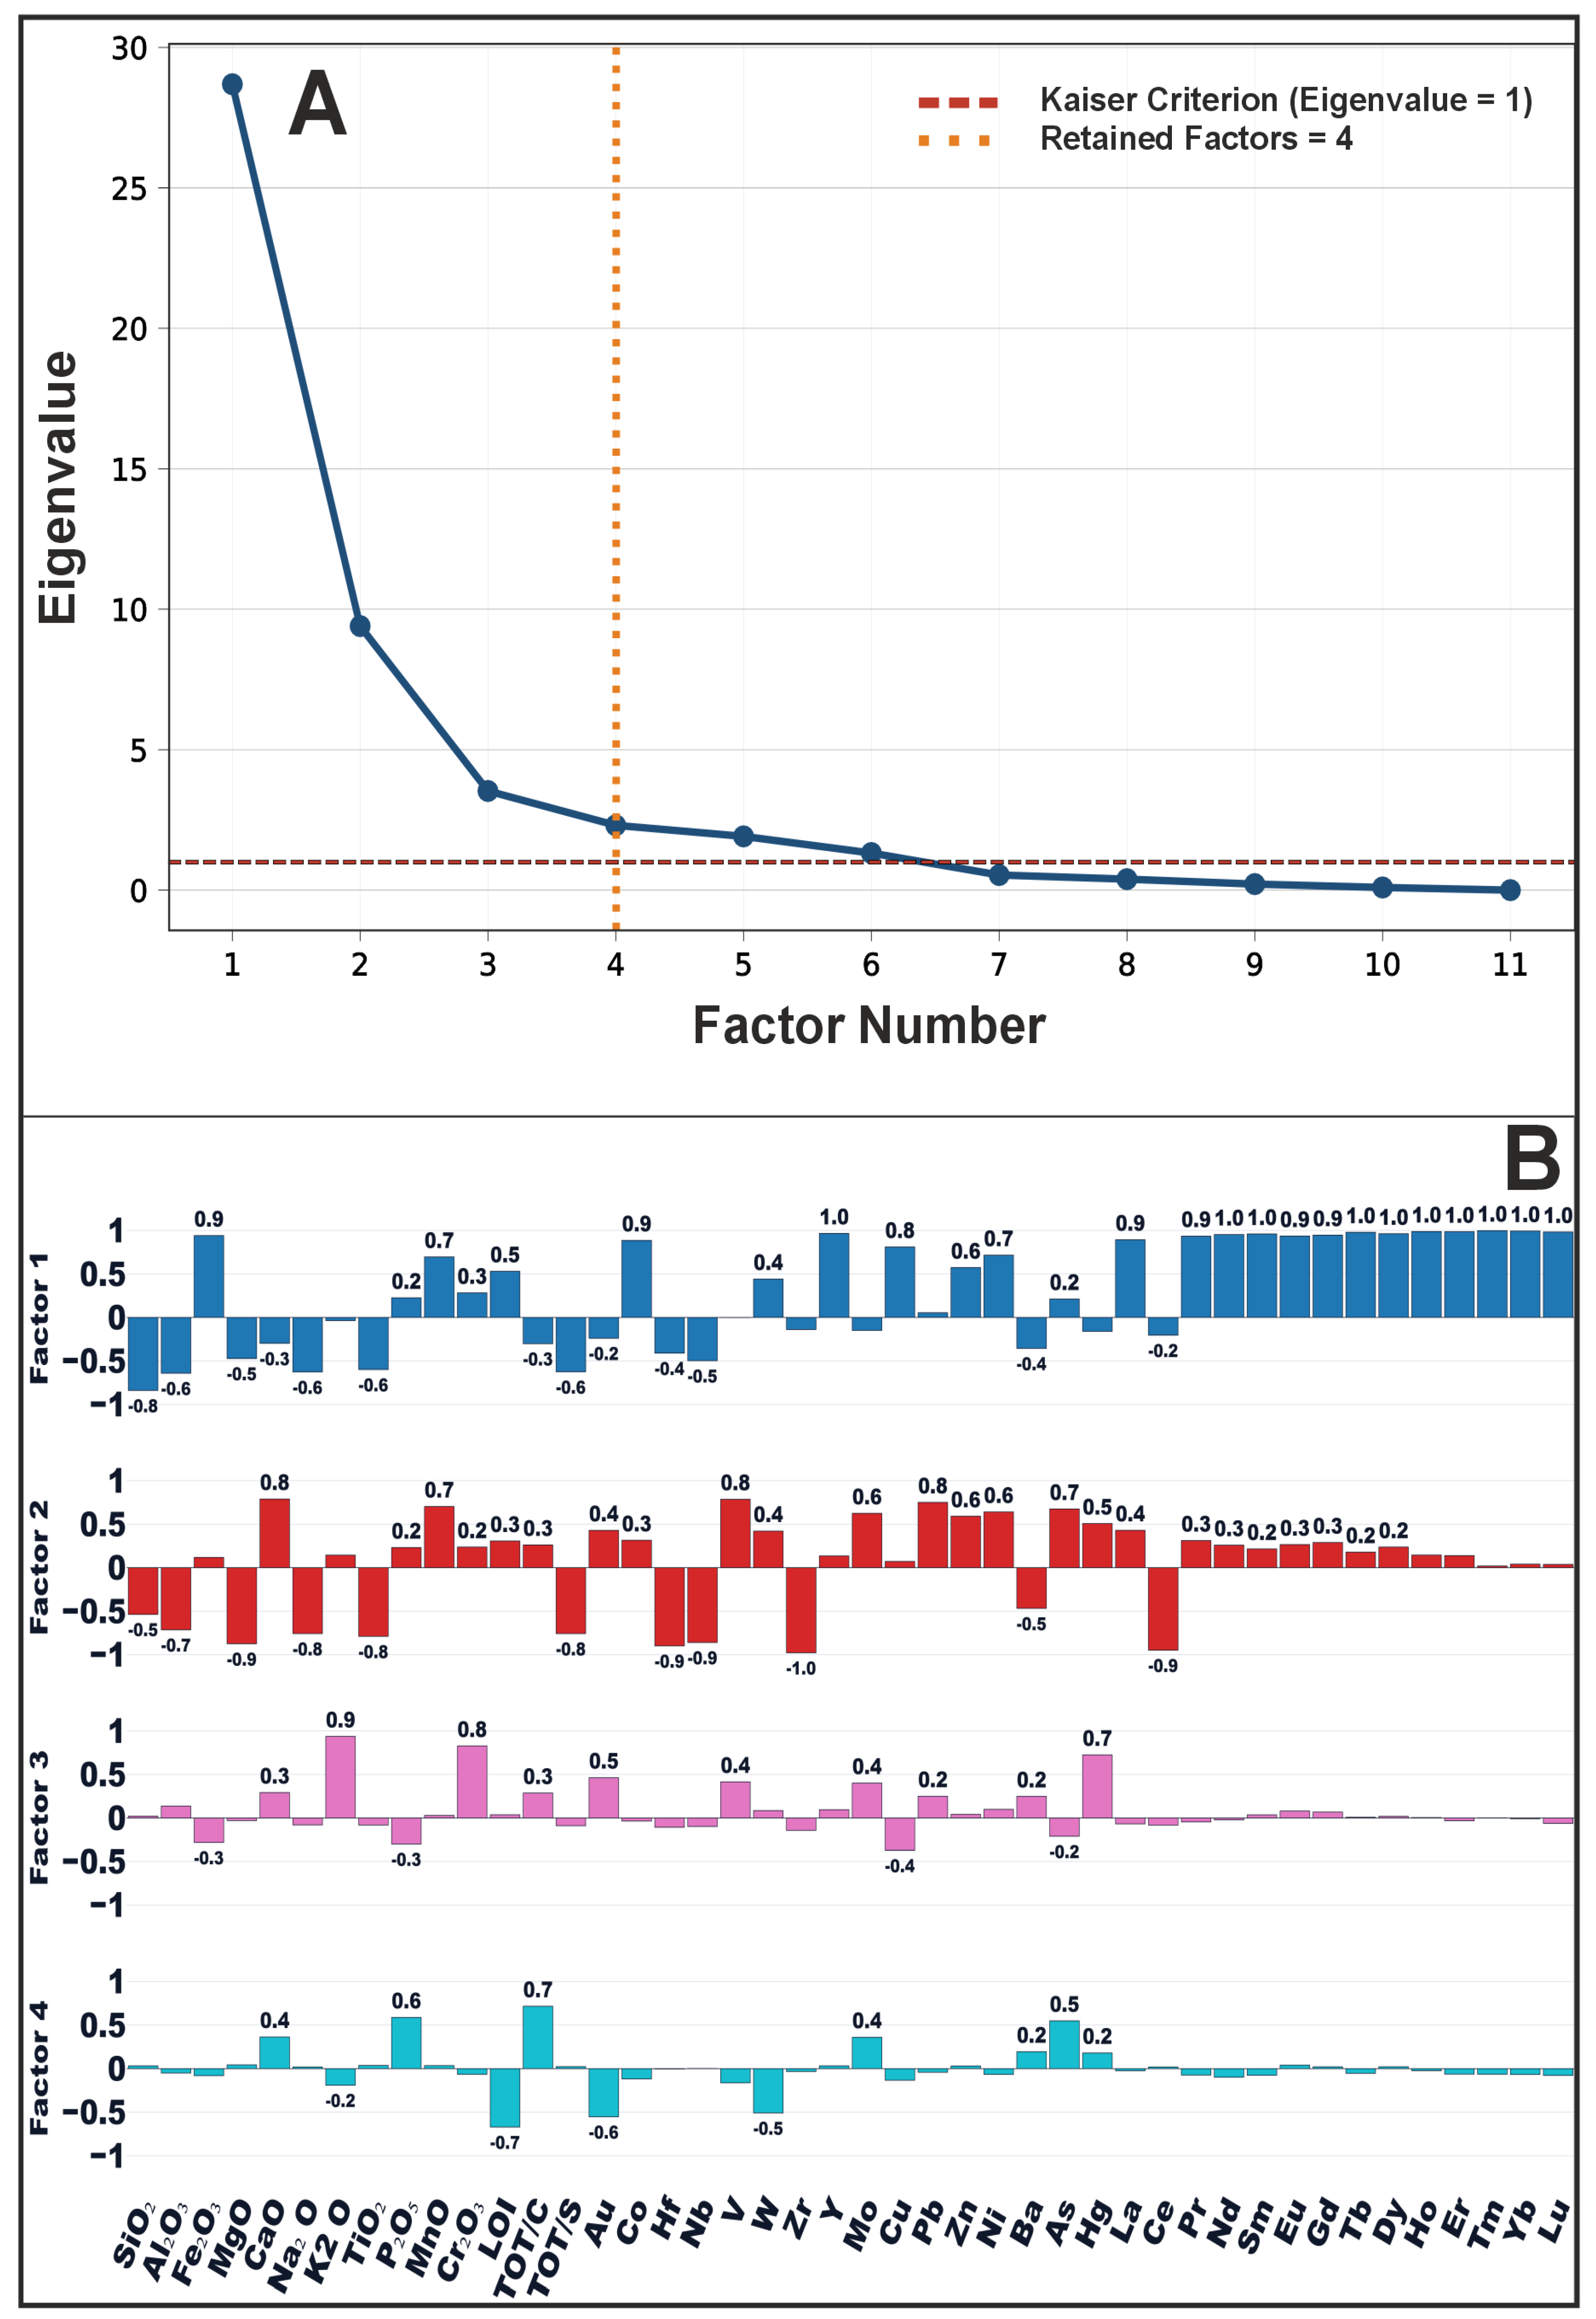
Factor analysis was applied as an exploratory tool to examine multivariate geochemical relationships among the ore samples (n = 11). Although the Kaiser criterion suggested six factors, scree-plot inspection and parsimony for the available sample size led to retention of four factors (Figure 10A,B; Table 5). The Varimax-rotated factor loadings and communalities are reported in Table 5.
Factor 1: Factor 1 is characterized by strong negative loadings of Fe2O3, MnO, Co, Cu and the REE suite (La–Lu, except Ce), opposed by positive loadings of SiO2, Al2O3, Na2O, TiO2, MgO and TOT/S. This may reflect the geochemical contrast between siliceous–detrital components and the Fe–Mn–REE ore signature during Fe–Mn oxy-hydroxide accumulation [100] rather than a unique genetic end-member.
Factor 2: Factor 2 shows positive loadings of CaO, MnO, V, Pb, Zn, Ni, Mo and As, and negative loadings of MgO, Na2O, TiO2, Zr, Hf, Nb and Ce. This association may reflect base-metal enrichment and its inverse relationship with immobile HFSE-bearing detrital phases, consistent with Ce fractionation under oxic seawater [101] in the ore subset.
Factor 3: Factor 3 is defined by positive loadings of TOT/C, P2O5 and As, with a negative LOI loading. This grouping may reflect carbon- and phosphorus-related geochemical variability among the ore samples.
Factor 4: Factor 4 is marked by positive loadings of K2O, Cr2O3 and Hg, with subordinate Au and V loadings. These loadings may reflect potassium–chromium–mercury associations; they are interpreted cautiously because of the small sample size; W retention in Fe–Mn oxy-hydroxides is documented for active hydrothermal systems [102].

4.5.4. Compositional Data Analysis (CoDA)

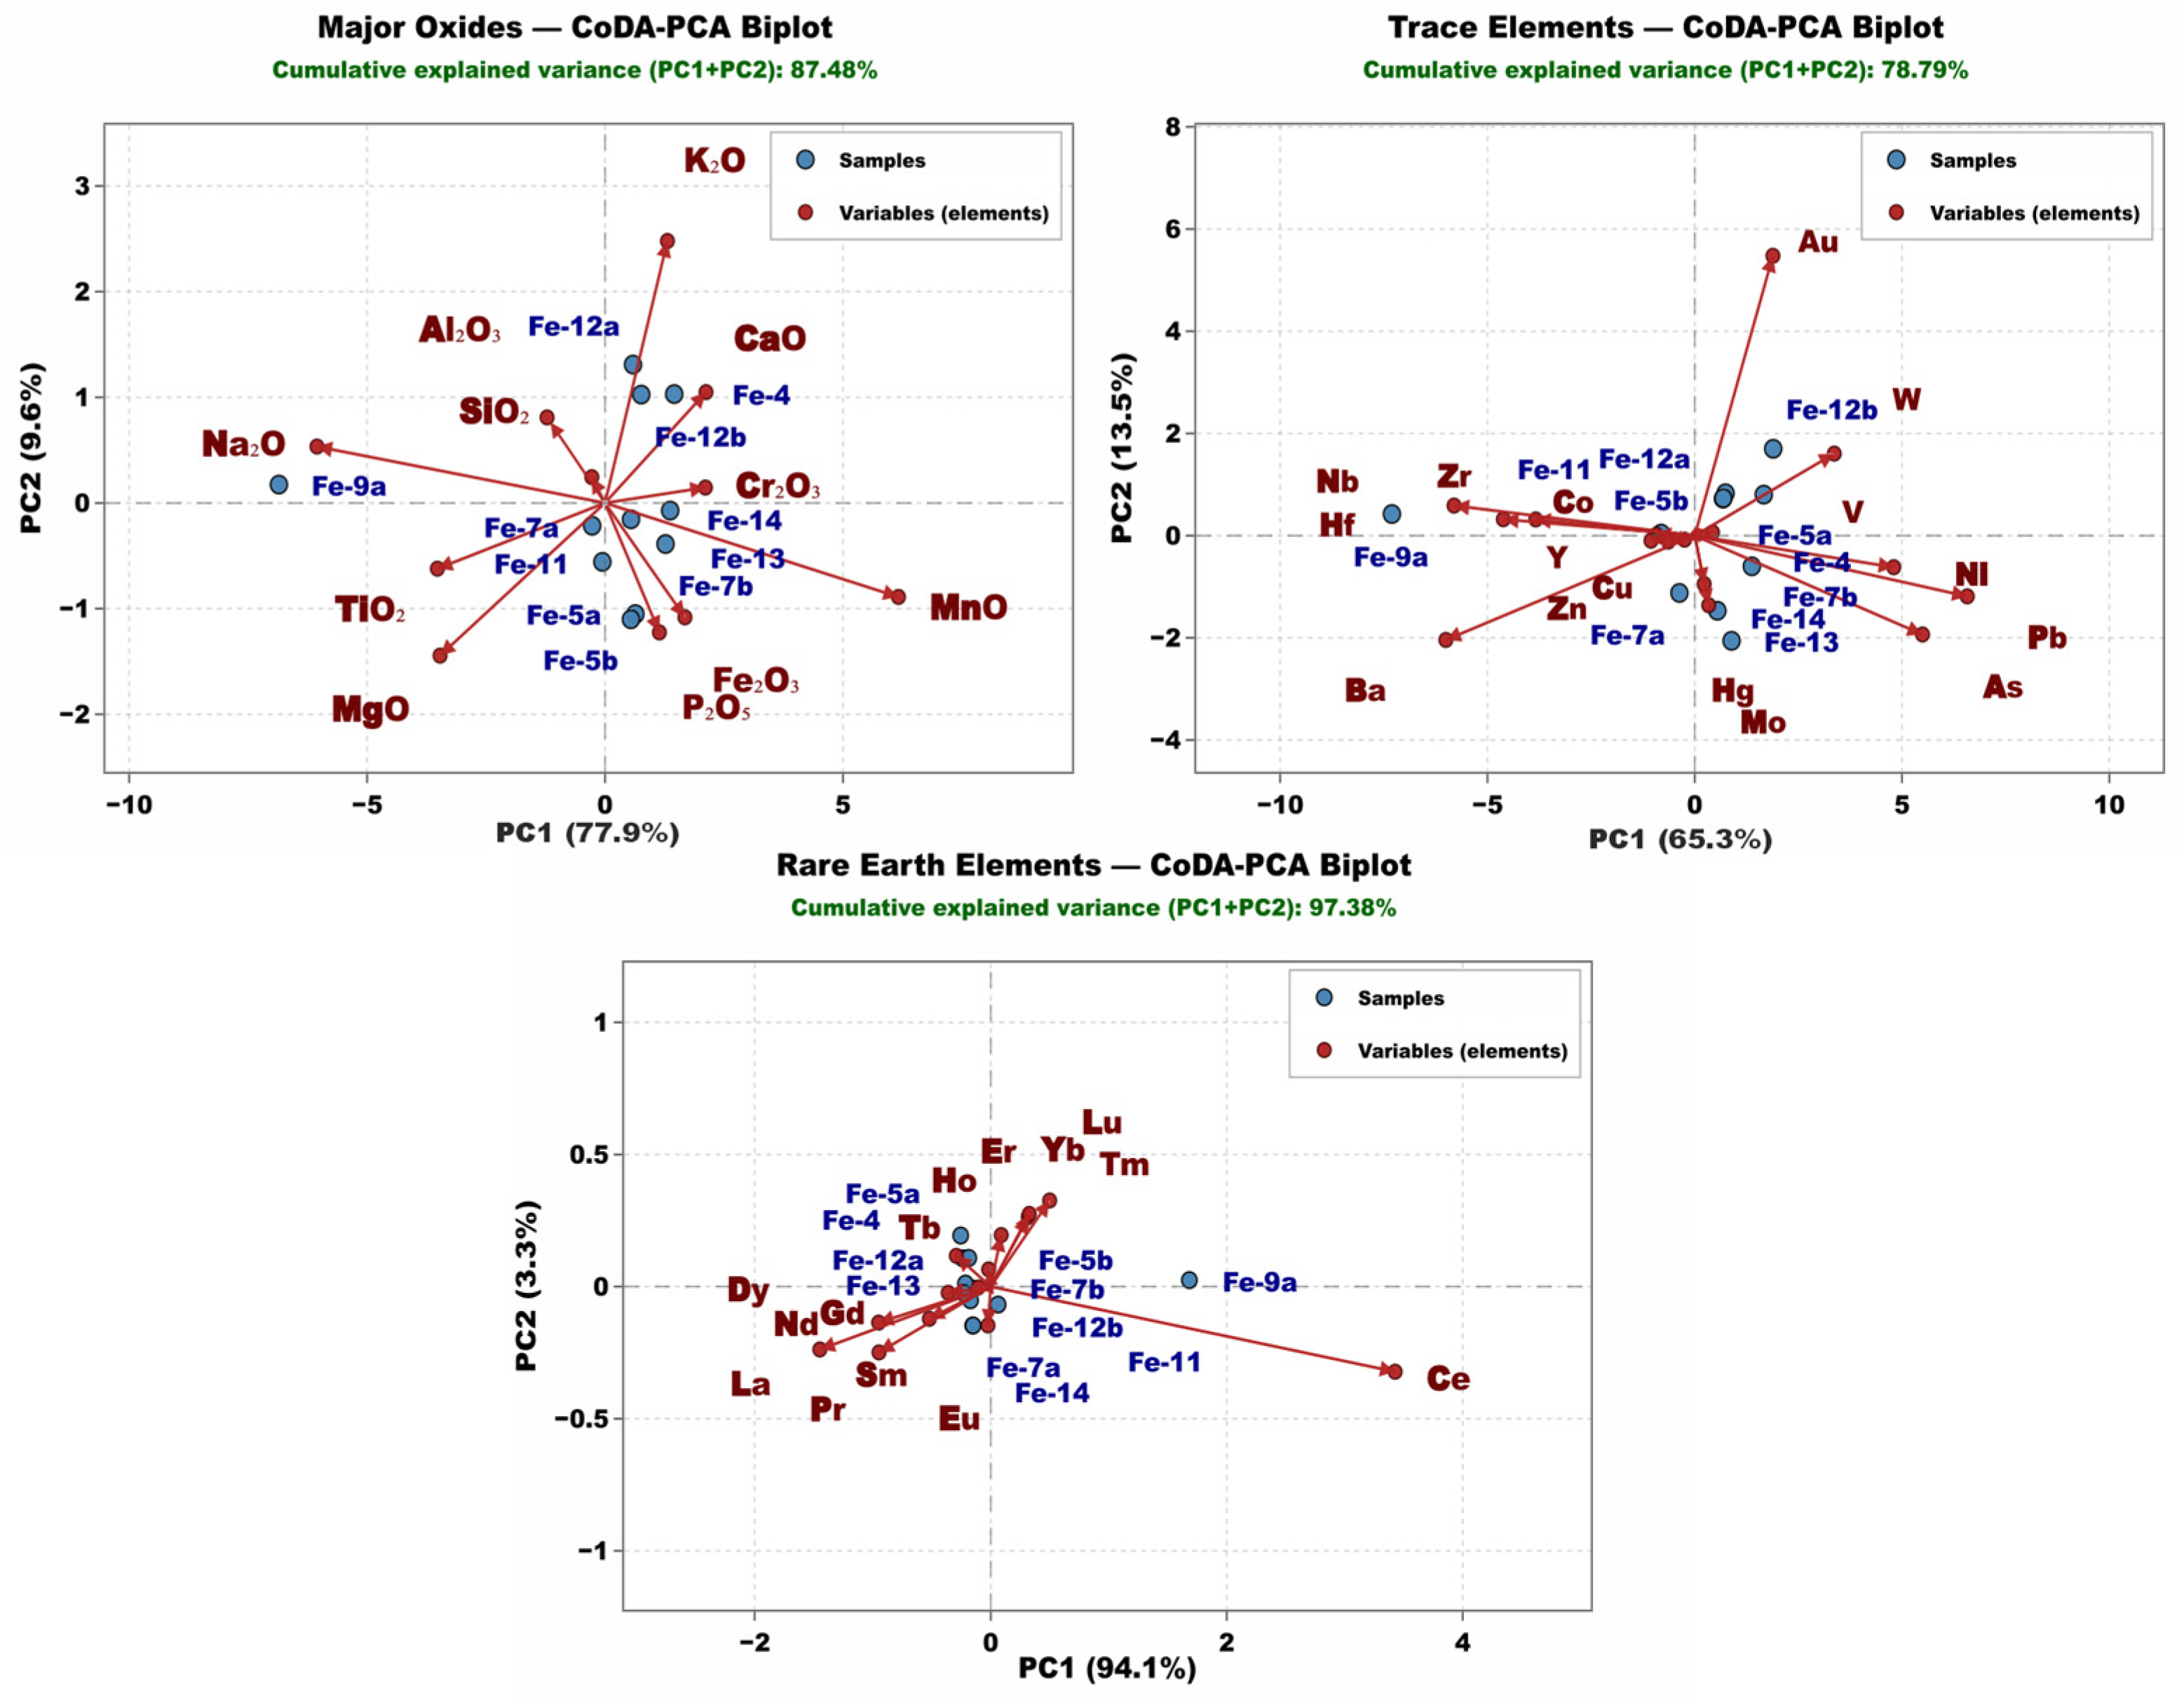
Because of the constant-sum constraint, the geochemical data were treated as compositional data [64]. The data were therefore subjected to a CLR transformation and CoDA-PCA was performed [65].
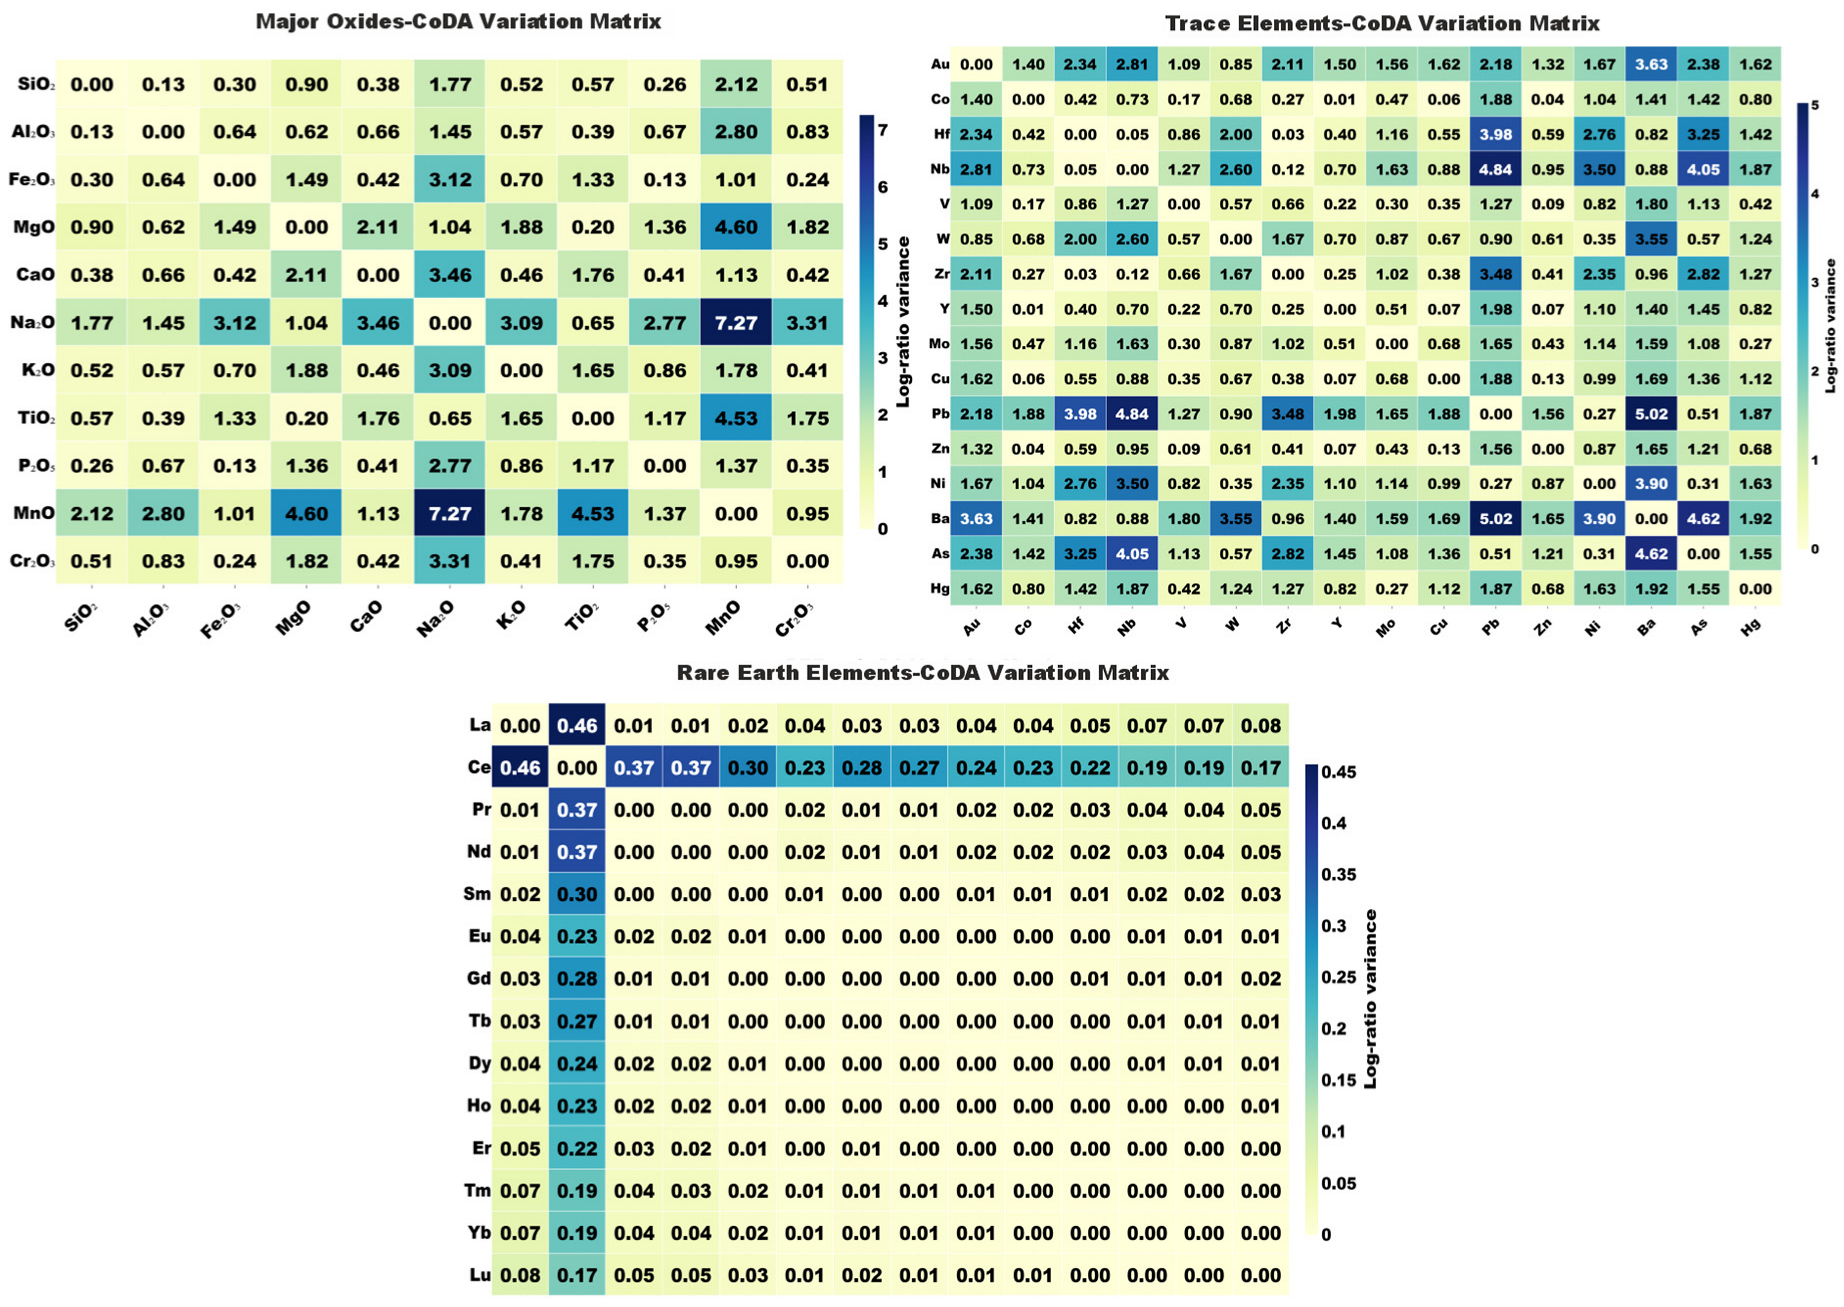
The element relationships were examined using the log-ratio variance matrix (Table 6; Figure 11). Low variance values suggest that the elements co-vary, whereas high values suggest the influence of different geochemical processes [64].
In the REE group, the highest log-ratio variances are between Ce and the other lanthanides (La-Ce: 0.457; Ce-Nd: 0.369). Ce varies independently relative to the other lanthanides [64].
The CoDA-PCA biplot and loading plots prepared with the CLR-transformed data (Figure 12 and Figure 13) display the geological processes independently of the closure effect [64,65].
The compositional data analysis (CoDA) results re-evaluated the element relationships in the Durmuştepe dataset while overcoming the closure effect, providing a more reliable interpretation of the geochemical processes. The implications of these results are discussed below in three distinct categories:
Major Oxides: In the log-ratio variance matrix (Table 6; Figure 11), the lowest variances among the major oxides are between SiO2 and Al2O3 (0.1271), Fe2O3 and P2O5 (0.1281), and MgO and TiO2 (0.1988). These low variances reflect strong coherence and a shared geological origin. SiO2, Al2O3, and TiO2 represent the detrital clay mineral input from the host-rock sequence, whereas the Fe2O3–P2O5 pair reflects the hydrothermal precipitation of iron oxides and their associated phosphate adsorption. Conversely, the highest variances are associated with MnO and Na2O (e.g., Na2O–MnO: 7.2660; MgO–MnO: 4.6008), demonstrating that manganese mineralization is geochemically decoupled from both the detrital clay input and primary basaltic/ophiolitic rock signatures. This decoupling is also clear in the CoDA-PCA biplot (Figure 12), where MnO projects in a direction nearly orthogonal to SiO2 and Al2O3, confirming that manganese deposition occurred as a distinct, independent hydrothermal-exhalative phase rather than a detrital constituent.
Trace Elements: For the trace elements, the lowest log-ratio variances are observed between Co and Y (0.0125), Hf and Zr (0.0308), and Co and Zn (0.0424). The close association of Hf–Zr is typical of zircon and stable detrital heavy minerals. The extremely low variance of Co with Y and Zn suggests that these metals co-varied during the primary accumulation of the iron-manganese oxides, where they were rapidly co-precipitated or scavenged from seawater. In contrast, the highest log-ratio variances occur between Pb and Ba (5.0223), Nb and Pb (4.8444), and Ba and As (4.6160). These high variances indicate different geochemical pathways. Lead (Pb) and barium (Ba) are highly mobile in hydrothermal fluids but tend to precipitate under different chemical barriers (such as sulfate vs. carbonate/oxide saturation), leading to local variations. The high variance of arsenic (As) relative to barium and niobium indicates that its enrichment was controlled by adsorption onto amorphous iron-manganese oxyhydroxides close to the hydrothermal vents, which is highly localized compared to the more regional dispersion of other trace elements.
Rare Earth Elements (REEs): In the REE subcomposition, the most significant geochemical finding is the high log-ratio variance between Ce and all other lanthanides (e.g., La–Ce: 0.4574; Ce–Nd: 0.3695; Ce–Pr: 0.3678), whereas the other REE pairs exhibit extremely low variances (e.g., Tm–Yb: 0.0004; Pr–Nd: 0.0006). This indicates that Ce behaves independently from the rest of the rare earth elements. While the trivalent REEs remained tightly coherent during transport and precipitation, Ce was subject to redox-controlled fractionation. In the CoDA-PCA biplot (Figure 12), the Ce loading projects in the opposite direction to the other REEs, mirroring the negative Ce anomaly observed in the PAAS-normalized patterns. This independent behavior of Ce is driven by the rapid oxidation of soluble Ce3+ to insoluble Ce4+ in well-oxygenated bottom waters and its selective adsorption onto manganese oxides, whereas the other REEs reflect the primary hydrothermal source and seawater mixing. Because these multivariate and compositional interpretations are based on a dataset of only 11 ore samples, they must be evaluated within the context of this sample size limitation. The number of geochemical variables exceeds the number of observations; consequently, the multivariate models are exploratory and may be over-parameterized. Genetic inferences in this study rely primarily on integrated field observations, ore mineralogy, trace-element and REE discrimination diagrams, and regional geological analogues; the statistical analyses provide complementary, qualitative support rather than independent confirmation.

5. Discussion

Numerous manganese deposits that developed in different geological settings occur throughout Türkiye. On the basis of their host-rock characteristics and stratigraphic ages, these deposits are classified into four main groups: those associated with radiolarian cherts, those related to black shale series, those developed in volcanic-arc settings, and those within Oligocene sedimentary units [103,104].
Based on field observations and mineralogical data, the Durmuştepe Fe–Mn mineralization falls within the group of manganese deposits that occur as lenses within radiolarian cherts. Similarly, the Vezirler oceanic Mn deposit in the Kula (Manisa) region [75], the Büyükmahal Mn occurrence in the Yozgat Artova ophiolitic complex [76] and the Kumluca Mn deposit within the Antalya Complex [77]—observed as interbeds with, or lenses within, radiolarian cherts in ophiolitic sequences and tectonic mélanges—are typical representatives of this group. These deposits are reported to have developed as a result of the mixing of hydrothermal fluids with seawater. By contrast, the Permian Zunyi [78] and Early Cambrian Maowanli [79] manganese carbonate (rhodochrosite, kutnahorite) deposits, located on the margin of the Yangtze Platform in southwestern China, can be cited as examples of deposits associated with black shale series. In contrast to the oxidizing conditions at Durmuştepe, these deposits are characterized by carbonate mineralogy that formed in anoxic–suboxic deep basins within organic-matter-rich black shales.
Compared with global deposits, the Durmuştepe Fe–Mn mineralization has a composition that is relatively poor in MnO but rich in Fe2O3. Whereas the Fe/Mn ratio is generally around 1 in hydrogenetic deposits that precipitate at rates of millimeters per million years in open-marine settings, this ratio can be below 0.1 or above 10 in seafloor hydrothermal systems [105,106].
The mean Fe/Mn ratio of the ore samples is 1.62 (Table 1); however, sample Fe-11 records a higher value (2.28), whereas the other ore samples for which Fe/Mn is reported range from 1.30 to 1.89 (median 1.50). We interpret the Fe-11 value as local variability within the mineralized horizon rather than as evidence of a separate genetic population. The Fe/Mn signature, together with plotting of the samples in the ‘Hydrothermal/Exhalative’ field on trace-element ternary diagrams (e.g., the Fe–Mn–(Ni + Co + Cu) × 10 diagram; Figure 3B), indicates formation near a proximal vent. Similar geochemical characteristics have been demonstrated in the Tokoro (Japan) hydrothermal Mn-oxide deposit [107], the Kasımağa (Kırıkkale) Mn-oxide deposits [108] and the Dongping sedimentary Mn deposit in the South China Block [80].
In the Kula–Vezirler radiolarite-related Mn deposit, on the other hand, the Mn/Fe ratio of higher than 5 (mean 95.26) may reflect a depositional environment distal from the feeder vent [75]. An average Fe/Mn ratio of 1.62 and co-precipitation of both metals indicate that metal-bearing fluids accumulated near the vents at the seafloor under abrupt physicochemical changes.
The petrographic examinations of the Durmuştepe Fe–Mn mineralization showed that the ore occurs within silicified mudstones and has a genetic relationship with the mafic volcanic units of the Maden Complex. The high SiO2 contents of the samples are a result of the intense silicification processes marked by secondary quartz and chalcedony veinlets [109]. The high Al2O3 values in the analyses, on the other hand, are directly related to the terrestrial detrital components derived from the mudstones that constitute the host rock. This is consistent with the wide distribution limits in the box plots and shows that detrital-material input also reached the basin contemporaneously with the hydrothermal processes.
Whereas in typical sedimentary deposits the average Al value is 8.82% and Ti is 0.91%, in the Durmuştepe ores Al2O3 was measured as 4.22% and TiO2 as 0.14%. While the immobile behavior of Ti within hydrothermal solutions indicates terrestrial detrital input [110], Al points to the presence of clay minerals. In Factor 1, Ti, Al and K load negatively, consistent with physical dilution of the primary ore by detrital material transported into the basin together with hydrothermal exhalations (dilution effect) [88].
Fe and Mn co-vary in the Kendall rank correlation matrix and cluster together in CoDA-PCA (PC1) and Factor 1, supporting their linked behavior in the ore-forming system [26,111,112].
The absence of a distinct positive Eu anomaly in the samples (Eu/Eu* ≈ 1.06–1.18; Figure 4) indicates that the temperature of the fluid reaching the seafloor remained below 250–300 °C. This pattern is consistent with hydrothermal fluids leaving feeder fractures and undergoing rapid, high-volume mixing with cold, oxic seawater at the seafloor [86,87,88]. Abrupt seawater contact likely drove co-precipitation of Fe and Mn. The presence of pentlandite [(Ni,Fe)9S8] detected in the gabbro samples can also be interpreted as one of the mineralogical indicators of the ophiolitic rock–fluid interaction that took place at the feeder base of the hydrothermal system.
In the literature, sedimentary formations with a Ce anomaly coefficient ranging between 0.2 and 0.5 are classified as deep-sea cherts [113,114]. The Ce/Ce* values of the Durmuştepe ore samples (0.10–0.15; mean 0.11) fall below this range. We interpret the unusually low Ce/Ce* chiefly as evidence of intense oxic seawater interaction and hydrothermal overprint during Fe–Mn oxide precipitation at a proximal seafloor exhalative setting within the Maden marginal basin [1,74,75,115], rather than as a direct palaeobathymetric depth estimate. The negative Ce anomaly is consistent with the decoupling of Ce from the other lanthanides in the CoDA results (La-Ce log-ratio variance: 0.457) and with oxic-seawater influence on Ce behavior [74,101,115] (Figure 4; see also the Figure 3D discussion in Section 4.3). The integrated field, mineralogical and multi-diagram evidence supports a volcano-sedimentary hydrothermal-exhalative model (Section 5) rather than a deep-basin hydrogenetic or anoxic carbonate setting [78,79]. Palaeobathymetric reconstruction from Ce/Ce* alone is not attempted here.
Compared with reference formations worldwide and in Türkiye, the Durmuştepe Fe–Mn mineralization occupies a distinct geochemical position. Durmuştepe contains much higher silica (SiO2 = 38.24%) and aluminum (Al2O3 = 8.58%) than Indian Ocean and Southwest Pacific hydrogenetic Fe–Mn crusts [82,115]. Its strong negative cerium anomaly (Ce/Ce* = 0.11) contrasts with these crusts (total REEs = 2000–3800 ppm; Ce/Ce* = 1.30–2.50) and excludes a slowly precipitating hydrogenetic origin [115]. Unlike the Zunyi [78] and Maowanli [79] manganese carbonate deposits formed in anoxic–suboxic basins, Durmuştepe records a deep negative Ce anomaly (0.11), indicating a strong oxic seawater influence in the depositional environment. The ophiolitic-chert-related Kula Vezirler [75], Aşağı Eğerci [85] and Büyükmahal [76] deposits in Türkiye (with Ce anomalies of 0.58, 0.58 and 0.50, respectively), as well as the high-silica Kumluca [77] deposit with its strong positive Ce anomaly (2.34), also differ from Durmuştepe. The distinctive position of Durmuştepe among these deposits (Fe/Mn = 1.62; Ce/Ce* = 0.11; Eu/Eu* = 1.13) supports the proximal volcano-sedimentary hydrothermal-exhalative genetic model.
Figure 14 integrates the geological, mineralogical and multivariate geochemical evidence into a proximal volcano-sedimentary hydrothermal-exhalative model for the geodynamic development and formation of the Durmuştepe Fe–Mn mineralization. These hydrothermal processes can be related to geothermal circulation triggered by magmatism during the evolution of the Middle Eocene Maden marginal basin and to the leaching of the underlying spilitic basalts/diabases [39].

6. Conclusions

Based on field, petrographic, geochemical and multivariate statistical (CoDA, PCA, factor analysis) work on the Durmuştepe Fe–Mn mineralization within the siliceous mudstones of the Middle Eocene Maden Complex, the genetic model is outlined below along three main lines of evidence:
The average Fe/Mn ratio of 1.62 in the Durmuştepe Fe–Mn mineralization and the concentration of high iron contents around the vents at the gabbro–diabase contacts indicate that the metal-bearing solutions precipitated rapidly upon reaching the seafloor. The clustering of Fe and Mn in the same group in the PCA and HCA models suggests that the fluids co-varied near the feeder vents without undergoing geochemical fractionation. On the other hand, the high Ni contents, the very low Co/Ni ratios (0.03–0.04) and the hydrothermal clustering on the trace-element discrimination diagrams (Figure 3A–C) support the exhalative origin of the mineralization. The negative Ce anomaly in the PAAS-normalized patterns and the absence of a distinct positive Eu anomaly (Figure 4) indicate that vent fluids did not exceed ~250–300 °C and underwent rapid mixing with cold, oxic seawater at the seafloor (Figure 4; see also the redox diagram discussion in Section 4.3). Finally, the occurrence of the mineralization as lenses within siliceous mudstones and the grouping of the detrital lithogenic elements (Ti, Al, K) under negative loadings in the factor analysis models reflect that the continuous terrestrial detrital input into the basin physically reduced the primary ore accumulation (dilution effect). The hydrothermal circulation is thought to have been triggered by magmatism during the evolution of the Maden marginal basin [39].
Taken together, the geochemical data and multivariate models (CoDA, PCA, factor analysis) indicate that the Durmuştepe deposit formed as a proximal volcano-sedimentary hydrothermal-exhalative system, shaped by rapid mixing of low- to medium-temperature hydrothermal fluids from the ophiolitic basement of the Maden Complex with oxic seawater and by contemporaneous sedimentation [1,39]. In addition to drilling-based exploration to be carried out in the field, the joint evaluation of multi-source geological data and machine-learning-based methods may be useful for determining the mineralization potential [116].

Author Contributions

Conceptualization, A.Ö. and O.A.; methodology, A.Ö. and O.A.; investigation, O.A.; writing—original draft, O.A.; writing—review and editing, A.Ö. and O.A.; conceptual model figure, A.Ö. and O.A. All authors have read and agreed to the published version of the manuscript.

Funding

This research was supported by the Coordination Office of Scientific Research Projects (BAP) of Selçuk University (Project No: 13201007). The project was initiated when the Department of Geological Engineering belonged to Selçuk University; since 2018 this department has been part of Konya Technical University.

Data Availability Statement

The analytical data supporting this study are presented in Table 1, Table 2, Table 3, Table 4, Table 5 and Table 6. Raw data are available from the corresponding author upon reasonable request.

Acknowledgments

This study is based on the master’s thesis entitled “Geological Investigation of Iron and Manganese Mineralization from Durmuştepe–Hatunköy (Maden–Elazığ)” in the Department of Geological Engineering, Institute of Science, Selçuk University. We thank the Coordination Office of Scientific Research Projects (BAP) of Selçuk University (Project No: 13201007). We also thank Bilgehan Yabgu HORASAN and Evren SOLGUN for their contributions during the study. During the preparation of this manuscript, the author(s) used Google NotebookLM for the purposes of assisting with the initial graphical layout and schematic visualization of the conceptual genetic model. Generative artificial intelligence tools were also used to assist with English-language editing and reference formatting. The authors have reviewed and edited all AI-assisted outputs and take full responsibility for the content of this publication.

Conflicts of Interest

The authors declare that they have no conflicts of interest to report.

References

  1. Hein, J.R.; Koschinsky, A.; Halbach, P.; Manheim, F.T.; Bau, M.; Kang, J.K.; Lubick, N. Iron and manganese oxide mineralization in the Pacific. Geol. Soc. Lond. Spec. Publ. 1997, 119, 123–138. [Google Scholar] [CrossRef]
  2. Fitzgerald, C.E.; Gillis, K.M. Hydrothermal manganese oxide deposits from Baby Bare seamount in the Northeast Pacific Ocean. Mar. Geol. 2006, 225, 145–156. [Google Scholar] [CrossRef]
  3. Öztürk, N. Investigation of Geological, Mineralogical and Geochemical Properties of Manganese Mineralizations in East of Hazar Lake (Sivrice-Elazığ). Master’s Thesis, Fırat University, Institute of Science, Elazığ, Turkey, 2008; 66p. [Google Scholar]
  4. Boström, K. Submarine volcanism as a source for iron. Earth Planet. Sci. Lett. 1970, 9, 348–354. [Google Scholar] [CrossRef]
  5. Boström, K. The origin and fate of ferromanganese active ridge sediments. In Pelagic Sediments: On Land and Under the Sea; Hsü, K.J., Jenkyns, H.C., Eds.; Blackwell: Oxford, UK, 1975; pp. 149–205. [Google Scholar] [CrossRef]
  6. Gedikoğlu, A.; Van, A.; Eyüboğlu, I.; Yalçınalp, B. An example of Eastern Black Sea region mineralizations: Ocaklı (Maçka-Trabzon) manganese occurrence. Geol. Eng. 1985, 25, 23–37. [Google Scholar]
  7. Öztunalı, Ö. Formation and Evaluation of Mineral Deposits; Latin Printing: Istanbul, Turkey, 1973; 309p. [Google Scholar]
  8. Altunbey, M.; Sağıroğlu, A. Characteristics and origin of manganese mineralizations in Koçkale-Elazığ. Bull. Miner. Res. Explor. 1995, 117, 139–148. [Google Scholar]
  9. Maynard, J. Geochemistry of Sedimentary Ore Deposits; Springer: New York, NY, USA, 1983. [Google Scholar]
  10. Özkoçak, O. Properties and Formation Conditions of Sedimentary Iron, Manganese and Aluminum Deposits; MTA Training Series No. 22; General Directorate of Mineral Research and Exploration: Ankara, Turkey, 1980; 95p.
  11. Roy, S. Manganese Deposits; Academic Press: London, UK, 1981; 458p. [Google Scholar]
  12. Stanton, R.L. A preliminary account of chemical relationships between sulfide lode and “banded iron-formation” at Broken Hill, New South Wales. Econ. Geol. 1972, 67, 1128–1145. [Google Scholar] [CrossRef]
  13. El-Hasan, T.; Al-Malabeh, A.; Komuro, K. Rare earth elements geochemistry of the Cambrian shallow marine manganese deposits at Wadi Dana, South Jordan. Jordan J. Earth Environ. Sci. 2008, 1, 45–52. [Google Scholar]
  14. Heshmatbehzadi, K.; Shahabpour, J. Metallogeny of manganese and ferromanganese ores in Baft Ophiolitic Mélange, Kerman, Iran. Aust. J. Basic Appl. Sci. 2010, 4, 302–313. [Google Scholar]
  15. Peng, E.; Yang, J.; Wang, Z.; Li, D.; Gao, Y.; Yan, D.; Chen, Y.; Guo, X. Manganese Resources in China: An Overview of Resource Status and Recent Advances in Metallogenic Models and Exploration. Minerals 2025, 15, 859. [Google Scholar] [CrossRef]
  16. Varentsov, I.M. Manganese ore giants of the Eastern Paratethys: Geological characterization, genesis. In Geology and Geochemistry of Manganese; Varentsov, I.M., Grasselly, G., Eds.; Akadémiai Kiadó: Budapest, Hungary, 1980; Volume 2, pp. 259–281. [Google Scholar]
  17. Frakes, L.A.; Bolton, B.R. Effects of ocean chemistry, sea level, and climate on the formation of primary sedimentary manganese ore deposits. Econ. Geol. 1992, 87, 1207–1217. [Google Scholar] [CrossRef]
  18. Miura, H.; Hariya, Y. Recent manganese oxide deposits in Hokkaido, Japan. In Manganese Mineralization: Geochemistry and Mineralogy of Terrestrial and Marine Deposits; Nicholson, K., Hein, J.R., Bühn, B., Dasgupta, S., Eds.; Geological Society of London: London, UK, 1997; Volume 119, pp. 281–299. [Google Scholar] [CrossRef]
  19. Öztürk, H.; Frakes, L. Sedimentation and diagenesis of an Oligocene manganese deposit in a shallow subbasin of the Paratethys: Thrace Basin, Turkey. Ore Geol. Rev. 1995, 10, 117–132. [Google Scholar] [CrossRef]
  20. Vural, A.; Erşen, F. Geology, mineralogy and geochemistry of manganese mineralization in Gumushane, Turkey. J. Eng. Res. Appl. Sci. 2019, 8, 1051–1059. [Google Scholar]
  21. Nicholson, K.; Hein, J.R.; Bühn, B.; Dasgupta, S. (Eds.) Manganese Mineralization: Geochemistry and Mineralogy of Terrestrial and Marine Deposits; Geological Society of London: London, UK, 1997; Volume 119, 370p. [Google Scholar]
  22. Öksüz, N. Geochemistry and origin of manganese mineralizations in Derbent (Yozgat) region. Yerbilimleri 2011, 32, 213–234. [Google Scholar]
  23. Narejo, A.A.; Shar, A.M.; Fatima, N.; Sohail, K. Geochemistry and origin of Mn deposits in the Bela ophiolite complex, Balochistan, Pakistan. J. Pet. Explor. Prod. Technol. 2019, 9, 2543–2554. [Google Scholar] [CrossRef]
  24. Yılmaz, M. Direct Leaching of Denizli-Tavas Manganese Ore with Sulphuric Acid. Master’s Thesis, Middle East Technical University, Ankara, Turkey, 1998; 57p. [Google Scholar]
  25. Teker, Y. Investigation of Ore Geology and the Origin of the Manganese Occurrences Between Çamoluk (Burdur) and Yazıpınar (Bucak). Master’s Thesis, Süleyman Demirel University, Institute of Science and Technology, Isparta, Turkey, 2004; 84p. [Google Scholar]
  26. Josso, P.; Pelleter, E.; Pourret, O.; Fouquet, Y.; Etoubleau, J.; Cheron, S.; Bollinger, C. A new discrimination scheme for oceanic ferromanganese deposits using high field strength and rare earth elements. Ore Geol. Rev. 2017, 87, 3–15. [Google Scholar] [CrossRef]
  27. Li, C.; Song, W.; Sun, Z.; Hu, G.; Yuan, X.; Kao, S.-J. Controls on Critical Metal Enrichments in Ferromanganese Nodules from the Philippine Sea, at Water Depths of 4400–6000 m. Minerals 2023, 13, 522. [Google Scholar] [CrossRef]
  28. Hassan, M.B.; Koschinsky, A.; da Silva, G.L.X.; Dantas, R.C.; Kuhn, T.; Millo, C.; Kletetschka, G.; Jovane, L. Magnetization of ferromanganese crusts: Geochemical and magnetic insights from Rio Grande Rise and Tropic Seamount. Geochem. Geophys. Geosyst. 2024, 25, e2023GC011210. [Google Scholar] [CrossRef]
  29. Berdnikov, N.; Kepezhinskas, P.; Nevstruev, V.; Krutikova, V.; Konovalova, N.; Savatenkov, V. Magmatic–Hydrothermal Origin of Fe-Mn Deposits in the Lesser Khingan Range (Russian Far East): Petrographic, Mineralogical and Geochemical Evidence. Minerals 2023, 13, 1366. [Google Scholar] [CrossRef]
  30. Sergienko, E.; Tarakhovskaya, E.; Rodinkov, O.; Yanson, S.; Pankin, D.; Kozlov, V.; Gareev, K.; Bugrov, A.; Kharitonskii, P. Biogenic Origin of Fe-Mn Crusts from Hydrothermal Fields of the Mid-Atlantic Ridge, Puy de Folles Volcano Region. Geosciences 2024, 14, 240. [Google Scholar] [CrossRef]
  31. Uner, T. Mixed Hydrogenetic–Hydrothermal Genesis of Quaternary Ferromanganese Nodules in a Tectonically Active Lacustrine Basin, Eastern Türkiye. J. Afr. Earth Sci. 2025, 232, 105823. [Google Scholar] [CrossRef]
  32. Koprubasi, N.; Aydin, B.; Ustundas, N.; Koprubasi, S.; Kuscu, M. Mineralogical and geochemical properties of mudstones in the Maden Complex around Elazig and Bingöl (Turkey). Sci. Rep. 2026, 16, 5388. [Google Scholar] [CrossRef] [PubMed]
  33. Zhou, J.; Zhang, H.; Dong, Y.; Fan, W.; Ren, J.; Yang, S. Mineral formation and element migration in fractures and pores of hydrogenetic ferromanganese nodules. Chem. Geol. 2024, 670, 122459. [Google Scholar] [CrossRef]
  34. Çilingir, Y. Metalik Cevherler ve Zenginleştirme Yöntemleri (Cilt 1); Dokuz Eylül Üniversitesi Mühendislik Fakültesi Baskı Ünitesi: İzmir, Turkey, 1996; 198p. [Google Scholar]
  35. Indian Bureau of Mines. Indian Minerals Yearbook 2013: Manganese Ore, 52nd ed.; Indian Bureau of Mines: Nagpur, India, 2014.
  36. Şimşek, S. Investigation of Low Grade Manganese Ores Enrichment/Düşük Tenörlü Mangan Cevherlerinin Zenginleştirilmesinin Araştırılması. Master’s Thesis, Çukurova University, Institute of Natural and Applied Sciences, Adana, Turkey, 2011; 118p. [Google Scholar]
  37. Nayl, A.A.; Ismail, I.M.; Aly, H.F. Recovery of pure MnSO4·H2O by reductive leaching of manganese from pyrolusite ore by sulfuric acid and hydrogen peroxide as reductant. Int. J. Miner. Process. 2011, 100, 116–123. [Google Scholar] [CrossRef]
  38. Dabbag, E. Leaching of Çorum Osmancık Manganese Ore Using Some Reductants in Sulphuric Acid Solution. Master’s Thesis, Hacettepe University, Graduate School of Natural and Applied Sciences, Ankara, Turkey, 2014; 138p. [Google Scholar]
  39. Şaşmaz, A.; Türkyılmaz, B.; Öztürk, N.; Yavuz, C.; Kumral, M. Geology and geochemistry of Middle Eocene Maden Complex ferromanganese deposits from the Elazığ-Malatya region, eastern Turkey. Ore Geol. Rev. 2014, 56, 352–372. [Google Scholar] [CrossRef]
  40. Önal, A. Geochemistry of Alihan-Pütürge (Malatya) Ferriferous-Manganese Mineralization. Master’s Thesis, Fırat University, Institute of Science, Elazığ, Turkey, 2000; 56p. [Google Scholar]
  41. Li, S.; Liu, C.; Chen, J. Mineral Prospecting Prediction via Transfer Learning Based on Geological Big Data: A Case Study of Huayuan, Hunan, China. Minerals 2023, 13, 504. [Google Scholar] [CrossRef]
  42. Robertson, A.H.F.; Parlak, O.; Ustaömer, T. Overview of the Palaeozoic-Neogene evolution of Neotethys in the Eastern Mediterranean region (southern Turkey, Cyprus, Syria). Pet. Geosci. 2012, 18, 381–404. [Google Scholar] [CrossRef]
  43. Parlak, O.; Karaoğlan, F.; Rızaoğlu, T.; Nurlu, N.; Bağcı, U.; Höck, V.; Öztüfekçi Önal, A.; Kürüm, S.; Topak, Y. Petrology of the İspendere (Malatya) ophiolite from the Southeast Anatolia: Implications for the Late Mesozoic evolution of the southern Neotethyan Ocean. In Geological Development of Anatolia and the Easternmost Mediterranean Region; Robertson, A.H.F., Parlak, O., Ünlügenç, U.C., Eds.; Geological Society of London: London, UK, 2013; Volume 372, pp. 219–247. [Google Scholar] [CrossRef]
  44. Nurlu, N.; Parlak, O.; Robertson, A.H.F.; von Quadt, A. Implications of Late Cretaceous U-Pb zircon ages of granitic intrusions cutting ophiolitic and volcanogenic rocks for the assembly of the Tauride allochthon in SE Anatolia (Adıyaman region, Turkey). Int. J. Earth Sci. 2016, 105, 283–314. [Google Scholar] [CrossRef]
  45. Parlak, O.; Rızaoğlu, T.; Bağcı, U.; Karaoğlan, F.; Höck, V. Tectonic significance of the geochemistry and petrology of ophiolites in southeast Anatolia, Turkey. Tectonophysics 2009, 473, 173–187. [Google Scholar] [CrossRef]
  46. Usta, D.; Ateş, Ş.; Çoban, M.; Deveci, Ö.; Ekmekyapar, A.; Sağlam, F.M.; Vural, A.; Dinç, S. 1:100.000 Ölçekli Türkiye Jeoloji Haritaları Serisi, Şanlıurfa-M 40 Paftası; MTA: Ankara, Turkey, 2018. [Google Scholar]
  47. Sarıfakıoğlu, E.; Sevin, M.; Dilek, Y. Turkey Ophiolites; MTA Special Publication Series No. 35; General Directorate of Mineral Research and Exploration: Ankara, Turkey, 2017; 100p.
  48. Görür, N.; Tüysüz, O.; Şengör, A.M.C. Tectonic evolution of the Central Anatolian basins. Int. Geol. Rev. 1998, 40, 831–850. [Google Scholar] [CrossRef]
  49. Yazgan, E.; Asutay, J.; Gültekin, M.C.; Poyraz, N.; Sirel, E.; Yıldırım, H. Geology of Southeast of Malatya and Geodynamic Evolution of Eastern Taurus; MTA Report No. 8272; General Directorate of Mineral Research and Exploration: Ankara, Turkey, 1987; 178p.
  50. Pearce, J.A.; Cann, J.R. Tectonic setting of basic volcanic rocks determined using trace element analyses. Earth Planet. Sci. Lett. 1973, 19, 290–300. [Google Scholar] [CrossRef]
  51. Özkan, Y.Z. Guleman (Elazığ) ofiyolitinin jeolojisi ve petrolojisi. İstanbul Yerbilim. Derg. 1982, 3, 295–312. [Google Scholar]
  52. Robertson, A.H.F. Overview of the genesis and emplacement of Mesozoic ophiolites in the Eastern Mediterranean Tethyan region. Lithos 2002, 65, 1–67. [Google Scholar] [CrossRef]
  53. Erdoğan, B. Geology and volcanic rocks of Southeastern Anatolia Ophiolite Belt in Ergani-Maden region. Bull. Geol. Soc. Turk. 1982, 25, 49–59. [Google Scholar]
  54. Aktaş, G.; Robertson, A.H.F. The Maden Complex, SE Turkey: Evolution of a Neotethyan active margin. In The Geological Evolution of the Eastern Mediterranean; Dixon, J.E., Robertson, A.H.F., Eds.; Geological Society of London: London, UK, 1984; Volume 17, pp. 375–402. [Google Scholar] [CrossRef]
  55. Aktaş, G.; Robertson, A.H.F. Tectonic evolution of the Tethys suture zone in S.E. Turkey: Evidence from the petrology and geochemistry of Late Cretaceous and Middle Eocene extrusives. In Ophiolites—Oceanic Crustal Analogues, Proceedings of the International Symposium “Troodos 1987”; Moores, E.M., Panayiotou, A., Xenophontos, C., Eds.; Geological Survey Department: Nicosia, Cyprus, 1990; pp. 311–329. [Google Scholar]
  56. Michard, A.; Whitechurch, H.; Ricou, L.E.; Montigny, R.; Yazgan, E. Tauric subduction (Malatya-Elazığ provinces) and Its bearing on tectonics of the Tethyan realm in Turkey. In The Geological Evolution of the Eastern Mediterranean Region; Dixon, J.E., Robertson, A.H.F., Eds.; Geological Society of London: London, UK, 1984; Volume 17, pp. 361–373. [Google Scholar] [CrossRef]
  57. Yazgan, E.; Chessex, R. Geology and tectonic evolution of the southeastern Taurides in the region of Malatya. Bull. Turk. Assoc. Pet. Geol. 1991, 3, 1–42. [Google Scholar]
  58. Dilek, Y.; Sandvol, E. Seismic structure, crustal architecture and tectonic evolution of the Anatolian-African Plate Boundary and the Cenozoic Orogenic Belts in the Eastern Mediterranean Region. In Ancient Orogens and Modern Analogues; Murphy, J.B., Keppie, J.D., Hynes, A.J., Eds.; Geological Society of London: London, UK, 2009; Volume 327, pp. 127–160. [Google Scholar] [CrossRef]
  59. Arıkal, R.T.; Taşan, N. Guleman Chrome Deposits; Etikrom A.Ş. Report No. 86/01; Etikrom: Elazığ, Turkey, 1986; 98p. [Google Scholar]
  60. Taylor, S.R.; McLennan, S.M. The Continental Crust: Its Composition and Evolution; Blackwell Scientific Publications: Oxford, UK, 1985; 312p. [Google Scholar]
  61. Fayyaz, A.; Asghar, H.; Alrebdi, T.A. Laser-induced breakdown spectroscopy and energy-dispersive X-ray analyses for green mineral fluorite (CaF2). Results Phys. 2023, 52, 106850. [Google Scholar] [CrossRef]
  62. Fayyaz, A.; Waqas, M.; Asghar, H.; Ahmed, R.; Liaqat, U.; Naseem, K.; Baig, M.A. Rapid elemental imaging of copper-bearing critical ores using laser-induced breakdown spectroscopy coupled with PCA and PLS-DA. Talanta 2026, 296, 128463. [Google Scholar] [CrossRef] [PubMed]
  63. Reimann, C.; Filzmoser, P.; Garrett, R.G.; Dutter, R. Statistical Data Analysis Explained: Applied Environmental Statistics with R; John Wiley and Sons: Chichester, UK, 2008. [Google Scholar] [CrossRef]
  64. Aitchison, J. The Statistical Analysis of Compositional Data; Monographs on Statistics and Applied Probability; Chapman and Hall: London, UK, 1986. [Google Scholar] [CrossRef]
  65. Pawlowsky-Glahn, V.; Egozcue, J.J.; Tolosana-Delgado, R. Modelling and Analysis of Compositional Data; John Wiley and Sons: Chichester, UK, 2015. [Google Scholar] [CrossRef]
  66. Filzmoser, P.; Hron, K.; Templ, M. Applied Compositional Data Analysis: With Selected Applications in R; Springer Series in Statistics; Springer: Cham, Switzerland, 2018. [Google Scholar] [CrossRef]
  67. Ronov, A.B. Evolution of rock composition and geochemical processes in the sedimentary shell of the Earth. Sedimentology 1972, 19, 157–172. [Google Scholar] [CrossRef]
  68. Ronov, A.B.; Balashov, Y.A.; Girin, Y.P.; Bratishko, R.K.; Kazakov, G.A. Regularities of rare-earth element distribution in the sedimentary shell and in the crust of the Earth. Sedimentology 1974, 21, 171–193. [Google Scholar] [CrossRef]
  69. McLennan, S.M. Rare earth elements in sedimentary rocks: Influence of provenance and sedimentary processes. In Geochemistry and Mineralogy of Rare Earth Elements; Lipin, B.R., McKay, G.A., Eds.; De Gruyter: Berlin, Germany, 1989; pp. 169–200. [Google Scholar] [CrossRef]
  70. Xie, J.; Yang, X.; Du, J.; Xu, W. Geochemical characteristics of sedimentary manganese deposit of Guichi, Anhui Province, China. J. Rare Earths 2006, 24, 374–380. [Google Scholar] [CrossRef]
  71. Gültekin, A.H.; Balcı, N. Geochemical Characteristics of Sedimentary Manganese Deposit of Binkılıç, Thrace Basin, Turkey. J. Geol. Geophys. 2018, 7, 1000336. [Google Scholar] [CrossRef]
  72. Roy, S. Environments and processes of manganese deposition. Econ. Geol. 1992, 87, 1218–1236. [Google Scholar] [CrossRef]
  73. Nicholson, K. Contrasting mineralogical-geochemical signatures of manganese oxides; guides to metallogenesis. Econ. Geol. 1992, 87, 1253–1264. [Google Scholar] [CrossRef]
  74. Bau, M.; Schmidt, K.; Koschinsky, A.; Hein, J.R.; Kuhn, T.; Usui, A. Discriminating between different genetic types of marine ferro-manganese crusts and nodules based on rare earth elements and yttrium. Chem. Geol. 2014, 381, 1–9. [Google Scholar] [CrossRef]
  75. Kılıç, G.; Aydoğan, M.S.; Kumral, M. Preliminary results of the radiolarian-chert hosted manganese deposit within the Vezirler ophiolitic mélange (Kula-Manisa, western Turkey): Constraints on the origin, paleo-redox conditions, and depositional environments. Arab. J. Geosci. 2018, 11, 645. [Google Scholar] [CrossRef]
  76. Öksüz, N.; Okuyucu, N. Mineralogy, geochemistry, and origin of Buyukmahal manganese mineralization in the Artova ophiolitic complex, Yozgat, Turkey. J. Chem. 2014, 2014, 837972. [Google Scholar] [CrossRef]
  77. Boztaş, S.; Özer Atakoğlu, Ö.; Yalçın, M.G. The Origin and Geochemistry of the Kumluca Manganese Deposit in the South West, Antalya Province, Türkiye: Possibility of Derived Hydrothermal Fluids. Min. Metall. Explor. 2025, 42, 3161–3193. [Google Scholar] [CrossRef]
  78. Gao, J.; Yang, R.; Xu, H.; Zhang, X.; Feng, K.; Zheng, L. Genesis of Permian sedimentary manganese deposits in Zunyi, Guizhou Province, SW China: Constraints from geology and elemental geochemistry. J. Geochem. Explor. 2018, 192, 142–154. [Google Scholar] [CrossRef]
  79. Cai, J.-M.; Cheng, W.-B.; Ran, B.; Lang, X.-H.; Wu, C.-Z.; Xu, W.-L.; Li, M.-L.; Song, Z.-H. Genesis and metallogenesis of Early Cambrian manganese deposits on the northwestern margin of the Yangtze Platform, South China. Ore Geol. Rev. 2026, 190, 107180. [Google Scholar] [CrossRef]
  80. Li, R.-Z.; Jiang, S.; Long, P.; Long, T.; Ding, D.-Q.; Zhao, L.-N.; Zhang, Y.; Huang, Q. Metallogenic Mechanisms of the Lower Triassic Dongping Sedimentary Manganese Deposit in the South China Block: Mineralogical and Geochemical Evidence. Minerals 2025, 15, 847. [Google Scholar] [CrossRef]
  81. Hein, J.R.; Schulz, M.S.; Dunham, R.E.; Stern, R.J.; Bloomer, S.H. Diffuse flow hydrothermal manganese mineralization along the active Mariana and southern Izu-Bonin arc system, western Pacific. J. Geophys. Res. Solid Earth 2008, 113, B08S14. [Google Scholar] [CrossRef]
  82. Staszak, P.; Collot, J.; Josso, P.; Pelleter, E.; Etienne, S.; Patriat, M.; Cheron, S.; Boissier, A.; Guyomard, Y. Origin and composition of ferromanganese deposits of New Caledonia Exclusive Economic Zone. Minerals 2022, 12, 255. [Google Scholar] [CrossRef]
  83. Rimmer, S.M. Geochemical paleoredox indicators in Devonian–Mississippian black shales, Central Appalachian Basin (USA). Chem. Geol. 2004, 206, 373–391. [Google Scholar] [CrossRef]
  84. Amiewalan, F.O.; Lucas, F.A. Geochemical characterization of FE-1 well, Onshore Western Niger Delta Basin, Nigeria. J. Appl. Sci. Environ. Manag. 2020, 24, 1481–1490. [Google Scholar] [CrossRef]
  85. Öksüz, N.; Kaya, S. Genesis of ferromanganese deposits from the Central Anatolian Province, Yozgat-Aşağı Eğerci village, Turkey: Geochemical properties and fluid inclusions. Geol. Croat. 2021, 74, 287–303. [Google Scholar] [CrossRef]
  86. Bau, M.; Dulski, P. Distribution of yttrium and rare-earth elements in the Penge and Kuruman iron-formations, Transvaal Supergroup, South Africa. Precambrian Res. 1996, 79, 37–55. [Google Scholar] [CrossRef]
  87. Bau, M.; Dulski, P. Comparing yttrium and rare earths in hydrothermal fluids from the Mid-Atlantic Ridge: Implications for Y and REE behaviour during near-vent mixing and for the Y/Ho ratio of Proterozoic seawater. Chem. Geol. 1999, 155, 77–90. [Google Scholar] [CrossRef]
  88. Marino, E.; González, F.J.; Kuhn, T.; Madureira, P.; Wegorzewski, A.V.; Mirao, J.; Medialdea, T.; Oeser, M.; Miguel, C.; Reyes, J.; et al. Hydrogenetic, diagenetic and hydrothermal processes forming ferromanganese crusts in the Canary Island seamounts and their influence in the metal recovery rate with hydrometallurgical methods. Minerals 2019, 9, 439. [Google Scholar] [CrossRef]
  89. Liu, F.; Zhang, Z.; Li, X.; An, Y.; Liu, Y.; Chen, K.; Bao, Z.; Li, C. Single-Stage Extraction Technique for Ce Stable Isotopes and Measurement by MC-ICP-MS. Anal. Chem. 2021, 93, 12524–12531. [Google Scholar] [CrossRef] [PubMed]
  90. Henderson, P. Rare Earth Element Geochemistry; Elsevier Science Publishers B.V.: Amsterdam, The Netherlands, 1984; 510p. [Google Scholar]
  91. Grunsky, E.C.; de Caritat, P. State-of-the-art analysis of geochemical data for mineral exploration. Geochem. Explor. Environ. Anal. 2020, 20, 217–232. [Google Scholar] [CrossRef]
  92. Grunsky, E.C. The interpretation of geochemical survey data. Geochem. Explor. Environ. Anal. 2010, 10, 27–74. [Google Scholar] [CrossRef] [PubMed]
  93. Filzmoser, P.; Hron, K.; Reimann, C. Principal component analysis for compositional data with outliers. Environmetrics 2009, 20, 621–632. [Google Scholar] [CrossRef]
  94. Davis, J.C. Statistics and Data Analysis in Geology, 3rd ed.; John Wiley and Sons: New York, NY, USA, 2002. [Google Scholar]
  95. Reimann, C.; Filzmoser, P. Normal and lognormal data distribution in geochemistry: Death of a myth. Consequences for the statistical treatment of geochemical and environmental data. Environ. Geol. 2000, 39, 1001–1014. [Google Scholar] [CrossRef]
  96. Rollinson, H.R. Using Geochemical Data: Evaluation, Presentation, Interpretation; Longman Scientific and Technical: London, UK, 1993. [Google Scholar]
  97. Bonatti, E.; Kraemer, T.; Rydell, H. Classification and genesis of submarine iron-manganese deposits. In Ferromanganese Deposits on the Ocean Floor; Horn, D., Ed.; National Science Foundation: Washington, DC, USA, 1972; pp. 149–166. [Google Scholar]
  98. Koschinsky, A.; Halbach, P. Sequential leaching of marine ferromanganese precipitates: Genetic implications. Geochim. Cosmochim. Acta 1995, 59, 5113–5132. [Google Scholar] [CrossRef]
  99. Hein, J.R.; Koschinsky, A. Deep-ocean ferromanganese crusts and nodules. In Treatise on Geochemistry, 2nd ed.; Elsevier: Amsterdam, The Netherlands, 2014; Volume 13, pp. 273–291. [Google Scholar] [CrossRef]
  100. Koschinsky, A.; Hein, J.R. Uptake of elements from seawater by ferromanganese crusts: Solid-phase associations and seawater speciation. Mar. Geol. 2003, 198, 331–351. [Google Scholar] [CrossRef]
  101. Bau, M.; Koschinsky, A. Oxidative scavenging of cerium on hydrous Fe oxide: Evidence from the distribution of rare earth elements and yttrium between Fe–Mn crusts and seawater. Geochem. J. 2009, 43, 37–47. [Google Scholar] [CrossRef]
  102. Kashiwabara, T.; Takahashi, Y.; Marcus, M.A.; Uruga, T.; Tanida, H. Tungsten species in natural ferromanganese oxides related to its different behavior from molybdenum in oxic ocean. Geochim. Cosmochim. Acta 2013, 106, 364–378. [Google Scholar] [CrossRef]
  103. Öztürk, H. Manganese deposits in Turkey: Distribution, types and tectonic setting. Ore Geol. Rev. 1997, 12, 187–203. [Google Scholar] [CrossRef]
  104. Öztürk, H.; Hein, J.R. Mineralogy and stable isotopes of black shale-hosted manganese ores, southwestern Taurides, Turkey. Econ. Geol. 1997, 92, 733–744. [Google Scholar] [CrossRef]
  105. González, F.J.; Somoza, L.; Lunar, R.; Martínez-Frías, J.; Rubí, J.M.; Torres, T.; Ortiz, J.E.; Díaz-del-Río, V. Internal features, mineralogy and geochemistry of ferromanganese nodules from the Gulf of Cadiz: The role of the Mediterranean Outflow Water undercurrent. J. Mar. Syst. 2010, 80, 203–218. [Google Scholar] [CrossRef]
  106. Oygür, V. Implications on geology, genesis and origin of Çayırlı manganese deposit, Ankara, Central Anatolia. Bull. Miner. Res. Explor. 1990, 110, 29–43. [Google Scholar]
  107. Choi, J.H.; Hariya, Y. Geochemistry and depositional environment of Mn oxide deposits in the Tokoro Belt, northeastern Hokkaido, Japan. Econ. Geol. 1992, 87, 1265–1274. [Google Scholar] [CrossRef]
  108. Koç, Ş.; Özmen, Ö.; Öksüz, N. Geochemical properties identifying the environment of manganese oxide mineralization of Kasımağa (Keskin–Kırıkkale). Bull. Miner. Res. Explor. 2000, 122, 107–118. [Google Scholar]
  109. Türkyılmaz, B. Mineralogical, Geochemical and Origin Investigation of Manganese Deposits in Southeast Anatolian Thrust Belt. Ph.D. Thesis, Fırat University, Elazığ, Turkey, 2004; 160p. [Google Scholar]
  110. Sugisaki, R. Relation between chemical composition and sedimentation rate of Pacific ocean-floor sediments deposited since the middle Cretaceous: Basic evidence for chemical constraints on depositional environments of ancient sediments. J. Geol. 1984, 92, 235–259. [Google Scholar] [CrossRef]
  111. Pelleter, E.; Fouquet, Y.; Etoubleau, J.; Cheron, S.; Labanieh, S.; Josso, P.; Bollinger, C.; Langlade, J. Ni-Cu-Co-rich hydrothermal manganese mineralization in the Wallis and Futuna back-arc environment (SW Pacific). Ore Geol. Rev. 2017, 87, 126–146. [Google Scholar] [CrossRef]
  112. Gartman, A.; Hein, J.R. Mineralization at oceanic transform faults and fracture zones. In Transform Plate Boundaries and Fracture Zones; Karson, C., Ed.; Elsevier: Amsterdam, The Netherlands, 2019; pp. 105–118. [Google Scholar] [CrossRef]
  113. Bayon, G.; German, C.R.; Burton, K.W.; Nesbitt, R.W.; Rogers, N. Sedimentary Fe-Mn oxyhydroxides as paleoceanographic archives and the role of aeolian flux in regulating oceanic dissolved REE. Earth Planet. Sci. Lett. 2004, 224, 477–492. [Google Scholar] [CrossRef]
  114. Kunimaru, T.; Shimizu, H.; Takahashi, K.; Yabuki, S. Differences in geochemical features between Permian and Triassic cherts from the Southern Chichibu terrane, southwest Japan: REE abundances, major element compositions and Sr isotopic ratios. Sediment. Geol. 1998, 119, 195–217. [Google Scholar] [CrossRef]
  115. Kuhn, T.; Bau, M.; Blum, N.; Halbach, P. Origin of negative Ce anomalies in mixed hydrothermal–hydrogenetic Fe-Mn crusts from the Central Indian Ridge. Earth Planet. Sci. Lett. 1998, 163, 207–220. [Google Scholar] [CrossRef]
  116. Zhao, J.; He, L.; Gong, J.; He, Z.; Feng, Z.; Pang, J.; Zeng, W.; Yan, Y.; Yuan, Y. Predicting Manganese Mineralization Using Multi-Source Remote Sensing and Machine Learning: A Case Study from the Malkansu Manganese Belt, Western Kunlun. Minerals 2025, 15, 113. [Google Scholar] [CrossRef]
Figure 1. Regional location and simplified geological map of Durmuştepe (Elazığ) and its surroundings.
Minerals 16 00687 g001
Figure 2. Macroscopic field outcrop, hand specimen, and microscopic ore mineralogy features of the Durmuştepe Fe–Mn mineralization and its host rocks. (A) Outcrop view of stratabound manganese ore in sharp contact with mudstone. (B) Field occurrence of the Fe–Mn mineralization zone showing thickness variations and fault-controlled structural contact. (C) Hand specimen of high-grade, massive manganese ore displaying steel-grey metallic luster and dense, blocky structure. (D) Highly weathered, reddish-brown limonitic clay and silica-cemented mudstone host rocks in the mineralization zone. (E) Intergrowth texture formed by cream-white, highly reflective pyrolusite (Pr) crystals with dark brown-earthy braunite (Br) (polished section, crossed nicols). (F) Manganese-magnetite (Mn-Mt) phases emplaced in microcrack and vein systems. (G) Cream-white secondary pyrolusite (Pr) formations filling voids and microcracks in a massive braunite (Br) matrix. (H) Fine-grained secondary manganese (Mn) crystals occurring as disseminations in a silica-cemented mudstone matrix, accompanied by relatively coarser braunite (Br) phases. (I) Light-grey magnetite (Mt) and bright white-reflecting hematite (Hem) crystals developed by martitization of this phase in a gabbro sample of the Guleman Group. (J) Yellow-brown, metallic-lustered pentlandite (Pn) crystals in paragenetic association with magnetite (Mt) in the same gabbro sample.
Minerals 16 00687 g002
Figure 4. PAAS-normalized (Taylor and McLennan, 1985) [60] REE distribution diagram of the Fe–Mn samples (modified after Marino et al., 2019 [88]). The light blue, light green, light beige, light pink and light purple fields represent the hydrogenetic, hydrogenetic/diagenetic, Fe-rich, diagenetic and hydrothermal reference fields, respectively.
Minerals 16 00687 g004
Figure 5. Box plots reflecting the statistical distributions of the major-oxide (wt.%), trace-element (ppm) and rare earth element (ppm) contents of the Fe–Mn mineralization samples from the study area (y-axis is on a base-10 logarithmic scale).
Minerals 16 00687 g005
Figure 6. Principal Component Analysis (PCA) results for the dataset (n = 21). (A) Biplot of PC1 (52.70%) versus PC2 (17.04%) with 95% confidence ellipses showing the separation of ore samples (red ellipse) from host-rock and alteration samples (grey ellipse). Red lines represent element vectors. (B) PCA scree plot showing the variance explained by the first two principal components (PC1: 53%, PC2: 17%) and the cumulative explained variance (PC1 + PC2: 69.73%).
Minerals 16 00687 g006
Figure 7. Hierarchical Cluster Analysis (HCA) dendrograms of the Durmuştepe Fe–Mn geochemical dataset. (A) Similarity relationships among the samples. (B) Geochemical relationships among the elements. Cluster branches are color-coded as follows. In (A), orange branches, ore samples (Fe-coded); green branches, host-rock and alteration samples. In (B), orange branches, Fe–Mn oxy-hydroxide– and REE-associated elements; green branches, Zr–Hf–Nb–Ce; red branches, LOI–Co–Ni–TiO2–Al2O3–Na2O; purple branches, TOT/S–Au–Cu–Hg; brown branches, Ba–K2O–TOT/C; pink branches, Zn–MgO–Cr2O3. Individual sample and element names are shown on the dendrograms.
Minerals 16 00687 g007
Figure 8. Kendall correlation matrix of the geochemical data of the Durmuştepe Fe–Mn ore samples.
Minerals 16 00687 g008
Figure 9. Binary scatter and linear regression diagrams of major-oxide and trace-element pairs for the Durmuştepe Fe–Mn mineralization samples.
Minerals 16 00687 g009
Figure 10. Exploratory factor analysis of ore samples (n = 11; 44 geochemical variables). (A) Scree plot with the Kaiser criterion (eigenvalue = 1); four factors were retained. (B) Varimax-rotated factor loadings; factor loading values are annotated on the bars. Communalities are given in Table 5.
Minerals 16 00687 g010
Figure 11. Heat maps of the log-ratio variance matrix for the major-oxide, trace-element and REE groups. Light colors indicate that the elements co-vary, and dark colors that they behave independently of one another.
Minerals 16 00687 g011
Figure 12. PCA (CoDA-PCA) biplots constructed with CLR-transformed data for the major-oxide, trace-element and rare earth element (REE) subcompositions.
Minerals 16 00687 g012
Figure 13. Loading diagrams of the PC1 and PC2 components obtained from the CoDA-PCA.
Minerals 16 00687 g013
Figure 14. Conceptual formation and geodynamic evolution model of the proximal volcano-sedimentary hydrothermal-exhalative Fe–Mn mineralization of the Maden Complex (Durmuştepe). The numbered annotations represent the key stages of the genetic system: (1) Fe–Mn orebody (Durmuştepe) showing the mineralized lenses; (2) source of Fe and Mn (leached from crust) representing transition metal leaching from basement basaltic rocks; (3) hydrothermal fluid migration pathways along volcanic crack systems; (4) cold seawater influx/mixing representing downwelling seawater circulation; and (5) mixing and oxidation zone representing precipitation at the vent–seawater interface (initial schematic layout assisted by Google NotebookLM; final vector drafting, annotations, and modifications executed by the authors using Corel Draw).
Minerals 16 00687 g014
Table 1. Major-oxide contents (wt.%) of rock samples from the Durmuştepe study area. (S. No.: Sample Number, Mean: Arithmetic Mean, U. L.: Upper Limit, L. L.: Lower Limit, Std. Dev.: Standard Deviation, LOI: Loss on Ignition, TOT/C: Total Carbon, TOT/S: Total Sulfur).
S. No.Sample TypeSiO2Al2O3Fe2O3MgOCaONa2OK2OTiO2P2O5MnOCr2O3LOITOT/CTOT/SFeMnFe/Mn
Fe-5aOre sample18.032.1141.280.294.930.050.030.121.0420.650.006110.040.0228.87161.80
Fe-5bOre sample18.362.1841.470.365.070.050.030.121.0119.850.006110.040.022915.371.89
Fe-7aOre sample25.596.5527.280.5716.20.090.040.20.6516.470.0045.80.060.0219.0812.761.50
Fe-7bOre sample24.713.1529.480.3170.020.050.11.5617.470.0045.70.270.0220.6213.531.52
Fe-12aOre sample24.415.2925.850.4114.90.090.330.120.7518.020.0159.20.190.0218.0813.961.30
Fe-12bOre sample27.624.825.250.1914.70.070.120.090.5616.970.0089.10.10.0217.7313.141.35
Fe-11Ore sample22.036.739.331.756.440.030.10.250.6215.570.0066.60.050.0227.5112.062.28
Fe-13Ore sample23.473.0731.440.27150.020.070.130.9419.50.0075.50.210.022215.11.46
Fe-14Ore sample24.833.6830.970.3614.30.060.060.141.118.790.0065.20.140.0221.6614.551.49
Fe-4Ore sample26.224.6728.610.113.60.020.120.090.5116.220.0039.30.030.0220.0112.561.59
Fe-9aGabbros/altered49.5614.3115.044.974.374.740.052.450.640.320.0023.30.120.12
G1Gabbros57.2814.949.932.912.845.330.071.20.430.160.0034.60.340.02
M1GSerpentinite36.691.4211.6333.13.050.020.010.030.020.260.485130.450.02
D3Siliceous mudstone
/Ore side rock
74.352.9416.871.310.940.030.180.10.030.440.0072.70.10.02
Ma-1Malachite/Azurite-rich specimen47.7916.348.416.683.513.980.160.850.290.470.0096.50.210.41
Ma-2Malachite/Azurite-rich specimen49.6317.869.077.3124.940.310.770.170.570.0085.80.090.02
H5Serpentinite38.625.258.6932.61.220.020.010.020.010.150.377130.060.04
H9Mudstone50.3214.288.384.257.140.83.040.730.150.620.039101.470.02
H11Sandstone52.7117.878.755.162.516.220.550.930.180.50.0144.40.050.02
H12Mudstone57.314.6110.151.785.385.490.140.630.210.110.0153.70.630.02
H13Sandstone53.5218.088.235.352.446.510.680.910.150.220.0133.70.040.02
Mean 38.248.5820.775.237.51.840.30.480.538.730.057.10.220.0521.4513.91.62
U. L. 74.3518.0841.4733.0517.016.513.042.451.5620.650.49131.470.41
L. L. 18.031.428.230.10.940.020.010.020.010.1102.70.030.02
Std. Dev. 15.786.0711.739.235.612.510.640.570.428.860.133.10.320.08
Table 2. Trace-element contents (ppm) of rock samples from the Durmuştepe study area. (S. No.: Sample Number, Mean: Arithmetic Mean, U. L.: Upper Limit, L. L.: Lower Limit, Std. Dev.: Standard Deviation).
S. No.Sample TypeAuCoHfNbVWZrYMoCuPbZnNi BaAsHg
Fe-5aOre sample0.00473.31.34.873418.484.4135.51.81796.674.43701937.916139.70.01
Fe-5bOre sample0.00475.914.976818.191.9139.221651.265.3291192018140.30.01
Fe-7aOre sample0.00270.91.24.311036.671.6103.36.71089.4109.23111889.320499.90.02
Fe-7bOre sample0.00254.50.72.912838.456.993.94.6723.5138.23721620.423233.30.03
Fe-12aOre sample0.01661.90.93.5153616.663.6122.76.2703.3152.83091848.212394.90.09
Fe-12bOre sample0.02753.70.72.6164213.652.473.54.4780.4184.4372164117114.50.06
Fe-11Ore sample0.002721.4711664.5113122.611263.21434231700.18133.60.01
Fe-13Ore sample0.00160.80.93.413166.469.7114.84.6936.7157.43811609.529240.70.07
Fe-14Ore sample0.00261.80.93.410097.367.2108.15.51496.7189.53051694.7100185.10.05
Fe-4Ore sample0.00660.60.83.2166715.263.5982.7981222.43131570.212103.30.03
Fe-9aGabbros/altered0.00127.33.3262770.516049.70.9368.70.810525.21781.70.01
G1Gabbros0.00414.7654630.927761.4188869.255733.8483.10.01
M1GSerpentinite0.0011400.10.1500.511.30.128.60.5212638.734.10.01
D3Siliceous mudstone
/Ore side rock
0.00111.10.20.71971.710.312.60.5131.963695.51272.30.02
Ma-1Malachite/Azurite-rich specimen0.03622.32.53.82330.510628.50.710,0005.27173.8890.90.1
Ma-2Malachite/Azurite-rich specimen0.00226.22.53.52410.510030.50.410,0002.67996.2462.70.07
H5Serpentinite0.0011240.10.1290.50.80.60.126.60.3172828.531.30.01
H9Mudstone0.00244.23.6151441.112629.70.446.615.999476.92866.20.07
H11Sandstone0.00227.32.23.42560.59523.90.638.45.380111.5873.80.02
H12Mudstone0.00631.11.842080.570332.21657.288.9904189.8444.30.06
H13Sandstone0.001252.23.32370.594.223.30.620.637377.4912.30.01
Mean 0.005854.21.67.3674.25.8584.566.962.24164977.822611146.67767.50.04
U. L. 0.036140.2654166718.4276.9139.26.710,000222.49042828.5286240.70.1
L. L. 0.00111.10.10.1290.50.80.60.120.60.31725.230.90.01
Std. Dev. 0.00932.41.411.8569.46.557.445.92.12769.273.9212931.672.379.90.03
Table 3. Rare earth element (REE) contents (ppm) of rock samples from the Durmuştepe study area (S. No.: Sample Number, Mean: Arithmetic Mean, U. L.: Upper Limit, L. L.: Lower Limit, Std. Dev.: Standard Deviation).
S. No.Sample TypeLaCePrNdSmEuGdTbDyHoErTmYbLu
Fe-5aOre sample171.434.436.72155.327.636.3727.724.324.64.8513.651.9411.451.68
Fe-5bOre sample190.138.238.7159.229.336.7130.374.3327.195.1914.042.0311.761.66
Fe-7aOre sample140.432.929.711922.185.2922.583.0919.573.739.581.357.691.09
Fe-7bOre sample137.429.727105.919.565.1922.063.0519.233.619.451.297.921.16
Fe-12aOre sample141.53129.16121.823.485.925.743.5321.94.1311.031.589.281.31
Fe-12bOre sample12027.925.53102.218.54.4618.352.5516.152.998.091.126.690.95
Fe-11Ore sample167.452.538.8159.930.527.1328.914.3825.735.112.971.9611.451.58
Fe-13Ore sample15332.531.73126.224.756.426.623.5923.34.1110.931.69.251.32
Fe-14Ore sample155.633.730.89124.422.585.7124.163.3121.864.0210.931.488.611.24
Fe-4Ore sample146.529.929.3111522.185.6823.863.2920.773.7510.081.388.161.22
Fe-9aGabbros/altered33.567.88.66357.962.479.061.318.961.744.930.774.540.71
G1Gabbros71129.115.0956.4102.9810.681.5411.182.176.4116.380.91
M1GSerpentinite10.30.160.50.090.050.220.030.230.030.120.020.120.03
D3Siliceous mudstone
/Ore side rock
4.94.91.274.91.360.491.80.322.560.491.210.211.410.18
Ma-1Malachite/Azurite-rich specimen14.728.13.8916.74.051.354.560.694.720.942.720.422.930.45
Ma-2Malachite/Azurite-rich specimen15.929.94.5919.44.571.515.370.785.561.072.950.452.810.47
H5Serpentinite0.30.20.030.30.050.040.10.010.090.020.080.010.090.01
H9Mudstone33.467.18.5733.16.291.545.970.814.990.932.640.382.360.36
H11Sandstone14.323.73.7716.83.681.294.310.624.470.842.610.392.390.39
H12Mudstone26.935.96.75275.791.616.340.915.851.113.010.482.920.47
H13Sandstone1122.63.1814.33.511.193.690.573.950.772.310.382.330.34
Mean 83.3435.8217.7972.0613.723.4914.42.0512.992.466.660.965.740.84
U. L. 190.1129.138.8159.930.527.1330.374.3827.195.1914.042.0311.761.68
L. L. 0.30.20.030.30.050.040.10.010.090.020.080.010.090.01
Std. Dev. 68.5226.7914.0257.1810.442.4210.661.529.171.734.590.653.730.52
Table 4. REE parameters and ratios for Durmuştepe Fe–Mn mineralization samples (S. No.: Sample Number, Mean: Arithmetic Mean).
S. No.∑REELREE/HREEEu/SmSm/NdLREE/(HREE + Y)La/YbCe/LaY/Hoδ Ceδ EuCe
(Anom)
Fe-5a522.014.790.230.181.9114.970.2027.940.101.08−1.00
Fe-5b558.814.790.230.181.9616.160.2026.820.101.06−0.99
Fe-7a418.155.090.240.192.0318.260.2327.690.121.11−0.93
Fe-7b392.494.790.270.182.0117.350.2226.010.111.18−0.95
Fe-12a431.344.490.250.191.7515.250.2229.710.111.13−0.95
Fe-12b355.485.250.240.182.2917.940.2324.580.121.14−0.93
Fe-11548.334.950.230.192.1314.620.3124.040.151.13−0.82
Fe-13455.304.640.260.201.9216.540.2127.930.111.17−0.97
Fe-14448.494.930.250.182.0318.070.2226.890.111.15−0.95
Fe-4421.084.810.260.192.0417.950.2026.130.111.16−0.98
Mean455.154.850.250.192.0116.710.2326.780.111.13−0.95
Table 5. Varimax-rotated factor loadings and communalities for the ore samples (n = 11; 44 geochemical variables).
VariableF1F2F3F4Communality
SiO20.883−0.5560.0500.0271.091
Al2O30.672−0.752−0.0200.1681.045
Fe2O3−0.9840.118−0.102−0.2981.081
MgO0.501−0.9080.060−0.0261.081
CaO0.3020.8340.3760.3081.024
Na2O0.665−0.7850.031−0.0841.067
K2O0.0370.164−0.1900.9670.999
TiO20.634−0.8190.051−0.0831.082
P2O5−0.2390.2760.661−0.3950.727
MnO−0.7340.7340.0150.0211.077
Cr2O3−0.3040.255−0.0660.8790.934
LOI−0.5470.317−0.7360.0240.942
TOT_C0.3160.3100.7670.2690.856
TOT_S0.663−0.7850.034−0.0941.066
Au0.2650.460−0.6100.4920.895
Co−0.9400.313−0.122−0.0180.997
Hf0.436−0.9390.014−0.1021.081
Nb0.528−0.8930.016−0.1001.087
V0.0020.836−0.1860.4360.924
W−0.4510.452−0.6040.0640.777
Zr0.153−1.020−0.021−0.1421.085
Y−1.0150.1410.0200.0911.059
Mo0.1420.6660.4180.4570.847
Cu−0.8570.059−0.148−0.3910.912
Pb−0.0510.813−0.0640.2630.737
Zn−0.6080.6320.0180.0320.770
Ni−0.7600.662−0.0730.1111.032
Ba0.343−0.5440.3020.3790.648
As−0.2190.7360.544−0.2710.959
Hg0.1660.5540.1830.7530.935
La−0.9400.443−0.041−0.0721.086
Ce0.219−0.9930.035−0.0771.041
Pr−0.9830.318−0.087−0.0441.077
Nd−1.0010.263−0.112−0.0211.085
Sm−1.0090.219−0.0880.0381.075
Eu−0.9850.2760.0260.0781.053
Gd−0.9930.3020.0040.0631.081
Tb−1.0250.185−0.0710.0011.091
Dy−1.0100.2460.0040.0111.081
Ho−1.0350.148−0.038−0.0011.095
Er−1.0310.143−0.081−0.0421.092
Tm−1.0420.019−0.081−0.0081.093
Yb−1.0370.043−0.086−0.0211.085
Lu−1.0260.039−0.099−0.0791.070
Table 6. Selected low- and high-variance log-ratio element pairs for major oxides, trace elements and REEs in the Durmuştepe Fe–Mn dataset (five lowest- and five highest-variance pairs per data block).
Data BlockVariance TypeRankComponent 1Component 2Log-Ratio Variance
Major oxidesLow variance1SiO2Al2O30.1271
Major oxidesLow variance2Fe2O3P2O50.1281
Major oxidesLow variance3MgOTiO20.1988
Major oxidesLow variance4Fe2O3Cr2O30.2366
Major oxidesLow variance5SiO2P2O50.2609
Major oxidesHigh variance1Na2OMnO7.2660
Major oxidesHigh variance2MgOMnO4.6008
Major oxidesHigh variance3TiO2MnO4.5350
Major oxidesHigh variance4CaONa2O3.4626
Major oxidesHigh variance5Na2OCr2O33.3147
Trace elementsLow variance1CoY0.0125
Trace elementsLow variance2HfZr0.0308
Trace elementsLow variance3CoZn0.0424
Trace elementsLow variance4HfNb0.0534
Trace elementsLow variance5CoCu0.0637
Trace elementsHigh variance1PbBa5.0223
Trace elementsHigh variance2NbPb4.8444
Trace elementsHigh variance3BaAs4.6160
Trace elementsHigh variance4NbAs4.0469
Trace elementsHigh variance5HfPb3.9760
REEsLow variance1TmYb0.0004
REEsLow variance2PrNd0.0006
REEsLow variance3HoEr0.0011
REEsLow variance4YbLu0.0012
REEsLow variance5EuDy0.0013
REEsHigh variance1LaCe0.4574
REEsHigh variance2CeNd0.3695
REEsHigh variance3CePr0.3678
REEsHigh variance4CeSm0.3009
REEsHigh variance5CeGd0.2791
Disclaimer/Publisher’s Note: The statements, opinions and data contained in all publications are solely those of the individual author(s) and contributor(s) and not of MDPI and/or the editor(s). MDPI and/or the editor(s) disclaim responsibility for any injury to people or property resulting from any ideas, methods, instructions or products referred to in the content.