Article

Selective Screening of Efficient Chalcopyrite Depressants and Their Mechanisms in Copper–Molybdenum Separation

School of Resources, Environment and Materials, Guangxi University, Nanning 530004, China
*
Author to whom correspondence should be addressed.
Minerals 2026, 16(5), 535; https://doi.org/10.3390/min16050535
Submission received: 8 March 2026 / Revised: 30 April 2026 / Accepted: 13 May 2026 / Published: 16 May 2026
(This article belongs to the Collection Flotation Theory and Technology)

Abstract

Molybdenum (Mo) is a strategic raw material for high-end equipment manufacturing, aerospace technologies, and advanced alloys, and approximately 50% of global molybdenum resources are hosted in porphyry Cu–Mo deposits. To address the long-standing challenge of selectively separating chalcopyrite and molybdenite by flotation, this study screened five sulfur-containing organic depressants and investigated their effects on the flotation responses of the two minerals, motivated by the strong affinity of sulfur donor atoms for surface Cu sites on chalcopyrite. The results indicate that thiomalic acid, 4-hydroxythiobenzamide, and 6-methyl-2-thiouracil markedly depress chalcopyrite flotation, whereas 2-(methylthio)acetic acid and N-phenylthiourea exert only minor effects. In contrast, none of the five reagents significantly affects the floatability of molybdenite. Among these depressants, thiomalic acid exhibited the best selectivity. In practical Cu–Mo bulk concentrate flotation, it showed a clear dosage advantage at low addition levels and improved Cu–Mo separation performance; at a Mo recovery of 76.09% and a Mo grade of 5.45%, Cu recovery was reduced to 9.54%. The adsorption mechanism of thiomalic acid on chalcopyrite was further investigated using FT-IR spectroscopy, X-ray photoelectron spectroscopy, and self-consistent charge density-functional tight-binding (SCC-DFTB) calculations. The results suggest that thiomalic acid interacts strongly with surface Cu sites on chalcopyrite via its S- and O-containing functional groups, likely increasing surface hydrophilicity and inhibiting collector adsorption (and subsequent bubble attachment), thereby contributing to selective chalcopyrite depression.

1. Introduction

Molybdenum is a strategic raw material for high-end equipment manufacturing, aerospace technologies, and advanced alloys and is therefore closely linked to national security and long-term development [1,2,3]. Roughly half of the world’s molybdenum resources are hosted in porphyry Cu–Mo sulfide deposits [4,5,6]. In these deposits, chalcopyrite (CuFeS2) commonly occurs in intimate association with molybdenite (MoS2) [7], and the two minerals exhibit comparable natural floatability. This similarity makes their selective flotation separation inherently difficult and has long constrained efficient resource recovery. Moreover, with the continued exploitation of molybdenum resources, ores are increasingly characterized by low grade, fine dissemination, and complex impurity assemblages. Under such conditions, incomplete separation readily leads to excessive copper entrainment in molybdenum concentrates, which can impair downstream processing and product quality [8,9].
In industrial practice, Cu–Mo bulk concentrates are typically processed using a flotation circuit in which chalcopyrite is depressed and molybdenite is floated [10,11], and the key to this process lies in the availability of highly selective chalcopyrite depressants [12,13]. The development of chalcopyrite depressants has gradually shifted from conventional inorganic reagents toward organic molecular depressants. The most established inorganic depressants include sulfide-based reagents [14,15,16], cyanides, Nokes-type reagents [12,17], oxidants [18,19,20,21,22,23,24], and precipitation- and film-forming depressants [23,25,26,27]. However, increasingly stringent requirements for environmental protection and operational safety have limited the use of many inorganic depressants because of their toxicity and pollution risks. In contrast, organic depressants generally offer improved selectivity with a lower environmental burden, making them promising alternatives to traditional inorganic systems. Representative classes of organic depressants include thioureas [28,29,30,31,32,33], thiols [34,35,36,37,38,39,40,41], carbonyl-containing compounds [42,43,44,45,46], hydroxyl-containing compounds [47], and xanthate-based depressants [48]. Nevertheless, in complex pulp environments, the selectivity of existing organic depressants remains insufficient, their robustness in polymetallic coexisting systems is often poor, and it is difficult to balance reagent dosage with environmental compatibility, factors that collectively hinder stable industrial implementation. Consequently, the development of efficient and environmentally benign chalcopyrite depressants remains of considerable importance for improving Cu–Mo separation and resource utilization.
Recent studies have shown that sulfur-containing organic depressants, especially thiol-containing small molecules, are important candidates for chalcopyrite depression [28,34,37,38,39,40,49]. Among these reagents, mercaptocarboxylic-acid-type depressants, such as thioglycolic acid, thiolactic acid, tiopronin, and dimercaptosuccinic acid derivatives, have received increasing attention because they generally contain both sulfur donor groups and carboxyl groups [34,36,40,50,51,52,53]. The sulfur donor atoms can coordinate with Cu or Fe sites on chalcopyrite surfaces, whereas carboxyl groups may enhance surface hydrophilicity and weaken collector adsorption [34,36,40,50,53]. However, the depression performance of these reagents is strongly affected by both molecular structure and pulp chemistry, including the number and position of thiol groups and the presence of carboxyl, hydroxyl, or heterocyclic groups [28,38,49,54].
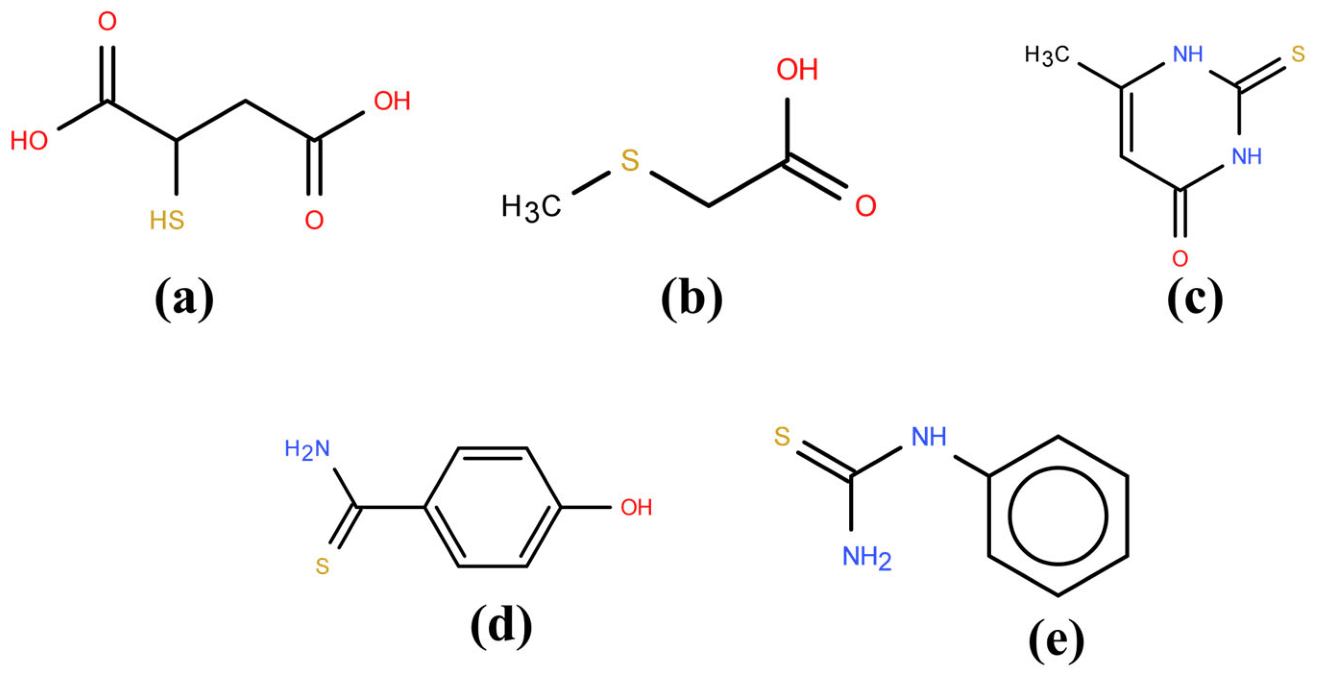
In this work, five candidate depressants, namely thiomalic acid (MA, also known as mercaptosuccinic acid), 2-(methylthio)acetic acid, 6-methyl-2-thiouracil, 4-hydroxythiobenzamide, and N-phenylthiourea, were selected not only because they contain sulfur-bearing functionalities but also because they represent structurally distinct types of sulfur-containing organic compounds with different auxiliary groups. Specifically, MA and 2-(methylthio)acetic acid contain carboxyl groups; 6-methyl-2-thiouracil and N-phenylthiourea contain thiocarbonyl-related heterocyclic or thiourea-type structures; and 4-hydroxythiobenzamide contains both a thiocarbonyl group and a hydroxyl group. Such structural variation provides a useful basis for comparing how different sulfur-containing functionalities and auxiliary groups affect the flotation behavior of chalcopyrite and molybdenite. Accordingly, these five candidate depressants were evaluated for their effects on the single-mineral flotation behavior of chalcopyrite and molybdenite. Because MA showed relatively more favorable selectivity among the tested reagents under the investigated conditions, its adsorption mechanism on chalcopyrite was further investigated.

2. Materials and Methods

2.1. Experimental Samples and Reagents

The chalcopyrite and molybdenite samples used for flotation tests were obtained from mines in Panzhihua, Sichuan Province, China, and from a mine in Jiangxi Province, China, respectively. After crushing, hand sorting, impurity removal, grinding, and sieving, two size fractions, 58–109 μm (140–250 mesh) and <58 μm (<250 mesh), were prepared, of which the 58–109 μm fraction was used for flotation experiments. The 58–109 μm and <58 μm size fractions were prepared using metal wire cloth test series (Shaoxing Shangyu Huafeng Hardware Instrument Co., Ltd., Shaoxing, China). It should be noted that the crushed pure chalcopyrite and molybdenite samples were sealed in plastic bags and stored under vacuum. For flotation tests conducted on the same day, freshly ground samples were used immediately after preparation.
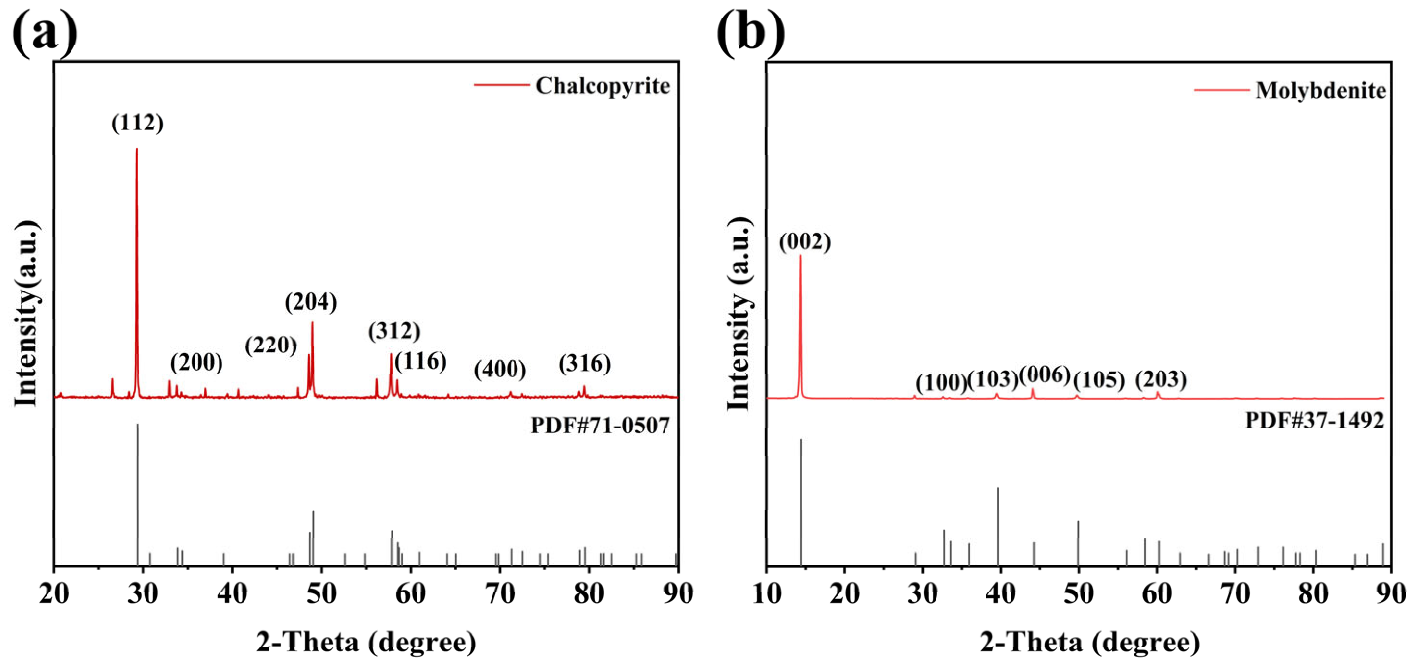
Phase identification of the chalcopyrite and molybdenite samples were identified by X-ray diffraction (XRD) using a Bruker D8 Advance diffractometer (BRUKER AXS GmbH, Karlsruhe, Germany), and the results are shown in Figure 1. All diffraction peaks matched well with the standard patterns of chalcopyrite and molybdenite, and no impurity peaks were observed, indicating that the samples possessed high purity. Multi-element chemical composition analysis was further carried out using an S8 TIGER XRF analyzer (BRUKER AXS GmbH, Karlsruhe, Germany), and the results are summarized in Table 1. The chalcopyrite sample mainly consisted of Cu, Fe, and S, with a combined content of more than 98%, and trace amounts of Er, Ca, and Zn were detected. The molybdenite sample was mainly composed of Mo and S, with a combined content exceeding 95%, meeting the requirements for subsequent experiments.
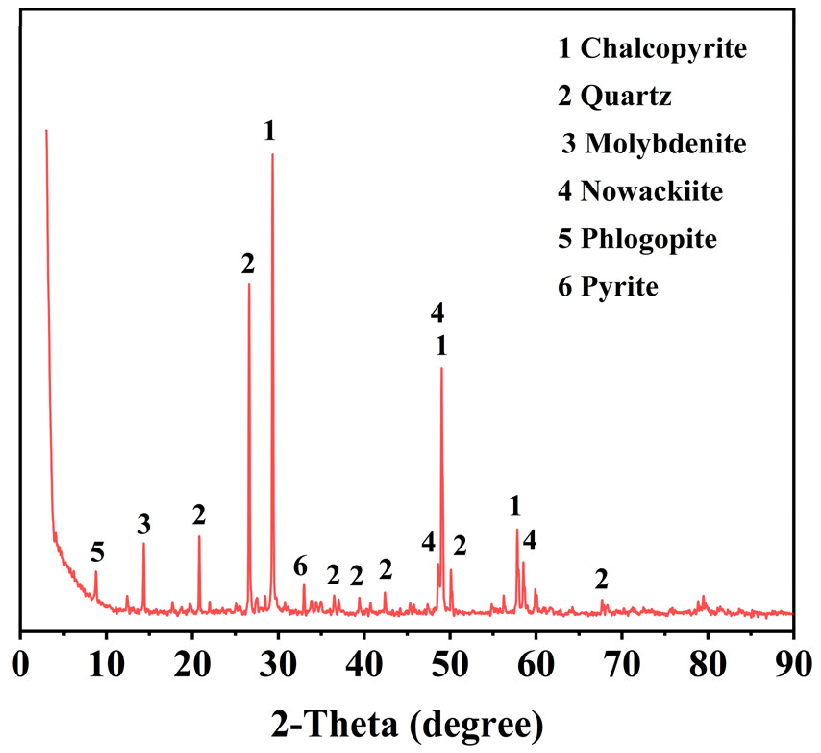
The bulk Cu–Mo concentrate sample was obtained from the Dexing Copper Mine, Jiangxi Province, China. It should be noted that the bulk Cu–Mo concentrate sample was collected directly on site from the mine. After thorough homogenization, the sample was divided into 340 g portions, sealed in plastic bags, vacuum-packed, and stored at low temperature prior to flotation testing. The X-ray diffraction results are presented in Figure 2. The results indicate that the major metallic minerals in the sample were chalcopyrite, pyrite, enargite, and molybdenite, while quartz was the dominant gangue mineral. The multi-element chemical analysis results are summarized in Table 2, showing that the Cu and Mo grades of the bulk concentrate were 24.5 wt% and 0.79 wt%, respectively. No additional grinding or regrinding treatment was applied to the bulk Cu–Mo concentrate prior to flotation. The particle size distribution of the original bulk concentrate sample is shown in Table 3, and particles smaller than 0.074 mm accounted for 78.22 wt% of the sample, confirming that the feed was generally fine-grained.
Hydrochloric acid and sodium hydroxide used as pH regulators were purchased from Chengdu Kelong Chemical Co., Ltd., Chengdu, China. The frother methyl isobutyl carbinol (MIBC) was supplied by Shanghai Aladdin Bio-Chem Technology Co., Ltd., Shanghai, China. Sodium sulfide (Na2S) was sourced from Solvay Industrial Co. The depressants thiomalic acid (MA), 2-(methylthio)acetic acid (6MAA), and 4-hydroxythiobenzamide (4HT) were obtained from Shanghai Haohong Biomedical Technology Co., Ltd., Shanghai, China. while 6-methyl-2-thiouracil (6MST) and N-phenylthiourea (NPT) were purchased from Shanghai Macklin Biochemical Co., Ltd., Shanghai, China. The chemical structures of the five candidate depressants used in this study are shown in Figure 3. Kerosene was purchased from Guangdong Linshi Chemical Reagent Co., Ltd., Guangzhou, China. MIBC and Na2S were of industrial grade, and all other reagents were of analytical grade. Deionized water was used in all microflotation tests and analytical procedures unless otherwise specified.

2.2. Flotation Tests

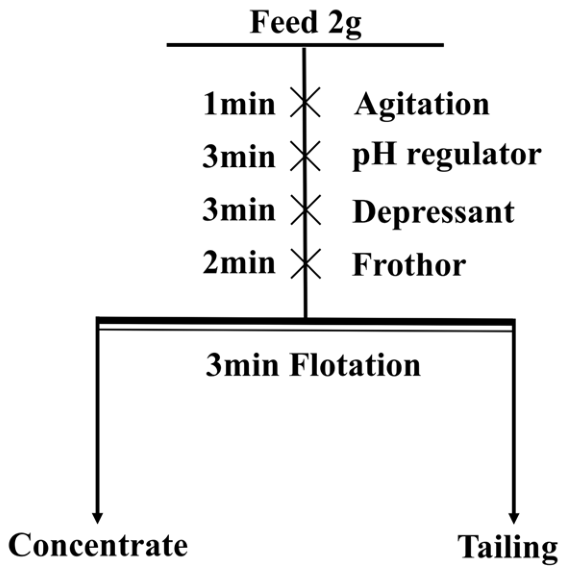
Single-mineral and artificially mixed-mineral flotation tests were carried out using a 40 mL XFGC-II air-inflated hanging-cell laboratory flotation machine (Jilin Province Exploration Machinery Factory, Changchun, China) operated at a constant impeller speed of 1740 rpm. For the mixed-mineral flotation tests, chalcopyrite and molybdenite were mixed together before the pretreatment step. For each test, 2.0 g of the mineral sample was added to 40 mL of deionized water in a beaker; ultrasonically dispersed for 2 min, and allowed to stand for 2 min, and the supernatant was then decanted after settling. The pulp was transferred to the flotation cell and preconditioned for 1 min. Reagents were added sequentially as follows: pH modifier, depressant, collector, and frother, with conditioning times of 1 min, 3 min, 3 min, and 2 min, respectively. Flotation was conducted for 3 min. The froth product and tailings were collected separately, filtered, dried, and weighed to calculate the recovery. The workflow is illustrated in Figure 4.
For mixed-mineral flotation tests, chalcopyrite and molybdenite were premixed at a mass ratio of 1:1 prior to the pretreatment step, and the flotation procedure was identical to that used for single-mineral tests. After flotation, the concentrate and tailings were collected, filtered, dried, and weighed. Their Cu and Mo grades were determined by XRF analysis, and the corresponding recoveries were calculated based on product masses and assay values. All flotation tests were conducted in triplicate, and the reported results are presented as mean values.
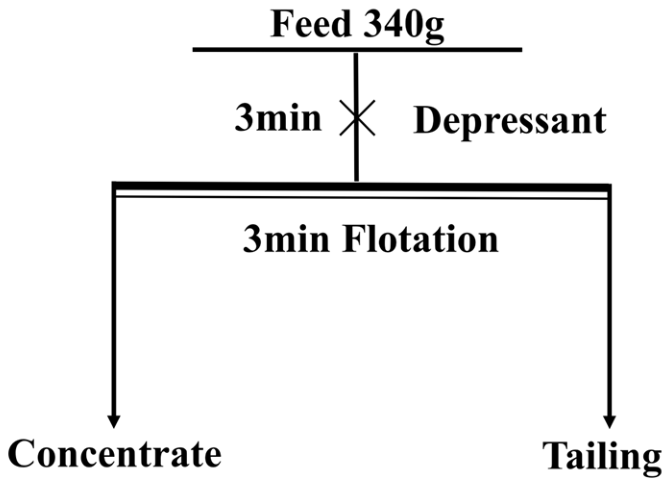
Flotation separation tests on the practical Cu–Mo bulk concentrate were performed in a 0.75 L XFD laboratory flotation machine (Jilin Province Exploration Machinery Factory, Changchun, China). In each test, 340 g of the concentrate sample was used, and the impeller speed was fixed at 1992 rpm. Tap water was used in these experiments, and the pH was measured to be 7–8. The pulp solid concentration was maintained at 45 wt% solids. The pulp was conditioned with the depressant for 3 min, followed by flotation for 3 min. The concentrate and tailings were collected separately, filtered, dried, weighed, and assayed, and the copper and molybdenum recoveries were calculated. All flotation tests were conducted in triplicate, and the reported results are presented as mean values. The corresponding flowsheet is shown in Figure 5.

2.3. FT-IR Measurements

FT-IR measurements were performed on an IRTracer-100 Fourier-transform infrared (FT-IR) spectrometer (Shimadzu Corporation, Kyoto, Japan) using the KBr pellet technique. For sample preparation, 2.0 g of chalcopyrite was added to 40 mL of deionized water in a flotation cell, and the depressant was then added to the desired concentration; the pulp pH was adjusted to 7. The suspension was agitated for 30 min to allow for reagent–mineral interaction. The solids were recovered by filtration and rinsed at least three times with deionized water. Finally, the samples were dried in a vacuum oven at 30 °C for 24 h.

2.4. XPS Measurements

Surface chemical states of chalcopyrite before and after depressant treatment were examined using a K-Alpha X-ray photoelectron spectrometer (Thermo Fisher Scientific, Waltham, MA, USA). For sample preparation, 2.0 g of chalcopyrite was ultrasonically pretreated for 3 min and then mixed with 40 mL of deionized water in a flotation cell; the depressant was added to the prescribed concentration, and the pulp pH was adjusted to 7. The suspension was magnetically stirred for 30 min, followed by filtration. The collected solids were washed three times with deionized water and dried at 30 °C in a vacuum oven prior to analysis.

2.5. SCC-DFTB Calculation Method

Quantum-chemical calculations provide a powerful approach for elucidating reagent–mineral interfacial interactions and adsorption mechanisms [55,56,57,58]. In this study, Materials Studio (MS) 2019 (BIOVIA, Dassault Systèmes, San Diego, CA, USA) was employed to investigate the adsorption of MA on chalcopyrite surfaces using the self-consistent charge density-functional tight-binding (SCC–DFTB) method. All calculations were performed in a spin-unrestricted manner. Geometry optimizations were carried out using the DFTB+ code with the CuFeOrg Slater–Koster parameter set (covering Cu, Fe, S, O, and H) [59,60,61]. The experimental lattice constants of chalcopyrite are a = b = 5.290 Å and c = 10.422 Å. [62] After DFTB+ optimization, the lattice parameters were a = 5.118 Å, b = 5.118 Å, and c = 10.408 Å, corresponding to a deviation of only 0.07% from the experimental values, supporting the reliability of the chosen method and parameters. The most stable chalcopyrite (112) surface was adopted [63]. A 2 × 1 × 1 supercell slab model comprising five atomic layers and a 20 Å vacuum region was constructed; to mimic bulk constraints, the bottom three layers were fixed during optimization. The self-consistent field (SCF) convergence criterion was set to 1 × 10⁻⁵ eV/atom, the calculation accuracy was set to medium, and a 1 × 2 × 1 k-point mesh was used.
Subsequently, the CASTEP module was used to compute the density of states (DOS), charge density distributions, and Mulliken charges. The Perdew and Wang 1992 (PW91) exchange–correlation functional within the generalized gradient approximation (GGA) was employed [64], with a plane-wave cutoff energy of 400 eV and spin polarization included. Ultrasoft pseudopotentials were used to describe electron–ion interactions, and the computational precision was further increased. The SCF tolerance was set to 2.0 × 10⁻⁶ eV/atom. It should be noted that the present computational model does not explicitly include interfacial water, surface hydration, OH, or other dissolved species, and thus the results mainly reflect intrinsic interaction trends under the modeled conditions.

3. Results and Discussion

3.1. Effect of Reagent Dosage on the Flotation Behavior of Single Minerals Under Different Depressant Systems

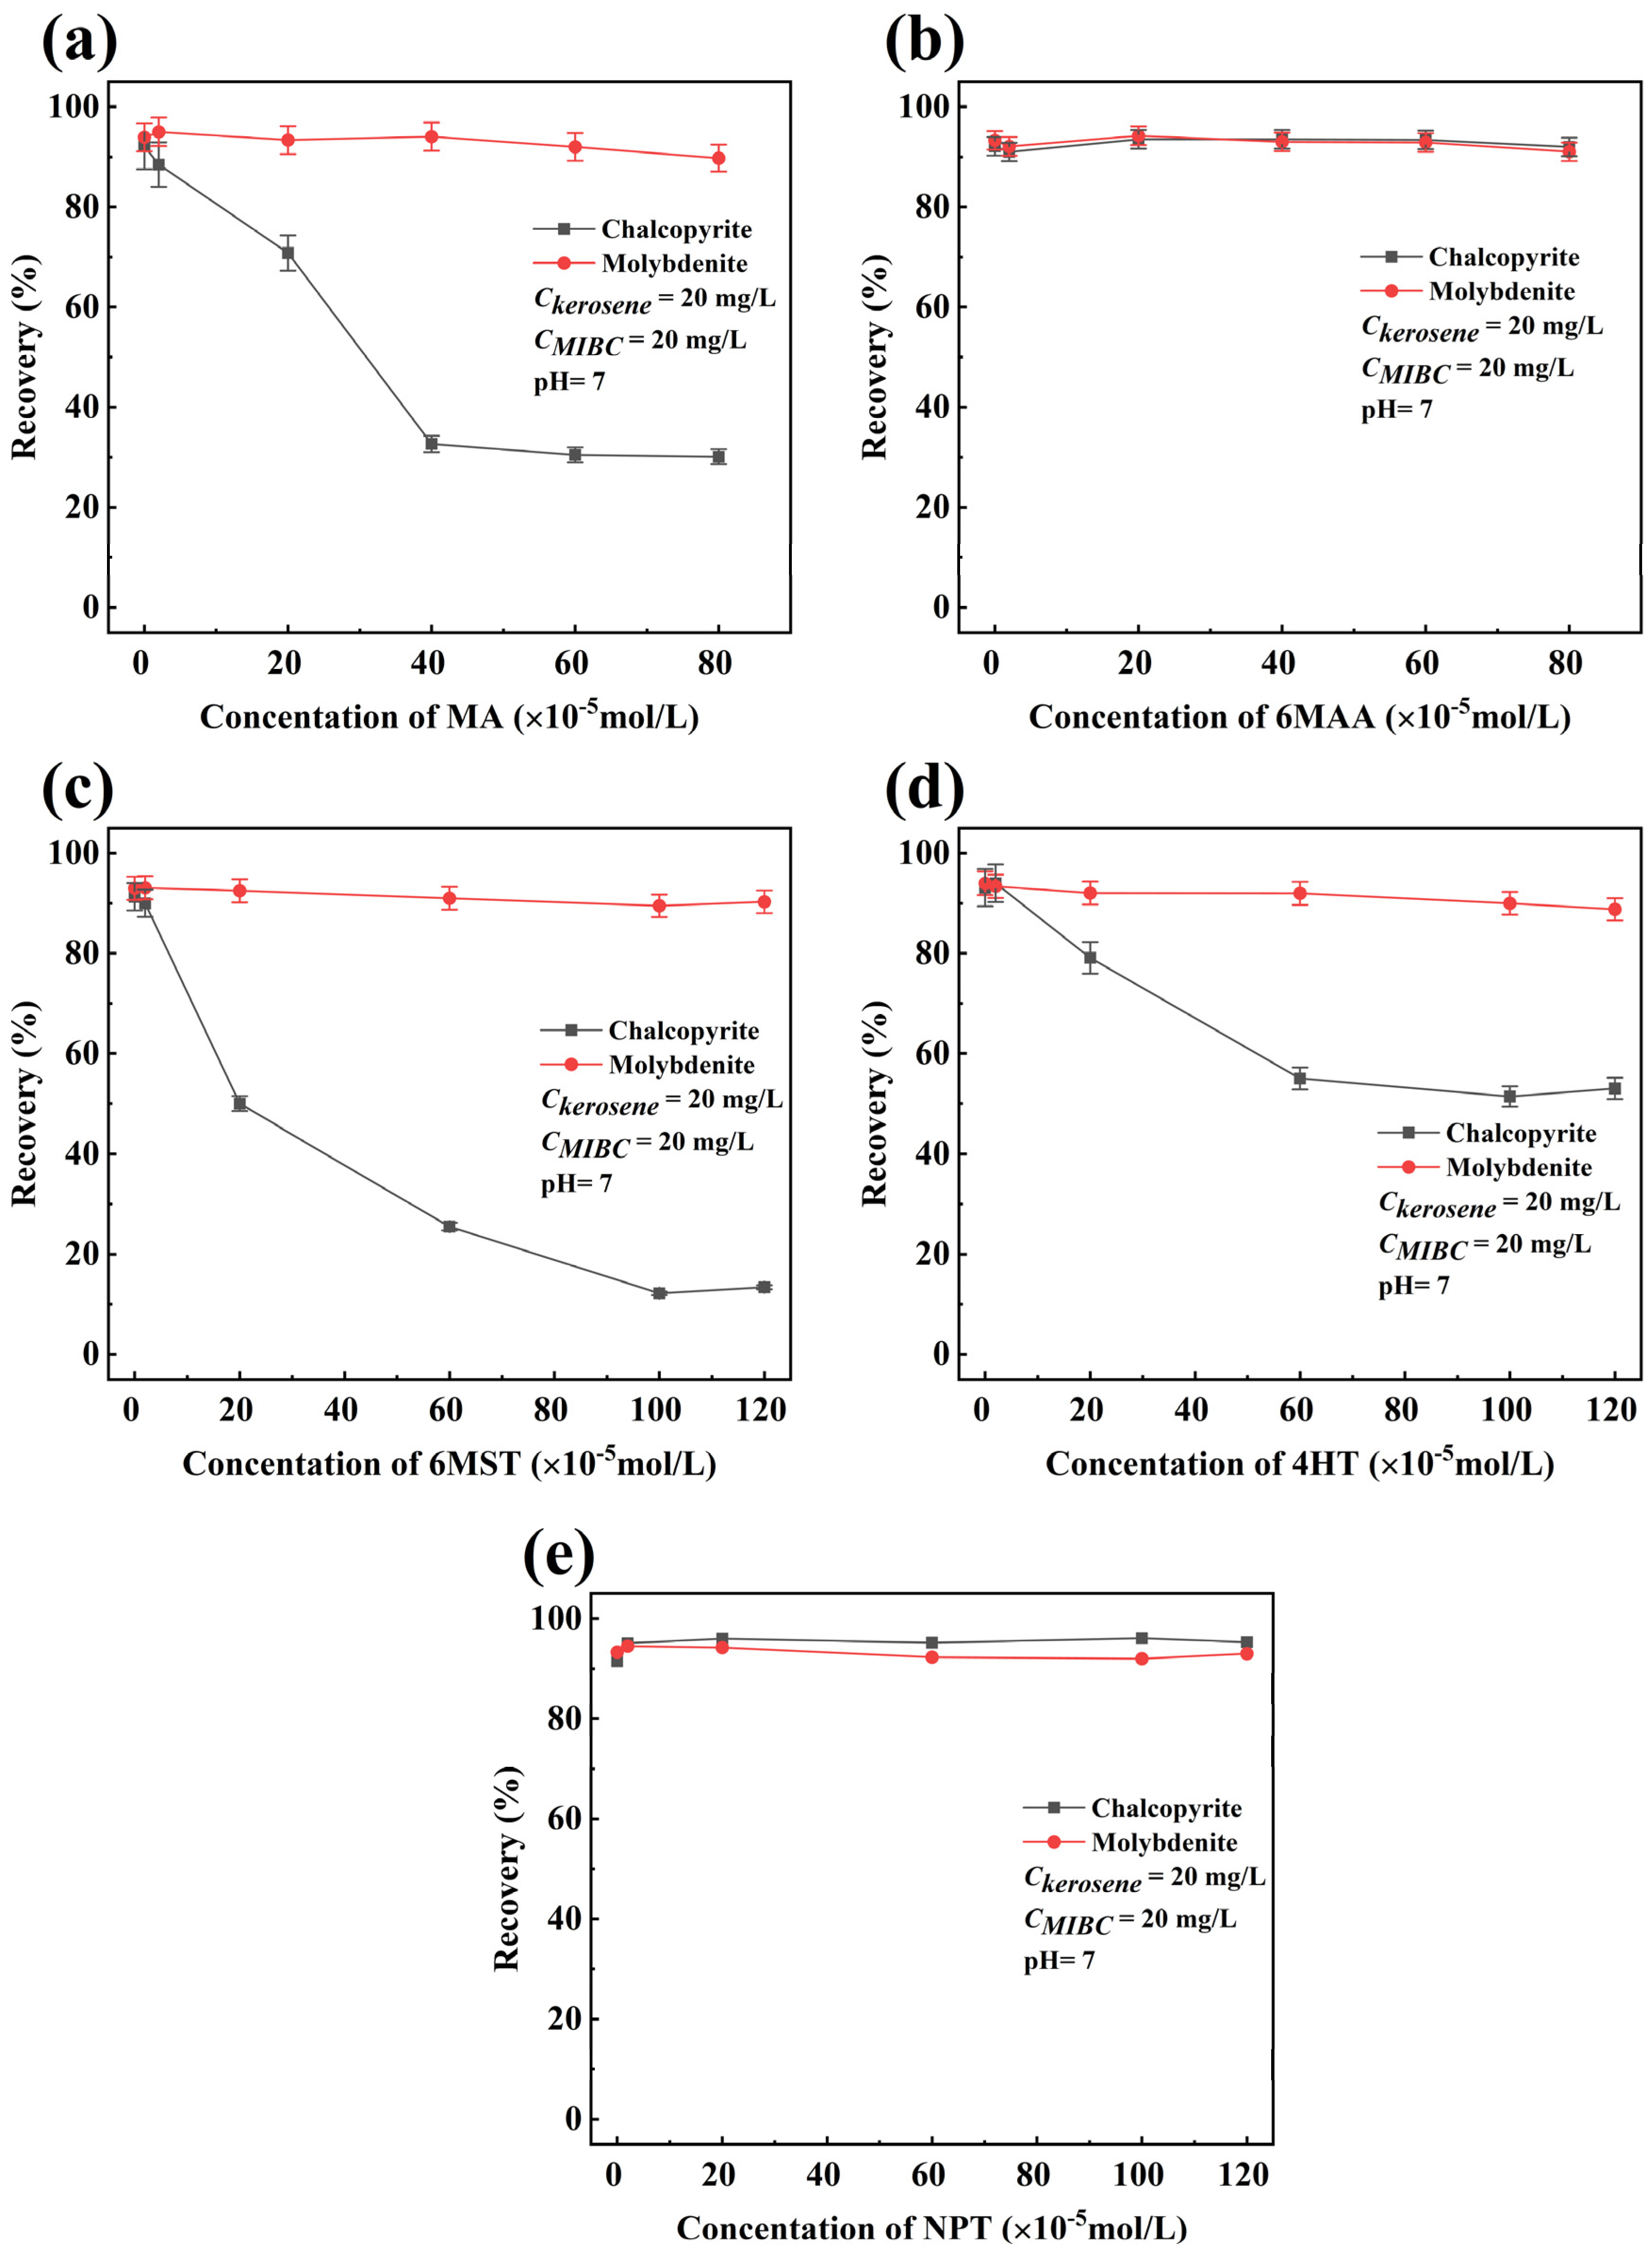
To evaluate the performance of five candidate depressants (MA, 6MAA, 6MST, 4HT, and NPT), the influence of depressant dosage on the flotation responses of chalcopyrite and molybdenite was examined using kerosene as the collector at pH 7. The results are presented in Figure 6.
As shown in Figure 6, the five sulfur-containing organic depressants exhibited markedly different effects on the flotation behavior of chalcopyrite and molybdenite as the reagent dosage increased. For chalcopyrite, MA, 6MST, and 4HT showed progressively stronger depression with increasing dosage, after which the recovery tended to level off, indicating relatively strong interactions with the chalcopyrite surface under the tested conditions. Specifically, as the MA dosage increased from 0 to 4 × 10⁻⁴ mol/L, the Cu recovery decreased to 32.66%; for 6MST, increasing the dosage from 0 to 1 × 10⁻³ mol/L reduced the Cu recovery to 12.20%; and for 4HT, the Cu recovery decreased to 51.40% at 1 × 10⁻³ mol/L, indicating weaker depression than 6MST at the same dosage and than MA at its maximum tested dosage. In contrast, 6MAA and NPT caused only minor changes in Cu recovery over the investigated dosage range, suggesting much weaker depressing ability.
These differences may be related to their molecular structures and functional groups. MA contains both thiol and carboxyl groups, which may favor stronger interaction with surface Cu sites and simultaneously enhance surface hydrophilicity. 6MST contains thiocarbonyl and carbonyl groups within a heterocyclic framework, which may contribute to stronger adsorption and depression toward chalcopyrite. 4HT contains sulfur- and hydroxyl-bearing functionalities, which may also strengthen its interfacial interaction with chalcopyrite. By comparison, the functional group configurations of 6MAA and NPT appear less favorable for effective chalcopyrite depression under the present conditions.
For molybdenite, none of the five depressants caused a pronounced change in recovery across the tested dosage range, indicating that their influence on molybdenite floatability was limited under the tested conditions. Considering both chalcopyrite depression and molybdenite selectivity, MA, 6MST, and 4HT were selected for the subsequent mixed-mineral flotation tests.

3.2. Effect of Pulp pH on the Flotation Behavior of Single Minerals Under Different Depressant Systems

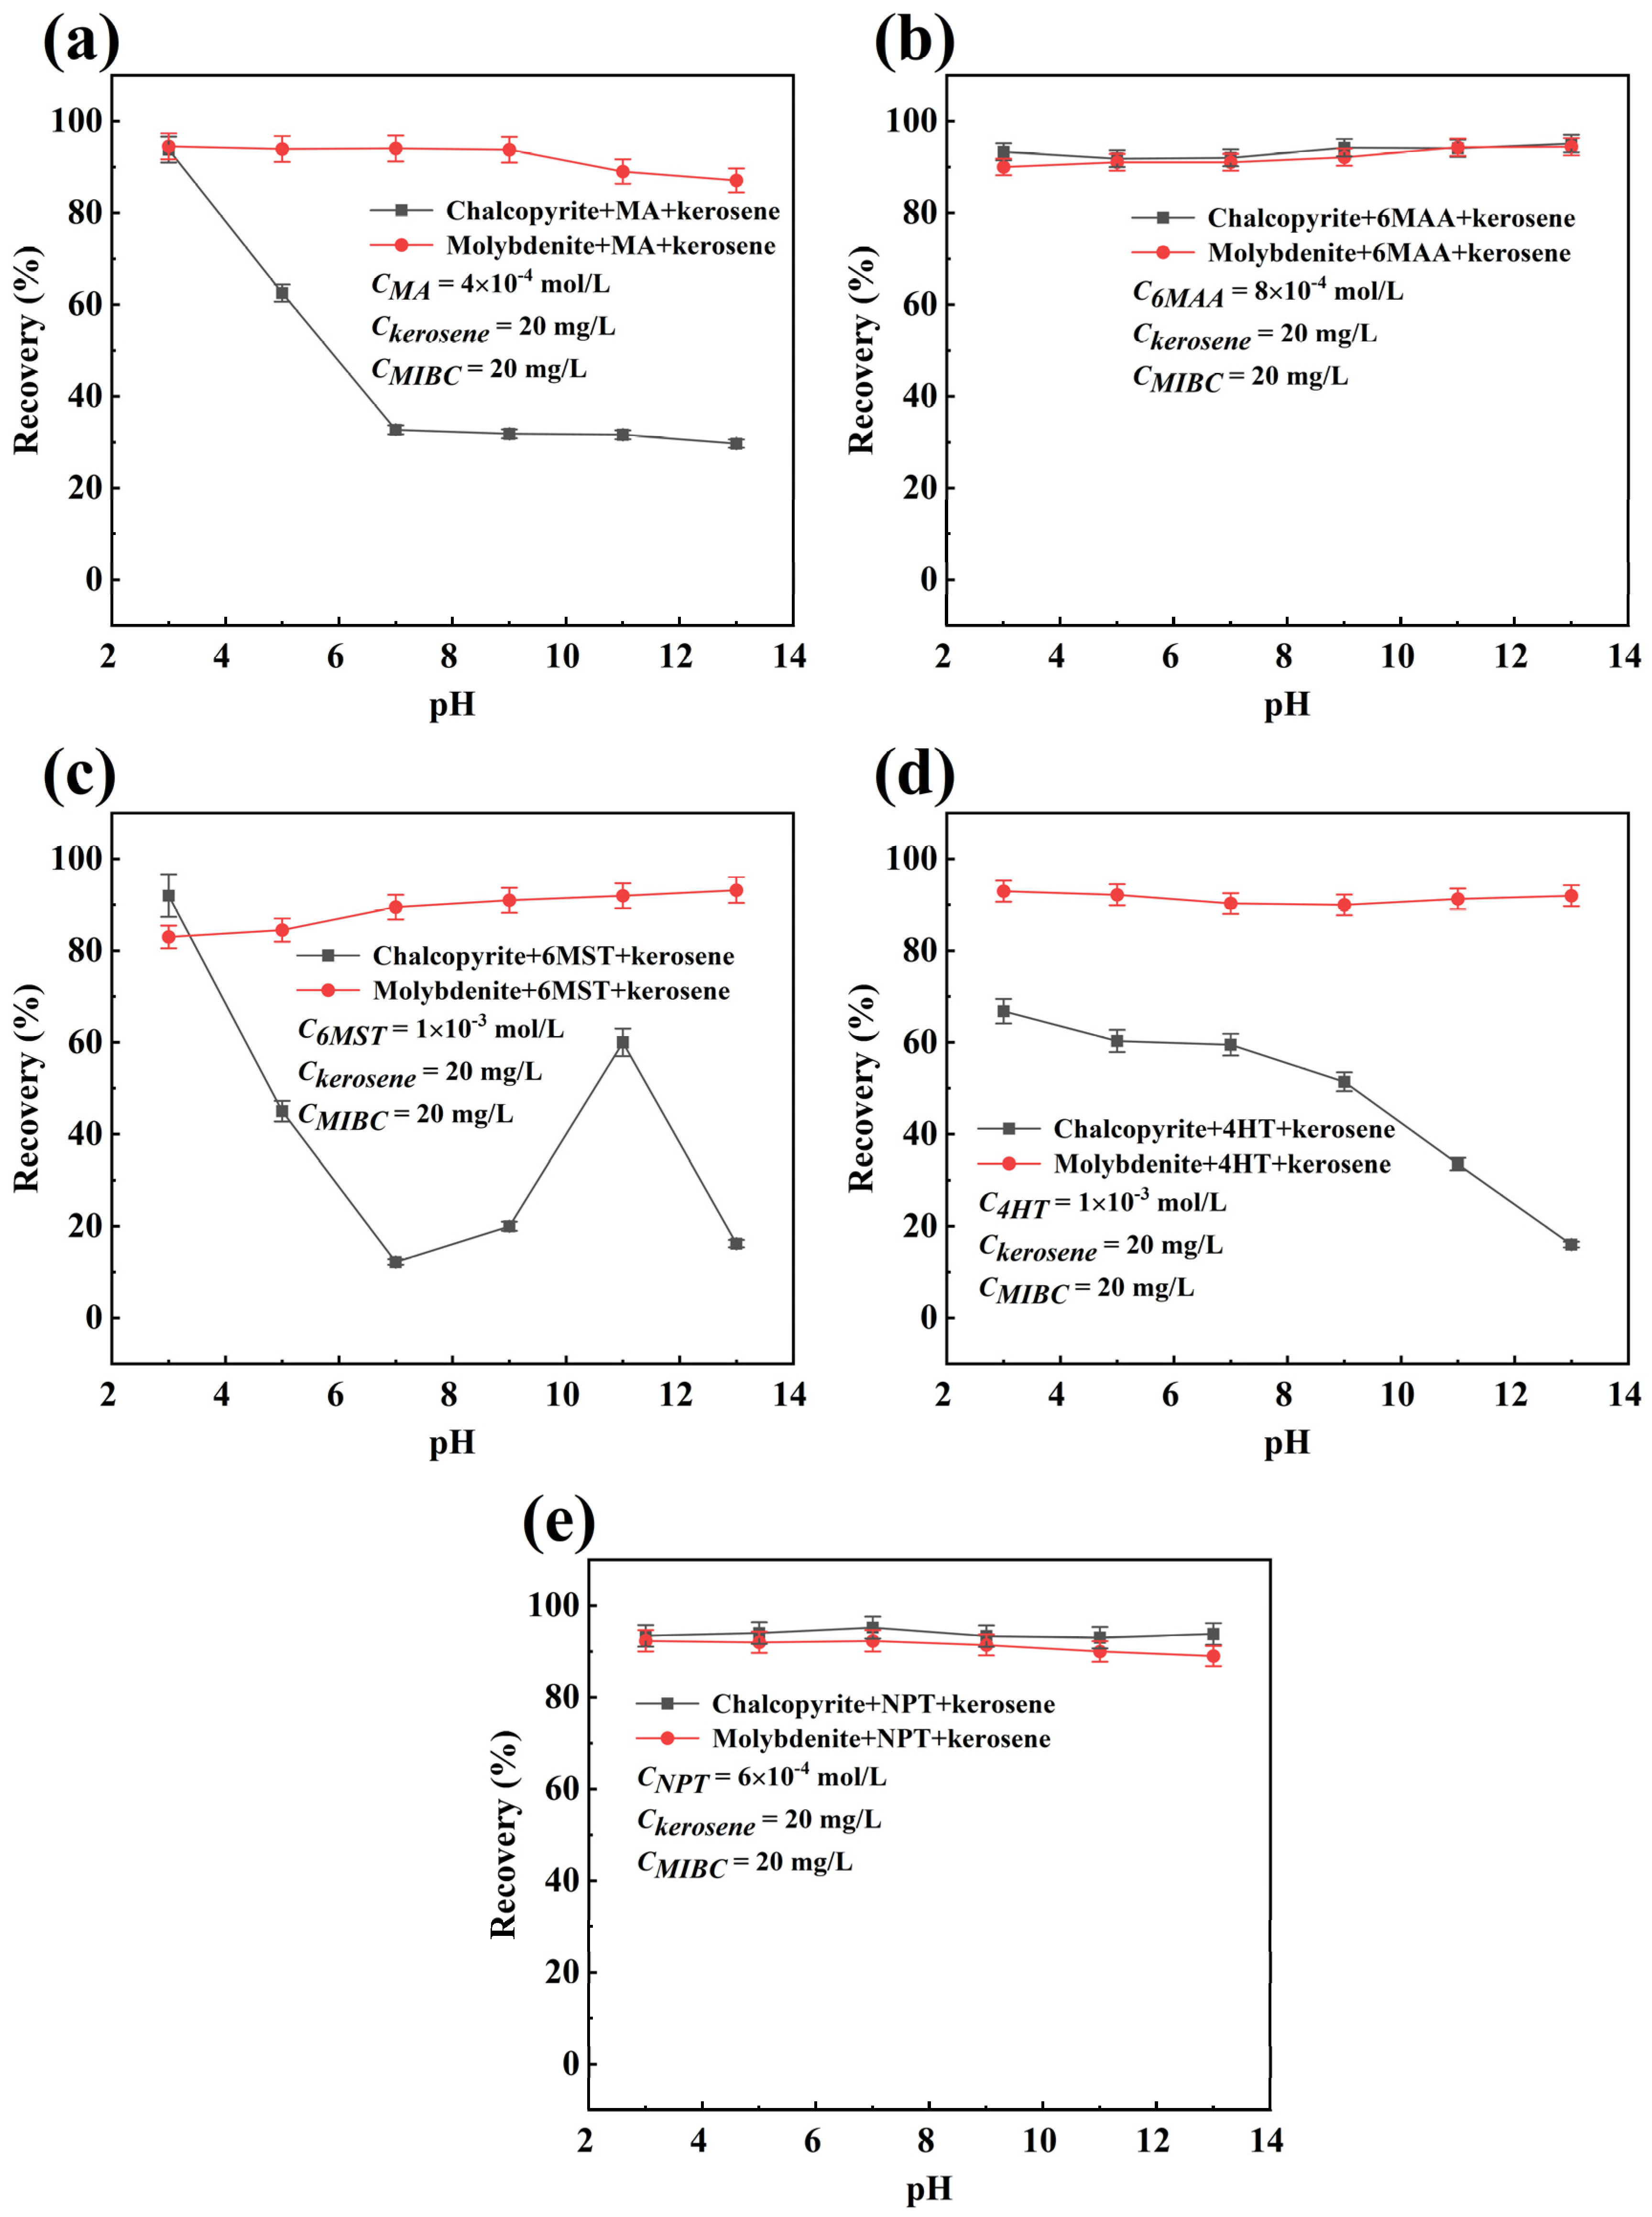
To further differentiate depressant performance, single-mineral flotation tests were carried out to investigate the effect of pulp pH on the flotation of chalcopyrite and molybdenite at appropriate reagent dosages, with a blank test (without depressant) used as a reference. The results are shown in Figure 7 and Figure 8.
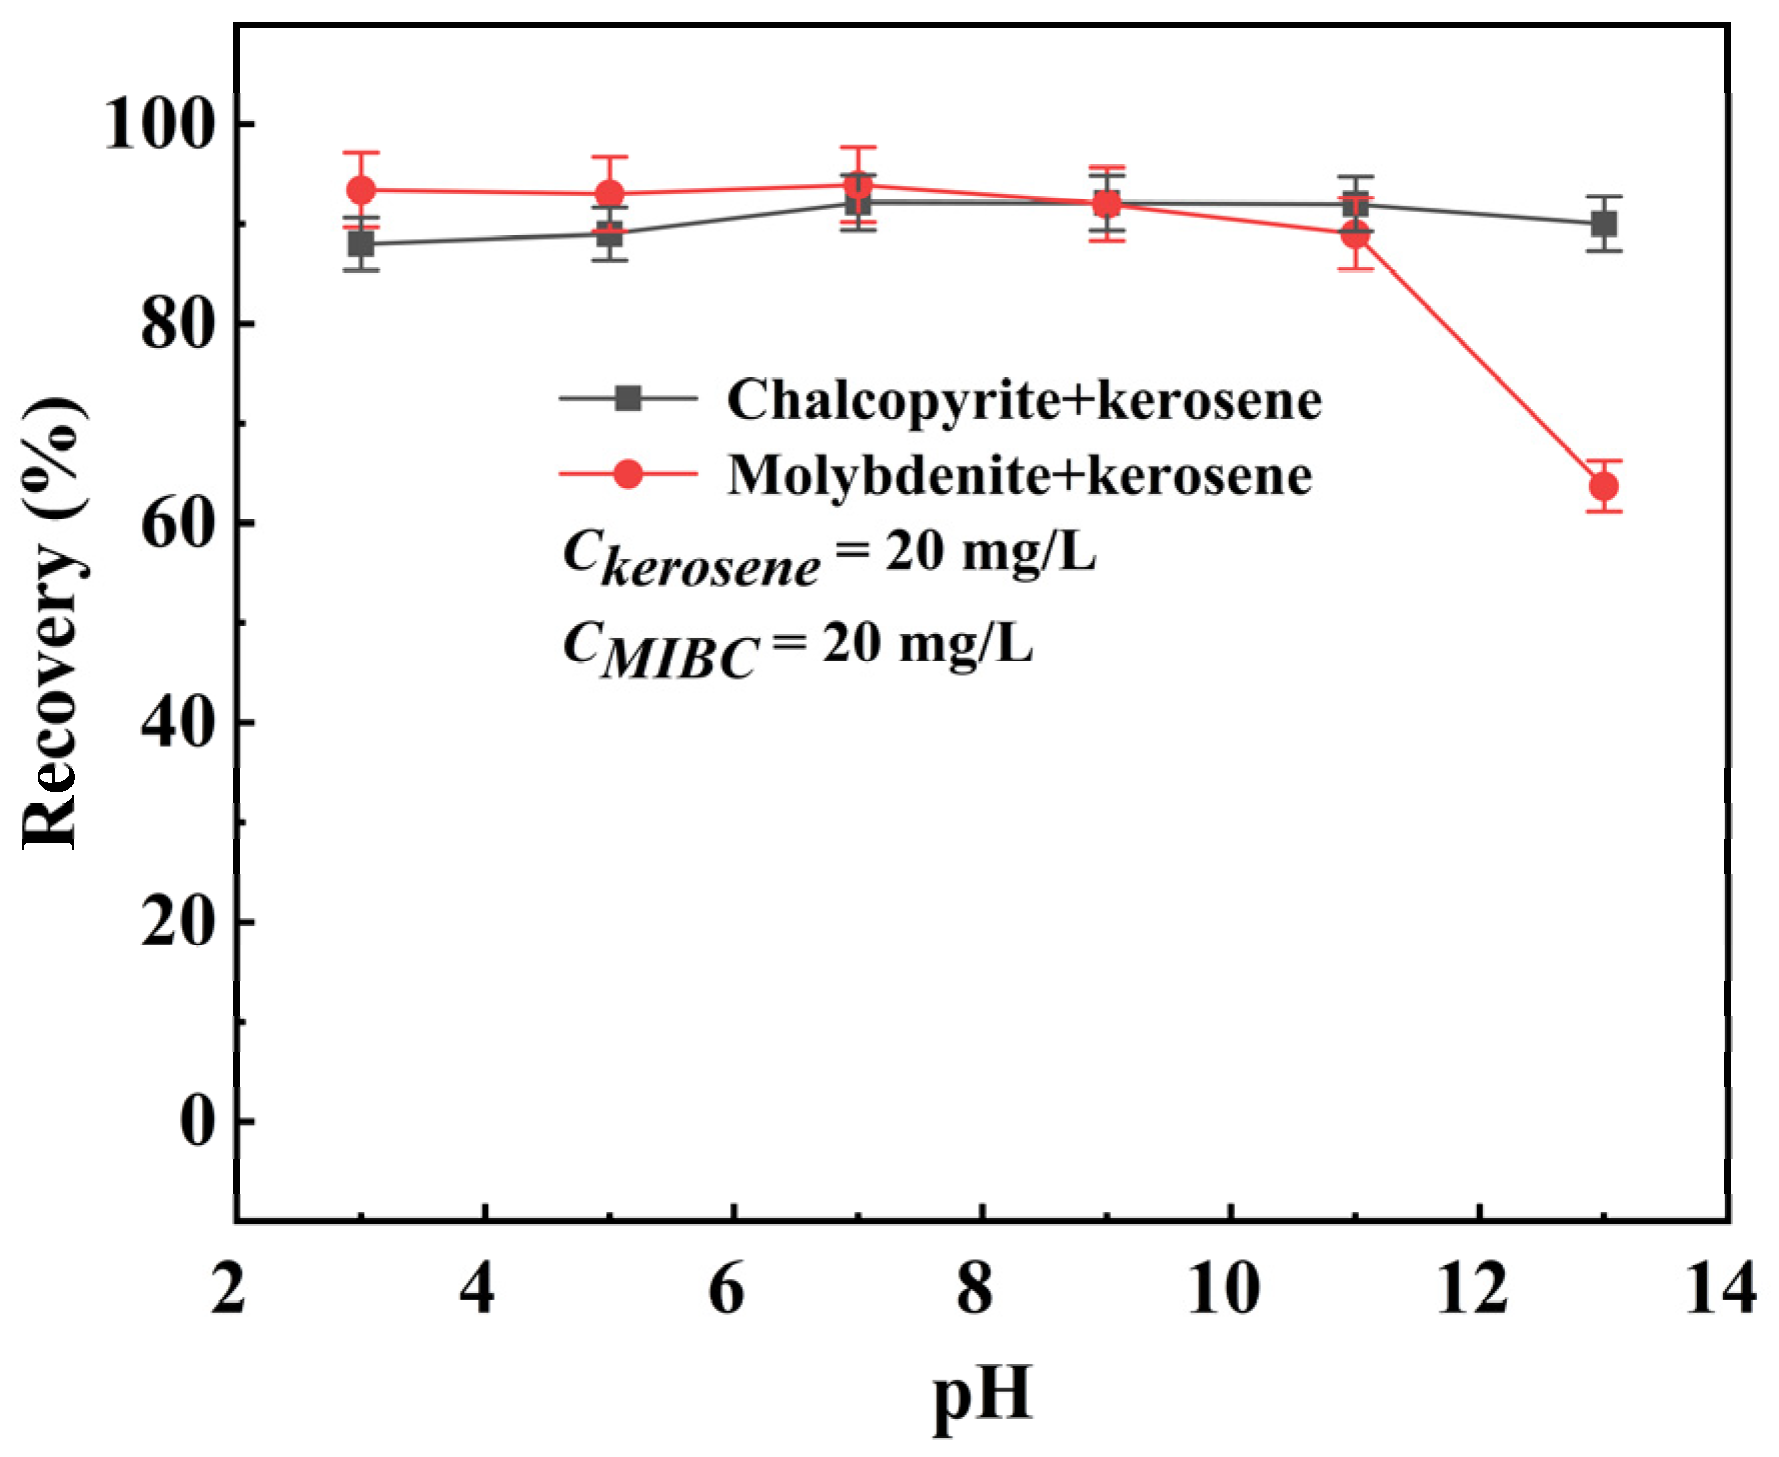
The marked decline in molybdenite recovery under strongly alkaline conditions in (pH 13) in Figure 7 is likely related to an intrinsic pH effect, i.e., reduced surface hydrophobicity of molybdenite. Molybdenite has a hydrophobic basal plane but relatively reactive edge sites; at high pH, OH may preferentially interact with the edge sites, enhancing surface hydration and weakening bubble–particle attachment. In addition, the formation or adsorption of hydrophilic molybdate species under alkaline conditions may further decrease its floatability. Therefore, the sharp decrease in molybdenite recovery at pH 13 should be interpreted primarily as a pH-controlled effect rather than an effect induced by the depressants.
As shown in Figure 7 and Figure 8, the five depressants exhibited distinct effects on the flotation behavior of chalcopyrite and molybdenite across the investigated pH range. For chalcopyrite, the depressing effects of MA and 4HT gradually increased with increasing pH and then became stable under mildly alkaline conditions, suggesting that higher pH favors their effective interaction with the chalcopyrite surface. Among the tested reagents, 6MST showed the strongest pH dependence: chalcopyrite recovery decreased markedly at pH 5–9 and pH 13 but exhibited a temporary increase at pH 11, indicating a non-monotonic variation in its depressing effect. This phenomenon may be related to changes in the solution speciation of 6MST under different pH conditions, as well as variations in its adsorption state on the chalcopyrite surface. Around pH 11, the competitive adsorption of OH and enhanced surface hydration may temporarily weaken the stability of 6MST adsorption, thereby reducing its depressing effect. In contrast, 6MAA and NPT had only a slight influence on chalcopyrite recovery, suggesting weak interaction with the chalcopyrite surface. Across the entire pH range investigated, none of the five depressants caused a significant decrease in molybdenite recovery, indicating that their influence on molybdenite floatability was limited. Considering both their depressing ability toward chalcopyrite and their selectivity toward molybdenite, MA, 6MST, and 4HT were selected as chalcopyrite depressants for the subsequent artificial mixed-mineral flotation tests.

3.3. Flotation of Synthetic Mixed Minerals

To verify separation performance in a multiphase system, mixed-mineral flotation tests were conducted using an artificial mixture of chalcopyrite and molybdenite at a 1:1 mass ratio, with kerosene as the collector at pH 7. The results are summarized in Table 4.
In the artificial mixed-mineral flotation tests, MA and 4HT both exhibited depressing effects on chalcopyrite, but their separation behaviors differed. It should be noted that, in mixed sulfide mineral systems, inter-mineral interactions may occur in the pulp, and the resulting flotation behavior may therefore differ from that observed in single-mineral tests. In the MA system, the concentrate Mo recovery remained high, while Cu recovery decreased to 70.53%, and the concentrate Cu grade was reduced to 16.01%, indicating moderate selectivity under the tested dosage. This suggests that the depressing effect of MA on chalcopyrite is present in the mixed-mineral environment, and further optimization may be required to enhance selectivity.
In the 4HT system, chalcopyrite was more strongly depressed, as reflected by the much lower Cu recovery (25.51%) in the concentrate and a substantially reduced Cu grade (11.09%), while the concentrate Mo grade increased to 35.67% at a Mo recovery of 60.63%. However, the concentrate mass recovery was lower than that of the MA system, indicating that improved Cu rejection was accompanied by a reduced overall flotation response.
By contrast, 6MST produced a very low-mass recovery concentrate with poor Mo grade (13.40%) and poor Mo recovery (10.65%), indicating that 6MST severely suppressed molybdenite in the mixed-mineral system and is unfavorable for the intended Cu–Mo selective flotation strategy (depress Cu while floating Mo). The markedly decreased molybdenite recovery observed with 6MST in the mixed-mineral tests, compared with the single-mineral results, suggests that its effect on molybdenite may not be purely direct. A possible explanation is that inter-mineral interactions in the mixed pulp altered the surface state of the minerals and the pulp chemistry, thereby indirectly affecting molybdenite floatability. Because Eh (oxidation–reduction potential) was not measured in the present study, this interpretation remains tentative.
Accordingly, the flotation responses observed in the mixed-mineral system should be interpreted with caution and not be regarded as a simple extension of the single-mineral results. Considering the intended Cu–Mo selective flotation strategy as well as the overall flotation response, MA and 4HT were selected as the primary candidates for practical-ore evaluation. In addition, although the mixed-mineral results suggested that 6MST was not aligned with the intended separation direction under the tested conditions, we included 6MST in the practical-ore tests to provide a direct benchmark and to strengthen the robustness of the conclusions.

3.4. Flotation Tests on a Practical Cu–Mo Bulk Concentrate

To further evaluate the practical applicability of MA, 4HT, and 6MST as chalcopyrite depressants for Cu–Mo separation, an open-circuit single rougher flotation test was carried out using a Cu–Mo bulk concentrate from the Dexing Copper Mine concentrator. Na2S, a conventional depressant widely used in industrial Cu–Mo separation, was employed as a benchmark for comparison. The results are presented in Table 5.
In the MA system, Mo recovery in the concentrate increased with increasing dosage and reached a maximum of 86.01% at 3 kg/t; however, a further increase in dosage led to a decline in Mo recovery, indicating that excessive addition was unfavorable for separation performance under the tested conditions. Importantly, MA showed a clear dosage advantage at low addition levels: at only 1 kg/t MA, the Mo recovery and grade reached 68.40% and 3.71%, respectively, which were markedly higher than those obtained with 3 kg/t Na2S alone. These results indicate that MA possesses promising selective depressing ability toward chalcopyrite in the bulk concentrate system. However, the practical flotation results also suggest that MA alone was insufficient to achieve a fully satisfactory separation performance comparable to that obtained in the combined Na2S -containing system, implying that MA is better regarded as a promising auxiliary organic depressant rather than a direct replacement for Na2S under practical flotation conditions.
In contrast, in the 4HT system, both chalcopyrite and molybdenite were strongly depressed, resulting in poor separation performance. The concentrate showed a low Mo grade and recovery, indicating insufficient selectivity of 4HT toward chalcopyrite and suggesting that it was unsuitable for efficient Cu–Mo separation under the tested conditions. In the 6MST system, the concentrate mass recovery was 30.95%, but the Mo grade and recovery remained low (0.46% and 22.12%). The concentrate was Cu-enriched, indicating that 6MST suppresses molybdenite and increases Cu reporting to the concentrate under the tested conditions, which is unfavorable for Cu–Mo selective flotation.
Based on the above results, combined-reagent flotation tests were further conducted to examine the effect of Na2S in the practical pulp system and its influence on flotation performance in the presence of MA. Specifically, the Na2S dosage was fixed at 3 kg/t, while MA was added at different levels, and the results are summarized in Table 6. Under a constant Na2S dosage, adding MA improved Cu–Mo separation relative to Na2S alone, but the benefit was dosage-dependent. At MA = 1 kg/t, the improvement over Na2S alone was limited. When the MA dosage increased to 3 kg/t, the combined system mass recovered a Mo grade of 4.57% and a Mo recovery of 83.83%, approaching the performance of MA alone at the same dosage. When the MA dosage reached 5 kg/t, the combined system produced a Mo grade of 5.43% and a Cu recovery of 8.96%, which was essentially comparable to the results obtained with MA alone at 5 kg/t and clearly superior to those obtained with Na2S alone at 3 kg/t. Overall, these results indicate that MA alone can already achieve satisfactory Cu–Mo separation at suitable dosages, whereas the Na2S–MA combination may provide a limited, dosage-dependent adjustment under the tested conditions.
A possible explanation is that the combination effect is not necessarily limited to the action of the two reagents on different surface states or different copper-bearing species. Another possibility is that Na2S and MA differ substantially in molecular size and chemical nature: Na2S is a small inorganic depressant, whereas MA is a sulfur-containing organic molecule with a larger molecular size and more complex functional groups. Such differences may lead to distinct transport, adsorption, and surface-coverage behaviors at the mineral interface. In addition, the combined use of inorganic and organic depressants may produce cooperative effects in practical flotation systems, thereby improving the overall separation performance under suitable reagent ratios. However, as noted above, the detailed basis of this Na2S–MA combination effect remains a preliminary interpretation at the present stage and requires further dedicated investigation to be fully verified.

3.5. FT-IR Spectral Analysis

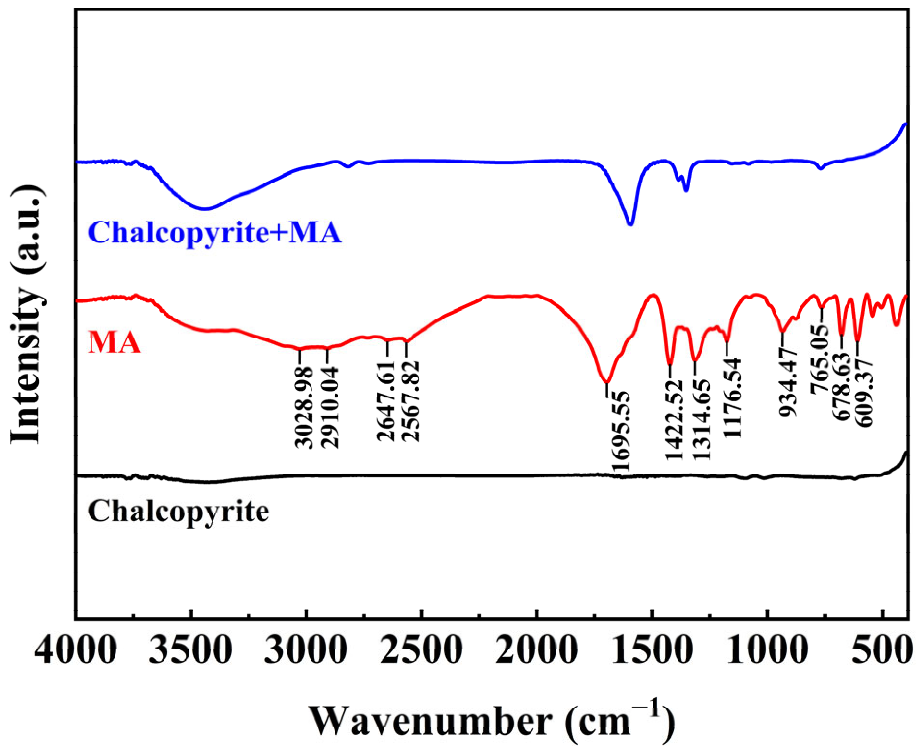
Figure 9 shows the FT-IR spectra of MA, untreated chalcopyrite, and chalcopyrite after MA treatment. Table 7 lists the characteristic peaks of MA, which contains carboxyl (-COOH) and thiol (-SH) functional groups. As seen in the figure, significant changes are observed in the infrared spectrum of chalcopyrite after treatment with MA. The broad absorption peak at 3343.66 cm−1 may be attributed to hydrogen bonding, or coordination interaction between the carboxyl group of the MA and the mineral surface, suggesting the presence of strong hydrogen-bonding or hydration-related effects. The bands at 2818.75 cm−1 and 2729.45 cm−1 may correspond to overlapping stretching vibrations of O-H, C-H, and S-H groups. The absorption bands at 1591.55 and 1384.76 cm−1 are assigned to carboxyl-related vibrations, while the band at 1352.38 cm−1 indicates strengthened C-O vibration. These features collectively suggesting that the carboxyl group participates in the interaction between MA and chalcopyrite. Additionally, the S-H absorption band at 2567.82 cm−1 in MA disappears after adsorption, suggesting that the thiol group may have undergone deprotonation and subsequently interacted with metal sites on the mineral surface. The redshift observed in the MA-related peaks after adsorption further supports the adsorption of MA on the chalcopyrite surface.

3.6. XPS Spectral Analysis

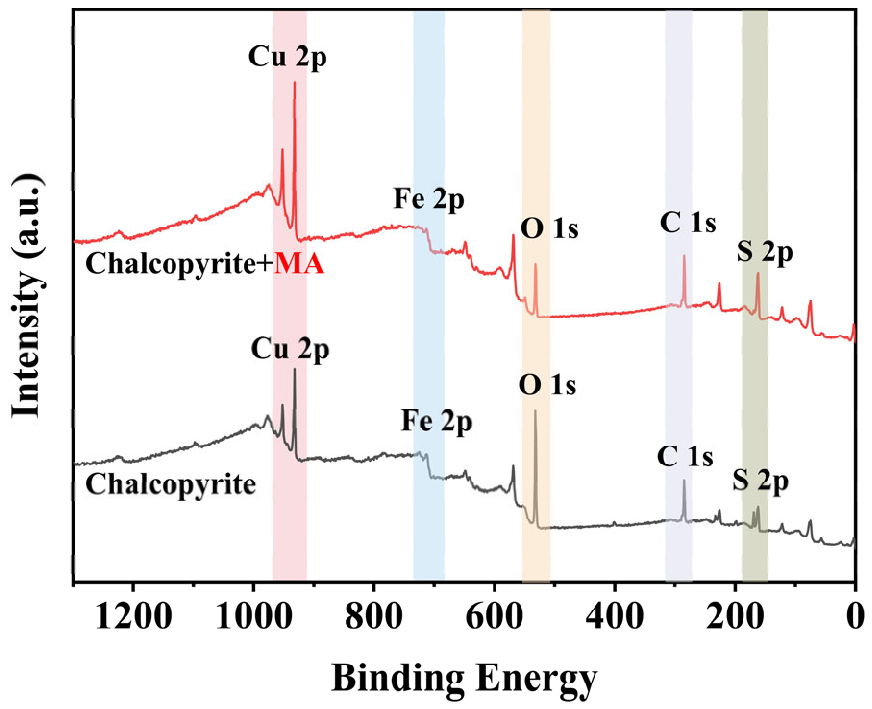
Figure 10 presents the XPS survey spectra of the chalcopyrite surface before and after MA treatment, and Table 8 summarizes the corresponding surface elemental compositions. After MA treatment, the relative surface atomic concentrations of C, Cu, and S increased by 6.45%, 5.42%, and 5.39%, respectively, whereas Fe remained essentially unchanged and O decreased by 16.42%. These variations indicate that MA was involved in interfacial interactions on chalcopyrite and caused a redistribution of the relative surface elemental composition. The increases in C and S suggest the presence of MA-derived organic species on the chalcopyrite surface, while the increase in Cu together with the nearly unchanged Fe content implies that the reagent may preferentially interact with Cu-related active sites. The decrease in the relative O content suggests that the surface composition was restructured after MA treatment. Therefore, the survey XPS results mainly provide overall evidence for surface compositional change after MA adsorption, whereas the variations in oxygen-containing species and surface hydrophilicity should be interpreted in combination with the high-resolution O 1s, S 2p, and C 1s spectra.
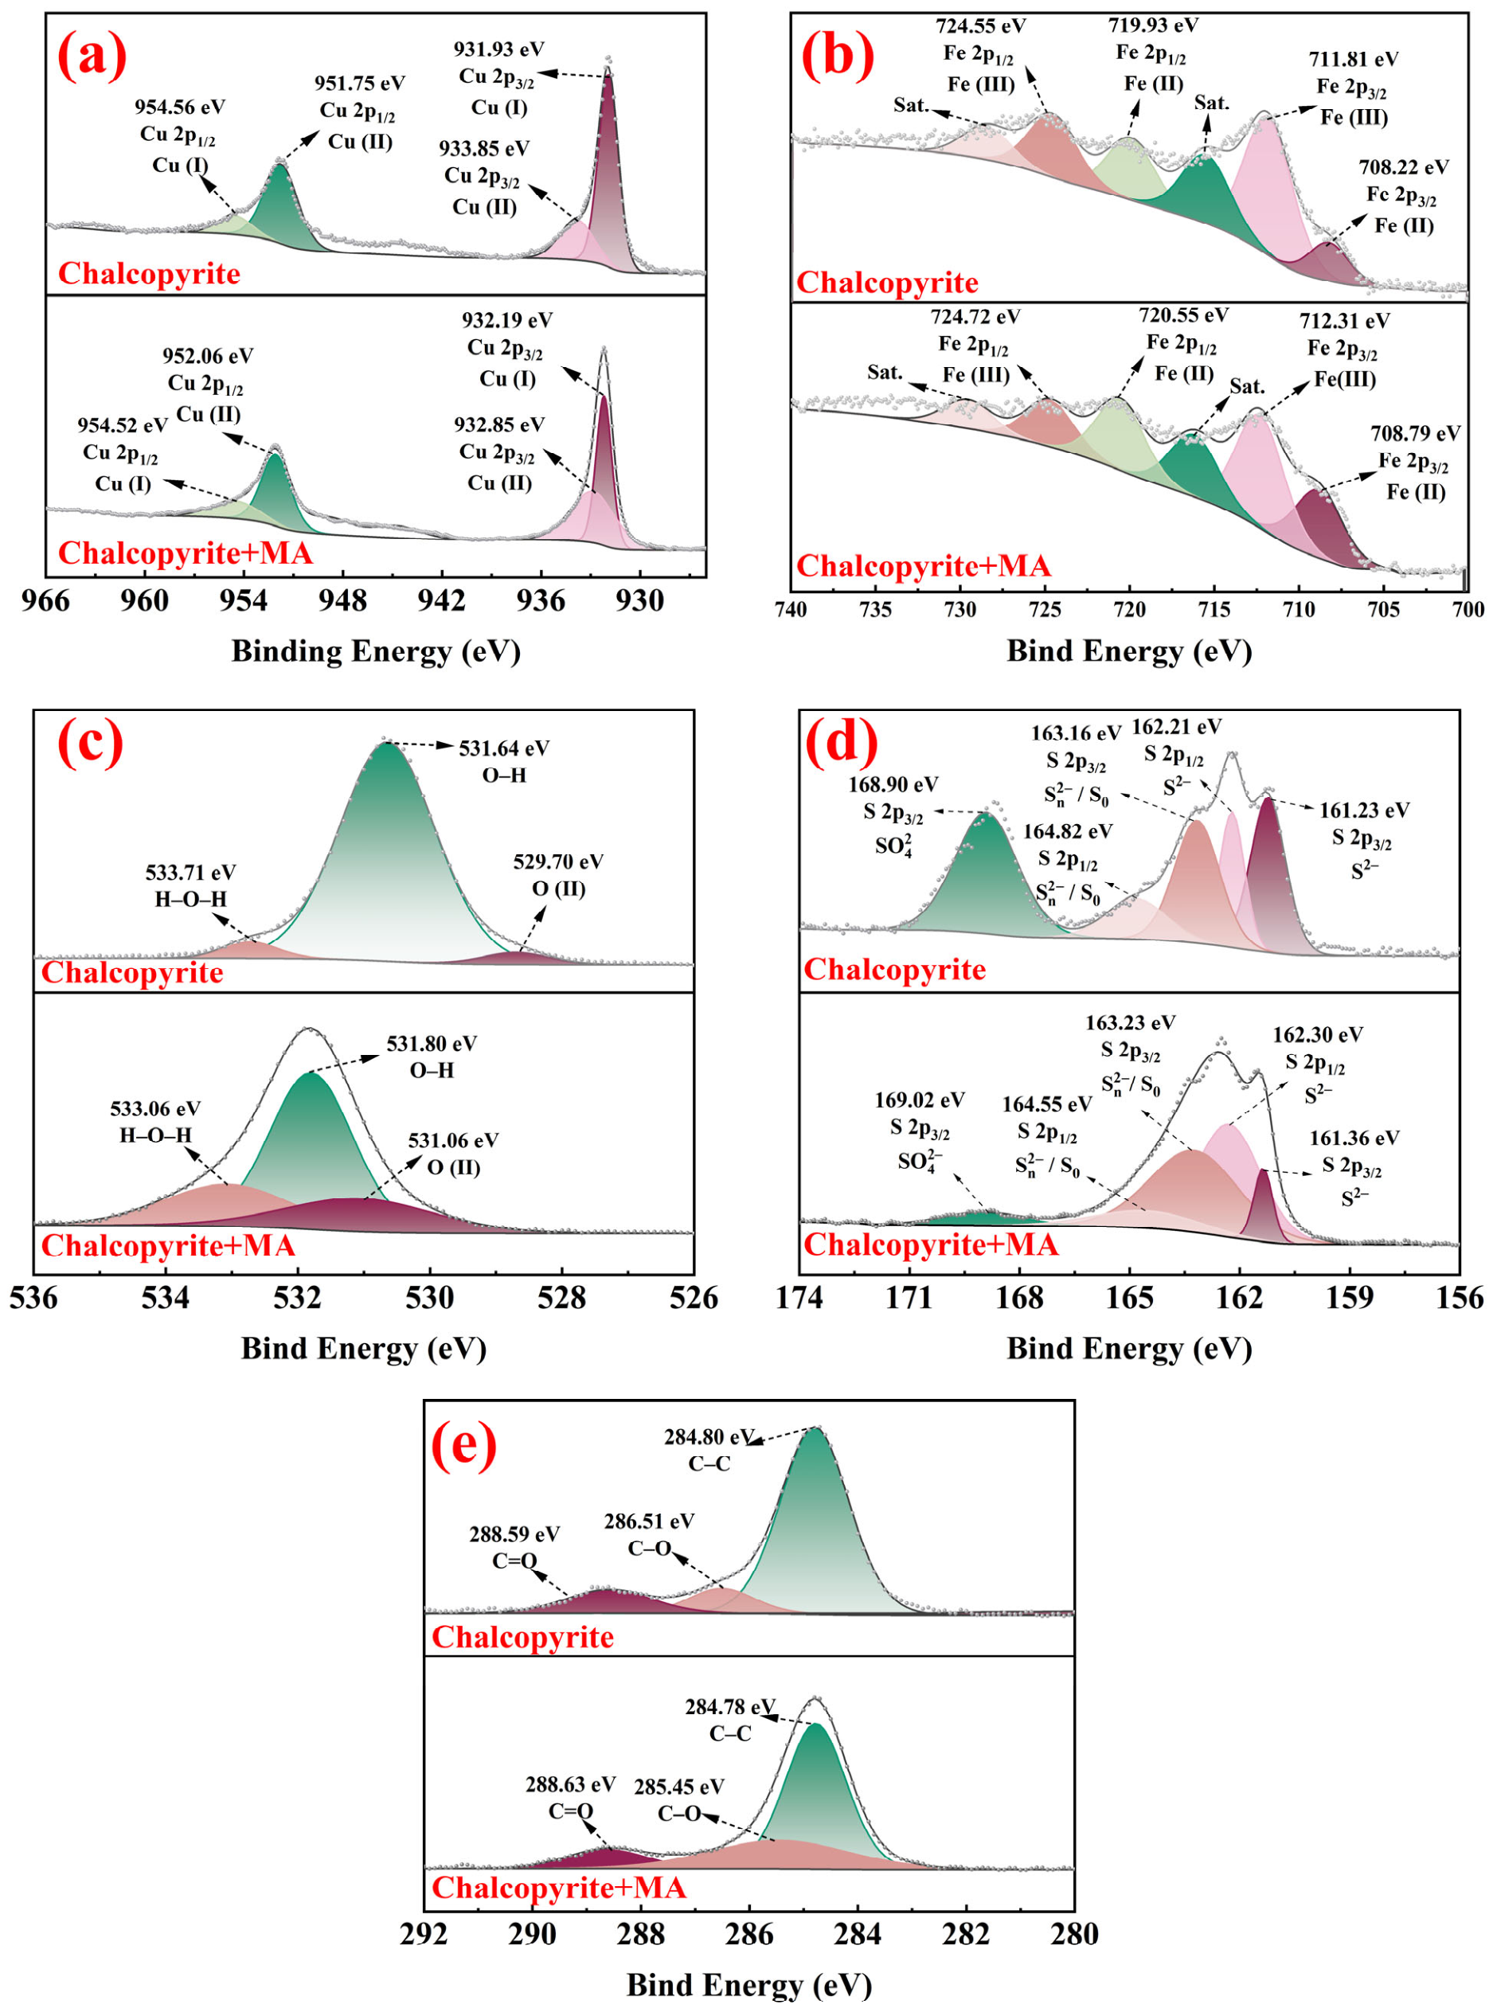
To further clarify the depression mechanism of MA, high-resolution XPS spectra of Cu 2p, Fe 2p, O 1s, S 2p, and C 1s for chalcopyrite before and after treatment were analyzed (Figure 11). Combined with the area-ratio variations summarized in Table 8, the following discussion focuses mainly on Cu 2p, O 1s, S 2p, and C 1s, which showed the most pronounced changes, while Fe 2p is used as supporting evidence.
As shown in Figure 11a, the untreated sample exhibits two spin–orbit doublets in the Cu 2p region [65]. The peaks at 931.93 eV and 933.85 eV correspond to Cu (I) and Cu (II) components of Cu 2p3/2, while the Cu (I) and Cu (II) components of Cu 2p1/2 appear at 951.75 eV and 954.56 eV, respectively. After MA treatment, the Cu (I) and Cu (II) peaks in Cu 2p3/2 shift to 932.19 eV (Δ = +0.26 eV) and 932.85 eV (Δ = −1.00 eV), and the Cu (I) and Cu (II) peaks in Cu 2p1/2 shift to 954.52 eV (Δ = −0.04 eV) and 952.06 eV (Δ = +0.31 eV). Specifically, the concentration of Cu 2p3/2 increased from 3.7% to 3.84%, and Cu 2p1/2 increased from 2.65% to 3.83%. This indicates that the reagent may enhance the Cu oxidation or expose Cu on the surface, thereby improving flotation performance. The treatment likely leads to changes in the oxidation state of Cu, potentially increasing the surface Cu content and surface activity. The pronounced peak shifts suggest strong interactions between MA and surface Cu sites, likely arising from coordination or electron donation of thiol or carboxyl groups to Cu.
Figure 11b shows that, for the untreated sample, the Fe 2p3/2 peaks at 708.22 eV and 711.81 eV are assigned to Fe (II) and Fe (III), while the Fe 2p1/2 peaks at 719.93 eV and 724.55 eV are also attributed to Fe (II) and Fe (III), respectively. After treatment, the Fe (II) and Fe (III) components in Fe 2p3/2 appear at 708.79 eV and 712.31 eV, and those in Fe 2p1/2 appear at 720.55 eV and 724.72 eV, representing positive shifts of 0.57 eV, 0.50 eV, 0.62 eV, and 0.17 eV, respectively. The increased binding energies imply a decrease in electron density at Fe sites, suggesting that Fe species were also affected after MA treatment. The concentration of Fe 2p3/2 (Fe (III)) decreased from 2.28% to 1.07%, and Fe 2p1/2 (Fe (II)) decreased from 1.01% to 0.73%. These changes suggest that the reagent treatment reduces the oxidation state of iron on the chalcopyrite surface, potentially suppressing the influence of iron ions on the surface, thereby improving Cu–Mo separation. However, compared with the Cu, O, and S spectra, the Fe-related changes were less diagnostic and are therefore regarded as supporting evidence only.
As shown in Figure 11c, the O 1s spectrum of pristine chalcopyrite can be deconvoluted into components at 529.70 eV (lattice oxygen, O2−), 531.64 eV (O-H), and 533.71 eV (H-O-H, adsorbed water). After treatment, the peak areas associated with H-O-H and O2−) increase markedly, and their binding energies increase by 1.36 eV and 1.42 eV, respectively, whereas the relative contribution of the O-H component decreases. The overall increase in O 1s binding energy indicates that MA promotes surface hydration and strengthens the hydrophilic character of chalcopyrite. The O 1s spectra show a significant reduction in surface O content after reagent treatment. The concentration of O-H bonds decreased from 30.88% to 8.97%, and O (II) decreased from 1.12% to 0.46%. These changes suggest that the reagent treatment may remove the hydration layer or oxide layer on the surface, thereby increasing the hydrophobicity of the mineral and making it more suitable for flotation.
Figure 11d indicates three characteristic S 2p doublets for the untreated chalcopyrite: S2− (S 2p3/2 at 161.23 eV and S 2p1/2 at 162.21 eV), Sn2−/S0 (S 2p3/2 at 163.16 eV and S 2p1/2 at 164.82 eV), and SO42− (S 2p3/2 at 168.90 eV). After adsorption, the S2− peaks shift to 161.36 eV and 162.30 eV (Δ = +0.13 and +0.09 eV), the Sn2−/S0 peaks shift to 163.23 eV (Δ = +0.07 eV) and 164.55 eV (Δ = −0.27 eV), and the SO42− peak shifts to 169.02 eV (Δ = +0.12 eV). The overall changes in binding energy suggest that the sulfur species on the chalcopyrite surface were affected after MA treatment. Specifically, the concentration of S 2p3/2 increased from 4.07% to 9.06%, and S 2p1/2 increased from 2.53% to 9.21%. Additionally, the concentration of SO42− decreased by 4%. These results suggest that the reagent treatment alters the distribution of S on the chalcopyrite surface, reducing the presence of S and potentially increasing the hydrophilicity of the surface sulfur.
As shown in Figure 11e, the C 1s spectrum of the untreated sample contains components at 284.80 eV (C-C), 286.51 eV (C-O), and 288.59 eV (C=O). After MA treatment, the C-O and C=O components shift to 285.45 eV and 288.63 eV, respectively. The strengthened C-O contribution together with the pronounced negative shift (Δ = −1.06 eV) indicates enrichment of carboxyl-related species on the chalcopyrite surface, supporting effective adsorption of MA and suggesting that the molecule participates in surface interactions via -COOH or -COO through complexation with metal sites and hydrogen bonding.
Taken together, the XPS results support the following possible mechanism for the depression of chalcopyrite by MA. MA contains both carboxyl (-COOH) and thiol (-SH) groups; under flotation conditions, the thiol group may deprotonate to form a thiolate species (-S), which can preferentially chemisorb onto surface metal active sites on chalcopyrite. In parallel, deprotonation of the carboxyl groups produces carboxylate (-COO), which may cooperate with the sulfur-containing site to strengthen and stabilize adsorption. This chemisorption alters the surface charge distribution and favors the formation, and accumulation of oxygen-bearing species, thereby promoting the development of a hydrophilic surface layer. The resulting hydrophilic surface layer depresses collector adsorption and weakens bubble–particle attachment, thereby reducing surface hydrophobicity and floatability and contributing to the selective depression of chalcopyrite.

3.7. Molecular Structure of MA

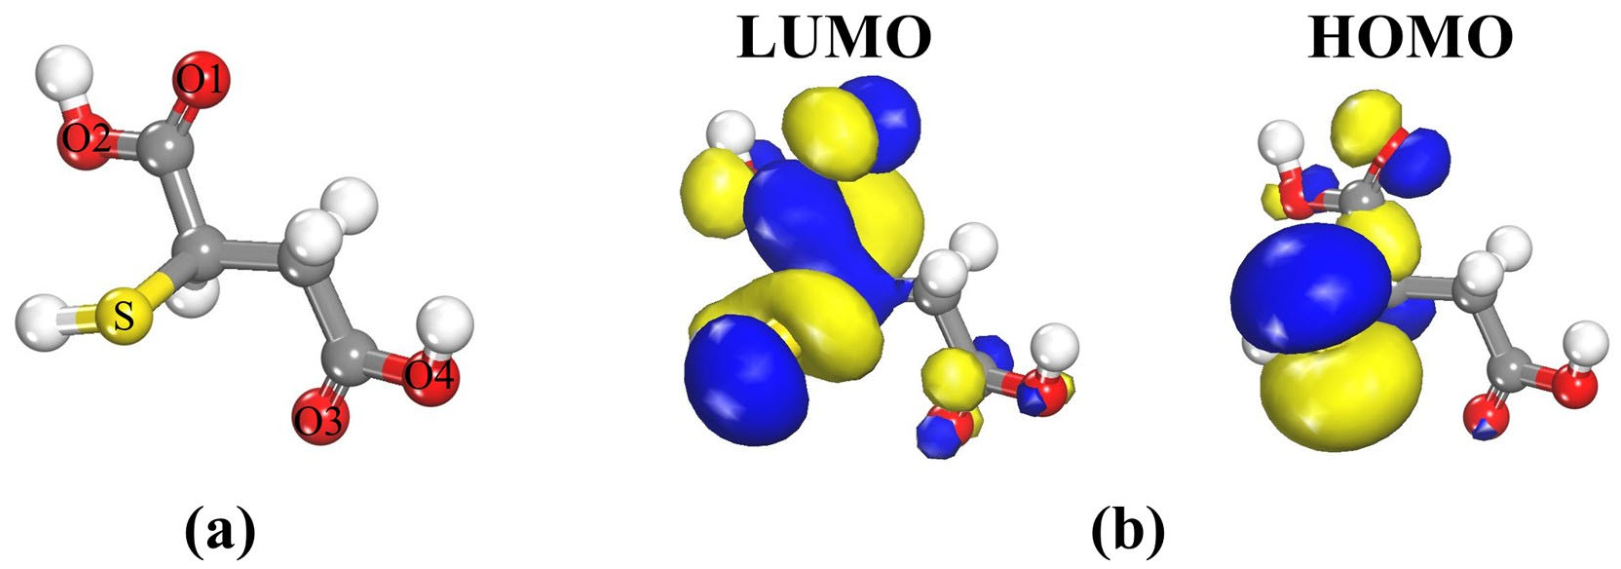
Frontier molecular orbital (FMO) theory suggests that a molecule’s reactivity is largely governed by its highest occupied molecular orbital (HOMO) and lowest unoccupied molecular orbital (LUMO). In this framework, the HOMO is commonly associated with electron-donating ability, whereas the LUMO reflects the ability to accept electron density. The optimized molecular configuration of MA and the corresponding frontier molecular orbital distributions are depicted in Figure 12. The HOMO electron density is mainly localized on the S atom and the O1 atom and shows pronounced π-character, implying that these sites possess strong electron-donating capability and are therefore favorable for forming a bidentate adsorption configuration with surface metal active sites on chalcopyrite. Surface metal cations on chalcopyrite typically carry positive charge, and their d orbitals can participate in orbital interactions. Notably, the LUMO associated with the S site exhibits predominant σ-type character, while the LUMO contribution on O1 displays π-type character. Accordingly, the S center can accept electron density from the metal d-orbitals to form coordination interactions with predominant σ character, whereas the O1 center may establish coordination with π character [66]. Overall, these orbital features support a plausible chemisorption pathway in which MA binds to chalcopyrite through bidentate coordination involving S and O atoms.
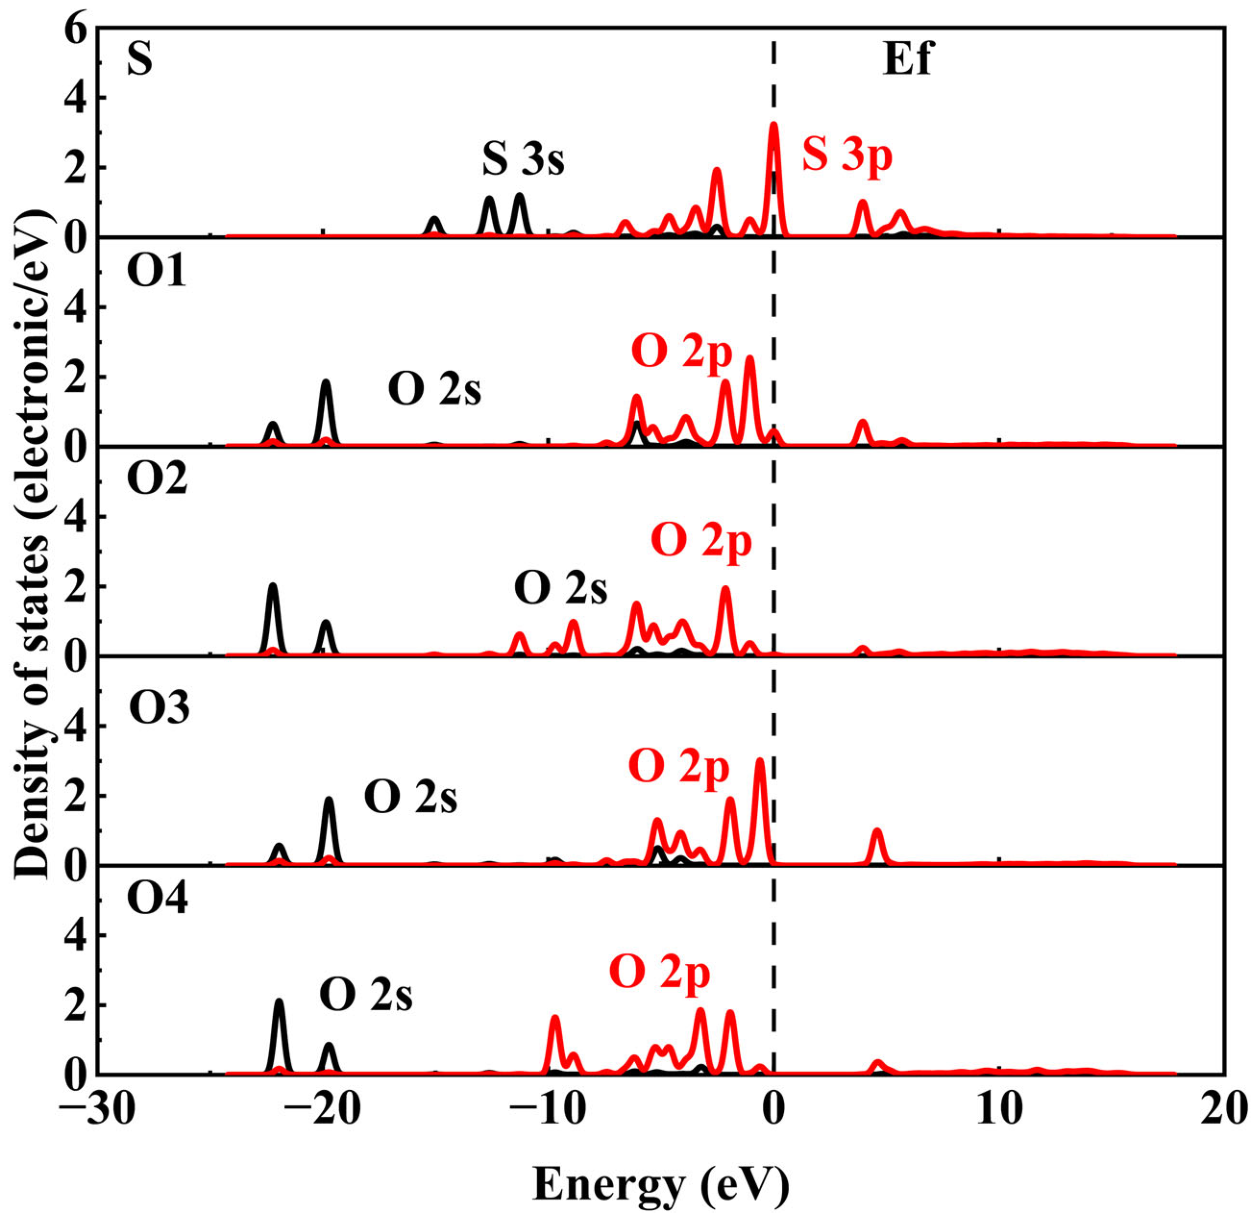
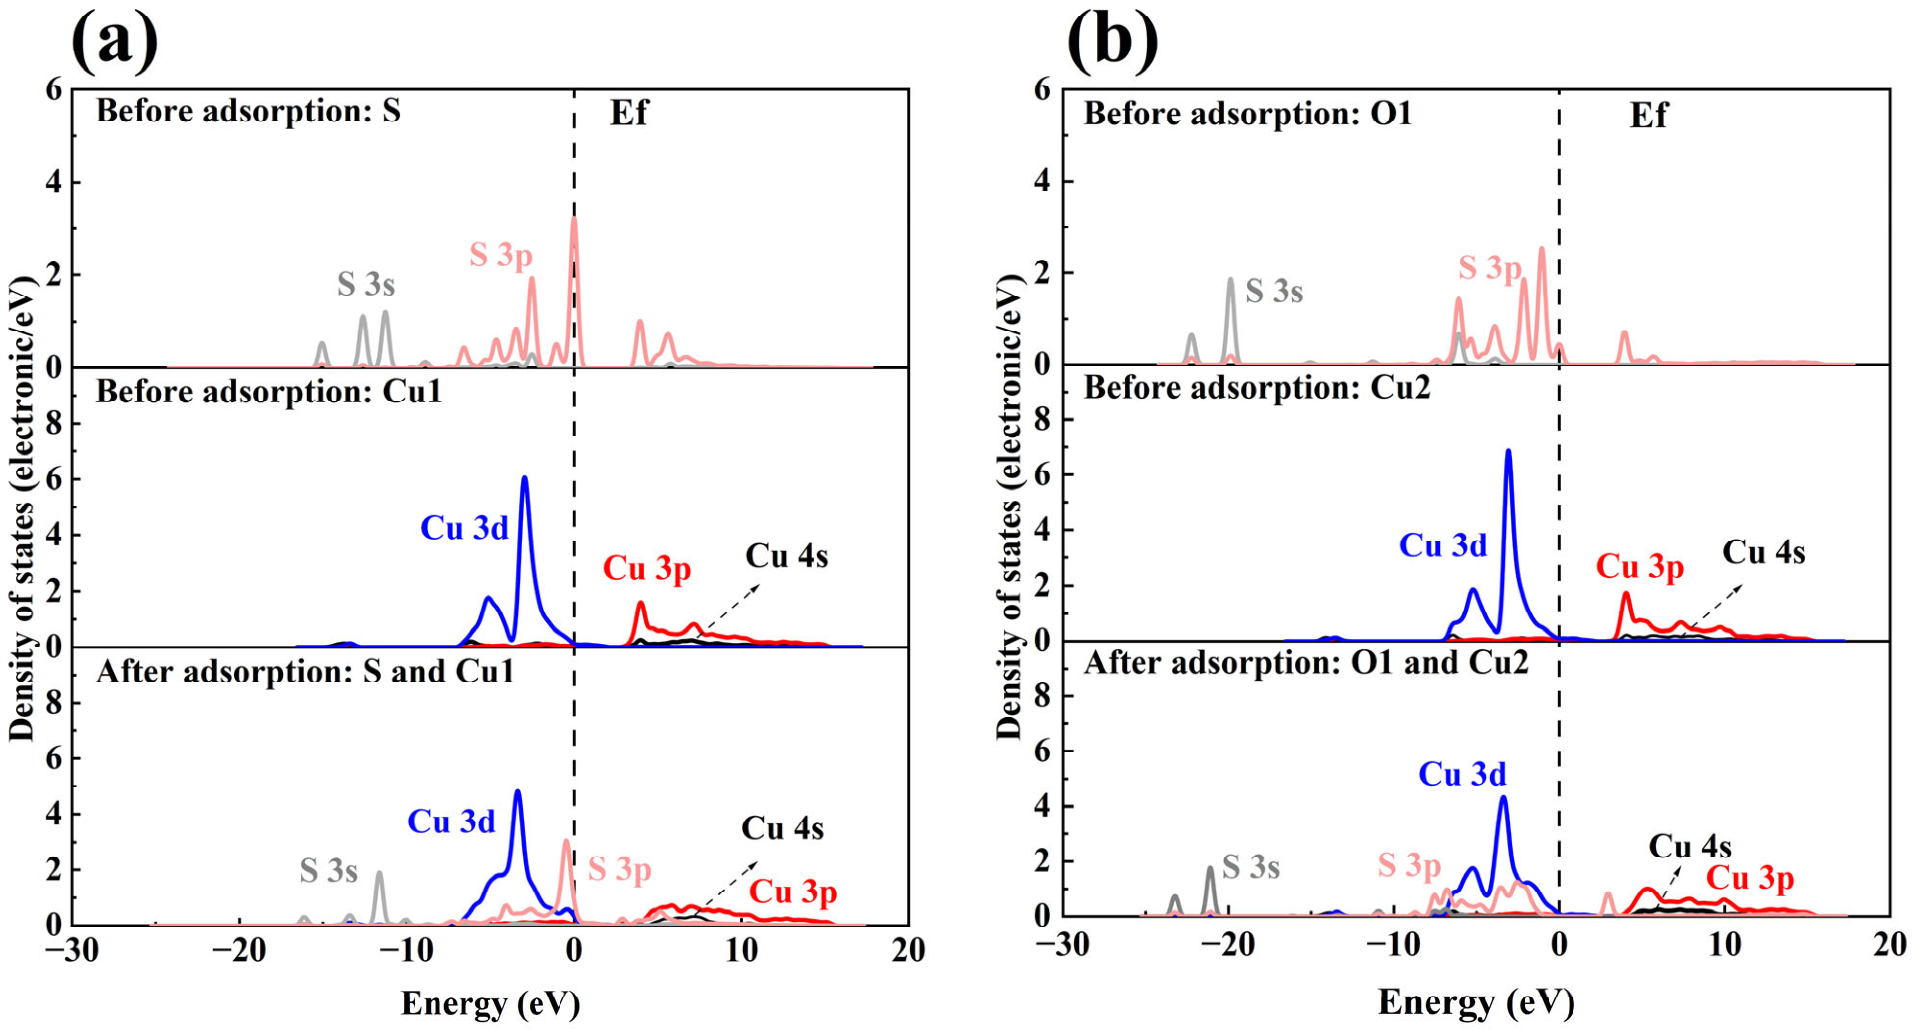
Figure 13 shows the projected density of states (PDOS) for the reactive atoms in MA. The S 3p states exhibit the highest intensity in the vicinity of the Fermi level (Ef), indicating that sulfur is the primary reactive site. The O1 and O3 2p PDOS curves cross Ef, and their peak intensities are higher than those of O2 and O4, suggesting that the carbonyl oxygens are more prone to interact with surface metal sites. Moreover, relative to O3, the O1 2p states are more intense and closer to Ef, implying higher electronic activity. In addition, O1 is spatially closer to S, which is favorable for cooperative bidentate binding. Taken together, S and O1 are regarded as the dominant active sites responsible for interfacial interaction with chalcopyrite.
Table 9 Summarizes the calculated Mulliken charges and Fukui indices for MA. Because chalcopyrite surface metal centers are generally positively charged, they preferentially interact with atoms of stronger electron-donating character. Fukui functions quantify the sensitivity of electron density to electron addition or removal, thereby reflecting the susceptibility of atomic sites to nucleophilic (f+) and electrophilic (f) attack. The results show that the S and O atoms carry negative charges, with sulfur displaying the strongest nucleophilicity, followed by O1; O2, O3, and O4 exhibit comparatively weaker indices. These findings consistently suggest that S and O1 are the most favorable adsorption centers for MA on the chalcopyrite surface.

3.8. Adsorption of MA on the Chalcopyrite Surface

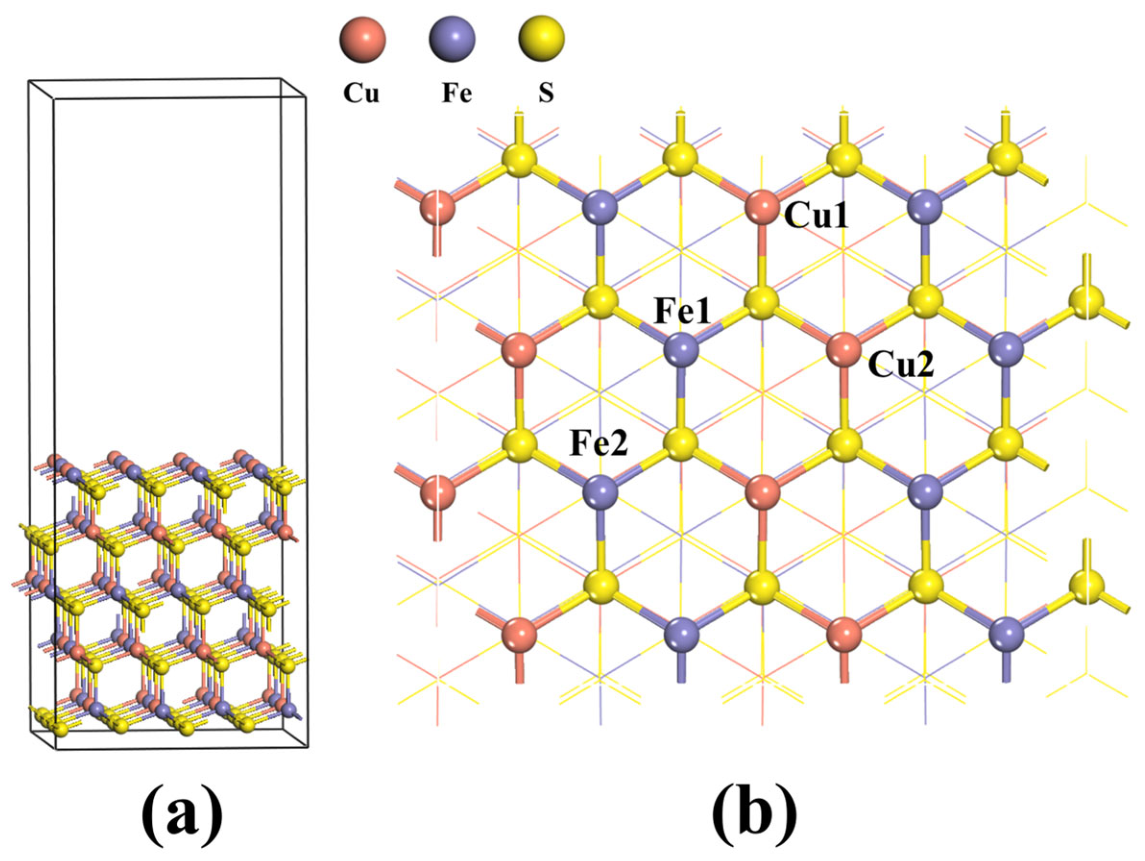
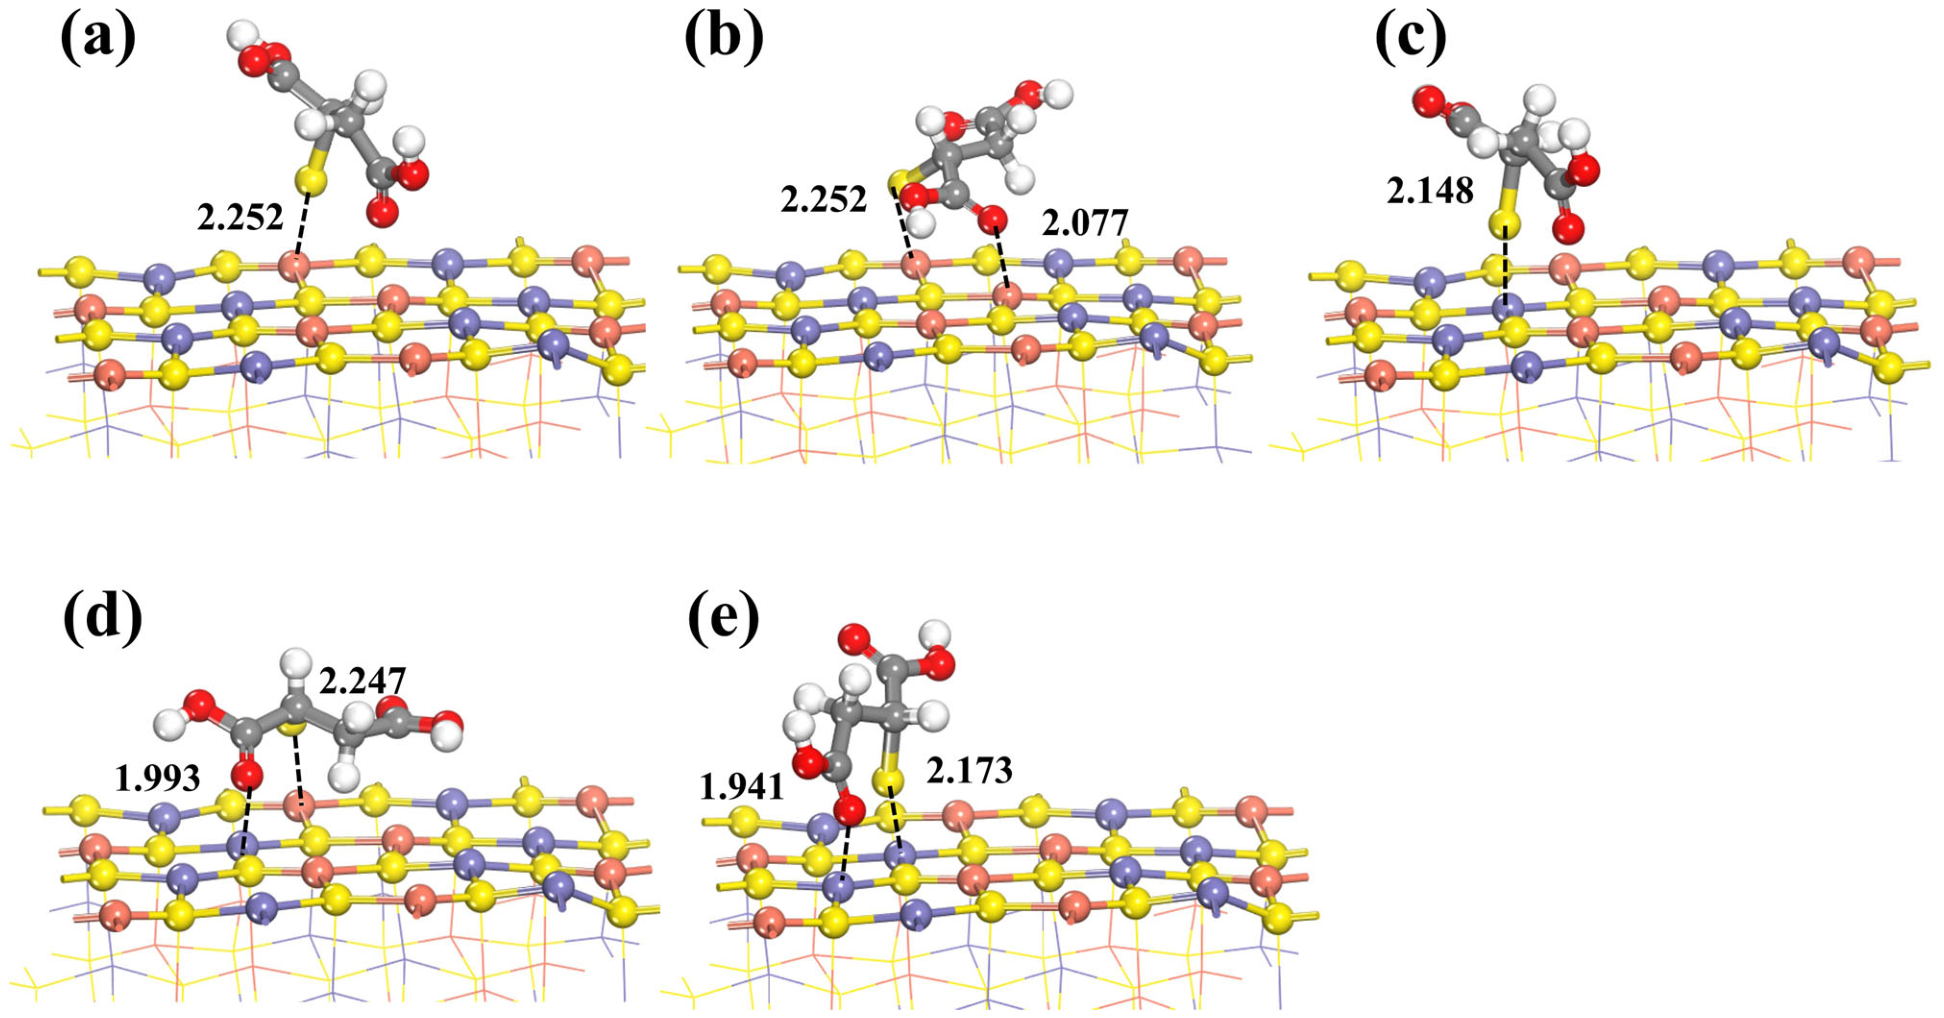
The adsorption mechanism of MA on chalcopyrite was investigated using the SCC-DFTB calculations. Figure 14 illustrates the optimized slab model of the chalcopyrite (112) surface together with the schematic representation of the adsorption sites. Four surface metal centers, Cu1, Cu2, Fe1, and Fe2 were identified as potential reactive sites on the chalcopyrite (112) plane. To simulate the interactions of MA with different surface sites, five representative adsorption configurations were constructed and optimized (Figure 15). The corresponding adsorption energies of MA at these sites are summarized in Table 10.
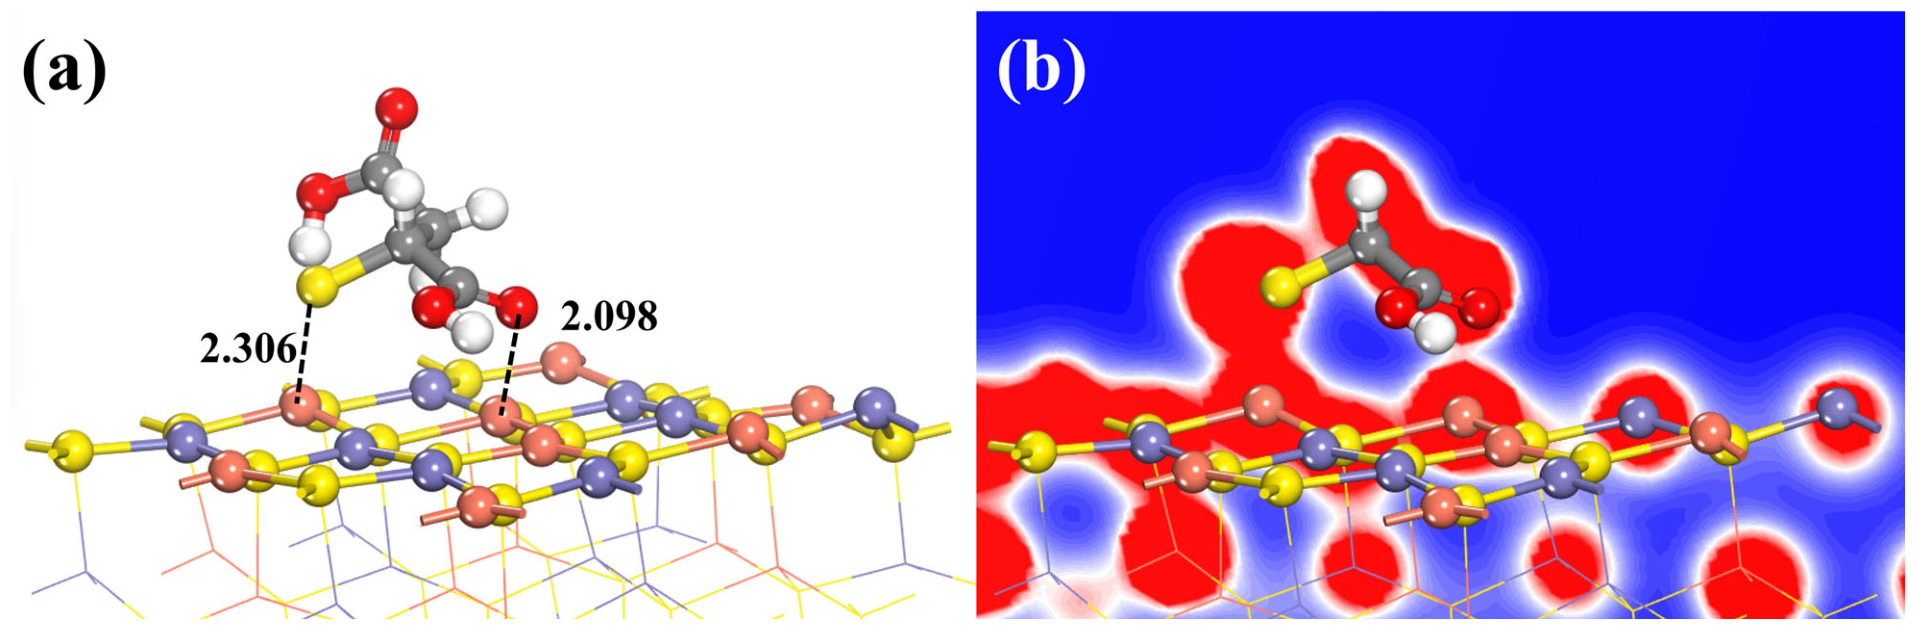
As summarized in Table 10, all calculated adsorption energies are negative, indicating that the adsorption of MA on the chalcopyrite surface is exothermic and thermodynamically favorable. Moreover, the bidentate configurations generally exhibit more negative adsorption energies than the corresponding monodentate ones, in agreement with the frontier molecular orbital analysis. Among the tested configurations, the adsorption energy for binding through S–Cu1 and O1–Cu2 is the lowest, suggesting that S and O1 are the preferred adsorption centers of MA on chalcopyrite.
Figure 16a shows the optimized adsorption geometry of MA on the chalcopyrite surface. During adsorption, deprotonation is proposed to occur at the sulfur site, followed by coordination between the S atom and surface Cu atoms. The resulting S–Cu1 and O1–Cu2 bond lengths are 2.306 Å and 2.098 Å, respectively, which are sufficiently short to indicate the formation of interfacial bonds between the S or O1 atoms of MA and surface Cu atoms. Figure 16b presents the electron density distribution after adsorption. A pronounced overlap of electron clouds is observed between S and Cu1 as well as between O1 and Cu2, supporting strong interfacial interactions with covalent character. The adsorption energy reaches −284.69 kJ/mol, which is likely associated with the chelating (bidentate) coordination of the thiol and carboxyl groups.
Figure 17 compares the projected density of states (PDOS) of the interacting atoms before and after adsorption. Upon adsorption, the S 3p and O1 2p states shift toward lower energies and become broadened, and they overlap substantially with the Cu 3d states of the chalcopyrite surface, indicating pronounced orbital hybridization accompanied by charge redistribution. Meanwhile, the Cu 3d features decrease in intensity and spread over a wider energy range, implying enhanced electron delocalization that contributes to the stabilization of the adsorbed system. Notably, the hybridized states associated with the S–Cu1 interaction extend to and intersect the Fermi level, whereas those related to O1–Cu2 shift downward and do not cross the Fermi level. This difference suggests that the S–Cu linkage is more prone to interfacial charge transfer and is electronically more active than the O1–Cu interaction.
Mulliken population analysis (Table 11) further supports directional charge transfer upon adsorption. After binding, the Mulliken charges on S and Cu2 increase by 0.047 and 0.110, respectively, while those on O1 and Cu1 decrease by 0.037 and 0.110, respectively. These trends indicate a net electron redistribution involving transfer from S toward Cu1 and from Cu2 toward O1, consistent with a directed interfacial charge-transfer process between the reactive atoms of MA and surface Cu sites. Collectively, the electronic-structure evidence suggests that MA adsorption on chalcopyrite is dominated by chemisorption rather than weak physical adsorption.
The DFTB calculations were performed on an idealized surface model without interfacial water, surface hydration, OH, and other dissolved species. Accordingly, the computed adsorption results are interpreted as mechanistic trends under the modeled conditions and are used only to support the experimental observations rather than to directly represent the flotation pulp environment.


4. Conclusions

This study comparatively evaluated five sulfur-containing organic depressants for the flotation separation of chalcopyrite and molybdenite. The results indicate that thiomalic acid (MA), a mercaptocarboxylic-acid-type depressant, showed relatively favorable selectivity toward chalcopyrite under the tested conditions. Therefore, MA should be regarded as a promising candidate within the mercaptocarboxylic acid depressant family rather than as a completely new chalcopyrite depressant. The main findings are summarized as follows:
(1)
Using pure chalcopyrite and molybdenite minerals, the effects of five depressants on flotation behavior were systematically evaluated. MA, 4-hydroxythiobenzamide, and 6-methyl-2-thiouracil significantly suppressed chalcopyrite flotation, whereas 2-(methylthio)acetic acid and N-phenylthiourea showed only minor influence on chalcopyrite recovery. In contrast, the floatability of molybdenite was scarcely affected by any of the five reagents. The results of the artificial mixed-mineral flotation tests further demonstrate that MA and 4HT exhibit promising potential for Cu–Mo separation, while 6MST is not suitable for the current separation strategy.
(2)
Flotation tests on a practical Cu–Mo bulk concentrate indicate that MA exhibits promising selectivity toward chalcopyrite and can improve Cu–Mo separation performance. Compared with Na2S alone, MA showed a clear dosage advantage at low addition levels. Combined-reagent tests further showed that, under a fixed Na2S dosage, the addition of MA improved the separation indices. These results suggest that MA may function as a promising auxiliary organic depressant in practical Cu–Mo flotation, whereas Na2S remains necessary to achieve a satisfactory overall separation level under the tested conditions.
(3)
FT-IR, XPS, and SCC-DFTB calculations suggest that MA interacts strongly with the chalcopyrite surface and may depress chalcopyrite through chemisorption involving its sulfur- and oxygen-containing functional groups. Such interaction is likely to increase surface hydrophilicity and depresses collector attachment, thereby contributing to selective chalcopyrite depression. However, it should be noted that the current evidence remains partly indirect, and possible contributions from surface oxidation, hydration, and other interfacial processes cannot be fully excluded.
Although MA showed promising selective depressing ability under the tested conditions, its current reagent consumption may still limit direct industrial application. Therefore, further dosage optimization, economic evaluation, and validation using different ore samples and continuous flotation tests will be necessary.

Author Contributions

Conceptualization, J.C.; Software, L.L.; Validation, L.L.; Investigation, L.L.; Data curation, L.L.; Writing—original draft, L.L.; Writing—review & editing, J.C. and A.L.; Visualization, L.L.; Project administration, J.C.; Funding acquisition, J.C. All authors have read and agreed to the published version of the manuscript.

Funding

This research was funded by the Key Technologies Research and Development Program, grant number 2024YFC2909600; the Major Science and Technology Projects in Yunnan Province, grant number 202402AB080010; and the National Natural Science Foundation of China (NSFC), grant number 52374264. The APC was funded by the corresponding author.

Data Availability Statement

The original contributions presented in this study are included in the article. Further inquiries can be directed to the corresponding author.

Conflicts of Interest

The authors declare no conflict of interest.

References

  1. Dutta, S.K.; Lodhari, D.R. Extraction of Nuclear and Non-Ferrous Metals; Springer: Singapore, 2018. [Google Scholar]
  2. Lasheen, T.; El-Ahmady, M.; Hassib, H.; Helal, A. Molybdenum metallurgy review: Hydrometallurgical routes to recovery of molybdenum from ores and mineral raw materials. Miner. Process. Extr. Metall. Rev. 2015, 36, 145–173. [Google Scholar] [CrossRef]
  3. Yin, Z.; Xu, L.; He, J.; Wu, H.; Fang, S.; Khoso, S.A.; Hu, Y.; Sun, W. Evaluation of l-cysteine as an eco-friendly depressant for the selective separation of MoS2 from PbS by flotation. J. Mol. Liq. 2019, 282, 177–186. [Google Scholar] [CrossRef]
  4. Liu, G.-Y.; Lu, Y.-P.; Zhong, H.; Cao, Z.-F.; Xu, Z.-H. A novel approach for preferential flotation recovery of molybdenite from a porphyry copper–molybdenum ore. Miner. Eng. 2012, 36, 37–44. [Google Scholar] [CrossRef]
  5. Yi, G.; Macha, E.; Van Dyke, J.; Macha, R.E.; McKay, T.; Free, M.L. Recent progress on research of molybdenite flotation: A review. Adv. Colloid Interface Sci. 2021, 295, 102466. [Google Scholar] [CrossRef] [PubMed]
  6. Zhang, N.; Liu, W.; Liu, W.; Chen, X. Flotation separation of molybdenite from chalcopyrite using mechanically degraded polyacrylamide as a novel depressant. Colloids Surf. A Physicochem. Eng. Asp. 2022, 652, 129897. [Google Scholar] [CrossRef]
  7. Chen, J.; Wang, J.; Li, Y.; Liu, M.; Liu, Y.; Zhao, C.; Cui, W. Effects of surface spatial structures and electronic properties of chalcopyrite and pyrite on Z-200 selectivity. Miner. Eng. 2021, 163, 106803. [Google Scholar] [CrossRef]
  8. Zhao, Y.; Lyu, J.; Wu, W.; Liang, G.; Chen, L. Research progress in flotation separation technologies for copper–molybdenum ores. Conserv. Util. Miner. Resour. 2022, 42, 169–178. [Google Scholar] [CrossRef]
  9. Xu, L.; Wang, J.; Yu, D.; Chen, H.; Sun, C.; Liu, B.; Zhang, F. Current status of China’s molybdenum resource industry and recommendations for sustainable development. Resour. Ind. 2015, 17, 32–38. [Google Scholar] [CrossRef]
  10. Liu, Z.; Liu, D.; Liu, Y.; Xu, L.; Wen, S. Selective depressing of chalcopyrite and molybdenite flotation by captopril: Mechanisms and insights. Appl. Surf. Sci. 2025, 695, 162906. [Google Scholar] [CrossRef]
  11. Xiao, J.; Liu, G.; Zhong, H.; Huang, Y.; Cao, Z. The flotation behavior and adsorption mechanism of O-isopropyl-S-[2-(hydroxyimino) propyl] dithiocarbonate ester to chalcopyrite. J. Taiwan Inst. Chem. Eng. 2016, 71, 38–46. [Google Scholar] [CrossRef]
  12. Prasad, M.S. Reagents in the mineral industry—Recent trends and applications. Miner. Eng. 1992, 5, 279–294. [Google Scholar] [CrossRef]
  13. Poorkani, M.; Banisi, S. Industrial use of nitrogen in flotation of molybdenite at the Sarcheshmeh copper complex. Miner. Eng. 2005, 18, 735–738. [Google Scholar] [CrossRef]
  14. Lei, G.C. Experimental study on copper–molybdenum separation process of a copper–molybdenum ore. China Molybdenum Ind. 2004, 28, 4. [Google Scholar]
  15. Zhang, L.-R.; Feng, X. Flotation of Xinhua molybdenite using sodium sulfide as modifier. Trans. Nonferrous Met. Soc. China 2010, 20, 702–706. [Google Scholar] [CrossRef]
  16. Mehrabani, J.V.; Mousavi, S.M.; Noaparast, M. Evaluation of the replacement of NaCN with Acidithiobacillus ferrooxidans in the flotation of high-pyrite, low-grade lead–zinc ore. Sep. Purif. Technol. 2011, 80, 202–208. [Google Scholar] [CrossRef]
  17. Cao, Q.B.; Wen, S.M.; Li, C.X.; Bai, S.J.; Liu, D. Investigation on molybdenite separation from a complex sulfide ore. Adv. Mater. Res. 2013, 634, 3408–3411. [Google Scholar] [CrossRef]
  18. Liao, R.; Feng, Q.; Wen, S.; Liu, J. Flotation separation of molybdenite from chalcopyrite using ferrate (VI) as selective depressant in the absence of a collector. Miner. Eng. 2020, 152, 106369. [Google Scholar] [CrossRef]
  19. Suyantara, G.P.W.; Hirajima, T.; Miki, H.; Sasaki, K.; Yamane, M.; Takida, E.; Kuroiwa, S.; Imaizumi, Y. Selective flotation of chalcopyrite and molybdenite using H2O2 oxidation method with the addition of ferrous sulfate. Miner. Eng. 2018, 122, 312–326. [Google Scholar] [CrossRef]
  20. Hirajima, T.; Miki, H.; Suyantara, G.P.W.; Matsuoka, H.; Elmahdy, A.M.; Sasaki, K.; Imaizumi, Y.; Kuroiwa, S. Selective flotation of chalcopyrite and molybdenite with H2O2 oxidation. Miner. Eng. 2017, 100, 83–92. [Google Scholar] [CrossRef]
  21. Castellón, C.I.; Toro, N.; Gálvez, E.; Robles, P.; Leiva, W.H.; Jeldres, R.I. Froth Flotation of Chalcopyrite/Pyrite Ore: A Critical Review. Materials 2022, 15, 6536. [Google Scholar] [CrossRef] [PubMed]
  22. Hu, J.; Zi, F.; Tian, G. Extraction of copper from chalcopyrite with potassium dichromate in 1-ethyl-3-methylimidazolium hydrogen sulfate ionic liquid aqueous solution. Miner. Eng. 2021, 172, 107179. [Google Scholar] [CrossRef]
  23. Chen, Y.; Chen, X.; Peng, Y. The depression of molybdenite flotation by sodium metabisulphite in fresh water and seawater. Miner. Eng. 2021, 168, 106939. [Google Scholar] [CrossRef]
  24. Huang, Y.; Yao, J.; Yu, B.; Zhang, L.; Song, X.; Peng, W. Enhancing separation of chalcopyrite and molybdenite via ozone micro-nano bubble oxidation and flotation. Process Saf. Environ. Prot. 2025, 197, 107064. [Google Scholar] [CrossRef]
  25. Yan, H.; Yang, B.; Zeng, M.; Huang, P.; Teng, A. Selective flotation of Cu–Mo sulfides using xanthan gum as a novel depressant. Miner. Eng. 2020, 156, 106486. [Google Scholar] [CrossRef]
  26. Miki, H.; Hirajima, T.; Muta, Y.; Suyantara, G.P.W.; Sasaki, K. Effect of Sodium Sulfite on Floatability of Chalcopyrite and Molybdenite. Minerals 2018, 8, 172. [Google Scholar] [CrossRef]
  27. Semoto, Y.; Suyantara, G.P.W.; Miki, H.; Sasaki, K.; Hirajima, T.; Tanaka, Y.; Aoki, Y.; Ura, K. Effect of Sodium Metabisulfite on Selective Flotation of Chalcopyrite and Molybdenite. Minerals 2021, 11, 1377. [Google Scholar] [CrossRef]
  28. Wang, X.; Zhao, B.; Liu, J.; Zhu, Y.; Han, Y. Dithiouracil, a highly efficient depressant for the selective separation of molybdenite from chalcopyrite by flotation: Applications and mechanism. Miner. Eng. 2022, 175, 107287. [Google Scholar] [CrossRef]
  29. Xu, H.; Ye, T.; Zhang, X.; Lu, L.; Xiong, W.; Zhu, Y. Insights into the adsorption mechanism of N-thiourea-maleamic acid on chalcopyrite surface in the flotation separation of Cu–Mo sulfide ores. J. Mol. Liq. 2022, 350, 118554. [Google Scholar] [CrossRef]
  30. Guan, C.; Yin, Z.; Khoso, S.A.; Sun, W.; Hu, Y. Performance Analysis of Thiocarbonohydrazide as a Novel Selective Depressant for Chalcopyrite in Molybdenite-Chalcopyrite Separation. Minerals 2018, 8, 142. [Google Scholar] [CrossRef]
  31. Yin, Z.; Sun, W.; Hu, Y.; Zhang, C.; Guan, Q.; Zhang, C. Separation of Molybdenite from Chalcopyrite in the Presence of Novel Depressant 4-Amino-3-thioxo-3,4-dihydro-1,2,4-triazin-5(2H)-one. Minerals 2017, 7, 146. [Google Scholar] [CrossRef]
  32. Zhang, X.; Lu, L.; Cao, Y.; Yang, J.; Che, W.; Liu, J. The flotation separation of molybdenite from chalcopyrite using a polymer depressant and insights to its adsorption mechanism. Chem. Eng. J. 2020, 395, 125137. [Google Scholar] [CrossRef]
  33. Yin, Z.; Sun, W.; Hu, Y.; Zhang, C.; Guan, Q.; Liu, R.; Chen, P.; Tian, M. Utilization of acetic acid-[(hydrazinylthioxomethyl)thio]-sodium as a novel selective depressant for chalcopyrite in the flotation separation of molybdenite. Sep. Purif. Technol. 2017, 179, 248–256. [Google Scholar] [CrossRef]
  34. Taheri, B.; Darvishnejad, M.H.; Rezaei, F. Depression Effect of Thioglycolic Acid (TGA) on Flotation Separation of Molybdenite from Copper Sulfides with different Collectors: An Experimental and Theoretical Study. Chem. Sel. 2022, 7, e202200026. [Google Scholar] [CrossRef]
  35. Qin, W.; Wu, J.; Jiao, F.; Zeng, J. Mechanism study on flotation separation of molybdenite from chalcocite using thioglycollic acid as depressant. Int. J. Min. Sci. Technol. 2017, 27, 1043–1049. [Google Scholar] [CrossRef]
  36. Li, M.-Y.; Wei, D.-Z.; Shen, Y.-B.; Liu, W.-G.; Gao, S.-L.; Liang, G.-Q. Selective depression effect in flotation separation of copper–molybdenum sulfides using 2,3-disulfanylbutanedioic acid. Trans. Nonferrous Met. Soc. China 2015, 25, 3126–3132. [Google Scholar] [CrossRef]
  37. Yan, H.; Yang, B.; Zhu, H.; Huang, P.; Hu, Y. Selective flotation of CuMo sulfides using dithiothreitol as an environmental-friendly depressant. Miner. Eng. 2021, 168, 106929. [Google Scholar] [CrossRef]
  38. Tang, M.; Chen, Y.; Feng, B.; Corin, K.C. Considering the mechanism of a depressant 2-Amino-5-mercapto-1,3,4-thiadiazole in the flotation of chalcopyrite and molybdenite. Colloids Surf. A Physicochem. Eng. Asp. 2023, 680, 132666. [Google Scholar] [CrossRef]
  39. Yin, Z.; Chen, S.; Xu, Z.; Zhang, C.; He, J.; Zou, J.; Chen, D.; Sun, W. Flotation separation of molybdenite from chalcopyrite using an environmentally-efficient depressant L-cysteine and its adsoption mechanism. Miner. Eng. 2020, 156, 106438. [Google Scholar] [CrossRef]
  40. Yang, B.; Yan, H.; Zeng, M.; Zhu, H. Tiopronin as a novel copper depressant for the selective flotation separation of chalcopyrite and molybdenite. Sep. Purif. Technol. 2021, 266, 118576. [Google Scholar] [CrossRef]
  41. Liao, X.J.; Mu, X. A Study on Dexing Copper-Molybdenum Flotation Separation with a New Low—Molewith Inhibitor. Adv. Mater. Res. 2011, 396–398, 867–871. [Google Scholar] [CrossRef]
  42. Zhong, C.; Feng, B.; Wang, H.; Chen, Y.; Guo, M. The depression behavior and mechanism of tragacanth gum on chalcopyrite during Cu–Mo flotation separation. Adv. Powder Technol. 2021, 32, 2712–2719. [Google Scholar] [CrossRef]
  43. Wang, C.; Liu, R.; Wu, M.; Xu, Z.; Tian, M.; Yin, Z.; Sun, W.; Zhang, C. Flotation separation of molybdenite from chalcopyrite using rhodanine-3-acetic acid as a novel and effective depressant. Miner. Eng. 2021, 162, 106747. [Google Scholar] [CrossRef]
  44. Gutierrez, L.; Uribe, L.; Hernandez, V.; Vidal, C.; Mendonça, R.T. Assessment of the use of lignosulfonates to separate chalcopyrite and molybdenite by flotation. Powder Technol. 2020, 359, 216–225. [Google Scholar] [CrossRef]
  45. Chen, J.-H.; Lan, L.-H.; Liao, X.-J. Depression effect of pseudo glycolythiourea acid in flotation separation of copper–molybdenum. Trans. Nonferrous Met. Soc. China 2013, 23, 824–831. [Google Scholar] [CrossRef]
  46. Yuan, D.; Cadien, K.; Liu, Q.; Zeng, H. Adsorption characteristics and mechanisms of O-Carboxymethyl chitosan on chalcopyrite and molybdenite. J. Colloid Interface Sci. 2019, 552, 659–670. [Google Scholar] [CrossRef]
  47. Dai, L.; Feng, B.; Tang, M.; Chen, Y. Effect and mechanism of environmentally friendly depressant 2, 4-Diamino-6-hydroxypyrimidine in separation of chalcopyrite and molybdenite. Process Saf. Environ. Prot. 2024, 187, 993–999. [Google Scholar] [CrossRef]
  48. Yin, Z.-G.; Sun, W.; Hu, Y.-H.; Guan, Q.-J.; Zhang, C.-H.; Gao, Y.-S.; Zhai, J.-H. Depressing behaviors and mechanism of disodium bis (carboxymethyl) trithiocarbonate on separation of chalcopyrite and molybdenite. Trans. Nonferrous Met. Soc. China 2017, 27, 883–890. [Google Scholar] [CrossRef]
  49. Hao, J.-M.; Liu, J.; Yu, Y.-L.; Gao, H.-L.; Qin, X.-Y.; Bai, X. Depressants for separation of chalcopyrite and molybdenite: Review and prospects. Miner. Eng. 2023, 201, 108209. [Google Scholar] [CrossRef]
  50. Huang, W.-X.; Tang, H.-H.; Cao, Y.; Liu, R.-H.; Sun, W. Separation of molybdenite from chalcopyrite with thiolactic acid depressant: Flotation behavior and mechanism. Trans. Nonferrous Met. Soc. China 2023, 33, 3157–3167. [Google Scholar] [CrossRef]
  51. Zhang, S.; Feng, Q.-C.; Wen, S.-M.; Xian, Y.-J.; Liu, J.; Liang, G.-Y. Flotation separation of chalcopyrite from molybdenite with sodium thioglycolate: Mechanistic insights from experiments and MD simulations. Sep. Purif. Technol. 2024, 342, 126958. [Google Scholar] [CrossRef]
  52. Mabudi, A.; Ahmadi, R. Mechanistic interpretation of thioglycolic acid as a depressant in the differential flotation of molybdenite from chalcopyrite. Mater. Chem. Phys. 2025, 342, 130964. [Google Scholar] [CrossRef]
  53. Du, Y.-X.; Lan, Z.-Y.; Li, H.; Pu, Z.-Y.; Hu, L.-T. Dimercaptosuccinic acid as an efficient depressant for the separation of molybdenite from chalcopyrite: Applications and mechanisms. Colloids Surf. A Physicochem. Eng. Asp. 2025, 726, 137781. [Google Scholar] [CrossRef]
  54. Pan, C.-L.; Wei, X.-X.; Zhang, X.-G.; Xu, Y.-W.; Xu, P.-F.; Luo, Y.-C. Mercapto-1,3,4-thiadiazol-2-yl)thio)acetic acid as a novel chalcopyrite depressant for selective flotation separation of molybdenite from chalcopyrite. Miner. Eng. 2022, 183, 107625. [Google Scholar] [CrossRef]
  55. Zhang, X.; Lu, L.; Luo, A.; Xiong, W.; Chen, J. Interface adsorption of 5-amino-1,3,4-thiadiazole-2-thiol on chalcopyrite surface as flotation depressant in Cu/Mo separation. Appl. Surf. Sci. 2022, 611, 155703. [Google Scholar] [CrossRef]
  56. Feng, Y.; Li, Z.; Chen, J.; Chen, Y. Effect of content and spin state of iron on electronic properties and floatability of iron-bearing sphalerite: A DFT+U study. Int. J. Min. Sci. Technol. 2023, 33, 1563–1571. [Google Scholar] [CrossRef]
  57. Luo, A.; Chen, J. Effect of hydration and hydroxylation on the adsorption of metal ions on quartz surfaces: DFT study. Appl. Surf. Sci. 2022, 595, 153553. [Google Scholar] [CrossRef]
  58. Zhang, Y.; Chen, J.; Li, Y.; Zhao, C.; Chen, Y. Application of a new self-consistent-charge density-functional tight-binding(SCC-DFTB) parameter set for simulating the adsorption of flotation reagents on the surface of typical lead minerals. Miner. Eng. 2024, 209, 108631. [Google Scholar] [CrossRef]
  59. Niehaus, T.A.; Elstner, M.; Frauenheim, T.; Suhai, S. Application of an approximate density-functional method to sulfur containing compounds. J. Mol. Struct. THEOCHEM 2001, 541, 185–194. [Google Scholar] [CrossRef]
  60. Chen, J.; Zhang, Y. Large system study of chalcopyrite and pyrite flotation surfaces based on SCC-DFTB parameterization method. Int. J. Min. Sci. Technol. 2025, 35, 1037–1055. [Google Scholar] [CrossRef]
  61. Knight, K.S.; Marshall, W.G.; Zochowski, S.W. The low-temperature and high-pressure thermoelastic and structural properties of chalcopyrite, CuFeS2. Can. Mineral. 2011, 49, 1015–1034. [Google Scholar] [CrossRef]
  62. de Oliveira, C.; de Lima, G.F.; de Abreu, H.A.; Duarte, H.A. Reconstruction of the Chalcopyrite Surfaces—A DFT Study. J. Phys. Chem. C 2012, 116, 6357–6366. [Google Scholar] [CrossRef]
  63. Pearce, C.I.; Pattrick, R.A.D.; Vaughan, D.J.; Henderson, C.M.B.; van der Laan, G. Copper oxidation state in chalcopyrite: Mixed Cu d9 and d10 characteristics. Geochim. Cosmochim. Acta 2006, 70, 4635–4642. [Google Scholar] [CrossRef]
  64. Perdew, J.P.; Wang, Y. Accurate and simple analytic representation of the electron-gas correlation energy. Phys. Rev. B 1992, 45, 13244–13249. [Google Scholar] [CrossRef] [PubMed]
  65. Liu, M.; Chen, J.; Chen, Y.; Zhu, Y. Interaction between smithsonite and carboxyl collectors with different molecular structure in the presence of water: A theoretical and experimental study. Appl. Surf. Sci. 2020, 510, 145410. [Google Scholar] [CrossRef]
  66. Chen, J.; Li, Y. Orbital symmetry matching study on the interactions of flotation reagents with mineral surfaces. Miner. Eng. 2022, 179, 107469. [Google Scholar] [CrossRef]
Figure 1. XRD patterns of the pure mineral samples: (a) Chalcopyrite; (b) Molybdenite.
Minerals 16 00535 g001
Figure 2. XRD pattern of the bulk Cu–Mo concentrate sample.
Minerals 16 00535 g002
Figure 3. Chemical structures of the five candidate depressants: (a) MA; (b) 6MAA; (c) 6MST; (d) 4HT; (e) NPT.
Minerals 16 00535 g003
Figure 4. Flowchart of the single-mineral flotation tests.
Minerals 16 00535 g004
Figure 5. Flowchart of the flotation tests using the actual ore.
Minerals 16 00535 g005
Figure 6. Effects of depressant dosage on the flotation behavior of single chalcopyrite and molybdenite under different depressant systems: (a) MA; (b) 6MAA; (c) 6MST; (d) 4HT; (e) NPT.
Minerals 16 00535 g006
Figure 7. Effect of pH on the flotation behavior of the minerals without adding the depressant.
Minerals 16 00535 g007
Figure 8. Effects of pH on the flotation behavior of single chalcopyrite and molybdenite under different depressant systems: (a) MA (4 × 10⁻⁴ mol/L), (b) 6MAA (8 × 10⁻⁴ mol/L), (c) 6MST (1 × 10⁻³ mol/L), (d) 4HT (1 × 10⁻³ mol/L), and (e) NPT (6 × 10⁻⁴ mol/L).
Minerals 16 00535 g008
Figure 9. FT-IR spectra of MA, MA-treated chalcopyrite, and untreated chalcopyrite.
Minerals 16 00535 g009
Figure 10. XPS survey spectra of chalcopyrite before and after treatment with MA.
Minerals 16 00535 g010
Figure 11. High-resolution XPS spectra of chalcopyrite with and without MA treatment: (a) Cu 2p; (b) Fe 2p; (c) O 1s; (d) S 2p; (e) C 1s.
Minerals 16 00535 g011
Figure 12. (a) Molecular structure of MA and (b) schematic illustration of its frontier molecular orbitals.
Minerals 16 00535 g012
Figure 13. Projected density of states (PDOS) of MA.
Minerals 16 00535 g013
Figure 14. (a) Unit-cell model of the chalcopyrite (112) surface and (b) schematic of the adsorption sites on the chalcopyrite (112) plane.
Minerals 16 00535 g014
Figure 15. Optimized adsorption configurations of MA on chalcopyrite at different surface sites: (a) S–Cu1; (b) S–Cu1 and O1–Cu2; (c) S–Fe1; (d) S–Cu1 and O1–Fe1; (e) S–Fe1 and O1–Fe2.
Minerals 16 00535 g015
Figure 16. Adsorption of MA on the chalcopyrite surface: (a) optimized adsorption geometry and (b) electron density distribution after adsorption.
Minerals 16 00535 g016
Figure 17. PDOS of the interfacial atoms before and after MA adsorption on chalcopyrite: (a) S–Cu1; (b) O1–Cu2.
Minerals 16 00535 g017
Table 1. Multi-element chemical analysis results of chalcopyrite and molybdenite samples.
ChalcopyriteElementCuFeSErCaZnSiOther-
Content (wt%)33.1031.9831.960.270.250.160.102.18-
MolybdeniteElementMoSBiPbRhSiFeAlOther
Content (wt%)58.6237.301.030.990.830.580.300.170.18
Table 2. Multi-element chemical composition of the practical Cu–Mo bulk concentrate sample.
ElementFeSCuSiAlKCaMg
Content (wt%)29.7024.8024.5010.704.282.031.460.82
ElementMoTiErZnPbPOther
Content (wt%)0.790.280.250.120.0060.0050.259
Table 3. Particle-size distribution of the practical Cu–Mo bulk concentrate sample.
Particle Size (mm)+150+106+74+58+45+38−38Total
Distribution (wt%)0.858.1121.1843.7571.2422.26.56100
Table 4. Effects of different depressant systems on the flotation behavior of the artificial Cu–Mo mixed minerals.
Reagent ConditionsProductMass Recovery (%)Grade (%)Recovery (%)
MoCuMoCu
In the absence of a depressantfeed100.0023.2417.53100.00100.00
Concentrate91.5025.1118.9898.8599.03
Tailing8.503.152.011.150.97
MA 4 × 10⁻⁴ mol/Lfeed100.0024.2916.92100.00100.00
Concentrate74.5027.4616.0184.2470.53
Tailing25.5015.01019.5515.7629.47
6MST 1 × 10⁻³ mol/Lfeed100.0023.2917.55100.00100.00
Concentrate18.5013.4025.4010.6526.77
Tailing81.5025.5315.7789.3573.23
4HT 1 × 10⁻³ mol/Lfeed100.0023.6517.48100.00100.00
Concentrate40.2035.6711.0960.6325.51
Tailing59.8015.5721.7739.3774.49
Note: Artificial mixed minerals were prepared at a mass ratio of 1:1 (chalcopyrite: molybdenite). Collector: kerosene, 20 mg/L; pH = 7.
Table 5. Effects of different depressant systems on the flotation behavior of the bulk Cu–Mo concentrate.
Reagent ConditionsProductMass Recovery (%)Grade (%)Recovery (%)
MoCuMoCu
In the absence of a depressantFeed100.000.6518.01100.00100.00
Concentrate13.540.6627.3213.7220.54
Tailing86.460.6516.5586.2879.46
Na2S (3 kg/t)Feed100.000.4820.75100.00100.00
Concentrate13.541.0925.4930.9816.63
Tailing86.460.3820.0169.0283.37
Na2S (5 kg/t)Feed100.000.6322.39100.00100.00
Concentrate25.472.1324.3186.2327.66
Tailing74.530.1221.7313.7772.34
Na2S (10 kg/t)Feed100.000.6222.06100.00100.00
Concentrate15.593.5522.7888.7516.09
Tailing84.410.0821.9311.2583.91
MA (1 kg/t)Feed100.000.4622.08100.00100.00
Concentrate8.483.7125.9668.409.97
Tailing91.520.1621.7231.6090.03
MA (3 kg/t)Feed100.000.8222.27100.00100.00
Concentrate13.545.1824.4186.0114.84
Tailing86.460.1321.9413.9985.16
MA (5 kg/t)Feed100.000.6322.63100.00100.00
Concentrate8.795.4524.5876.099.54
Tailing91.210.1722.4423.9190.46
MA (7 kg/t)Feed100.000.5722.46100.00100.00
Concentrate8.484.3424.9964.439.44
Tailing91.520.2222.2235.5790.56
4HT (5 kg/t)Feed100.000.6422.67100.00100.00
Concentrate34.670.5926.9031.5341.13
Tailing65.330.6720.4368.4758.87
6MST (5 kg/t)Feed100.000.6422.26100.00100.00
Concentrate30.950.4628.4722.1239.58
Tailing69.050.7219.4877.8860.42
Note: Flotation tests were conducted at pH 7 using kerosene (20 mg/L) as the collector. No frother was added.
Table 6. Effect of MA dosage at a fixed Na2S dosage on the flotation performance of the bulk Cu–Mo concentrate.
Reagent ConditionsProductMass Recovery (%)Grade (%)Recovery (%)
MoCuMoCu
Na2S (3 kg/t) + MA (1 kg/t)Feed100.000.3320.21100.00100.00
Concentrate8.481.3426.8634.0611.27
Tailing91.520.2419.5965.9488.73
Na2S (3 kg/t) + MA (3 kg/t)Feed100.000.7422.39100.00100.00
Concentrate13.544.5723.9883.8314.50
Tailing86.460.1422.1416.1785.50
Na2S (3 kg/t) + MA (5 kg/t)Feed100.000.5722.42100.00100.00
Concentrate8.485.4323.6981.538.96
Tailing91.520.1122.3018.4791.04
Note: The Na2S dosage was fixed at 3 kg/t. Flotation tests were conducted at pH 7 using kerosene (20 mg/L) as the collector. No frother was added.
Table 7. Major functional groups in the MA molecule.
Wavenumber (cm−1)Groups
609.37C-S stretching vibration
678.63C-S stretching vibration
765.05C-C bending vibration
934.47CH2 oscillation or sideband vibration
1176.54C-O bending vibration
1314.65carboxyl (C-O, bending) vibration
1422.52carboxyl (O-H, bending) vibration
1695.55carboxyl (C=O, bending) vibration
2567.82S-H stretching vibration
2647.61carboxyl (O-H, bending) vibration
2910.04C-H stretching vibration
3028.98carboxyl (O-H, bending) vibration
Table 8. Relative elemental contents on the chalcopyrite surface before and after MA treatment.
ElementRelative Content (%)D-Value (%)
ChalcopyriteChalcopyrite + MA
C30.236.656.45
Cu9.3614.785.42
Fe6.516.46–0.05
O32.2115.79–16.42
S17.7723.165.39
Table 9. Calculated Mulliken charges and Fukui indices for MA.
AtomSO1O2O3O4
Mulliken charge–0.269–0.473–0.421–0.471–0.428
Fukui (f+)0.2600.1740.0890.0340.021
Table 10. Adsorption energies of MA at different sites on the chalcopyrite (112) surface.
Adsorption SitesAdsorption Energies (kJ/mol)
S–Cu1–244.94
S–Fe1–152.54
S–Fe1 and O1–Fe2–106.06
S–Cu1 and O1–Cu2–284.69
S–Cu1 and O1–Fe1–170.83
Table 11. Mulliken charge populations of the interacting atoms before and after MA adsorption.
AtomMulliken ChargeD-Value
Before AdsorptionAfter Adsorption
Cu10.2700.160–0.110
Cu20.2700.3300.110
S–0.269–0.2200.047
O1–0.473–0.510–0.037
Disclaimer/Publisher’s Note: The statements, opinions and data contained in all publications are solely those of the individual author(s) and contributor(s) and not of MDPI and/or the editor(s). MDPI and/or the editor(s) disclaim responsibility for any injury to people or property resulting from any ideas, methods, instructions or products referred to in the content.