Review

REE Mineralogical Evolution in a F-Rich Peralkaline System: A Review on the REE Mineralization Associated with the Madeira Sn-Nb-Ta-Cryolite (REE, U, Th, Zr, Li) Deposit (Amazonas, Brazil)
by
Artur C. Bastos Neto
1,
Ingrid W. Hadlich
1,
Harald G. Dill
2,* and
Vitor P. Pereira
1
1
Instituto de Geociências, Universidade Federal do Rio Grande do Sul, Avenida Bento Gonçalves 9500, Porto Alegre 91501-970, RS, Brazil
2
Section of Mineralogy, Department of Earth System Sciences, Gottfried Wilhelm Leibniz University, Callinstrasse 3, D-30167 Hannover, Germany
*
Author to whom correspondence should be addressed.
Minerals 2026, 16(4), 417; https://doi.org/10.3390/min16040417
Submission received: 24 February 2026 / Revised: 23 March 2026 / Accepted: 15 April 2026 / Published: 17 April 2026

Abstract

This study is centered on REE distribution in several minerals exhibiting exceptionally rare mineralogical and chemical compositions in the 1.8 Ga Madeira albite-enriched granite (AEG). This is a peralkaline A-type granite and corresponds to the Madeira Sn-Nb-Ta-cryolite (REE, Th, U, Zr, Li) world-class deposit (195 Mt) (Amazonas, Brazil). The REE mineralization ranks among the major deposits associated with alkaline and peralkaline magmatism in intracontinental and extensional anorogenic environments in terms of tonnage and grades. However, with respect to REE paragenesis and structure, it differs from all other known REE deposits. The REE mineralization (xenotime, gagarinite, fluocerite, thorite, pyrochlore, zircon, fluorite, and cryolite) is disseminated and zoned. In addition, in the central part of the deposit, there is a massive hydrothermal cryolite body, whose feasibility for REE extracting has been demonstrated. The evolution of rare earth minerals followed a precise order, with minimal formation of compound minerals and minerals with compositions distinct from their typical occurrences. Small pegmatites very rich in xenotime and gagarinite occur in the core AEG. These characteristics are due to the very high F activity in the magma, buffered by cryolite crystallization, to progressive, undisturbed crystallization from the margins toward the center, and to minimal CO2 activity. The alteration of primary REE minerals by F-rich hydrothermal fluids, the origin of these fluids, and the formation of secondary REE minerals are also discussed.

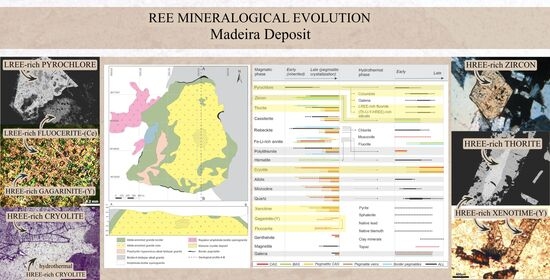
Graphical Abstract

1. Introduction

1.1. Rare Earth Elements and Their Applications: A Geoscientific Overview

Rare earth elements (REEs) comprise the 15 lanthanides, together with yttrium (Y) and scandium (Sc), which exhibit chemical behavior similar to that of the lanthanides. REEs are lithophile elements and invariably occur together in natural systems. The term “rare earth elements” is essentially a misnomer, as these metals are not truly rare. Their relative abundance in the Earth’s crust and their common incorporation into mineral lattices such as monazite, bastnäsite, and xenotime demonstrate this. Xenotime, a Y-phosphate, is a well-known host of heavy REEs (HREEs), which more accurately justify the designation “rare” in terms of crustal abundance [1]. In this study, REEs are classified using both the detailed subdivision into light (LREEs: La to Sm), medium (MREEs: Eu to Dy), and heavy (HREEs: Gd to Lu) rare earth elements, as well as the simplified LREE–HREE scheme (La–Eu; Gd–Lu), depending on the study considered.
Their usage and demand in civil and military technologies are very much different, as is their associated supply risk. Not surprisingly, the LREEs La and Ce, which are the major constituents of monazite and bastnäsite, are generally considered non-critical, as are Pr, Sm, and Gd. In contrast, the heavier and less abundant the REE, the greater the supply risk. Neodymium (Nd) and yttrium (Y) occupy particularly important positions in this assessment. Neodymium is essential for NdFeB magnets used in wind turbines and other high-performance technologies. Yttrium is the dominant element in xenotime, the main HREE-bearing phosphate. Although Y is often grouped with REEs, it is chemically more closely related to scandium, its neighbor in the Periodic Table. With an average crustal abundance of 31 ppm Y, this REE sensu lato would fall within the LREE range; however, from mineralogical and chemical perspectives, it behaves more similarly to MREEs and HREEs. In the defense industry, REEs are used in targeting lasers, satellite communications, remotely piloted aircraft systems, and precision-guided munitions. Dy, Nd, Pr, Sm, and Y are particularly important, with smaller amounts of Er, Eu, and Gd also utilized in applications ranging from fighter aircraft and missile systems to naval vessels. In an overview such as this, only a brief summary can be provided based on the 2022 production quotas, expressed in metric tonnes of rare earth oxide (REO) equivalent: China (210,000), USA (43,000), Australia (18,000), and Myanmar (12,000). Although HREEs represent less than 15% of total global production by volume, they account roughly 50% of revenue due to their high technological value. Outside China, most operating mines predominantly produce LREEs. Consequently, the most critical global demand is for HREEs [2,3,4,5].

1.2. Main Types of REE Deposits and Brazil’s Potential for REE Production

Various geological processes can lead to the concentration of REEs in specific rock types and sediments, promoting enrichment in both LREEs and HREEs through fractionation of the REE series. However, the principal REE deposits currently in production, as well as the most advanced exploration projects, are predominantly associated with magmatic rocks [3]. Chakhmouradian and Zaitsev [6] classified REE deposits related to igneous rocks into five groups: (1) carbonatite-associated deposits; (2) deposits related to undersaturated peralkaline silicate rocks; (3) peralkaline granites and pegmatites; (4) pegmatites associated with submetaluminous granites; and (5) iron oxide–phosphate deposits. Of the 50 most advanced REE exploration projects outside China, 13 are related to various types of alkaline silicate rocks.
Carbonatites exhibit a strong affinity for LREEs, whereas other deposit types may contain both LREEs and HREEs. Although several types of REE deposits occur in China, only three—all related to igneous processes—are of major economic importance [7]. These are: (1) the Bayan Obo deposit, where bastnäesite, parisite, and monazite mineralization hosted in dolomitic marble formed through hydrothermal alteration related to carbonatitic magmatism; it is the world’s largest REE deposit (48 Mt of contained REE2O3; grade of 6% REE2O3) and accounts for approximately 90% of global LREE production; (2) intensely altered residual deposits, in which LREEs and HREEs are adsorbed onto ion-adsorption clays derived from altered granitic rocks; these numerous deposits total approximately 1 Mt of REE2O3 in reserves and, although they represent only 7% of China’s REE production, they supply nearly all global HREE production; and (3) carbonatite-related deposits within orogenic belts, composed predominantly of bastnäsite [3,6].
The main characteristics and REE potential of peralkaline granites are summarized by Chakhmouradian and Zaitsev [6]. Granitic rocks with varying proportions of alumina, alkalis, and Ca contain distinct—though partially overlapping—assemblages of accessory REE minerals. These accessory phases account for 70%–80% of the whole-rock REE budget in amphibole-rich metaluminous granites and more than 90% in peraluminous and peralkaline varieties. The highest REE concentrations (commonly 300–800 ppm) are found in anorogenic peralkaline granites and associated pegmatites. Extremely evolved systems may reach much higher enrichment levels due to advanced fractional crystallization and the concentration of REEs in F-rich residual melts. A notable feature of peralkaline granites is their relative enrichment in HREEs compared with other igneous rocks [e.g., (La/Yb)N = 2–10 and Y/Nd ≥ 1]. This distribution is commonly attributed to the low solubility of monazite in silicic melts, leading either to retention of LREEs in monazite-bearing crustal sources or to early removal of LREEs during magma evolution. HREE enrichment in evolved granites is further enhanced by feldspar fractional crystallization, which also produces the characteristic negative Eu anomaly. In addition to monazite and allanite—typical LREE hosts in most granitoids—peralkaline granites may contain HREE-bearing minerals such as xenotime, fergusonite, samarskite, and gagarinite. Other important REE hosts include primary zirconosilicates (depending on Na and silica activity in the system) and pyrochlore. Hydrothermally modified deposits may also contain diverse silicate, fluorocarbonate, and mixed-anion phases, whose precipitation is controlled by REE mobility in fluids of variable composition and by fluid–rock interaction processes.
Currently, Brazil produces small amounts of REEs as a by-product of Nb extraction at Araxá, associated with carbonatites. Two additional carbonatite-related deposits with REE potential are Catalão—currently mined for Nb and phosphate—and the undeveloped Morro dos Seis Lagos Nb deposit. A project is underway to exploit ion-adsorption clays associated with the Serra Dourada granite, and the Madeira deposit may potentially produce REEs as a by-product of Sn-Nb-Ta extraction. Takehara [8] summarize the characteristics of these and other Brazilian REE occurrences with significant potential.
This paper focuses on REE mineralization associated with the world-class Madeira Sn-Nb-Ta deposit (195 Mt at 0.17% Sn in cassiterite, and 0.20 wt.% Nb2O5 and 0.024 wt.% Ta2O5 in pyrochlore and columbite [9]). The deposit is characterized by Sn, Nb, Ta, cryolite, REE, Li, Zr, U, and Th, disseminated within the albite-enriched granite (AEG). In addition, the central portion of the deposit hosts a massive cryolite deposit (MCD) (10 Mt at 31.9% Na3AlF6). The coexistence of rare metals and an MCD within the same peralkaline granite is unique worldwide.
Although REE mineralization at the Madeira deposit has not previously been addressed in a comprehensive study, several mineralogical investigations of REE minerals have been conducted by our research group. In this paper, we integrate these studies with whole-rock geochemical data to develop a model for the mineralogical evolution of REEs in the Madeira deposit from the early magmatic stage to the low-temperature hydrothermal stage. We demonstrate that REE mineralization was strongly controlled by the high fluorine content of the system and therefore deviates significantly from typical models for peralkaline-granite-hosted deposits, particularly with respect to paragenetic sequence, mineral compositions, and transformations driven by F-rich fluid–rock interactions.

2. Geoscientific Studies

2.1. Geological Setting

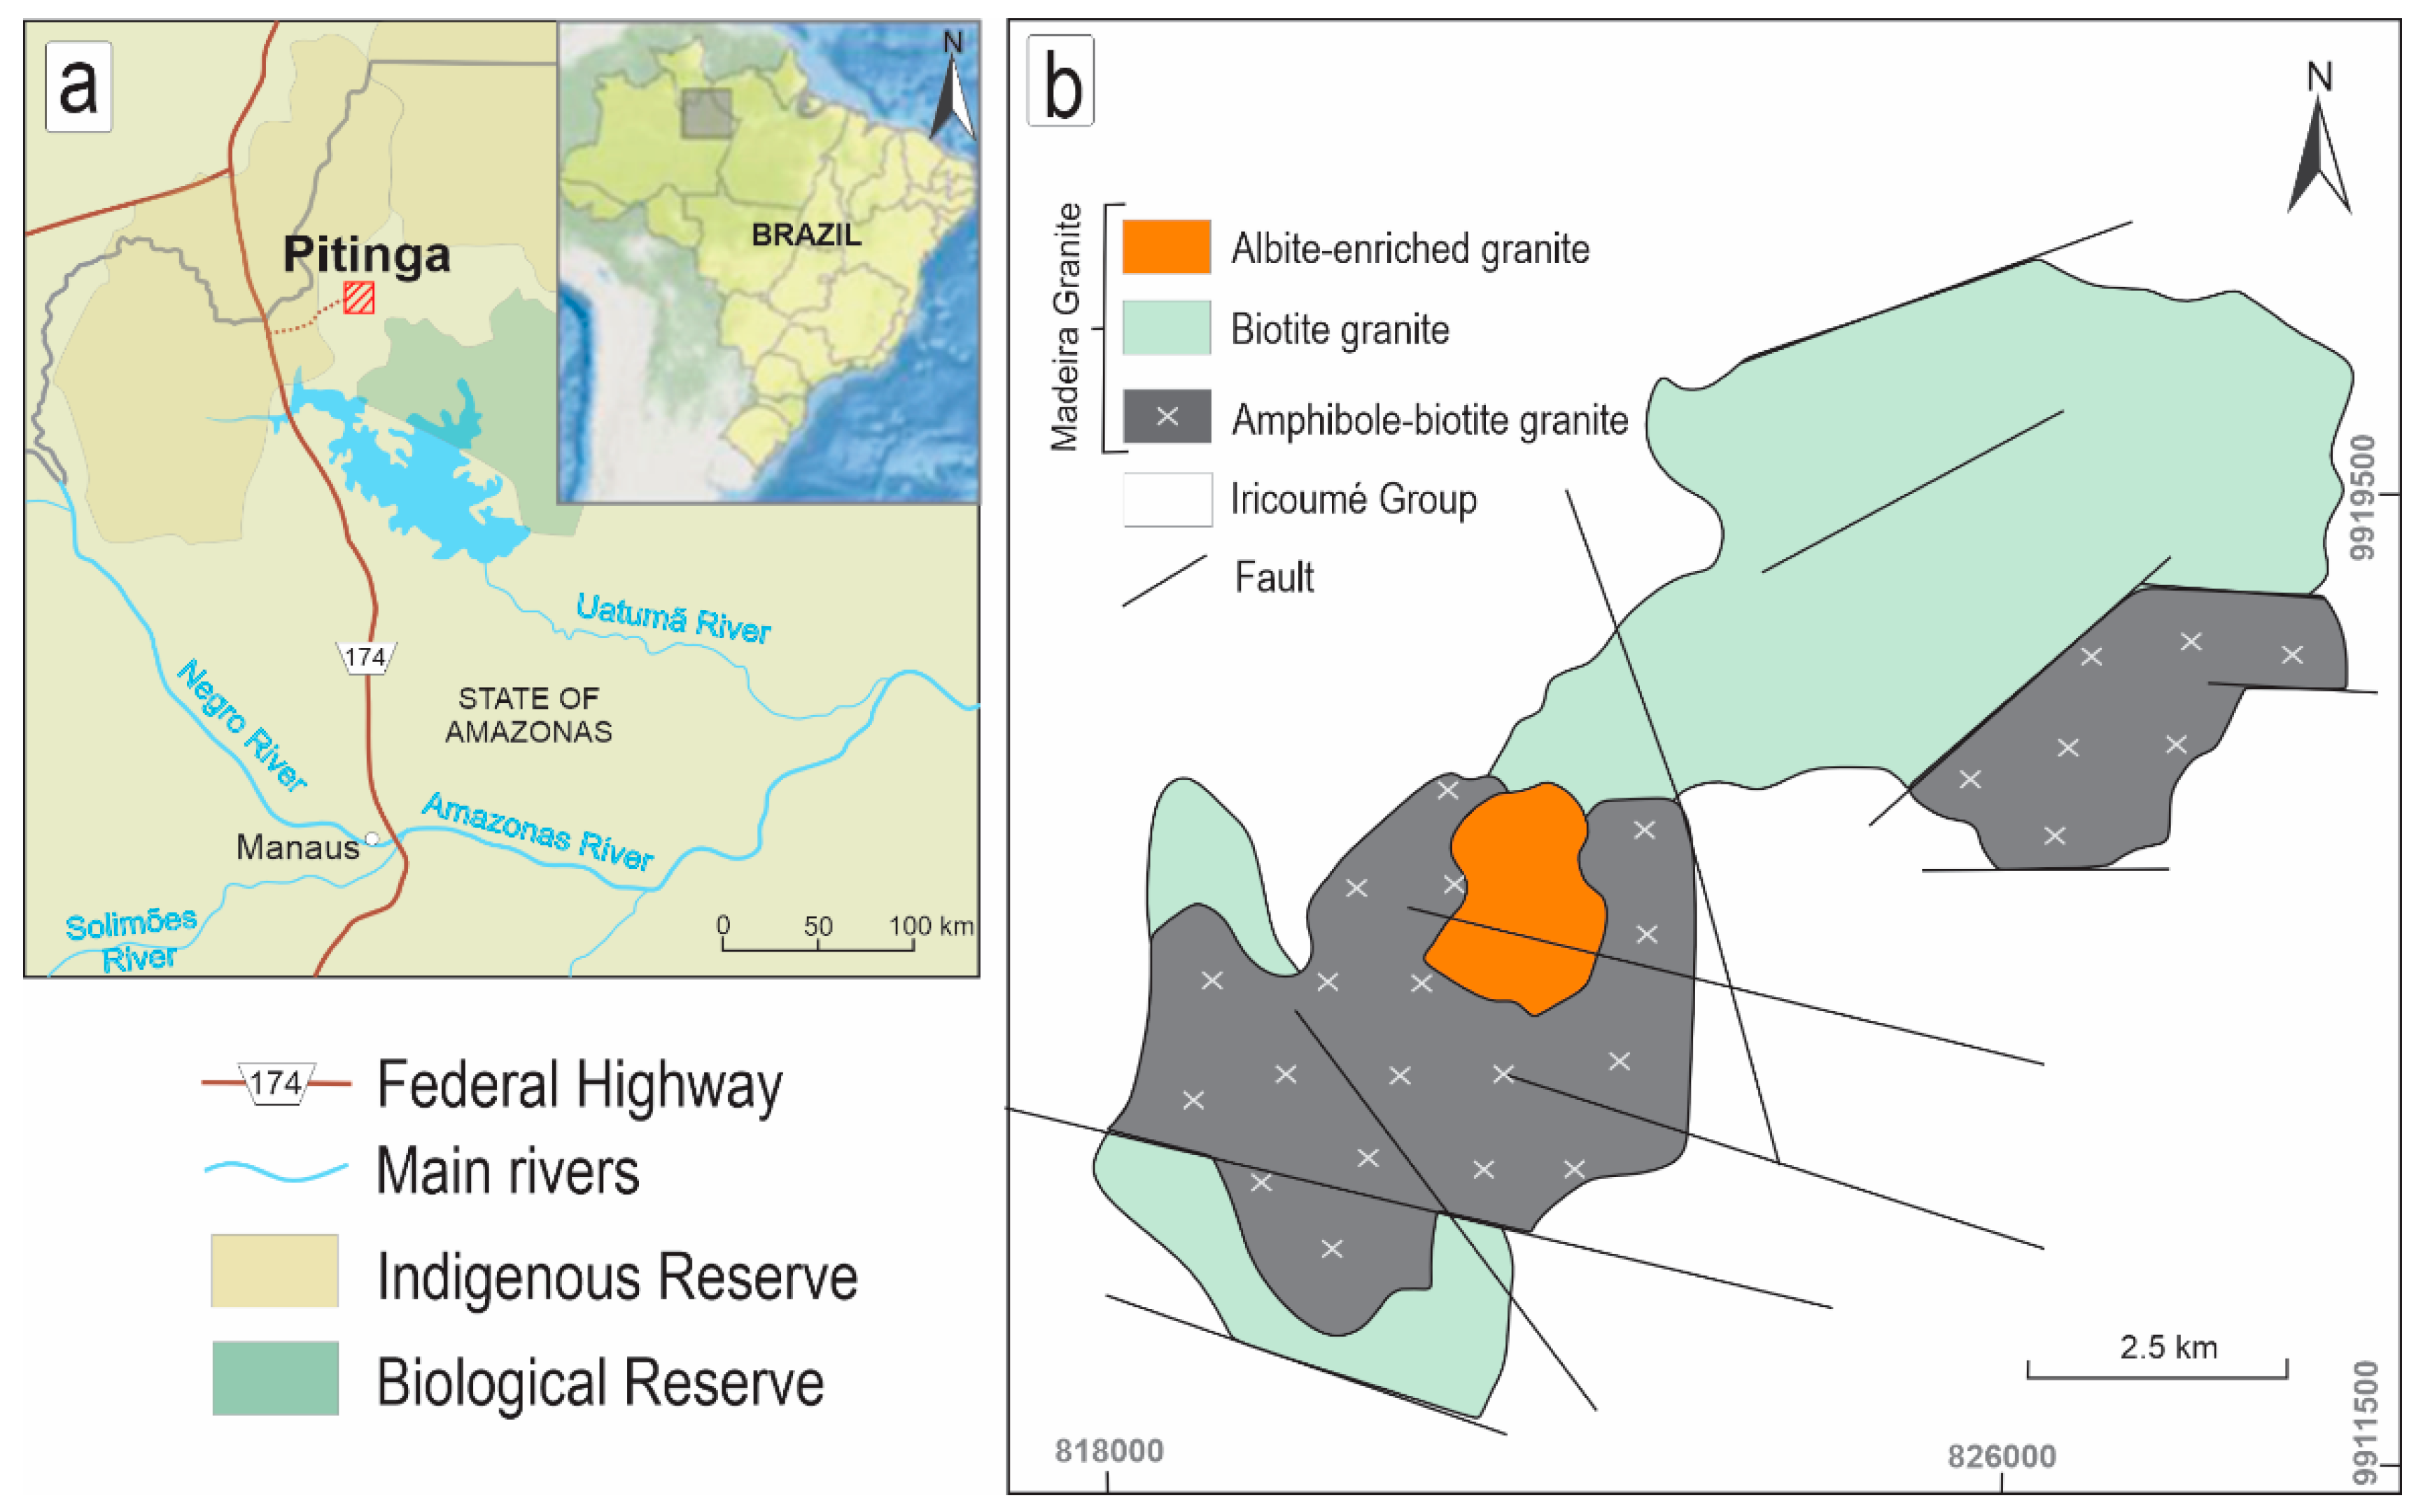
The Pitinga Province is located (Figure 1) in the southern portion of the Guyana Shield [10], within the Tapajós–Parima Tectonic Province [11]. It is the largest tin-producing province in Brazil. Alluvial ore deposits were first identified in 1979 [12] and are currently close to depletion. The primary ore deposits are associated with two main tin-bearing granites: the Madeira and Agua Boa A-type granites (Figure 1). Both belong to the ∼1830 Ma Madeira Suite [13]. The Madeira deposit, which has been exploited since 1989, is hosted by the Madeira granite (Figure 2). In addition, several small greisen bodies associated with the Água Boa granite have been intermittently exploited.
In the Pitinga Province, the Madeira granite (Figure 1) is emplaced within volcanic rocks of the Iricoume Group [12], which are the dominant lithologies in the region. These rocks yield zircon 207Pb/206Pb ages between 1881 ± 2 and 1890 ± 2 Ma [14]. They were formed in a subaerial volcanic environment marked by alternating effusive and explosive activity, and they consist predominantly of rhyolitic units as well as highly welded ignimbrites, ignimbrite tuffs, and surge deposits [15,16,17].
The Madeira granite (Figure 1 and Figure 2) contains four facies [13,18,19]. The early, mostly metaluminous porphyritic amphibole–biotite granite (1824 ± 2 Ma) contains plagioclase-mantled K-feldspar megacrysts, sometimes also showing reverse zonation and is thus referred to as the “rapakivi” granite. This facies was followed by the biotite granite facies (1822 ± 2 Ma). The alkali feldspar hypersolvus porphyritic granite facies (1818 ± 2 Ma) has K-feldspar phenocrysts in a fine- to medium-grained matrix dominantly composed of K-feldspar and quartz. The AEG magmas and the hypersolvus granite (Figure 2) interacted and were emplaced simultaneously [13]. The age of the AEG is only very roughly constrained at 1822 ± 22 Ma [20] due to metasomatic and/or hydrothermal alteration of zircon. Therefore, the age of the AEG is considered to correspond to that of the hypersolvus granite (1818 ± 2 Ma).
The geochemical features of Madeira granite [13,19,21] are summarized by Nardi et al. [22] as follows. The biotite granites show (Na2O + K2O) contents higher than 8.5 wt.%, FeOT/(FeOT + MgO) > 0.9, Ga × 104/Al > 3, high Nb (>25 ppm), Y (>80 ppm) and Ga (>20 ppm) contents, and low Sr contents (<100 ppm). Such features, as well as the REE patterns, are typical of A-type granites. The biotite granite and amphibole–biotite granite facies are metaluminous, and the peralkaline character is developed only in the highly evolved albite-enriched granite core (CAG, Figure 2). Chondrite-normalized REE patterns of the biotite granite show high contents (LaN200–900, LuN 20–200), deep negative Eu anomalies, and low LREE/HREE fractionation (LaN/LuN < 4). The CAG facies shows distinct patterns with HREE enrichment and lower LREE contents (LuN100–700, average LaN = 100). Most samples of the AEG show the M-type tetrad effect commonly observed in magmatic rocks where F-rich hydrothermal fluids were present.
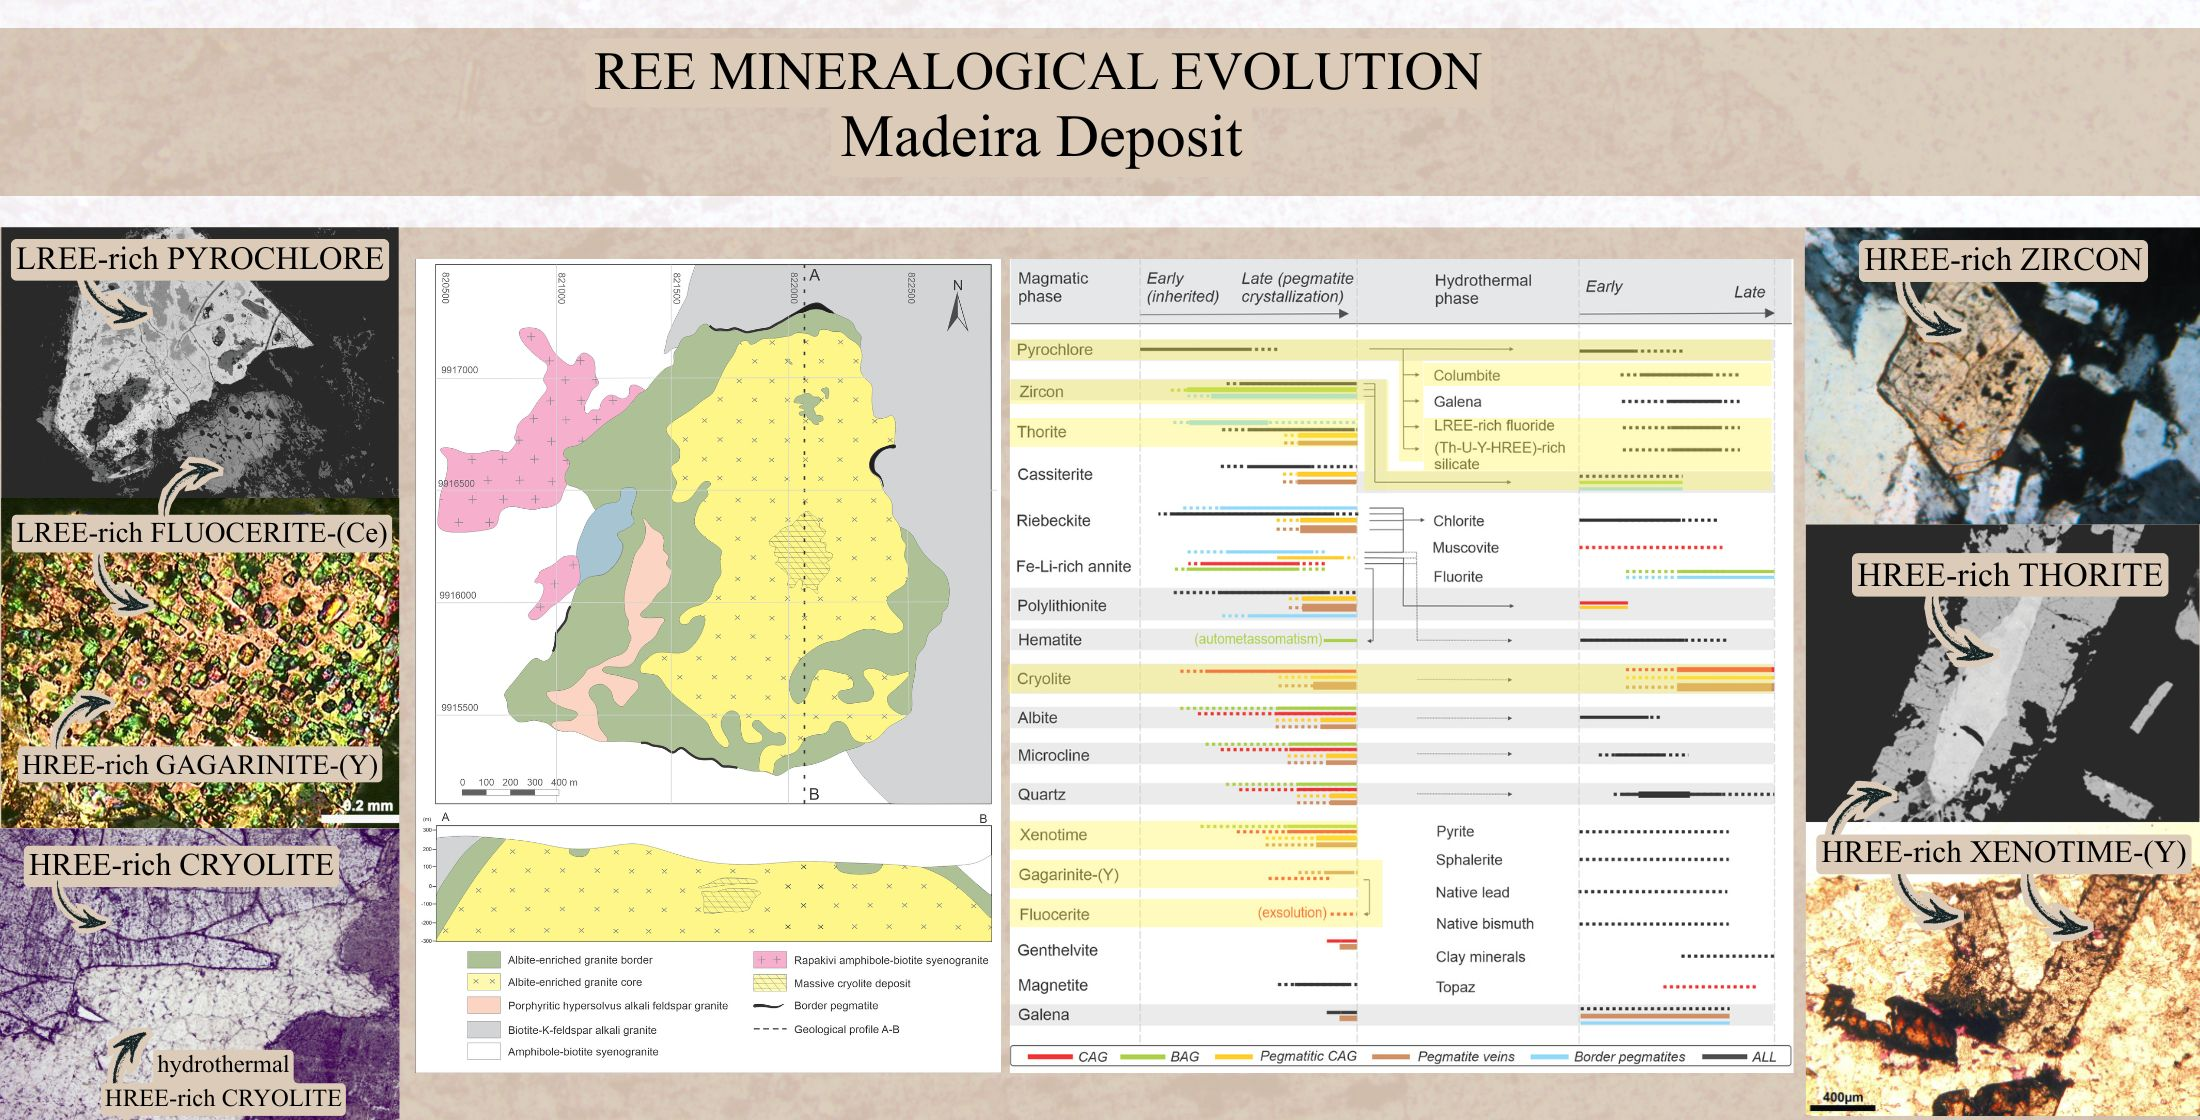
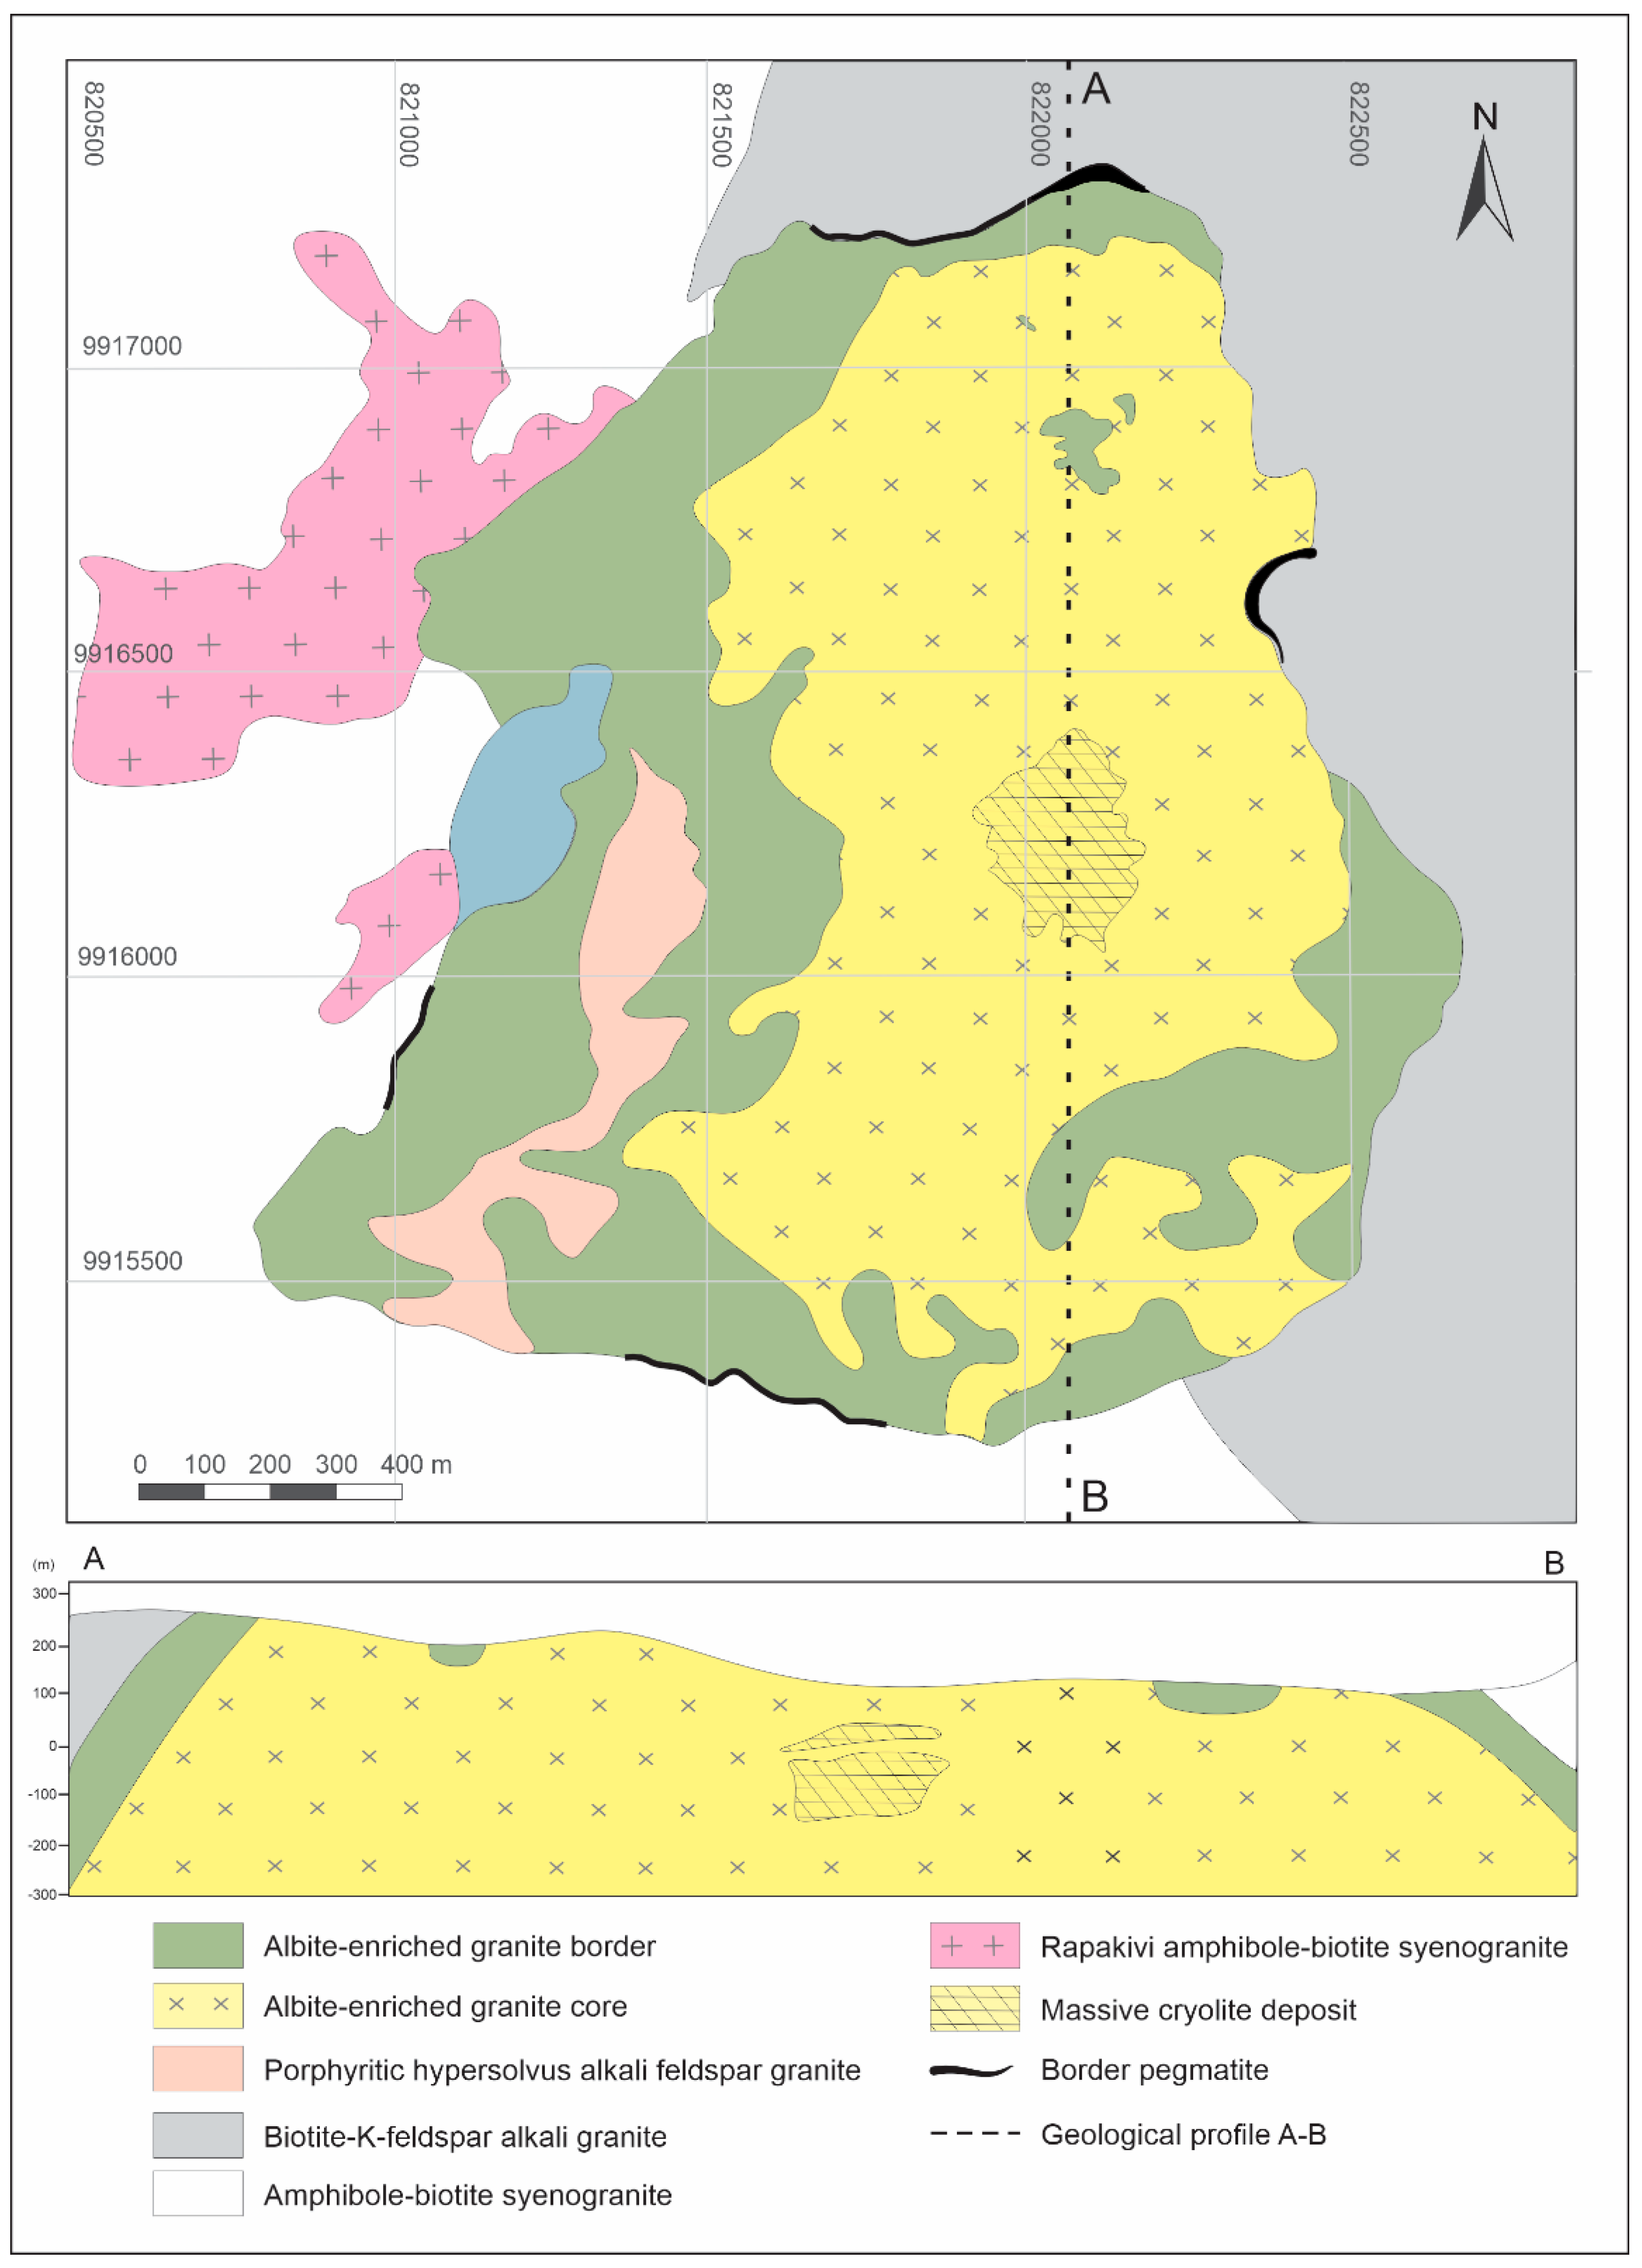
Figure 2. Geological map of the albite-enriched granite [23].
Minerals 16 00417 g002

2.2. The Madeira Deposit

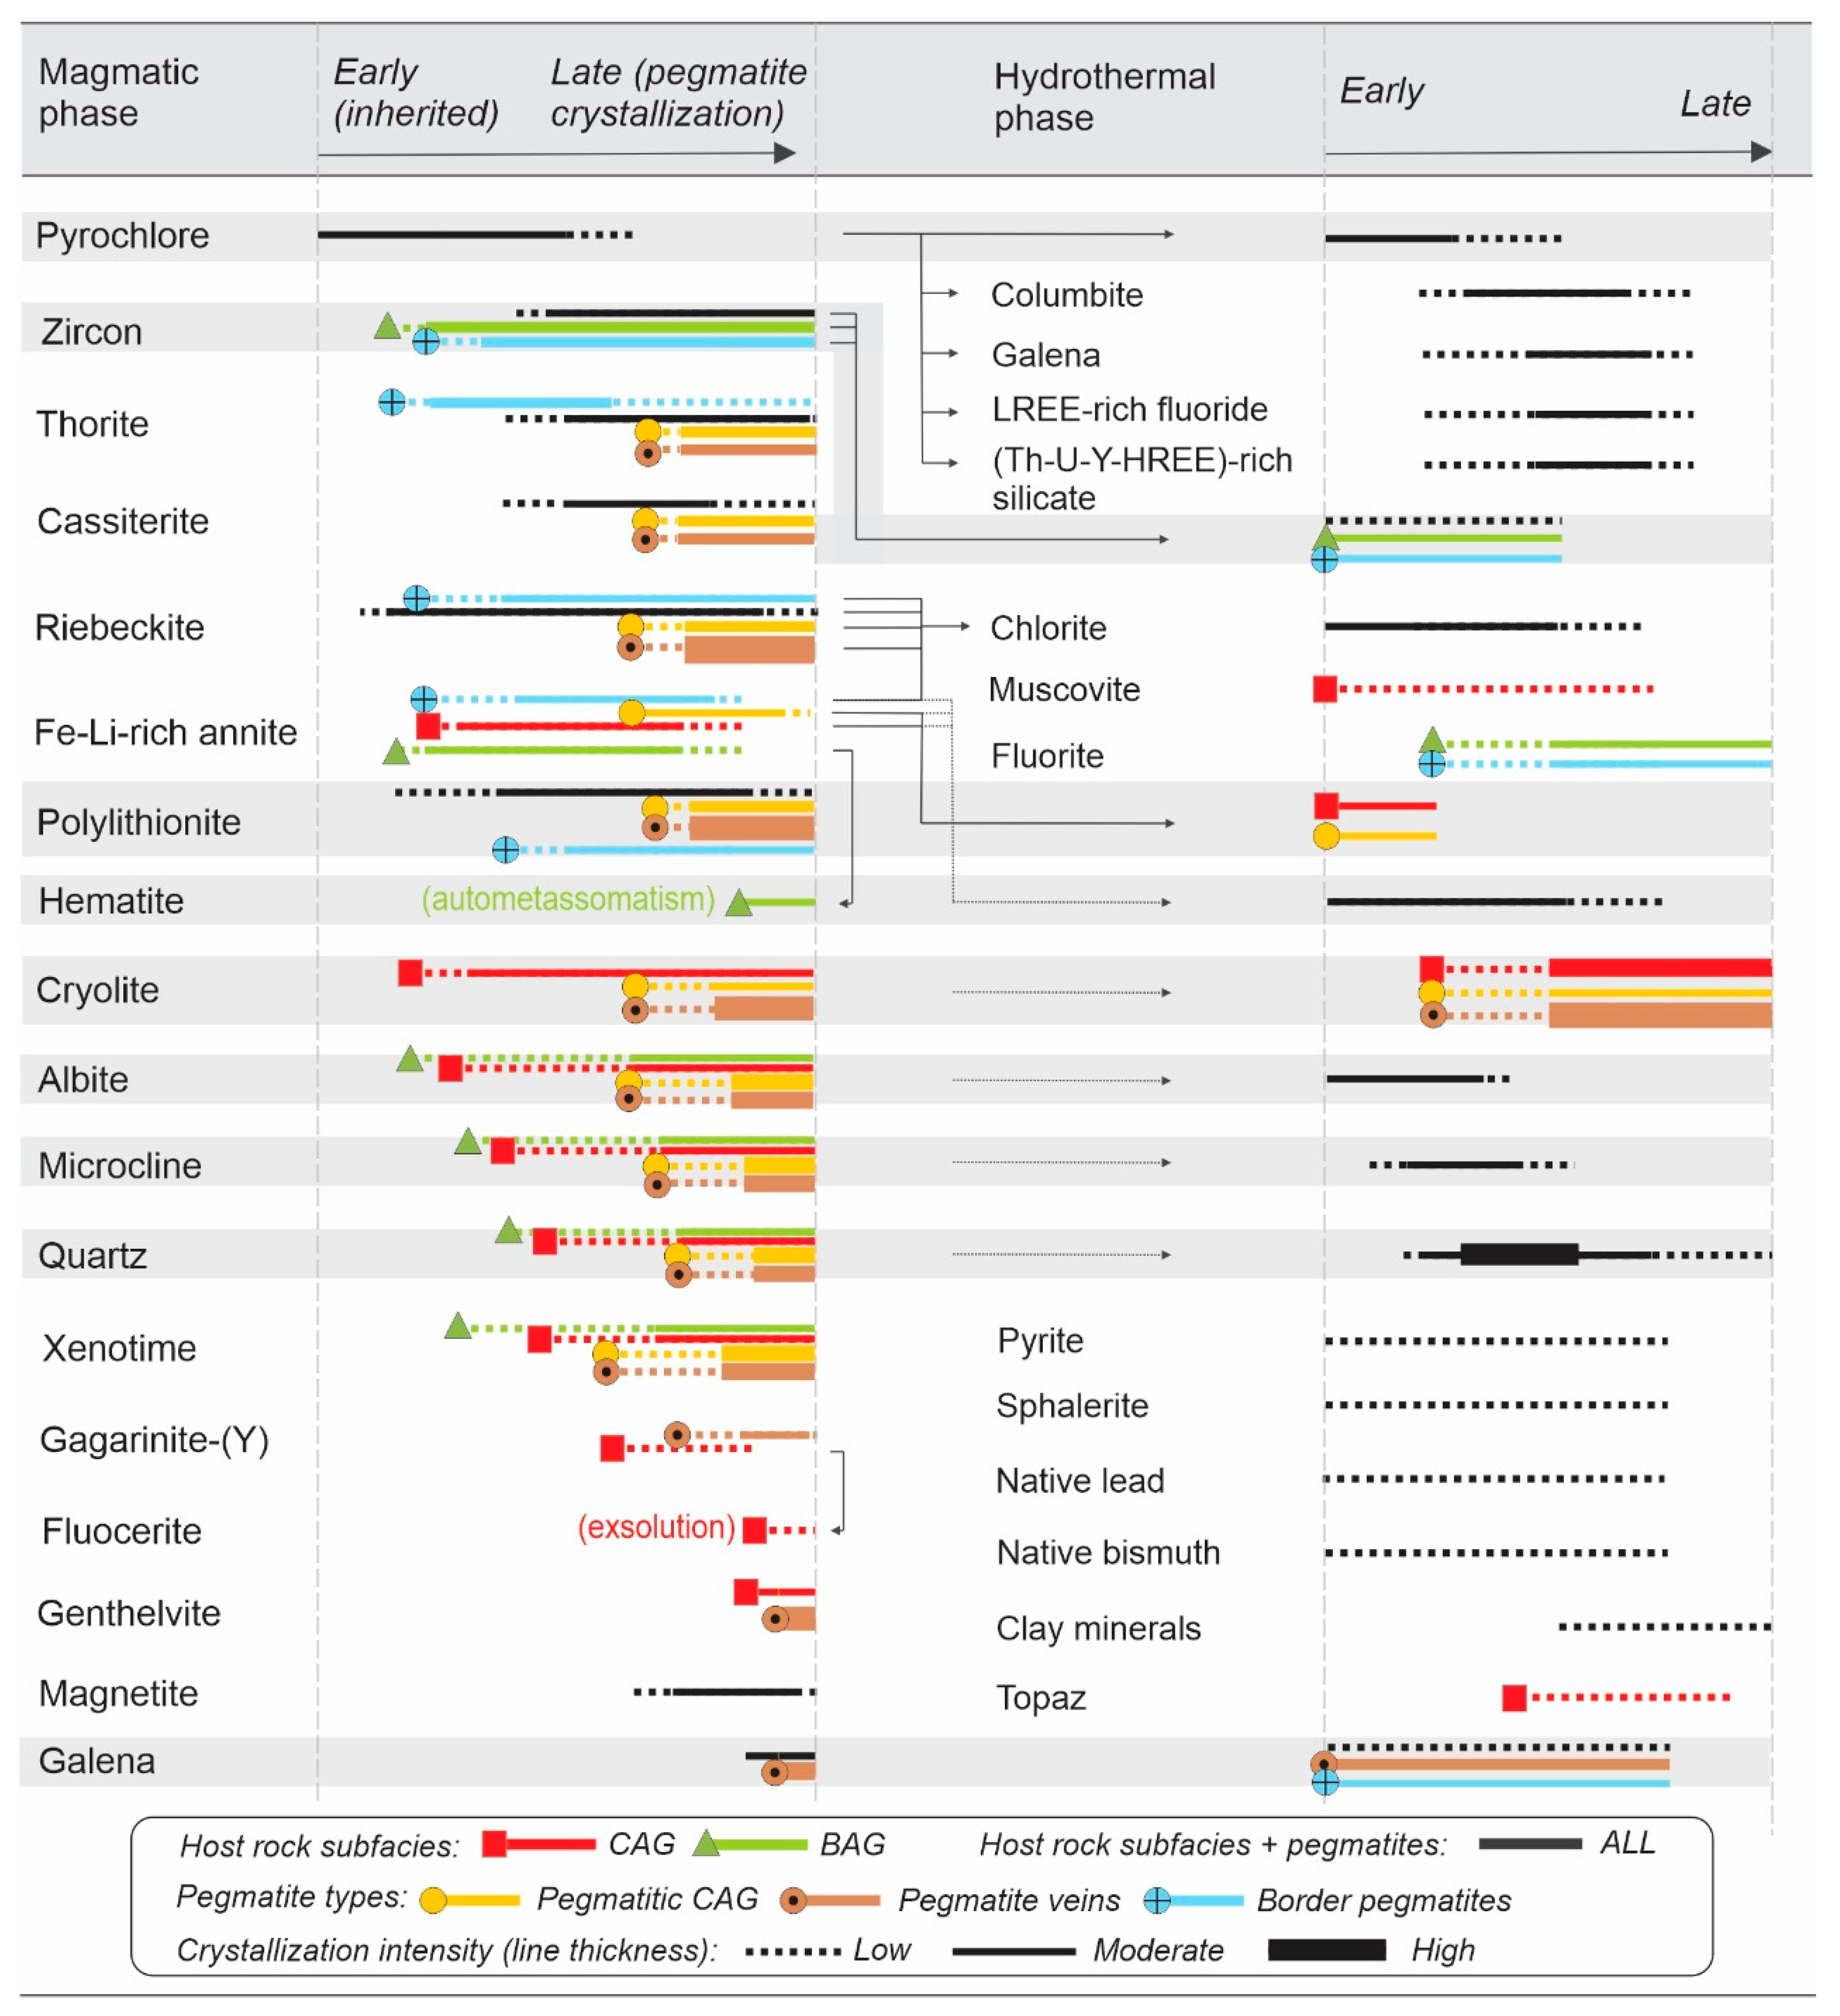
The Madeira deposit (Figure 2) corresponds to the AEG body with an overall oval geometry, measuring approximately 2 km by 1.3 km. It is internally subdivided into two main subfacies: an albite-enriched granite core (CAG) and an albite-enriched granite border (BAG) [24]. The CAG consists of a peralkaline subsolvus granite displaying porphyritic-to-seriate textures and fine- to medium-grained characteristics. Its assemblage is dominated by quartz, albite, and K-feldspar, each occurring in roughly similar proportions (25%–30%). Accessory minerals include cryolite (4%), polylithionite (4%), F-rich annite (3%), zircon (2%), and riebeckite (2%), with additional minor occurrences of pyrochlore, cassiterite, xenotime, columbite, thorite, magnetite, and galena [13,24]. In contrast, the BAG is peraluminous and broadly comparable to the CAG in terms of textures and major mineralogy. However, it is distinguished by higher zircon contents, the presence of fluorite in place of cryolite, and the near absence of Fe-rich silicate minerals, which were largely removed during an autometasomatic process [18,25]. The paragenesis of the BAG, CAG, and associated pegmatites is shown in Figure 3.
In addition to the primary disseminated ore, the deposit hosts several economically relevant by-products associated with specific mineral phases: F (in cryolite and fluorite); Zr and Hf (in zircon); Th (thorite, 0.07 wt.% ThO2); U (pyrochlore, 0.03 wt.% UO2), Li (polylithionite) [22,26,27,28], and REEs, which are the focus of this study. Although these elements are generally dispersed, localized enrichment occurs in distinct zones where certain minerals become more abundant. These enriched domains include the MCD and a set of pegmatite bodies whose mineral assemblages reflect the rare metal paragenesis of the host granite (Figure 3). Together, they record a progressive magmatic–hydrothermal evolution, controlled by physicochemical processes such as tectonic decompression, extreme fractional crystallizations, melt–melt immiscibility, and exsolution of internal fluids [29,30,31]. Three main types of pegmatites can be distinguished, as follows.
Border pegmatites (BPEGs) (Figure 2) occur along contraction fractures at the contact between the intrusion and country rocks. They display coarser grain sizes relative to the host granite and are enriched in K-feldspar, quartz, and zircon. These bodies also show advanced alteration of K-feldspar and biotite, along with localized concentrations of fluorite, polylithionite, thorite, and secondary hematite [31,32].
Pegmatitic CAG forms pods and bands, typically around 50 cm thick but locally reaching up to 10 m. Their mineralogical composition closely resembles that of the CAG, although grain sizes are significantly larger. In these bodies, polylithionite, riebeckite, xenotime, and thorite occur in much higher abundances than in the host granite [31,33].
Pegmatite veins (PEG) range from a few centimeters to approximately 2 m in thickness and are texturally heterogeneous, commonly displaying porphyritic features. Phenocrysts may be composed of quartz, K-feldspar, xenotime, thorite, cryolite, polylithionite, and riebeckite set within a matrix composed mainly by albite, quartz, K-feldspar, polylithionite, cryolite, and riebeckite. Accessory minerals comprise zircon, cassiterite, pyrochlore, columbite, galena, sphalerite, hematite, gagarinite, and genthelvite. Based on mineral assemblages, these veins are subdivided into amphibole-rich, polylithionite-rich, and cryolite-rich pegmatites [29,30,31]. Within the CMS classification [34], they correspond to the 24dE type, as they are hosted in peralkaline igneous rocks and contain REE-Y ores.
The MCD (Figure 2) is formed by several bodies of hydrothermal massive cryolite intercalated with CAG and hypersolvus granite; these are sub-horizontal, up to 300 m long and 30 m thick. The bodies of massive cryolite are composed of cryolite crystals (∼87 vol%, up to 15 mm), quartz, zircon, feldspar, subordinate chiolite, and rare thomsenolite. The contacts between cryolite bodies and host rocks are characterized by corrosion features in almost all minerals of the host rock [27,35].
Different genetic models have been proposed for the origin of the AEG. Costi et al. [18] interpret it as the product of melt immiscibility, drawing parallels with phase-separation processes described by Thomas et al. [36] for the Variscan Erzgebirge granites (Germany). Bastos Neto et al. [35] suggest that the AEG magma was influenced by the ascent of mantle-derived fluids into the crust, triggering fenitization-type reactions [37] and introducing F, Nb, Y, REE, and Th into rocks previously enriched in Sn. The input of F-rich fluids likely enhanced the fusibility of the rock. Other authors, such as Lenharo [38] and Costi [13], proposed that the magma evolved toward a highly fractionated residual melt enriched in Na and F. However, according to Bastos Neto et al. [35], such extreme fluorine enrichment was probably not fully achieved, as F activity would have been buffered by the crystallization of magmatic cryolite [39].

3. Materials and Methods

For this study, a large part of the collection of more than 500 rock samples and thin sections from the research group at the Universidade Federal do Rio Grande do Sul (UFRGS), Porto Alegre, Brazil, was reviewed through petrographic analysis under optical microscopy to characterize the mineralogy and paragenesis of REE-bearing minerals. A total of 15 thin sections were re-examined by scanning electron microscopy (SEM) with qualitative analysis using an energy-dispersive X-ray detector Zeiss model EVO MA10 (Carl Zeiss AG, Oberkochen, Germany) at the Center for Microscopy and Microanalysis at UFRGS. All mineral chemistry data were obtained by the research group and collaborators using electron probe microanalysis (EPMA), as specified for each studied mineral in the references cited below. These references should be consulted for detailed operational conditions, analytical quality control procedures, and applied corrections.
Compositions of xenotime from the CAG [40] were obtained using a Cameca JSM-5800 (Cameca, Gennevilliers Cedex, France) at the Bureau des Recherches Scientifiques et Minières, Orléans, France. Operating conditions were as follows: P, Y, Si, U, Ca, Na, F, and REEs were determined with an accelerating voltage of 15 kV, a beam current of 20 nA, and a focused beam. U, Th, and Pb were determined with an accelerating voltage of 30 kV and a beam current of 200 nA.
Trace element concentrations in zircon [22] were determined in approximately 300 zircon grains by LA-ICP-MS using a CETAC LSX100 Nd:YAG laser (Teledyne CETAC Technologies, Omaha, NE, USA) operating at 266 nm at the NERC ICP Facility, Kingston University, UK. The shot repetition rate was 10 Hz, and the laser energy was 200 mJ.
Compositions of pyrochlore, thorite, and associated secondary minerals (this study; [23,26,31]) were obtained using a JEOL JXA-8230 (JEOL, Tokyo, Japan) at the EPMA Laboratory of the Universidade de Brasília (UnB), Brazil. Operating conditions were a 15 kV accelerating voltage and a 10 nA beam current for F, Mg, Zn, Al, Si, Hf, Nb, P, Cl, S, Bi, Ti, Mn, Y, Ta, Sn, Ca, Zr, Fe, V, and Rb; 20 kV and 50 nA were used for Na, K, Pb, REE, Sr, Th, Ba, and U. A beam diameter of 1 μm was used, and interference corrections were applied in cases of peak overlap. The Wavelength-Dispersive X-ray Spectrometer (WDS) crystals used were: TAP (Si, Zn, Na, Al, Mg), PETJ (Nb, P, Hf, Cl, S, K, Bi, Sr, Y, Ta, Sn, Th, Pb), PETH (Rb, Zr, U), LIF (Ti, Mn, Sm, Eu, Gd, Dy, Er, Ho, Tb, Tm, Yb, Lu), LIFH (Ca, Fe, Ba, V, La, Ce, Pr, Nd), and LDE1 (F). Counting times for peaks measurements were 10 s for all elements, with background counts collected on both sides of the peaks for half that time. Natural and synthetic standards included microcline (Si, K, Al), albite (Na), apatite (P, Ca), andradite (Fe), topaz (F), forsterite (Mg), vanadinite (V, Pb, Cl), pyrite (S), MnTiO3 (Mn, Ti), YFe2O12 (Y), LiNbO3 (Nb), LiTaO3 (Ta), ZnS (Zn), Bi2O3 (Bi), RbSi (Rb), BaSO4 (Ba), baddeleyite (Zr), PbS (Pb), HfO2, SrSO4 (Sr), SnO2, ThO2, UO2, and synthetic REE-bearing glasses.
Compositions of xenotime and gagarinite from the pegmatites [29] were obtained using the same methodology applied to pyrochlore described above. Compositions of gagarinite and fluocerite from the CAG [28,41] were also obtained at the UnB EPMA Laboratory, but analyses were performed using a Cameca SX-50 (Cameca, Gennevilliers Cedex, France) with operating conditions of 20 kV and 40 nA for REE and Y and 15 kV and 25 nA for other elements.
Samples containing cryolite and fluorite [28] were crushed, sieved, and concentrated using heavy-liquid separation and a Frantz isodynamic separator. Manually selected grains were dissolved by acid digestion in a microwave oven and diluted with deionized water prior to analysis. The compositions of the samples with small amounts of material (disseminated minerals) were determined by ICP-MS using a Perkin Elmer/Sciex ELAN 6100 DRC (Perkin Elmer, Waltham, MA, USA) at the Institute of Geosciences of the Universidade de São Paulo, Brazil. Analyses of cryolite and chiolite from the MCD were carried out by ICP after multi-acid digestion to determine REE and Y concentrations. Fluorine (F) was determined by the ion-selective electrode method. Both analyses were performed at the Lakefield-Geosol Laboratory, Belo Horizonte, Brazil.
Crystallographic studies of xenotime [40] were performed by X-ray diffraction at the Institute des Sciences de la Terre d’Orléans (ISTO), France, using an INEL textural goniometer equipped with a PSC 120 cobalt tube and an XRG 3000 generator (INEL Inc., Artenay, Centre Val de Loire, France). Analyses were performed on thin sections using a current of 35 nA and an acceleration voltage of 30 kV. The inclination angles were ω = 5° and ψ = 0–80° with a step of 2.5°, over a range of 0–355° with a step of 5°. The acquisition time for each point was 10 s, resulting in a total analysis time of approximately 8 h per thin section. Crystallographic parameters were determined using the LCLSQ 8.5 software [42].
Whole-rock geochemical data (498 analyses for Y and 222 for REEs) of the AEG and associated pegmatites were also obtained by the UFRGS research group and are reported by Bastos Neto et al. [28,35], Minuzzi et al. [27,43,44], Pires [45,46], Paludo et al. [29], Stolnik [33], and Lengler [32]. Samples were collected from drill cores and fresh outcrops at the mine. Analyses were performed at Actlabs (Canada). Major elements were determined by ICP-AES, whereas minor and trace elements were determined by ICP-MS, and F was measured by ISE.

4. REE Minerals and REE-Bearing Minerals in the Madeira Deposit

4.1. Xenotime-(Y)

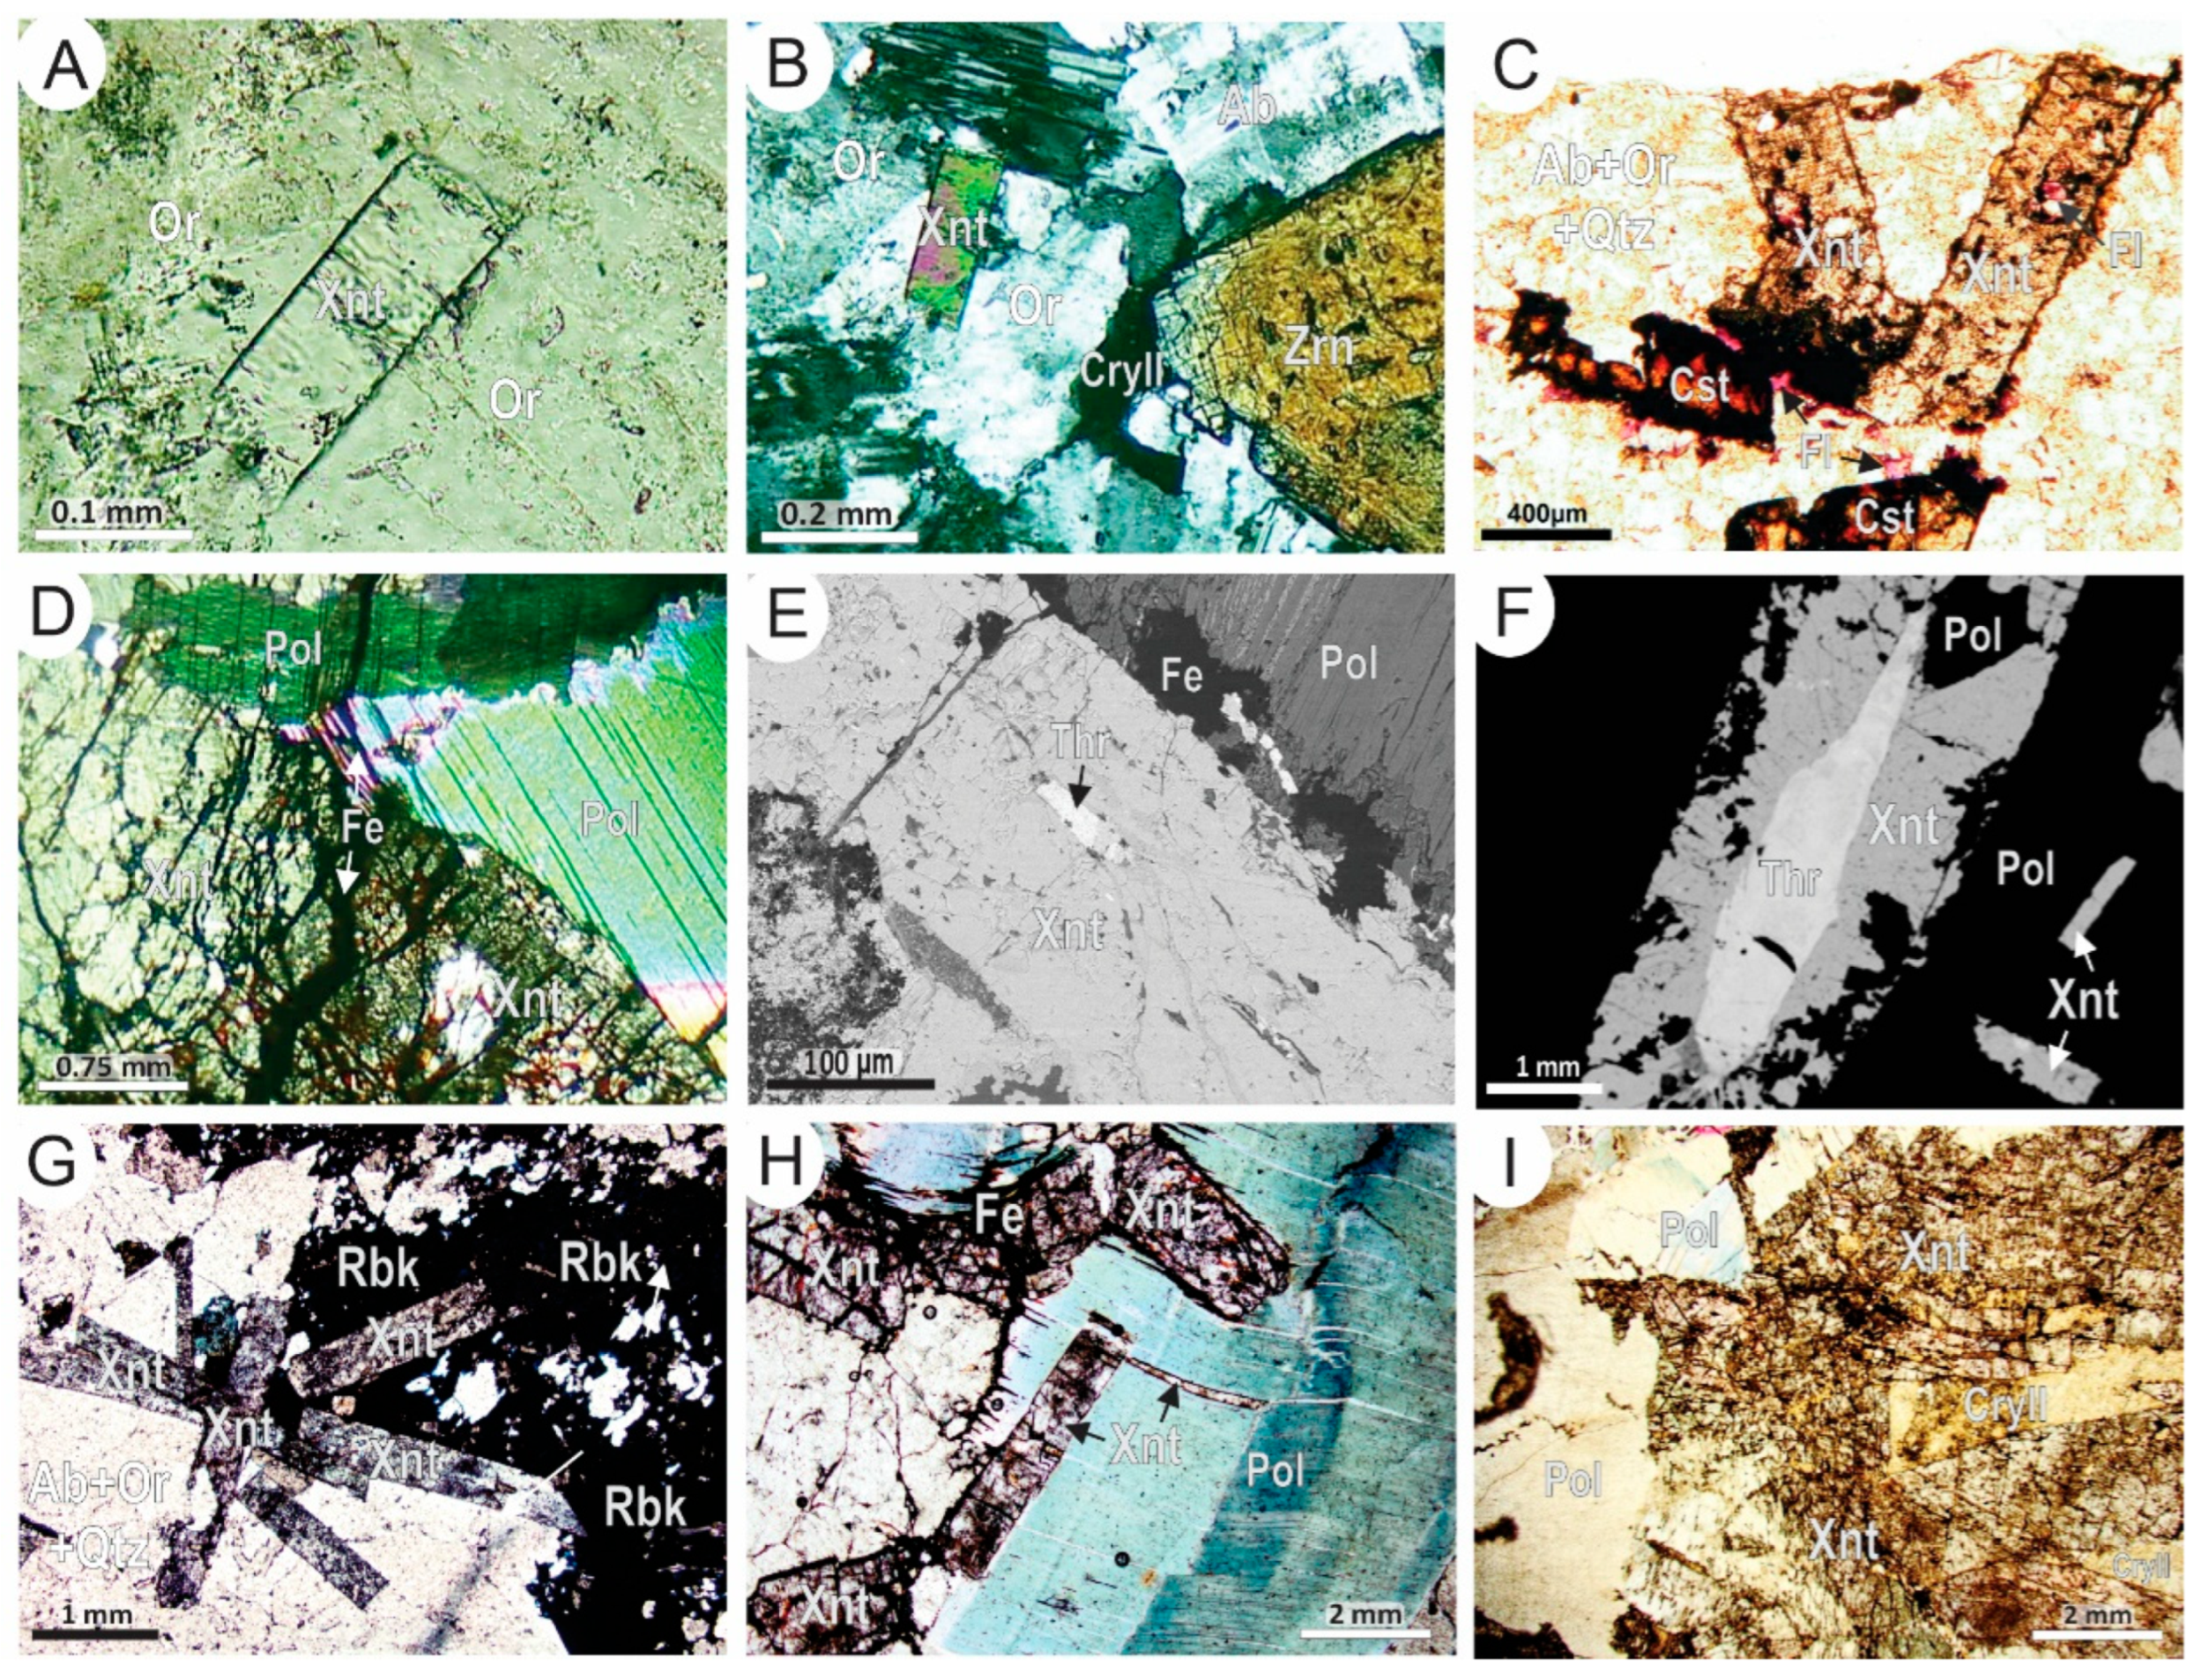
In the CAG and TAG (CAG-BAG transitional zone), xenotime-(Y) occurs scattered in the rock matrix, as inclusions in minerals, or arranged interstitially, reaching up to 0.5% (by vol.). The crystals (0.05 to 0.44 mm) are subhedral-to-euhedral and form short or elongated prisms (Figure 4A–C). In the BAG, no xenotime has been observed. Xenotime-(Y) formed after the initial crystallization of pyrochlore and early zircon and developed contemporaneously with thorite, continuing into the stage of late zircon growth. In the pegmatitic CAG, it can reach abundances of up to 30 vol.% (Figure 4D). It typically occurs as brown prismatic crystals, locally attaining lengths of up to 4 cm, and it frequently contains inclusions of thorite (Figure 4E,F).
In the PEG, xenotime-(Y) is found both in the matrix and as pegmatitic crystals (Figure 4F–I). Crystals are euhedral-to-subhedral, with sizes ranging from 0.05 mm to 5 cm, commonly with inclusions, mainly of pyrochlore, thorite (Figure 4F), and matrix minerals. Pegmatitic crystals can occur individually (Figure 4F) or in clusters (Figure 4G), whereas matrix crystals are dispersed and typically found in areas enriched in zircon, cassiterite, thorite, riebeckite, and polylithionite (Figure 4E). Xenotime-(Y) crystallized after pyrochlore and early zircon, concurrently with thorite, and was partially synchronous with late zircon and polylithionite. During the hydrothermal stage, xenotime was corroded and fractured by F-rich fluids that precipitated hydrothermal cryolite (Figure 4F,I). Neither xenotime-(Y) nor any other primary HREE-Y-bearing mineral was identified in the BPEG.
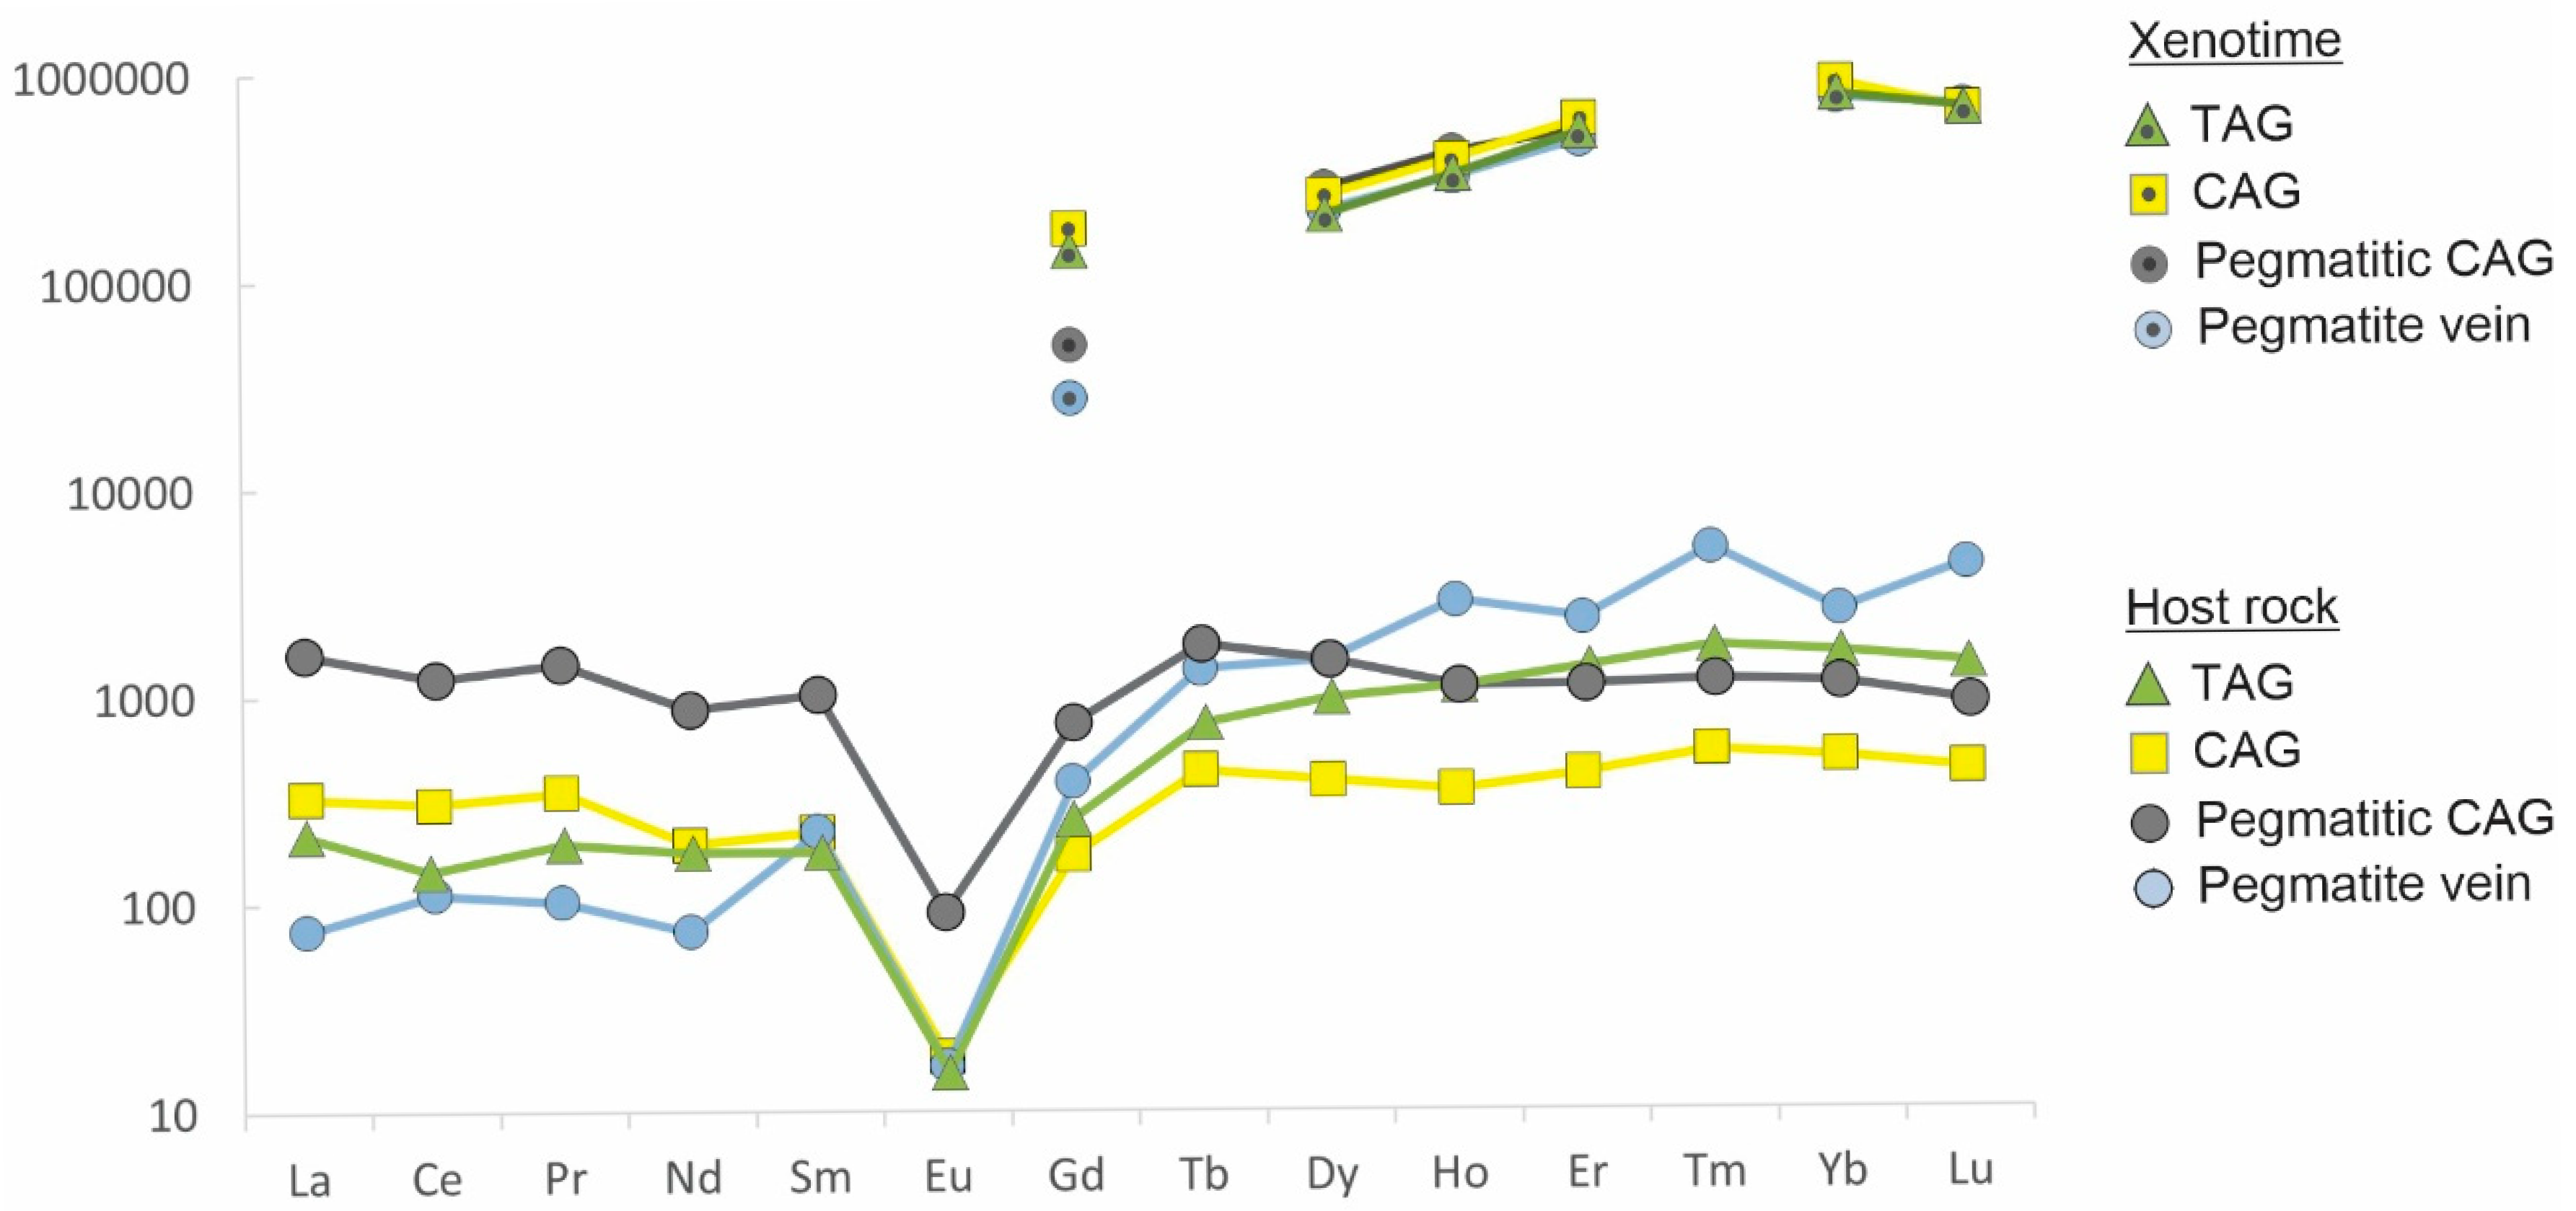
Representative compositions of xenotime-(Y) [A(VIII)B(IV)O4] are presented in Table 1. Whereas xenotime in the CAG has the highest average HREE content (38.65 wt.% HREE2O3, up to 44.43 wt.%), xenotime from the PEG has the highest Y content (30.93 wt.% Y2O3, up to 33.18 wt.%). The HREE/Y ratios in xenotime decrease in the order CAG > pegmatitic CAG > TAG > PEG. In xenotime, components of zircon, coffinite, or thorite are very subordinate. Xenotime grains from the granite facies and pegmatites show similar average HREE-normalized patterns (Figure 5), despite the different REE-normalized patterns of the host rocks. Among the HREE, the average Gd content shows the highest variation, with the highest concentration in xenotime from the CAG (4.95 wt.% Gd2O3), followed by the TAG and pegmatitic CAG, and the lowest content is in the pegmatite vein (up to 0.74 wt.% Gd2O3).
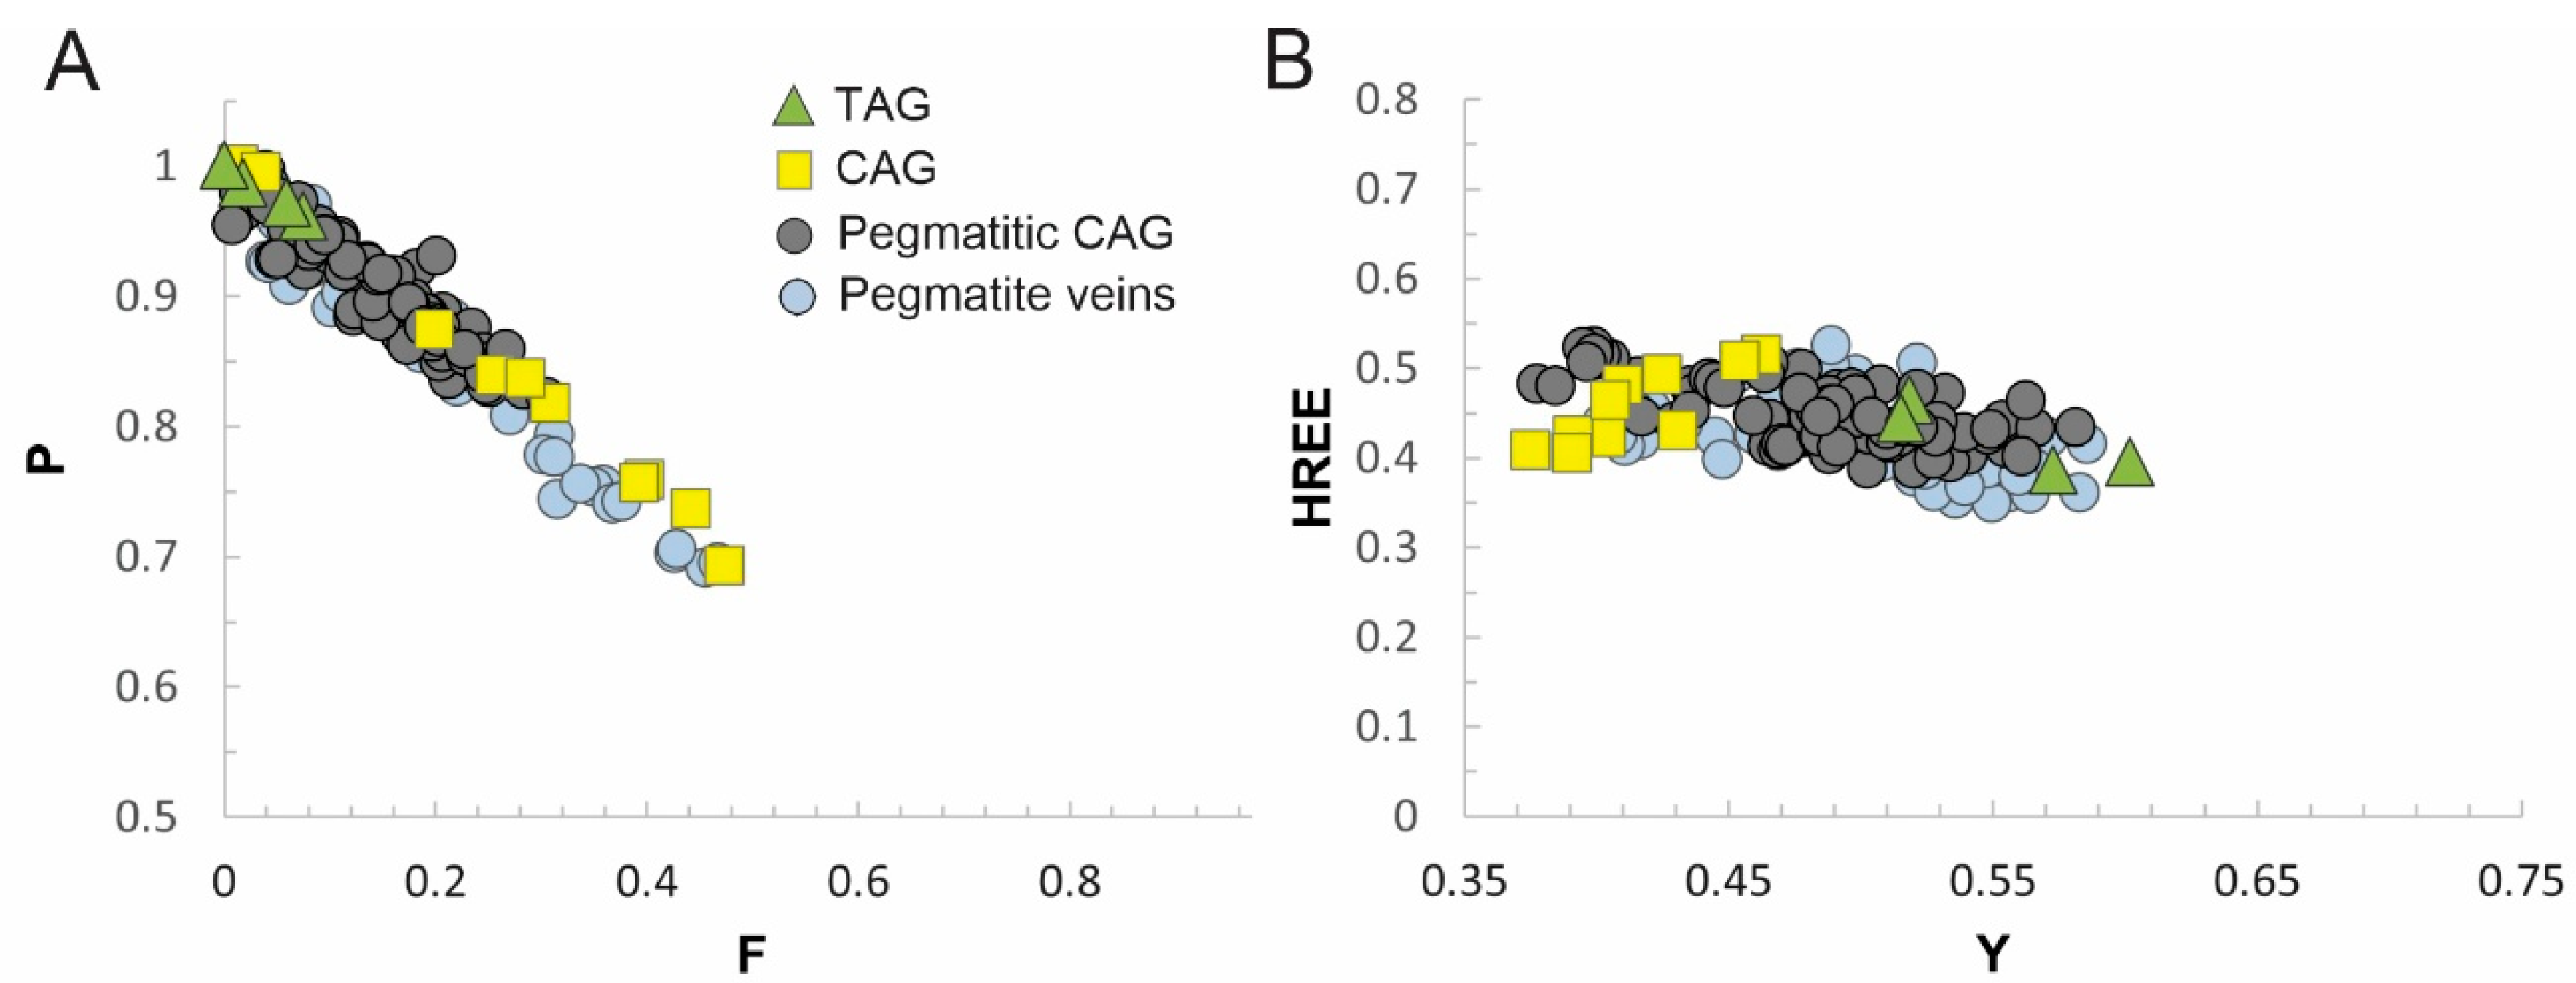
Xenotime-(Y) is the main Y + HREE ore mineral in the Madeira deposit, and it was not affected by hydrothermal activity in the same way as pyrochlore and thorite, which will likely favor its beneficiation. The most significant characteristic of xenotime is its higher F content and its control on mineral composition [40]. Fluorine was detected in all xenotime crystals from the CAG (up to 5.10 wt.% F, average 2.83 wt.% F) and from the pegmatitic CAG (up to 1.40 wt.%, average 1.30 wt.%) and in some crystals from the transitional rock. Where xenotime is richer in F, Na and Si increase, whereas P (Figure 6A) and Ca decrease, along with the effectiveness of the thorite-type substitution. Fluorine also exerts control on the HREE/Y ratio (Figure 6B), with F-enriched xenotime showing increased REE contents, especially Er and Yb.
There is no infrared spectroscopy evidence of OH in the xenotime structure. The presence of F in the structure of xenotime caused shortening of both the a and c parameters, which were modified in different proportions (Table 2). The authors contend that fluorine substitutes for O, forming PO3F tetrahedra, as in bobdownsite [48], in which the halogen causes shortening of both the a and c parameters in different proportions. Because this substitution decreases the unit-cell volume and, consequently, increases the difficulty of accommodating larger cations, F-rich xenotime preferentially incorporates Er and Yb at the expense of Y, and the incorporation of LREE in F-rich crystals is virtually impossible. The shrinkage of the unit cell likely hampers the replacement of P by Si, explaining other chemical features, such as the good correlation between P and F, the weak correlation between P and Si, and the lower effectiveness of the thorite-type substitution in F-rich xenotime.

4.2. Thorite and REE in Secondary Minerals Formed by Thorite Hydrothermal Alteration

4.2.1. Thorite in the AEG

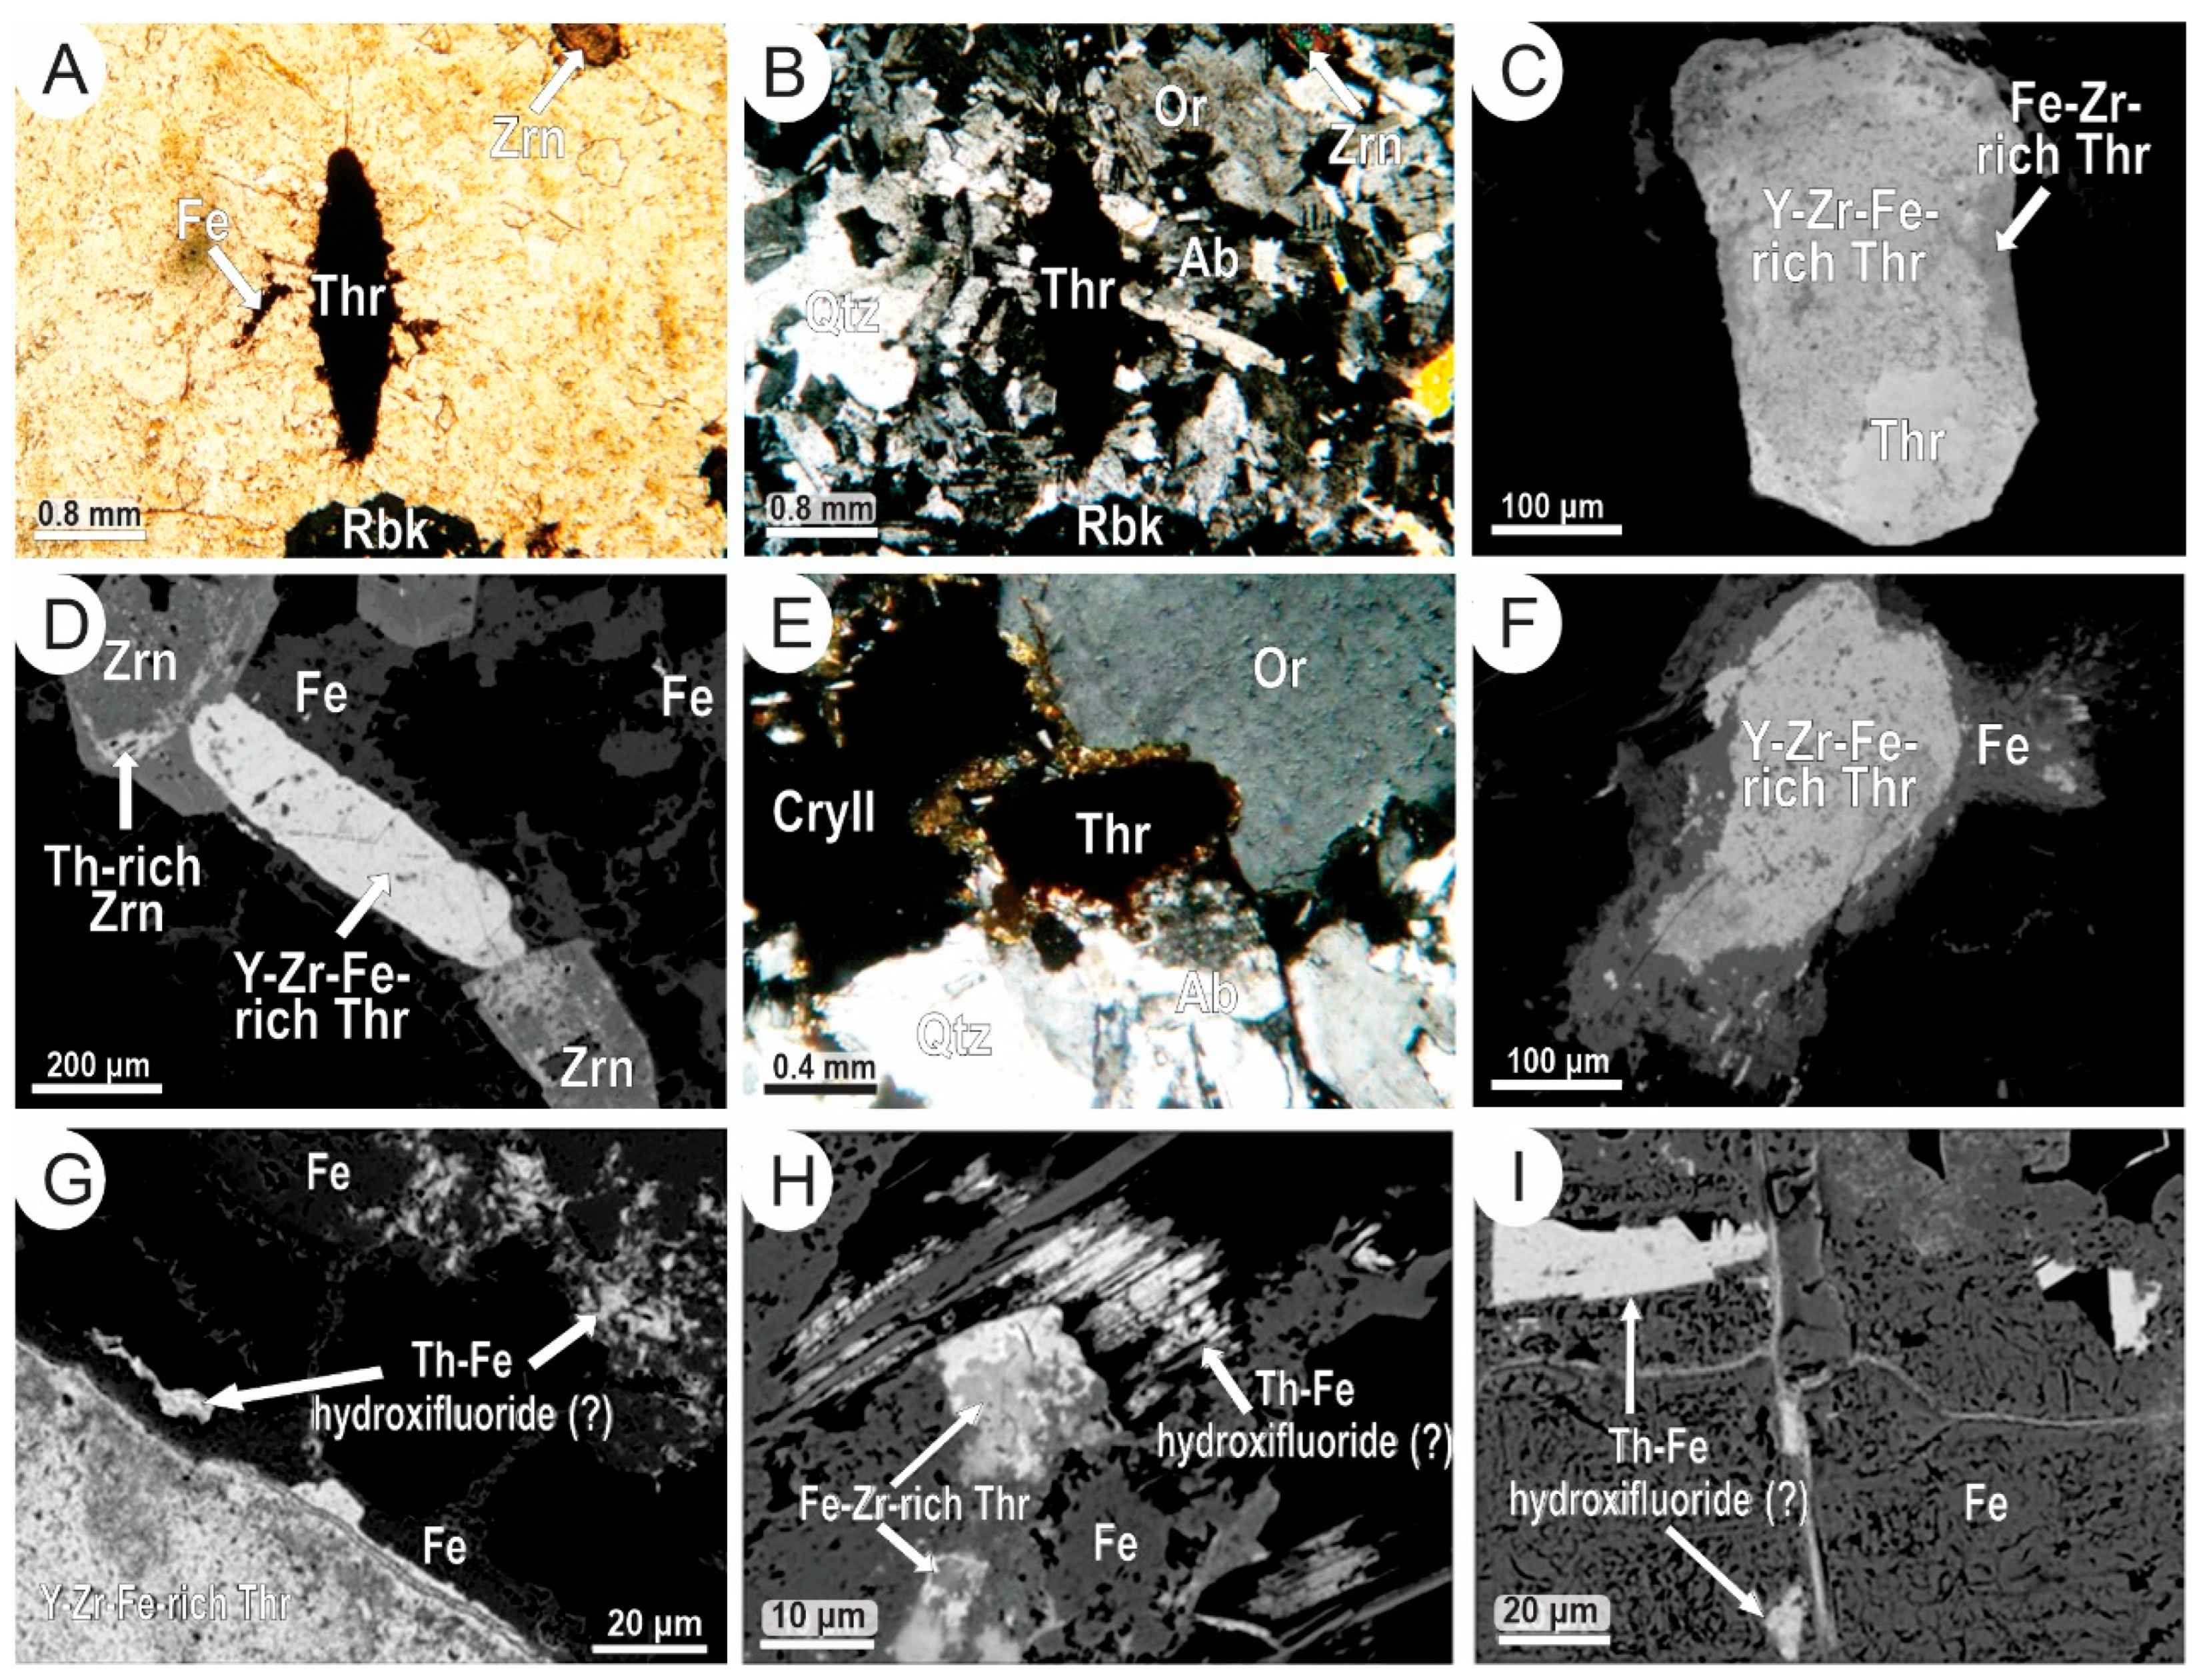
In both the CAG and BAG, thorite occurs as individual crystals ranging from 0.1 to 2.0 mm, typically embedded within a matrix of quartz, albite, and K-feldspar (Figure 7A–C), and frequently associated with zircon (Figure 7D). The crystals commonly exhibit elongated lens-shaped morphologies (Figure 7A,B), with sections perpendicular to the c-axis varying from subhedral (Figure 7C) to rounded (Figure 7E,F) due to the development of iron oxide aureoles. As a result of hydration and metamictization, thorite in the AEG is consistently opaque (Figure 7A). Contacts with the surrounding matrix are generally sharp, either straight or slightly irregular, whereas interaction with hydrothermal cryolite in the CAG produces corroded boundaries (Figure 7E,F), leading to rounding and fragmentation of the grains. Overall, thorite is interpreted as a primary phase formed predominantly during the late magmatic stage and subsequently modified by F-rich hydrothermal fluids.
The best-preserved grains contain small relicts of compositionally homogeneous, unaltered thorite (Figure 7C). In these crystals, Y-Zr-Fe-rich thorite dominates, with Fe-Zr-rich variants occurring along the margins, reflecting solid solution relationships. Intermediate compositions within the thorite–zircon solid solution system are particularly common in samples where both minerals coexist (Figure 7D), suggesting a primary origin during the magmatic evolution of the AEG. Secondary features of thorite are closely associated with iron oxide–hydroxide phases (Figure 7F,G), which form rims, inclusions, and aggregates adjacent to thorite grains, typically with sharp contacts (Figure 7G). In addition, a possible Th-Fe hydroxifluoride (?) phase has been identified within the iron oxide halos, filling voids and microfractures (Figure 7H,I).

4.2.2. Thorite in the Pegmatites

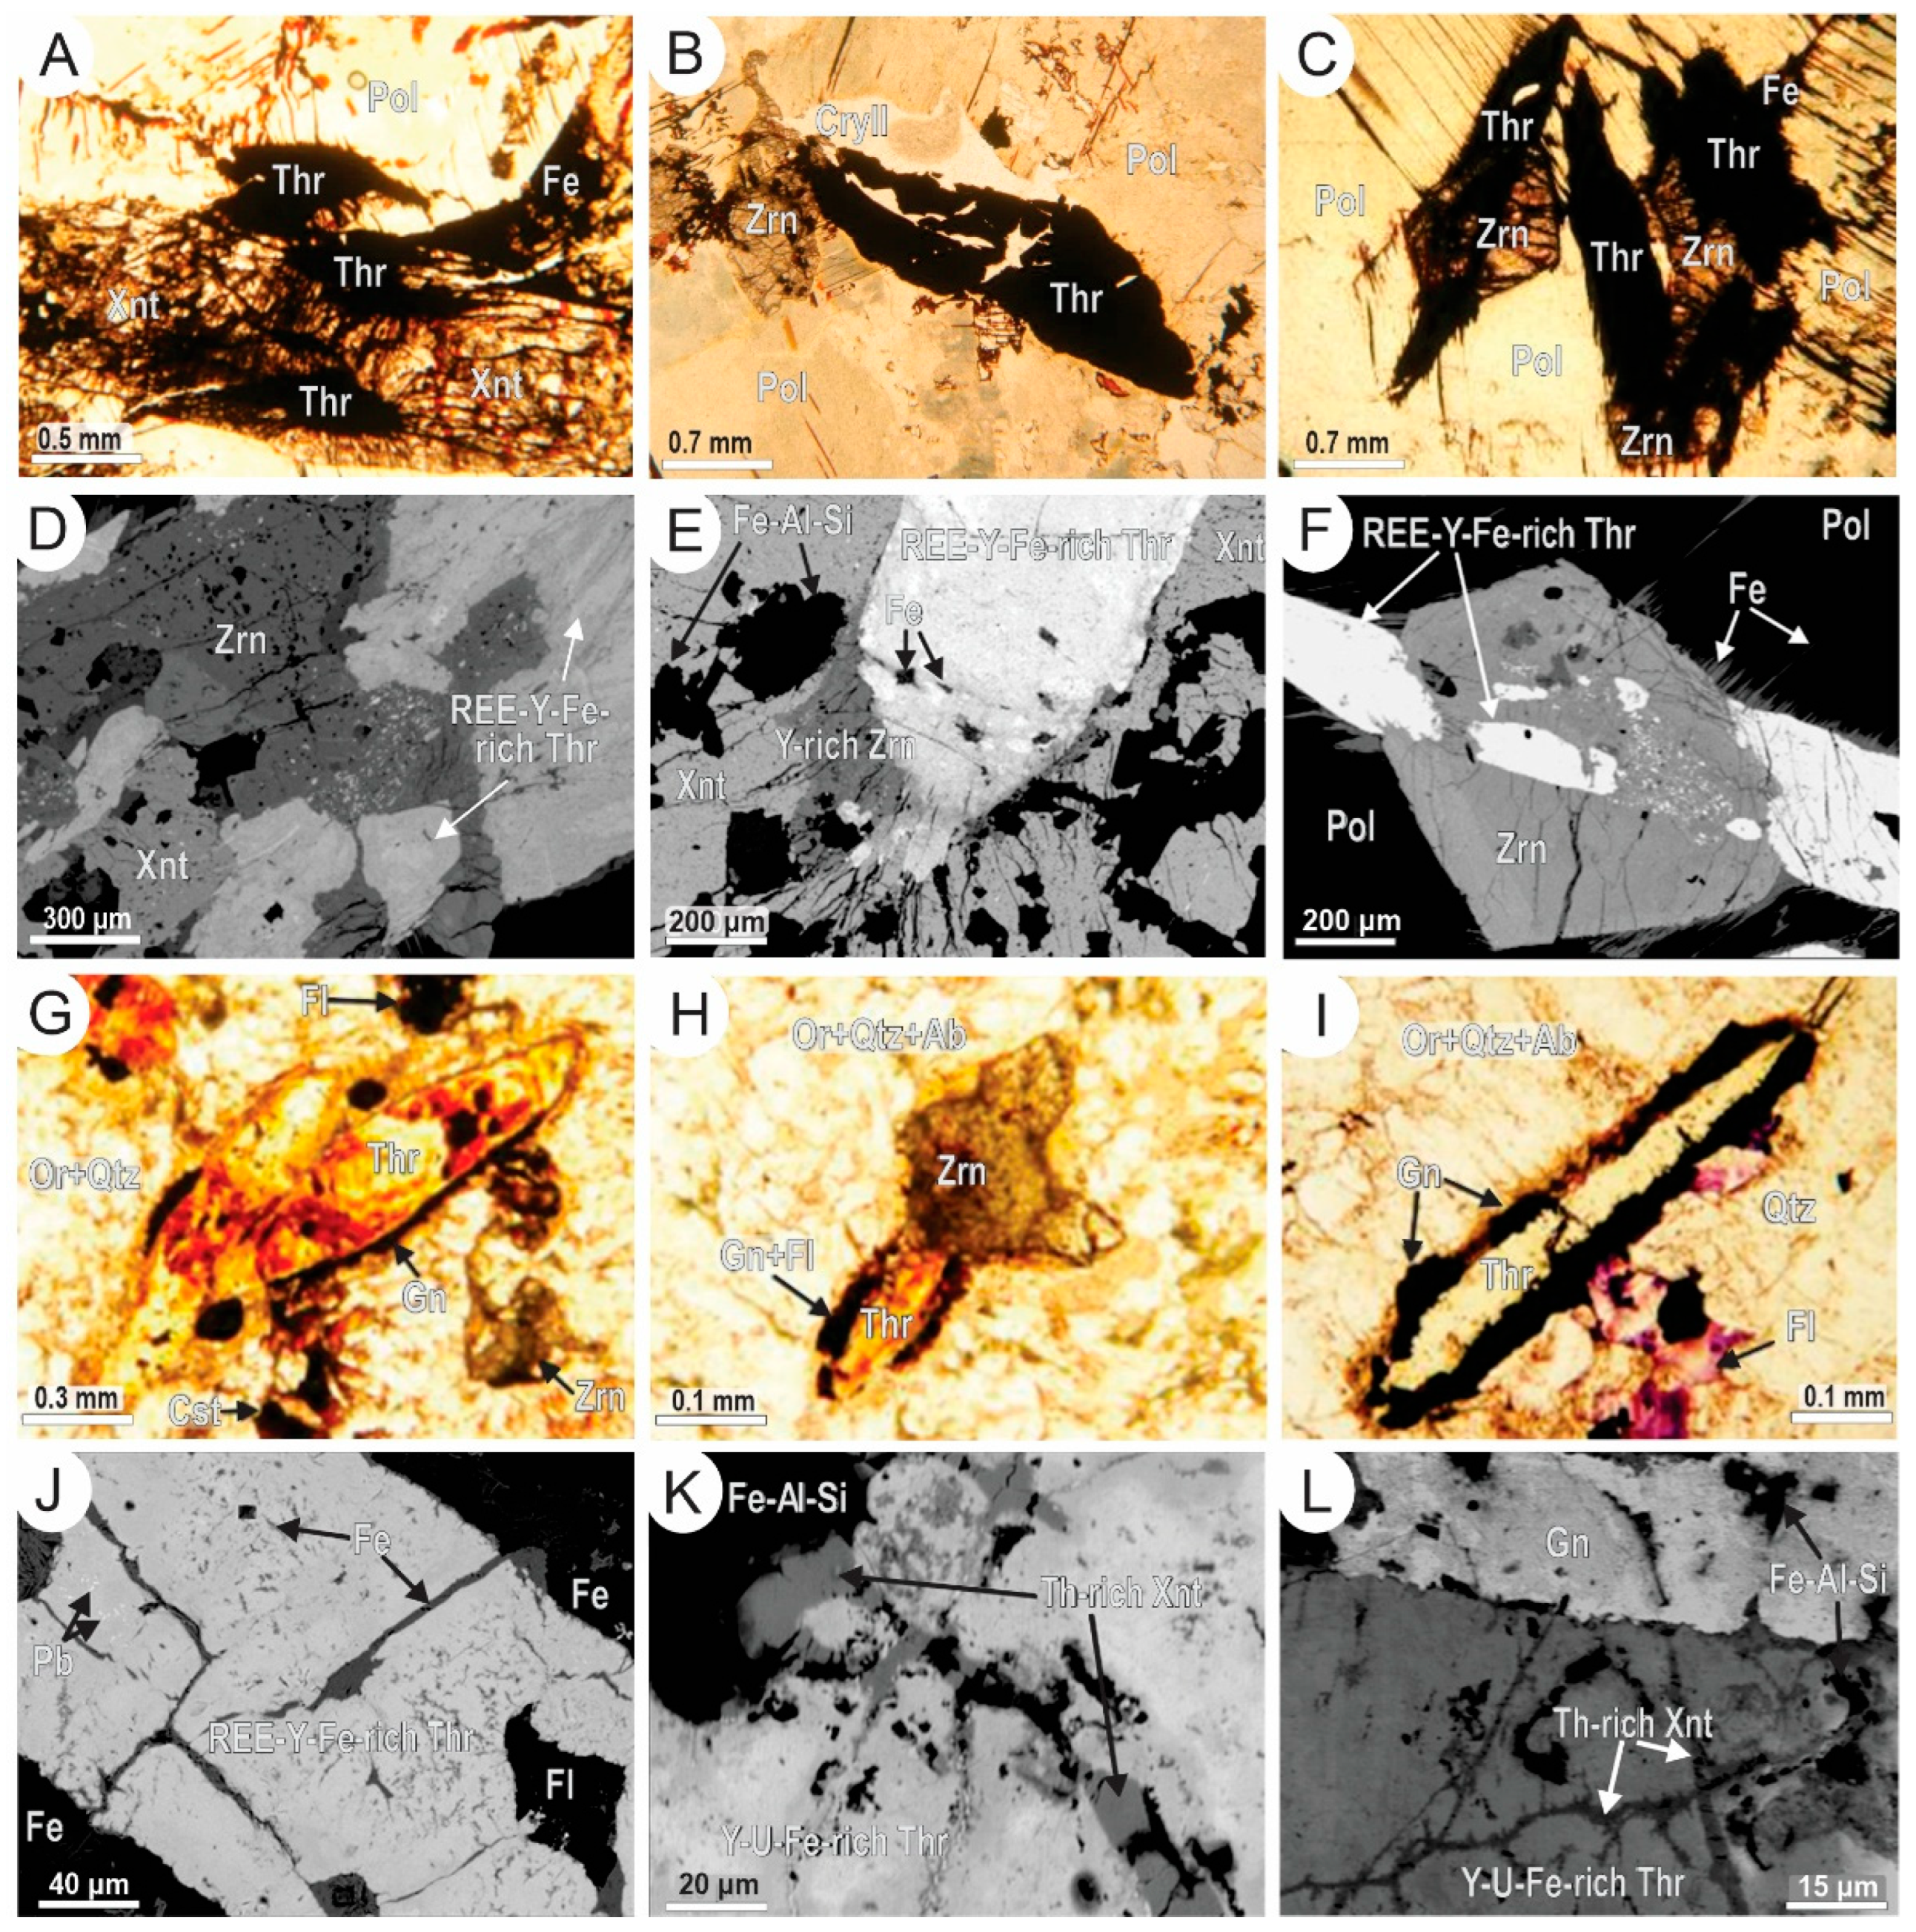
In pegmatite veins (PEG), thorite occurs as dark, completely opaque crystals that may reach lengths of up to 4 cm. These crystals are commonly enclosed within large xenotime (Figure 8A) and polylithionite (Figure 8A,B) grains or form intergrowths with zircon and xenotime (Figure 8C–F). Contacts with primary pegmatitic minerals such as polylithionite, riebeckite, and pyrochlore are generally sharp, whereas interactions with cryolite II are marked by corrosion features (Figure 8B). In several samples, thorite–zircon–xenotime solid solutions produce REE-Y-Fe-enriched thorite (Figure 8D–F), interpreted as a primary phase within the PEG. Subsequent hydrothermal activity, locally associated with hydraulic fracturing (Figure 8B), resulted in pervasive alteration of thorite, strongly influenced by its chemical composition. Fractures, voids, and grain margins are filled with secondary phases, including (Th, Fe)-aluminosilicates, Th-Fe-rich hydroxifluoride, quartz, and subordinate (Th, Ca, Fe, Sr)-Y-rich fluorides.
In border pegmatites (BPEGs), thorite is significantly smaller (typically 1–2 mm) and ranges from translucent to opaque. Twinned crystals (Figure 8G) are frequent, and zircon is commonly associated (Figure 8H), whereas xenotime is absent. Unlike in PEG, contacts with fluorite are not corrosive. Thorite grains are often surrounded by galena rims (Figure 8G–I), which partially replace the original crystal boundaries, leaving relict cores within the sulfide. Iron oxide may also occur as rims, inclusions, or microveins (Figure 8J). Additionally, microveins of Th-rich xenotime (Figure 8K,L) have been observed within thorite crystals. Minor occurrences of Ca-Y-rich fluorides and Fe–aluminosilicate are also associated with thorite and fluorite.

4.2.3. REE Contents in Thorite and Associated Secondary Minerals

In all the rocks, thorite is highly hydrated (OH was calculated by stoichiometry based on charge balance considerations) with a low average Th concentration (~48 wt.% ThO2) and high contents of Fe (0.11 to 29.56 wt.% Fe2O3) and F (up to 6.02 wt.% F) [26]. Thorite from the CAG, BAG and PEG have similar contents of F (average of ∼4.50 wt.% F), and in the BPEG, the average content of F is systematically lower, with ∼2.35 wt.% F. Thorite has compositions either close to its respective poles (Table 3 crystal 1) or as limited solid solutions in the thorite–zircon–xenotime–coffinite system. In the AEG, the most common composition is an Y-Zr-Fe-rich thorite (crystal 2), characterized by Y2O3 slightly above 1 wt.% (up to 1.78 wt.% Y2O3). In all thorite grains analyzed from the CAG and BAG, the REE contents range from 0.05 to 0.63 wt.% LREE2O3 and from 0.45 to 2.5 wt.% HREE2O3. The LREE/HREE ratio is normally below 0.5, although ratios up to 1.22 were observed in the analysis with lower analytical totals.
Thorites from PEG and BPEG are systematically richer in Y and REEs than those in the AEG, forming REE-Y-(Fe)-rich thorite and REE-Y-U-(Fe)-rich thorite (Table 3, crystals 5–8). In thorite grains from the PEG, the REE content is up to 0.33 wt.% LREE2O3 and 2.98 wt.% HREE2O3, while Y goes up to 4.21 wt.% Y2O3. In the BPEG, the common thorite is also enriched in Y (up to 6.54 wt.% Y2O3) and HREEs (up to 6.86 wt.% HREE2O3). The highest concentrations of Y and REEs were measured in a single thorite crystal, reaching 6.54 wt.% Y2O3 and 7.39 wt.% REE2O3. These values correspond to approximately 22.0 mol% of a xenotime component, as indicated by a P2O5 content of 5.53 wt.%. Microveins within thorite in the PEG and BPEG are filled with Th-Fe-rich xenotime and xenotime (Table 3, crystals 9, 10). A comparison of the average concentrations of REEs and Y shows that thorites from the eastern BPEG are richer (5.23 wt.% Y2O3; 3.11 wt.% REE2O3), followed by thorite from the northern BPEG (3.38 wt.% Y2O3, 2.44 wt.% REE2O3), the PEG (3.04 wt.% Y2O3, 2.10 wt.% REE2O3), and the granites themselves (1.02 wt.% Y2O3, 1.27 wt.% REE2O3).
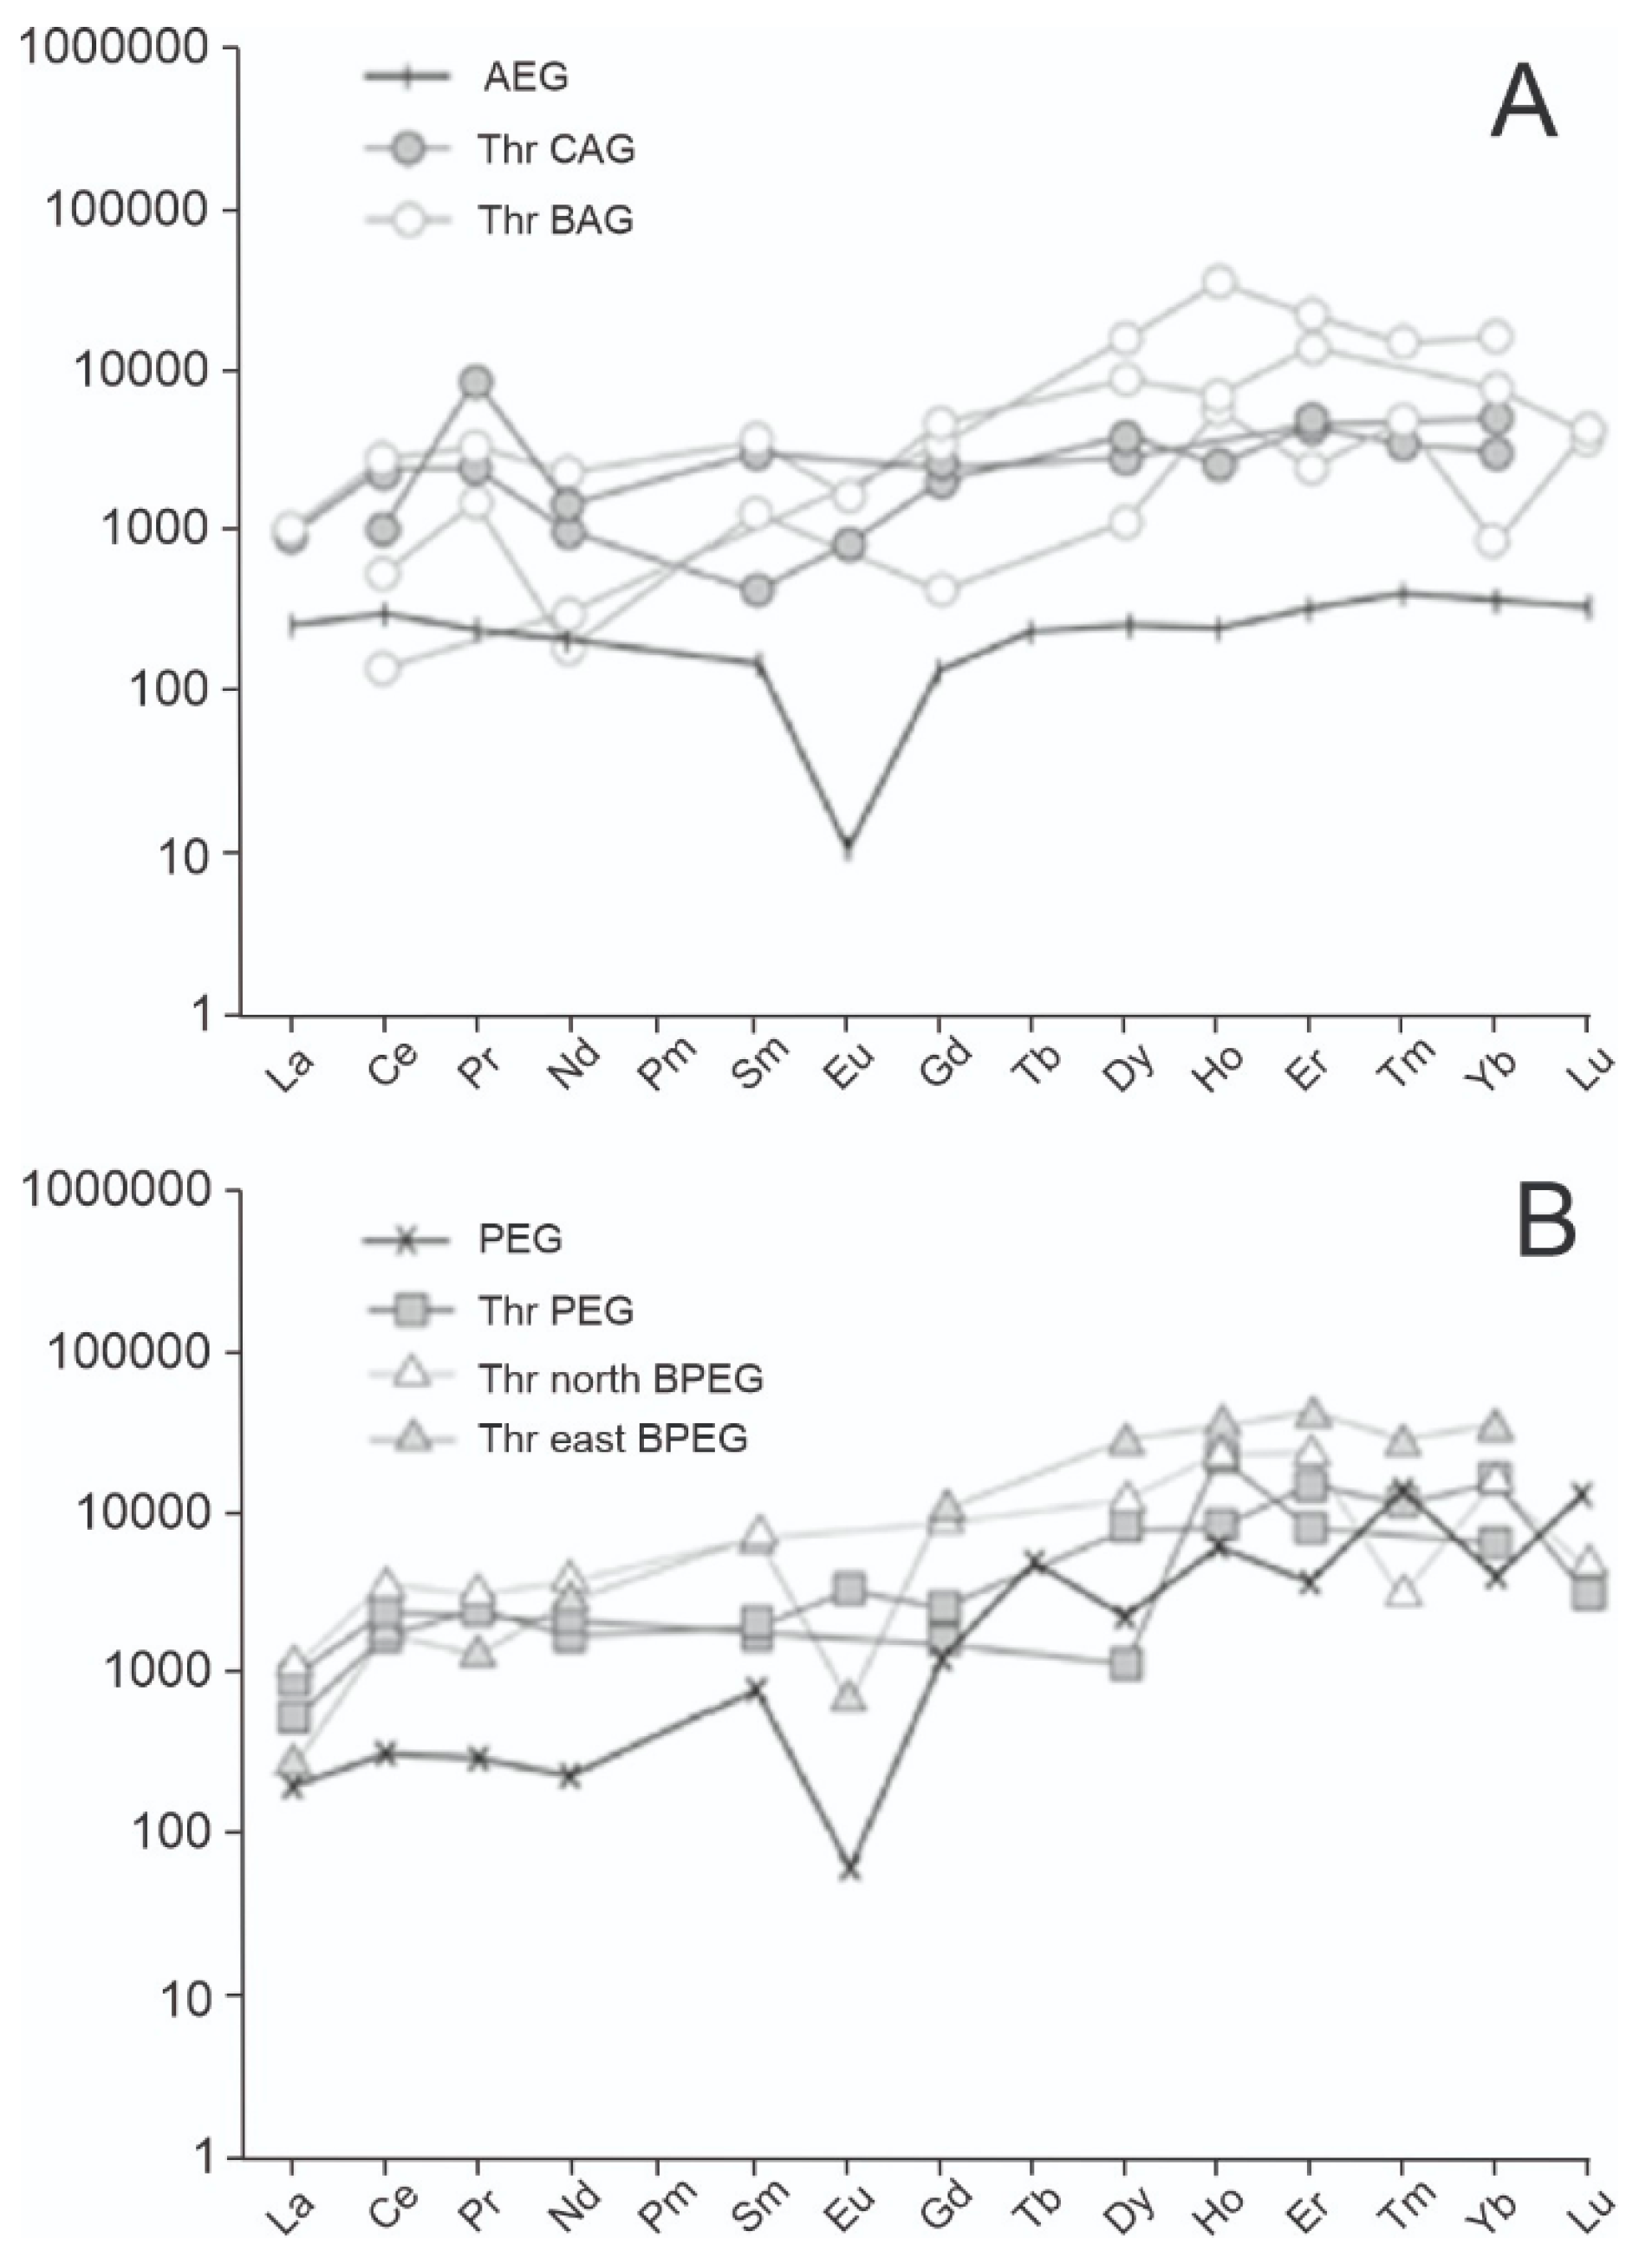
Normalized REE patterns of thorites from the CAG and BAG are broadly comparable (Figure 9), although BAG samples show slight enrichment in HREEs. Among pegmatitic occurrences, thorite from the BPEG contains somewhat higher HREE concentrations (2.32 wt.% HREE2O3) than that from the PEG (1.58 wt.% HREE2O3). Overall, thorite from pegmatites exhibits a greater degree of REE fractionation than its counterparts in the granitic subfacies. Despite these variations, the REE patterns of thorite closely mirror those of their respective rocks, supporting the interpretation of Staatz et al. [49] that thorite composition primarily reflects the chemistry of the melt at the time of crystallization. The data further indicate that LREEs were preferentially incorporated in the host granite, whereas HREEs became progressively concentrated in the pegmatitic environments, where they were partitioned among several mineral phases, including thorite.
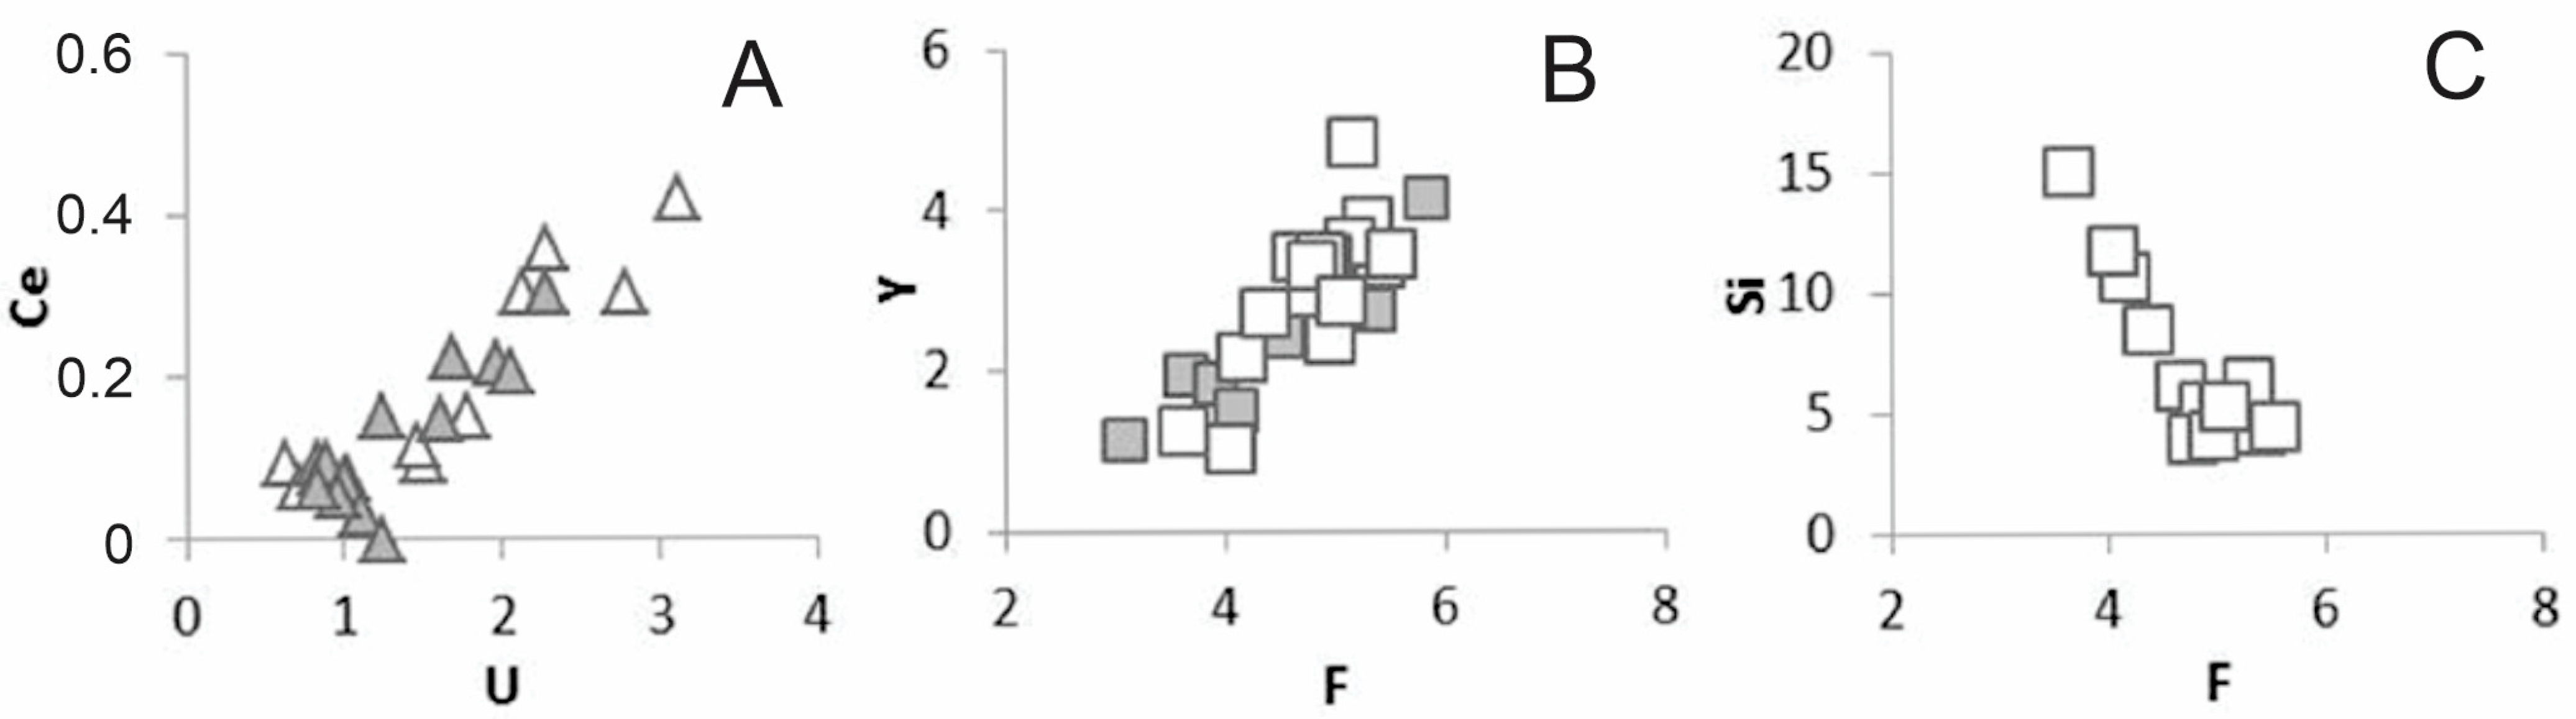
In thorite from the BPEG, which displays the highest proportions of xenotime and coffinite components, a positive correlation between Ce and U is observed (Figure 10A), a feature not identified in other occurrences. Additional compositional trends include a positive correlation between F and Y (Figure 10B) and a negative correlation between F and Si (Figure 10C). These patterns are consistent with fluorine incorporation via the substitution (Th, U)4+1−x (Y)3+x (SiO4)1−x (OH, F)3x. Furthermore, Y + REE/P ratios consistently exceeding unity (>1) indicate that the incorporation of these elements cannot be explained solely by the xenotime-type substitution (Y3+ + P5+ ↔ Th4+ +Si4+) [51].
Representative compositions of the REE-bearing secondary minerals associated with thorite are presented in Table 4. The Th-Fe-rich fluoride (crystals 1, 2) presents up to 1.80 wt.% LREE2O3 in the CAG, and 1.77 Y2O3 in the PEG. In the PEG, an Fe-Y-Th-rich fluoride was also observed (crystals 3, 4), in which the Y content reaches up to 15.95 wt.% Y2O3, 4.38 wt.% HREE2O3, and 0.84 wt.% LREE2O3. This mineral can be a thorbastnäsite or another fluorcarbonate.

4.3. Zircon

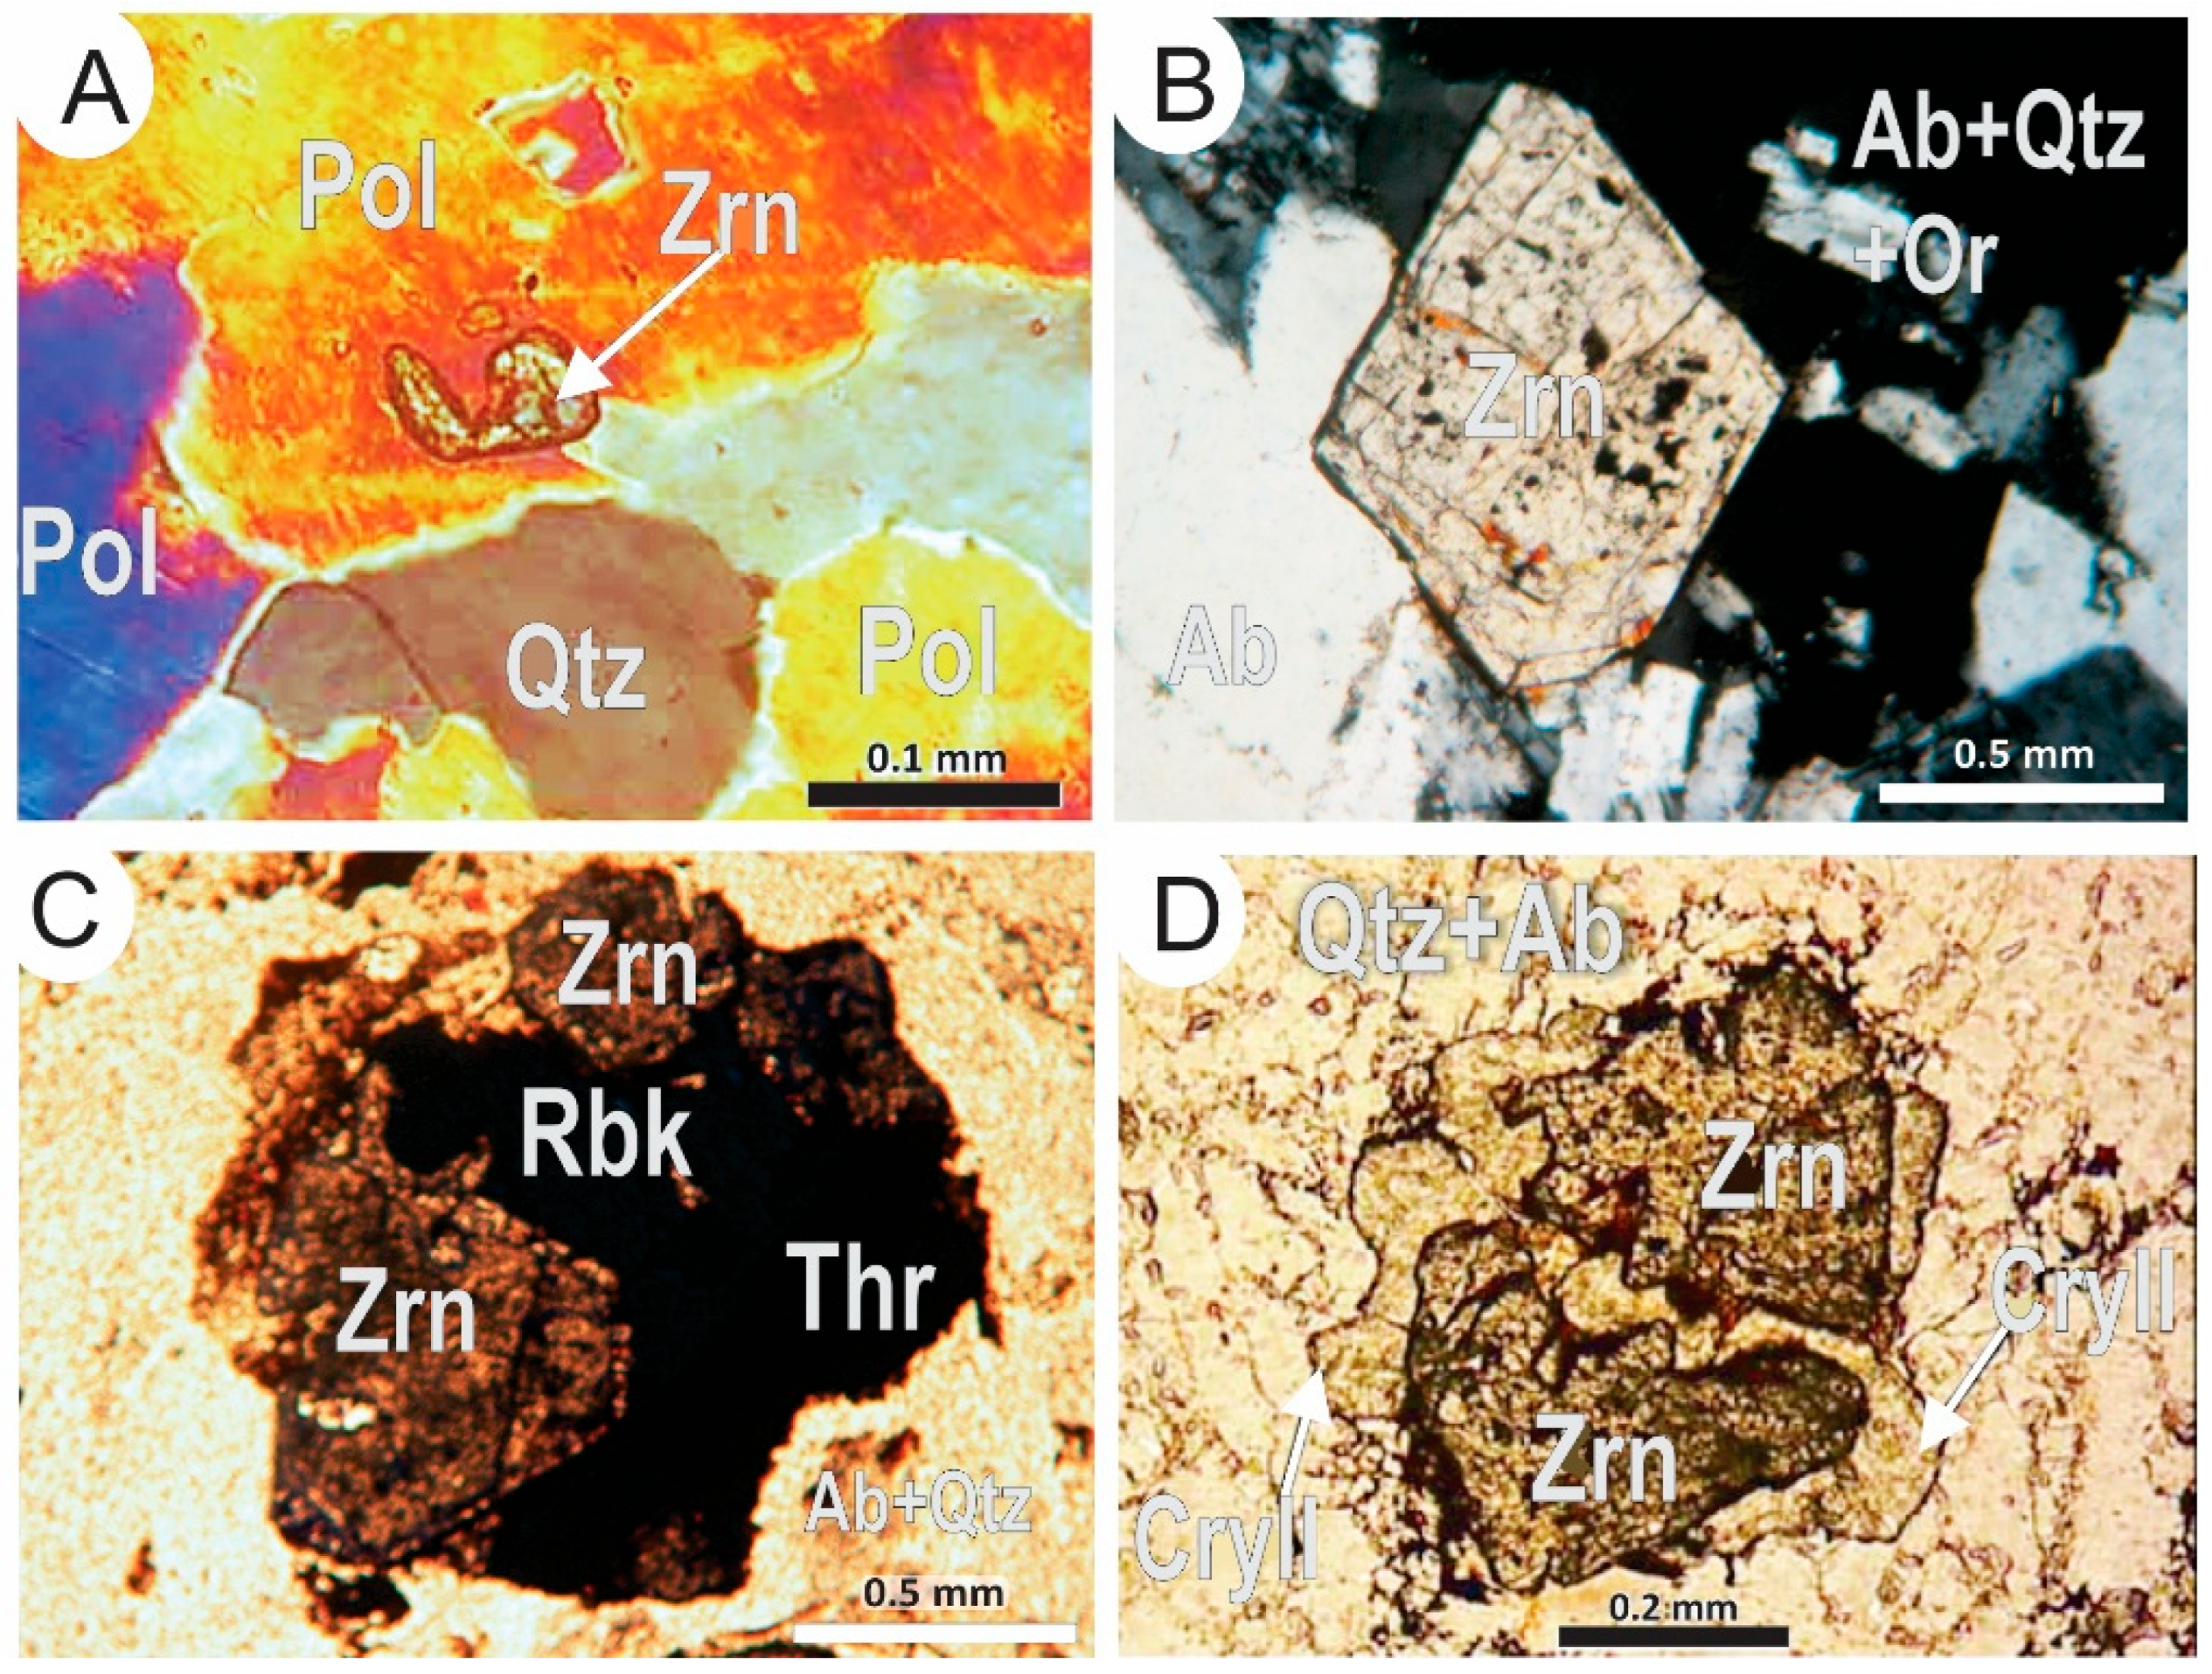
Early zircon is predominantly skeletal (Figure 11A) and occurs mainly as inclusions in other minerals and with grain sizes of approximately 0.04 mm. A second generation of zircon occurs as individual euhedral-to-subhedral crystals (0.14 to 3 mm) (Figure 11B) or forming aggregates with cassiterite, thorite, mica, cryolite, riebeckite, and opaques (Figure 11C); in both cases, they commonly exhibit corroded contacts with hydrothermal cryolite (Figure 11D). Oscillatory chemical zoning is observed in back-scattered electron images of most grains. Zircon crystals commonly contain inclusions of albite, magnetite, and cavities filled by cryolite, micas, and opaque minerals. Zircons from the CAG and BAG are texturally similar but are much more abundant in the BAG (up to 5 vol.%) than in the CAG (~2 vol.%).
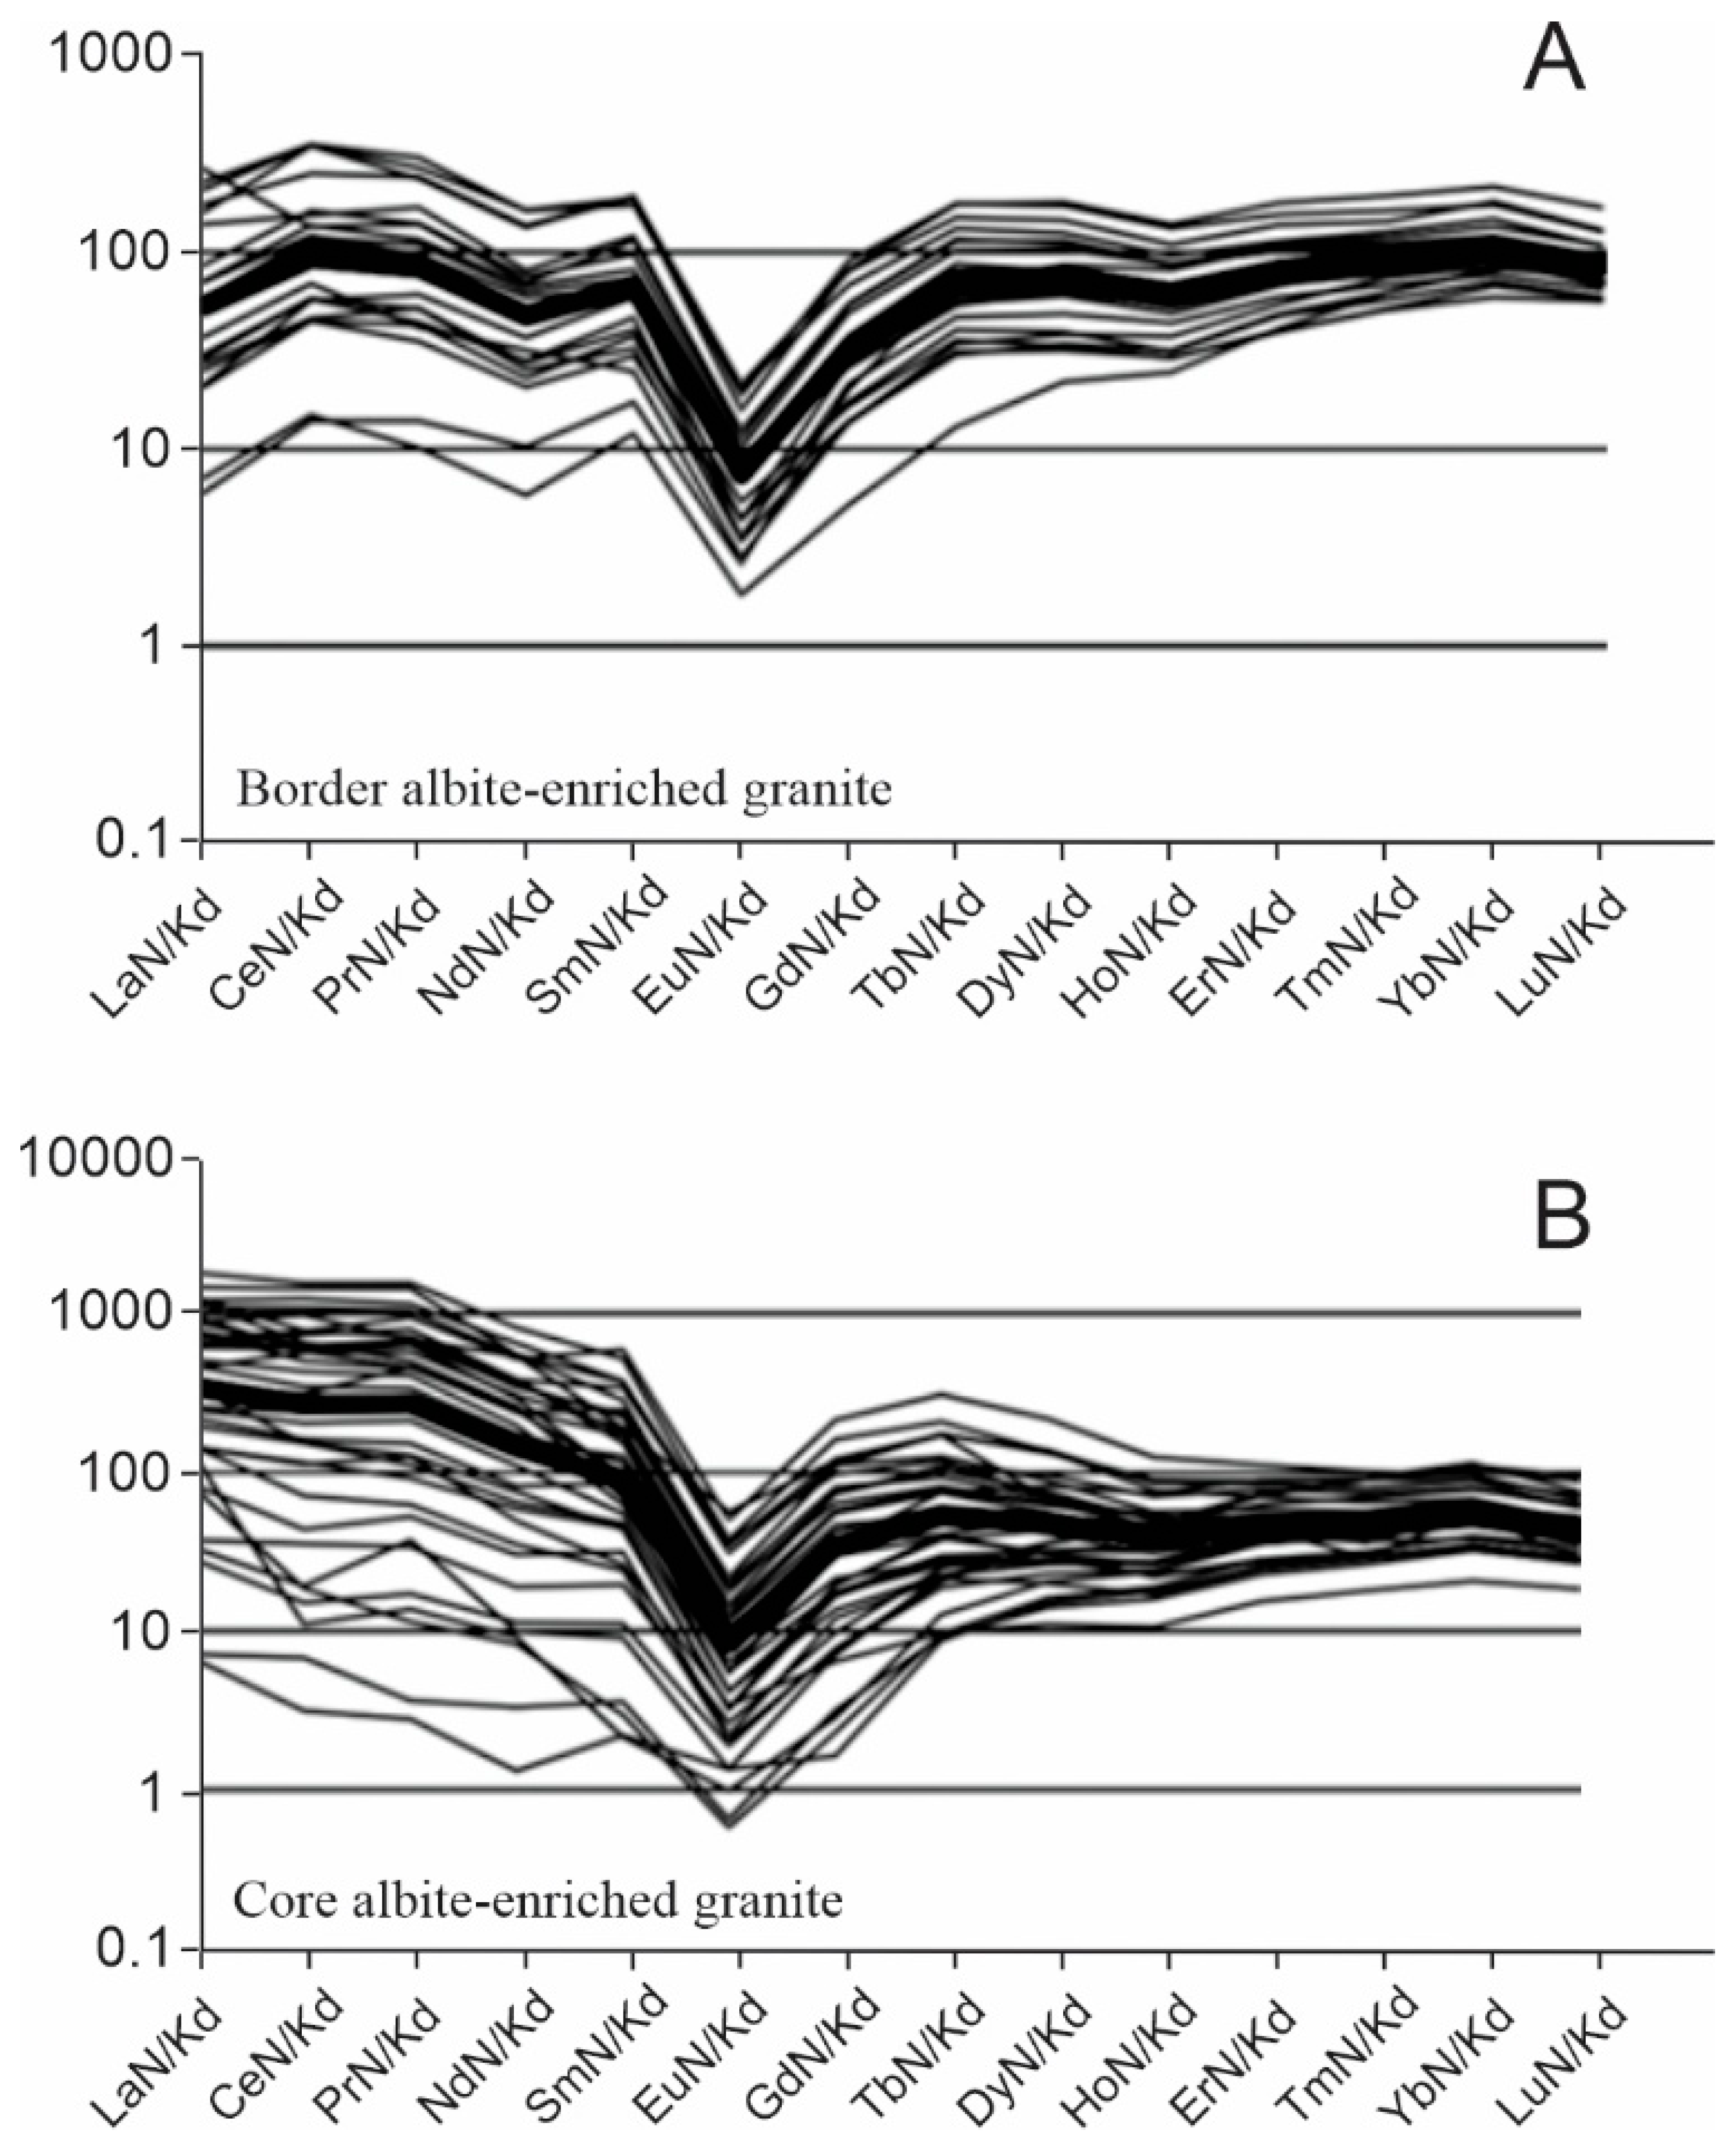
Nardi et al. [22] examined the trace element composition of zircon from the AEG and older facies. Here, we focus on BAG and CAG data (Table 5), whose REE-normalized patterns are shown in Figure 12. The sum of the REE contents in the zircon grains varies from 500 to 20,000 ppm. Eu anomalies show values from 0.05 to 0.40. Zircon with a negative Eu anomaly is typical of A-type granite, reflecting the whole-rock REE pattern [22]. Positive Ce anomalies are conspicuous in the BAG. Such positive Ce anomalies are commonly reported in magmatic zircon [52,53]. Positive Sm anomalies are more prominent in zircons from the BAG than from the CAG. According to Nardi et al. [22], the REE contents in zircon grains are close to the values expected from mineral/rock partition coefficient data reported by several authors [53,54,55,56,57,58]. The estimated melt patterns, normalized to chondrite values, from which the zircon crystallized (calculated by dividing the REE content in zircon by the mineral/rock partition coefficients) are comparable to those of whole-rock samples, which points to the magmatic origin of the zircon grains.
In the CAG, HREEs and MREEs display lower values (Figure 12) than those expected for common magmatic zircon; in the BAG, all REEs show similar behavior, with a slight positive Ce anomaly. Flatter LREE patterns, lacking positive Ce anomalies and showing higher LREE contents, similar to those described by Hoskin [59] in hydrothermal zircon, are interpreted as having formed in late-crystallized grains from a melt with a higher LREE/HREE ratio due to the increase in HREE mobility linked to the formation of F complexes in the melt. The high mineral/melt partition coefficients of HREEs in zircon cause their depletion in more evolved liquids, leading to flatter REE patterns and a wider range of LREE contents in zircon grains. The CAG was produced by crystallization of a highly evolved melt [13,19], although part of its mineralogy may have precipitated from a fluid phase exsolved during resurgent boiling. The BAG facies shows the effects of subsolidus hydrothermalism. Nevertheless, its chemical composition does not show significant variations in the studied trace elements [22].
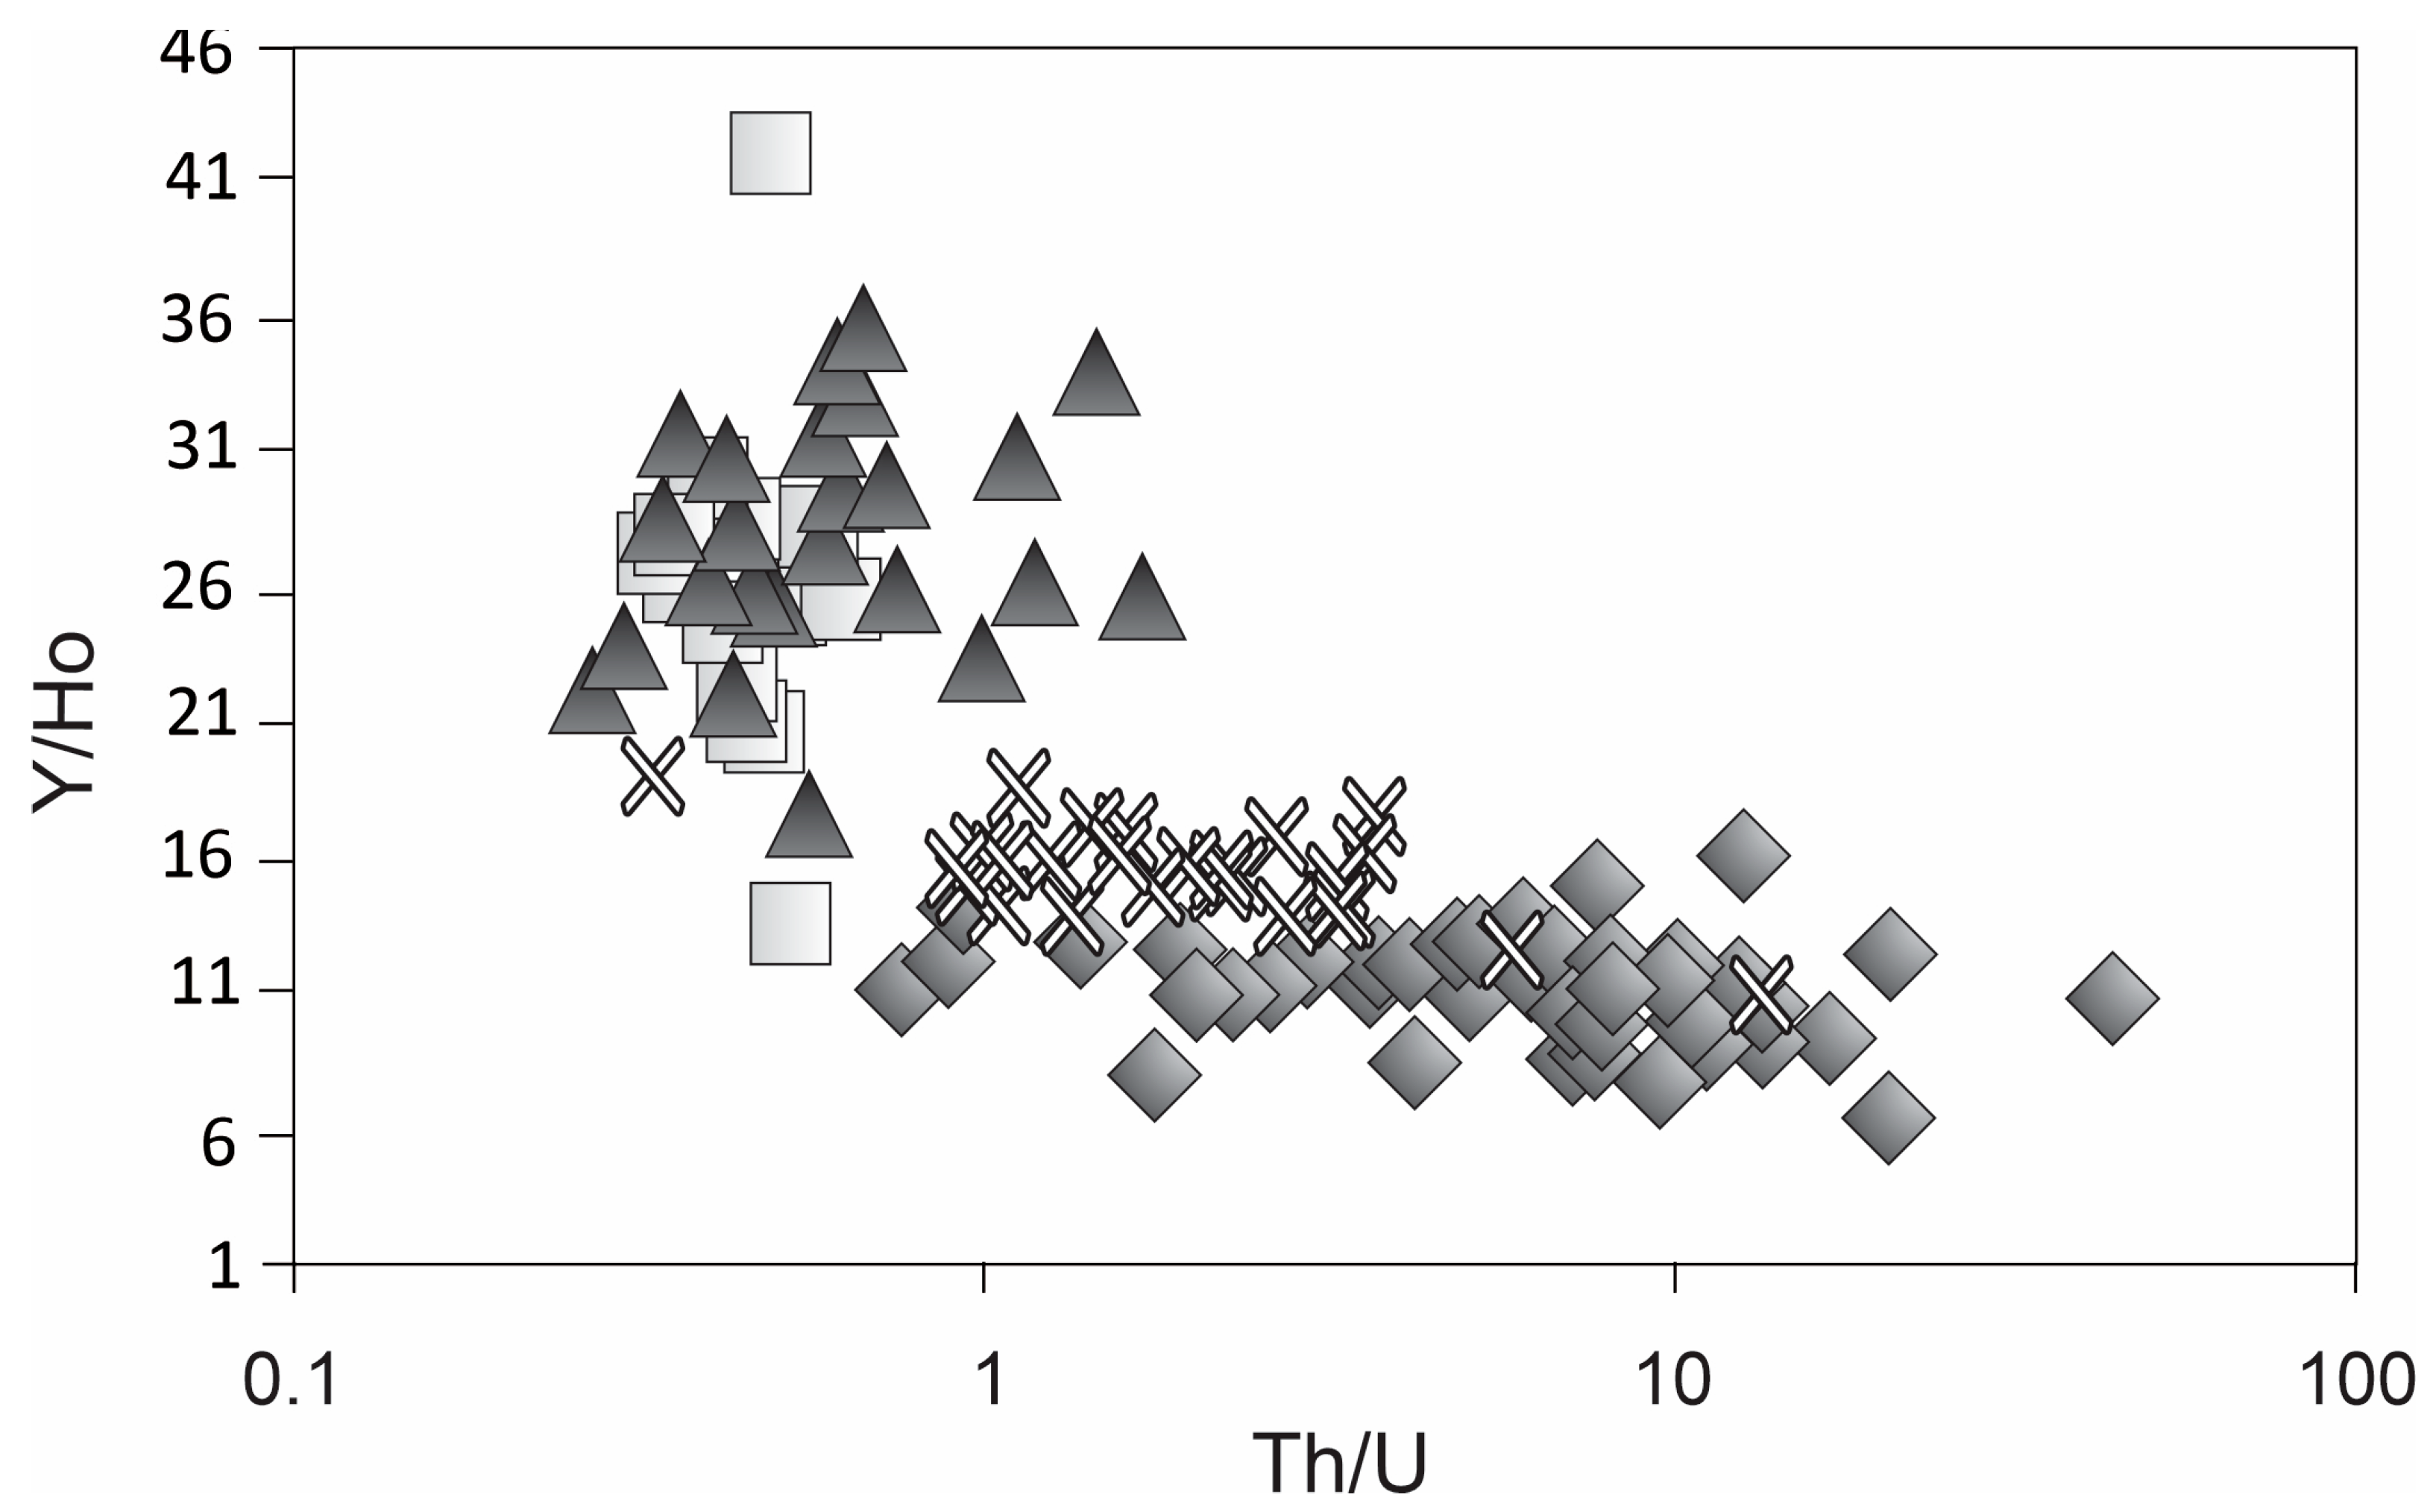
Zircon from both the CAG and BAG displays Y/Ho ratios (averaging 11.02 and 15.06, respectively) that fall within the typical range for magmatic zircon, with lower Y/Ho values reflecting relative depletion of Y. In contrast, Th/U ratios in these zircons are highly variable, commonly spanning from 1 to 80 (Figure 13), a range that differs markedly from that of whole-rock compositions, where Th/U values are generally restricted to 2–6 and do not show systematic enrichment in the albite-enriched granite subfacies [22].
Figure 12. REE contents normalized to C1 chondrite [60] for zircon grains from (A) the core albite-enriched granite and (B) the border albite-enriched granite (adapted from Nardi et al. [22]).
Minerals 16 00417 g012
In addition, some zircon crystals from both subfacies exhibit an M-type tetrad effect (Figure 12), a feature also recognized at the whole-rock scale [61]. This effect was quantified by Nardi et al. [22] using the TE1,3 parameter [62], yielding values between 1.4 and 2.0 in for BAG and 0.9 to 1.7 for CAG zircon. Following the criteria of Irber [62], values above 1.4 indicate a well-developed tetrad effect. Given the magmatic origin of these zircons, the M-type patterns are interpreted as inherited from the melt. The development of these patterns is attributed to preferential stabilization of certain REEs (Ce, Pr, Sm, Eu, Tb, Dy, Tm, and Yb, Sastri et al. [63]) through complexation during magmatic evolution. As proposed by Weksler et al. [64], such M-type tetrad signatures are characteristic of highly evolved, F-rich granitic melts and are likely related to the formation of aluminofluoride complexes.
Figure 13. Binary diagram of Y/Ho and Th/U ratios in zircon from the Madeira granite [22]. Tringles and squares refer to amphibole–biotite and biotite granites, respectively. Lozenges and X symbols represent CAG and BAG, respectively.
Minerals 16 00417 g013

4.4. Pyrochlore and REEs in Secondary Minerals Formed by Hydrothermal Alteration of Pyrochlore

4.4.1. Albite-Enriched Granite (CAG and BAG)

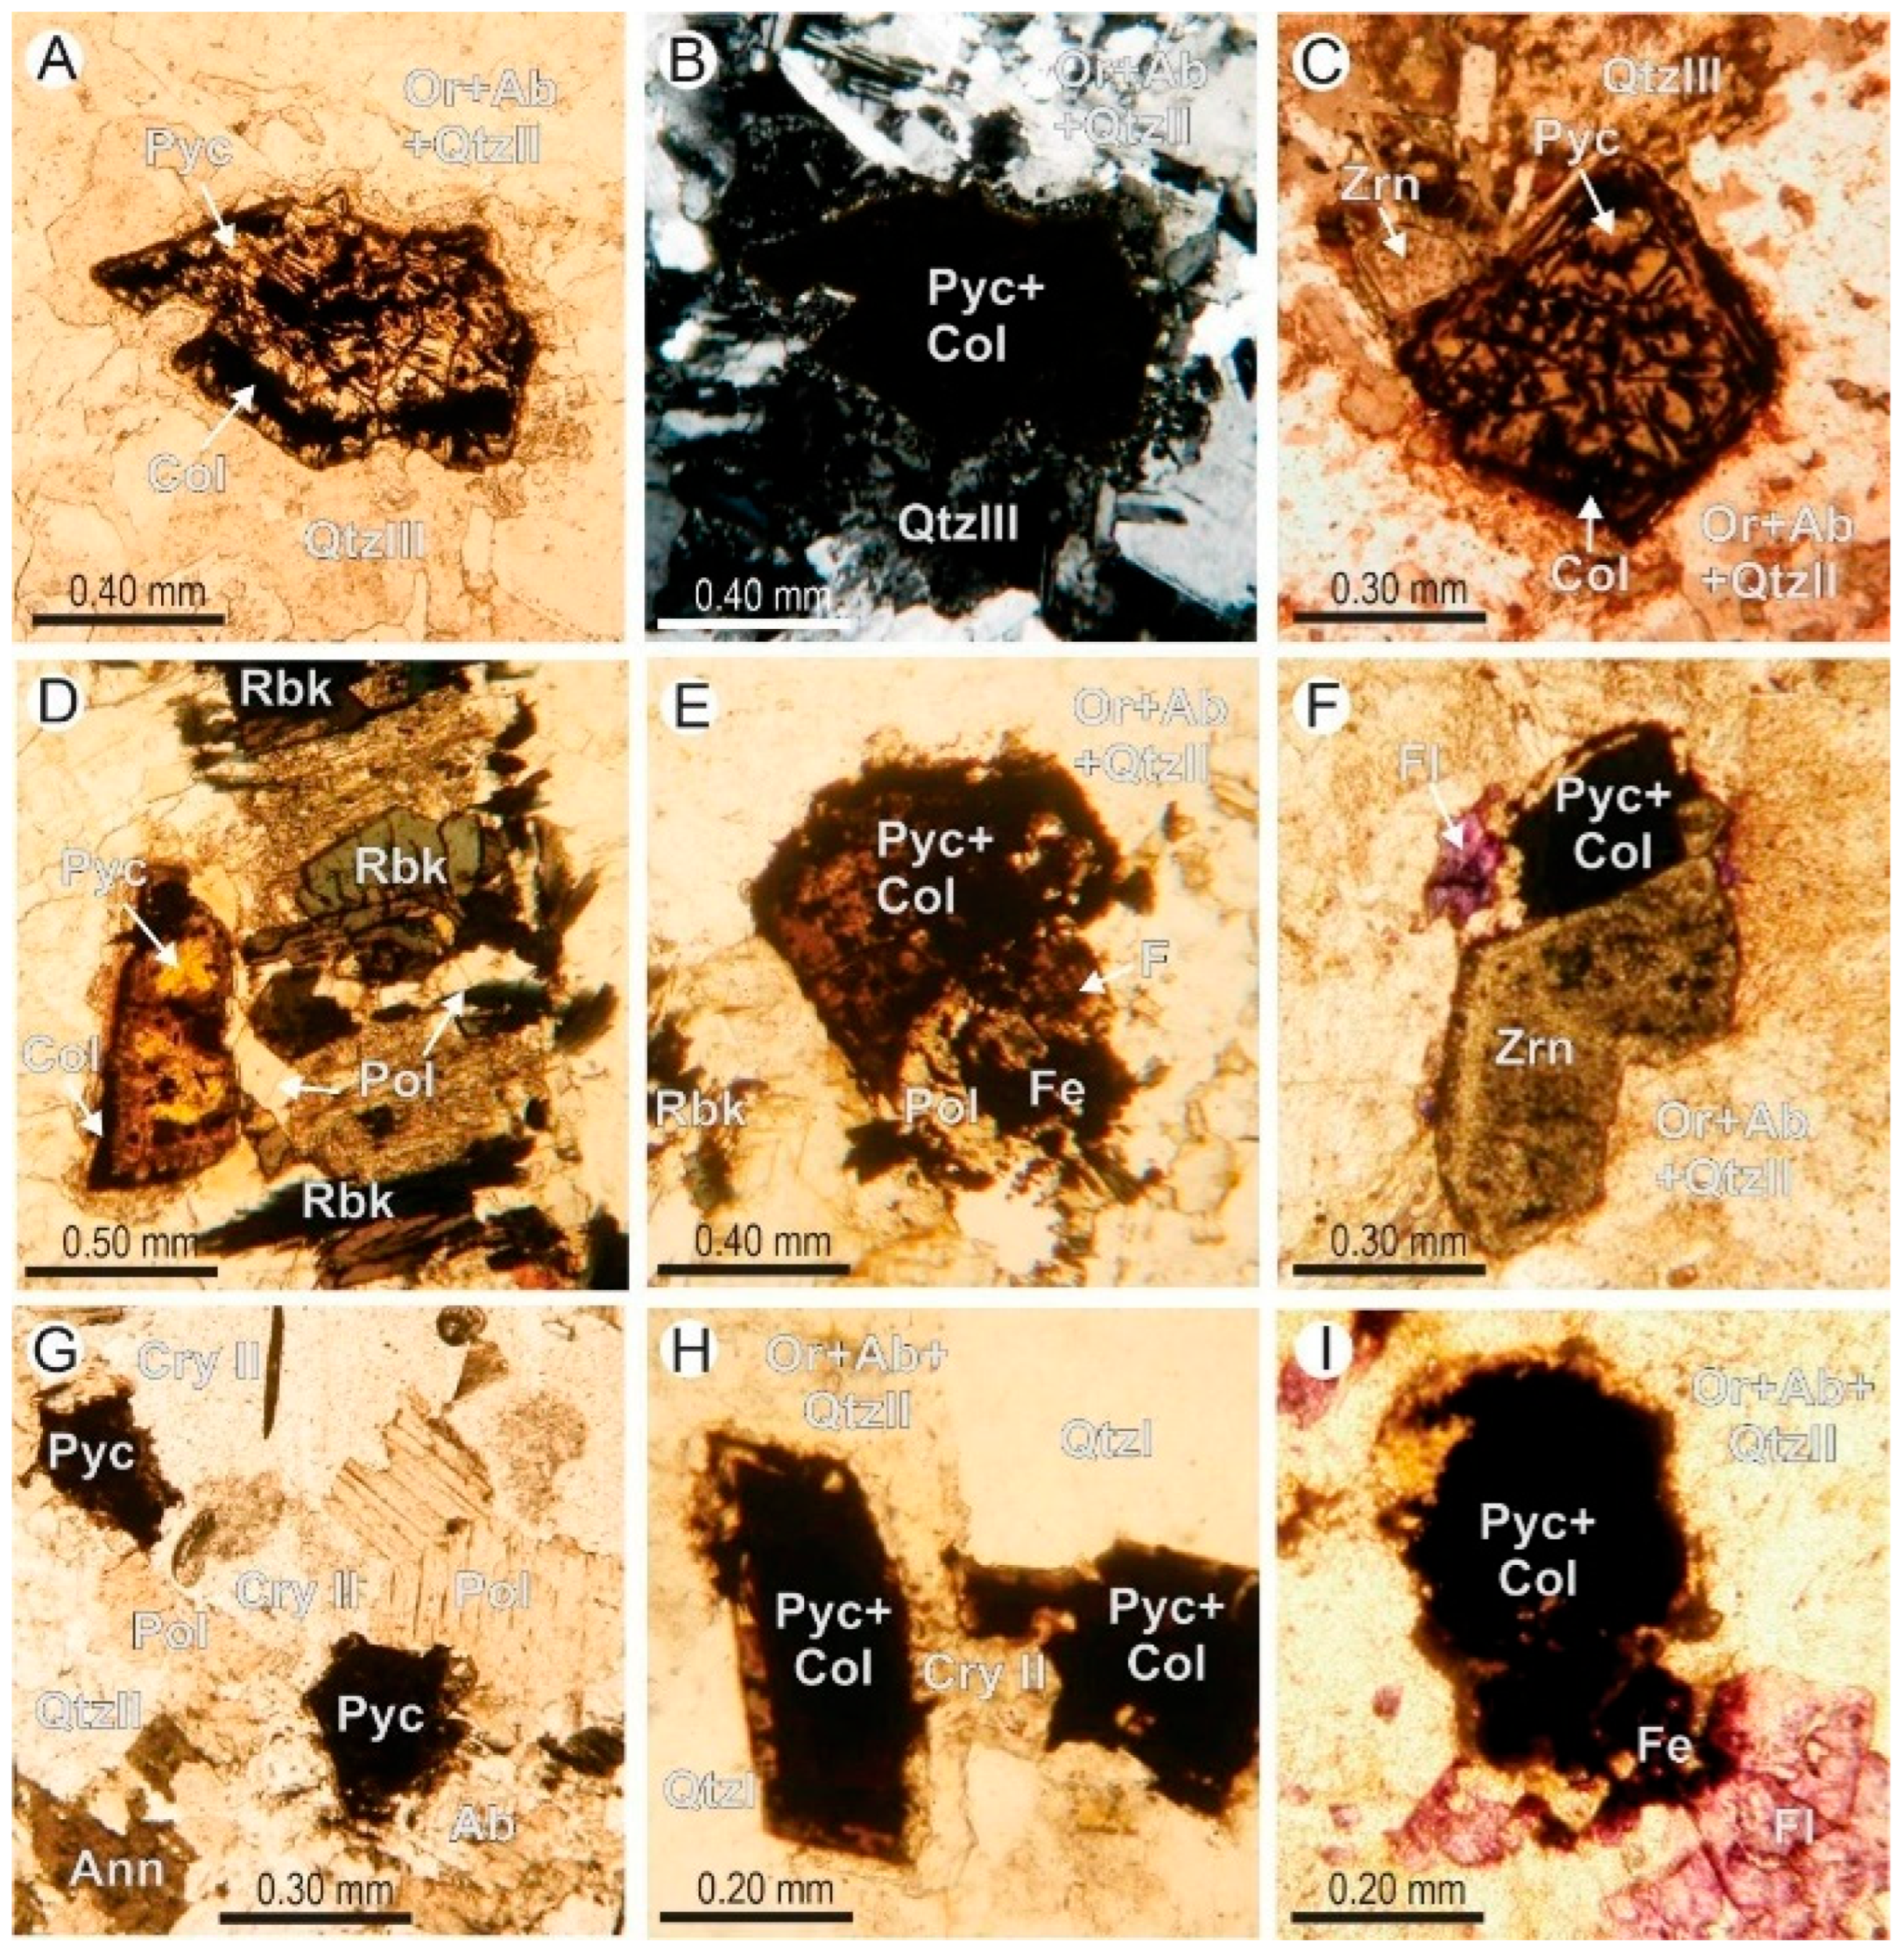
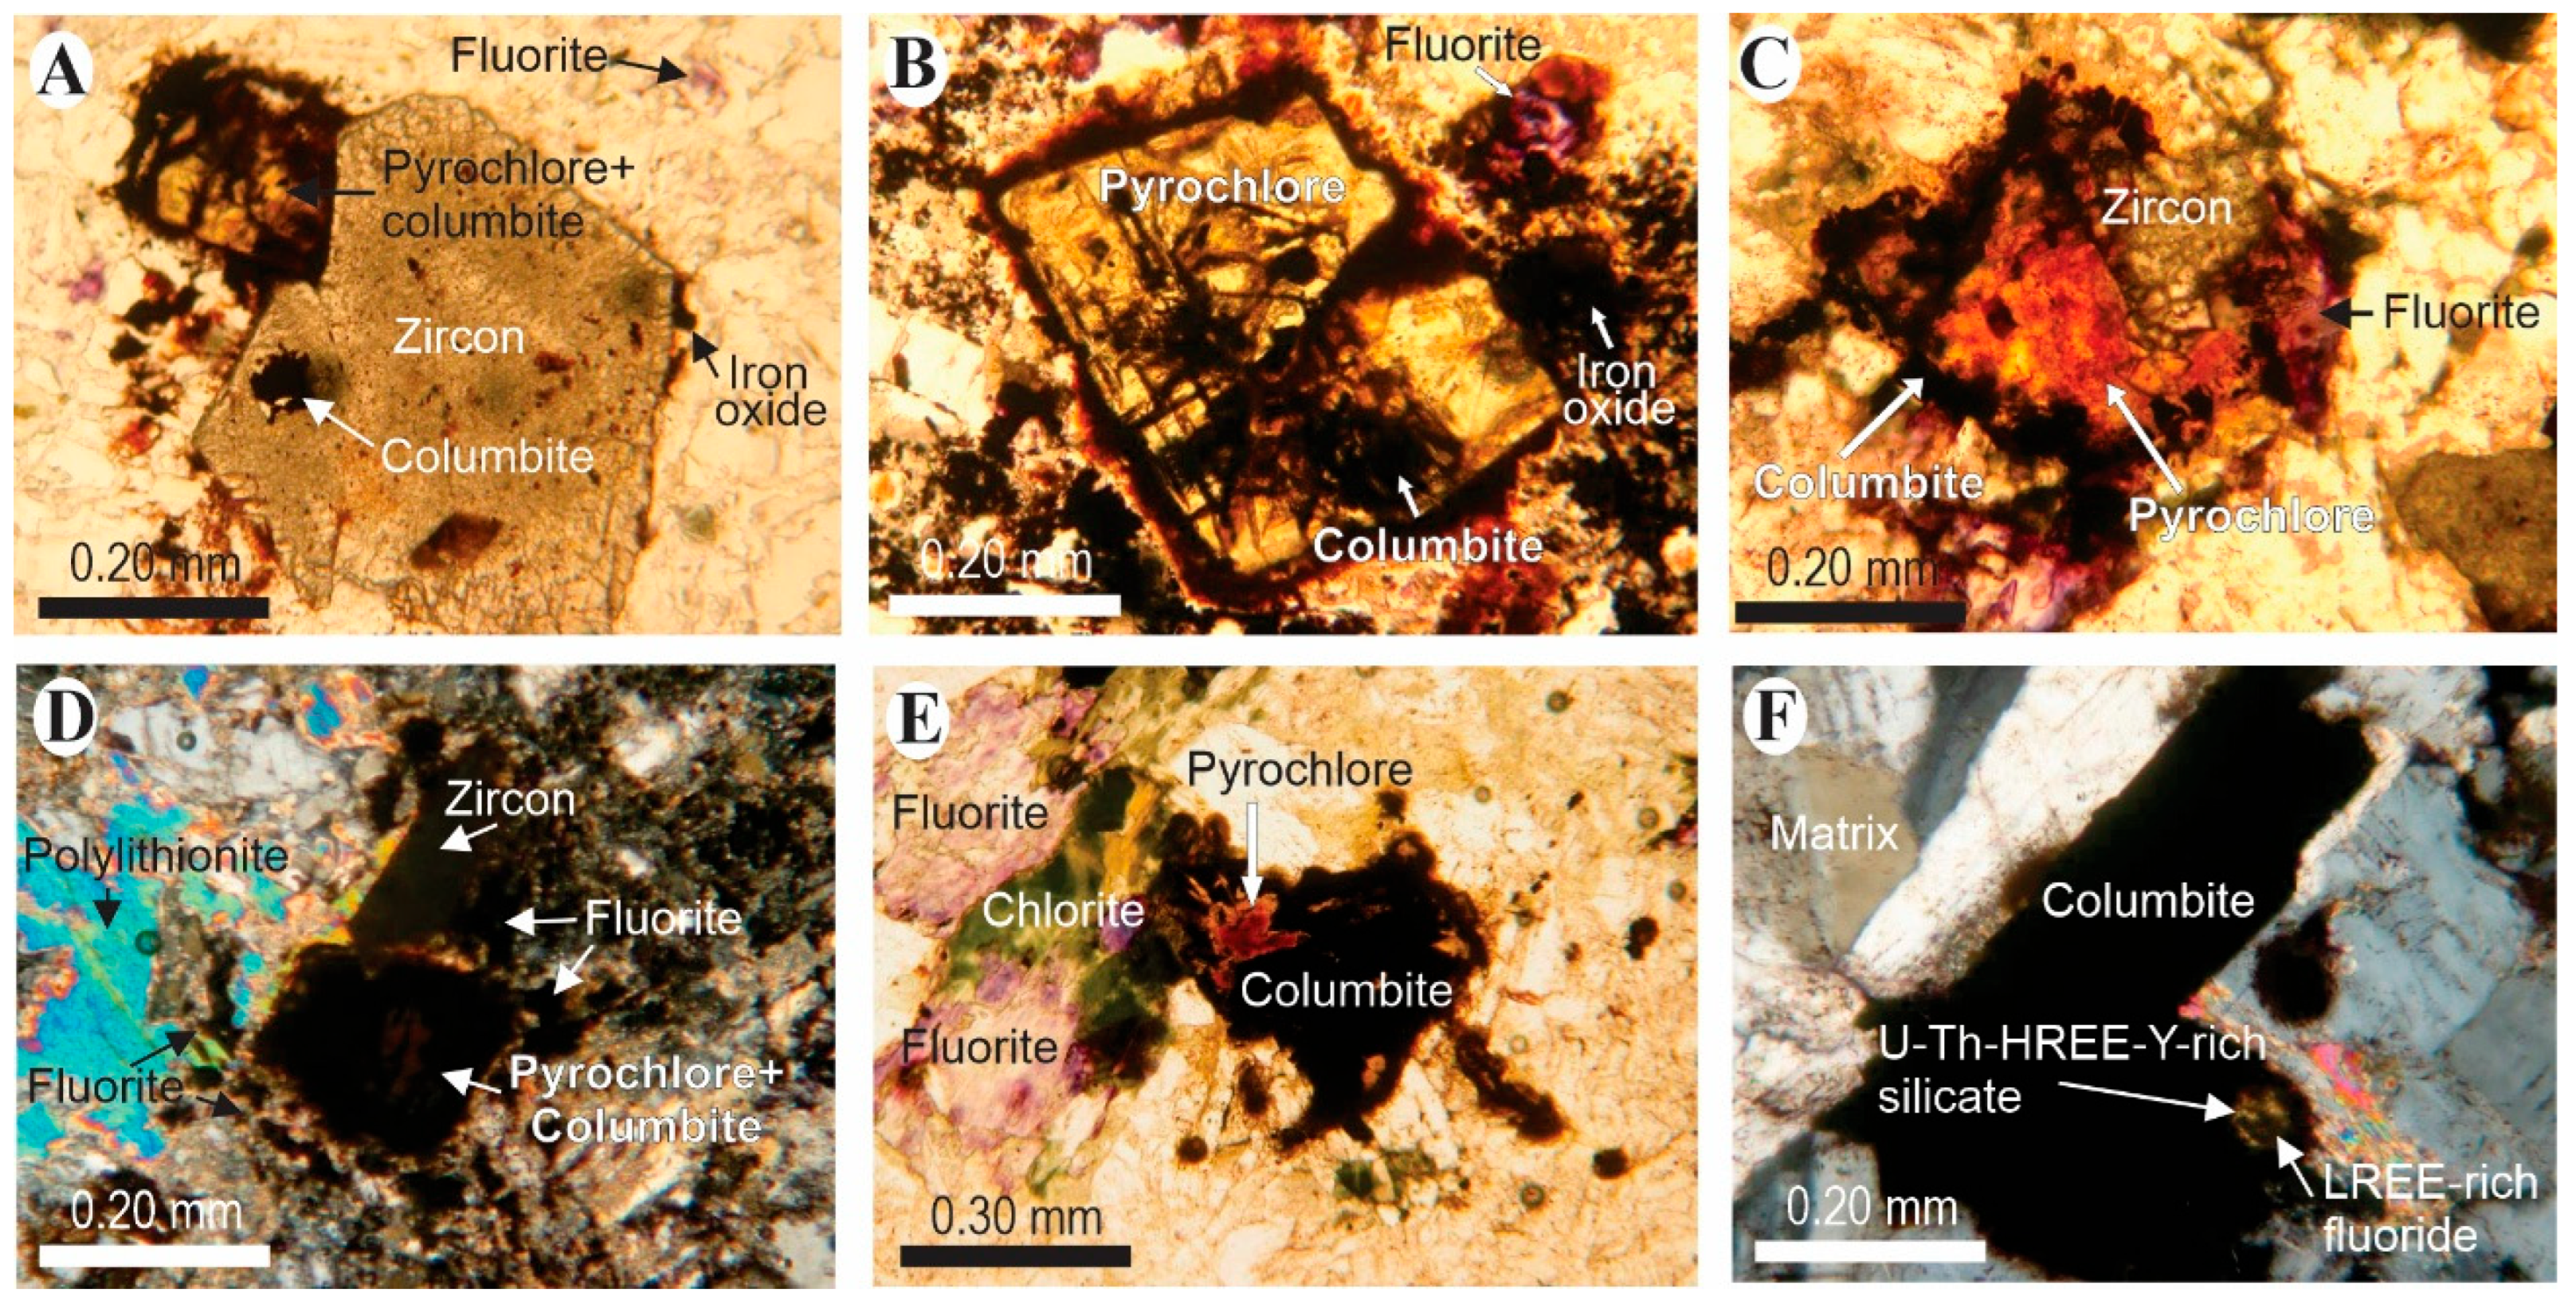
In both the CAG and BAG, pyrochlore occurs dispersed within a matrix of quartz, albite, and orthoclase (Figure 14A–C), with sizes ranging from 0.1 to 0.9 mm. It may also be surrounded by recrystallized quartz (Figure 14A–C), occur in association with riebeckite, annite, and polylithionite (Figure 14D,E,G), or appear together or intergrown with zircon (Figure 14C,F). Pyrochlore is a primary phase that crystallized during the early magmatic stage and was subsequently overprinted by F-rich hydrothermal processes that pervaded the AEG, with the strongest alteration observed in the BAG and in the central portion of the CAG. The grains are generally partially rounded, although pseudo-cubic crystals are locally preserved (Figure 14A–C). Under natural light, they display a dark yellow color (Figure 14A,C,D). The rounded morphologies reflect in situ hydrothermal alteration, which results in the formation of columbite (Figure 14A–I), iron oxide (Figure 14E,I), and LREE-rich fluorides (Figure 14E). The associated columbite grains are opaque in both granite facies (Figure 14A–I). Even well-preserved pyrochlore crystals exhibit incipient alteration features (Figure 14A,C,D). More advanced alteration is characteristic of the BAG and central portions of the CAG, where pyrochlore remains only as vestigial relicts (Figure 14F–I).
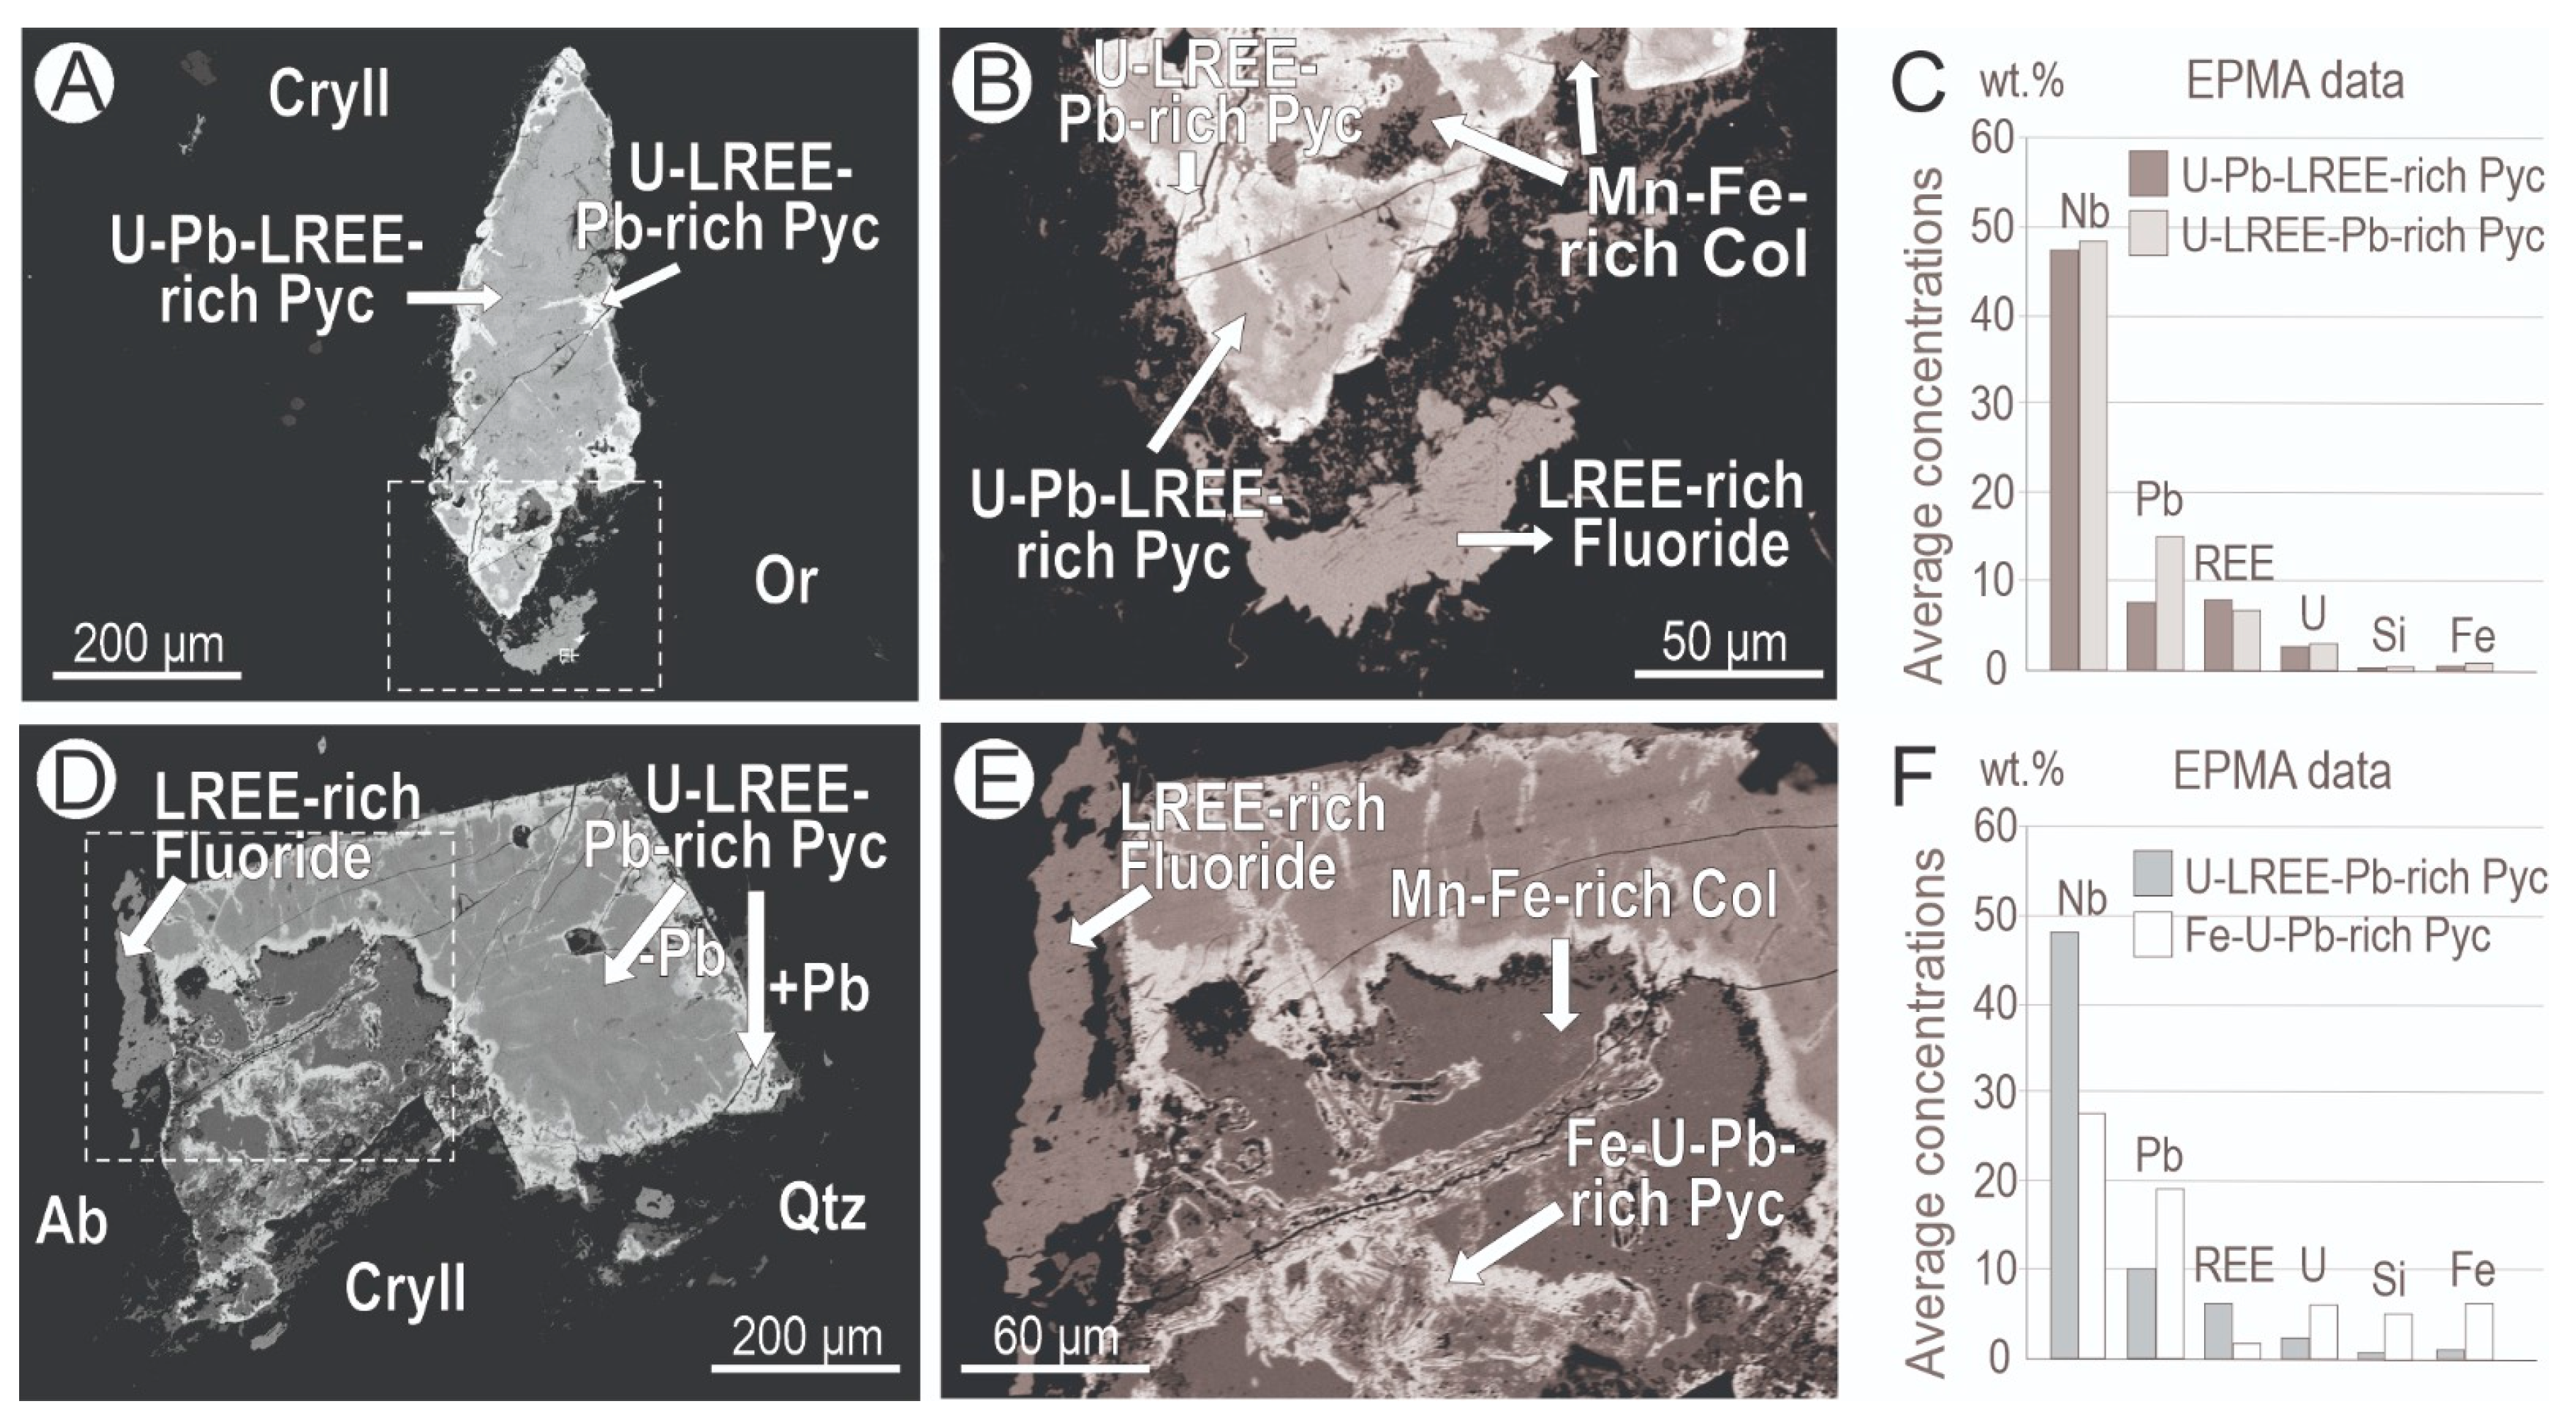
The degree of alteration of pyrochlore was assessed based on textural preservation, supported by BSE imaging, compositional data, and features such as fractures, voids, and rims. The least-altered pyrochlore crystals (Figure 15A) consist mainly of U-Pb-LREE-rich compositions. Toward the grain margins, microfractures and small cavities are bordered by brighter domains of U-LREE-Pb-rich pyrochlore (Figure 15B), reflecting progressive Pb enrichment (Figure 15C). Another grain showing incipient alteration (Figure 15D) is composed of U-LREE-Pb-rich pyrochlore. In this same crystal, Fe-U-Pb-rich pyrochlore is surrounded by columbite (Figure 15E), exhibiting a composition depleted in LREE-Nb-Ta-F but enriched in U-Pb-Fe-Si (Figure 15F). The predominant secondary phase is Mn-Fe-rich columbite, with some portions enriched in elements inherited from pyrochlore, primarily U and REEs. In the most advanced alteration stages, primary pyrochlore is absent.
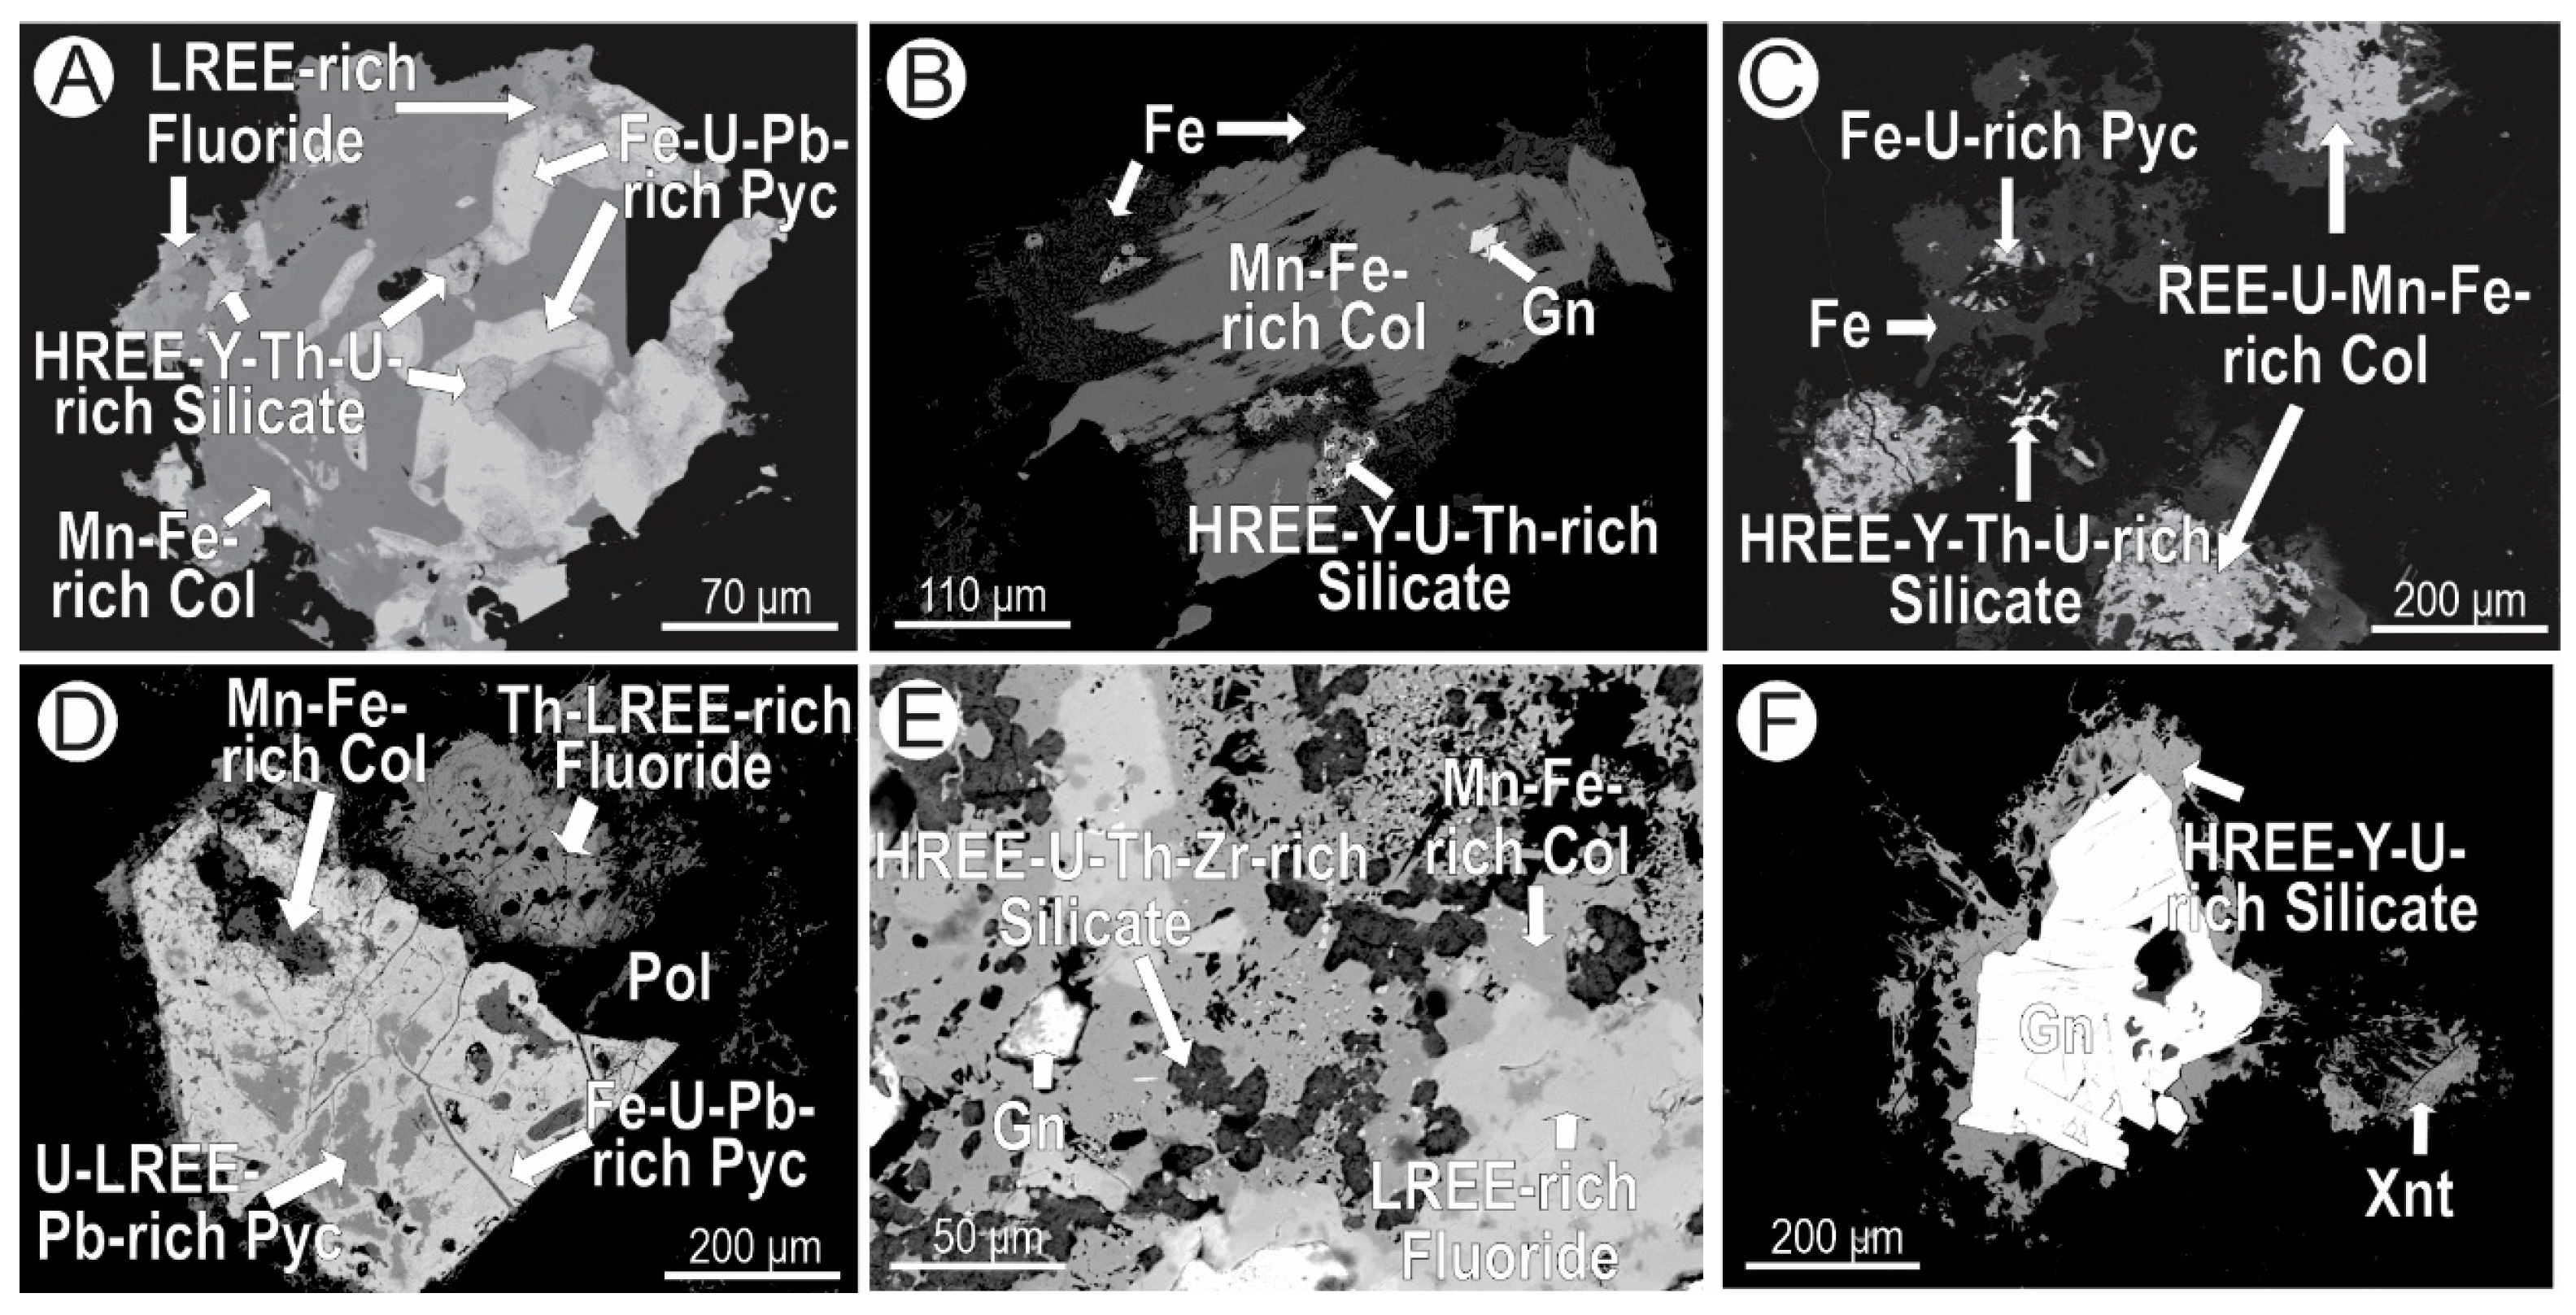
The breakdown of pyrochlore led to the release of LREEs, which subsequently precipitated as LREE-rich fluorides. These occur in two main settings: (i) concentrated along the margins of pyrochlore crystals (Figure 16A–D) and (ii) dispersed within pyrochlore and columbite as rounded-to-irregular aggregates (Figure 16A,E). In both cases, the fluorides and columbite mutually enclose one another, indicating coeval formation. In addition, secondary siliceous phases enriched in U, Th, Zr, Y, and HREEs (Figure 16A–F) are present. These phases likely correspond to intermediate compositions within the coffinite–thorite–zircon–xenotime mineral system. They occur in several textural contexts: as irregular masses in reactive contact with columbite (Figure 16A,E), infilling cavities within both pyrochlore and columbite (Figure 16B), and as inclusions in the surrounding matrix near columbite grains (Figure 16C,F). More rarely, phosphates enriched in Y-HREEs (interpreted as xenotime) and LREEs (interpreted as monazite) are also associated with columbite.

4.4.2. Pegmatite Veins (PEG)

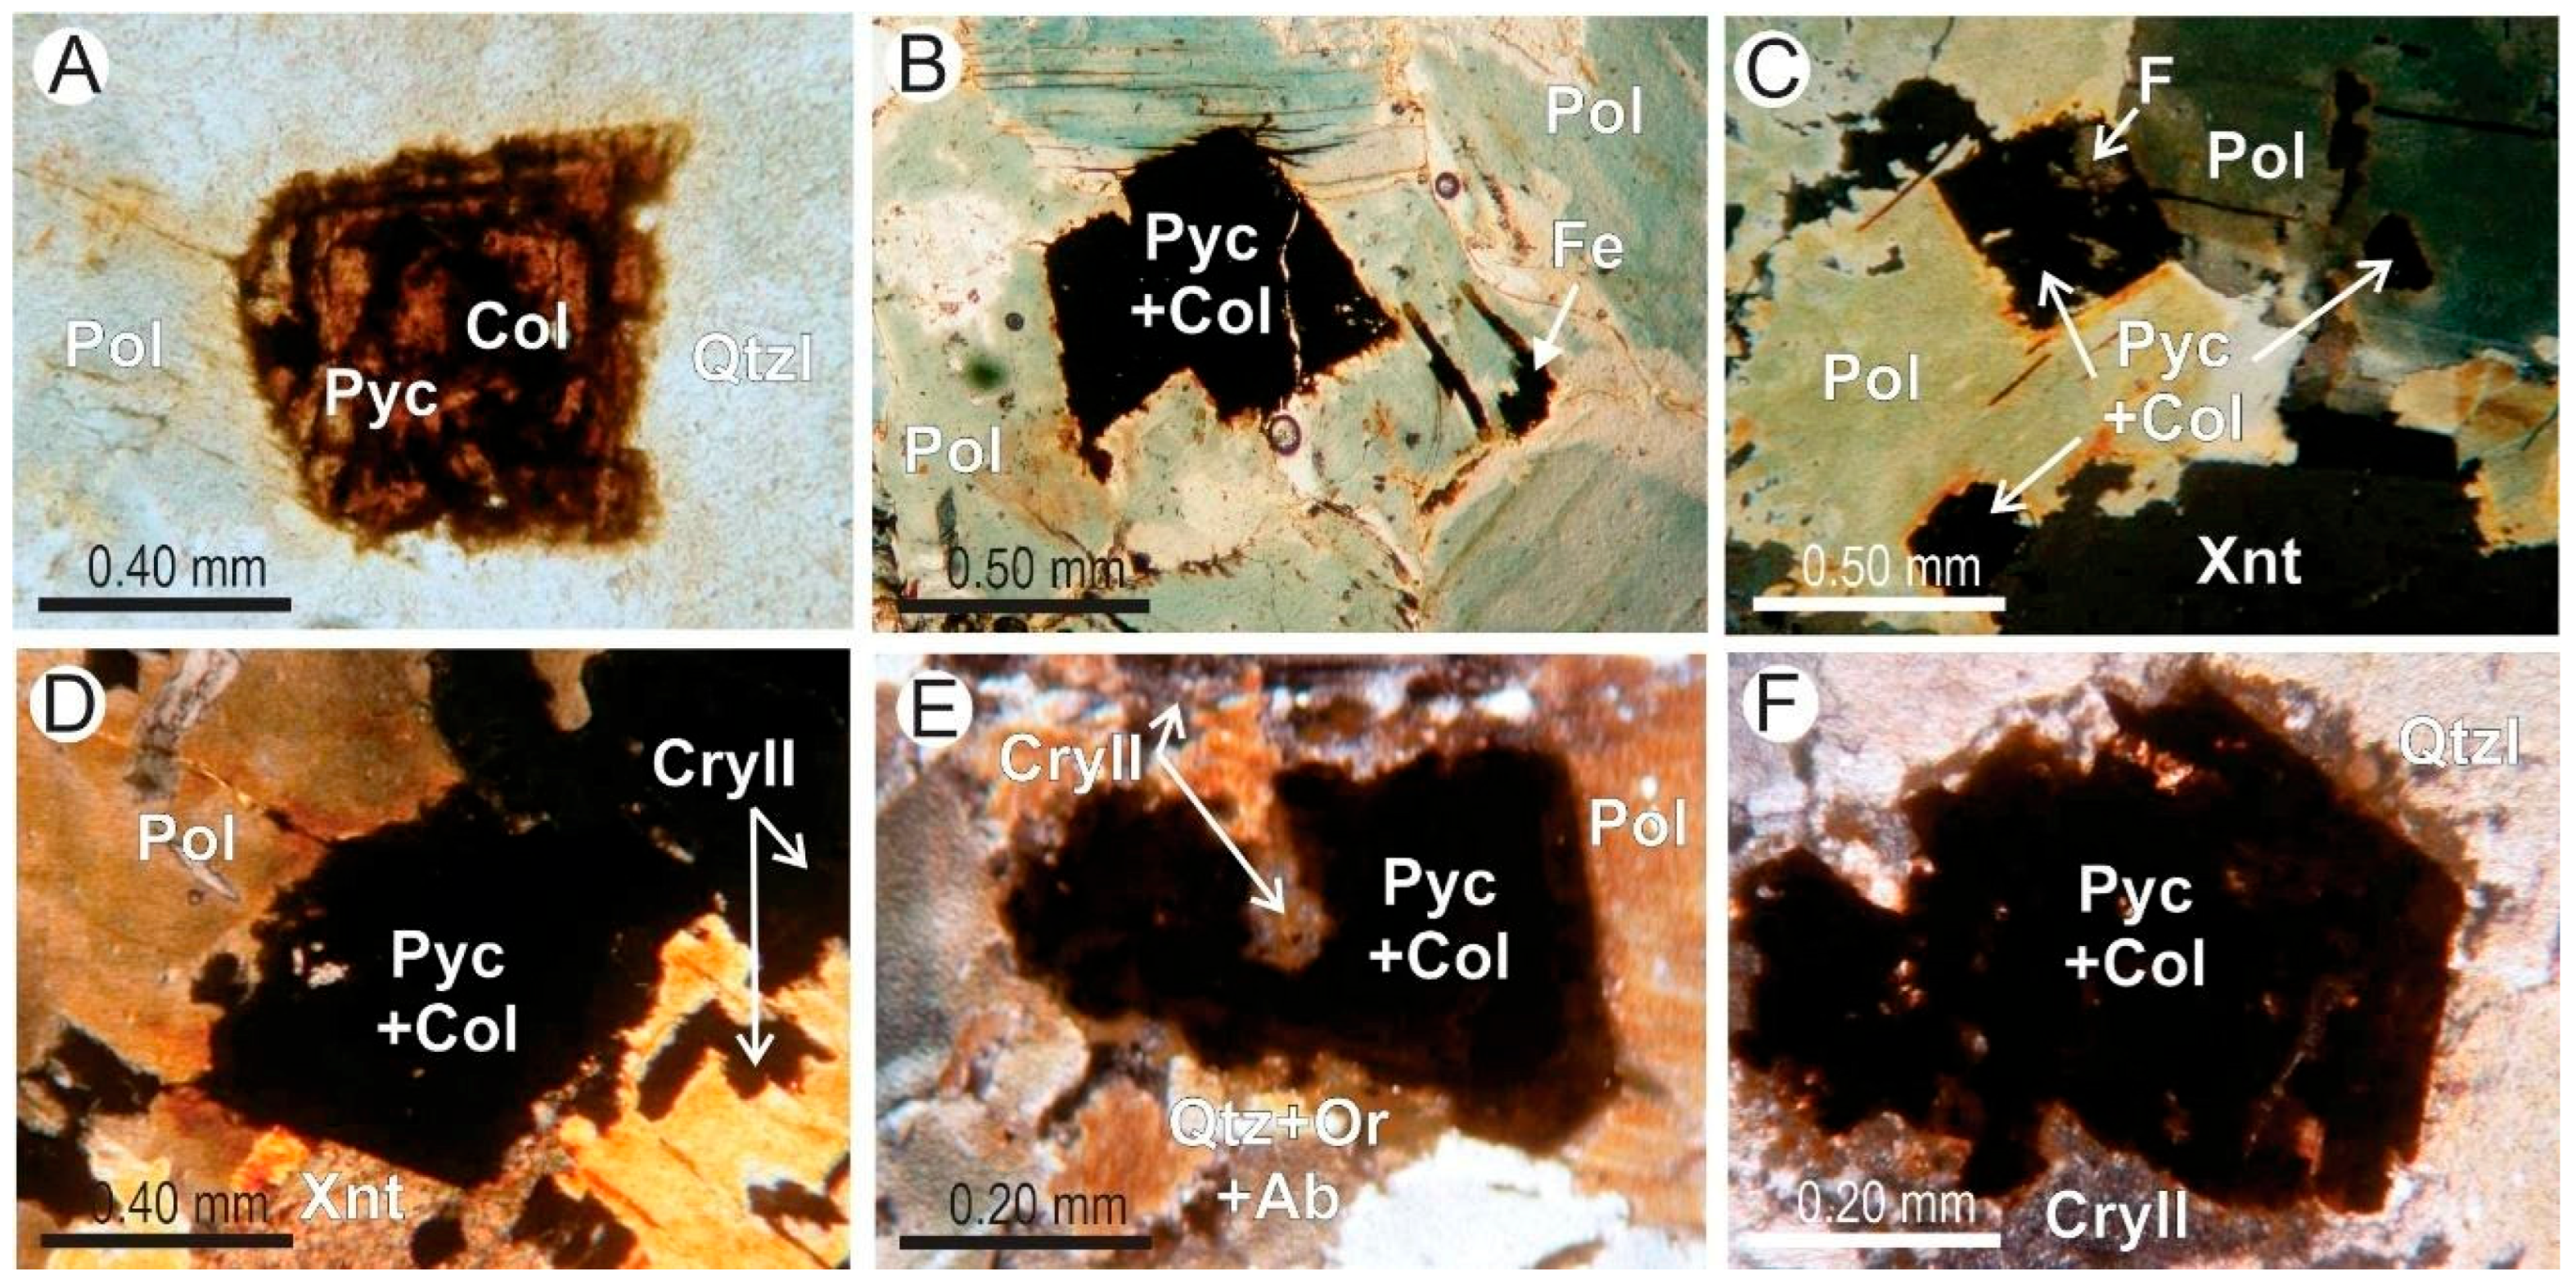
Pyrochlore from the PEG occurs as single crystals with dimensions ranging from 0.1 to 0.7 mm. It predominates as fully opaque grains due to extensive substitution by columbite; the remaining pyrochlore translucent portions are brown–orange (Figure 17A). Pyrochlore commonly occurs as inclusions in large quartz, polylithionite, and xenotime crystals (Figure 17A–D) and is also observed in the matrix (Figure 17E). Pyrochlore is surrounded by hydrothermal cryolite (Figure 17E,F) with highly reactive contact. Pyrochlore from the PEG is similar to that of the AEG in terms of size, shape, color, alteration, and textural relationships with columbite, although its compositions vary. PEG pyrochlore is interpreted as inherited from the magmatic phase of the AEG and later affected by hydrothermal fluids.
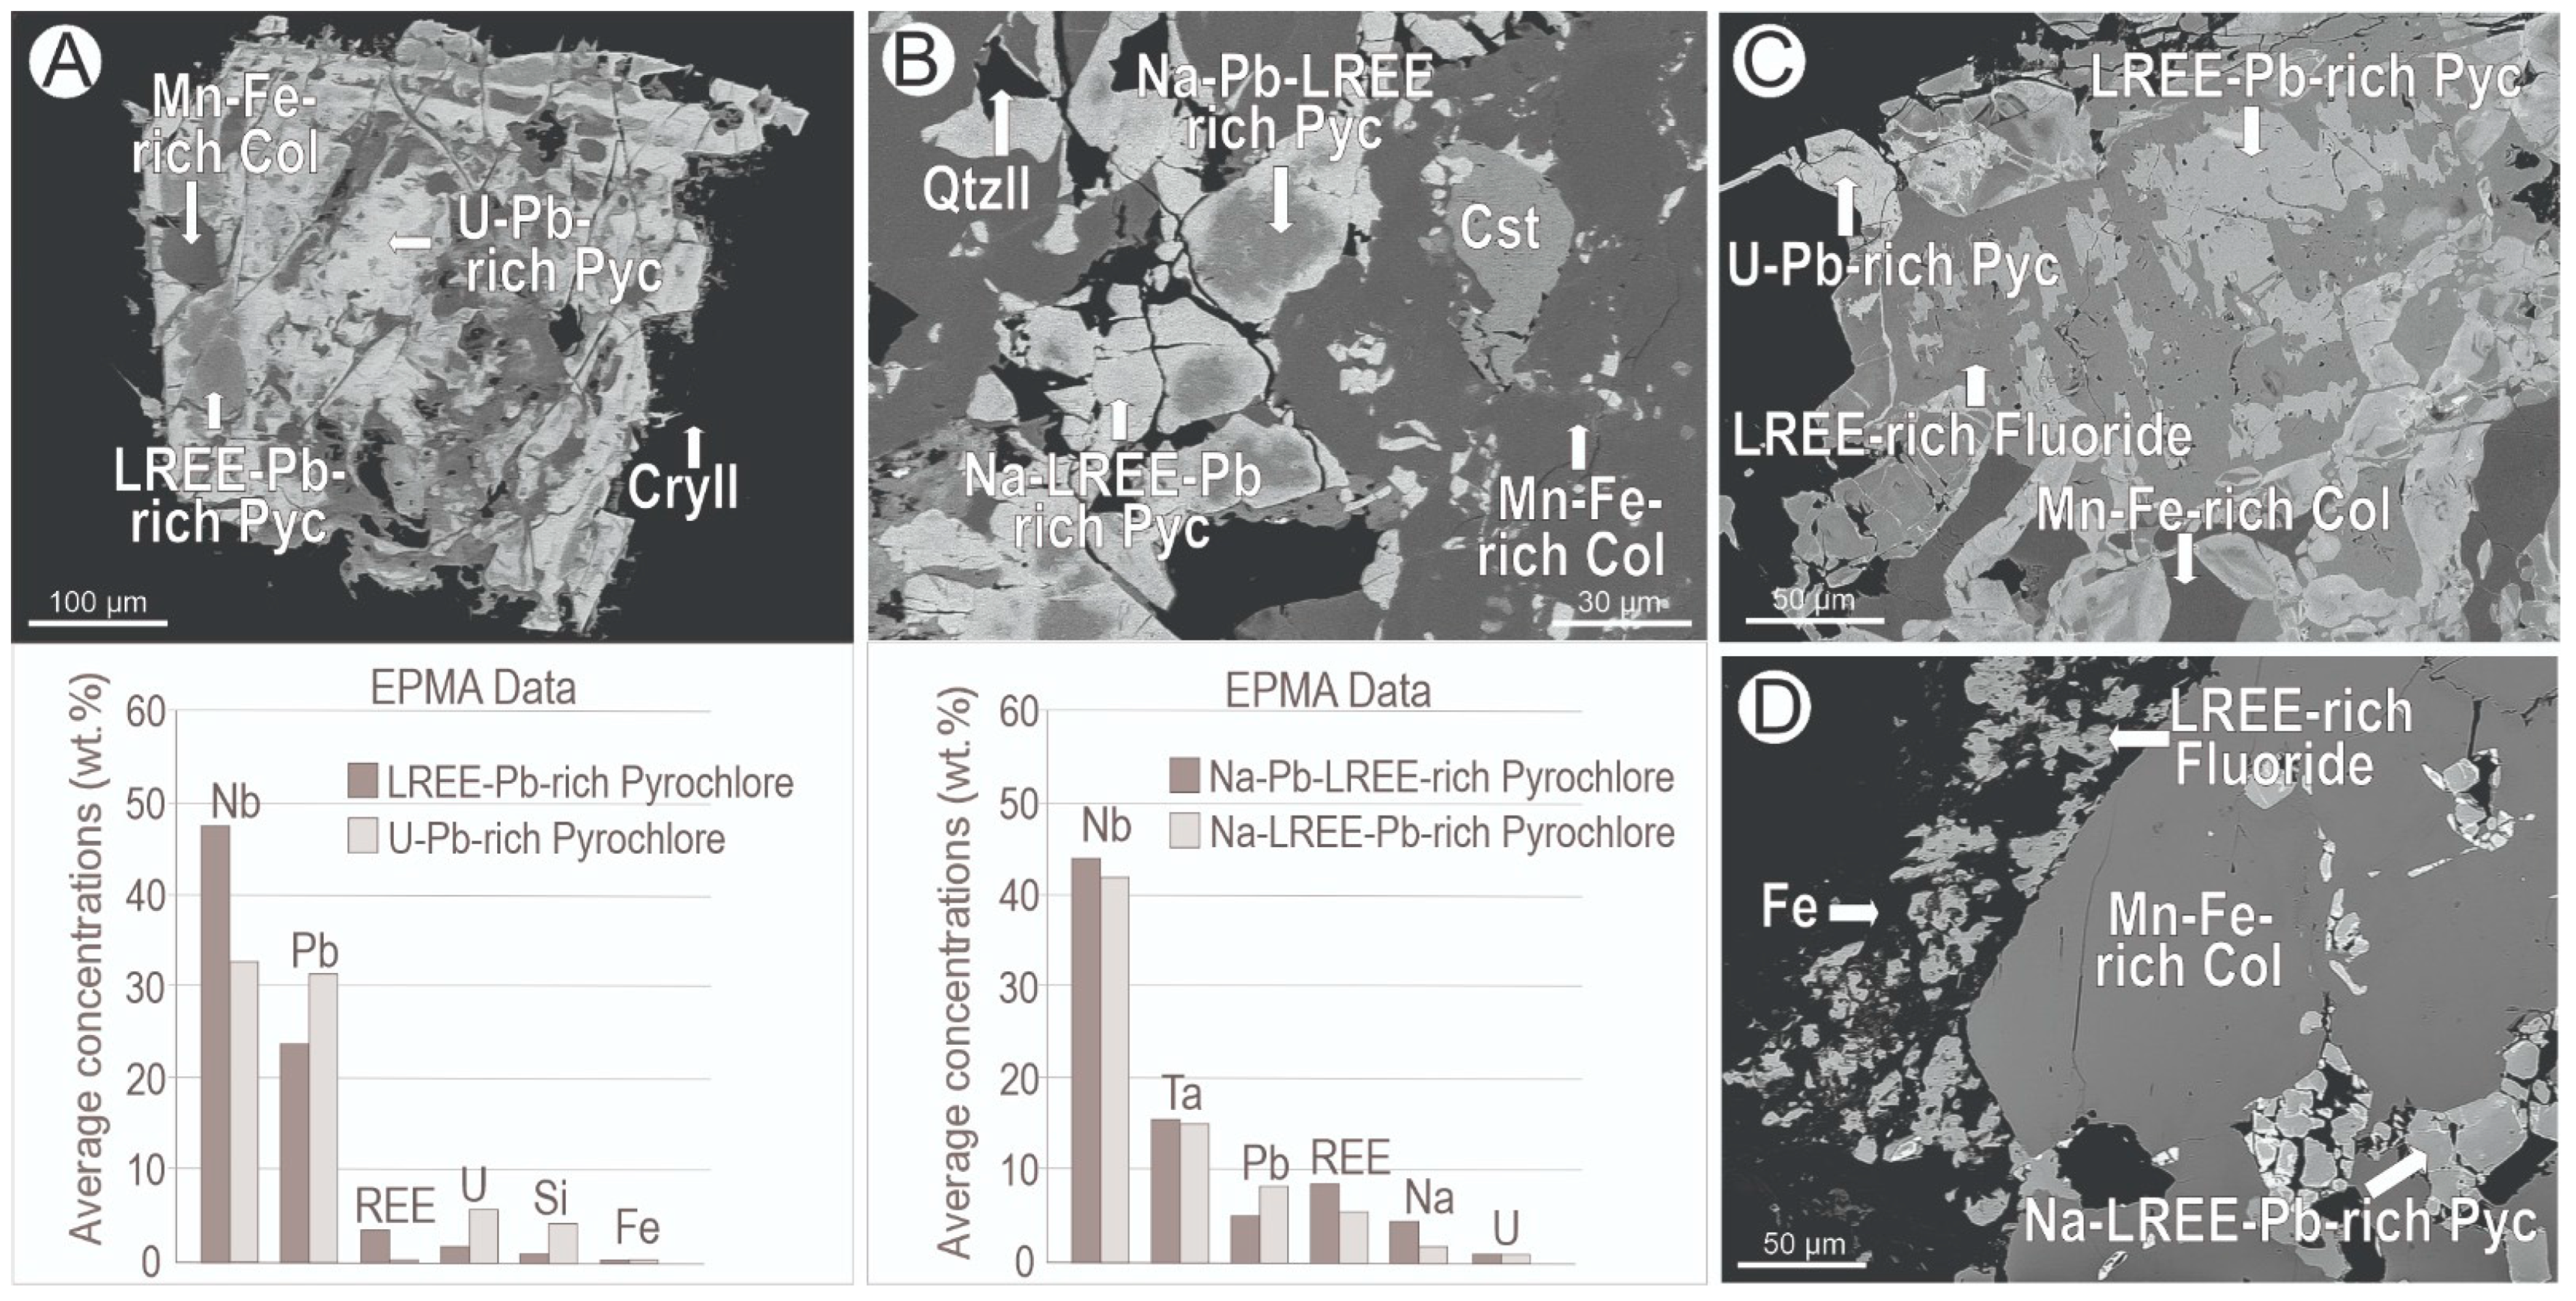
Pyrochlore always shows moderate-to-strong alteration. The grain with moderate alteration (Figure 18A) is a U-Pb-rich pyrochlore that surrounds remnants of U-LREE-Pb-rich pyrochlore. There is a decrease in Nb-LREE and an increase in Pb-U-Si contents toward the U-Pb-rich pyrochlore. In a columbitized grain (Figure 18B), remaining portions of pyrochlore occur surrounded by Mn-Fe-rich columbite, grading from Na-Pb-LREE-rich pyrochlore to Na-LREE-Pb-rich pyrochlore at the borders. The LREE-Nb leaching and Pb-U-Si enrichment of the primary phase gave rise to the relatively Pb-U-Si enriched hydrothermal pyrochlore (Figure 18A,C), which is the predominant pyrochlore variety in the PEG. The Na-Pb-LREE-rich and Na-LREE-Pb-rich pyrochlore varieties (Figure 18B) occur only in highly altered grains.
The majority of pyrochlore grains are almost completely replaced (Figure 18A–D) by columbite and other secondary minerals, mainly LREE-rich fluorides. The only variety of columbite observed is Mn-Fe-rich columbite, homogeneous in texture, more commonly as irregular and rounded masses dispersed within the pyrochlore grain. The fluorides occur (i) partially replacing pyrochlore grains (Figure 18C), included in columbite, at the borders of pyrochlore grains, as irregular-shaped masses included in iron oxide (Figure 18D) or filling interstices in the surrounding matrix. Other minor secondary minerals are (REE, U)-Th-rich silicates, galena, and cassiterite.

4.4.3. Border Pegmatites (BPEGs)

Pyrochlore from BPEGs occurs as single crystals dispersed within the quartz–feldspathic matrix, ranging in size from 0.2 mm to 0.5 mm. It is largely substituted by columbite and occurs more commonly as anhedral dark opaque grains (Figure 19A), but euhedral light-yellow crystals (Figure 8B) are also common, suggesting that alteration in the BPEG is less intense than in the PEG. Intergrowth with late zircon is a common feature (Figure 19A,C,D). The contact between pyrochlore and matrix minerals is reactive and invariably preceded by a columbite or iron oxide halo (Figure 19A–F). Hydrothermal fluorite is consistently present around pyrochlore and columbite grains (Figure 19A–E) with corrosive features. LREE-rich fluorides are commonly associated with columbitized pyrochlore (Figure 19F). The BPEG pyrochlore is interpreted as inherited from the BAG and was subsequently altered by an F-rich hydrothermal fluid.
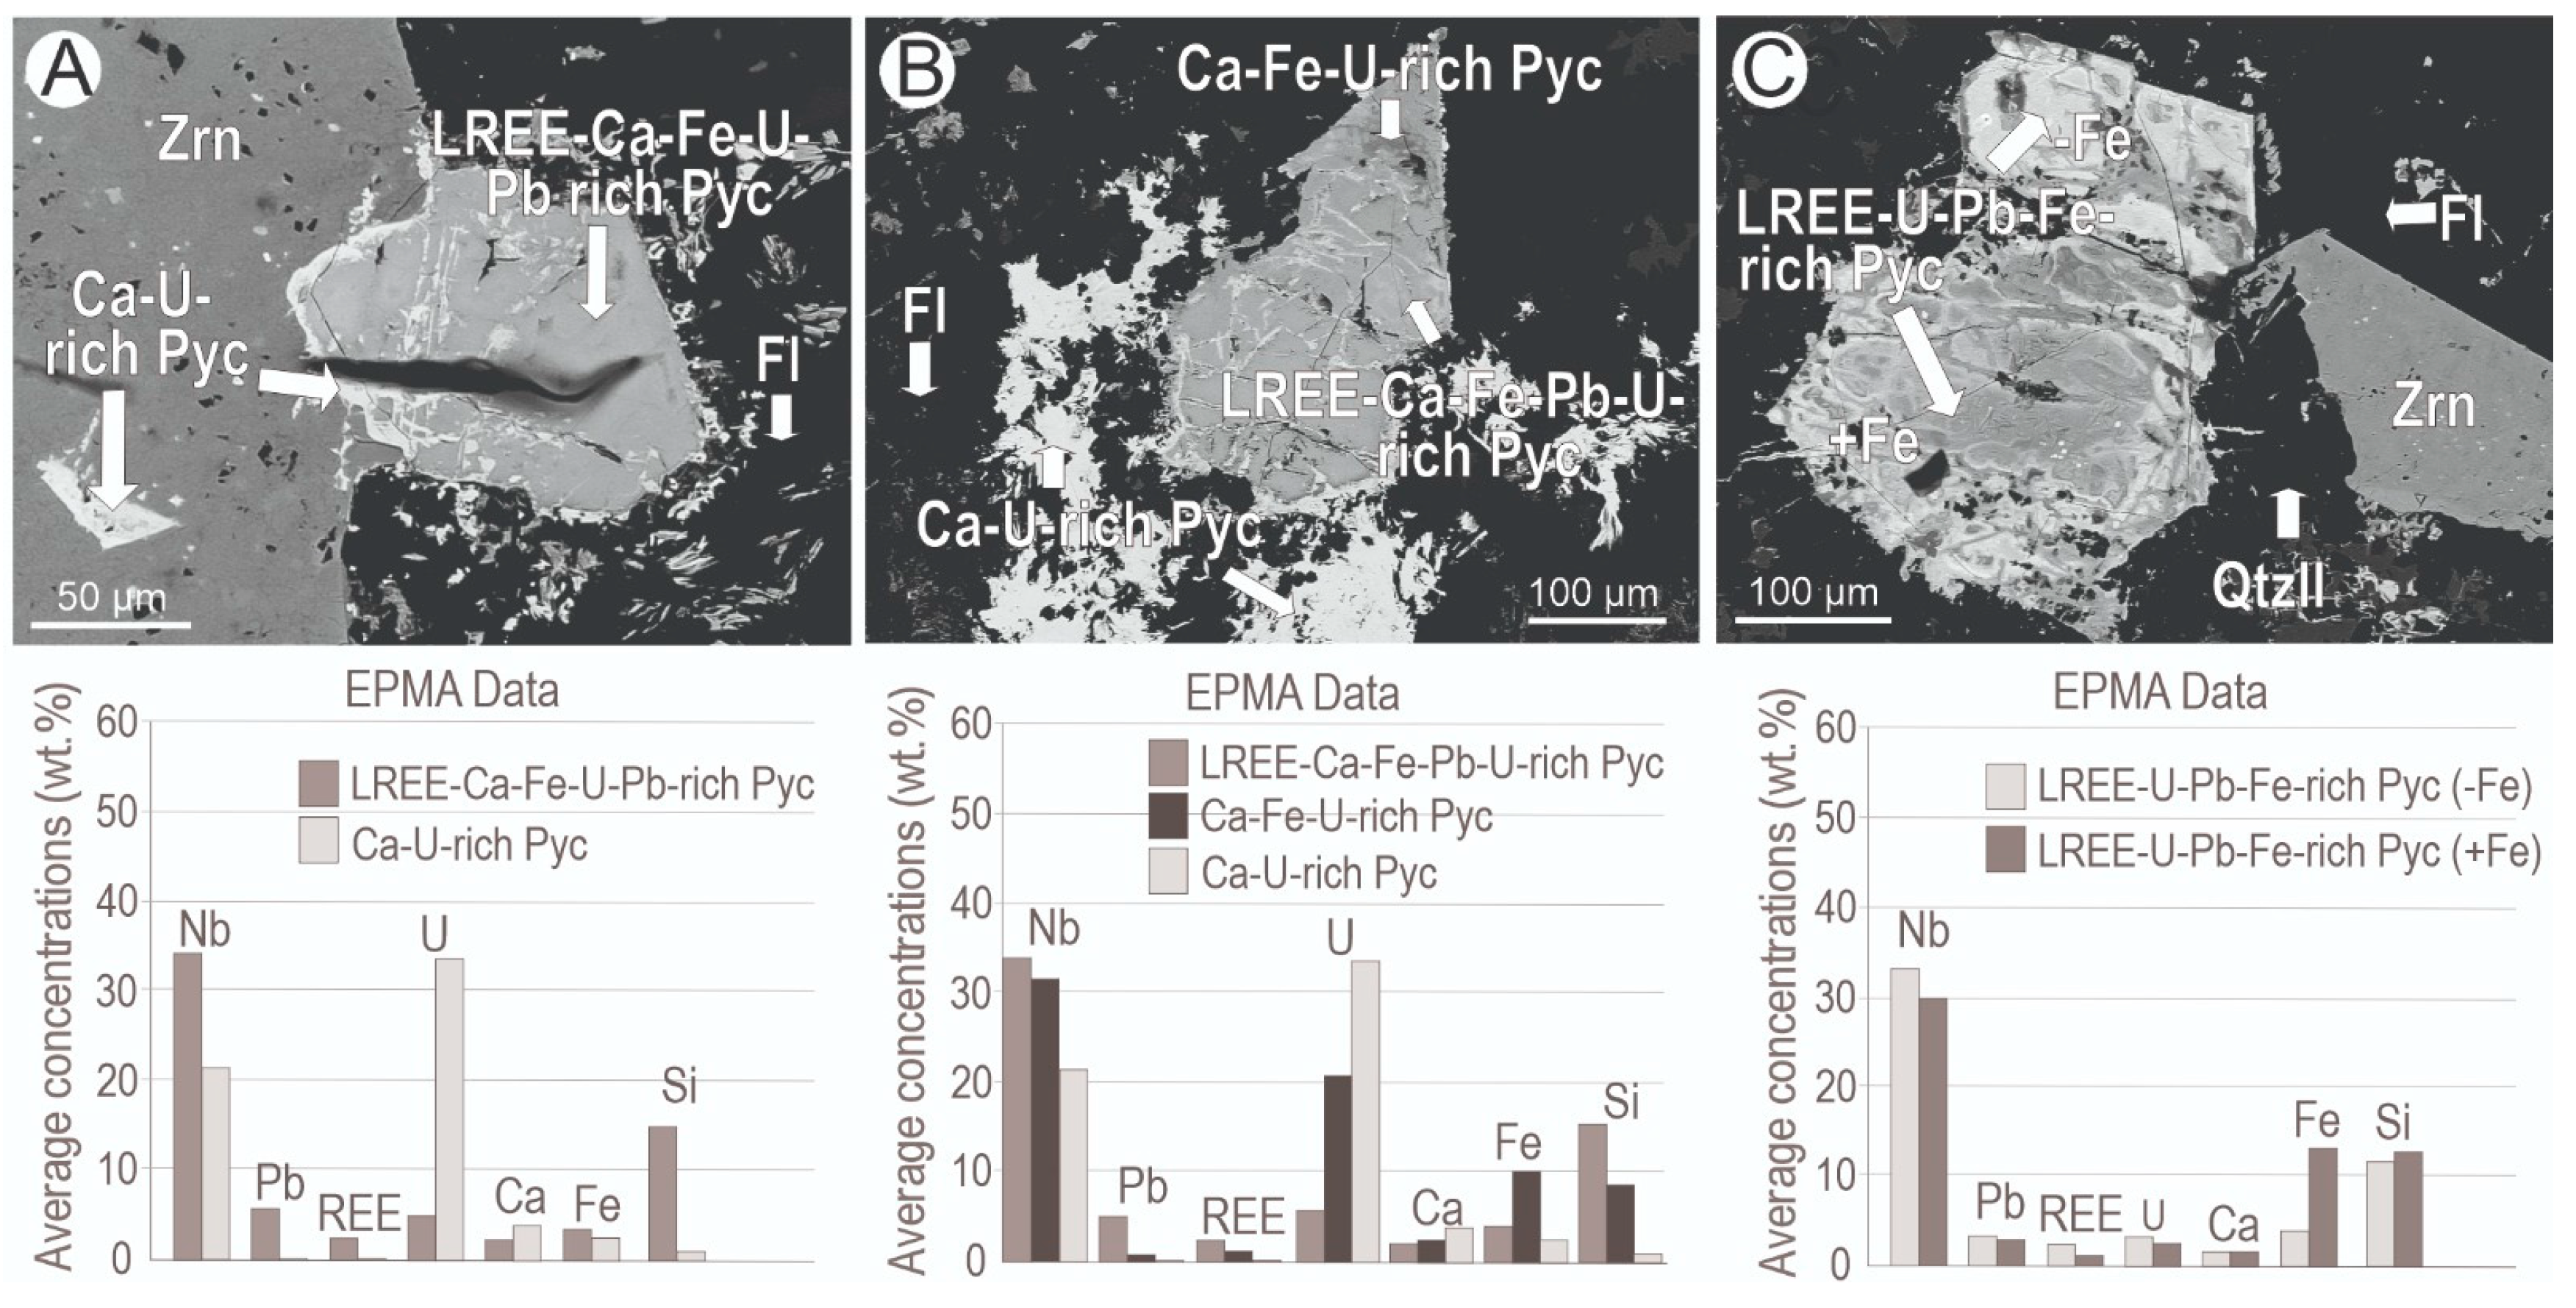
The best-preserved pyrochlore grains occur in the eastern BPEG. LREE-Ca-Fe-U-Pb-rich pyrochlore (Figure 20A) with high Si (~14 wt.% SiO2), intergrown with zircon, displays Ca-U-rich pyrochlore at its borders and along microfractures. In Figure 20B, the pyrochlore grain is constituted predominantly by LREE-Ca-Fe-Pb-U-rich pyrochlore (~15 wt.% SiO2) and subordinately by Ca-Fe-U-rich pyrochlore. Ca-U-rich pyrochlore (white) also occurs at the grain borders, along microfractures, and dispersed in the surrounding matrix. The predominant pyrochlore varieties in these grains (Figure 20A,B) are considered to be of primary origin and are both Ca-Si-enriched relative to the primary pyrochlore of the AEG. The Ca-U-rich pyrochlore is a hydrothermal phase with substantial Nb-Si depletion and U enrichment related to the primary pyrochlore. The grain in Figure 20C is LREE-U-Pb-Fe-rich pyrochlore (~12 wt.% SiO2), heterogeneous in texture and composition. The central portion is significantly Fe-enriched (dark gray) relative to the Fe-depleted border (light gray), with which the contact is gradual and reactive. These representative grains show different alteration paths for the eastern BPEG pyrochlore: preferential LREE-Pb leaching and transport, Ca-U leaching, Fe concentration and incorporation, and absence of the typical AEG Mn-Fe-rich columbite.
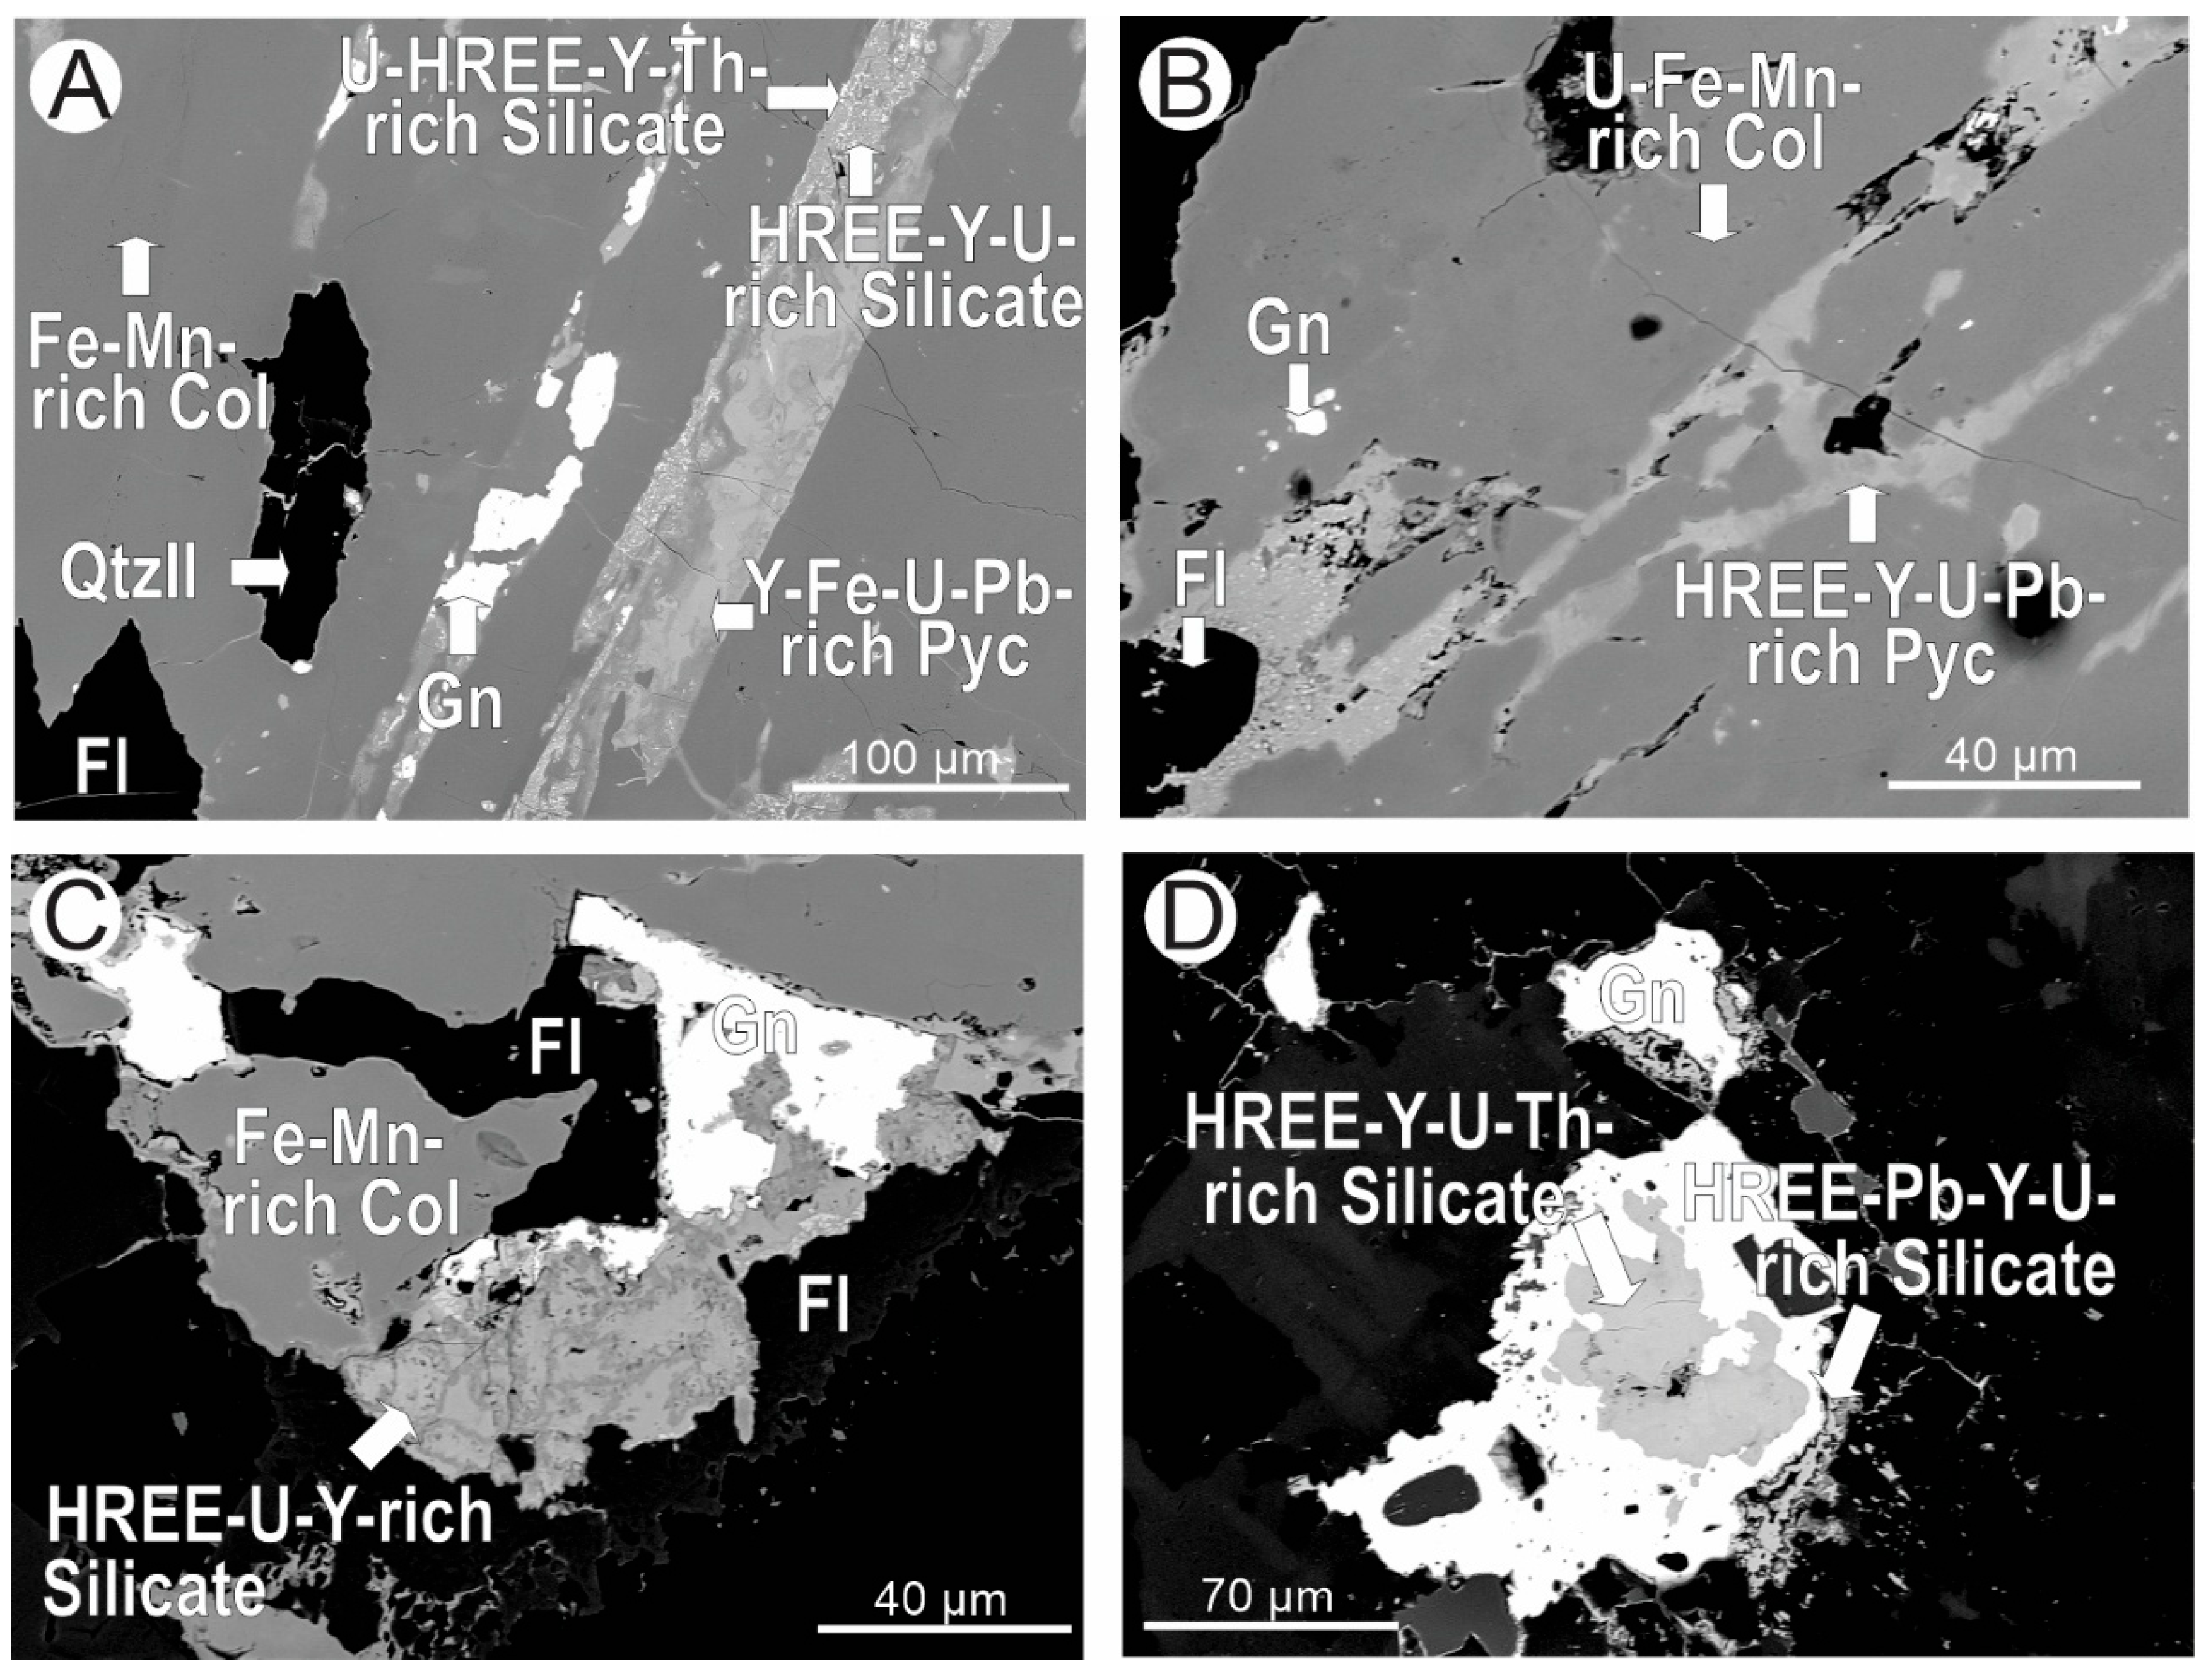
The pyrochlore from the northern and southern BPEG are widely substituted by homogeneous Fe-Mn-rich columbite in association with hydrothermal pyrochlore remnants and other REE-bearing secondary minerals. In Figure 21A, Fe-Mn-rich columbite surrounds Y-Fe-U-Pb-rich pyrochlore remnants, along with micrograins of HREE-Y-U-Th-enriched silicates and galena. In Figure 21B, HREE-Y-U-Pb-rich pyrochlore remnants occur surrounded by U-Fe-Mn-rich columbite. In Figure 21C, HREE-U-Y-rich silicate and galena occur at the border of the Fe-Mn-rich columbite grain. In Figure 21D, secondary minerals—galena, HREE-Y-U-Th-rich silicate, and HREE-Pb-Y-U-rich silicate—occur included in the matrix in the vicinity of columbite grains.

4.4.4. REE Contents in Pyrochlore and Associated Secondary Minerals

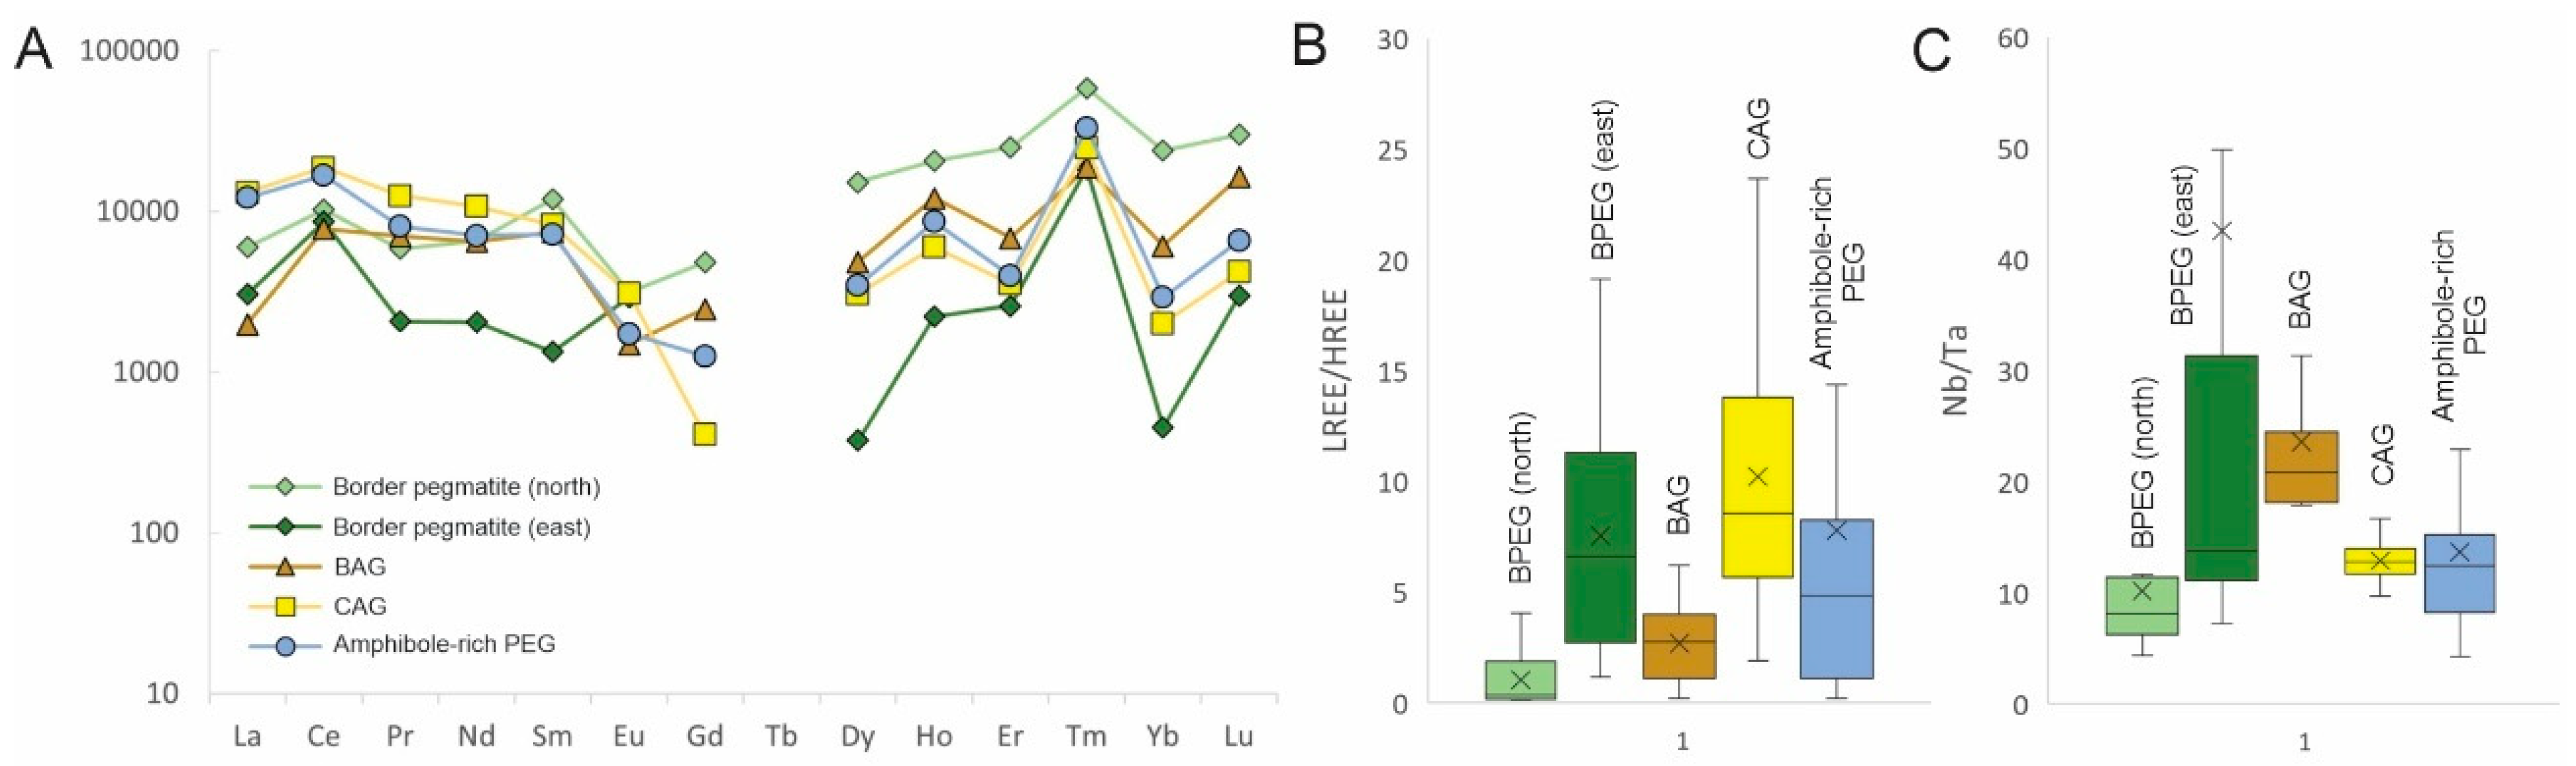
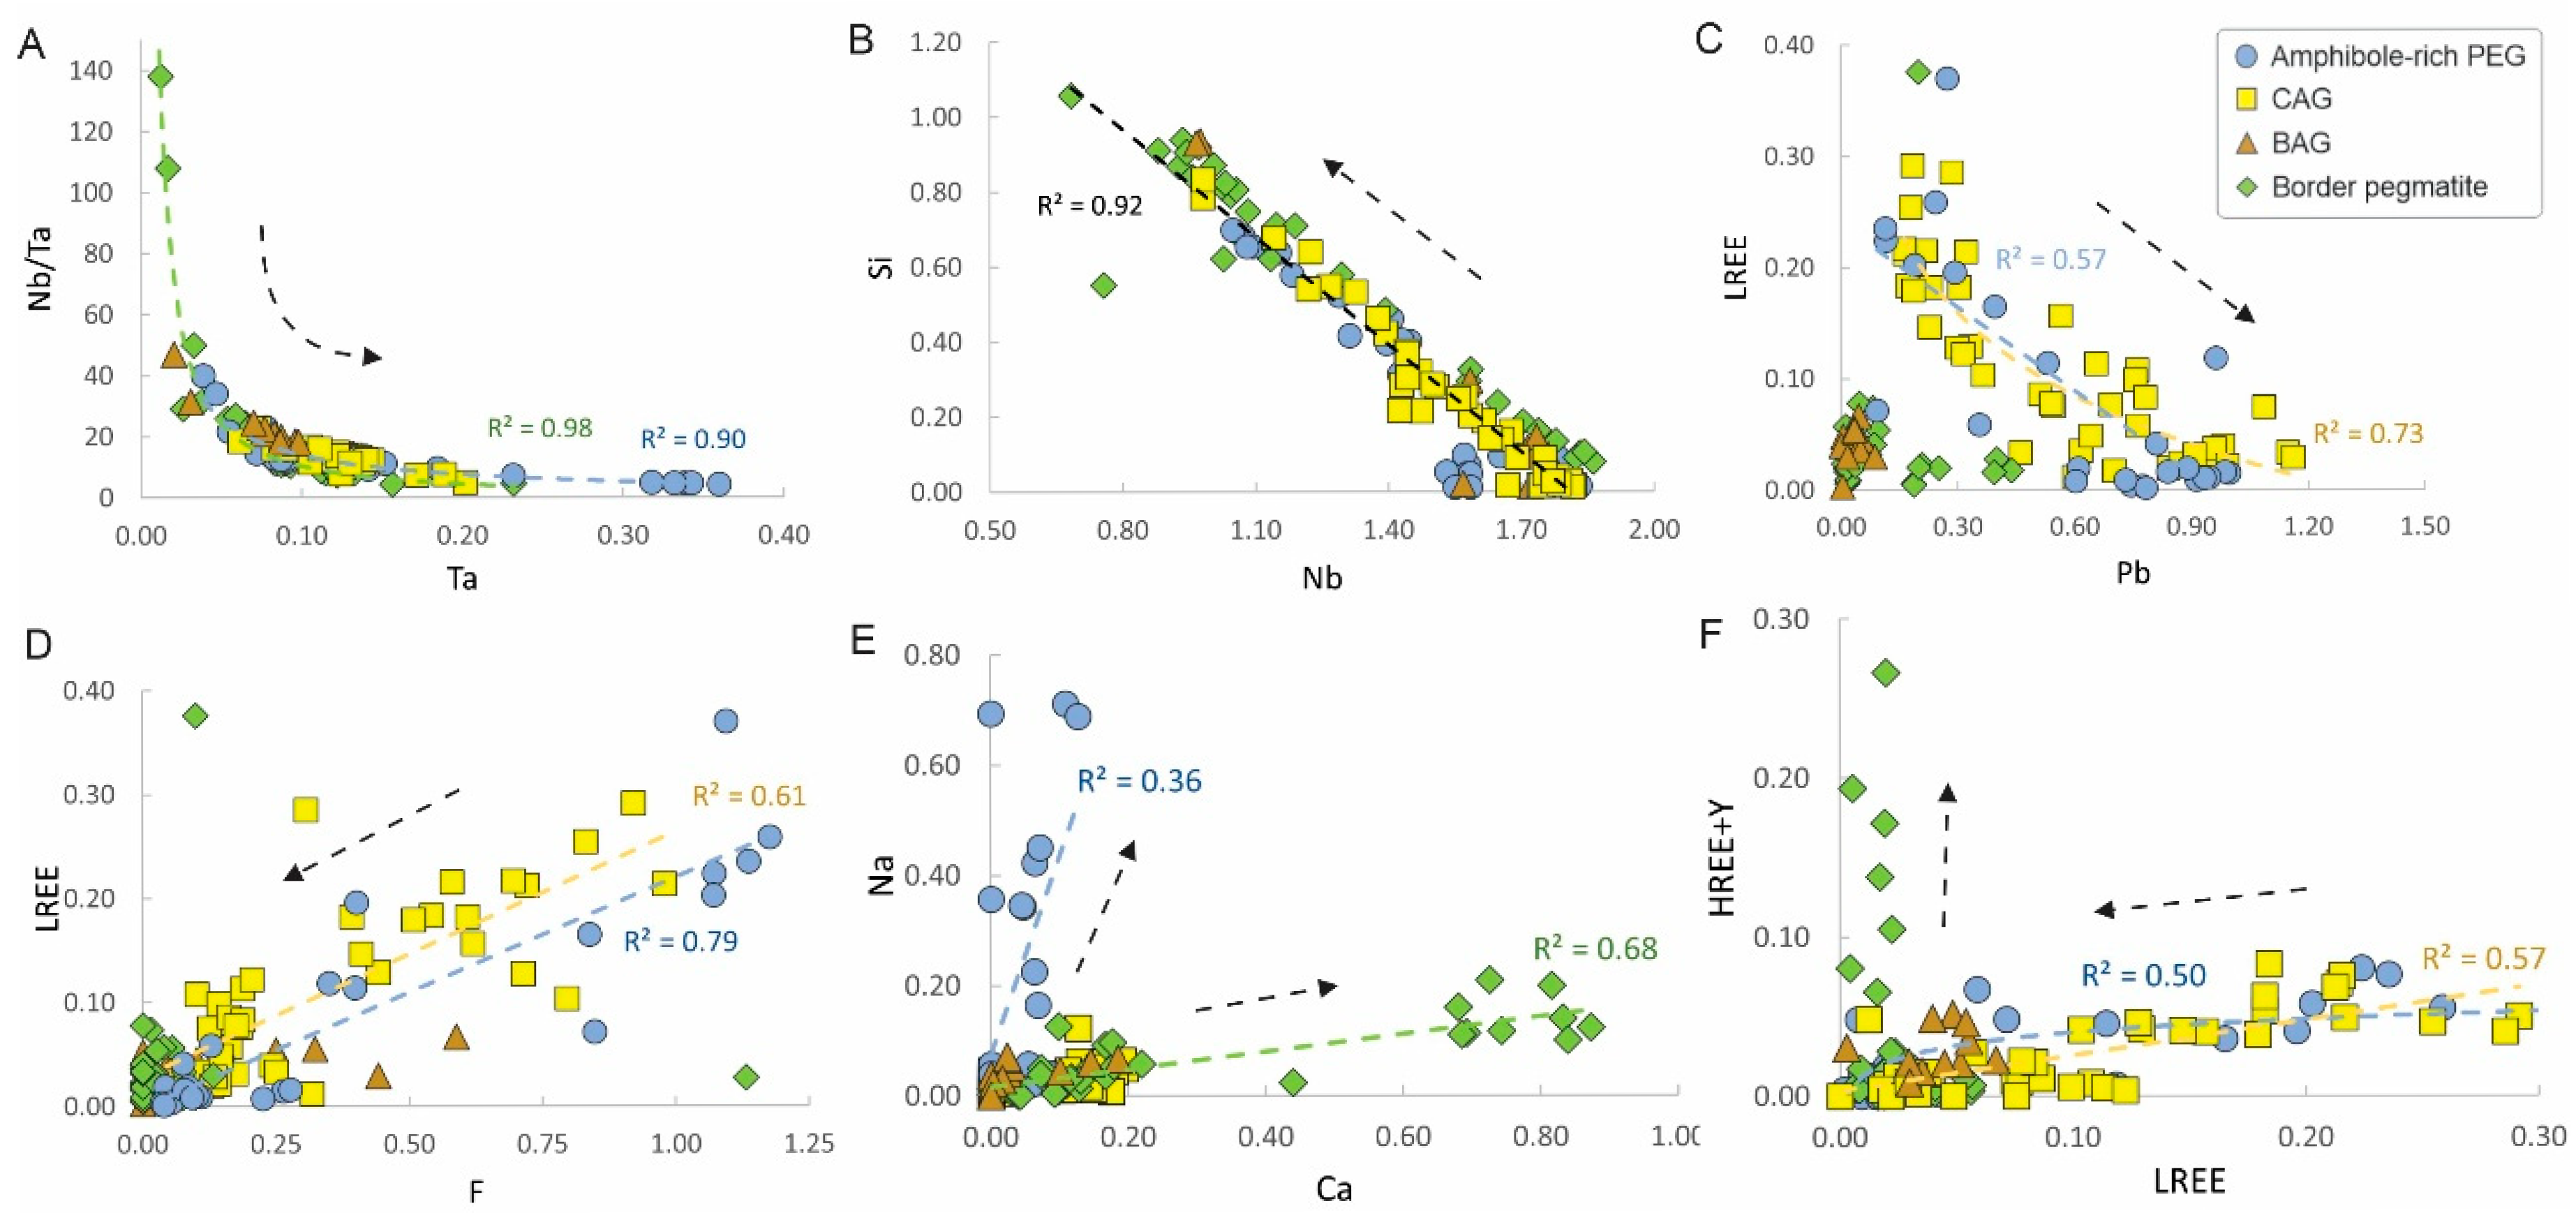
Representative chemical compositions and calculated structural formulas for pyrochlore are listed in Table 6. The consistently low analytical totals are interpreted as the combined effect of intense hydration, radiation-induced metamictization, and the presence of micro- to nanoscale voids. In the set of pyrochlores, TREE2O3 ranges from 0.20 to 13.50 wt.%. The average chondrite-normalized REE patterns (Figure 22A) indicate that pyrochlore from the CAG is characterized by the highest LREE abundances and comparatively depleted HREE contents. In contrast, pyrochlore from the eastern BPEG shows the lowest overall REE concentrations. The lowest average LREE/HREE ratios (Figure 22B) are observed in pyrochlore grains from the northern BPEG (1.0), whereas the highest values occur in pyrochlore from the CAG (10.2).
Variations in Nb/Ta ratios among pyrochlore grains (Figure 22C) reveal distinct compositional differences between subfacies. Lower average values are observed in the northern BPEG (10.2), the CAG (12.9), and the amphibole-rich PEG (13.7), whereas significantly higher ratios occur in the BAG (23.5) and especially in the eastern BPEG (42.5). Across all subfacies, Nb/Ta ratios display a pronounced negative correlation with Ta concentrations (Figure 23A), while no meaningful correlation is observed with Nb. The lowest Nb/Ta values (<5) are restricted to Na-rich hydrothermal pyrochlore from the amphibole-rich PEG. In addition, Nb consistently shows a strong negative correlation with Si (Figure 23B) in all analyzed samples.
Pyrochlore in CAG and BAG
The relict varieties of primary pyrochlore in the CAG are relatively rich in LREE. In Table 6, these crystals are: (1) U-Pb-LREE-rich pyrochlore, (2) U-LREE-Pb-rich pyrochlore, and (3) LREE-U-Pb-rich pyrochlore. The magmatic and incipiently altered U-LREE-Pb-rich pyrochlore crystals from the CAG have averages of 6.53 wt.% LREE2O3, 0.83 wt.% HREE2O3, and 0.69 wt.% Y2O3. The pattern where the central portions have a lower Pb concentration (min. 7.5 wt.% PbO), while higher Pb concentrations are observed along the borders and microfractures (max. 14.5 wt.% PbO), is expressed by the inverse correlation between Pb and LREEs (−0.93; Figure 23C). In the predominant CAG variety (LREE-U-Pb-rich pyrochlore, Table 6, crystal 3), the averages are 1.7 wt.% LREE2O3 and 0.2 wt.% HREE2O3. The Fe-U-rich pyrochlore (Table 6, crystal 4), predominant in the BAG and in the central portion of the CAG, has an average of 1.64 wt.% LREE2O3 and 0.78 wt.% HREE2O3.
In the LREE-richer varieties of pyrochlore, the cerium content represents, on average, 49.3% of the total LREE content, along with 22.3% Nd, 15.13% La, 6.8% Sm, and 5.6% Pr. As the LREE concentration decreases in the U-Pb-rich pyrochlore, the average proportions of Ce (61.2%) and Nd (24.0%) increase, whereas the average proportions of the other LREEs decrease (9.1% La, 1.7% Sm, and 2.8% Pr). Fluorine is the dominant anion in the Y-site of the LREE-enriched pyrochlore species, with concentrations of up to 2.96 wt.% F, while OH is dominant in the Fe-U-Pb-enriched species. The diverse compositions of pyrochlore reflect the intense hydrothermal alteration by an F-enriched fluid.
Pyrochlore in Pegmatite Veins
In the amphibole-rich PEG, remnants of LREE-Pb-rich pyrochlore (Table 6, crystal 5), with averages of 7.63 wt.% LREE2O3 (up to 13.05 wt.% LREE2O3), 1.15 wt.% HREE2O3, and 0.57 wt.% Y2O3, are surrounded by U-Pb-rich pyrochlore (Table 6, crystal 6), with reactive contact. The loss of LREEs is accompanied by a relative increase in Pb (Figure 23C) and a decrease in F (Figure 23D). With the advancement of alteration, there is progressive loss of Pb and relative U enrichment. This relatively Pb-U-Si-enriched hydrothermal phase is the predominant pyrochlore variety in the amphibole-rich PEG, which presents averages of 0.87 wt.% LREE2O3, 0.34 wt.% HREE2O3, and 0.12 wt.% Y2O3. However, in grains with advanced alteration, remaining portions of heterogeneous pyrochlore also occur, grading from Na-Pb-LREE-rich pyrochlore (Table 6, crystal 7) in the center to Na-LREE-Pb-rich pyrochlore at the border. Despite occurring in a highly hydrothermally altered context, these pyrochlore varieties present high amounts of LREEs (up to 8.05 wt.% LREE2O3) and F (up to 4.47 wt.% F) and a trend of Na enrichment up to 4.42 wt.% Na2O (Figure 23E).
Pyrochlore in Border Pegmatites
In the highly altered pyrochlore grains from the northern BPEG, relicts of hydrothermal Y-Fe-U-Pb-rich pyrochlore (Table 6, crystal 8) and HREE-Y-U-Pb-rich pyrochlore (Table 6, crystal 9) occur; the latter stands out for the incorporation of HREEs (up to 2.72 HREE2O3) and Y (up to 3.53 wt.% Y2O3) (Figure 23F). In the eastern BPEG, incipiently to moderately altered pyrochlore grains are Ca-Fe-U-Pb-rich pyrochlore (Table 6, crystal 10) with 3.28 wt.% LREE2O3 and Ca-Fe-Pb-U-rich pyrochlore (crystal 11) with 1.34 wt.% LREE2O3. The HREE contents in these pyrochlores are low compared to the northern BPEG.
Columbite
In the set of columbites, TREE2O3 ranges from 0.09 to 3.78 wt.%. Representative compositions of the most common columbite species are presented in Table 7. The Mn-Fe-rich columbite (Table 7, crystal 2) is predominant in both the CAG and BAG and usually has less than 1 wt.% TREE2O3. In the CAG, the averages are 0.39 wt.% TREE2O3 (ranging from 0.092 to 1.25 wt.%), 0.29 wt.% LREE2O3 (ranging from 0.09 to 1.15 wt.%), and 0.10 wt.% HREE2O3 (0 to 0.23 wt.%), along with an average 0.01 wt.% Y2O3 (0 to 0.15 wt.%). In the BAG, REE-U-Mn-Fe-rich columbite is also observed (Table 7, crystal 3), with averages of 1.51 wt.% TREE2O3, 0.85 wt.% LREE2O3, and 0.65 wt.% HREE2O3, along with an average 0.12 wt.% Y2O3 and up to 3.64 wt.% UO2. The LREE content, considering all columbite grains from the BAG, shows an average proportion of ~50% Ce, 13% Nd, 13% Sm, 10% Eu, and 8% La. Considering the HREE content, the average proportion is 34% Er, 33% Tm, 18% Yb, 18% Ho, and 15% Dy.
In the amphibole-rich PEG, mainly Mn-Fe-rich columbite is observed, with REE contents ranging from 0.27 to 3.78 wt.% TREE2O3, 0.05 to 3.51 wt.% LREE2O3, 0 to 0.38 wt.% HREE2O3, and 0 to 0.14 wt.% Y2O3. The average contents are 0.82 wt.% TREE2O3, 0.61 wt.% LREE2O3, and 0.20 wt.% HREE2O3, along with 0.04 wt.% Y2O3. In the eastern BPEG, columbite was not observed. In the northern BPEG, Fe-Mn-rich columbite and REE-U-Fe-Mn-rich columbite occur, with up to 0.78 wt.% TREE2O3 and averages of 0.20 wt.% LREE2O3, 0.37 wt.% HREE2O3, and 0.02 wt.% Y2O3.
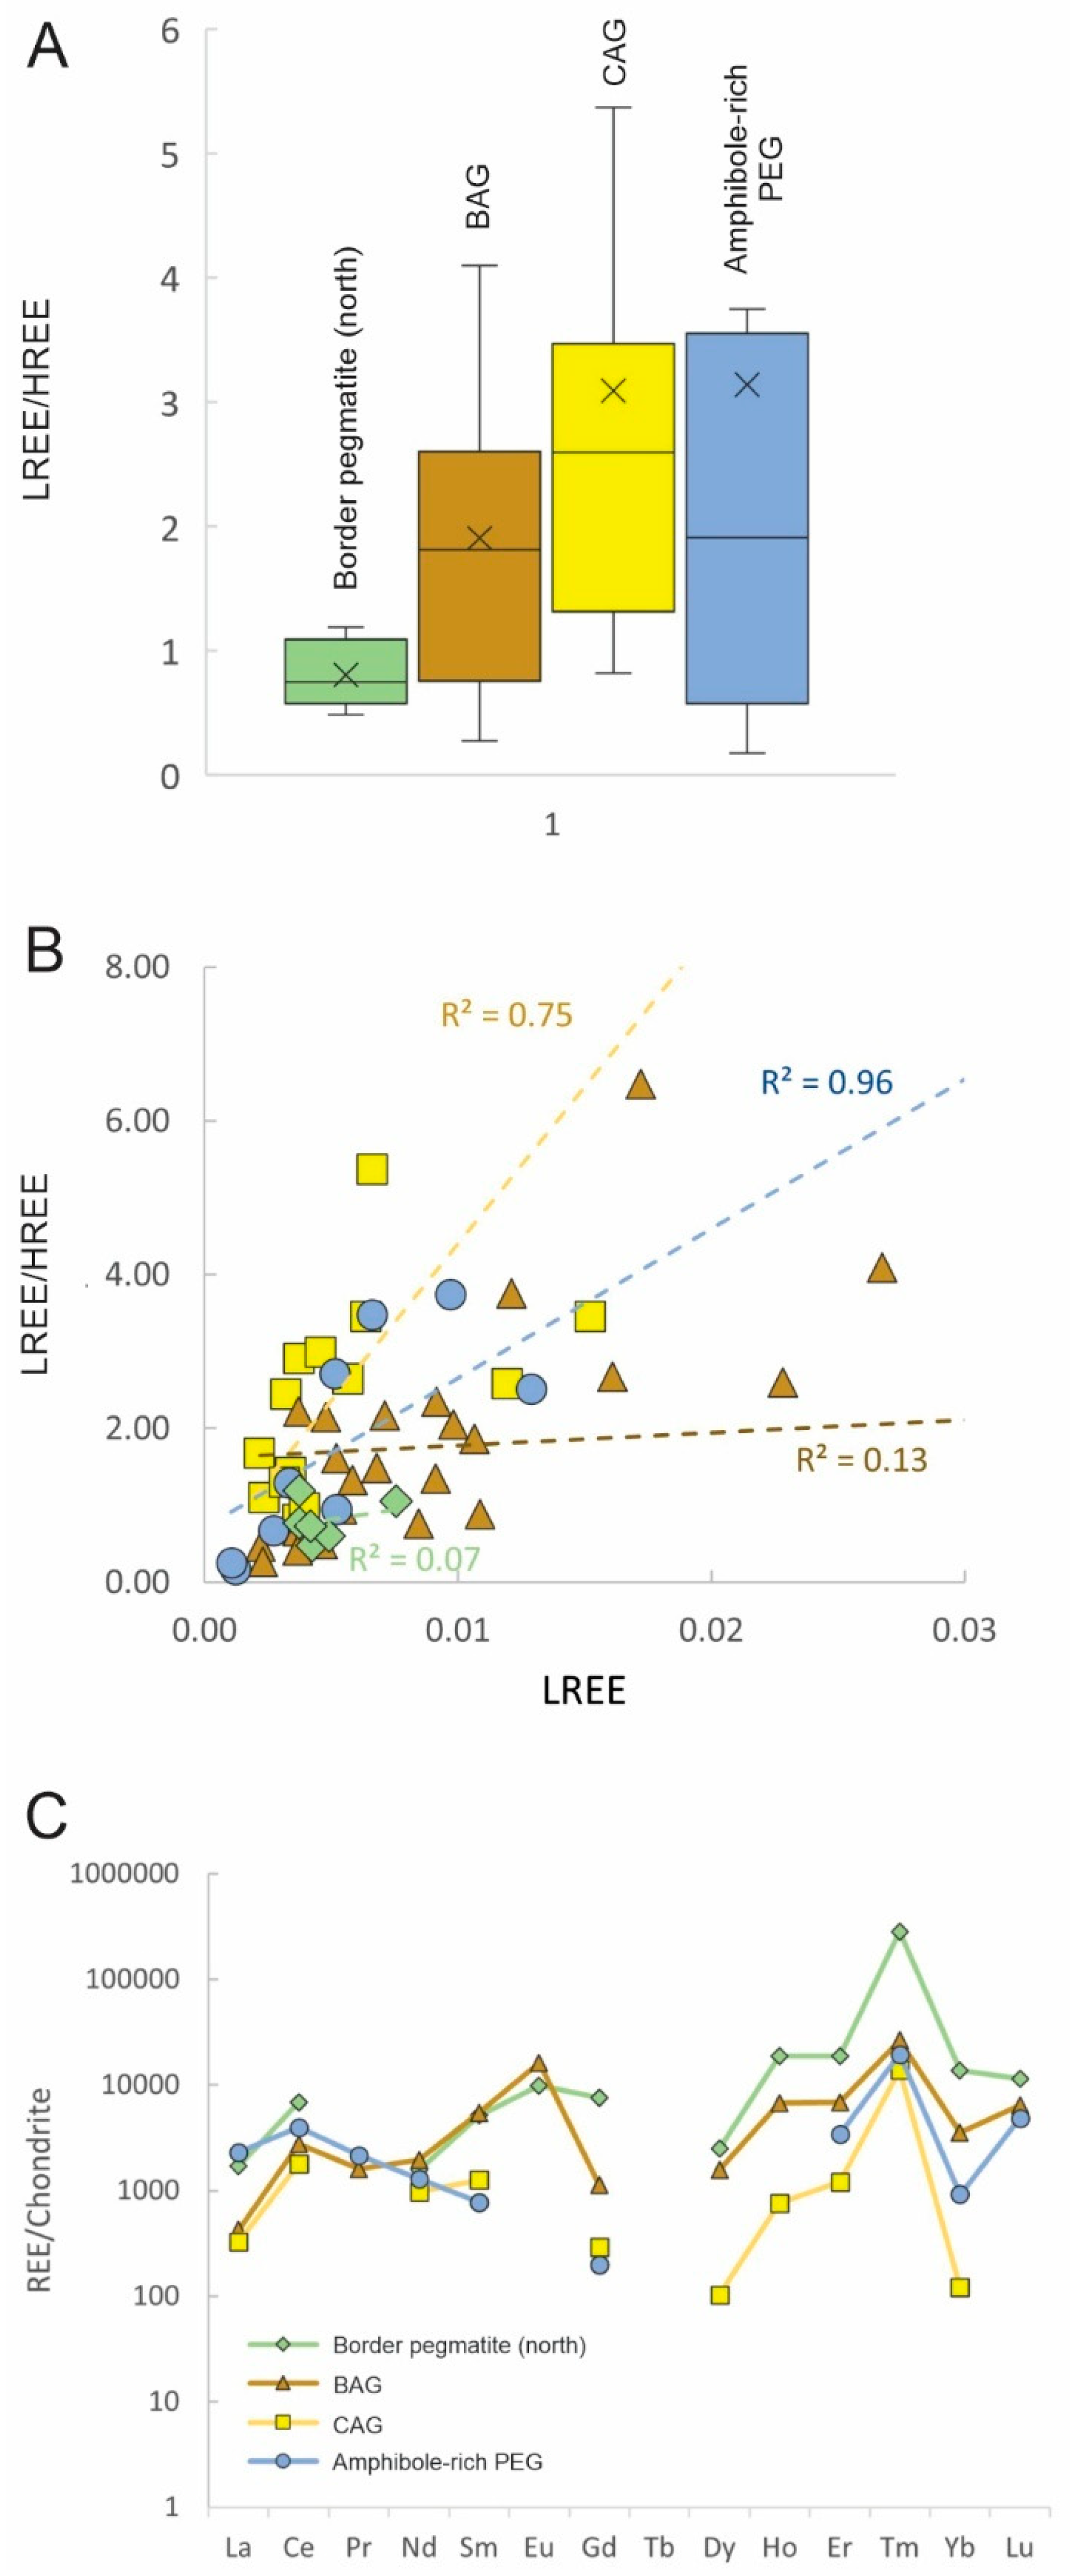
Columbite displays marked variations in LREE/HREE ratios across the different subfacies (Figure 24A). The lowest values are recorded in the northern BPEG (0.8) and the BAG (1.9), whereas higher ratios characterize columbite from the CAG (3.10) and the amphibole-rich PEG (3.14). In these latter settings, the ratio shows a clear positive correlation with LREE concentrations (Figure 24B). Chondrite-normalized REE patterns (Figure 24C) further indicate that overall REE abundances in columbite are lowest in the CAG, followed by the amphibole-rich PEG, the BAG, and finally the northern BPEG, which shows the highest contents. Distinct positive anomalies in Ce, Eu, and Tm are also evident.
REE Composition of Other Products of Pyrochlore Alteration
The most representative compositions of these minerals are presented in Table 7. In several cases, the analytical totals are low, partly due to hydration, as these phases occur in association with highly altered pyrochlore crystals. In addition, a combination of porosity (voids) and hydration related to late hydrothermal alteration, together with metamictization, also contributes to these low totals. The (HREE-Y-Zr)-Th-U-rich silicates (Table 7, crystals 4–5) occur mainly in highly or completely altered pyrochlore grains (more commonly in the BAG and the central zone of the CAG). In these secondary phases, Y2O3 ranges from 0 to 14.57 wt.%, and TREE range from 0.28 to 8.93 wt.%. The HREE content is significantly more pronounced, reaching up to 8.80 wt.% HREE2O3 (average of 2.98 wt.%), in comparison to the much lower LREE contents, which reach up to 3.10 wt.% LREE2O3 (average 0.69 wt.%). Among the total HREE content, the highest average proportions are 27% Dy, 24.5% Er, and 23% Yb, followed by Gd, Lu, and Tm. Cerium (34%), Nd (28%), and Sm (27%) account for the highest average proportional LREE contents.
These phases can be interpreted as intermediate members within the coffinite–thorite–xenotime–zircon compositional spectrum. However, their calculated structural formulas consistently show vacancies in both the A and B sites [A1-□B1-□X)4], with □A ranging from 0.01 to 0.39 and □B from 0.01 to 0.42. This feature is most likely related to the relatively high Nb5+ contents accommodated in the B site (averaging 3.18 wt.% Nb2O5). The presence of Nb, together with elevated fluorine concentrations (average 2.77 wt.% F), restricts the incorporation of OH into the structure. Nevertheless, given the systematically low totals of these secondary phases, a significant proportion of molecular H2O is likely present. Nanoscale investigations of pyrochlore alteration [65] identified fergusonite-(Y), waimirite-(Y), uraninite, and coffinite occurring in fractures and at grain interfaces. These observations suggest that these (HREE-Y-Zr)-Th-U-rich silicates are part of the solid solution system xenotime–coffinite–thorite–zircon. XRD and Raman analyses will be conducted to confirm the precise identification of these mineral phases.
In the northern BPEG, these secondary silicates are further enriched in HREEs and Y (Table 7, crystal 6), with up to 15.44 wt.% Y2O3 and 11.22 wt.% HREE2O3. The HREE2O3 content presents an average of 6.89 wt.%, whereas the LREE2O3 content averages only 0.25 wt.% (up to 1.17 wt.%). Among the total HREE content, the highest average proportions are Yb (33%), Er (29%), and Dy (17%).
In the PEG, these secondary silicates are rare, and the observed phases are Th-enriched, with lower contents of Y2O3 (up to 3.02 wt.%), HREE2O3 (up to 2.64 wt.%), and LREE2O3 (up to 0.59 wt.%) compared to the AEG and BPEG.
The Y-LREE-rich fluorides in the CAG and BAG (Table 7, crystals 7–10) present a range from 27.18 to 46.09 wt.% LREE2O3 (average 37.72 wt.%), 4.92 to 13.33 Y2O3 (average 9.04 wt.%), and less significant amounts of HREE2O3 (average of 0.11 wt.%, up to 1.47 wt.%). In the CAG, this phase is also enriched in ThO2 (average of 4.24 wt.%, up to 13.02 wt.%), whereas in the BAG, it presents an average of 0.44 wt.% ThO2 (up to 3.13 wt.%) and up to 3.81 wt.% UO2 (average 0.37 wt.%).
In the PEG, this phase presents averages of 34.87 wt.% LREE2O3 (up to 46.76 wt.%), 9.39 wt.% Y2O3 (up to 13.23 wt.%), 0.29 wt.% HREE2O3 (up to 1.35 wt.%), 1.92 wt.% ThO2 (up to 4.04 wt.%), 0.32 wt.% UO2 (up to 8.84 wt.%), and up to 3.49 wt.% PbO. In the northern BPEG, the Y-LREE-rich fluorides present similar LREE2O3 (average 43.93 wt.%, up to 45.29 wt.%), Y2O3 (average 10.70 wt.%, up to 10.97 wt.%), and HREE2O3 (0.15 wt.%, up to 2.18 wt.%) contents, with Th, U, and Ca contents lower than 1%.
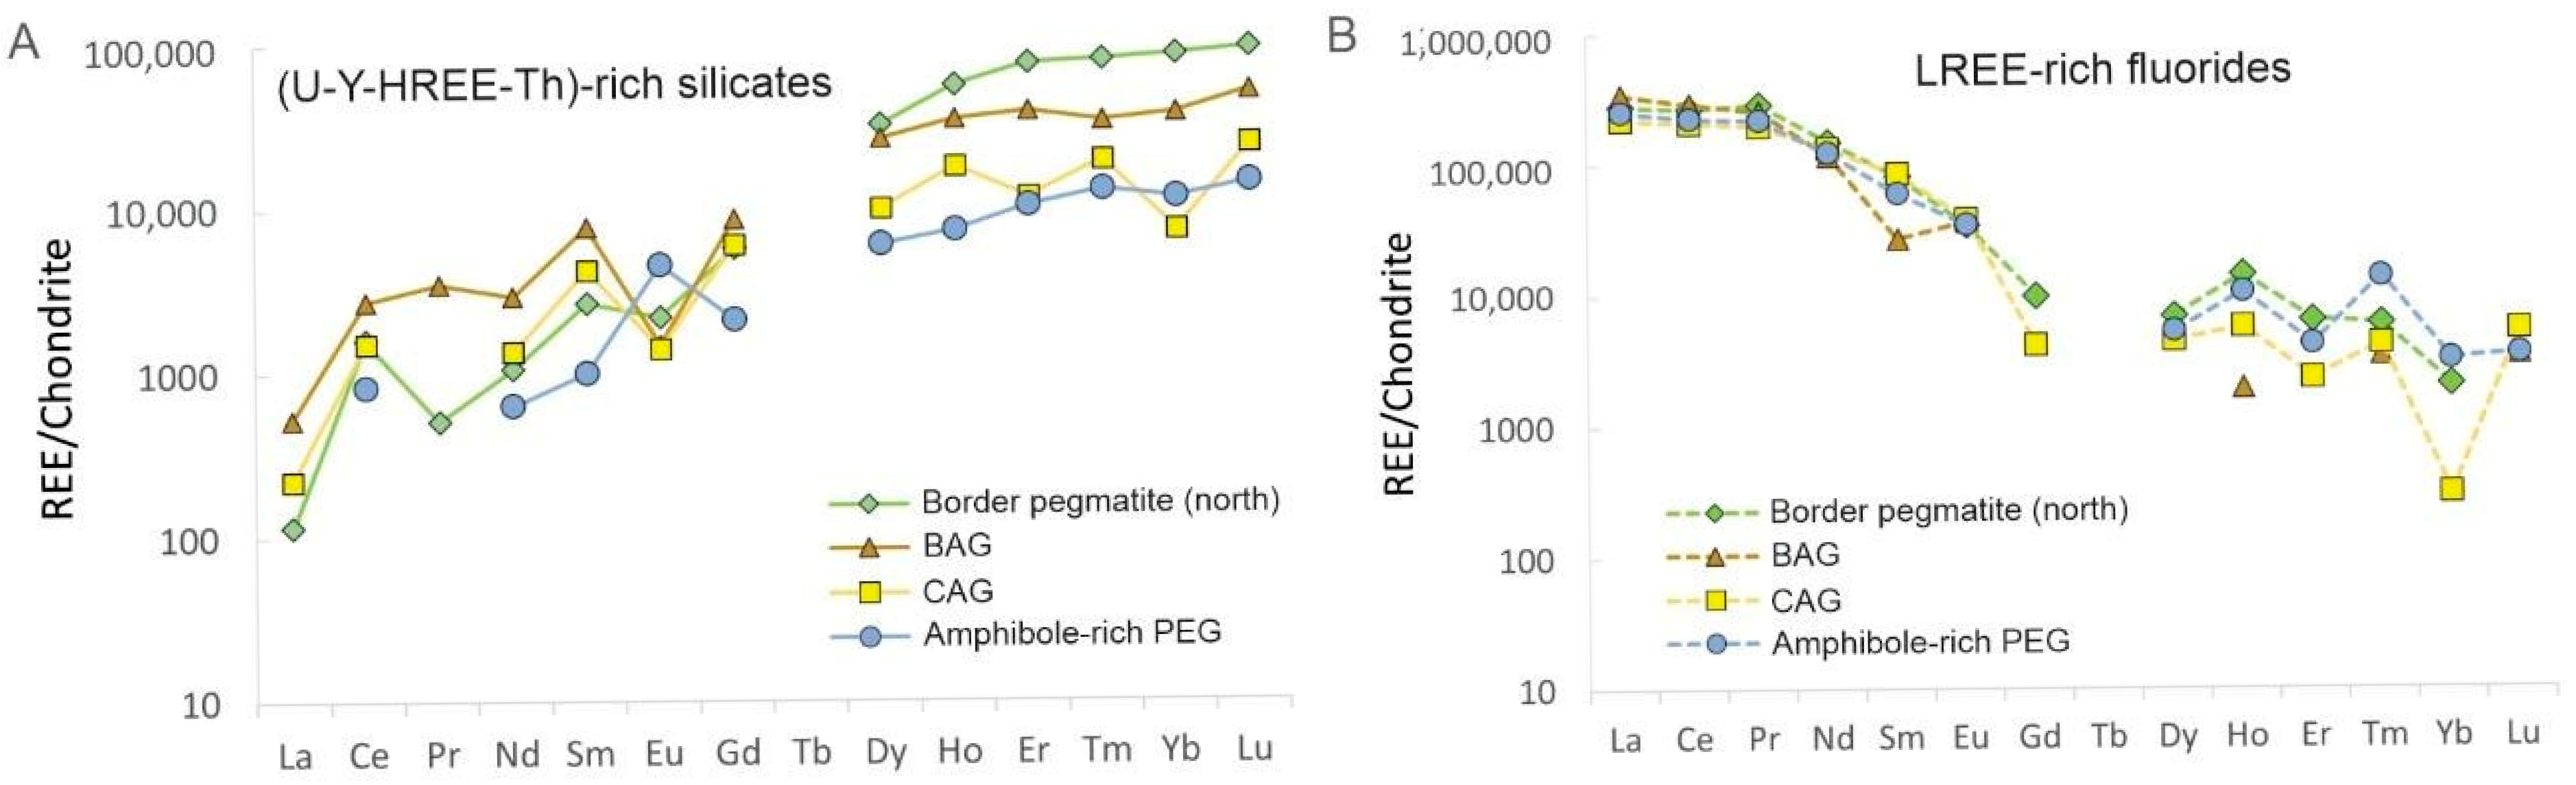
Chondrite-normalized REE patterns (Figure 25A) of (HREE-Y-U-Th)-enriched silicates from both the northern BPEG and the amphibole-rich PEG closely resemble those observed in the CAG and BAG, particularly in showing relatively flat HREE distributions. Among these occurrences, the highest HREE concentrations are recorded in the northern BPEG, whereas the amphibole-rich PEG hosts the most HREE-depleted compositions. In contrast, LREE-rich fluorides (Figure 25B) display highly consistent normalized patterns across all lithologies, with little variation between different rock types.

4.5. Gagarinite-(Y) and Fluocerite-(Ce)

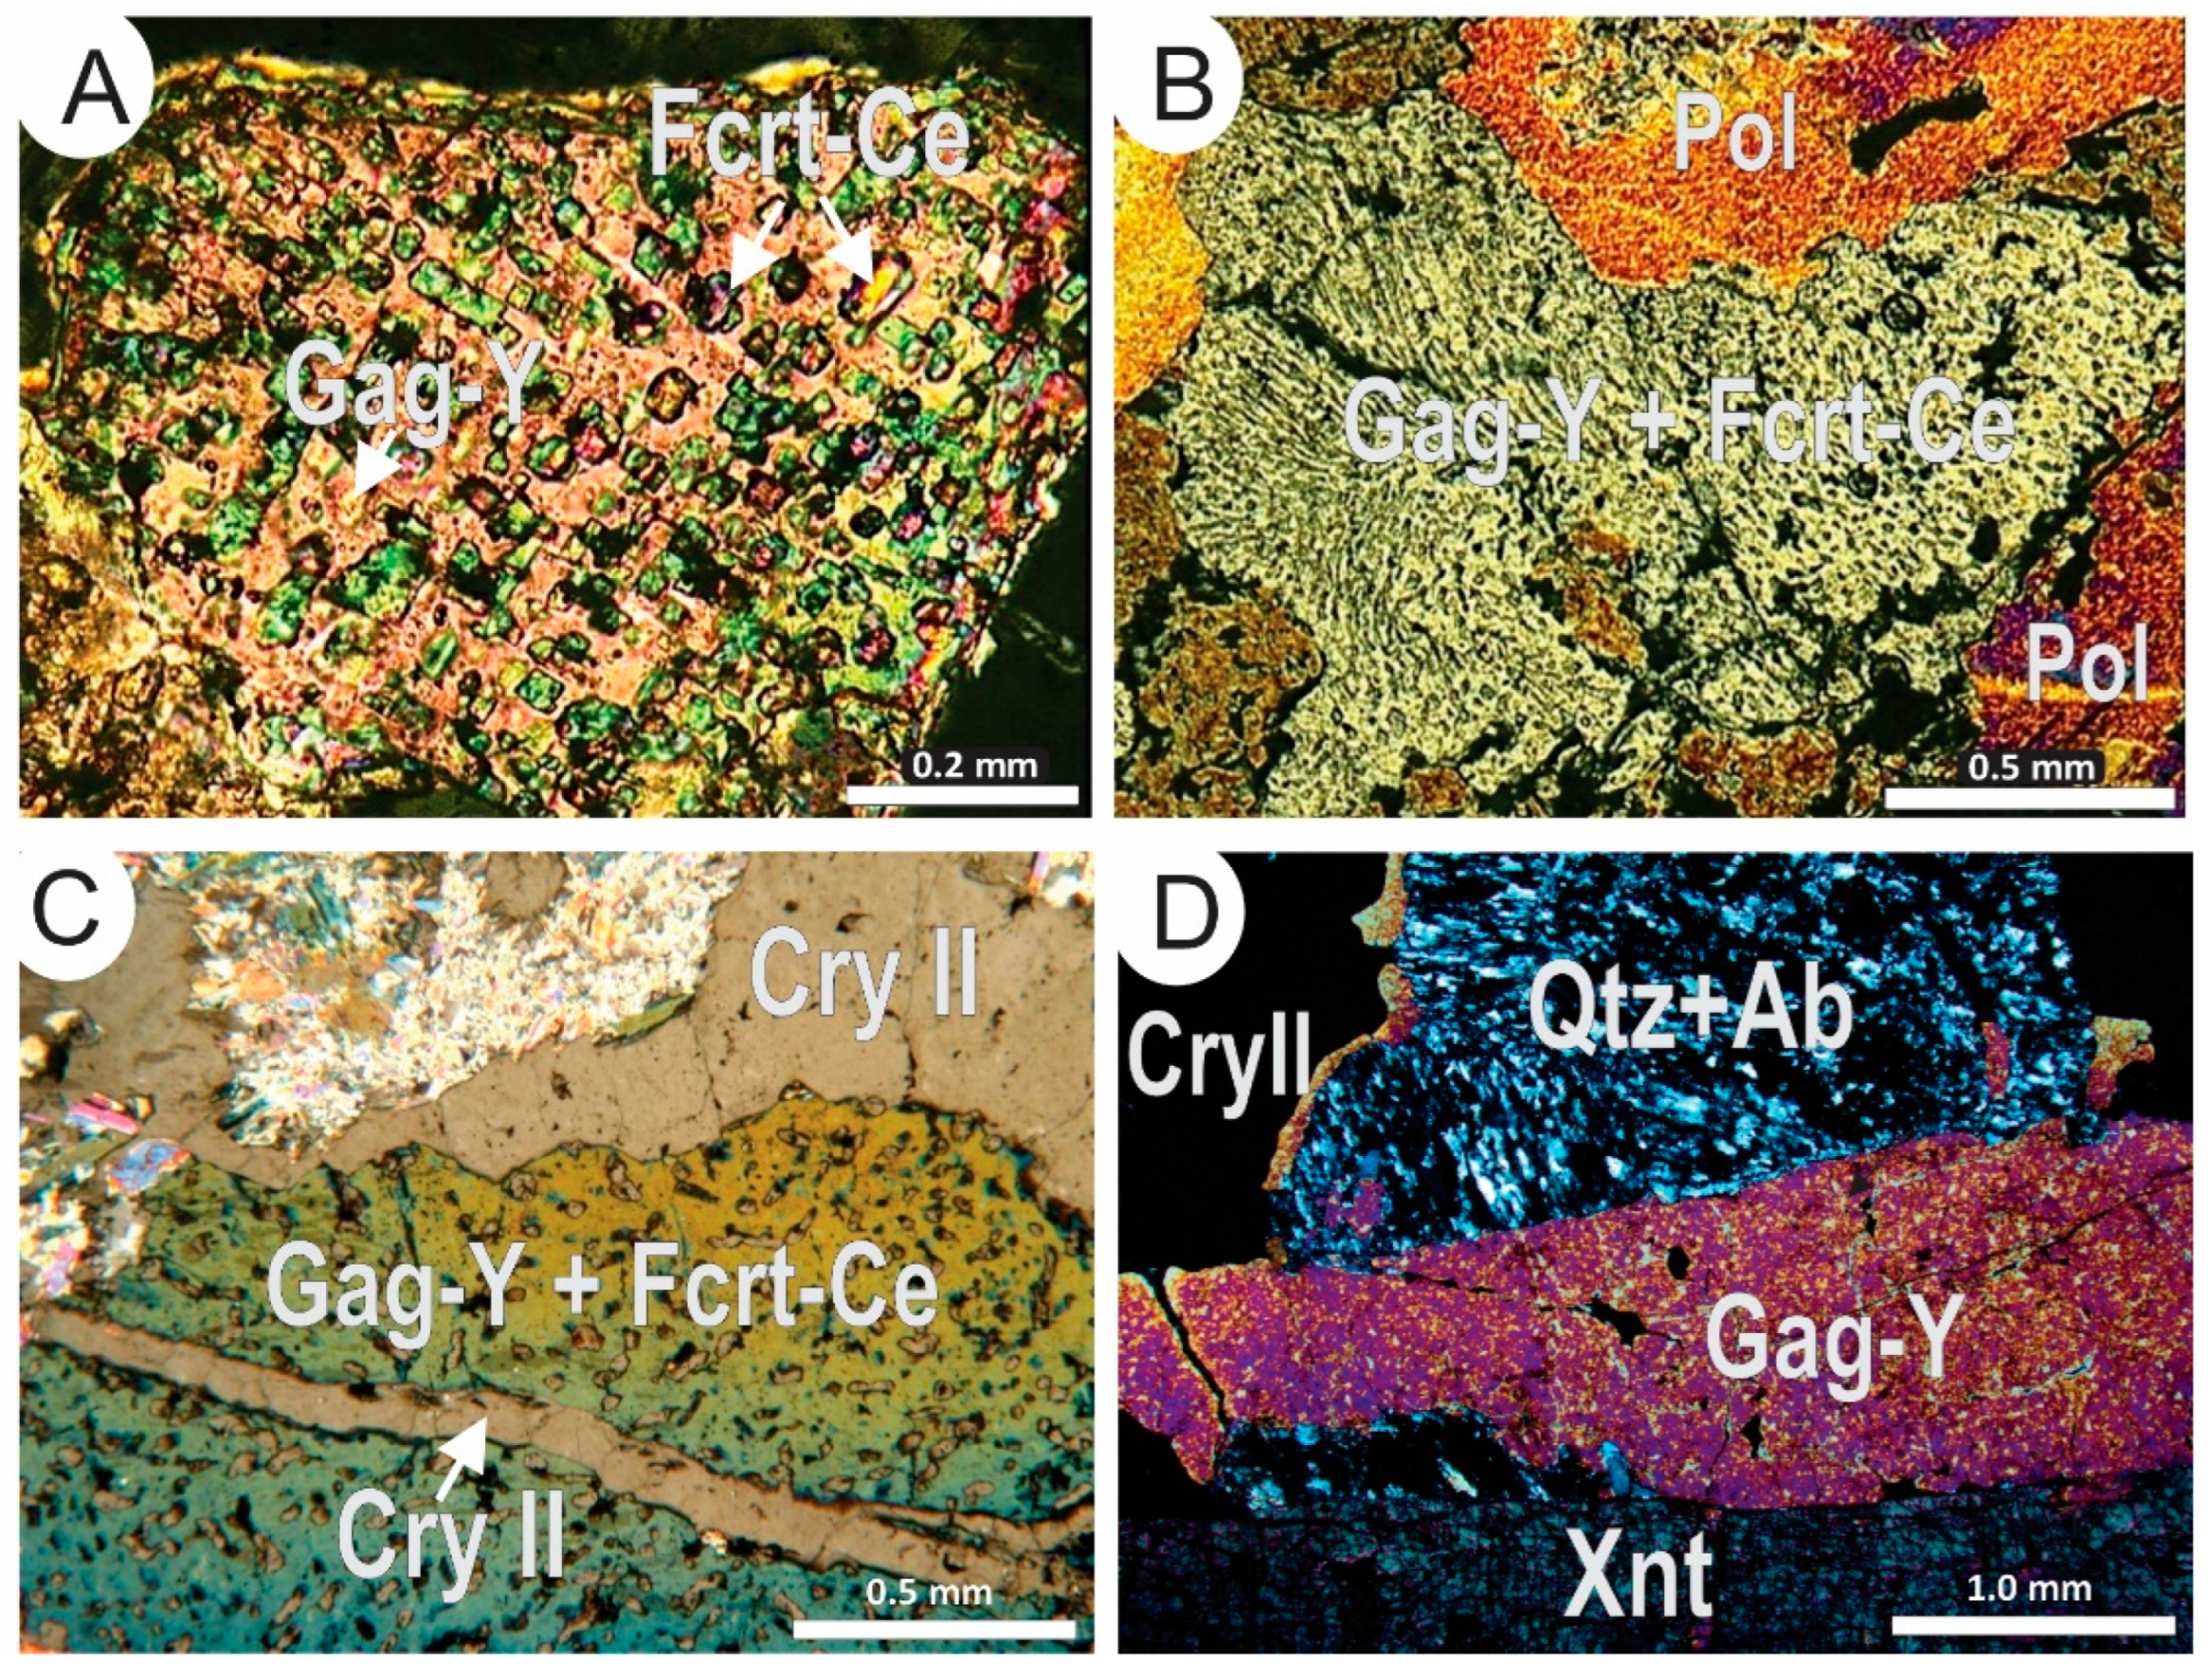
Gagarinite-(Y) occurs in the central part of the CAG [41,43] and in the PEG [29,31]. Gagarinite-(Y) crystals from the CAG are translucent, anhedral, and 0.5 to 6.8 mm across, and they present exsolutions of fluocerite-(Ce) commonly distributed uniformly along one or more orientations (Figure 26A) and, in some cases, as strings or stringlets (Figure 26B). Modal analysis of diverse textural types of exsolution gives 25.7% of the exsolved phase. Fractures in gagarinite-(Y) are filled by hydrothermal cryolite (Figure 26C) that corrodes the host and exsolved phases [35,41].
Gagarinite-(Y) in pegmatites (Figure 26D) occurs as anhedral crystals ranging from 0.2 mm to 4.0 cm in size that are pink in natural light, and it is more frequent in cryolite-rich PEG. Exsolutions have not been observed. It is intensely affected by corrosion at the contact with hydrothermal cryolite.
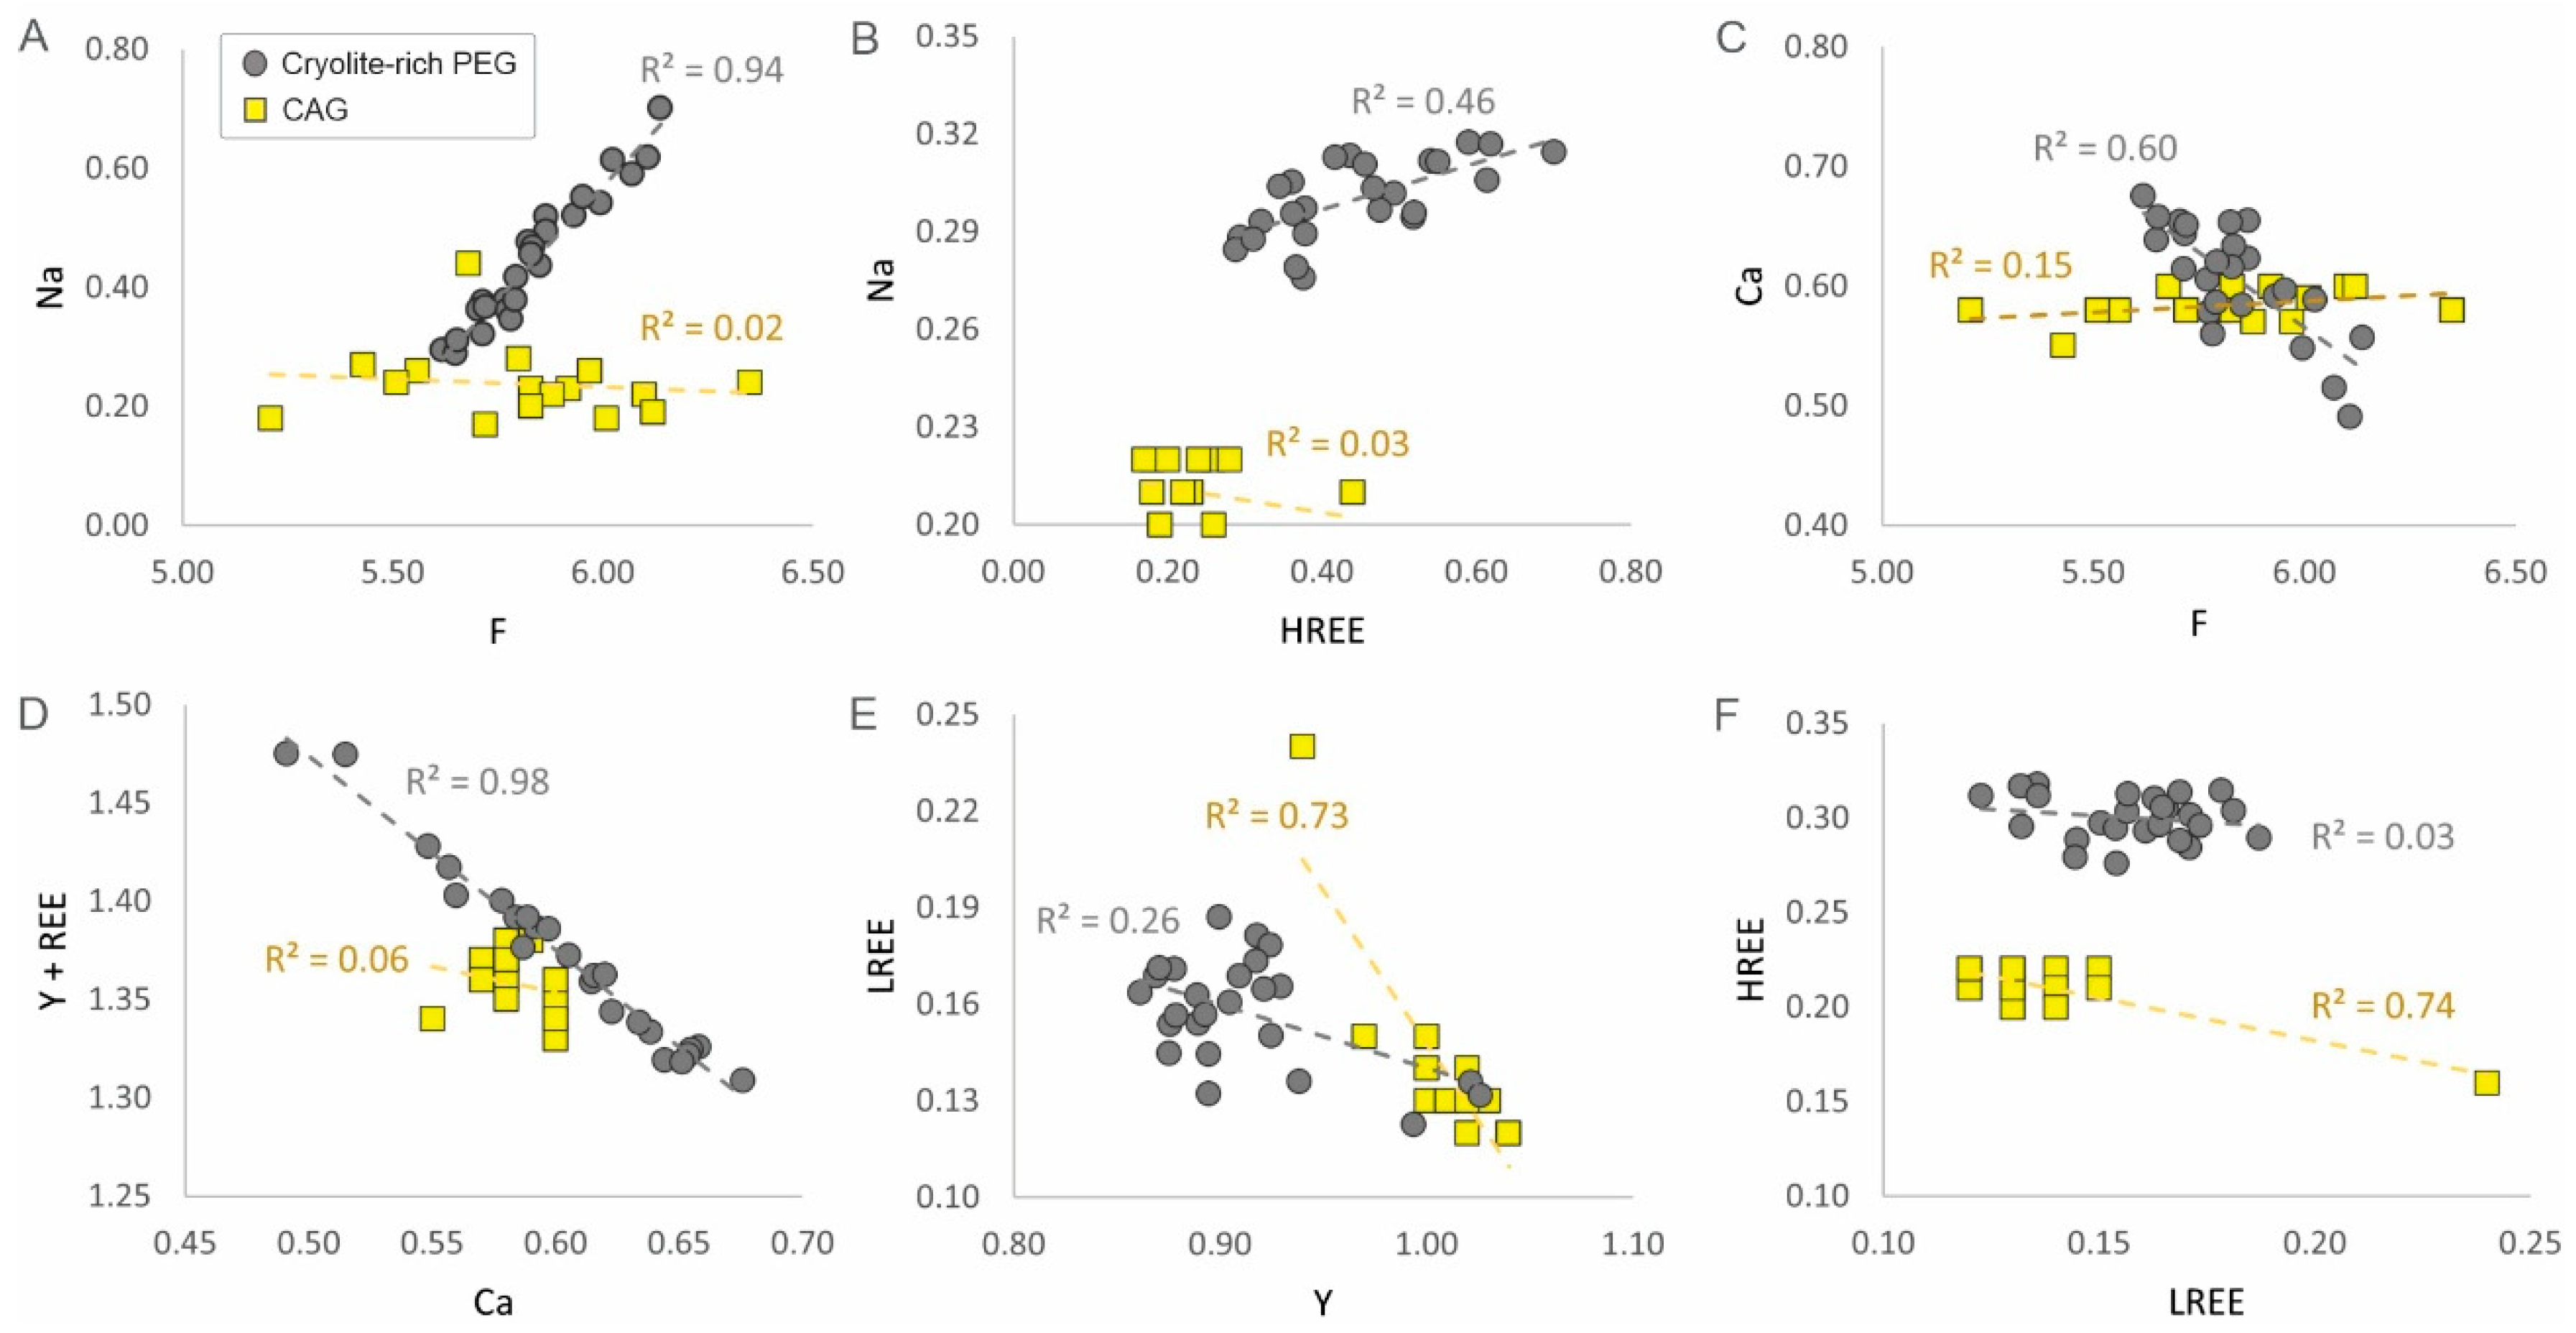
Average compositions and structural formula of gagarinite-(Y) and fluocerite-(Ce) are presented in Table 8. In the CAG, gagarinite-(Y) presents higher average contents of Y (31.12 wt.%), LREEs (9.03 wt.%), and Ca (8.10 wt.%), whereas in the cryolite-rich PEG, it is richer in HREEs (15.66 wt.%), Na (3.19 wt.%), and F (42.29 wt.%). Fluorine and Na, as well as Na and HREEs, exhibit positive correlations (Figure 27A,B), while Ca has a strong negative correlation with F and with Y + REEs (Figure 27C,D). Moderate negative correlations exist between Y and LREEs (Figure 27E), and between HREEs and LREEs (Figure 27F) in the CAG gagarinite-(Y) [31].
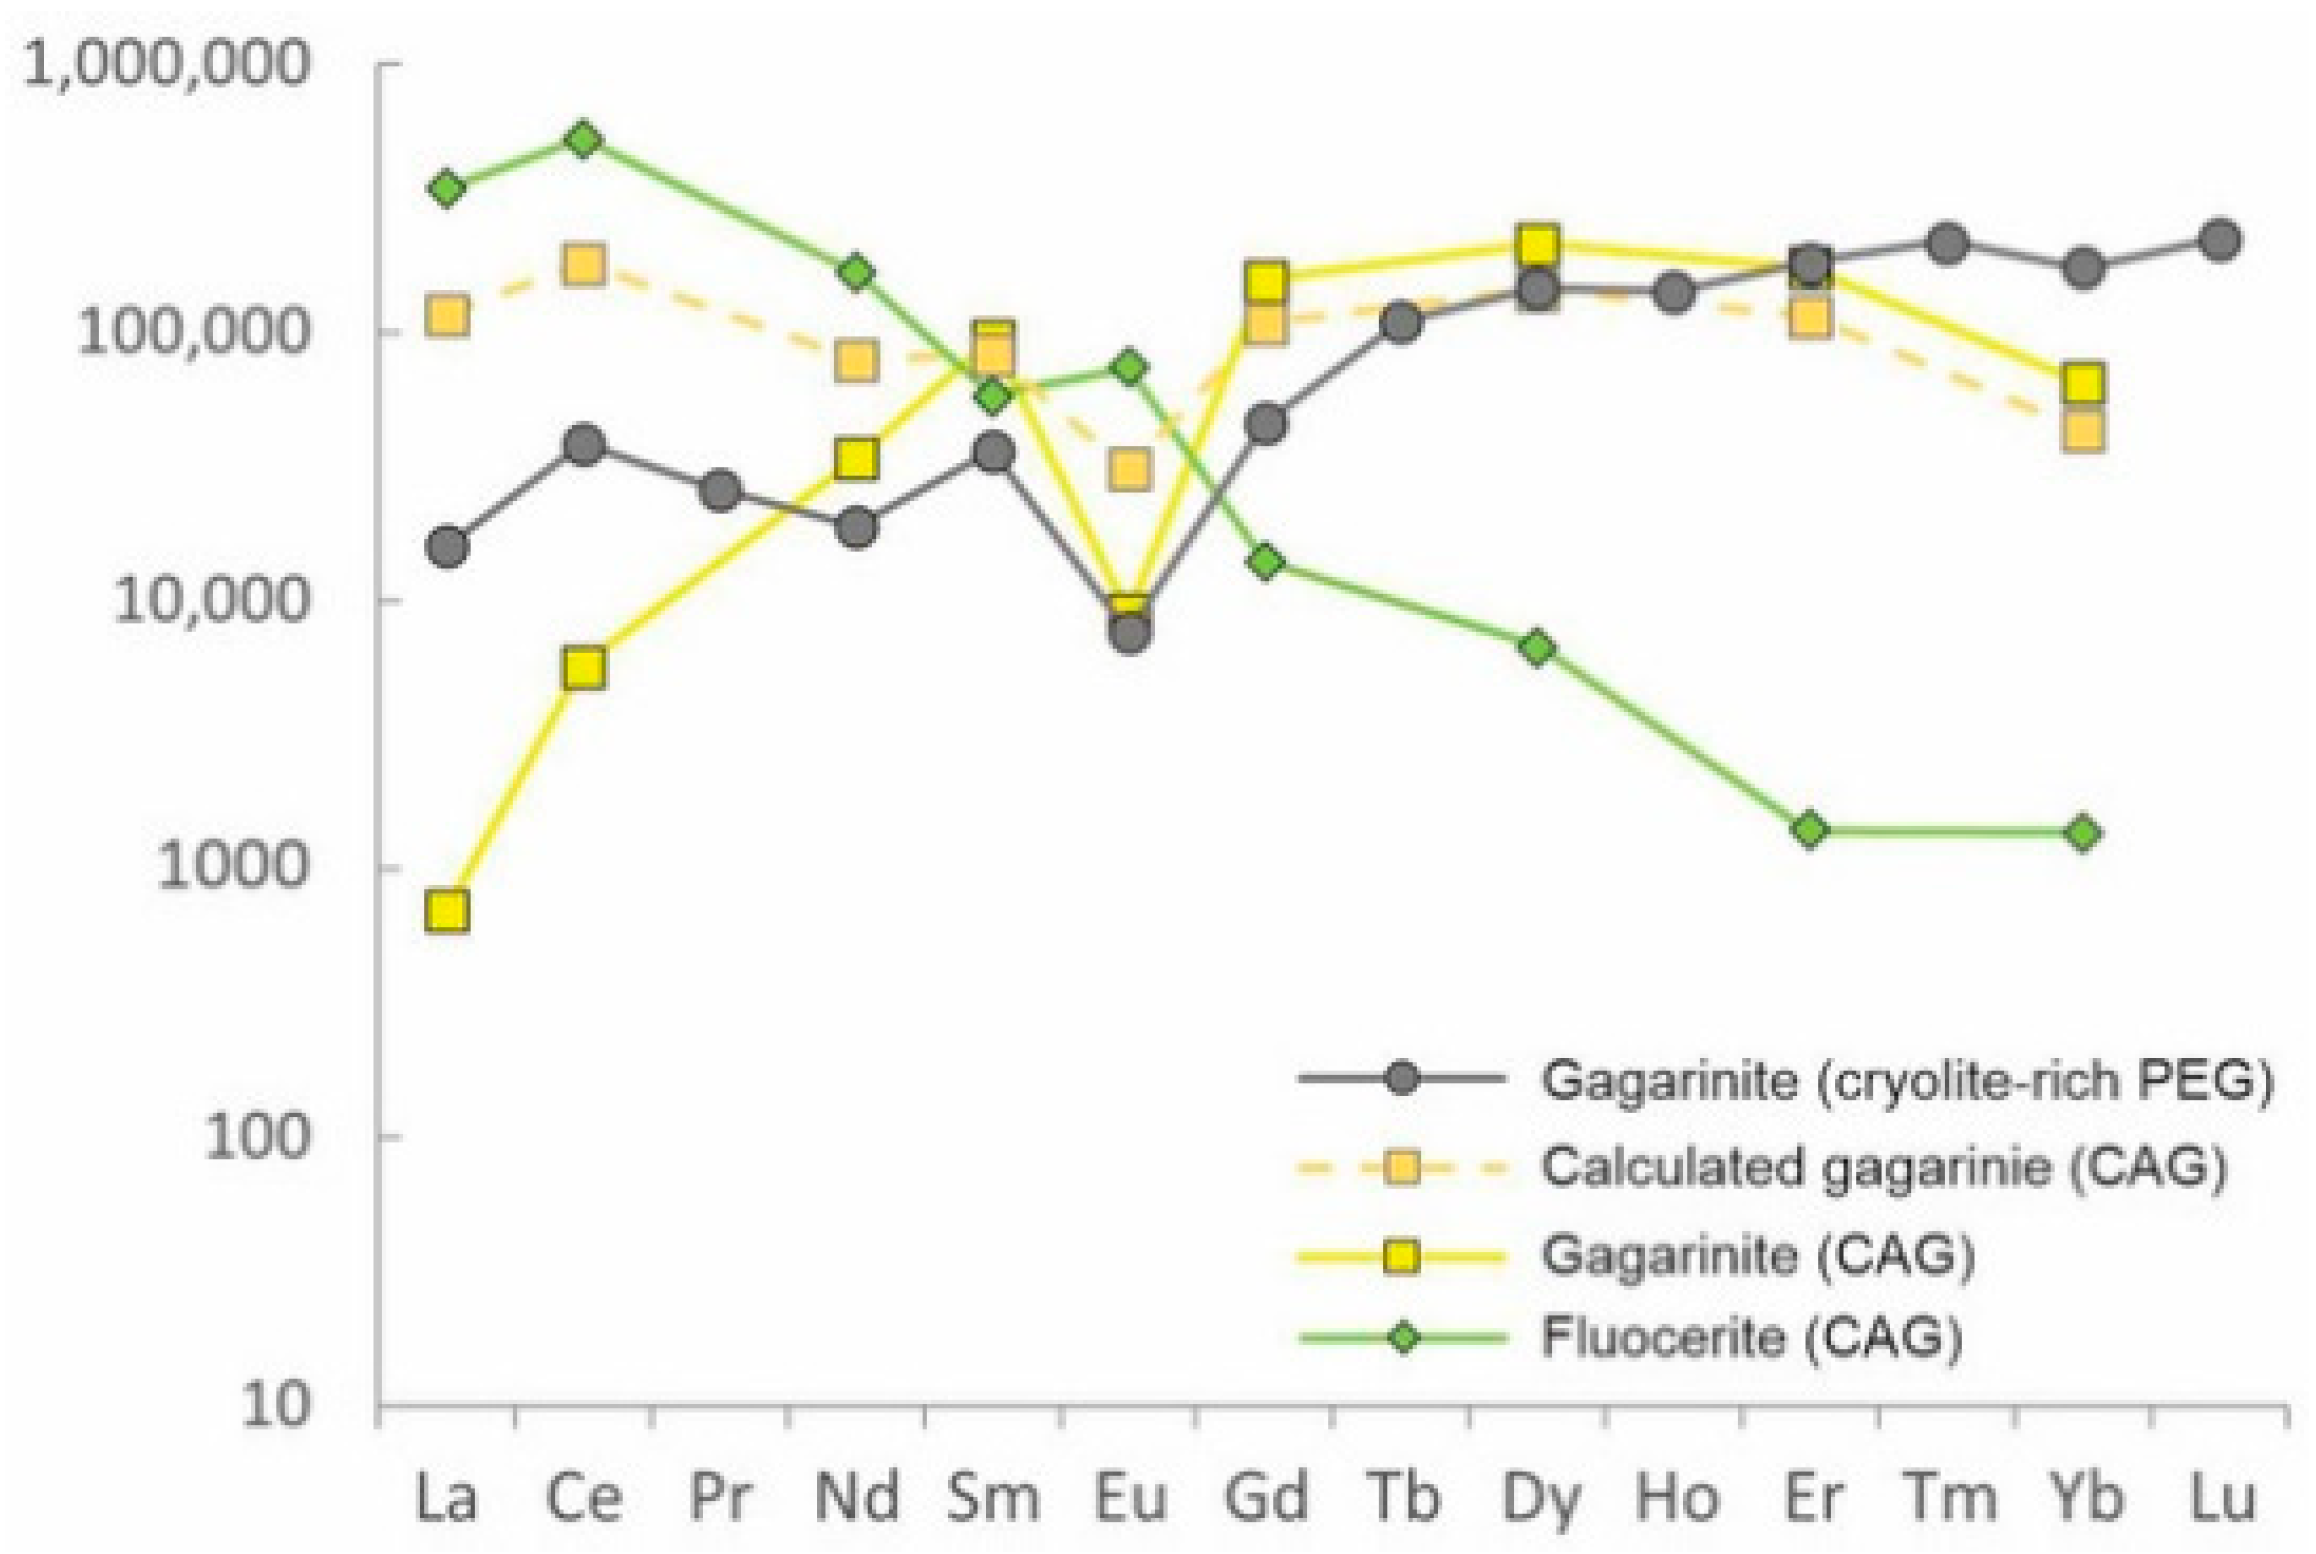
The chondrite-normalized REE pattern (Figure 28) of gagarinite-(Y) from the CAG shows a strong LREE depletion, especially in La and Ce, compared to gagarinite-(Y) from the cryolite-rich PEG. The exsolved fluocerite-(Ce) presents HREE depletion relative to LREEs. To estimate the composition of the earliest gagarinite (prior to exsolution), the volume percentages (74% gagarinite and 26% exsolved phase) obtained by modal analysis were converted to weight percentages (66% gagarinite and 34% exsolved phase), taking into account the densities of the two minerals. The calculated composition of the earliest gagarinite displays a flat REE pattern (Figure 28). In contrast, gagarinite-(Y) from the cryolite-rich PEG is enriched in HREEs and has lower LREE contents than the earliest gagarinite-(Y) in the CAG [31,41].
The presence of fluocerite-(Ce) inclusions was attributed to the exsolution of LREEs with ionic radii larger than that of Sm, triggered by the contraction of the initial gagarinite structure due to cooling [41], resulting in the formation of the host gagarinite-(Y) (rich in HREEs and poor in LREEs) and the exsolved-phase fluocerite-(Ce) (rich in LREE). Such LREE exsolution did not occur in the gagarinite-(Y) of the cryolite-rich PEG due to the LREE content being insufficient to destabilize its structure during cooling.

4.6. Cryolite, Chiolite, Fluorite, and Waimirite-(Y)

Cryolite has never been exploited for REE production. Nevertheless, Paulino et al. [66] demonstrated the feasibility of recovering REEs as a by-product of sodium and aluminum production after leaching cryolite from the MCD for the production of hydrogen fluoride. REEs were extracted using PC 88A, and yield increased with the atomic number of the REEs. Due to their abundance in the rock, magmatic cryolite and disseminated hydrothermal cryolite were also included in this study.
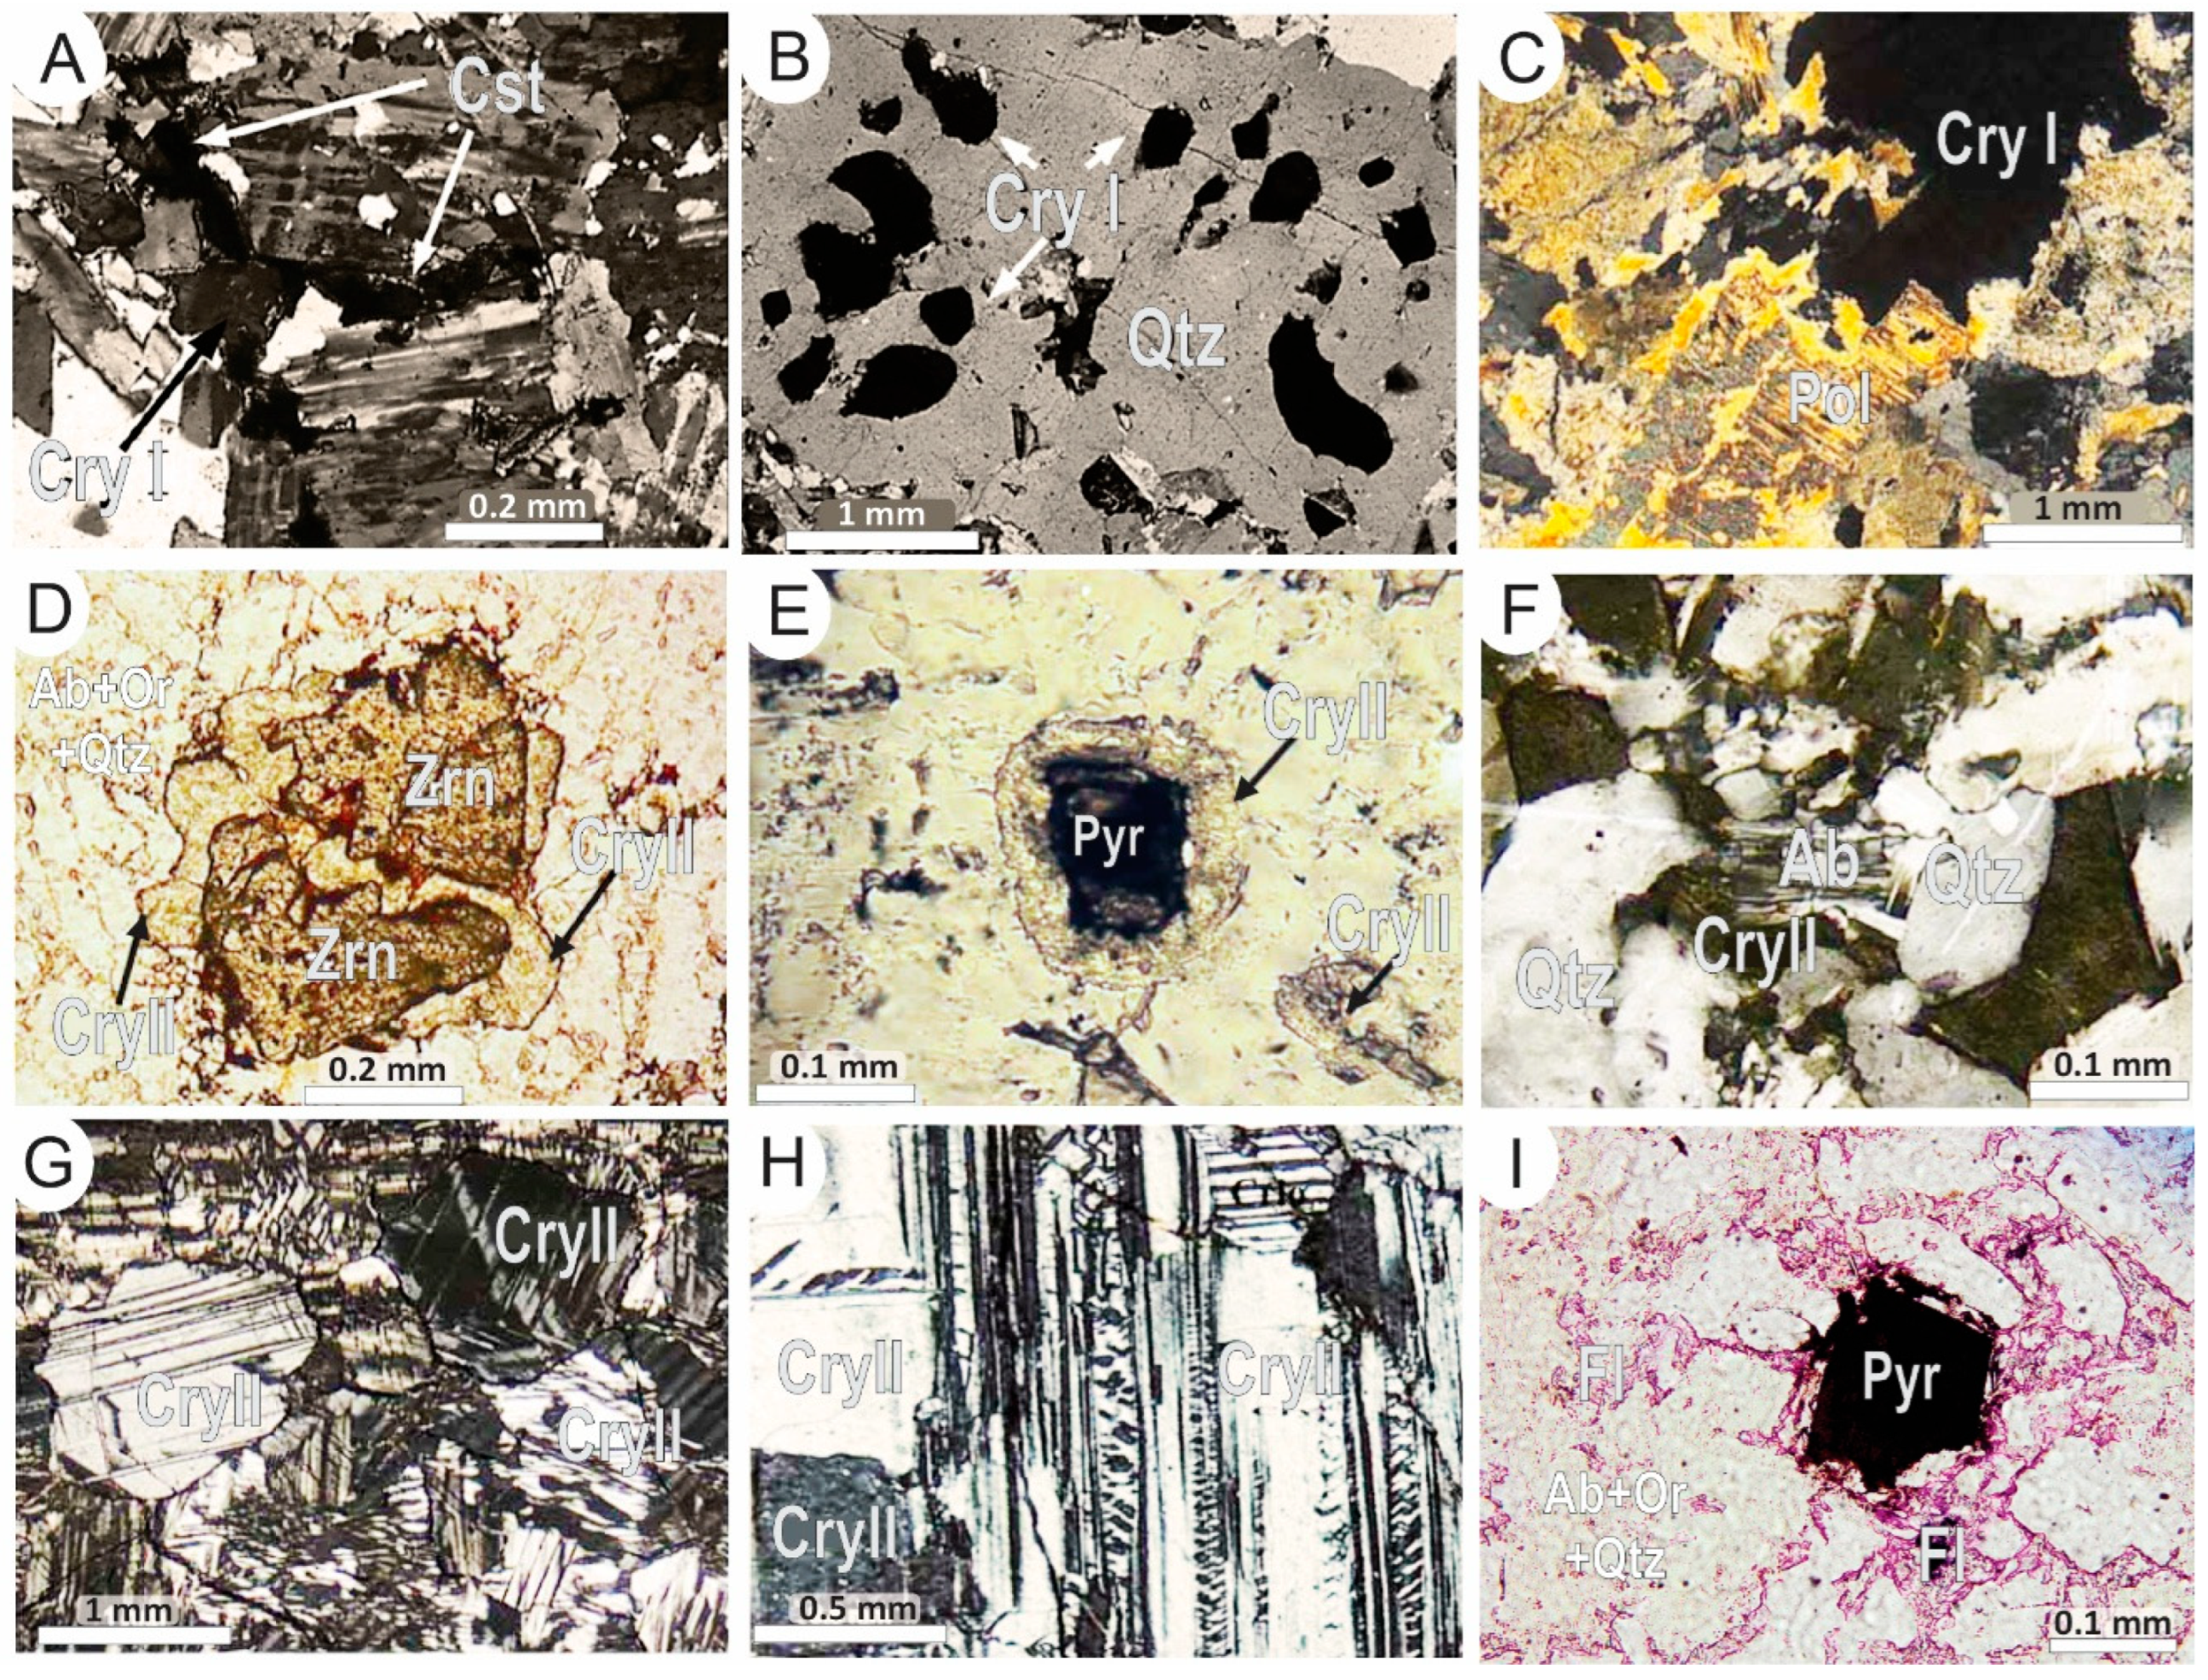
In the CAG, two types of disseminated cryolite are recognized. Cryolite I is magmatic, nearly isotropic, and rarely twinned. It occurs most commonly as disseminated (Figure 29A) subhedral-to-anhedral rounded crystals (0.02 to 1.05 mm) in equilibrium with early zircon and showing a straight or concave–convex contact with albite and K-feldspar phenocrysts. It also occurs as oval inclusions (0.04 to 0.30 mm) in quartz phenocrysts, commonly exhibiting a “snowball” texture (Figure 29B), and in mica agglomerates (Figure 29C), all without corrosion features. Cryolite II, hydrothermal, is characterized by corrosion features in nearly all contact minerals. It forms a complete or partial envelope around magmatic zircon (Figure 29D), pyrochlore (Figure 29E), thorite, and cassiterite, displaying a reaction rim with these minerals. It is also found very finely disseminated (<0.05 mm) in the rock matrix (Figure 29F). Cryolite II is more abundant in the CAG closer to the MCD [35].
Cryolite crystals in the MCD are of two generations: (1) the earliest cryolite is zoned, with a brown-to-dark yellow rim and a medium-gray core; (2) caramel cryolite occurs as massive aggregates that engulf zoned cryolite crystals. White cryolite, described by Minuzzi et al. [27] as a third cryolite generation, was later identified as chiolite [67]. Cryolite bodies from the upper part of the MCD consist of caramel cryolite with minor proportions of zoned cryolite, which are indistinguishable in thin section (Figure 29G,H). In the intermediate portion, caramel and nucleated variants occur in approximately equal proportions, while in the lower part, nucleated cryolite predominates.
Chiolite (Na5Al3F14, tetragonal) occurs exclusively at the base of the MCD. Chiolite is white-to-light gray, locally translucent, composed of finely crystalline aggregates with a saccaroidal texture, and locally massive. Subordinate thomsenolite (NaCaAlF6.H2O, monoclinic) occurs in association with chiolite [67].
In the BAG, instead of cryolite, only fluorite occurs, typically disseminated interstitially in the matrix and surrounding accessory minerals such as pyrochlore (Figure 29I), thorite, zircon, and cassiterite. Fluorite displays a corrosive contact with surrounding minerals and is considered of hydrothermal origin.
Waimirite-(Y), (Y0.69Dy0.08Er0.06Yb0.05Ca0.03Gd0.02Ho0.02Nd0.01Sm0.01Tb0.01Tm0.01Lu0.01)S1.00 (F2.54O0.210.25)∑3.00, is an REE mineral first described in the Madeira deposit [20,68]. It occurs in association with halloysite in centimeter-thick hydrothermal veins that cross-cut the CAG at a single locality and, more rarely, within nanofractures in altered pyrochlore. Due to its restricted occurrence, it is not considered significant for the purposes of the present study.
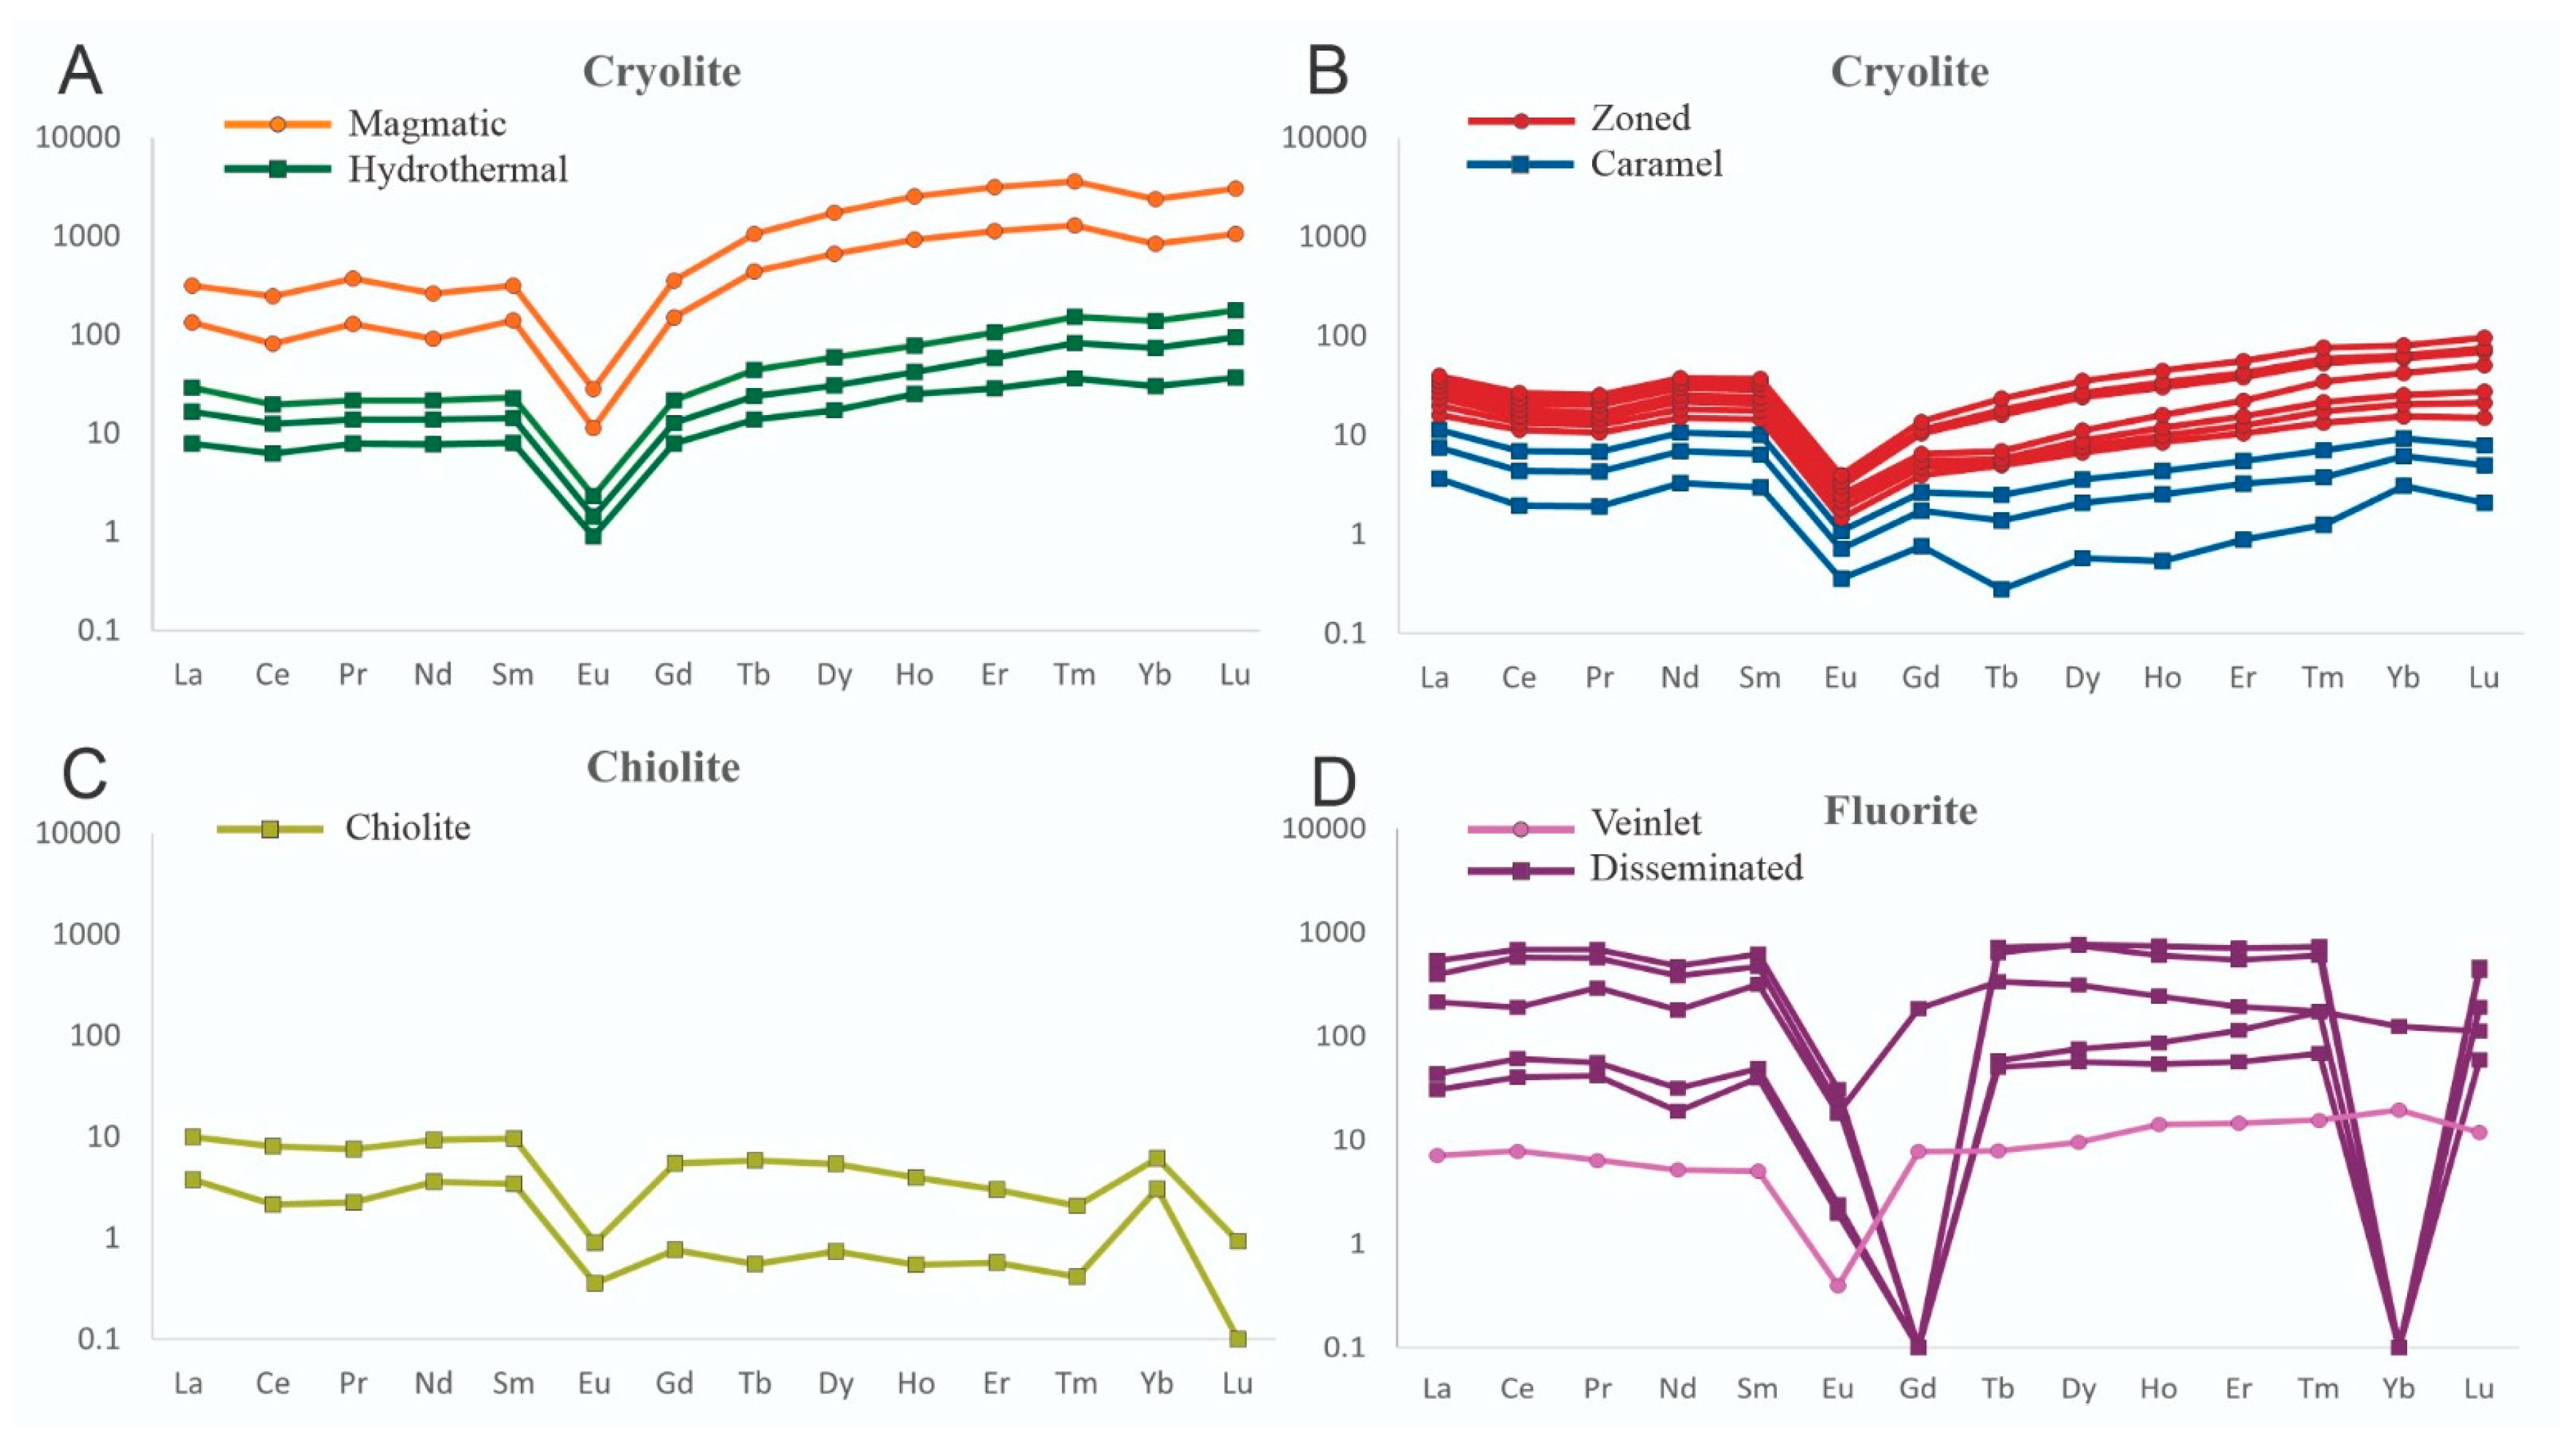
Representative EPMA data for the cryolite varieties, chiolite, and fluorite are presented in Table 9. Europium anomalies were calculated following Eu* = 2 × Eun/(Smn + Gdn). ∑REE values in magmatic cryolite (677 ppm and 1345 ppm) are much higher than those in hydrothermal disseminated cryolite (29 ppm to 45 ppm). MCD cryolite and chiolite (Figure 30) display even lower ∑REE values, with average values of 10.3 ppm (zoned cryolite), 6.66 ppm (caramel cryolite), and 8.38 ppm (chiolite). The highest ∑REE value in the MCD (16.81 ppm) was obtained in zoned cryolite.
Cryolite I (Table 9) displays a relative enrichment in REEs (3.6 < REE/Y < 6.4) and a relative enrichment in HREEs (0.22 < LREE/HREE < 0.25), which is opposite to the ratio observed in the host rock (LREEs > HREEs). These two aspects may reflect the preferential replacement of Na by REEs with smaller ionic radii (with Y behaving similarly to HREEs). Cryolite II is characterized by relatively low HREE and Y contents and a negative Eu anomaly (Eu/Eu* from 0.09 to 0.11) compared to cryolite I (Eu/Eu* from 0.07 to 0.09). The two generations of massive cryolite display a systematically less pronounced Eu anomaly (Eu/Eu* from 0.11 to 0.21). Some parameters (Y, ∑REE, La/Lu, and LREE/HREE) show a continuous evolution from the magmatic environment through low-temperature hydrothermal conditions. The La/Lu ratio increases conspicuously toward the late-stage cryolite: cryolite I (0.90 to 1.14), cryolite II (1.47 to 2.06), zoned cryolite (1.61 to 5.40), caramel cryolite (5.67 to 17.41) and chiolite (12.13 to 218.60). The evolution of LREE/HREE values shows a continuous depletion in HREEs, from cryolite I (0.22 to 0.25) to cryolite II (0.38 to 0.59), nucleated cryolite (0.50–2.28), caramel cryolite (1.84–10.86), and finally chiolite (3.13–13.59). In fluorite, the REE content ranges from 108 ppm to 1708 ppm, and fluorite from the veinlet presents the lowest REE + Y contents (63.38 ppm).
The REE signatures of disseminated cryolite (I and II) are very similar to each other (Figure 30A) and to the CAG pattern [13]. Tetrad effects may be observed in the zoned and caramel cryolite (Figure 30B) as well as in chiolite (Figure 30C), especially in the first tetrad. The tetrad effects are probably related to the different complex behavior of REEs and F [62]. Disseminated and nucleated cryolites show almost constant LREE contents, increasing HREE contents, and a conspicuous negative Eu anomaly. Caramel cryolite exhibits a slight irregular decrease in LREEs related to the tetrad effect and an increase in HREEs with irregular behavior, including a positive ytterbium anomaly. Chiolite also displays a positive Yb anomaly but shows different behavior with respect to LREEs. The distinctive HREE patterns and positive Yb anomalies are probably related to tetrad effects in caramel cryolite and chiolite. Fluorite presents REE distribution patterns similar to those of the BAG, and a tetrad effect is observed, with more pronounced negative Gd and Yb anomalies in several samples of disseminated fluorite (Figure 30D).

5. Geochemical Distribution of REEs in the Albite-Enriched Granite, Pegmatites and MCD

The average and maximum values of LREE2O3, HREE2O3, and Y2O3 concentrations, as well as the LREE/(HREE + Y) and LREE/HREE ratios, in the BAG, CAG, PEG, pegmatitic CAG, and MCD are presented in Table 10. Comparing the average values among the different rocks, the following observations can be made: (1) the CAG (480 ppm LREE2O3, 360 ppm HREE) has approximately twice the values of the BAG (263.6 ppm LREE2O3, 188.6 ppm HREE2O3), whereas both show similar Y2O3 concentrations (~1330 ppm). (2) Compared to the CAG, the pegmatite veins are twice as rich in LREEs (843 ppm LREE2O3), five times as rich in HREEs (2,138 ppm HREE2O3), and twice as rich in Y (2664 ppm Y2O3). The pegmatitic CAG has an LREE concentration (318.6 ppm LREE2O3) similar to that of the CAG but is much richer in HREEs and Y (2,184 ppm HRE2O3 and 2,270.8 ppm Y2O3). The lowest values occur in the MCD (158.9 ppm LREE2O3, 42.74 ppm HREE2O3 and 51.3 ppm Y2O3).
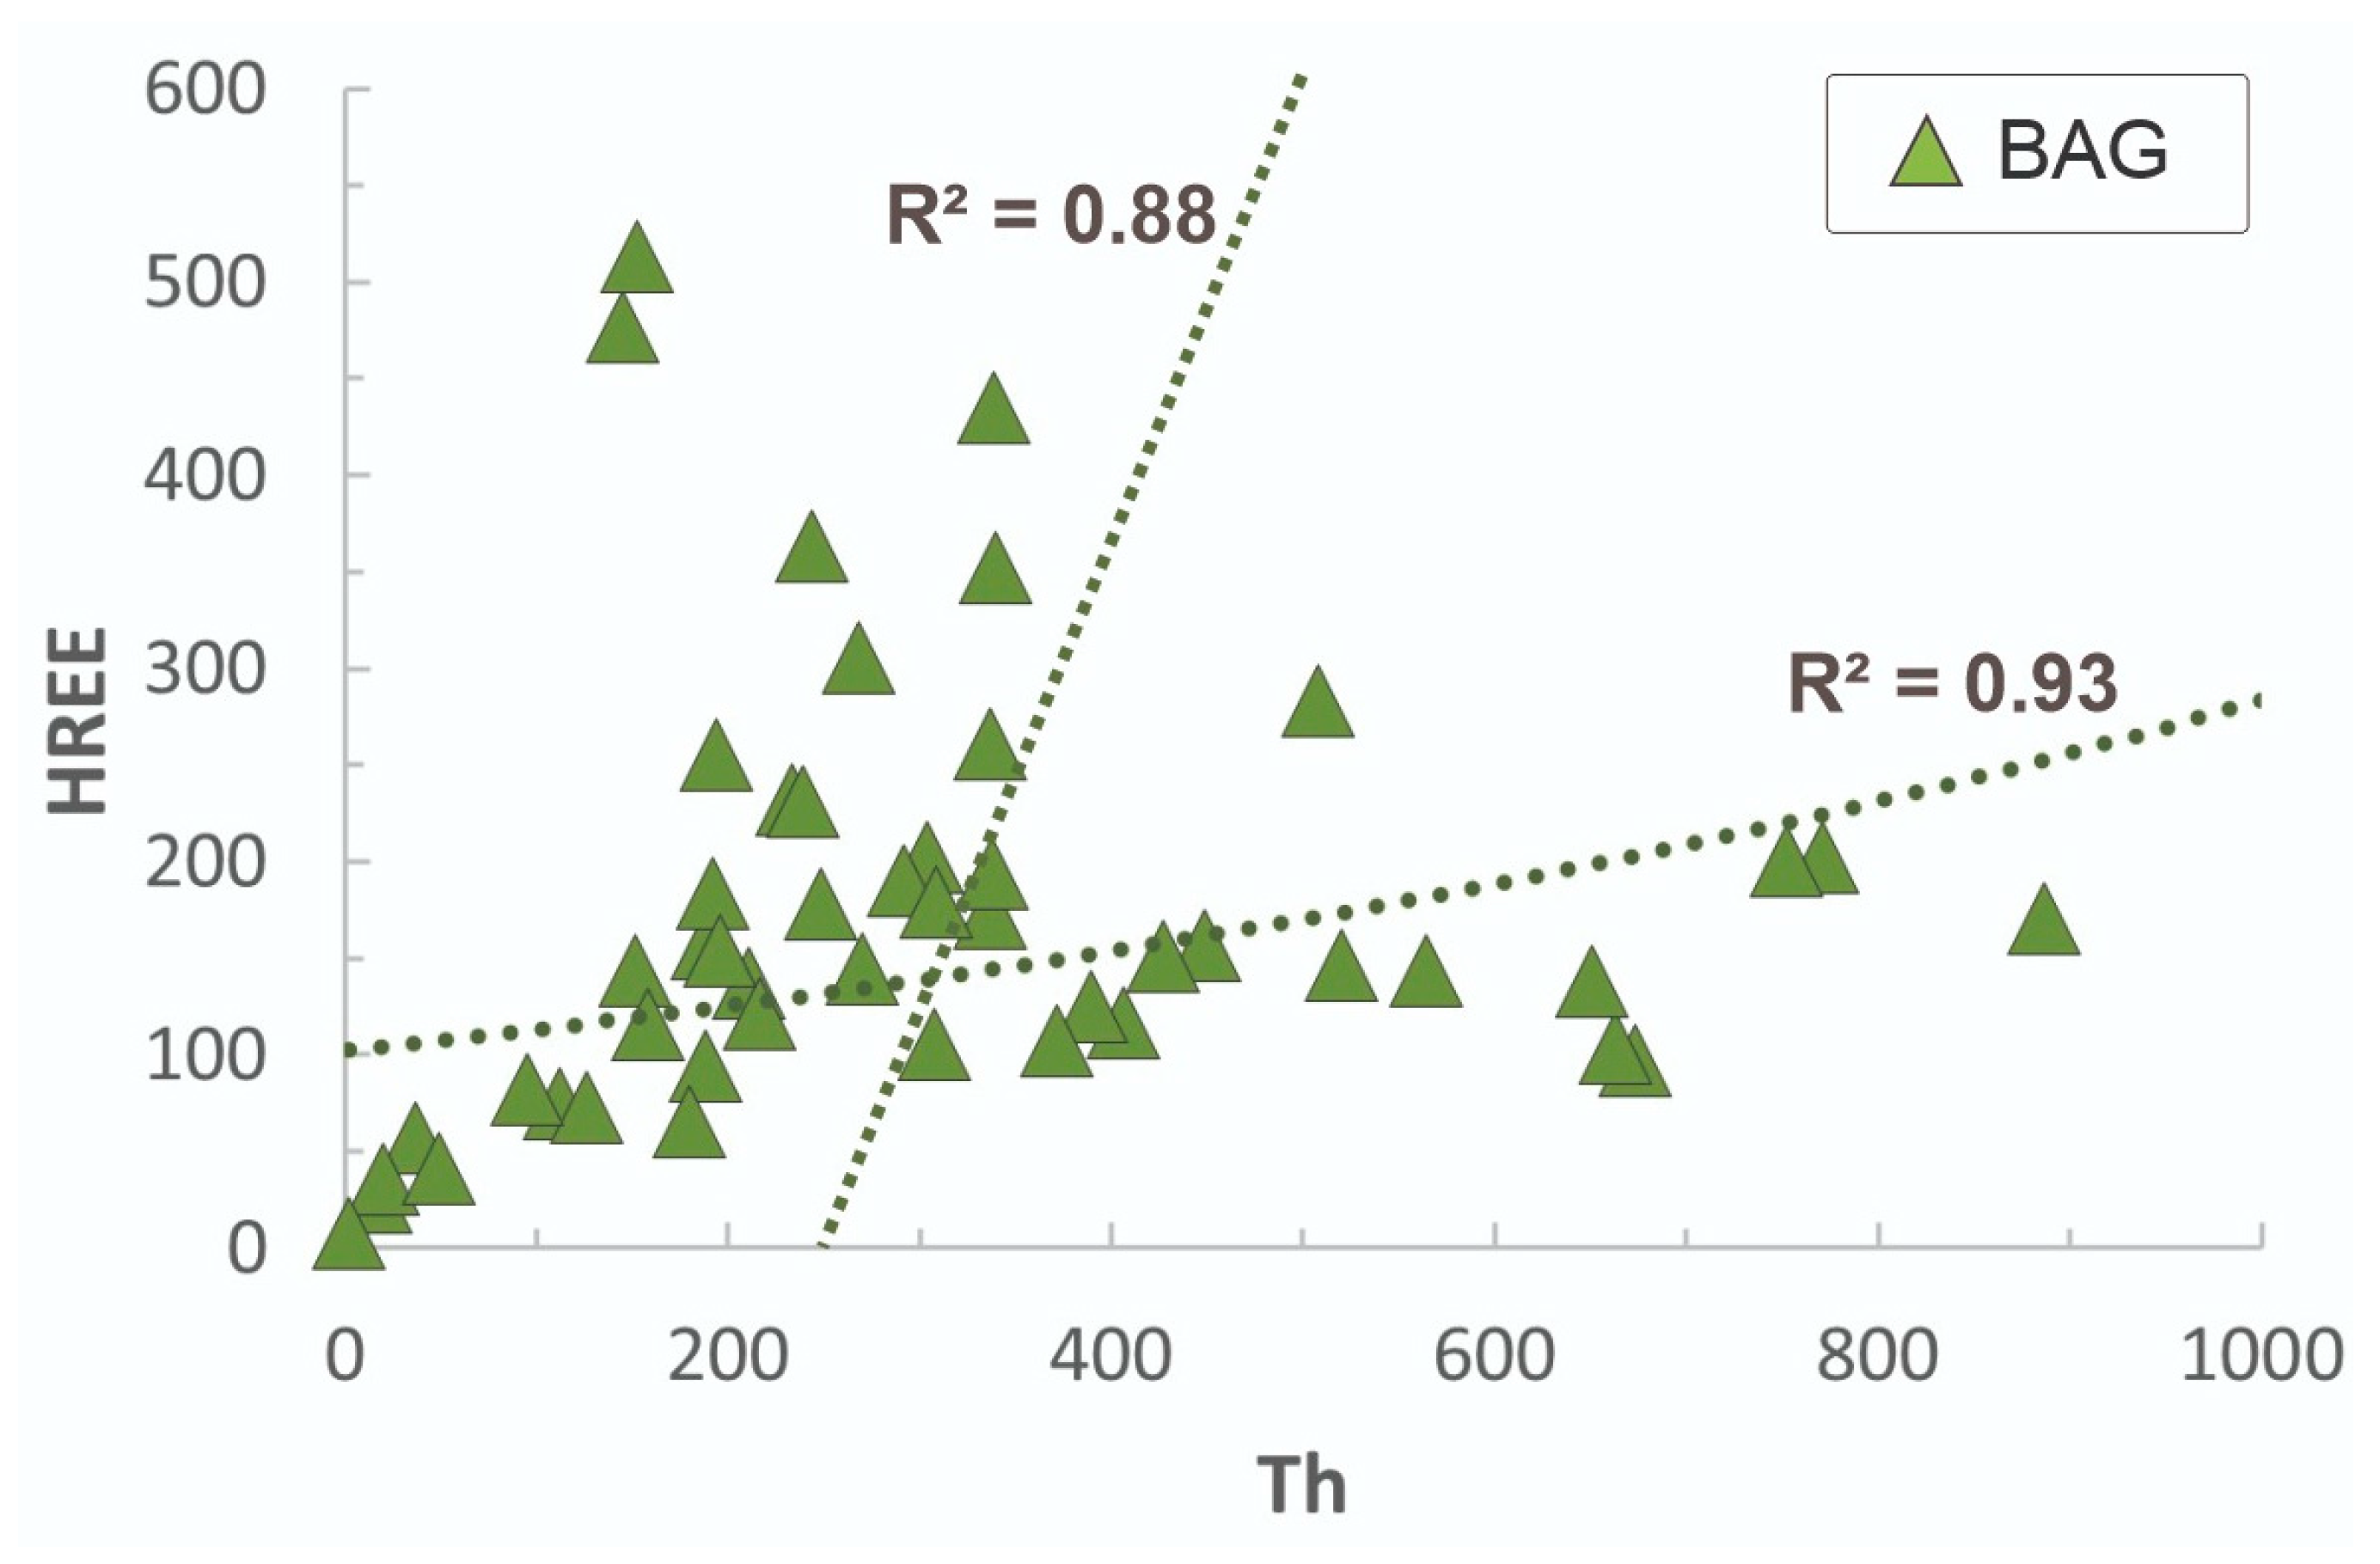
Whole-rock geochemical data confirm several observations from petrography and mineral chemistry, allowing for a more accurate identification of the main carriers of LREEs and HREEs in each rock type. An example is the BAG, where xenotime is not a common mineral, raising the question of the main HREE carrier. The correlation between Th and HREEs (Figure 31) indicates that thorite is the principal host phase.
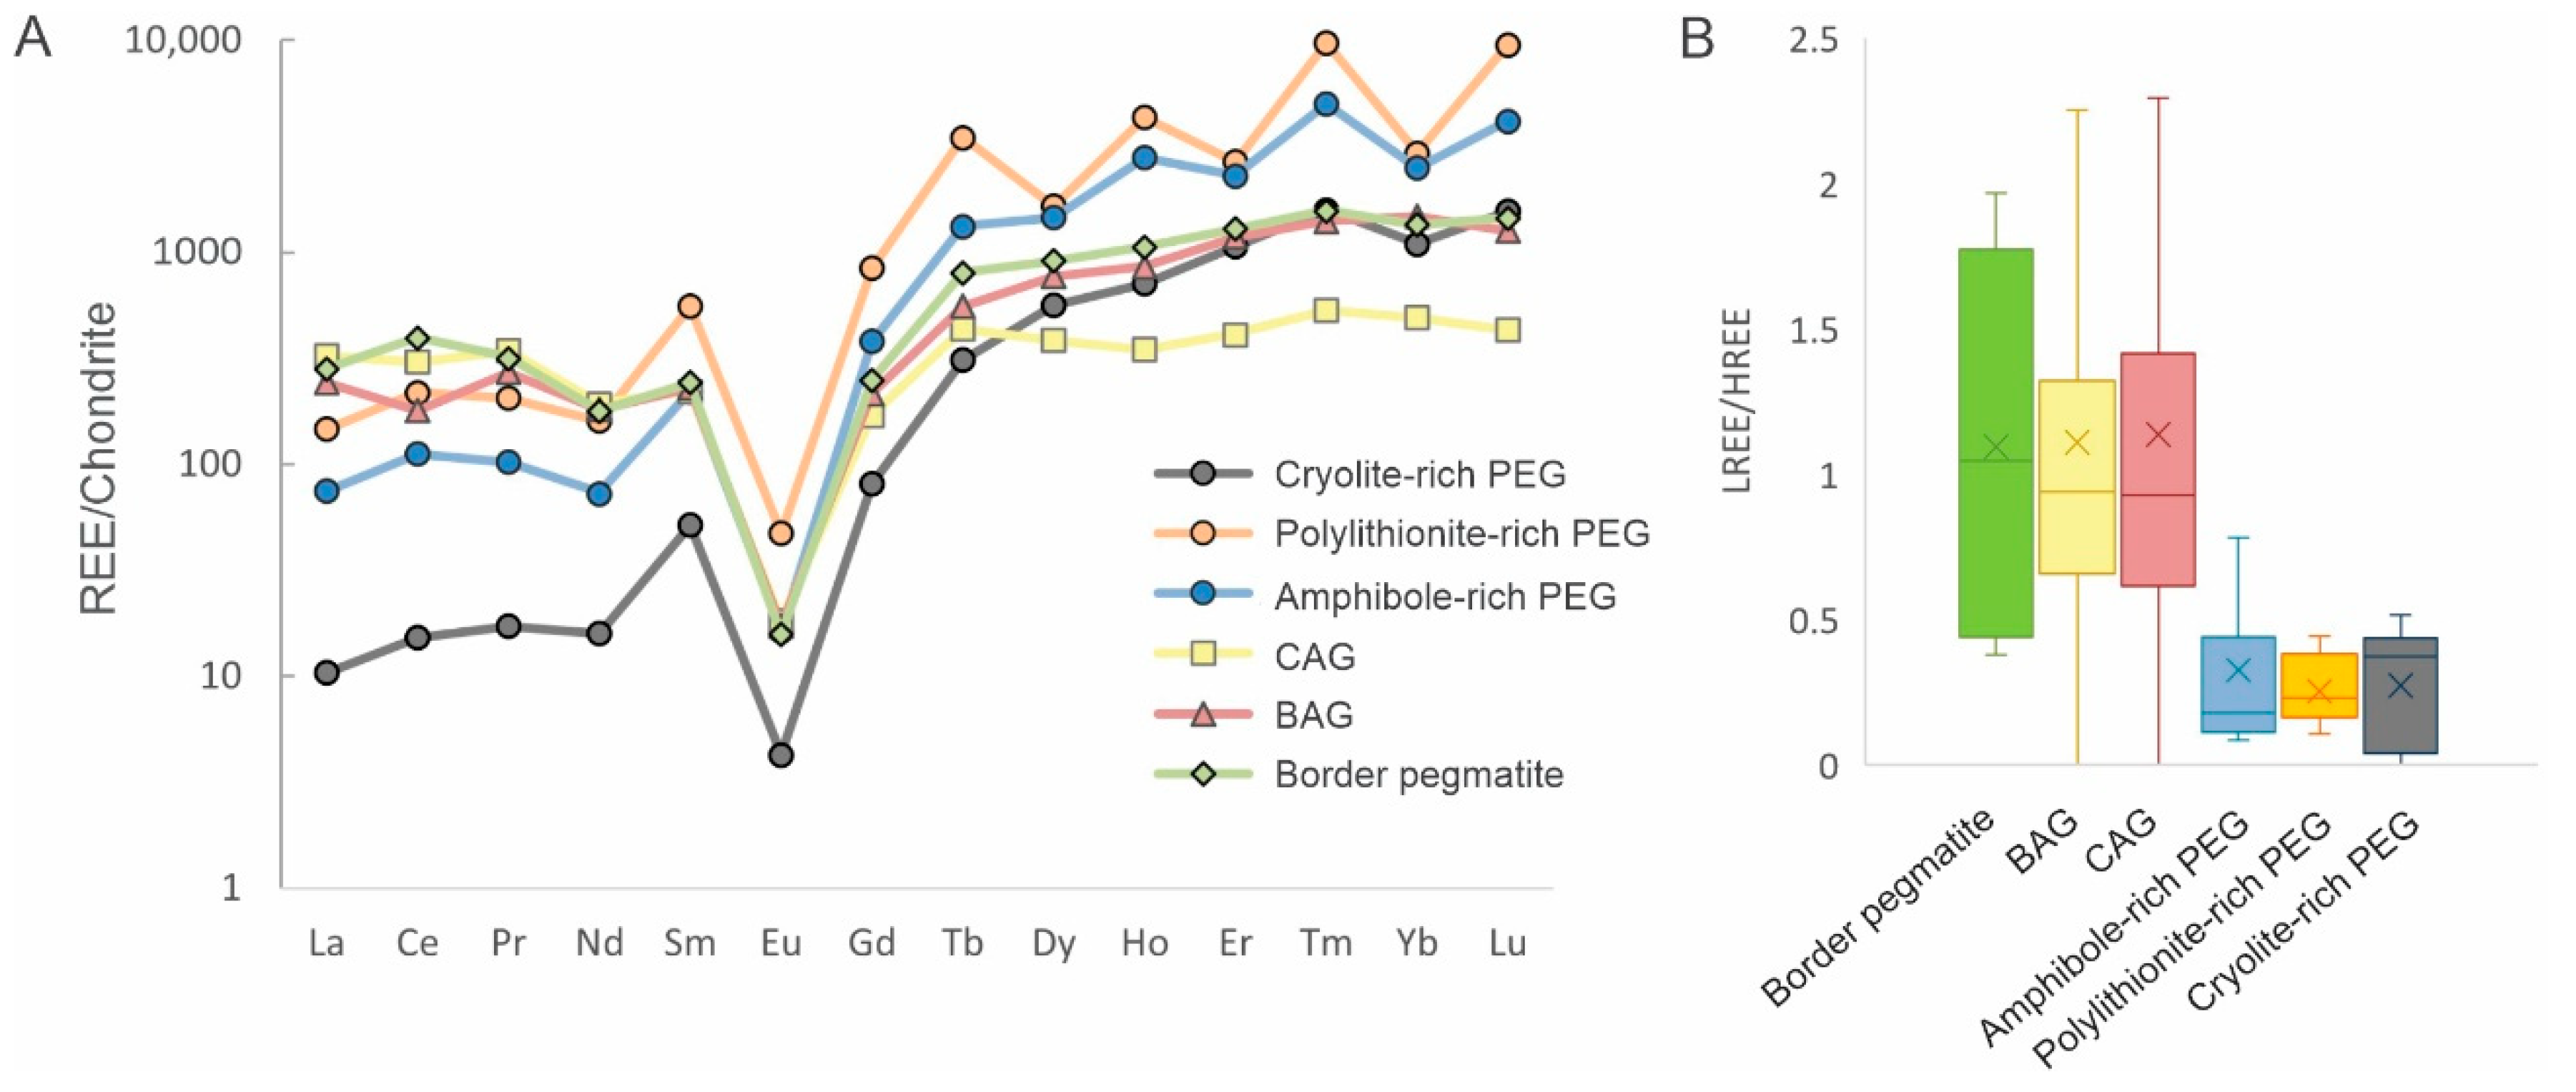
Chondrite-normalized REE patterns (Figure 32A) reveal variable degrees of fractionation across all investigated lithologies. The CAG is the least fractionated, characterized by elevated LREE contents (average 598 ppm) and comparatively low HREE concentrations (average 397 ppm). In contrast, the BAG and BPEG show broadly similar REE signatures, although the BPEG is slightly more enriched overall. Pegmatite veins (PEG) differ markedly from their host rocks, displaying lower LREE and higher HREE abundances. Within the PEG group, both LREE and HREE concentrations decrease systematically from the polylithionite-rich PEG (688 ppm LREEs, 2915 ppm HREEs) to the amphibole-rich PEG (320 ppm LREEs, 2110 ppm HREEs) and further to the cryolite-rich PEG (59 ppm LREEs, 833 ppm HREEs). The amphibole-rich and polylithionite-rich varieties exhibit a pronounced M-type tetrad effect [70]. Although absolute REE concentrations vary, the LREE/HREE ratios (Figure 32B) remain relatively consistent among the granitic subfacies and BPEG, with values of 1.13 in the CAG, 1.09 in the BAG, and 1.10 in the BPEG. By contrast, the pegmatite veins are distinctly enriched in HREEs relative to LREEs, as reflected by much lower ratios: 0.32 in the amphibole-rich PEG, 0.25 in the polylithionite-rich PEG, and 0.27 in the cryolite-rich PEG.

6. Discussion

6.1. Controls on REE Transport and Deposition

The evolution of trace elements during melt differentiation is recorded by several key minerals. For instance, progressive fractionation leads to enrichment of Li, Rb, and Cs in K-feldspar and muscovite, while Nb/Ta ratios in columbite-group minerals tend to decrease [71]. In addition, the bulk composition of the melt controls the extent to which HFSEs compete with fluxing components for incorporation into sites involving Al and alkalis [72]. In the CAG, BAG, and pegmatites studied, 28 minerals were identified, and a crystallization sequence was established for both magmatic and hydrothermal phases (Figure 3).
The enrichment of REEs to the ore-forming level requires that the parental magma initially contains sufficient REE concentrations and subsequently undergoes further enrichment during magma evolution. This process is controlled by factors such as the oxidation state of the magma, differentiation during crystallization, and enrichment in alkali elements [6,73,74]. Carbonatite and alkaline magmas may contain various volatile components, including CO2, H2O, Cl, F, and S [75,76]. As crystallization progresses, these volatiles, together with incompatible elements, become concentrated in the residual melt. They may subsequently partition into separate fluid phases, as evidenced by fluid inclusions and alkaline metasomatism [35,77].
Depending on magma composition and evolutionary stage, REE-bearing minerals may crystallize directly from the melt—such as bastnäsite at the Mountain Pass deposit—or REEs may behave as incompatible elements, remaining in the residual melt and later being transported into the fluid phase by exsolved fluids. Fluid exsolution from the melt is controlled not only by melt composition but also by variations in temperature and pressure [75]. In high-temperature and high-pressure fluids, enhanced hydrolysis of REEs may cause the dominant REE species to shift from simple hydrated ions to REE–ligand complexes [78,79]. Thus, in high-temperature magmatic systems, ligands are among most influential factors controlling REE transport, playing a critical role in REE distribution within both magmatic and hydrothermal environments.
Fluorine can form stable REE–F complexes [80,81], and most studies suggest that REE-transporting and mineralizing fluids are F-rich. The deposition of REEs in F-bearing systems has been attributed to three main processes: (1) reaction between the mineralizing fluid and Ca-rich wall rocks or fluids, leading to the precipitation of low-solubility fluorite; (2) defluorination of the ore-forming fluid, resulting in decreased F activity; and (3) destabilization of REE–F complexes [82,83,84].
Fluorine also lowers the solidus temperature and viscosity of silicate melts and enhances ionic diffusion rates [85,86,87,88]. In addition, it increases the solubility of minerals such as zircon, monazite, ilmenite, and rutile in melts and fluids [89,90,91]. This may inhibit the incorporation of REEs into these minerals and promote their enrichment in residual melts. However, recent results by Duan et al. [92] suggest that F does not directly enhance REE transport. Instead, high F contents may influence magma crystallization pathways, leading to REE enrichment followed by removal through exsolved volatile phases.

6.2. REE Minerals in the Early Magmatic Stage

In addition to monazite and allanite, which are typical LREE hosts in most granitoids, peralkaline varieties contain HREE-bearing minerals such as xenotime, fergusonite, samarskite, and gagarinite. Other important REE hosts include primary zirconosilicates (the specific mineral depending on Na and silica activity in the system) and pyrochlore. Hydrothermally modified deposits may also contain a variety of exotic silicate, fluorocarbonate, and mixed-anion phases, whose precipitation is controlled by the relative mobility of REEs in fluids of varying composition and by fluid–rock interaction [6]. According to Bea [93], the nature, composition, and associations of primary accessory minerals enriched in U, Th, REEs, and Y vary according to the Al saturation of the host rock. Peralkaline granites exhibit assemblages including arscinite, fergusonite, samarskite, bastnäsite, fluocerite, allanite, sphene, zircon, monazite, xenotime, and Th-orthosilicates. Due to their small size and low density in contrast with the melt, these accessory minerals are unlikely to settle gravitationally within the magma chamber. Instead, they crystallize early and remain suspended in the melt until they are entrapped within major rock-forming minerals.
However, the models proposed by Bea [93] and by Chakhmouradian and Zaitsev [6], do not fully apply to the Madeira deposit. During the early crystallization stages of the AEG, REEs were mainly incorporated into pyrochlore and cryolite I. Early zircon (skeletal) is rare, fluocerite occurs as an exsolution phase within gagarinite, and xenotime and thorite formed only during the late magmatic stage. The other accessory minerals mentioned above have not been described in the Madeira deposit.
The absence of fluorocarbonates in the AEG is consistent with the results of the detailed fluid inclusion studies conducted on cryolite and quartz from the MCD [35,94], which showed the total absence of CO2 in the fluid inclusions of these minerals. Ronchi et al. [94] suggested that CO2 was likely exsolved during an earlier stage of magmatic differentiation, prior to the generation of the AEG magma, due to its solubility in silicate melt being lower than that of water. This hypothesis requires further studies to be proven. The fluid inclusions study also demonstrated the hydrothermal origin of the deposit and a progressive decrease in formation temperatures from approximately 400 °C to 100 °C.
The early crystallization of pyrochlore in F-rich magmas, associated with the formation of granites containing disseminated cryolite, has been documented in the albite arfvedsonite granite of the Ririwai Complex [95]. In this setting, the preferential crystallization of pyrochlore over columbite was attributed to the high fluorine content of the system [96]. Nevertheless, early pyrochlore crystallization does not depend exclusively on extremely high F concentrations in the melt. The solubility product (Ksp) of pyrochlore is only weakly affected by fluorine contents above 1 wt.% [97]. Th/U ratios averaging 1.85 in the BAG and 3.82 in the CAG [26] indicate high U availability during the early stages of magma evolution. Furthermore, the greater stability of HREEs in F-bearing complexes [22] favored preferential incorporation of LREEs into pyrochlore.
Fluorine-bearing complexes facilitated the transport of Sn, REEs, and HFSEs throughout the melt, contributing to the disseminated distribution of ore minerals in the Madeira deposit. However, extreme F enrichment in the residual melt was limited by the buffering effect of magmatic cryolite crystallization [39]. This buffering hindered the development of highly concentrated ore zones [35]. There are currently no quantitative data on REE concentrations in cryolite or on the mechanisms responsible for their incorporation. Substitution likely occurs via Na replacement, requiring coupled substitutions or vacancy creation for charge balance—processes that cannot be evaluated based solely on REE compositional data. The high HREE contents observed in magmatic cryolite may reflect two main factors: (1) LREE sequestration by early pyrochlore crystallization and (2) the comparatively greater compatibility of HRREs for substitution into Na sites in VI coordination.

6.3. Zircon and a Fluid-Phase Exsolution

Zircon crystallization during the early magmatic stage was strongly inhibited by the high F content and elevated alkalinity of the melt. With the onset of crystallization of hydrous Na-bearing silicates, the progressive reduction in alkalinity promoted enhanced zircon crystallization, accompanied by the formation of xenotime and thorite. In acidic igneous rocks, the average Th/U ratio is approximately 5.6; however, rocks affected by intense post-magmatic alteration and element mobilization typically exhibit values below 3 [98]. Despite this, the higher zircon abundance in the BAG (5 vol.%, Th/Uavg = 2.23) compared to the CAG (2 vol.%, Th/U avg = 5.33) [22] suggests that the relative U enrichment in the zircon of the BAG is more likely related to primary magmatic crystallization rather than to post-magmatic processes. Accordingly, zircon in the CAG likely crystallized from a magma already depleted in U, Nb, Ta, and LREEs.
Zircon grains from the CAG do not display depletion in LREEs but show lower concentrations of MREEs and HREEs. Nardi et al. [22] attributes this feature to high F activity in the volatile phase exsolved from the melt that formed the CAG, leading to preferential partitioning of MREEs and HREEs into the fluid phase, as these elements form more stable complexes with F. As suggested by Kawabe [99] and Bau and Dulski [80], a fluorine-rich fluid phase would preferentially deplete the melt in REEs with higher ionization energies (i.e., HREEs and Y). This mechanism explains the decreasing Y/Ho ratios observed in zircon from the BAG and especially from the CAG. Low Sm/Nd ratios in zircon from the AEG are interpreted as the result of volatile exsolution driven by resurgent boiling, which caused Sm depletion in the melt and, consequently, in zircon crystallizing from it. Sm forms more stable complexes with F than Nd, a behavior associated with the tetrad effect as discussed by Sastri et al. [61], resulting in apparent positive Sm anomalies in chondrite-normalized REE patterns.
The marked increase in Th/U ratios in zircon from both the CAG and BAG facies is interpreted as a consequence of preferential U partitioning into the fluid phase, given that U forms more stable complexes with F than Th. Thus, zircon with high Th/U ratios likely crystallized from the melt after volatile exsolution during resurgent boiling. U, similarly to Y and HREEs, was probably retained in the fluid phase, explaining the moderate concentrations of these elements in zircon from the CAG. An additional control on U depletion in the melts was early pyrochlore crystallization.
The crystallization of zircon following volatile exsolution raises the question of whether zircon may have a hydrothermal origin or was significantly modified by hydrothermal processes [100,101,102]. However, according to Nardi et al. [22], trace element patterns of non-metamict zircon zones from the BAG and CAG are consistent with expected mineral-melt partition coefficients and display the same M-type tetrad effects observed in whole-rock patterns. This supports crystallization from silicate melts rather than hydrothermal fluids. M-type patterns exhibit the highest TE1,3 (first and third tetrad effect) values in zircon from the BAG, reflecting less intense exsolution of REE–F complexes in this facies compared to the CAG. In contrast, stronger volatile exsolution in the CAG led to greater depletion in the melt of elements forming more stable complexes (e.g., Ce-Pr relative to La-Nd), resulting in lower TE1,3 values in M-type zircon patterns from the CAG.

6.4. REE Minerals in the Late Magmatic Stage

A notable feature in the studied paragenesis is the complete absence of phosphate minerals other than xenotime. Previous studies have suggested that REE transport may be influenced by phosphate, either through the formation of phosphate complexes or in association with other ligands. However, in hydrothermal systems enriched in both fluorine and phosphorus, extensive REE transport is considered unlikely [103], suggesting that phosphorus may play a role similar to that of F in controlling REE mobility and deposition. Moreover, the extremely low solubility of REE phosphate minerals (monazite and xenotime) limits the amount of REEs that can be transported in solution [104], making it improbable that PO3−4 significantly enhances REE mobility [82]. Experimental work by Gysi et al. [105] on REE–phosphate and REE–chloride complexes showed that dissolved REE concentrations in the H3PO4 system are minimal, whereas total dissolved REE contents in HCl-bearing systems are 2–4 orders of magnitude higher under H3PO4–HCl–HF experimental conditions. Therefore, xenotime crystallization in the studied system was likely only weakly, if at all, related to the exsolved fluid phase.
During the late magmatic stage, Y, HREEs, and P became concentrated in the residual melt and were subsequently incorporated into late-disseminated xenotime in the CAG. These elements also formed large xenotime crystals in both amphibole-rich and polylithionite-rich pegmatite veins (PEG). In xenotime from the CAG, F substitutes for O, forming PO3F tetrahedra [40]. This substitution results in structural contraction, favoring the incorporation of smaller cations such as Er and Yb at the expense of Y while further hindering LREE incorporation. This interpretation is supported by the lower F contents and higher Y concentrations observed in xenotime from the polylithionite-rich PEG [31]. In the cryolite-rich PEG, HREEs were preferentially incorporated into gagarinite-(Y), whereas no primary HREE-Y-bearing phases were identified in the border pegmatites.
The onset of thorite crystallization was also delayed by the high F content of the system [26,106]. In pegmatite veins, the occurrence of unusually large primary thorite crystals, relatively enriched in HREEs and Y, indicates crystallization from a melt that had undergone further enrichment in these elements during the pegmatitic stage. In contrast, the presence of U-rich primary thorite in the border pegmatite suggests an earlier crystallization stage for this mineral [31].
During the late magmatic stage in the CAG, residual LREEs were buffered by early gagarinite-(Y). In the CAG gagarinite-(Y), fluocerite-(Ce) inclusions are interpreted as the result of exsolution of LREEs with ionic radii larger than that of Sm. This exsolution was triggered by structural contraction of the original gagarinite during cooling [41], producing an HREE-enriched, LREE-depleted host gagarinite-(Y) and an LREE-rich exsolved fluocerite-(Ce) phase. Such LREE exsolution was not observed in gagarinite-(Y) from the cryolite-rich PEG. This absence is attributed to insufficient LREE concentrations to destabilize the structure during cooling, as these crystals formed from a melt already depleted in LREEs. In contrast, gagarinite from the cryolite-rich PEG displays higher average HREE, Na, and F contents. These compositional variations indicate that gagarinite crystallized at different stages of the granite–pegmatite system, reflecting progressive enrichment of the melt in HREEs, Na, and F and the evolving REE patterns of the system [31].

6.5. F-Rich Fluid–Rock Interactions: Secondary REE Minerals

Insights into the composition and origin of the hydrothermal fluids, as well as REE remobilization processes, can be derived from the secondary minerals formed during pyrochlore alteration. This is particularly evident in the different pegmatite types, given their spatial distribution from the margins to the center of the deposit and their well-constrained position within the evolutionary system of the AEG [31]. In columbite, the average LREE/HREE ratio is lower in the northern border pegmatite (0.8) and higher in the amphibole-rich PEG (3.14). Furthermore, secondary silicate phases associated with pyrochlore alteration in the northern BPEG are enriched in HREEs and Y, whereas those in the amphibole-rich PEG display lower concentrations of these elements. Hydrothermal pyrochlore from the northern BPEG also incorporates significant HREEs and Y, in contrast to hydrothermal pyrochlore from the amphibole-rich PEG. These contrasting features indicate that the availability of HREEs and Y in the hydrothermal fluid was closely linked to the magmatic paragenesis of the host rock. In the amphibole-rich PEG, where xenotime and gagarinite-(Y) are abundant, HREEs and Y were largely sequestered during magmatic crystallization, reducing their availability in the hydrothermal fluid. Conversely, in the northern BPEG, where primary HREE- and Y-rich minerals are scarce, the hydrothermal fluid contained higher concentrations of these elements.
These observations imply that the hydrothermal fluid compositions differed between the BPEG and the PEG and that the HREEs and Y present in the hydrothermal fluids were not derived from leaching of primary HREE-Y-bearing magmatic phases. Instead, the hydrothermal fluids represent residual aqueous phases exsolved from crystallizing magma, reflecting—at a local scale—the degree of melt fractionation at the point of H2O saturation. During the early stages of magmatic evolution, in the BPEG, the relatively F-poor aqueous melt did not reach HREE-Y saturation sufficient to crystallize their own minerals (e.g., xenotime, gagarinite). As a result, HREEs and Y were preferentially concentrated in the exsolved deuteric fluids and subsequently incorporated into secondary hydrothermal phases. With progressive magmatic evolution from the BAG to the CAG, HREEs and Y became increasingly concentrated in the residual melt as F complexes. During the formation of the amphibole-rich PEG, extensive crystallization of xenotime and minor gagarinite led to depletion of HREEs and Y in the exsolved deuteric fluids. Additional evidence for the genetic link between hydrothermal fluid composition and host-rock fractionation is provided by the occurrence of Ca-enriched hydrothermal pyrochlore and fluorite in the BPEG compared to Na-enriched hydrothermal pyrochlore and cryolite in the amphibole-rich PEG. Together, these features strongly support an origin of the hydrothermal fluids as residual aqueous phases derived from the magmatic system rather than from an external source. Because the BPEGs and PEGs formed at different evolutionary stages of the AEG system, their hydrothermal alteration processes also occurred at distinct times [31].
It is important to emphasize that the compositional changes observed in hydrothermally altered pyrochlore are not merely relative enrichments due to element loss; they also involve true incorporation of new elements. Figure 33 summarizes the principal chemical exchanges during alteration. The first alteration stage involved preferential leaching of LREE (Figure 8D). In the second stage, continued LREE loss was accompanied by Nb and F depletion, while Fe and Si were incorporated. This resulted in relative enrichment of U and Pb and the formation of Fe-U-Pb-rich pyrochlore. During the third stage, Pb and Fe began to be leached, along with continued Nb and F loss, giving rise to Pb-Fe-U-rich, Fe-U-rich, and Fe-Mn-U-rich pyrochlore varieties. These latter types are the most U-enriched and are most commonly observed in the BAG and the central zone of the CAG.
At the pluton scale, the composition of disseminated cryolite II and cryolite from the MCD provides important constraints on REE distribution and mobility. Although disseminated cryolite II is hydrothermal in origin, it preserves REE distribution patterns broadly similar to those of cryolite I and host granite, albeit with significantly lower ∑REE contents and relative depletion in HREEs and Y. In turn, the cryolite varieties from the MCD (zoned and caramel cryolite) and chiolite display even lower total REE concentrations, increasing La/Lu ratios, and more pronounced tetrad effects. This systematic evolution from disseminated cryolite II to massive cryolite and chiolite reflects progressive fractionation of the hydrothermal system and changes in REE complexation behavior, controlled by F-rich fluids and melt–fluid partitioning during the magmatic–hydrothermal transition.
Instead, REEs—particularly HREEs and Y—were preferentially retained in late magmatic phases (zircon, thorite, xenotime, and gagarinite-(Y)) or redistributed into specific hydrothermal minerals according to local fluid composition. The progressive HREE depletion observed in MCD cryolite further supports the interpretation that REE distribution was controlled by the degree of melt fractionation and by the composition of locally exsolved deuteric fluids rather than by large-scale remobilization from pre-existing HREE-rich magmatic minerals. Consequently, the pluton-scale REE architecture records multiple independent magmatic–hydrothermal transitions, each imprinting a specific REE signature on cryolite, pyrochlore, and associated secondary phases.
The occurrence of hydrothermal pyrochlore dispersed within the matrix surrounding primary pyrochlore crystals indicates fluid-mediated transport of Nb, U, and Ca. According to Bollaert et al. [65], the nanometric association between waimirite-(Y) and fergusonite-(Y) suggests co-transport of Nb and REEs. Their formation in the BAG, along fluorite boundaries, together with the high F contents in waimirite-(Y), further highlights the fundamental role of F in their mobilization. High concentrations of F and Y, released from Y-bearing pyrochlore into the hydrothermal fluid, initially promoted the precipitation of waimirite-(Y), reflecting the strong complexing capacity of fluoride ligands with REEs [78]. As F was progressively consumed during waimirite-(Y) formation, Nb solubility decreased, leading to the subsequent precipitation of fergusonite-(Y). Thus, the formation of waimirite-(Y) effectively limited Nb mobility in the BAG.

6.6. The Madeira Deposit as an REE Resource

Primary igneous REE deposits can be subdivided according to magma source and evolutionary history. Chakhmouradian and Zaitev [6] recognized three main groups: carbonatites, silica-undersaturated peralkaline rocks (alkaline rocks), and highly differentiated granites. According to Dostal [107], REE deposits associated with alkaline and peralkaline rocks can be divided into three main types. The first type is hosted by nepheline syenites in large layered alkaline intrusions. Examples include Ilimaussaq (Greenland), Lovozero and Khibiny (Kola Peninsula, Russia), Thor Lake/Nechalacho (NWT, Canada), Kipawa (Canada), and Norra Kärr (Sweden). The second group comprises deposits associated with peralkaline granites, including mineralization in pegmatites (e.g., Strange Lake, Quebec–Labrador, Canada), felsic dikes (e.g., Bokan Mountain, southeastern Alaska, USA), and small highly fractionated intrusions in which REE-bearing minerals are mainly disseminated and do not exhibit cumulate textures (e.g., Khaldzan–Buregtey, western Mongolia; Ghurayyah, Saudi Arabia). The third type is related to peralkaline felsic volcanic rocks, especially trachytes containing disseminations of very fine-grained REE-bearing minerals. Examples of these relatively rare deposits include Toongi (Dubbo Zirconia) and Brockman/Hastings, both in Australia.
Host nepheline syenites, syenites, and peralkaline granites are commonly interpreted as products of extensive fractional crystallization of alkaline basaltic magmas. These parental magmas are generally considered to originate from low-degree partial melting of lithospheric mantle metasomatically enriched in HFSEs, REEs, Th, U, and halogens rather than from a primitive mantle source [107,108]. Many REE deposits occur in intracontinental, extensional, and anorogenic settings. Lithospheric thinning promotes adiabatic decompression melting of the mantle, generating alkali-rich, silica-undersaturated magmas [6]. These magmas are typically associated with rift systems and deep crustal fault zones [3,109,110], which may be reactivated episodically, producing deposits of different ages within the same province. Bastos Neto et al. [35] related the origin of the AEG and older A-type granites in the Pitinga region to this geodynamic setting.
Table 11 presents some of the world’s largest REE deposits associated with alkaline and peralkaline rocks. In these deposits, the host peralkaline magmas formed through prolonged fractional crystallization, facilitated in part by high concentrations of halogens and alkalis. These deposits typically record two main mineralization stages: (1) primary magmatic mineralization, crystallized from a melt enriched in HFSEs, REEs, Th, and U; and (2) late magmatic-to-hydrothermal overprinting by predominantly orthomagmatic fluids enriched in the same elements, which remobilized and locally enriched the primary ore, commonly through multiple metasomatic events. The REE mineralization of the Madeira deposit (Table 11) ranks among these deposits in terms of tonnage and grade. However, with respect to REE paragenesis and overall deposit structure, Madeira differs from all of them.
A distinctive feature of the Madeira deposit is that the main ore minerals (cassiterite, pyrochlore, and columbite) are evenly distributed throughout the AEG (BAG and CAG). In contrast, REE mineralization is strongly zoned: the BAG contains pyrochlore, thorite, abundant zircon, and fluorite; the major part of the CAG hosts pyrochlore, xenotime, cryolite I and II, thorite, and zircon; and the central CAG contains xenotime, gagarinite with exsolved fluocerite, pyrochlore, abundant disseminated cryolite, and a massive cryolite body. Furthermore, despite the magma being highly enriched in volatiles—particularly F—any additional input of cations through metasomatic processes was negligible. Secondary pyrochlore and thorite formed predominantly by in situ alteration of their respective primary minerals. Another notable aspect is that ore mineral formation followed a well-defined sequence, with minimal formation of compound minerals. For example, unlike most U-Th mineralizations worldwide, where these elements commonly coexist in several mineral phases, in the Madeira deposit, U is hosted primarily by early pyrochlore, whereas Th is concentrated in late thorite [26]. Similarly, LREEs are predominantly incorporated into early pyrochlore, whereas HREEs are concentrated in xenotime and other late-stage minerals. Most of these characteristics are attributed to the high F activity in the magma, which controlled mineral solubility and complex stability.
The rock unit most similar to the AEG described to date occurs in the Ririwai Kaffo Valley Ring Complex, Nigeria [117,118,119]. The albite-enriched granite is very similar to the AEG, including the presence of disseminated cryolite; however, no MCD is present, suggesting lower fluoride activity. Mineralization there is metasomatic and hosted in biotite granite that underwent extensive post-magmatic metasomatism, producing albitized, microclinized, and greisenized rocks containing late coffinite, thorite, and xenotime. In the Ghurayyah deposit [120], Saudi Arabia, rare metal mineralization is disseminated within peralkaline microgranites. The main ore minerals include uraninite, thorite, monazite, pyrochlore, samarskite, aeschinite, cassiterite, columbite–tantalite, and xenotime [121].
The Motzfeldt REE-Nb-Ta-Zr deposit (Table 11) provides an example of REE mineralization formed under exceptionally high fluorine activity. Fluorite is abundant as both a primary magmatic and later hydrothermal phase, and early pyrochlore formation represents a major REE-hosting stage. However, high carbon activity and the nature of the host rock resulted in a deposit markedly different from Madeira in terms of paragenesis (notably the presence of fluorocarbonates) and structural setting. The deposit formed in an alkali–silicate roof zone. Nb-Ta-mineralization is concentrated at the top of the magma chamber, where quartzites in the roof were digested by an HFSE-enriched, silica-undersaturated syenitic magma, locally modifying magma geochemistry and creating compositional and thermal gradients. These processes produced a complex series of cross-cutting syenite variants, including meter-scale lenses of pyrochlore microsyenite, REE-rich veins, and pegmatites in the roof zone [113,122,123].
The Bokan Mountain complex (Table 11) is a circular intrusion approximately 3 km in diameter. Similar to the AEG at Madeira, it is a concentrically zoned, with an arfvedsonite granite core and an outer zone dominated by aegirine granite. Major REE mineralization occurs in clusters of subparallel mineralized dikes and metasomatically enriched (albite-rich) alteration halos associated with shear zones. REE-bearing minerals include xenotime, fergusonite, monazite, bastnäsite, synchysite, zircon, immoriite, and kainosite. Many occur as secondary phases formed by replacement of earlier REE-bearing minerals by late-to-post-magmatic fluids [112,124]. Intense tectonic activity and high C activity account for the main differences relative to the Madeira deposit.
In the Madeira deposit, the most favorable minerals for REE extraction are xenotime-(Y), gagarinite-(Y), and associated fluocerite-(Ce), particularly xenotime due to its widespread distribution throughout the CAG (0.2–0.5 vol.% in typical CAG; up to 30 vol.% in small pegmatites) and its HREE-rich composition. Gagarinite and fluocerite occur disseminated mainly in the central CAG and in pegmatites (up to 10 vol.%). Concentrates enriched in these three minerals were obtained from pegmatite-rich CAG zones [9,125]. Ore-sorting trials [126] using dual-energy X-ray transmission sensors were successful for these minerals. However, pegmatite-rich CAG zones show irregular depth distribution, and selective mining operations have not yet been implemented. The REE potential of the pegmatitic aureole [13], a pegmatite-rich zone enveloping the upper part of the MCD, remains unexplored and may prove promising. Likewise, CAG intercalations within the MCD deserve further evaluation. In the central CAG, disseminated cryolite is particularly abundant, suggesting that this subdomain, in addition to the CAG as a whole, may represent an important target for future REE exploitation.
In the BAG, where xenotime is rare, thorite is the principal HREE-bearing mineral, followed by zircon. Although both minerals occur in the CAG and BAG, their refractory nature presents challenges for REE extraction. Nevertheless, zircon is abundant (~5 vol.% in the BAG and ~2 vol.% in the CAG), and the Madeira deposit, (CAG + BAG) ranks among the world’s largest rock-hosted thorium reserves [26]. Additionally, abundant disseminated fluorite in the BAG (~8 vol.%) contains up to 2736.78 ppm REEO + Y and should not be disregarded as a potentially relevant REE-bearing phase.
Regarding pyrochlore, which occurs in both the CAG and BAG and is currently processed for Fe-Nb-Ta alloy production, REE recovery may not be economically attractive. This reflects the predominance of LREEs—more readily available in higher concentrations in other deposits—and the additional challenges associated with U-related radioactivity. However, it is noteworthy that the silicate phase formed during hydrothermal alteration of pyrochlore effectively sequestered the released HREEs, reaching concentrations between 4.87 and 10.88 wt.% HREO.
The similarities between the studied REE mineralization and other deposits in the group of REE deposits associated with peralkaline granites are largely limited to the geodynamic context, characterized by a spatial association with rifting and deep crustal lineaments. These geodynamic environments are also linked to unconventional deposits in oceanic settings, where REE enrichment may occur in systems related to hotspots [127,128]. These geodynamic characteristics establish a link with the Canary Islands (Spain) and the volcanic islands of the Cape Verde Archipelago, where REE and rare metal mineralizations occur and unconventional terrain analysis approaches have been successfully applied in exploration [129,130]. Well-studied deposits, such as Madeira, can serve as calibration or reference areas, allowing this approach to be extended to other regions in Brazil.

7. Conclusions

The study of REE mineralization associated with the Madeira Sn-Nb-Ta-cryolite (REEs, U, Th, Zr, Li) deposit leads to the following conclusions:
(1)
REE mineralization formed during the crystallization of F-rich peralkaline magma, with no evidence of external fluid or REE input. It belongs to the group of REE deposits associated with alkaline and peralkaline magmatism in intracontinental, extensional, anorogenic settings. In terms of tonnage and grade, the deposit ranks among the major deposits of this group. However, with respect to REE paragenesis and structural configuration, it differs from all other known REE deposits.
(2)
The main characteristics of the REE mineralization are: (a) It is disseminated (except in the MCD) within the AEG and is strongly zoned: thorite (zircon + pyrochlore + fluorite) in the BAG; xenotime (cryolite + thorite + pyrochlore + zircon) in most of the CAG; and xenotime and gagarinite (cryolite + fluocerite + pyrochlore + zircon) as well as an MCD in the central CAG. (b) Thorite is the main HREE-bearing mineral in the BAG. (c) The absence of fluorocarbonates and of a second REE mineralization phase related to metasomatic processes is noteworthy.
(3)
These characteristics result from: (a) Very high F activity in the magma, without reaching extreme enrichment due to buffering by the crystallization of cryolite I. (b) Progressive crystallization from the margins toward the center, undisturbed by geochemical gradients or significant tectonic activity. (c) Negligible CO2 activity. Under consistently high F activity, decreasing temperature controlled mineral solubility, complex stability, fluid exsolution, and mineral composition.
(4)
REE mineral evolution followed a well-defined sequence, with minimal formation of compound minerals: LREE-rich pyrochlore and cryolite I in the early magmatic stage; xenotime, zircon, thorite, and gagarinite in the late magmatic stage; cryolite II, secondary pyrochlore, secondary thorite, and associated REE-bearing silicates and fluorides in the early hydrothermal stage; and cryolite and chiolite from the MCD in the late hydrothermal stage.
(5)
Most zircon crystalized after volatile exsolution from a magma already depleted in LREEs. Matrix xenotime, particularly enriched in HREEs due to formation of PFO3 tetrahedra, was only weakly, if at all, related to the exsolved fluid phase. During the late magmatic stage, residual LREEs were buffered by gagarinite-(Y), whose cooling generated fluocerite-(Ce) exsolutions.
(6)
The hydrothermal fluid represents a residual aqueous phase exsolved from the crystallizing rock, locally reflecting the degree of melt fractionation at the point of H2O saturation. As AEG crystallization progressed from the margins toward the center, hydrothermal processes and secondary REE mineral formation occurred at different stages.
(7)
Cryolite II preserves REE distribution patterns similar to those of cryolite I and the CAG but with significantly lower ∑REE contents and relative depletion in heavy REEs and Y. In contrast, the MCD cryolite varieties and chiolite exhibit even lower total REE concentrations, increased La/Lu ratios, and more pronounced tetrad effects. This trend reflects the progressive fractionation of the hydrothermal system and changes in REE complexation behavior. The MCD does not have as high REE concentrations as other minerals; however, it remains important because of its volume and the technical feasibility of REE extraction.
(8)
Widely disseminated secondary fluorite in the BAG and HREE-rich secondary silicates associated with pyrochlore and thorite alteration in both the CAG and BAG should also not be overlooked as potential REE sources.

Author Contributions

Conceptualization, A.C.B.N. and I.W.H.; methodology, V.P.P. and I.W.H.; software, I.W.H.; validation, A.C.B.N. and H.G.D.; formal analysis, I.W.H. and H.G.D.; investigation, A.C.B.N., V.P.P., and I.W.H.; data curation. I.W.H. and V.P.P.; writing—original draft preparation, A.C.B.N., I.W.H., and H.G.D.; writing—review and editing, A.C.B.N. and I.W.H.; visualization, I.W.H.; supervision, A.C.B.N. and H.G.D.; project administration, A.C.B.N. and V.P.P.; funding acquisition, A.C.B.N. All authors have read and agreed to the published version of the manuscript.

Funding

This work was supported by the Conselho Nacional de Desenvolvimento Científico e Tecnológico (CNPq).

Data Availability Statement

This work is based on 25 previous studies conducted by the UFRGS team and associates.

Acknowledgments

The authors thank the reviewers and editors for their contributions to improving the manuscript and the Mineração Taboca for supporting all of our work that has been summarized here.

Conflicts of Interest

The authors declare no conflict of interest.

References

  1. Dill, H.G. The “chessboard” classification scheme of mineral deposits: Mineralogy and geology from aluminum to zirconium. Earth Sci. Rev. 2010, 100, 1–420. [Google Scholar] [CrossRef] [Scilit]
  2. Castor, S.B. Rare Earth Deposits of North America. Resour. Geol. 2008, 58, 337–347. [Google Scholar] [CrossRef] [Scilit]
  3. Chakhmouradian, A.R.; Wall, F. Rare Earth Elements: Minerals, Mines, Magnets (and More). Elements 2012, 8, 333–340. [Google Scholar] [CrossRef] [Scilit]
  4. Hatch, G.P. Dynamics in the global market for rare earths. Elements 2012, 8, 341–346. [Google Scholar] [CrossRef] [Scilit]
  5. Formoso, M.L.; Pereira, V.P.; Menegotto, E.; Nardi, L.V.; Bastos Neto, A.C.; Lima e Cunha, M.C. Os elementos terras raras e sua importância para o setor mineral do Brasil. In Recursos Minerais no Brasil: Problemas e Desafios; Melfi, A.J., Misi, A., Campos, D.A., Cordani, U.G., Eds.; Academia Brasileira de Ciências: Rio de Janeiro, Brazil, 2016; pp. 331–363. [Google Scholar]
  6. Chakhmouradian, A.R.; Zaitsev, A.N. Rare earth mineralization in igneous rocks: Sources and processes. Elements 2012, 8, 347–353. [Google Scholar] [CrossRef] [Scilit]
  7. Kynicky, J.; Smith, M.P.; Xu, C. Diversity of rare earth deposits: The key example of China. Elements 2012, 8, 361–367. [Google Scholar] [CrossRef] [Scilit]
  8. Takehara, L. Avaliação do Potencial de Terras Raras no Brasil; CPRM: Brasília, Brazil, 2015; 218p.
  9. Garcia, M. Mina de Pitinga de Sn, Nb-Ta. Slides. 2012. Available online: http://www.adimb.com.br/simexmin2012/wp-content/themes/simexmin/palestras/06terras/VII_3_Garcia.pdf (accessed on 11 December 2025).
  10. Almeida, F.F.M.; Hasui, Y.; Brito Neves, B.B.; Fuck, R.A. Brazilian structural Provinces: An introduction. Earth Sci. Rev. 1991, 17, 1–29. [Google Scholar] [CrossRef] [Scilit]
  11. Santos, J.O.S.; Hartmann, L.A.; Gaudete, H.E.; Groves, D.I.; McNaughton, N.J.; Fletcher, L.R.A. New understanding of the Provinces of Amazon Craton based on Integration of Field Mapping and U-Pb and Sm-Nd geochronology. Gondwana Res. 2000, 3, 453–488. [Google Scholar] [CrossRef] [Scilit]
  12. Veiga, J.P.; Nunes, A.C.B.; Fernandes, A.S.; Amaral, J.E.; Pessoa, M.R.; Cruz, S.A.S. Projeto Sulfetos de Uatumã. Relatório Final; DNPM/CPRM: Manaus, Brazil, 1979.
  13. Costi, H.T. Petrologia de Granitos Alcalinos com Alto Flúor Mineralizados em Metais Raros: O Exemplo do Albita-Granito da Mina Pitinga Amazonas Brazil. Ph.D. Thesis, Universidade Federal do Pará, Belém, Brazil, 2000; 345p. [Google Scholar]
  14. Ferron, J.M.T.M.; Bastos Neto, A.C.; Lima, E.F.; Costi, H.T.; Moura, C.A.V.; Prado, M.; Galarza, M.A. Geologia e cronologia Pb-Pb de rochas graníticas e vulcânicas ácidas a intermediárias paleoproterozóicas da Província de Pitinga, Cráton Amazônico. Rev. Bras. Geociências 2006, 36, 499–512. [Google Scholar] [CrossRef] [Scilit]
  15. Pierosan, R.; Lima, E.F.; Nardi, L.V.S.; Campos, C.P.; Bastos Neto, A.C.; Ferron, J.M.T.M.; Prado, M. Paleoproterozoic (~1.88 Ga) felsic volcanism of the Iricoumé Group in the Pitinga Mining District area, Amazonian Craton, Brazil: Insights in ancient volcanic processes from field and petrological data. An. Acad. Bras. Ciências 2011, 83, 921–937. [Google Scholar] [CrossRef] [Scilit]
  16. Pierosan, R.; Lima, E.F.; Nardi, L.V.S.; Bastos Neto, A.C.; Campos, C.P.; Ferron, J.M.T.M.; Prado, M. Geochemistry of Paleoproterozoic volcanic rocks of the Iricoumé Group, Pitinga Mining District, Amazonian craton, Brazil. Int. Geol. Rev. 2011, 53, 946–976. [Google Scholar] [CrossRef] [Scilit]
  17. Simões, M.S.S.; Almeida, M.E.; Souza, A.G.H.; Silva, B.D.P.B.; Rocha, P.G. Characterization of the volcanic and hypabyssal rocks of the Paleoproterozoic Iricoumé Group in the Pitinga region and Balbina Lake area, Amazonian craton, Brazil: Petrographic distinguishing features and emplacement conditions. J. Volcanol. Geotherm. Res. 2014, 286, 138–147. [Google Scholar] [CrossRef] [Scilit]
  18. Costi, H.T.; Dall’agnol, R.; Pichavant, M.; Ramo, O.T. The peralkaline tin-mineralized Madeira cryolite albite-rich granite of Pitinga, Amazonian Craton, Brazil: Petrography, mineralogy and crystallization processes. Can. Mineral. 2009, 47, 1177–1203. [Google Scholar] [CrossRef] [Scilit]
  19. Lenharo, S.L.R.; Pollard, P.J.; Born, H. Petrology and textural evolution of granites associated with tin and rare-metals mineralization at the Pitinga mine, Amazonas, Brazil. Lithos 2003, 66, 37–61. [Google Scholar] [CrossRef] [Scilit]
  20. Bastos Neto, A.C.; Ferron, T.M.M.; Chauvet, A.; Chemale, F.; Lima, E.F.; Barbanson, L.; Costa, C.F.M. U-Pb dating of the Madeira Suite and structural control of the albite-enriched granite at Pitinga (Amazônia, Brazil): Evolution of the A-type magmatism and implications for the genesis of the Madeira Sn-Ta-Nb (REE, cryolite) world-class deposit. Precambrian Res. 2014, 243, 181–196. [Google Scholar] [CrossRef] [Scilit]
  21. Horbe, M.A.; Horbe, A.C.; Costi, H.T.; Teixeira, J.T. Geochemical characteristics of cryolite-tin-bearing granites from the Pitinga mine, northwestern Brazil—A review. J. Geochem. Explor. 1991, 40, 227–249. [Google Scholar] [CrossRef] [Scilit]
  22. Nardi, L.V.S.; Formoso, M.L.L.; Jarvis, K.; Oliveira, L.; Bastos Neto, A.C.; Fontana, E. REE, Y, Nb, U and Th contents and tetrad effect in zircon from a magmatic-hydrothermal F-rich system of Sn-rare metal-cryolite mineralized granites from the Pitinga Mine, Amazonia, Brazil. J. S. Am. Earth Sci. 2012, 33, 34–42. [Google Scholar] [CrossRef] [Scilit]
  23. Hadlich, I.W.; Bastos Neto, A.C.; Pereira, V.P.; Dill, H.G.; Botelho, N.F. The radioactive rare metal mineralization in the world-class Sn-Nb-Ta-U-Th-REE-deposit Madeira (Pitinga, Amazonas State, Brazil): With special reference to the complex alteration of pyrochlore-group minerals. Minerals 2024, 14, 895. [Google Scholar] [CrossRef] [Scilit]
  24. Horbe, M.A.; Horbe, A.C.; Teixeira, J.T.; Costi, H.T. Granito Madeira: Petrologia, petroquimica e mineralizações. In Anais do II Simpósio de Geologia da Amazônia; SBG: Belém, Brazil, 1985; Volume 3, pp. 284–320. [Google Scholar]
  25. Costi, H.T.; Dall’agnoll, R.; Moura, C.A.V. Geology and Pb-Pb Geochronology of Paleoproterozoic volcanic and granitic rocks of Pitinga province, Amazonian craton, northern Brazil. Int. Geol. Rev. 2000, 42, 832–849. [Google Scholar] [CrossRef] [Scilit]
  26. Hadlich, I.W.; Bastos Neto, A.C.; Botelho, N.F.; Pereira, V.P. The thorite mineralizations in the Madeira Sn-Nb-Ta world-class deposit (Pitinga, Brazil). Ore Geol. Rev. 2019, 105, 445–466. [Google Scholar] [CrossRef] [Scilit]
  27. Minuzzi, O.R.R.; Bastos Neto, A.C.; Pereira, V.P.; Flores, J.A.A. The massive cryolite deposit and the disseminated ore of cryolite from the Pitinga mine (Amazon, Brazil). Rev. Bras. Geociências 2006, 36, 104–123. [Google Scholar] [CrossRef] [Scilit]
  28. Bastos Neto, A.C.; Pereira, V.P.; Lima, E.F.; Ferron, J.M.; Minuzzi, O.; Prado, M.; Ronchi, L.H.; Flores, J.A.; Frantz, J.C.; Pires, A.; et al. A jazida de criolita da Mina Pititnga (Amazonas). In Caracterização de Depósitos Minerais em Distritos Mineiros da Amazônia; Marini, O.J., Queiroz, E.T., Ramos, B.W., Eds.; DNPM-CT/MINERAL-ADIMB: Brasília, Brazil, 2005; pp. 481–547. [Google Scholar]
  29. Paludo, C.M.; Bastos Neto, A.C.; Pereira, V.P.; Botelho, N.F. Mineralogia e geoquímica de pegmatitos ricos em ETR, F e metais alcalinos associados à facies albita granito no depósito de Sn-Nb-Ta-(F, ETR, U, Th) Madeira (mina Pitinga, AM, Brazil). Pesqui. Geociências 2018, 45, e0747. [Google Scholar] [CrossRef] [Scilit]
  30. Ronchi, F.C.; Althoff, F.J.; Bastos Neto, A.C.; Dill, H.G. Structural control of REE-pegmatites associated with the world-class Sn-Nb-Ta-cryolite deposit at the Pitinga mine, Amazonas, Brazil. Pesqui. Geociências 2019, 46, e0734. [Google Scholar] [CrossRef] [Scilit]
  31. Hadlich, I.W.; Bastos Neto, A.C.; Pereira, V.P.; Dill, H.G.; Botelho, N.F. The diversity of rare-metal pegmatites associated with albite-enriched granite in the world-class Madeira Sn-Nb-Ta-cryolite deposit, Amazonas, Brazil: A complex magmatic-hydrothermal transition. Minerals 2025, 15, 559. [Google Scholar] [CrossRef] [Scilit]
  32. Lengler, H.F. Pegmatitos do Albita Granito Madeira: Avaliação do Minério Para Fins de Beneficiamento. Bachelor’s Thesis, Universidade Federal do Rio Grande do Sul, Porto Alegre, Brazil, 2016; 118p. [Google Scholar]
  33. Stolnik, D. Caracterização da Xenotima na Fácies Pegmatítica do Albita Granito de Núcleo, Pitinga (AM). Bachelor’s Thesis, Universidade Federal do Rio Grande do Sul, Porto Alegre, Brazil, 2015; 67p. [Google Scholar]
  34. Dill, H.G. Pegmatites and aplites: Their genetic and applied ore geology. Ore Geol. Rev. 2015, 69, 417–561. [Google Scholar] [CrossRef] [Scilit]
  35. Bastos Neto, A.C.; Pereira, V.P.; Ronchi, L.H.; Lima, E.F.; Frantz, J.C. The world-class Sn, Nb, Ta, F (T, REE, Li) deposit and the massive cryolite associated with the albite-enriched facies of the Madeira A-type granite, Pitinga Mining District, Amazonas State, Brazil. Can. Mineral. 2009, 47, 1329–1357. [Google Scholar] [CrossRef] [Scilit]
  36. Thomas, R.; Forster, H.; Rickers, K.; Webster, J.D. Formation of extremely F-rich hydrous melt fractions and hydrothermal fluids during differentiation of highly evolved tin-granite magmas: A melt/fluid-inclusion study. Contrib. Mineral. Petrol. 2005, 148, 582–601. [Google Scholar] [CrossRef] [Scilit]
  37. Martin, R.F. A-type granites of crustal origin ultimately result from open-system fenitization-type reactions in an extensional environmental. Lithos 2006, 91, 125–136. [Google Scholar] [CrossRef] [Scilit]
  38. Lenharo, S.L.R. Evolução Magmática e Modelo Metalogenético dos Granitos Mineralizados da Região de Pitinga Amazonas Brazil. Ph.D. Thesis, Universidade de São Paulo, São Paulo, Brazil, 1998; 290p. [Google Scholar]
  39. Dolejs, D.; Baker, D.R. Liquidus equilibria in the system K2O-Na2O-Al2O3-SiO2-F2O to 100 MPa 2: Differentiation paths of fluorosilicic magmas in hydrous systems. J. Petrol. 2007, 48, 807–828. [Google Scholar] [CrossRef] [Scilit]
  40. Bastos Neto, A.C.; Pereira, V.P.; Pires, A.C.; Barbanson, L.; Chauvet, A. Fluorine-rich xenotime from the Nb-Ta-Sn Madeira world-class deposit associated with the albite-enriched granite at Pitinga, Amazonia, Brazil. Can. Mineral. 2012, 50, 1019–1032. [Google Scholar] [CrossRef] [Scilit]
  41. Pires, A.C.; Bastos Neto, A.C.; Pereira, V.P.; Botelho, N.F.; Minuzzi, O.R.R. Gagarinita-(Y) com polimorfo de fluocerita: Provável caso de formação de um novo mineral por exsolução de ETRL a partir de fluoreto de ETRLP (Mina Pitinga—AM). Rev. Bras. Geociências 2006, 36, 155–164. [Google Scholar] [CrossRef] [Scilit]
  42. Burnham, C.W. Least-Squares Refinement of Crystallographic Lattice Parameters; Harvard University: Cambridge, MA, USA, 1993. [Google Scholar]
  43. Minuzzi, O.R.R. Gênese e Evolução da Mineralização de Criolita Pirocloro e Columbita da Subfacies Albita Granito de Núcleo Mina Pitinga Amazonas Brazil. Ph.D. Thesis, Universidade Federal do Rio Grande do Sul, Porto Alegre, Brazil, 2005; 249p. [Google Scholar]
  44. Minuzzi, O.R.R.; Bastos Neto, A.C.; Formoso, M.L.L.; Andrade, S.; Janasi, V.A.; Flores, J.A. Rare Earth elements and yttrium geochemistry applied to the genetic study of cryolite ore at the Pitinga Mine (Amazon, Brazil). An. Acad. Bras. Ciências 2008, 80, 719–733. [Google Scholar] [CrossRef] [Scilit]
  45. Pires, A.C. A Gagarinita e Fases Associadas no Granito Madeira (Pitinga, Amazonas). Master’s Thesis, Universidade Federal do Rio Grande do Sul, Porto Alegre, Brazil, 2005; 122p. [Google Scholar]
  46. Pires, A.C. Xenotima Gagarinita Fluocerita e Waimirita da Mina Pitinga (AM): Mineralogia e Avaliação Preliminar do Potencial do Albita Granito Para Exploração de Elementos Terras Raras e Ítrio. Ph.D. Thesis, Universidade Federal do Rio Grande do Sul, Porto Alegre, Brazil, 2010; 201p. [Google Scholar]
  47. Anders, E.; Grevesse, N. Abundances of the elements: Meteoritic and solar. Geochim. Cosmochim. Acta 1989, 53, 197–214. [Google Scholar] [CrossRef] [Scilit]
  48. Tait, K.T.; Barkley, M.C.; Thompson, R.M.; Origlieri, S.; Evans, S.H.; Prewitt, C.T.; Yan, G.; Hexion, G. Bobdownsite, A new mineral from Big Fish River, Yukon, Canada, and its structural relationship with whitelockite-type compounds. Can. Mineral. 2011, 49, 1065–1078. [Google Scholar] [CrossRef] [Scilit]
  49. Staatz, M.H.; Adams, J.W.; Wahlberg, J.S. Brown, yellow, orange, and greenishblack thorites from the Seerie Pegmatite, Colorado. J. Res. US Geol. Surv. 1976, 4, 575–582. [Google Scholar]
  50. Boynton, W.V. Geochemistry of the rare earth elements: Meteorite studies. In Rare Earth Element Geochemistry; Henderson, P., Ed.; Elsevier: Amsterdam, The Netherlands, 1984; pp. 63–114. [Google Scholar]
  51. Forster, H.J. The chemical composition of REE-Y-Th-U-rich accessory minerals in peraluminous granites of the Erzebirge-Fichtelgebirge region, Germany. Part II—Xenotime. Am. Mineral. 1998, 83, 1302–1315. [Google Scholar] [CrossRef] [Scilit]
  52. Hinton, R.W.; Upton, B.G.J. The chemistry of zircon: Variations within and between large crystals from syenite and alkali basalt xenoliths. Geochim. Cosmochim. Acta 1991, 55, 3287–3302. [Google Scholar] [CrossRef] [Scilit]
  53. Hanchar, J.M.; Westrenen, W. Rare earth element behavior in zircon-melt systems. Elements 2007, 3, 37–42. [Google Scholar] [CrossRef] [Scilit]
  54. Mahood, G.; Hildreth, W. Large partition coefficients for trace elements in high-silica rhyolites. Geochim. Cosmochim. Acta 1983, 47, 11–30. [Google Scholar] [CrossRef] [Scilit]
  55. Fujimaki, H. Partition coefficients of Hf, Zr, and REE between zircon, apatite and liquid. Contrib. Mineral. Petrol. 1986, 94, 42–45. [Google Scholar] [CrossRef] [Scilit]
  56. Green, T.H. Experimental studies of trace element partitioning applicable to igneous petrogenesis-Sedona 16 years later. Chem. Geol. 1994, 117, 1–36. [Google Scholar] [CrossRef] [Scilit]
  57. Sano, Y.; Terada, K.; Fukuoka, T. High mass resolution ion microprobe analysis of rare earth elements in silicate glass, apatite and zircon: Lack of matrix dependency. Chem. Geol. 2002, 184, 217–230. [Google Scholar] [CrossRef] [Scilit]
  58. Thomas, J.B.; Bodnar, R.J.; Shimizu, N.; Sinha, A.K. Determination of zircon/melt trace element partition coefficients from SIMS analysis of melt inclusions in zircon. Geochim. Cosmochim. Acta 2002, 66, 2887–2901. [Google Scholar] [CrossRef] [Scilit]
  59. Hoskin, P.W.O. Trace-element composition of hydrothermal zircon and the alteration of Hadean zircon from the Jack Hills, Australia. Geochim. Cosmochim. Acta 2005, 69, 637–648. [Google Scholar] [CrossRef] [Scilit]
  60. Sun, S.S.; McDonough, W.F. Chemical and Isotopic Systematics of Oceanic Basalts: Implications for Mantle Composition and Processes. In Magmatism in the Ocean Basins; Saunders, A.D., Norry, M.J., Eds.; Geological Society Special Publications: London, UK, 1989; Volume 42, pp. 313–345. [Google Scholar]
  61. Sastri, V.S.; Bünzli, J.C.; Perumareddi, J.R.; Rao, V.R.; Rayudu, G.V.S. Modern Aspects of Rare Earths and Their Complexes; Elsevier: Amsterdam, The Netherlands, 2003. [Google Scholar]
  62. Costi, H.T.; Borges, R.M.; Dall’Agnol, R. Depósitos de estanho da mina Pitinga, estado do Amazonas. In Caracterização de Depósitos Minerais em Distritos Mineiros da Amazônia; Marini, O.J., Queiroz, E.T., Ramos, B.W., Eds.; DNPM-CT/MINERAL-ADIMB: Brasília, Brazil, 2005; pp. 391–475. [Google Scholar]
  63. Irber, W. The lanthanide tetrad effect and its correlation with K/Rb, Eu/Eu*, Sr/Eu, Y/Ho, and Zr/Hf of evolving peraluminous granite suites. Geochim. Cosmochim. Acta 1999, 63, 489–508. [Google Scholar] [CrossRef] [Scilit]
  64. Weksler, I.V.; Dorfman, A.M.; Kamenetsky, M.; Dulski, P.; Dingwell, D.B. Partitioning of lanthanides and Y between immiscible silicate and fluoride melts, fluorite and cryolite and the origin of the lanthanide tetrad effect in igneous rocks. Geochim. Cosmochim. Acta 2005, 69, 2847–2860. [Google Scholar] [CrossRef] [Scilit]
  65. Bollaert, Q.; Chassé, M.; Bastos Neto, A.C.; Horbe, A.; Allard, T.; Menguy, N.; Le Guillou, C.; Courtin, A.; Quantin, C.; Vantelon, D.; et al. Hydrothermal niobium (Nb) mineralization and mobilization in the world-class Madeira Sn-Nb-Ta granitic deposit (Amazonas, Brazil). Ore Geol. Rev. 2024, 174, 106321. [Google Scholar] [CrossRef] [Scilit]
  66. Paulino, J.F.; Neumann, R.; Afonso, J.C. Production of sodium and aluminum chemicals and recovery of rare earth elements after leaching cryolite from Pitinga mine (Amazonas—Brazil) with sulfuric acid. Hydrometallurgy 2018, 180, 254–261. [Google Scholar] [CrossRef] [Scilit]
  67. Atencio, D.; Bastos Neto, A.C.; Pereira, V.P. Quiolita e Thomsenolita na mina Pitinga, Presidente Figueiredo, Amazonas. In Proceedings of the 49º Congresso Brazileiro de Geologia, Rio de Janeiro; SBG: São Paulo, Brazil, 2018. [Google Scholar]
  68. Atencio, D.; Bastos Nero, A.C.; Pereira, V.P.; Ferron, J.T.M.M.; Hoshino, M.; Moriyama, T.; Watanabe, Y.; Miyawaki, R.; Coutinho, J.M.V.; Andrade, M.B.; et al. Waimirite-(Y), orthorhomic YF3, a new mineral from the Pitinga mine, Presidente Figueiredo, Amazonas, Brazil and from Jabal Tawlah, Saudi Arabia: Description and crystal structure. Mineral. Mag. 2015, 79, 767–780. [Google Scholar] [CrossRef] [Scilit]
  69. Evensen, N.H.; Hamilton, P.J.; O’Nions, R.K. Rare earth abundances in chondrite meteorites. Geochim. Cosmochim. Acta 1978, 42, 1199–1212. [Google Scholar] [CrossRef] [Scilit]
  70. Masuda, A.; Kawakami, O.; Dohmoto, Y.; Takenaka, T. Lanthanite tetrad effects in nature: Two mutually opposite types, W and M. Geochem. J. 1987, 21, 119–124. [Google Scholar] [CrossRef] [Scilit]
  71. Černý, P. Exploration strategy and methods for pegmatite deposits of tantalum. In Lanthanides, Tantalum and Niobium; Möller, P., Černý, P., Saupé, F., Eds.; Springer: Heidelberg, Germany, 1989; pp. 274–310. [Google Scholar]
  72. Van Lichtervelde, M.; Holtz, F.; Hanchar, J.M. Solubility of manganotantalite, zircon and hafnon in highly fluxed peralkaline to peraluminous pegmatitic melts. Contrib. Mineral. Petrol. 2010, 160, 17–32. [Google Scholar] [CrossRef] [Scilit]
  73. Watanabe, Y.; Kon, Y.; Echigo, T.; Kamei, A. Differential fractionation of rare earth elements in oxidized and reduced granitic rocks: Implication for heavy rare earth enriched ion adsorption mineralization. Resour. Geol. 2017, 67, 35–52. [Google Scholar] [CrossRef] [Scilit]
  74. Bernard, C.; Estrade, G.; Salvi, S.; Béziat, D.; Smith, M. Alkali pyroxenes and amphiboles: A window on rare Earth elements and other high field strength elements behaviour through the magmatic-hydrothermal transition of peralkaline granitic systems. Contrib. Mineral. Petrol. 2020, 175, 81. [Google Scholar] [CrossRef] [Scilit]
  75. Verplanck, P.L. The role of fluids in the formation of rare earth element deposits. Procedia Earth Planet. Sci. 2017, 17, 758–761. [Google Scholar] [CrossRef] [Scilit]
  76. Anenburg, M.; Broom-Fendley, S.; Chen, W. Formation of rare earth deposits in carbonatites. Elements 2021, 17, 327–332. [Google Scholar] [CrossRef] [Scilit]
  77. Song, W.; Xu, C.; Smith, M.P.; Chakhmouradian, A.R.; Brenna, M.; Kynicky, J.; Tang, H. Genesis of the world’s largest rare earth element deposit, Bayan Obo, China: Protracted mineralization evolution over ~1 by. Geology 2018, 46, 323–326. [Google Scholar] [CrossRef] [Scilit]
  78. Migdisov, A.; Wiliams-Jones, A.E.; Brugger, J.; Caporuscio, F.A. Hydrothermal transport, deposition, and fractionation of the REE: Experimental data and thermodynamic calculations. Chem. Geol. 2016, 439, 13–42. [Google Scholar] [CrossRef] [Scilit]
  79. Brugger, J.; Liu, W.; Etschmann, B.; Mei, Y.; Sherman, D.M.; Testemale, D. A review of the coordination chemistry of hydrothermal systems, or do coordination changes make ore deposits? Chem. Geol. 2016, 447, 219–253. [Google Scholar] [CrossRef] [Scilit]
  80. Bau, M.; Dulski, P. Comparative study of yttrium and rare-earth element behaviours in fluorine-rich hydrothermal fluids. Contrib. Mineral. Petrol. 1995, 119, 213–223. [Google Scholar] [CrossRef]
  81. Petrella, L.; Williams-Jones, A.E.; Goutier, J.; Walsh, J. The nature and origin of the rare earth element mineralization in the Misery syenitic intrusion, northern Quebec, Canada. Econ. Geol. 2014, 109, 1643–1666. [Google Scholar] [CrossRef] [Scilit]
  82. She, H.D.; Fan, H.R.; Hu, F.F. Migration and precipitation of rare earth elements in the hydrothermal fluids. Acta Petrol. Sin. 2018, 34, 3567–3581. [Google Scholar]
  83. Deng, X.H.; Chen, Y.J.; Yao, J.; Bagas, L.; Tang, H.S. Fluorite REE-Y (REY) geochemistry of the ca. 850 Ma Tumen molybdenite-fluorite deposit, eastern Qingling, China: Constraints on ore genesis. Ore. Geol. Rev. 2014, 63, 532–543. [Google Scholar] [CrossRef] [Scilit]
  84. Xu, C.; Kynicky, J.; Chakhmouradian, A.R.; Campbell, I.H.; Allen, C.M. Trace-element modelling of the magmatic evolution of rare-earth-rich carbonatite from the Miaoya deposit, Central China. Lithos 2010, 118, 145–155. [Google Scholar] [CrossRef] [Scilit]
  85. Jiang, Z.H.; Ding, X.; Song, M.S.; Ling, M.X. Thermodiffusion of major and trace elements in dried aluminosilicate glass. Ceram. Int. 2022, 48, 28404–28412. [Google Scholar] [CrossRef] [Scilit]
  86. Manning, D.A.C. The effect of fluorine on liquidus phase relationships in the system Qz-Ab-Or eith excess water at 1 kb. Contrib. Mineral. Petrol. 1981, 76, 203–215. [Google Scholar] [CrossRef] [Scilit]
  87. Dingwell, D.B.; Scarfe, C.M.; Cronin, D.J. The effect of fluorine on viscosities in the system Na2O-Al2O3-SiO2: Implications for phonolites, trachytes an rhyolites. Am. Miner. 1985, 70, 80–87. [Google Scholar]
  88. Giordano, D.; Romano, C.; Dingwell, D.B.; Poe, B.; Behrens, H. The combined effects of water and fluorine on the viscosity of silic magmas. Geochim. Cosmochim. Acta 2004, 68, 5159–5168. [Google Scholar] [CrossRef] [Scilit]
  89. Shao, T.B.; Xia, Y.; Ding, X.; Cai, Y.F.; Song, M.S. Zircon saturation model in silicate melts: A review and update. Acta Geochim. 2020, 39, 387–403. [Google Scholar] [CrossRef] [Scilit]
  90. Yan, H.B.; He, J.J.; Liu, X.W.; Wang, H.B.; Liu, J.F.; Ding, X. Thermodynamic investigation of the hydrolysis behaviour of fluorozirconate complexes at 423.15-773.15 K and 100 MPa. J. Sout. Chem. 2020, 49, 836–848. [Google Scholar]
  91. Rapp, J.F.; Kleme, S.; Butler, I.B.; Harley, S.L. Extremely high solubility of rutile in chloride and fluoride-bearing metamorphic fluids: An experimental investigation. Geology 2010, 38, 323–326. [Google Scholar] [CrossRef] [Scilit]
  92. Duan, D.; Jiang, S.Y. Significant mobilization of REE from calc-calkaline melt into fluid during fluids exsolution: Insights from magmatic amphibole composition from Tieshan skarn Fe-Cu deposit (Hubei Province, China). Ore Geol. Rev. 2023, 163, 105759. [Google Scholar] [CrossRef] [Scilit]
  93. Bea, F. Residence of REE, Y, Th and U in granites and crustal protoliths: Implications for the chemistry of crustal melts. J. Petrol. 1996, 37, 521–552. [Google Scholar] [CrossRef] [Scilit]
  94. Ronchi, L.H.; Bastos Neto, A.C.; Gedoz, S.C.; Weber, M.L.; Pereira, V.P.; Andrek, M. A transição magmático-hidrotermal registrada por inclusões fluidas no albita-granito de núcleo, Mina Pitinga, Amazonas. In Contribuições à Metalogenia do Brazil; Frantz, J.C., Charão, J.M., Jost, H., Eds.; CPRM-UFRGS: Porto Alegre, Brazil, 2011; Chapter 10. [Google Scholar]
  95. Ogunleye, P.O.; Garba, I.; Ike, E.C. Factors contributing to enrichment and crystallization of niobium in pyrochlore in the Kaffo albite arfvedsonite granite, Ririwai Complex, Younger Granites province of Nigeria. J. Afr. Earth Sci. 2006, 44, 372–382. [Google Scholar] [CrossRef] [Scilit]
  96. Linnen, R.L.; Keppler, H. Columbite solubility in granitic melts: Consequences for the enrichment and fractionation of Nb and Ta in the Earth’s crust. Contrib. Mineral. Petrol. 1997, 128, 213–227. [Google Scholar] [CrossRef] [Scilit]
  97. Tang, N.; Gritsenko, Y.; Kimura, K.; Bhattacharjee, S.; Sakai, A.; Fu, M.; Takeda, H.; Man, H.; Sugawara, K.; Matsumoto, Y.; et al. Spin-orbital liquid state and liquid-gas metamagnetic transition on a pyrochlore lattice. Nat. Phys. 2022, 19, 92–98. [Google Scholar] [CrossRef] [Scilit]
  98. Killeen, P.G. Gamma ray spectrometric methods in uranium explorations: Application interpretation. In Geochemistry in the Search for Metallic Ores; Economic Geology; Hood, P.J., Ed.; Geological Survey of Canada: Ottawa, ON, Canada, 1979; Volume 31, pp. 163–229. [Google Scholar]
  99. Kawabe, I. Tetrad effects and fine structures of REE abundance patterns of granitic and rhyolitic rocks: ICPeAES determinations of REE and Y in eight GSJ reference rocks. Geochem. J. 1995, 29, 213–230. [Google Scholar] [CrossRef] [Scilit]
  100. Rayner, N.; Stern, R.A.; Carr, S.D. Grain-scale variations in trace element composition of fluid e altered zircon, Acasta Gneiss Complex, northwestern Canada. Contrib. Mineral. Petrol. 2005, 148, 721–734. [Google Scholar] [CrossRef] [Scilit]
  101. Poitrasson, F.; Hanchar, J.M.; Schaltegger, U. The current state and future of accessory mineral research. Chem. Geol. 2002, 191, 3–24. [Google Scholar] [CrossRef] [Scilit]
  102. Schaltegger, U. Hydrothermal zircon. Elements 2007, 3, 51–79. [Google Scholar] [CrossRef] [Scilit]
  103. Anenburg, M.; Mavrogenes, J.A. Carbonatitic versus hydrothermal origin for fluorapatite REE-Th deposits: Experimental study of REE transport and crustal “antiskarn” metasomatism. Am. J. Sci. 2018, 318, 335–366. [Google Scholar] [CrossRef] [Scilit]
  104. Sheard, E.R.; Williams-Jones, A.E.; Heoligmann, M.; Pederson, C.; Trueman, D.L. Controls on the concentration of zirconium, niobium, and the rare earth elements in the Thor Lake Rare metal deposit, Northwest Territories, Canada. Econ. Geol. 2012, 107, 81–104. [Google Scholar] [CrossRef] [Scilit]
  105. Gysi, A.P.; Williams-Jones, A.E.; Harlov, D. The solubility of xenotime-(Y) and other HREE phosphates (DyPO4, ErPO4 and YbPO4) in aqueous solutions from 100 to 250 °C and psat. Chem. Geol. 2015, 401, 83–95. [Google Scholar] [CrossRef] [Scilit]
  106. Cuney, M.; Kyser, K. Recent and Not-so-Recent Developments in Uranium Deposits and Implications for Exploration. Short Course Series; Mineralogical Association of Canada: Quebec, QC, Canada, 2008; Volume 39, p. 257.
  107. Dostal, J. Rare earth element deposits of alkaline igneous rocks. Resources 2017, 6, 34. [Google Scholar] [CrossRef] [Scilit]
  108. Pilet, S.; Baker, M.B.; Stolper, E.M. Metasomatized lithosphere and the origin of alkaline lavas. Science 2008, 320, 916–919. [Google Scholar] [CrossRef] [Scilit] [PubMed]
  109. Bell, K.; Kjarsgaard, B.A.; Simonetti, A. Carbonatites—Into the twenty-first century. J. Petrol. 1999, 39, 1839–1845. [Google Scholar] [CrossRef]
  110. Verplanck, P.L.; Van Gosen, B.S. Carbonatite and Alkaline Intrusion-related Rare Earth Element Deposits: A Deposit Model; US Geological Survey; US Department of the Interior: Washington, DC, USA, 2011.
  111. Teixeira, L.M.; Botelho, N.F. Comportamento geoquímico de ETR durante evolução magmática e alteração hidrotermal de granitos: Exemplos da Província Estanífera de Goiás. Rev. Bras. Geociências 2006, 36, 679–691. [Google Scholar] [CrossRef] [Scilit]
  112. Dostal, J.; Kontak, D.J.; Karl, S.M. The Early Jurassic Bokan Mountain peralkaline granitic complex (southeastern Alaska): Geochemistry, petrogenesis and rare-metal mineralization. Lithos 2014, 202–203, 395–412. [Google Scholar] [CrossRef] [Scilit]
  113. Rooks, C.J.W.; Finch, A.A.; Hutchison, W.; Herd, D.A.; Frangeskides, G. Rare earth and niobium mobility at the magmatic-hydrothermal transition: Motzfeldt Sø Centre, Greenland. Ore Geol. Rev. 2026, 188, 107009. [Google Scholar] [CrossRef] [Scilit]
  114. Ucore Rare Metals Inc. Preliminary Economic Assessment—Bokan Mountain Rare Element Project. Tetra Tech. 10 January 2013. Available online: https://ucore.com/PEA.pdf (accessed on 13 October 2025).
  115. Elemental Rare Metals Ltd. Operations Motzfeldt. Available online: https://elementalraremetals.com/new-page (accessed on 13 October 2025).
  116. Avalon Rare Metals Inc. Technical Report Disclosing the Results of the Feasibility Study on the Nechalacho Rare Earth Elements Project. Micon International Limited. 31 May 2013. Available online: https://avalonadvancedmaterials.com/wp-content/uploads/2024/07/Nechalacho-Feasibility-may_2013_ni43_report.pdf (accessed on 13 October 2025).
  117. Pointer, C.M.; Ashworth, J.R.; Ixer, R.A. The zircon-thorite mineral group in metasomatized granite, Ririwai, Nigeria 1: Geochemistry and metastable solid solution of thorite and coffinite. Mineral. Petrol. 1988, 38, 245–262. [Google Scholar] [CrossRef] [Scilit]
  118. Pointer, C.M.; Ashworth, J.R.; Ixer, R.A. The zircon-thorite mineral group in metasomatized granite, Ririwai, Nigeria 2: Zoning, alteration and exsolutions in zircon. Mineral. Petrol. 1988, 39, 21–37. [Google Scholar] [CrossRef] [Scilit]
  119. Bowden, P.; Kinnaird, J.A. Geology and mineralization of the Nigerian Anorogenic Ring Complexes. Geol. Jahrb. 1984, 56, 3–56. [Google Scholar]
  120. Drysdall, A.R.; Jackson, J.; Ramsay, C.R.; Douch, C.J.; Hackett, D. Rare element mineralization related to Precambrian alkali granites in the Arabian Shield. Econ. Geol. 1984, 79, 1366–1377. [Google Scholar] [CrossRef] [Scilit]
  121. Lalande, P.G. Final Report on Preliminary Geological and Geophysical Investigations on the Ghurayyah Radioactive Granite, Kingdom of Saudi Arabia; Mineral Resources Open-File Report; Directorate General: Riyadh, Saudi Arabia, 1977; p. 3.
  122. Finch, A.A.; McCreath, J.A.; Reekie, C.D.J.; Hutchison, W.; Ismaila, A.; Armour-Brown, A.; Andersen, T.; Simonsen, S.L. From Mantle to Motzfeldt: A genetic model for syenite-hosted Ta,Nb-mineralisation. Ore Geol. Rev. 2019, 107, 402–416. [Google Scholar] [CrossRef] [Scilit]
  123. Beard, C.D.; Goodenough, K.M.; Borst, A.M.; Wall, F.; Siegfried, P.R.; Deady, E.A.; Pohl, C.; Hutchison, W.; Finch, A.A.; Walter, B.F.; et al. Alkaline-silicate REE-HFSE systems. Econ. Geol. 2023, 118, 177–208. [Google Scholar] [CrossRef] [Scilit]
  124. Dostal, J.; Karl, S.M.; Keppie, J.D.; Kontak, D.J.; Shellnutt, J.G. Bokan Mountain peralkaline granitic complex, Alexander terrane (southeastern Alaska): Evidence for Early Jurassic rifting prior to accretion with North America. Can. J. Earth Sci. 2013, 50, 678–691. [Google Scholar] [CrossRef] [Scilit]
  125. Neumann, R.; Barreto, J.C.G. Caracterização Mineralógica de Pré-Concentrado de Minerais de Elementos Terras Raras; Centro de Tecnologia Mineral, CETEM: Rio de Janeiro, Brazil, 2012; 34p.
  126. Veras, M.M.; Young, A.S.; Born, C.R.; Szewczuk, A.; Bastos Neto, A.C.; Petter, C.O.; Sampaio, C.H. Affinity of duals energy X-ray transmission sensors on minerals bearing heavy rare earth elements. Miner. Eng. 2020, 147, 106151. [Google Scholar] [CrossRef] [Scilit]
  127. Dill, H.G.; Buzatu, A.; Balaban, S.-I.; Rüsenberg, K.A. A mineralogical-geomorphological terrain analysis of hotspot volcanic islands -The missing link between carbonatite- and pegmatite Nb-F-Zr-Li-Be-bearing REE deposits and new tools for their exploration (Canary Islands Archipelago, Spain). Ore Geol. Rev. 2023, 163, 105702. [Google Scholar] [CrossRef] [Scilit]
  128. Dill, H.G.; Rüsenberg, K.A. Marker minerals in volcanics and xenoliths—An approach to categorize the inferred magmatic rocks underneath the present-day volcanic landscape of Tenerife, Spain (NW African Rare Mineral Province). Minerals 2023, 13, 1410. [Google Scholar] [CrossRef] [Scilit]
  129. Dill, H.G. An overview of the pegmatitic landscape from the pole to the equator—Applied geomorphology and ore guides. Ore Geol. Rev. 2017, 91, 795–823. [Google Scholar] [CrossRef] [Scilit]
  130. Dill, H.G.; Buzatu, A.; Balaban, S.-I.; Schmitt, D.; Heimhofer, U.; Techmer, A. Numerical terrain analysis of fluvial-marine watersheds on the Isle of Santiago, Cape Verde, based on satellite imagery, ground-truthing and landform indices—A preparatory study in search of Nb-Ta-REE deposits related to hotspot islands. J. Afr. Earth Sci. 2025, 227, 105548. [Google Scholar] [CrossRef] [Scilit]
Figure 1. (a) Location map. (b) Geological map of the Madeira granite (modified from [13]).
Minerals 16 00417 g001
Figure 3. Paragenetic evolution in the CAG, BAG, and associated pegmatites. Arrows indicate the precursor minerals involved in the main replacement reactions.
Minerals 16 00417 g003
Figure 4. Photomicrographs and SEM images of xenotime-(Y) from the albite-enriched granite and associated pegmatites. (A) Typical xenotime from the CAG dispersed in the matrix, P.l. (B) Xenotime near zircon and hydrothermal cryolite in the CAG, X.l. (C) Xenotime in the TAG, associated with cassiterite and hydrothermal fluorite, P.l. (D) Large xenotime crystal in contact with polylithionite in the pegmatitic CAG, where iron oxide fills fractures, X.l. (E) Xenotime in the pegmatitic CAG, with inclusion of thorite, BSE image. (F) Large thorite grain included in xenotime in the amphibole-rich PEG; polylithionite surrounds the set and fills voids, BSE image. (G) Xenotime cluster in the riebeckite-rich PEG, associated with riebeckite, P.l. (H) Xenotime grains included in polylithionite and also filling polylithionite-cleavage-associated fractures in the polylithionite-rich PEG, P.l. (I) Large xenotime crystal intensely fractured in the cryolite-rich PEG, where the fractures are filled with hydrothermal cryolite. Minerals abbreviations: Ab = albite, CryII = hydrothermal cryolite, Cst = cassiterite, Fe = iron oxide, Fl = hydrothermal fluorite, Or = orthoclase, Pol = polylithionite, Rbk = riebeckite, Thr = thorite, Xnt = xenotime. Rocks abbreviation: CAG = albite-enriched granite core, PEG = pegmatite veins, TAG = transitional albite-enriched granite.
Minerals 16 00417 g004
Figure 5. Average REE-normalized patterns (chondrite C1 of Anders and Grevesse [47]) of xenotime (this study) in comparison to those of the host rocks [29,46]. Abbreviations: CAG = core albite-enriched granite, TAG = transitional albite-enriched granite.
Minerals 16 00417 g005
Figure 6. Binary diagrams for xenotime from the albite-enriched granite (adapted from Bastos et al. [40]). (A) F versus P. (B) Y versus HREEs. Concentrations are expressed in apfu. Abbreviations: CAG = core albite-enriched granite, TAG = transitional albite-enriched granite.
Minerals 16 00417 g006
Figure 7. Photomicrographs and BSE images of thorite from the albite-enriched granite (CAG and BAG) (adapted from Hadlich et al. [26]). (A) Typical thorite from the albite-enriched granite, P.l. (B) Same as in A, thorite in the matrix with albite, quartz, and K-feldspar, X.l. (C) Euhedral grain of Y-Zr-Fe-rich thorite (light gray) with a relict of thorite of nearly pure composition (bright) and Fe-Zr-rich thorite at the border (dark gray), BSE image. (D) Y-Zr-Fe-rich thorite between two zircon grains; inside zircon, Th-rich zircon occurs (light gray), BSE image. (E) Rounded thorite section perpendicular to the c-axis, with an alteration halo associated with the presence of hydrothermal cryolite, X.l. (F) Y-Zr-Fe-rich thorite (bright) strongly altered, with a thick iron oxide halo (dark gray); thorite relicts are scattered in the mass of iron oxide, which also forms inclusions inside thorite, BSE image. (G) Secondary Th-Fe hydroxyfluoride (?) in the iron oxide halo, BSE image. (H) Secondary Th-Fe hydroxyfluoride (?) occurs along an Fe-Zr-rich thorite in the iron oxide halo, BSE image. (I) Detail of an isolated iron oxide grain with voids and microfractures filled by secondary Th-Fe hydroxyfluoride (?), BSE image. Abbreviations: Ab = albite, CryII = hydrothermal cryolite, Fe = iron oxide, Rbk = riebeckite, Thr = thorite, Or = orthoclase, Zrn = zircon.
Minerals 16 00417 g007
Figure 8. Photomicrographs and BSE images displaying various features of thorite from pegmatite veins (PEG) and from border pegmatites (BPEGs) (adapted from Hadlich et al. [26]). (A) Thorite grains included in xenotime in the PEG, P.l. (B) Fragmented thorite included in polylithionite in the PEG; voids are filled with hydrothermal cryolite, P.l. (C) Thorite with a penetration intergrowth with zircon in the PEG, both included in polylithionite; iron oxide forms rims on thorite and fills the polylithionite cleavages, P.l. (D) Thorite–zircon–xenotime solid solution with extreme compositional variations; the major zones have REE-Y-Fe-rich thorite (white), zircon (dark gray), and xenotime (light gray) compositions, BSE image. (E) REE-Y-Fe-rich thorite associated with Y-Fe-rich zircon and xenotime; the boundary between thorite and xenotime is either abrupt or gradual; Fe–aluminosilicates (Fe-Al-Si) fill voids and fractures in xenotime, and Fe–oxides are included in thorite, BSE image. (F) Penetration intergrowth between REE-Y-Fe-rich thorite (bright) and zircon (gray), with fine- to coarse-grained thorite grains inside a zircon crystal; both thorite and zircon are included in polylithionite; iron oxides from zircon and thorite penetrate the mica cleavage, BSE image. (G) Typical translucent thorite appearance in the BPEG, P.l. (H) Thorite and zircon from the BPEG growing in one of the faces of a zircon crystal; thorite presents a rim of galena and fluorite, P.l. (I) Translucent thorite from the BPEG with a thick rim of galena and fluorite, P.l. (J) REE-Y-Fe-rich thorite grain (bright) with an iron oxide (gray) halo, inclusions, and microveins; microinclusions of native Pb are also present inside the thorite grain; fluorite (black) fills a void, BSE image. (K) Detail of an Y-U-Fe-rich thorite (bright) with Th-rich xenotime (gray) inside; Fe–aluminosilicate (black, Fe-Al-Si) fills voids, BSE image. (L) Y-U-Fe-rich thorite (light gray) and its galena (bright) rim; Th-rich xenotime forms microveins (dark gray), and the voids are filled with Fe–aluminosilicates (black, Fe-Al-Si), BSE image. Abbreviations: Ab = albite, CryII = hydrothermal cryolite, Fe = iron oxide, Fl = hydrothermal fluorite, Gn = galena, Or = orthoclase, Pol = polylithionite, Qtz = quartz, Thr = thorite, Zrn = zircon, P.l.
Minerals 16 00417 g008
Figure 9. REE-normalized patterns (chondrite normalization after Boynton [50]) (adapted from Hadlich et al. [26]). (A) Albite-enriched granite (AEG) and thorite from the core albite-enriched granite (CAG) and the border albite-enriched granite (BAG). (B) Pegmatite veins (PEG) within the albite-enriched granite and thorite from the PEG, the north border pegmatite (BPEG), and the east BPEG. Abbreviations: Thr = thorite.
Minerals 16 00417 g009
Figure 10. Binary diagrams for thorite from pegmatites associated with the albite-enriched granite [26]. (A) Ce versus U. (B) Y versus F. (C) Si versus F. Abbreviations: squares = thorite from pegmatite veins (PEG) within the albite-enriched granite; triangles = thorite from border pegmatites. Concentrations are expressed in atomic percentages.
Minerals 16 00417 g010
Figure 11. (A) Early magmatic, skeletal zircon. (B) Late magmatic euhedral zircon crystal. (C) Aggregate of zircon grains with riebeckite and thorite. (D) Late magmatic zircon cut by and corroded by a hydrothermal cryolite vein.
Minerals 16 00417 g011
Figure 14. Photomicrographs illustrating various features of pyrochlore from the albite-enriched granite. (A) Typical pyrochlore from the albite-enriched granite, showing incipient alteration to columbite, P.l. (B) Same as (A), pyrochlore in the matrix with albite, quartz, and K-feldspar and recrystallized quartz, X.l. (C) Euhedral pyrochlore grain with incipient alteration in the matrix, P.l. (D) Pyrochlore grain with incipient alteration associated with riebeckite and polylithionite, P.l. (E) Pyrochlore grain with moderate alteration associated with LREE-rich fluorite and iron oxide, P.l. (F) Pyrochlore and zircon intergrowth associated with hydrothermal fluorite, P.l. (G) Pyrochlore grains with advanced alteration associated with hydrothermal cryolite, P.l. (H) Pyrochlore grains with advanced alteration, partially included in quartz phenocrysts, P.l. (I) Pyrochlore and columbite associated with hydrothermal fluorite. Abbreviations: Ab = albite, Col = columbite, Cry = cryolite, F = LREE-rich fluorite, Fe = iron oxide, Fl = fluorite, Or = orthoclase, Pyc = pyrochlore, QtzI = quartz phenocryst, QtzII = quartz matrix, QtzIII = recrystallized quartz, Zrn = zircon.
Minerals 16 00417 g014
Figure 15. BSE images of magmatic pyrochlore from the albite-enriched granite (adapted from Hadlich et al. [31]). (A) Grain of magmatic U-Pb-LREE-rich pyrochlore (gray); early hydrothermal U-LREE-Pb-rich pyrochlore (white) occurs along the borders and microfractures. (B) Detail of A; the grain borders are altered, and voids are filled with Mn-Fe-rich columbite and LREE-rich fluoride. (C) Comparison of EPMA data for pyrochlore in A-B shows Pb enrichment during alteration. (D) U-LREE-Pb-rich pyrochlore grain partially altered, with higher Pb concentration along the borders and microfractures. (E) Detail of D; Fe-U-Pb-rich pyrochlore occurs surrounded by U-Mn-Fe-rich columbite, and at the edge of the crystal, an LREE-rich fluoride occurs. (F) EPMA data for pyrochlore in D-E show Pb-U-Si-Fe enrichment and REE-Nb loss during alteration. Abbreviations: Ab = albite, Col = columbite, Cry = cryolite, Or = orthoclase, Pyc = pyrochlore, Qtz = quartz.
Minerals 16 00417 g015
Figure 16. BSE images of miscellaneous products of pyrochlore alteration from the albite-enriched granite. (A) Grain composed of Mn-Fe-rich columbite (dark gray) with relics of Fe-U-Pb-rich pyrochlore and disseminated LREE-rich fluoride and Th-U-rich silicate. (B) Grain fully converted into Mn-Fe-rich columbite, surrounded by iron oxide. (C) Grains composed of (U)-Mn-Fe-rich columbite, relics of Fe-U-rich pyrochlore and grains of Y-Th-U-rich silicate surrounded by iron oxide; the assemblage is surrounded by iron oxide. (D) Th-LREE-rich fluoride grain located at the edge of a Fe-U-Pb-rich pyrochlore grain. (E) Grain of Mn-Fe-rich columbite with disseminated galena, LREE-rich fluoride, and U-Th-Zr-rich silicate. (F) Grain of galena surrounded by HREE-Y-U-rich silicate and xenotime; the assemblage is near a group of Mn-Fe-rich columbite grains. Abbreviations: Col = columbite, Fe = iron oxide, Gn = galena, Pyc = pyrochlore, Xnt = xenotime.
Minerals 16 00417 g016
Figure 17. Photomicrographs showing various features of pyrochlore from the pegmatite veins. (A) Typical pyrochlore from the pegmatite veins, moderately altered to columbite, P.l. (B) Euhedral columbitized pyrochlore grains included in polylithionite, P.l. (C) Columbitized pyrochlore grains included in polylithionite and in contact with xenotime, associated with LREE-rich fluoride, X.l. (D) Anhedral columbitized pyrochlore grain included in xenotime and polylithionite, in contact with hydrothermal cryolite, X.l. (E) Subhedral columbitized pyrochlore in the matrix, with corrosion cavities filled by hydrothermal cryolite, X.l. (F) Columbitized pyrochlore grain with straight crystal faces in contact with a quartz phenocryst and corroded where in contact with hydrothermal cryolite, X.l. Abbreviations: Ab = albite, Col = columbite, CryII = hydrothermal cryolite, F = LREE-rich fluoride, Fe = iron oxide, Or = orthoclase, Pol = polylithionite, Pyc = pyrochlore, QtzI = quartz phenocryst, Xnt = xenotime.
Minerals 16 00417 g017
Figure 18. BSE images of pyrochlore and associated secondary minerals from the pegmatite veins. (A) Grain of early hydrothermal U-Pb-rich pyrochlore (white) with relics of magmatic LREE-Pb-rich pyrochlore (gray); below, EPMA data comparison shows Pb enrichment and REE depletion during pyrochlore alteration. (B) Mn-Fe-rich columbite grain with relics of pyrochlore; below, EPMA data indicate Pb enrichment and REE-Na depletion during alteration along the grain margins. (C) Altered pyrochlore grain with voids filled by LREE-rich fluoride and Mn-Fe-rich columbite. (D) Columbitized pyrochlore grain with iron oxide and LREE-rich fluoride along the border. Abbreviations: Col = columbite, Cst = cassiterite, CryII = hydrothermal cryolite, Fe = iron oxide, Pyc = pyrochlore, QtzII = hydrothermal quartz.
Minerals 16 00417 g018
Figure 19. Photomicrographs showing pyrochlore features from the eastern (AC) and northern (DF) border pegmatites (adapted from Hadlich et al. [31]). (A) Euhedral pyrochlore with incipient alteration, surrounded by hydrothermal fluorite and iron oxides, P.l. (B) Moderately altered pyrochlore transitioning to columbite, associated with polylithionite and zircon; the set is surrounded by matrix and fluorite, X.l. (C) Pyrochlore with marginal alteration, associated with zircon and fluorite, P.l. (D) Intergrowth between pyrochlore and zircon, with columbitized pyrochlore inclusions inside zircon, P.l. (E) Anhedral columbitized pyrochlore surrounded by fluorite and chlorite, P.l. (F) Completely columbitized grains with secondary U-Th-HREE-Y-rich silicate and LREE-rich fluoride, X.l. Abbreviations: Ab = albite, Cl = chlorite, Col = columbite, Fe = iron oxide, Fl = fluorite, Or = orthoclase, Pyc = pyrochlore, Pol = polylithionite, Qtz = quartz, Zrn = zircon.
Minerals 16 00417 g019
Figure 20. BSE images of pyrochlore and associated secondary minerals from the east border pegmatites, with corresponding EPMA data of the observed phases. (A) Grain of altered LREE-Ca-Fe-U-Pb-rich pyrochlore intergrown with zircon; Ca-U-rich pyrochlore occurs at the grain borders; the set is surrounded by hydrothermal fluorite; EPMA data show Ca and U enrichment and Pb and REE loss during pyrochlore alteration. (B) Grain of LREE-Ca-Fe-Pb-U-rich pyrochlore with advanced alteration to Ca-Fe-U-rich pyrochlore and Ca-U-rich pyrochlore; the set is surrounded by hydrothermal fluorite; EPMA data show Pb and LREE loss, along with U and Ca enrichment during pyrochlore alteration. (C) Altered grain of LREE-U-Pb-Fe-rich pyrochlore, with the borders (light gray) depleted in Fe; the set is surrounded by hydrothermal fluorite and quartz; EPMA data show an increase in Fe and a reduction in LREEs in the altered nuclei of the grain. Abbreviations: Fe = iron, Fl = hydrothermal fluorite, Pyc = pyrochlore, QtzII = hydrothermal quartz, Zrn = zircon.
Minerals 16 00417 g020
Figure 21. BSE images of hydrothermal products of pyrochlore alteration in the northern border pegmatite. (A) Fe-Mn-rich columbite with relics of Y-Fe-U-Pb-rich pyrochlore, along with galena and U-HREE-Y-Th-rich silicate; voids are filled by hydrothermal quartz and fluorite. (B) U-Fe-Mn-rich columbite with hydrothermal HREE-Y-U-Pb-rich pyrochlore and galena; the set is surrounded by hydrothermal fluorite. (C) Columbitized pyrochlore grain with galena, HREE-U-Y-rich silicate, and hydrothermal fluorite at its borders. (D) Near a fully columbitized pyrochlore grain, an association of galena, HREE-Y-U-Th-rich silicate, and HREE-Pb-Y-U-rich silicate occurs. Abbreviations: Col = columbite, Fl = hydrothermal fluorite, Gn = galena, Pyc = pyrochlore, QtzII = hydrothermal quartz.
Minerals 16 00417 g021
Figure 22. (A) REE distribution patterns normalized to chondrite [47] in pyrochlore from the albite-enriched granites and associated pegmatites. (B) Boxplots showing the distribution of LREE/HREE ratios. (C) Boxplots showing the distribution of Nb/Ta. Boxes represent interquartile range (IQR), horizontal lines indicate medians, crosses represent means, and whiskers correspond to 1.5 × IQR. (Adapted from Hadlich et al. [31].) Abbreviations: BAG = border albite-enriched granite, BPEG = border pegmatite, CAG = core albite-enriched granite, PEG = pegmatite veins.
Minerals 16 00417 g022
Figure 23. Binary diagrams for pyrochlore from the CAG and BAG, the amphibole-rich pegmatite vein (PEG), and the border pegmatites (adapted from Hadlich et al. [31]). (A) Nb/Ta versus Ta. (B) Si versus Nb. (C) LREEs versus Pb. (D) LREEs versus F. (E) Na versus Ca. (F) HREEs + Y versus LREEs. Concentrations are expressed in atoms per formula unit. Arrows indicate the direction of hydrothermal alteration.
Minerals 16 00417 g023
Figure 24. (A) Boxplots showing the distribution of LREE/HREE ratios in columbite from the albite-enriched granite and associated pegmatites. Boxes represent interquartile range (IQR), horizontal lines indicate medians, crosses represent means, and whiskers correspond to 1.5 × IQR. (B) Binary diagrams of LREE/HREE ratio versus LREEs. Concentrations are expressed in atoms per formula unit. (C) REE distribution patterns normalized to chondrite [46] in columbite (adapted from Hadlich et al. [31]). Abbreviations: BAG = border albite-enriched granite, BPEG = border pegmatite, CAG = core albite-enriched granite, PEG = pegmatite veins.
Minerals 16 00417 g024
Figure 25. Average REE distribution patterns normalized to chondrite [47] in secondary phases associated with pyrochlore alteration: (A) (U-Y-HREE-Th)-rich silicates, and (B) Y-LREE-rich fluorides from the CAG and BAG and from the amphibole-rich pegmatite vein (PEG) and northern border pegmatite (adapted from Hadlich et al. [31]).
Minerals 16 00417 g025
Figure 26. Gagarinite-(Y) and fluocerite-(Ce) in the central CAG and in the pegmatite veins. (A) Gagarinite-(Y) (pink) with fluocerite-(Ce) exsolutions following two orientations in the CAG. (B) Gagarinite-(Y) with stringlets of exsolved fluocerite-(Ce) in the CAG. (C) Gagarinite-(Y) with fluocerite-(Ce) exsolutions; the set is cross-cut by a hydrothermal cryolite vein. (D) Gagarinite-(Y) with fractures filled by hydrothermal cryolite in the cryolite-rich pegmatite vein. Abbreviations: Ab = albite, Cry II = hydrothermal cryolite, Fcrt-Ce = fluocerite-(Ce), Gag-Y = gagarinite-(Y), Pol = polylithionite, Qtz = quartz, Xnt = xenotime.
Minerals 16 00417 g026
Figure 27. Binary diagrams for gagarinite-(Y) from the cryolite-rich pegmatite vein (PEG) and the core albite-enriched granite (CAG) [31]. (A) Na versus HREEs. (B) Ca versus F. (C) Y + REEs versus Ca. (D) Na versus F. (E) LREEs versus Y. (F) HREEs versus LREEs. Concentrations expressed in atoms per formula unit.
Minerals 16 00417 g027
Figure 28. REE patterns normalized to chondrite [47] for gagarinite from the cryolite-rich pegmatite vein (PEG) and for gagarinite-(Y), fluocerite-(Ce) (exsolved phase), and the calculated earliest gagarinite from the core albite-enriched granite (CAG) [31].
Minerals 16 00417 g028
Figure 29. Photomicrographs of cryolite, chiolite, and fluorite from the albite-enriched granite (adapted from Bastos Neto et al. [35]). (A) Typical cryolite I disseminated in the matrix of the CAG, X.l. (B) Snowball texture in a quartz phenocryst with ovoid inclusions of cryolite I in the CAG, X.l. (C) Cryolite I and polylithionite agglomerate in the CAG, X.l. (D) Early magmatic zircon showing reactive contact with the surrounding cryolite II in the CAG, P.l. (E) Pyrochlore with an Fe-rich aureole formed after reaction with the surrounding cryolite II in the CAG, P.l. (F) Typical disseminated cryolite II in the matrix, showing corrosive contact with magmatic quartz, X.l. (G,H) Twinned cryolite II crystals in the MCD, X.l. (I) Typical disseminated hydrothermal fluorite surrounding pyrochlore in the BAG. Minerals abbreviations: Ab = albite, CryI = cryolite I, CryII = cryolite II, Cst = cassiterite, Fl = fluorite, Or = orthoclase, Pol = polylithionite, Pyr = pyrochlore, Qtz = quartz, Zrn = zircon. Rock abbreviations: BAG = border albite-enriched granite, CAG = core albite-enriched granite, MCD = massive cryolite deposit.
Minerals 16 00417 g029
Figure 30. Chondrite-normalized [69] REE patterns of (A) cryolite I (magmatic) and cryolite II (hydrothermal). (B) Zoned and caramel cryolite. (C) Chiolite. (D) Hydrothermal fluorite, disseminated and in veinlets (adapted from Bastos Neto et al. [28]).
Minerals 16 00417 g030
Figure 31. Binary diagram of Th versus HREEs for the border albite-enriched granite (BAG), based on bulk-rock analyses expressed in ppm (adapted from Hadlich et al. [26]).
Minerals 16 00417 g031
Figure 32. REE data for the CAG, BAG, border pegmatite, and pegmatite veins (amphibole-rich, polylithionite-rich, and cryolite-rich) [31]. (A) Chondrite-normalized [47] average REE patterns. (B) LREE/HREE ratios.
Minerals 16 00417 g032
Figure 33. Evolution of pyrochlore alteration in the albite-enriched granite and associated pegmatites.
Minerals 16 00417 g033
Table 1. Representative EPMA data (in wt.%) for xenotime from the core albite-enriched granite (CAG), transitional albite-enriched granite (TAG), pegmatitic CAG and pegmatite veins.
CAG 1TAG 1Pegmatitic CAG 1Pegmatite Vein 2
Crystal(1)(2)(3)(4)(5)(6)(7)(8)(9)(10)
P2O530.1029.4030.1732.5933.1532.1432.8231.8233.4432.75
SiO200.1900.2600.22d.l.00.1400.0200.0300.1300.0100.06
ThO200.3701.1400.39d.l.00.4300.1100.3900.2700.1100.19
Y2O325.2624.7523.4031.1627.6826.9829.0730.1932.1633.18
Gd2O304.0804.2104.9502.9104.1404.0703.6500.7400.5800.51
Dy2O306.2507.6307.8604.6107.4207.7706.3107.1906.0806.50
Ho2O302.0002.5302.9401.5602.2502.8002.2702.6202.9101.34
Er2O309.5711.2211.9608.2510.6809.9309.2908.4408.8908.67
Yb2O317.6414.1115.2314.1414.3814.0714.7815.0514.4313.51
Lu2O302.0802.0201.4902.2901.5501.3401.6201.5401.7801.80
CaOd.l.00.03d.l.d.l.00.03d.l.00.01d.l.00.0500.00
Na2O00.0500.1400.0300.0200.02d.l.00.01d.l.d.l.00.00
F03.0404.7002.46d.l.00.1601.4000.8702.0800.2201.30
F=O201.2801.9801.04-00.0700.5900.3700.8700.0900.55
Total99.44100.14100.0697.53101.97100.62100.7699.26100.5799.33
HREE2O341.6241.7244.4333.7640.4239.9837.9235.5834.6732.33
Structural formula based on a sum of cations = 2 a.p.f.u. (site VIII + site IV = 2) and O = 4-F
P5+0.9680.9500.9681.0080.9980.9960.9970.9830.9970.988
Si4+0.0070.0100.008 0.0050.0010.0010.005 0.002
Th4+0.0030.0100.003 0.0030.0010.0030.0020.0010.002
Y3+0.5090.5030.4720.6060.5240.5250.5550.5860.6030.630
Gd3+0.0510.0530.0620.0350.0490.0490.0430.0090.0070.006
Dy3+0.0760.0940.0960.0540.0850.0920.0730.0850.0690.075
Ho3+0.0240.0310.0350.0180.0250.0330.0260.0300.0330.015
Er3+0.1140.1350.1420.0950.1190.1140.1050.0970.0980.097
Yb3+0.2040.1640.1760.1570.1560.1570.1620.1680.1550.147
Lu3+0.0240.0230.0170.0250.0170.0150.0180.0170.0190.019
Ca2+0.0170.0170.017 0.0180.0180.0180.0180.0180.018
Na+0.0040.0100.002 0.002
F0.3640.5680.295 0.0180.1610.0990.2400.0250.146
O2−3.6363.4323.7054.0003.9823.8393.9013.7133.9663.816
HREE/Y0.9690.9941.1190.6340.8610.8760.7690.6930.6320.570
1 Bastos Neto et al. [40]; 2 Paludo et al. [29]. Abbreviations: d.l. = below detection limit.
Table 2. Crystallographic parameters of xenotime from the pegmatitic core albite-enriched granite and from Novo Horizonte (adapted from Bastos Neto et al. [40]).
Sample 2σNovo Horizonte
a (Å)6.8840.0076.898
c (Å)6.0090.0126.037
V (Å3)284.7520.711287.281
Calculated density (g/cm3)5.146 4.658
Table 3. EPMA data (in wt.%) for (1) thorite, (2) Y-Zr-Fe-rich thorite, (3) Fe-rich thorite, (4) Fe-Zr-rich thorite, (5, 6) REE-Y-(Fe)-rich thorite, (7, 8) REE-Y-U-(Fe)-rich thorite, (9) Th-Fe-rich xenotime, and (10) xenotime (adapted from Hadlich et al. [26]). CAG: 1, 3; BAG: 2, 4; PEG: 5, 8, 10; BPEG: 6, 7, 9.
Crystal(1)(2)(3)(4)(5)(6)(7)(8)(9)(10)
Nb2O500.06d.l.00.1900.80d.l.01.1705.6300.5001.04d.l.
P2O500.3301.3000.1001.5001.4205.5305.8701.7013.5226.70
SiO209.1313.3912.1910.5709.2411.9712.3514.5406.52d.l.
ZrO200.8601.99d.l.06.24d.l.d.l.d.l.d.l.d.l.00.47
HfO2d.l.00.1300.2700.48d.l.00.22d.l.d.l.d.l.d.l.
ThO260.9859.0251.6851.2049.1241.9036.8750.8525.0600.05
UO200.6000.7300.2700.4200.3501.0401.6909.3801.44d.l.
Al2O300.2601.0600.6400.4701.1900.4900.4700.1800.25d.l.
Fe2O3 (1)00.1104.9329.5615.9511.7103.9401.5000.1915.9400.10
Y2O300.9601.5700.7600.7204.2106.5406.2303.4918.4723.47
La2O3d.l.d.l.d.l.00.1000.08d.l.d.l.00.0800.07d.l.
Ce2O300.11d.l.00.0900.2700.1200.0900.1200.2600.09d.l.
Pr2O300.14d.l.d.l.00.11d.l.d.l.00.0600.1200.05d.l.
Nd2O300.1200.0700.0700.1500.0600.1900.1300.1800.1900.08
Sm2O300.08d.l.00.09d.l.d.l.00.2500.1100.1100.1500.16
Eu2O3d.l.d.l.d.l.d.l.d.l.d.l.d.l.d.l.d.l.d.l.
Gd2O300.0800.0600.0800.1300.1800.4100.3700.2600.3300.47
Tb2O3d.l.d.l.d.l.d.l.d.l.d.l.d.l.d.l.d.l.00.42
Dy2O300.1100.5200.2000.3800.8102.3701.5200.6301.6605.02
Ho2O3d.l.00.44d.l.00.1200.1300.4000.3200.3900.6201.81
Er2O300.1300.6100.3300.4600.8701.8001.2400.4802.6608.85
Tm2O3d.l.00.11d.l.d.l.00.1200.2300.1900.0800.3401.94
Yb2O300.1300.3900.1900.3200.8701.6501.0500.3802.4113.25
Lu2O3d.l.d.l.d.l.d.l.d.l.d.l.d.l.d.l.00.05d.l.
CaO00.5601.1500.7500.6400.5701.1400.8601.4700.5200.29
MnOd.l.00.2600.0700.1603.30d.l.00.14d.l.00.09d.l.
PbOd.l.d.l.d.l.d.l.01.1300.1502.4600.2000.26d.l.
F04.7804.2203.9503.0205.4103.5302.2902.2902.4000.66
F=O2−02.01−01.78−01.66−01.27−02.28−01.49−00.96−00.96−01.01−00.28
Total77.5690.1799.8292.9488.6183.5280.5186.8093.1383.46
H2O (2)22.4409.8300.1807.0611.3916.4819.4913.2006.8716.54
LREE2O300.4500.0700.2500.6300.2600.5300.4200.7500.5500.24
HREE2O300.4502.2000.8001.4102.9806.8604.6902.2208.0731.76
Structural formula based on a sum of 1 a.p.f.u. in the [8] A site
Nb4+0.0020.0000.0020.0120.0000.0260.1330.0120.0150.000
Zr4+0.0260.0460.0000.1050.0000.0000.0000.0000.0000.011
Hf4+0.0000.0020.0020.0050.0000.0030.0000.0000.0000.000
Th4+0.8690.6310.3280.4000.4130.4670.4400.6270.1800.000
U4+0.0080.0080.0020.0030.0030.0110.0200.1130.0100.000
Fe3+0.0050.1740.6200.4120.3260.1450.0590.0080.3780.003
Y3+0.0320.0390.0110.0130.0830.1710.1740.1000.3090.540
LREE3+0.0110.0010.0030.0070.0040.0090.0070.0140.0070.003
HREE3+0.0090.0310.0080.0140.0340.1060.0770.0380.0790.429
Ca2+0.0380.0580.0220.0270.0230.0600.0490.0850.0180.014
Mn2+0.0000.0100.0020.0050.1030.0000.0060.0000.0020.000
Pb2+0.0000.0000.0000.0000.0110.0020.0350.0030.0020.000
Ʃ [8]A1.0001.0001.0001.0001.0001.0001.0001.0001.0001.000
P5+0.0170.0510.0020.0210.0440.2290.2600.0780.3600.978
Si4+0.5720.6290.3400.8710.3420.5860.6470.7860.2050.000
Al3+0.0190.0590.0210.0300.0520.0290.0290.0120.0090.000
Ʃ [4]B0.6080.7390.3630.9220.4380.8440.9360.8760.5740.978
O2−2.3922.2613.6513.9772.5632.1562.0642.1242.4252.022
F-0.9460.6270.3490.0230.6320.5470.3790.3920.2390.091
OH-0.6621.112--0.8051.2971.5571.4841.3361.887
ƩX4.0004.0004.0004.0004.0004.0004.0004.0004.0004.000
H2O8.1280.9800.0300.5781.2872.9393.8681.9581.4444.778
LREE/HREE1.2220.0320.3750.5000.1170.0850.0910.3680.0880.007
(1) Total Fe as Fe2O3; (2) calculated. Abbreviations: d.l. = below detection limit.
Table 4. EPMA data (in wt.%) of secondary minerals associated with thorite: (1, 2) Th-Fe-rich fluoride, (3, 4) Fe-Y-Th-rich fluoride; CAG: 1, PEG: 2, 3, 4, (adapted from Hadlich et al. [26]).
Crystal(1)(2)(3)(4)
Nb2O500.3400.09d.l.00.18
P2O500.47d.l.01.1500.85
SiO203.1200.4003.1914.14
ZrO200.83d.l.00.3500.32
ThO241.8935.3918.0422.08
UO200.3400.26d.l.d.l.
Al2O300.9800.2600.4203.78
Fe2O3 (1)06.9326.9115.1006.15
Y2O301.3601.7715.9512.65
La2O300.1100.1200.1800.03
Ce2O300.6400.3200.3600.18
Pr2O300.05d.l.00.0800.13
Nd2O300.1000.1400.1700.08
Sm2O3d.l.00.09d.l.00.18
Eu2O3d.l.d.l.00.05d.l.
Gd2O300.07d.l.00.3200.16
Tb2O3d.l.d.l.d.l.d.l.
Dy2O300.1900.1100.8200.70
Ho2O300.18d.l.00.3700.20
Er2O300.1100.1301.3200.75
Tm2O3d.l.d.l.00.2100.15
Yb2O300.0600.0101.3400.78
CaOd.l.00.5204.7302.80
PbO00.0600.5000.2000.48
F07.8907.2114.9914.52
F=O2−03.23−03.04−06.31−06.13
Total62.4971.1973.0375.16
H2O (2)37.5128.8126.9724.84
LREE2O301.8000.6700.8400.60
HREE2O300.6100.2504.3802.74
(1) Total Fe as Fe2O3; (2) calculated. Abbreviations: d.l. = below detection limit.
Table 5. Geometric mean and standard deviation (SD) of trace element contents in zircon grains and their host rocks (adapted from Nardi et al. [22]).
Core Albite-Enriched GraniteBorder Albite-Enriched Granite
Trace ElementsHost Rock
n = 45
Zircon (Mean)Zircon
(SD)
Host Rock
n = 26
Zircon (Mean)Zircon
(SD)
Y3273616226331192114606
Nb158883412271411825653
Hf53530,69121,93340241,96211,492
Ta1716557148180160
Pb658265737391458187426
Th894824312,709915664912,247
U2911546109337929752250
La38.7011212318619.9029.30
Ce93.10436578161174198
Pr17.9087.2011268.3030.8031.10
Nd52.40347462222132130
Sm26.2021635763.10184157
Eu0.606.39.902.106.605.10
Gd27.9023536643.70263196
Tb14.2010815216.40173109
Dy1011169123899.4021011208
Ho22.8032824219.40611314
Er83.30151379164.4030851396
Tm16.0035615811.60784305
Yb1183546132785.3079042927
Lu15.5047015311.301087342
Th/U3.075.33-2.412.23-
Y/Ho14.4011.02-16.1015.06-
Zr 1/Hf12.4316.29-11.1511.92-
Nb/Ta9.2712.78-9.494.59-
1 Estimated stoichiometric content.
Table 6. Representative EPMA data (in wt.%) for pyrochlore: (1) U-Pb-LREE-rich pyrochlore; (2) U-LREE-Pb-rich pyrochlore; (3) LREE-U-Pb-rich pyrochlore; (4) Fe-U-rich pyrochlore; (5) LREE-Pb-rich pyrochlore, (6) U-Pb-rich pyrochlore, (7) Na-Pb-LREE-rich pyrochlore; (8) Y-Fe-U-Pb-rich pyrochlore, (9) HREE-Y-U-Pb-rich pyrochlore; (10) Ca-LREE-Fe-Pb-U-rich pyrochlore, (11) LREE-U-Pb-Fe-rich pyrochlore (adapted from Hadlich et al. [25,31]).
CAGBAGAmph.-Rich PEGN. Border PegmatiteE. Border Pegmatite
Crystal(1)(2)(3)(4)(5)(6)(7)(8)(9)(10)(11)
Nb2O546.2050.8340.1031.9350.6533.2043.6634.3624.3233.8328.51
Ta2O506.1306.1502.4701.6908.7304.0415.1712.8609.2305.0406.55
SiO200.2100.2100.4213.8200.3404.8900.5809.3716.9215.2713.27
SnO201.1602.7200.72d.l.00.0000.7800.6200.2300.2400.6100.06
TiO201.0500.4700.9201.4500.17d.l.00.2802.2402.0300.6201.65
UO202.8102.2506.9712.6401.6508.8601.1306.4009.7605.7203.02
ThO201.7702.2400.4900.8401.4400.3500.9800.0000.6600.9101.93
Y2O301.0000.7200.1300.2500.6000.2400.6501.7203.5300.2900.21
La2O301.0400.6300.5700.0602.6700.0001.2900.0000.1100.3700.16
Ce2O303.4302.2002.3800.6207.3800.1604.5100.4100.3702.5801.02
Pr2O300.3900.2700.2600.1800.67d.l.00.3100.0000.04d.l.00.00
Nd2O301.6001.1200.7400.4901.8800.1001.3300.1500.1700.2400.15
Sm2O300.5600.4300.1300.2400.3500.0000.5400.1000.18d.l.00.00
Eu2O3d.l.00.0000.0000.0500.0800.0000.0700.0000.0000.0900.00
Gd2O3d.l.00.2000.0000.2400.0000.00d.l.d.l.00.0400.0000.00
Dy2O300.4600.14d.l.00.5900.0000.0000.83d.l.00.5600.0000.00
Ho2O3d.l.00.00d.l.00.2000.0000.0000.1500.0000.12d.l.00.00
Er2O300.1800.1300.0500.3900.1200.0000.2300.0000.7500.1300.11
Tm2O300.0700.1600.0700.0400.1900.0700.5000.2400.3000.1300.18
Yb2O300.2000.0800.0800.2500.0900.0000.20d.l.00.87d.l.00.00
Lu2O3d.l.00.0000.0000.1600.0900.0000.0000.0000.1200.0000.00
FeO (1)00.6900.2801.7003.2400.3700.0000.0402.7001.9003.7612.33
CaO01.4201.7301.0400.3400.7600.0001.4800.6100.1901.7801.34
MnO00.1100.2000.2300.4900.2001.3300.0000.1200.2900.4100.70
PbO07.2314.5113.9800.0213.0728.8705.2722.0014.9104.9303.47
Na2O00.7600.2000.1800.3101.5000.2104.42d.l.00.0700.2700.94
F02.7302.9600.8500.2104.4500.3104.4700.0000.0000.0800.00
F=O2−01.15−01.25−00.36−00.0901.87−00.13−01.88−00.00−00.00−00.03−00.00
Total80.0889.5774.1869.3495.6183.2986.8693.2985.4976.7075.63
LREE2O307.0204.6404.0801.8813.0500.2608.0500.6600.8903.2801.34
HREE2O300.9100.7100.2001.6300.4900.0701.9100.2402.7200.2600.30
Structural formula based on a sum of 2 a.p.f.u. in the [6] B site
U4+0.0520.0380.1540.1890.0290.1850.0200.0940.1350.0780.046
Th4+0.0340.0390.0110.0130.0260.0080.018 0.0090.0130.030
Y3+0.0440.0290.0070.0090.0250.0120.0280.0610.1170.0090.008
LREE3+0.2130.1270.1490.0460.3700.0090.2350.0160.0210.0730.034
HREE3+0.0240.0170.0060.0340.0120.0020.0490.0050.0530.0050.006
Pb2+0.1620.2970.373 0.2740.7300.1140.3930.2510.0810.064
Fe2+0.0480.0180.1410.1820.024 0.0030.1500.0990.1930.706
Mn2+0.0080.0130.0200.0280.0140.106 0.0070.0150.0210.041
Ca2+0.1270.1410.1110.0240.063 0.1270.0440.0130.1170.098
Na+0.1230.0300.0350.0410.2260.0390.689 0.0090.0330.125
Ʃ [8]A0.8350.7501.0060.5651.0621.0901.2840.7690.7220.6241.158
Nb5+1.7391.7471.7950.9681.7791.4081.5851.0290.6850.9360.882
Ta5+0.1390.1270.0670.0310.1840.1030.3320.2320.1570.0840.122
Si4+0.0170.0160.0420.9290.0260.4600.0470.6221.0570.9370.910
Sn4+0.0390.0830.028 0.0000.0290.0200.0060.0060.0150.002
Ti4+0.0660.0270.0690.0730.010 0.0170.1110.0950.0290.085
Ʃ [6]B2.0002.0002.0002.0002.0002.0002.0002.0002.0002.0002.000
O2-4.8784.6725.3283.5805.4705.0615.3204.0683.7593.5044.393
F- 0.094 0.137
OH1.1221.3280.6722.4200.4360.9390.5431.9322.2413.4981.607
ƩX6.0006.0006.0006.0006.0006.0006.0006.0006.0006.0006.000
F-0.7210.7130.2680.0461.0000.0911.000 0.016
OH-0.2790.2870.7320.954 0.909 1.0001.0000.9841.000
ƩY1.0001.0001.0001.0001.0001.0001.0001.0001.0001.0001.000
LREE/
HREE
8.8757.47024.8331.35230.8334.5004.7953.2000.39614.6005.666
(1) Total Fe as FeO. Abbreviations: CAG = core albite-enriched granite, BAG = border albite-enriched granite, BPEG = border pegmatite, d.l. = below detection limit, PEG = pegmatite vein.
Table 7. EPMA data (in wt.%) for the following secondary minerals: (1) Ca-U-rich niobate; (2) Mn-Fe-rich columbite; (3) REE-U-Mn-Fe-rich columbite; (4) HREE-Y-U-rich silicate; (5) HREE-Y-U-Th-rich silicate; (6) HREE-Y-U-rich silicate; (7, 8) Y-LREE-rich fluoride; (9) U-Y-LREE-rich fluoride; (10) Y-Th-LREE-rich fluoride. CAG: 4, 10; central portion of the CAG: 5, 9; BAG: 2, 3; PEG: 8; east BPEG: 1; north BPEG: 6, 7.
Crystal(1)(2)(3)(4)(5)(6)(7)(8)(9)(10)
Nb2O521.8565.6157.1200.4001.1303.1900.2602.6200.0902.49
Ta2O506.5505.7204.64d.l.d.l.00.0000.0001.05d.l.d.l.
P2O500.0000.0000.0003.5201.0401.0700.0000.0000.0700.10
SiO200.7500.5700.6814.1311.5314.7600.0300.1000.0400.07
SnO200.23d.l.d.l.d.l.00.2300.0000.00d.l.d.l.d.l.
TiO200.5202.3602.74d.l.00.1500.0000.0000.08d.l.00.22
UO236.6503.6408.8221.2117.3429.2300.3100.3003.8100.65
ThO200.0300.1800.7804.7030.3900.2500.0500.4903.1311.61
ZrO200.0000.0000.0000.1802.5200.0000.00d.l.d.l.00.19
Y2O300.0000.0700.2210.2703.5115.0910.9713.2309.0805.82
La2O300.0000.00d.l.d.l.d.l.00.0027.0726.7526.3317.03
Ce2O300.1000.1800.4200.0200.1800.0804.4203.8003.5502.22
Pr2O300.0000.00d.l.d.l.00.0900.0011.7009.3908.8908.34
Nd2O300.0600.0500.2900.1000.2500.0801.7401.8400.8702.94
Sm2O300.0000.1800.28d.l.00.6300.0000.3600.3900.3700.40
Eu2O300.1300.0000.1200.08d.l.00.0400.0000.00d.l.00.38
Gd2O300.0000.0000.1500.5000.7700.1500.0000.00d.l.00.00
Dy2O300.0000.0000.4002.4300.2301.7600.0000.1900.0000.69
Ho2O300.0000.1500.1500.4901.0000.7900.1400.0000.1300.28
Er2O300.0000.1600.3802.0601.6403.2100.0400.0000.3000.26
Tm2O300.0000.1700.1100.2600.3000.4800.0000.00d.l.d.l.
Yb2O300.0000.1500.3102.0900.8503.9100.0000.0500.0800.12
Lu2O300.0000.0000.0700.57d.l.00.7300.0000.05d.l.00.11
FeO 102.0016.1313.8500.8000.2500.5000.0000.1900.1401.66
CaO04.34d.l.d.l.00.6200.3400.3200.27d.l.d.l.02.11
MnO00.4504.9204.9900.13d.l.d.l.00.1600.1400.1200.48
PbO00.2200.0600.3600.0901.2302.7100.00d.l.00.5500.29
Na2O00.2800.0400.1100.0200.0400.0000.00d.l.d.l.d.l.
F00.06d.l.d.l.03.9204.5402.6107.1308.6517.3110.75
F=O2−00.02−00.00−00.00−01.65−01.91−01.10
Total 267.6699.7495.7166.9481.1079.8764.6569.3174.8669.21
LREE2O300.3000.4101.1100.2001.1500.3356.2655.4049.0936.75
HREE2O300.0000.6201.5708.4004.7910.8800.1800.2900.5101.84
1 Total Fe as FeO; 2 calculated. Abbreviations: CAG = albite-enriched granite core, BAG = albite-enriched granite border, BPEG = border pegmatite, d.l. = below detection limit, PEG = pegmatite vein.
Table 8. EPMA average compositions (wt.%) of exsolved fluocerite-(Ce) and host gagarinite-(Y) from the core albite-enriched granite (CAG), and gagarinite-(Y) from the cryolite-rich pegmatite vein (PEG).
CAG Fluocerite aCAG Gagarinite aCryolite-Rich PEG Gagarinite b
RangeRangeRange
n = 24n = 16n = 25
Ud.l. d.l. 0.200.05
Thd.l. d.l. 0.170.10
Y0.360.5331.121.3225.311.78
HREE0.482.3112.151.3715.660.82
LREE66.153.219.033.057.121.66
Ca0.140.718.100.487.611.70
Pbd.l. d.l. 0.250.08
Srd.l. d.l. 0.140.10
Nad.l. 1.901.013.191.38
F35.673.5938.223.2742.291.42
Total102.804.22100.523.03101.952.59
Structural formula in a.p.f.u.
U 0.0030.001
Th 0.0020.001
Y0.0100.0101.0090.0510.9170.087
HREE0.0030.0290.2100.0300.3020.023
LREE0.9770.0700.1390.0570.1580.034
Ca0.0070.0370.5840.0280.6090.094
Pb 0.0040.002
Sr 0.0050.004
Na0.0010.0120.2380.1270.4500.226
F3.8830.4485.8080.5745.8400.288
LREE/
HREE
289.08243.860.750.400.450.10
a Pires et al. [41], b Paludo et al. [29]. Fluocerite structural formula calculated based on 1 cation. Gagarinite structural formula calculated based on Y + REEs + Ca = 2. Abbreviation: d.l. = below detection limit.
Table 9. Representative EPMA data for REE + Y (in ppm) for cryolite, chiolite, and fluorite from the albite-enriched granite (adapted from Bastos Neto et al. [28]; Minuzzi et al. [44]).
Cryolite ICryolite IIZoned CryoliteCaramel CryoliteChioliteDisseminated
Fluorite
Fluorite Veinlet
Crystal(1)(2)(3)(4)(5)(6)(7)(8)(9)(10)(11)(12)(13)
La (ppm)24.3742.8802.9602.0500.8901.0501.1000.8501.4600.88125.7667.8402.26
Ce37.1798.3404.1703.7801.6701.9902.6501.1703.5301.30471.41155.9506.40
Pr9.5521.7500.7000.5200.2800.2600.3400.1700.4700.2068.8835.2800.77
Nd31.5577.5603.4702.6802.0401.7501.9301.4902.6101.63234.83110.403.15
Sm17.1525.8501.2500.9300.7400.6000.6600.4400.9200.5093.4463.4301.00
Eu00.500.9300.0500.0300.0300.0300.0200.0200.0300.0201.6301.3800.03
Gd25.0539.8001.7100.9600.7600.4500.2500.1500.9300.15b.d.l.48.9802.06
Tb14.2322.4800.7400.3600.3300.2000.0900.0100.1900.0231.4916.6400.39
Dy145.67260.2006.9103.2903.0902.0700.7500.1401.1300.18254.08102.0903.12
Y188.83209.5534.3718.1200.8000.6000.2300.0300.1900.031209.77186.7134.81
Ho46.7589.1101.9700.9202.5102.1500.7700.1400.3900.0955.3318.3101.06
Er161.99316.6607.3704.7200.4500.4400.1500.0300.0400.01152.0341.3903.14
Tm27.5456.0101.6901.1202.7502.6901.0200.5000.5000.5023.8305.7400.51
Yb112.94246.2310.4407.1400.4500.5200.1700.0500.0200.00b.d.l.27.2504.29
Lu21.4447.532.0101.3817.4419.1803.1500.6301.8200.4714.1003.7100.39
REE + Y864.731554.8879.8148.0034.2333.9813.2805.8214.2305.982736.78885.163.38
LREE120.29267.3112.609.9905.6505.6806.7004.1409.0204.53995.95434.2813.61
HREE555.611078.0232.8419.8927.7827.7006.3501.6505.0201.42531.06264.1114.96
LREE/
HREE
00.2200.2500.3800.5000.2000.2101.0602.5101.8003.1901.8801.6400.91
Eu/Eu*00.0700.0900.0900.1100.1100.1600.1600.1800.1100.15n.c.00.0700.06
Ce/Ce*00.6200.7700.6700.8600.7900.9001.0400.7001.0200.7201.1900.7501.16
La/Yb00.2200.1700.2800.2901.9802.0206.4717.0073.00-1257.6002.4900.53
La/Sm01.4201.6602.3702.2001.2001.7501.6701.9301.5901.7601.3501.0702.26
La/Lu01.1400.9001.4701.4900.0500.0500.3501.3500.8001.8708.9218.2905.79
Gd/Yb00.2200.1600.1600.1301.6900.8701.4703.0046.50-01.0001.8000.48
Abbreviations: n.c. = not calculated.
Table 10. REE and Y contents, as well as LREE/(HREE + Y) and LREE/HREE ratios, in the border albite-enriched (BAG), core albite-enriched granite (CAG), pegmatite veins (PEG), pegmatitic CAG (GR PEG), and the massive cryolite deposit (MCD). The number of analyses is indicated in parentheses.
LREE2O3 ppmHREE2O3 ppmY2O3 ppmLREE/HREE + YLREE/HREE
Avg.Max.Avg.Max.Avg.Max.Avg.Max.Avg.Max.
BAG263.6 (53)5408.5188.6 (53)1439.71325 (174)8425.80.63 (53)1.781.14 (53)4.6
CAG480.0 (97)9791.5360 (97)3070.91335 (252)31,498.50.71 (97)6.941.25 (97)14.1
PEG843 (22)10,0802138 (22)70002664.8 (22)10,0000.14 (22)0.590.34 (22)1.4
GR PEG318.6 (22)9262184.9 (22)51492207.8 (22)71650.18 (22)0.630.30 (22)1.0
MCD159.9 (28)578.642.74 (28)298.651.3 (28)219.32.1 (28)7.875.51 (28)20.3
The averages for AEG (CAG + BAG) are 371.8 ppm LREE2O3, 274.3 ppm HREE2O3, 646.1 ppm TREE2O3, 1330 ppm Y2O3, and 1976.1 ppm TREE2O3 + Y2O3.
Table 11. Rare earth element mineralization in the Madeira deposit compared with major rock-hosted REE deposits worldwide. The table was compiled from the following sources: Teixeira and Botelho [111] b; Dostal et al. [112] c; Rooks et al. [113] d; Sheard et al. [104] e.
Deposit and LocationTectonic SettingOre Age (Ga)Deposit TypeHost Rock/Structure (Other Associated Rocks)REE-Bearing Ore Minerals (Other Minerals)Economic Parameters
Madeira, Pitinga, Amazonas, BrazilGuianas Shield, Amazonas craton1.82–1.79Zoned albite-enriched granite, small pegmatites Albite granite (alkali-feldspar granite and amphibole-biotite granite)Xenotime, gagarinite, thorite, zircon, LREE-rich pyrochlore, LREE-rich fluoride, HREE-Y-Th-U-rich silicates, columbite, cryolite, and fluorite (cassiterite)195 Mt at 371.8 ppm LREO, 274.3 ppm HREO, 1330 ppm Y (385 kt TREO + Y) a
Serra Dourada, Goiás, BrazilBrasil Central Shield, São Francisco craton1.70–1.60Granites and granitic pegmatitesBiotite granite (ortognaisse, porfirytic granite veins)Alanite, apatite, bastnaesite, fluocerite, monazite, xenotime, and zircon412 Mt at 1600 ppm TREO + Y (659 kt TREO + Y) b
Bokan Mountain, Southeast AlaskaAlexander terrane, western Canadian Cordillera0.15Granites and granitic pegmatitesAegirine granite, pipes, veins and dykes (riebeckite granite and aegirine syenite)Xenotime, fergusonite, monazite, bastnäesite, synchysite, zircon, immoriite, and kainosite (thorite, uraninite, coffinite)5.22 Mt at 3940 ppm LREO, 2590 ppm HREO (34 kt TREO) c
Motzfeldt, Aries, GreenlandGardar intracratonic rifting Province1.27Alkaline rock-hostedPegmatitic and aplitic syenite (quartzite, basalt)Fluorcalciopyrochlore, REE–fluorcarbonates (columbite)340 Mt at 2600 ppm TREO + Y (884 kt TREO + Y) d
Thor Lake, Nechalacho Tardiff, CanadaSlave Province, Canadian Shield2.1Alkaline rock-hostedNepheline syenitesZircon, eudialyte, fergusonite, allanite, synchysite, and bastnäesite121 Mt at 2.500 ppm HREO, 15,000 ppm TREO (1.8 Mt TREO) e
a This study; b cut-off at 0.1% (Mineração Serra Verde, 2014, apud [8]); c cut-off at 0.4% TREO [114]; d [115]; e cut-off at US$320/t (rare earths + rare metals) [116].
Disclaimer/Publisher’s Note: The statements, opinions and data contained in all publications are solely those of the individual author(s) and contributor(s) and not of MDPI and/or the editor(s). MDPI and/or the editor(s) disclaim responsibility for any injury to people or property resulting from any ideas, methods, instructions or products referred to in the content.