Article

Deciphering Middle–Late Eocene Paleoenvironmental Conditions Using Geochemical Trends: Insights from the Beni Suef Area, Northeastern Desert, Egypt


1
Department of Geology, Faculty of Earth Sciences, Geography and Astronomy, University of Vienna, 1090 Vienna, Austria
2
Department of Palaeontology, Faculty of Earth Sciences, Geography and Astronomy, University of Vienna, 1090 Vienna, Austria
3
Geology Department, Faculty of Science, Beni-Suef University, Beni-Suef 62511, Egypt
4
Faculty of Earth Science, Beni-Suef University, Beni-Suef 62511, Egypt
5
Geology Department, Faculty of Science, Cairo University, Cairo 12613, Egypt
6
Geology Department, Faculty of Science, Minia University, Minia 61519, Egypt
7
Marine Geology Department, Faculty of Marine Science, King Abdulaziz University, P.O. Box 80200, Jeddah 21589, Saudi Arabia
*
Author to whom correspondence should be addressed.
Minerals 2026, 16(4), 361; https://doi.org/10.3390/min16040361
Submission received: 15 January 2026 / Revised: 16 March 2026 / Accepted: 25 March 2026 / Published: 29 March 2026
(This article belongs to the Section Environmental Mineralogy and Biogeochemistry)

Abstract

The reconstruction of detrital flux, paleoclimate, paleosalinity, paleo-primary productivity, paleohydrodynamic conditions, and paleo-water depth enhances understanding of sedimentary processes and their drivers during deep-time greenhouse-icehouse transitions, such as the Eocene–Oligocene transition. This study uses detailed geochemical analyses of major oxides and trace elements in sediment samples collected from the Beni Suef Formation (Bartonian–Priabonian) and the Maadi Formation (Priabonian) in the southern Tethys shelf (Egypt, northeastern Desert). Detrital proxies, including Si/Al, Ti/Al, and Zr/Al, indicate an enhanced influx of terrigenous sediments in the middle portion of the Qurn Member of the Beni Suef Formation, as further supported by noticeable facies variations, particularly the transition from shale to coarser silt- and sand-sized fractions. Paleoclimate indicators (Sr/Ba, Rb/Sr, K2O/Al2O3, and Sr/Cu) point to a climatic shift from humid to arid conditions, consistent with the regional Late Eocene aridification across the Tethyan realm. Paleosalinity proxies (Sr/Ba, Ca/Al, and Mg/Al×100) suggest episodic intensification of open-marine influence and a reduction in freshwater input, with an upsection increase in Sr/Ba ratios, reflecting phases of enhanced marine water settings or decreased terrestrial runoff. Primary productivity was evaluated using multiple geochemical proxies, including P, Ni/Al, Cu/Al, P/Al, P/Ti, and Babio ratios. These collectively indicate generally low primary productivity interrupted by intervals of enhanced paleoproductivity or increased organic matter export to the sediments. This interpretation is further supported by the low total organic carbon (TOC) values. These results highlight the sensitivity of the southern Tethys shelf to Middle–Late Eocene climatic variability and the key role of prevailing paleoenvironmental conditions in controlling sediment supply, water chemistry, and biological productivity.

1. Introduction

The Late Eocene represents a critical interval of global climatic and oceanographic transitions, recording the final stages of the long-term Cenozoic cooling trend that culminated in the establishment of permanent Antarctic glaciation near the Eocene–Oligocene boundary (ca. 33.9 Ma) [1,2,3]. This period was characterized by significant paleoceanographic reorganization, including a major decline in atmospheric CO2 concentrations, progressive cooling of sea-surface temperatures, and enhanced oceanic circulation that redistributed nutrients and oxygen within the global ocean [4,5,6]. These changes triggered a fundamental shift from a greenhouse to an icehouse climate mode, influencing global paleoproductivity, organic carbon burial, and marine geochemistry [7,8,9]. Within the Tethys realm, the Eocene sediments are represented by widespread shallow- to open-marine carbonate and marl sequences that preserve excellent archives of these global paleoenvironmental shifts [10,11,12,13,14]. The closing of the eastern Tethys seaway and restriction of the western Tethys–Atlantic gateway influenced regional circulation patterns, promoting the development of stratified water columns and localized upwelling systems [15]. These processes enhanced primary productivity and modulated redox conditions, as recorded by variations in carbonate content, organic matter enrichment, and redox-sensitive trace elements such as V, Ni, Cr, and Mo [16,17]. In the eastern Mediterranean and North African sectors of the southern Tethys, such as in Egypt, Tunisia, and Libya, the Eocene depositional settings were largely shaped by these evolving oceanographic gradients, fluctuating paleosalinity, and varying terrigenous sediment supply linked to climatic oscillations and regional tectonics [10,12,18,19,20,21,22].
In Egypt, the Eocene successions are extensively developed in both the northern and central parts of the country, represented by several formations, including the Beni Suef and Maadi formations in northern Egypt [23,24,25], and the El Fashn, Beni Suef, and Maadi formations in the Beni Suef district [20,21,26]. Meanwhile, the Gehannam, Birket Qarun, and Qasr El-Sagha formations are represented in the Fayum Depression [10,11,27]. These formations were deposited under predominantly shallow-marine, neritic to hemipelagic conditions at the southern Tethys margin [23,26,28,29], reflecting the interplay between carbonate productivity and detrital input. Geochemical investigations have demonstrated that variations in major, trace, and rare earth elements (REEs), as well as total organic carbon (TOC), can be used to reconstruct redox fluctuations, paleoproductivity levels, and paleoclimate oscillations during the deposition of these strata [11,21,30,31]. Elevated ratios of Al-normalized elements (e.g., Ti/Al, Zr/Al, and Fe/Al) are indicative of detrital fluxes derived from continental weathering [32]. In contrast, enrichment in redox-sensitive trace metals (e.g., V/Cr, Ni/Co, Cu/Zn) reflects oxygen-depleted conditions [16,17] and enhanced organic matter preservation [16,33]. Eocene exposures in northern Egypt have been the focus of numerous studies that primarily addressed stratigraphy, geochemistry, and paleontology. More recently, Sayed et al. [11,21] investigated the paleoenvironmental and paleoclimatic conditions of the Eocene successions exposed along the eastern and western sides of the Nile Valley, respectively, based on integrated geochemical and micropaleontological analyses. Their results indicated that the deposition occurred across a range of depositional settings, transitioning from lowly–moderately oxygenated middle–outer neritic environments to well-oxygenated inner neritic shallow marine agitated settings, under warm and predominantly arid climatic conditions, punctuated by minor humid intervals.
The Middle to Upper Eocene of Egypt represents a significant interval for reconstructing and evaluating the interaction between Tethyan marine productivity, continental weathering on Africa, and the regional climate evolution within the southern Tethys [11,21]. The Eocene strata exposed in the study area have attracted comparatively little research attention, as investigations to date have largely been confined to detailed stratigraphic and paleontological analyses. Sayed et al. [20] examined ostracod assemblages to infer the paleoenvironmental conditions that prevailed during the deposition of the Middle and Upper Eocene sediments in the Beni Suef region. They established three ostracod biozones and correlated them with the standard planktonic foraminiferal zones, Morozovelloides crassatus, Globigerinatheka semiinvoluta, and Globigerinatheka index. Similarly, Salama et al. [25] recognized three standard planktonic foraminiferal biozones: E13. Morozovelloides crassatus Zone (Bartonian), E14. Globigerinatheka semiinvoluta Zone (late Bartonian–early Priabonian), and E15. Globigerinatheka index Zone (Priabonian). They assigned the Middle–Upper Eocene boundary to the Globigerinatheka semiinvoluta Zone. Despite these several biostratigraphic and sedimentological investigations, comprehensive integrated geochemical studies of well-dated Middle–Upper Eocene sequences, particularly those aimed at detailed paleoenvironmental and paleoclimatic reconstruction, remain limited.
Based on the integrated geochemical dataset and the paleoenvironmental context of the southern Tethys during the Middle–Late Eocene, this study tests the hypothesis that regional climatic fluctuations and relative sea-level changes significantly controlled sediment supply, water chemistry, and biological productivity in the shallow-marine environments of northern Egypt. Specifically, it is hypothesized that variations in detrital input, paleosalinity, redox conditions, and primary productivity recorded in the Beni Suef and Maadi formations reflect climate-driven shifts in continental weathering intensity, marine circulation, and freshwater influx during the transition from the Middle to the Late Eocene. It is noteworthy that testing these relationships allows the study to determine whether the observed geochemical trends correspond to climate-driven environmental variability across the Middle–Late Eocene interval in the southern Tethys, thereby providing insight into how regional marine systems responded to broader climatic transitions during the late stages of the Eocene greenhouse world.
Accordingly, the present study seeks to (1) evaluate the vertical distribution of selected geochemical indicators reflecting terrigenous input, paleosalinity, and redox conditions; (2) assess the relationship between primary productivity and organic matter preservation; and (3) provide a comprehensive understanding of the paleoenvironments and paleoclimatic conditions of the Middle to the Late Eocene succession in Egypt within the broader southern Tethyan context.

2. Geologic Setting and Stratigraphy

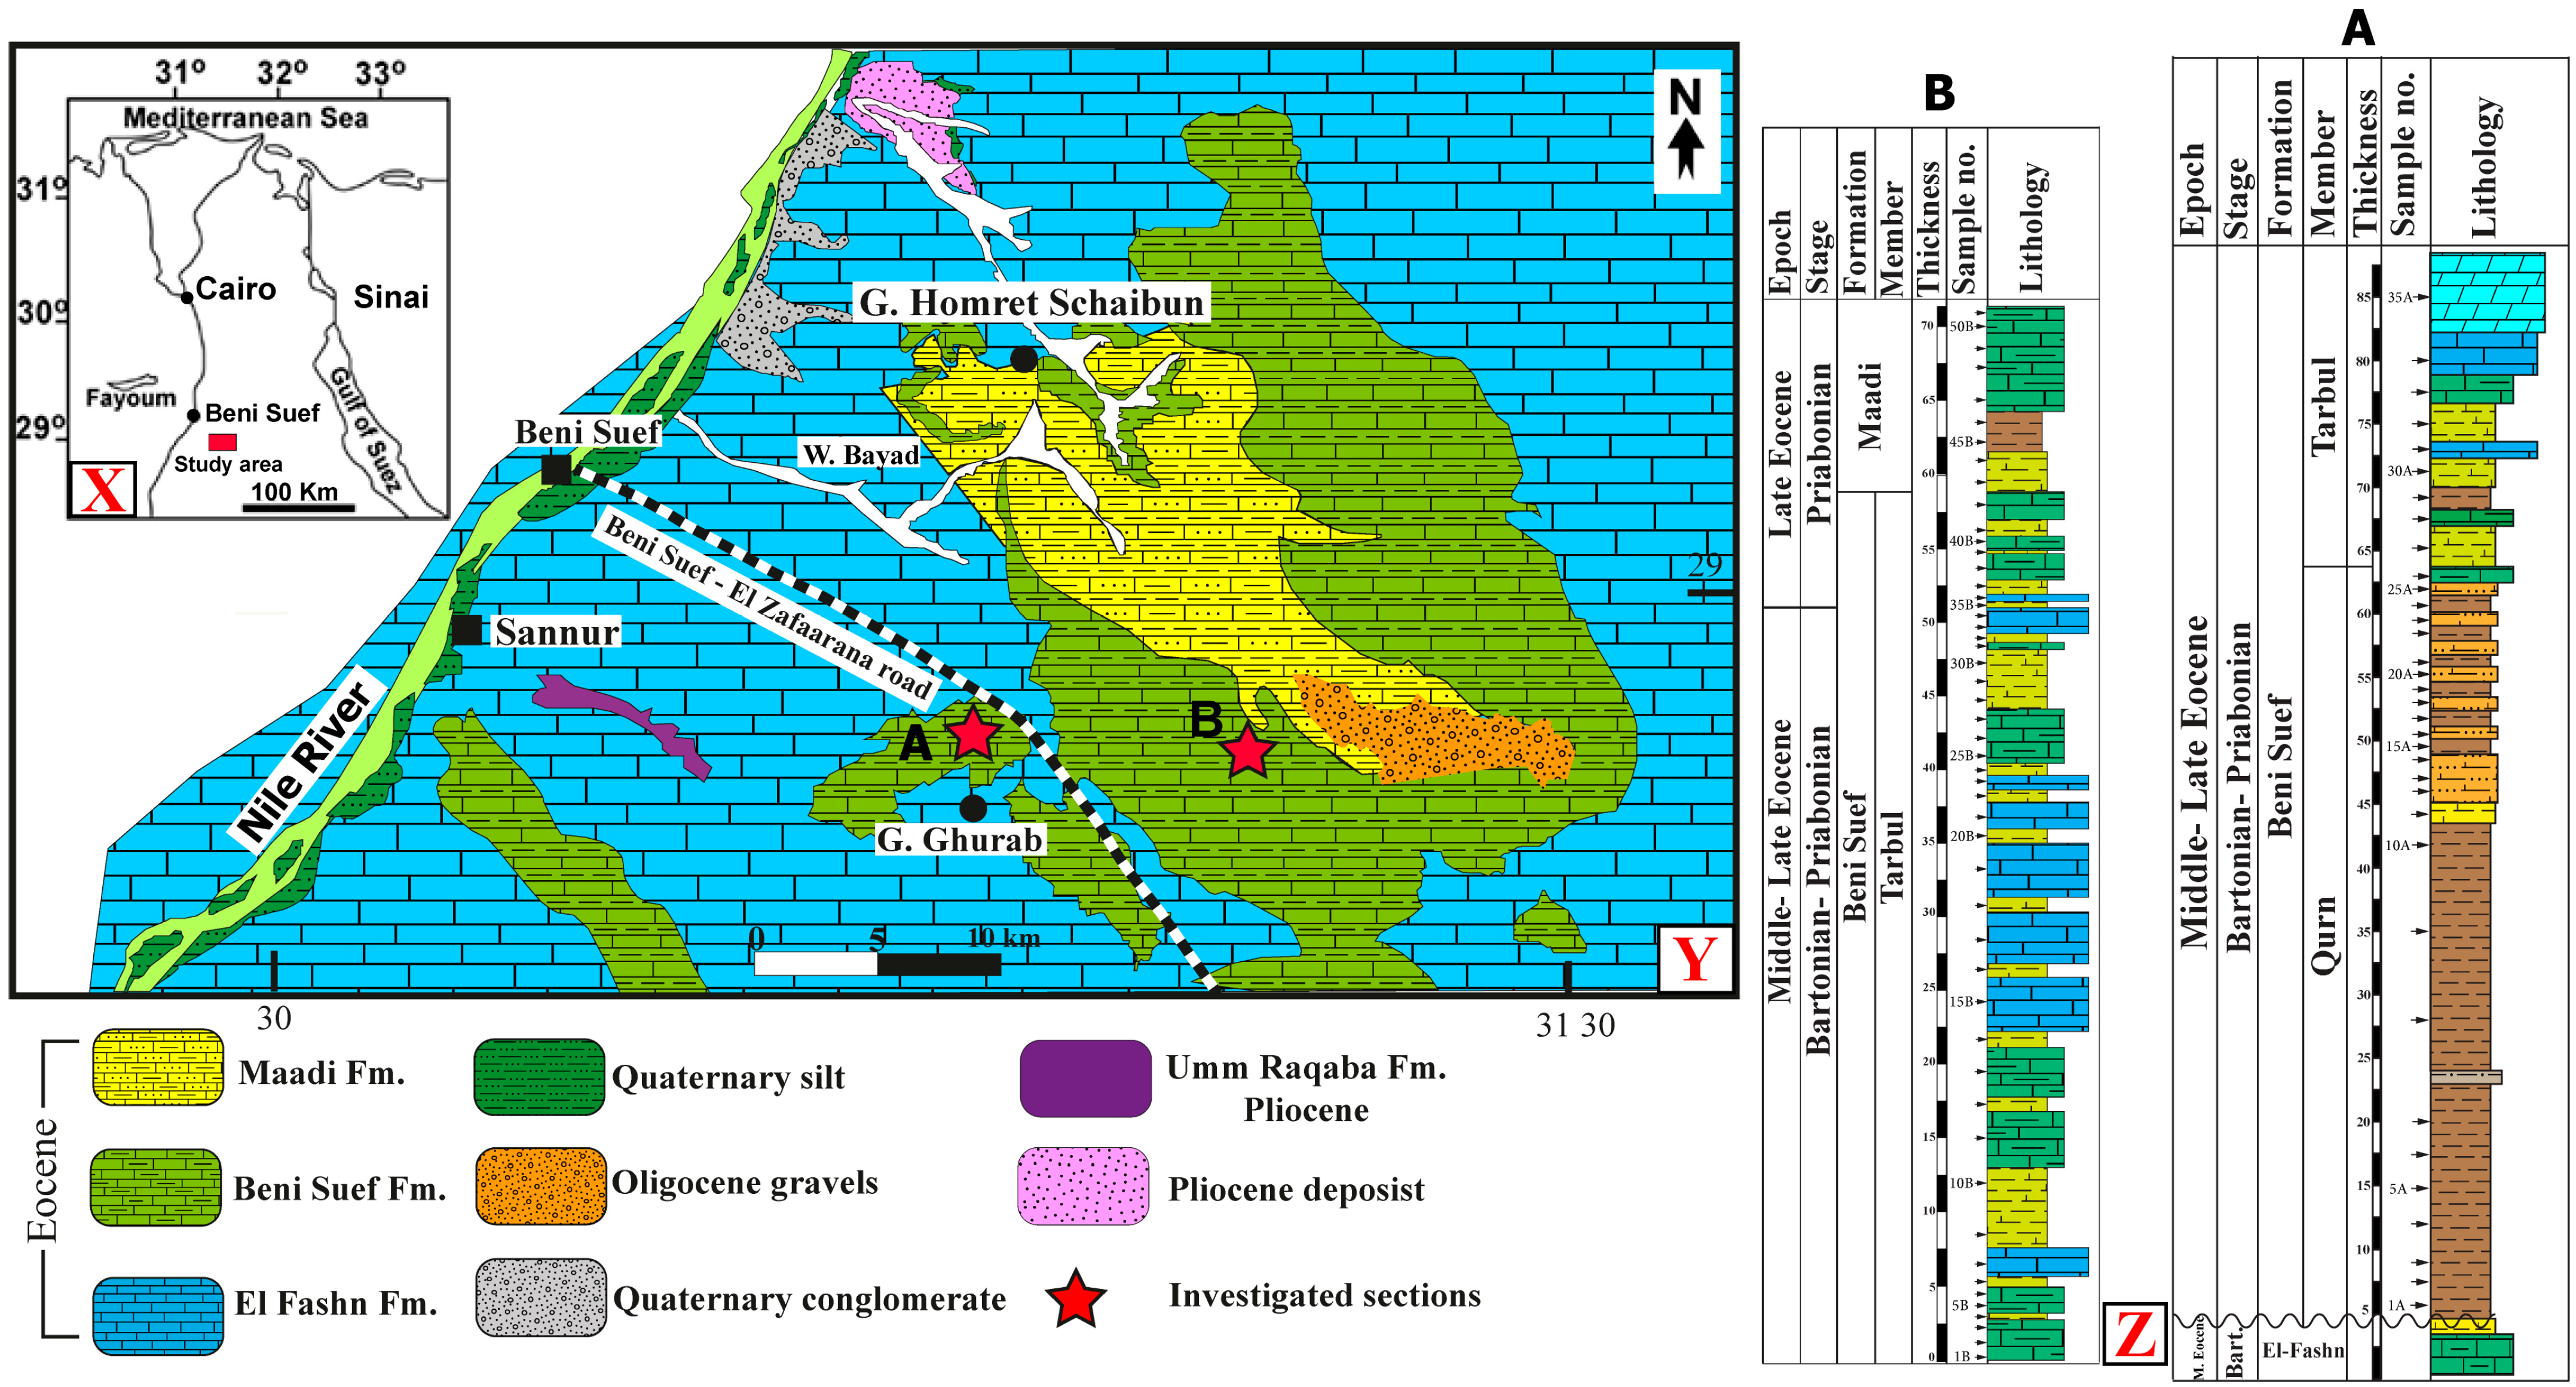
The study area is situated on the eastern side of the Nile Valley, particularly in East Beni Suef City, and in the northeastern Desert, comprising two sections, namely A and B (Figure 1). These outcrops are located between latitudes 28°58′31.7″ E and 28°57′35″ N, and lie between longitudes 31°16′36.4″ E and 31°22′53.1″ E. The studied successions include, from older to younger, the Beni Suef Formation (Middle-Upper Eocene) and the Maadi Formation (Upper Eocene) (see Figure 1).

2.1. The Beni Suef Formation (Bartonian-Priabonian)

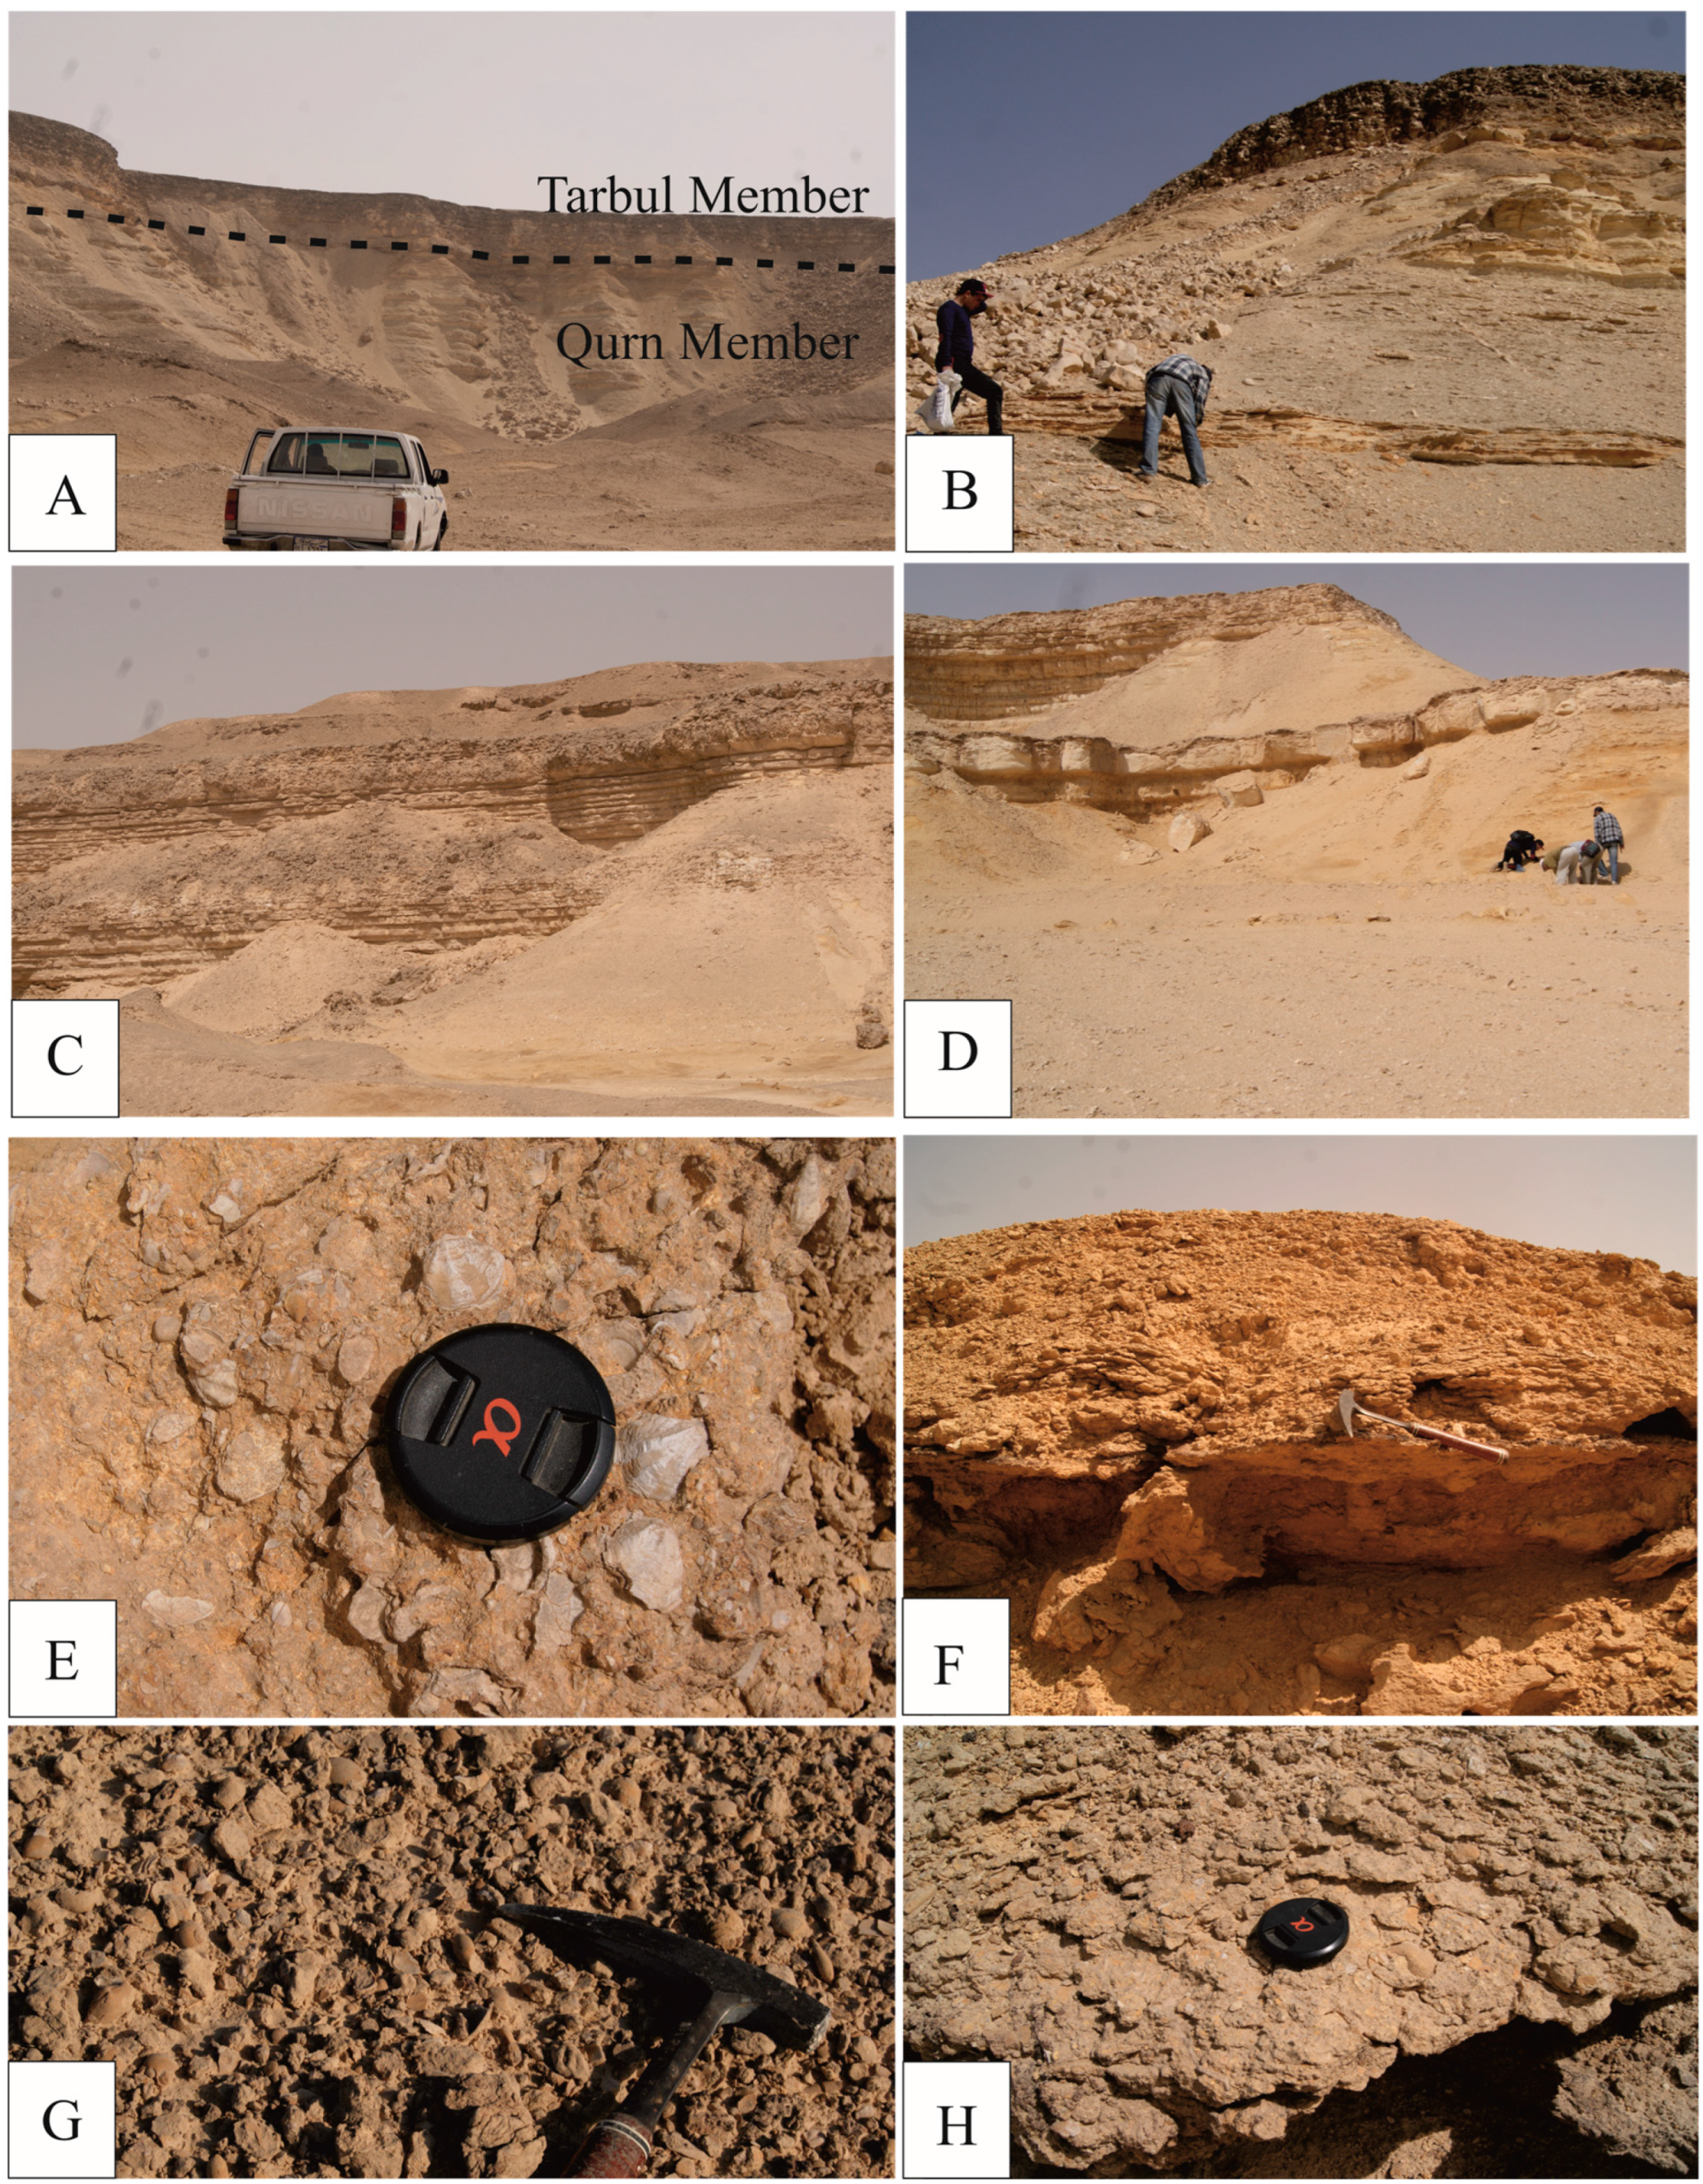
Bishay [34] described the Beni Suef Formation as a sedimentary sequence at Gebel Homret Schaibon, overlying the El Fashn Formation and capped by the Maadi Formation. Afterwards, this formation was subdivided into two members, named in ascending order as the Qurn Member and the Tarbul Member [35]. In the study area, the Beni Suef Formation is well exposed in both investigated sections A and B, and is differentiated into two members. In section A, the lower and middle intervals correspond to the Qurn Member, which attains a thickness of approximately 54 m and consists predominantly of shale, silty shale, and marl (Figure 2A,B). The upper part is assigned to the Tarbul Member, measuring about 24 m in thickness. It is composed mainly of marly limestone, shale, and marl, including thalassinoid-bearing limestones overlain by dolomitic limestone.
In Section B, the Beni Suef Formation is represented exclusively by the Tarbul Member, which occupies most of the succession and reaches a total thickness of 63 m. Its lower part (8 m thick) consists of fossiliferous marl and marly limestone (Figure 2C,D). These beds are characterized by abundant macrofossils, particularly bivalves and gastropods, in association with benthic foraminifera and ostracods (Figure 2E), reflecting favourable shallow-marine depositional conditions. The middle part of the Tarbul Member is approximately 25 m thick and comprises alternating yellow marl and yellowish, hard marly limestone. The upper part, reaching 38 m in thickness, consists of marl and white to yellowish-white limestone and exhibits a noticeably lower faunal abundance compared to the underlying intervals, suggesting possible environmental shifts during deposition.
Biostratigraphically, this rock unit has been assigned to the Globigerinatheka semiinvoluta (E14) and Globigerinatheka index (E15) planktonic foraminiferal zones, previously recorded from the Beni Suef Formation [25]. The occurrence of these standard biozones, supported by characteristic benthic foraminifera and ostracod assemblages, indicates a late Middle to Late Eocene age [20,24].

2.2. The Maadi Formation (Priabonian)

The topmost part of section B is represented by the lower part of the Maadi Formation (Figure 2F), a lithostratigraphic unit introduced by Said [36] for the upper Mokattam of Zittel [37]. The type locality of this rock unit is located east of the Maadi area, comprising 70 m of shales, limestones, sandstones, and topped by dolomite. In the present study, the studied part of the Maadi Formation is 14 m thick and made up of greyish to greenish shales, marly limestone, and yellow marls. This interval is dominated by large benthic foraminifera (Nummulites spp.), macrofossils including pelecypods, gastropods, echinoids, and corals (Figure 2G,H). It is also accompanied by distinctive representation of shallow water-depth and high oxygen benthic foraminifera and ostracod assemblages, reflecting a shallow, inner-neritic depositional setting with well-oxygenated waters [38]. Planktonic foraminifera are completely absent, consistent with deposition in relatively shallow marine settings. The Maadi Formation is assigned to a Late Eocene age based on its stratigraphic position above the Middle-Late Eocene Beni Suef Formation, and the presence of the index fossil Carolia placunoides [20,24,25].

3. Materials and Methods

A total of 86 shale, marl, marly limestone, and limestone samples were collected from two Eocene surface sections at intervals ranging from 30 cm to 2 m. Total organic carbon (TOC) was measured on ~100 mg of powdered sample using a LECO RC612 carbon analyzer at 1100 °C with an analytical precision of ±0.1 wt% at the Microbiology and Environmental Systems Science Center, University of Vienna, Austria. Carbonate content was determined using a FOGII digital soil calcimeter (Thessaloniki, Greece) after reaction with 6 N HCl.
Major oxides (SiO2, Al2O3, MgO, CaO, MnO, K2O, Fe2O3, P2O5, TiO2, Cr2O3) and trace elements (Ni, Zn, Zr, Cu, Ba, Rb, Sr, Pb) were analyzed using a Bruker AXS TRACER IV-SD handheld energy-dispersive X-ray fluorescence (XRF) spectrometer (Karlsruhe, Germany). Powdered samples were measured under dual excitation energies for major and trace elements. The analytical precision ranged between 0.5% and 2%, with detection limits of ~2 ppm for trace elements. Calibration was performed using proprietary Bruker standards, and analytical quality was monitored through duplicates, blanks, and internal standards. For mixed carbonate–siliciclastic samples, analyses were performed on the insoluble residue after acid digestion to minimize potential diagenetic effects.
The enrichment of redox-sensitive elements was assessed through the calculation of the enrichment factor (EF), using average shale as a reference, as established by Wedepohl [39]. The enrichment factor is defined by the following equation: EF = (X/Al) samples/(X/Al) average shale. Redox-sensitive elements can be categorized based on their enrichment factor (EF) values: strongly enriched (EF > 10), significantly enriched (EF = 5–10), enriched (EF = 2–5), weakly enriched (EF = 1–2), depleted (EF = 0.5–1), and significantly depleted (EF < 0.5) [16,40].
Several trace elements and major oxides, including Sr/Ba, Rb/Sr, K2O/Al2O3, and Sr/Cu, were utilized for reconstruction of the prevailing paleoclimate, paleosalinity, redox conditions, and productivity [11,21,41,42,43,44,45,46]. In particular, elevated K2O/Al2O3 ratios (>0.2) suggest cold and dry climatic settings, while low K2O/Al2O3 ratios (<0.2) reflect warm and humid conditions [11,47]. In addition, high Sr/Cu ratios (>5) are indicative of hot and arid climatic conditions, whereas low ratios (from 1.3 to 5.0) reflect warm and humid environments [48,49]. Similarly, a high Sr/Ba ratio (>1) indicates arid climatic conditions, whilst a low ratio (<1) is characteristic of humid environments [50]. The Rb/Sr ratio is largely influenced by climate, with higher values (>0.5) corresponding to humid climatic conditions, and lower values (<0.5) pointing towards arid settings [51].
Paleosalinity can be reconstructed using ratios of major and trace elements, such as Sr/Ba, Ca/Al, and Mg/Al × 100. Strontium concentrations generally increase with rising salinity and water depth, reflecting marine influence, whereas Ba enrichment commonly indicates continental or freshwater input [51,52]. In marginal-marine environments, Sr is mainly associated with biogenic carbonates, whereas Ba may precipitate as barite under sulphate-rich, low-salinity, or reducing conditions [53,54]. It is notable that Sr/Ba ratios > 0.5 typically indicate marine conditions, values between 0.5 and 0.2 reflect freshwater deposition, and ratios < 0.2 suggest terrestrial environments [43]. Similarly, Mg/Al × 100 values < 1 indicate freshwater conditions, 1–10 brackish conditions, and >10 marine conditions [11]. High Ca/Al ratios are also characteristic of marine settings, whereas lower values reflect freshwater influence, whereas variations in Mg/Al may indicate changes in Mg-bearing carbonate production [30,55]. Together with lithological and fossil evidence, these geochemical characteristics are often linked to relative sea-level rises that supported carbonate production across Tethyan shelves and reduced clastic input [23].
We used the Mn/Fe elemental ratio as a proxy for bottom-water redox conditions, with higher Mn/Fe values indicating more oxic conditions and lower values reflecting oxygen-depleted environments. Variations in this ratio may therefore record sea-level fluctuations and associated environmental changes, including water-mass ventilation and organic matter input [19,20,56].
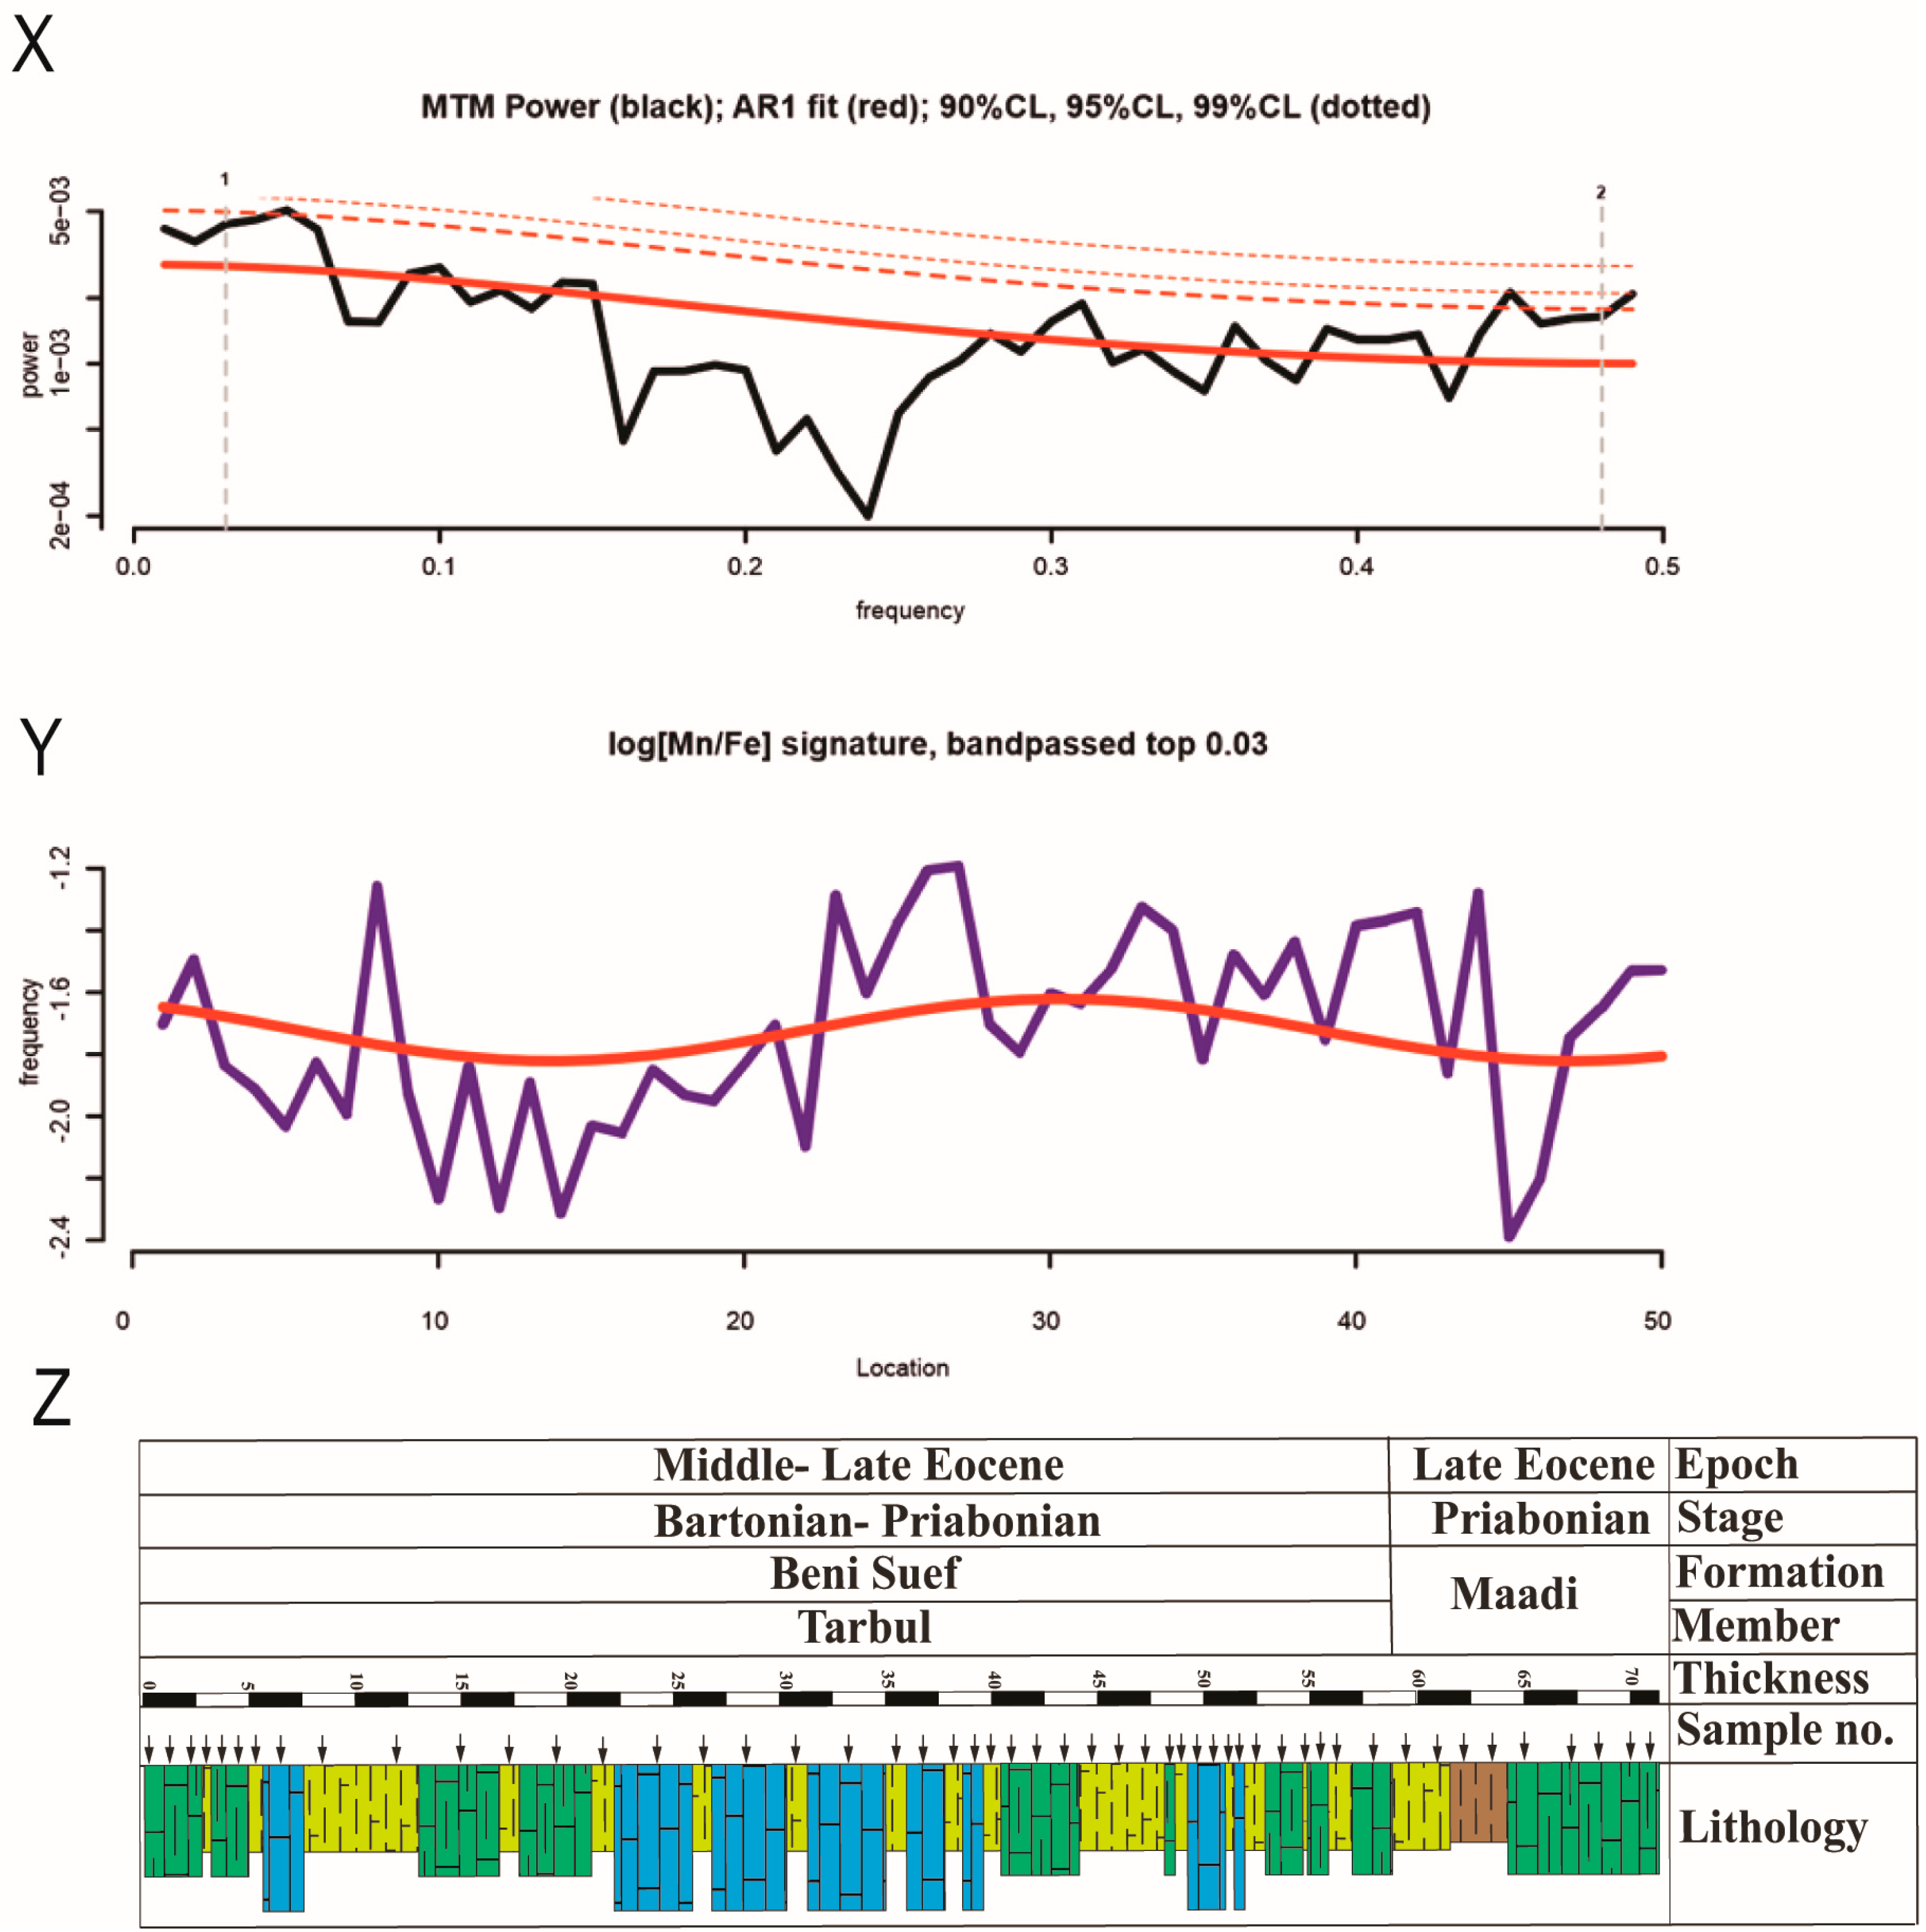
The logarithmic Mn/Fe ratio was analyzed in sections A and B to detect harmonic frequencies potentially linked to orbital (astrochronological) forcing of sea-level change. Spectral analysis was performed using the Astrochron package in R (version 2025.09.2+418, R Core Team, Vienna, Austria, 2025) [57]. Multitaper method (MTM) analysis of log (Mn/Fe) data from section B identified dominant spectral peaks, which were further visualized using band-pass filtering. Rather than constructing a formal astrochronological timescale, the analysis aimed to identify underlying mechanisms controlling Mn/Fe variability and to relate this proxy to shifts between marine and non-marine influences. The inferred astronomical component is constrained by estimated durations derived from the total thickness of the studied section. High Mn values are tied to oxygen availability, as Mn is tentatively removed from sediments under anoxic or suboxic conditions [52]. We interpret intervals of high Mn/Fe ratios as periods of improved bottom water circulation (and thus oxygenation). Rising sea levels, together with increased ventilation, could be a factor in this behaviour reflected in the Mn/Fe signature.
Several geochemical proxies, including P, Ni/Al, Cu/Al, P/Al, P/Ti, and Ba/Al ratios, are widely used to reconstruct paleoproductivity. Phosphorus is a key nutrient controlling primary productivity, and its sedimentary concentration is commonly linked to organic matter input during periods of high productivity [58,59,60,61]. Moreover, Porg and Babio are particularly reliable proxies, as their fluxes reflect microbial activity and organic matter production under suitable preservation conditions [62,63,64]. The organic phosphorus flux (Porg) is determined using the following equation:
Porg = [Ptotal] − [Al] × [P/Al]det
(P/Al)det ratio of 0.0087 is employed, corresponding to the average P and Al values of the upper continental crust [53]. Conversely, Babio, representing the non-detrital component of total barium, is calculated as follows:
Babio = [Batotal] − [Al] × [Ba/Al]det
Similarly, Babio is derived by removing the detrital fraction of barium using a (Ba/Al)det ratio of 0.0075 [65,66,67]. High Babio values (1000–5000 ppm) indicate elevated primary productivity, whereas negative values suggest a dominantly detrital barium source [57,68]. Additionally, Ni and Cu, due to their strong association with organic matter, and Ba/Al ratios can also serve as useful indicators of paleoproductivity across different redox conditions [62,67,69,70,71].
Bulk mineralogy of 33 samples was determined by X-ray diffraction (XRD) using a Panalytical PW 3040/60 X’Pert PRO diffractometer (Almelo, Netherlands) with CuKα radiation (40 kV, 40 mA). Clay mineralogy was analyzed for two mudstone samples by separating the <2 µm fraction after removal of organic matter and ultrasonic dispersion. Oriented mounts were subjected to ethylene glycol and heating treatments to identify clay minerals following standard procedures [72,73]. All XRD and XRF analyses were conducted at the Department of Geology, University of Vienna.

4. Results

4.1. Bulk and Clay Mineralogy

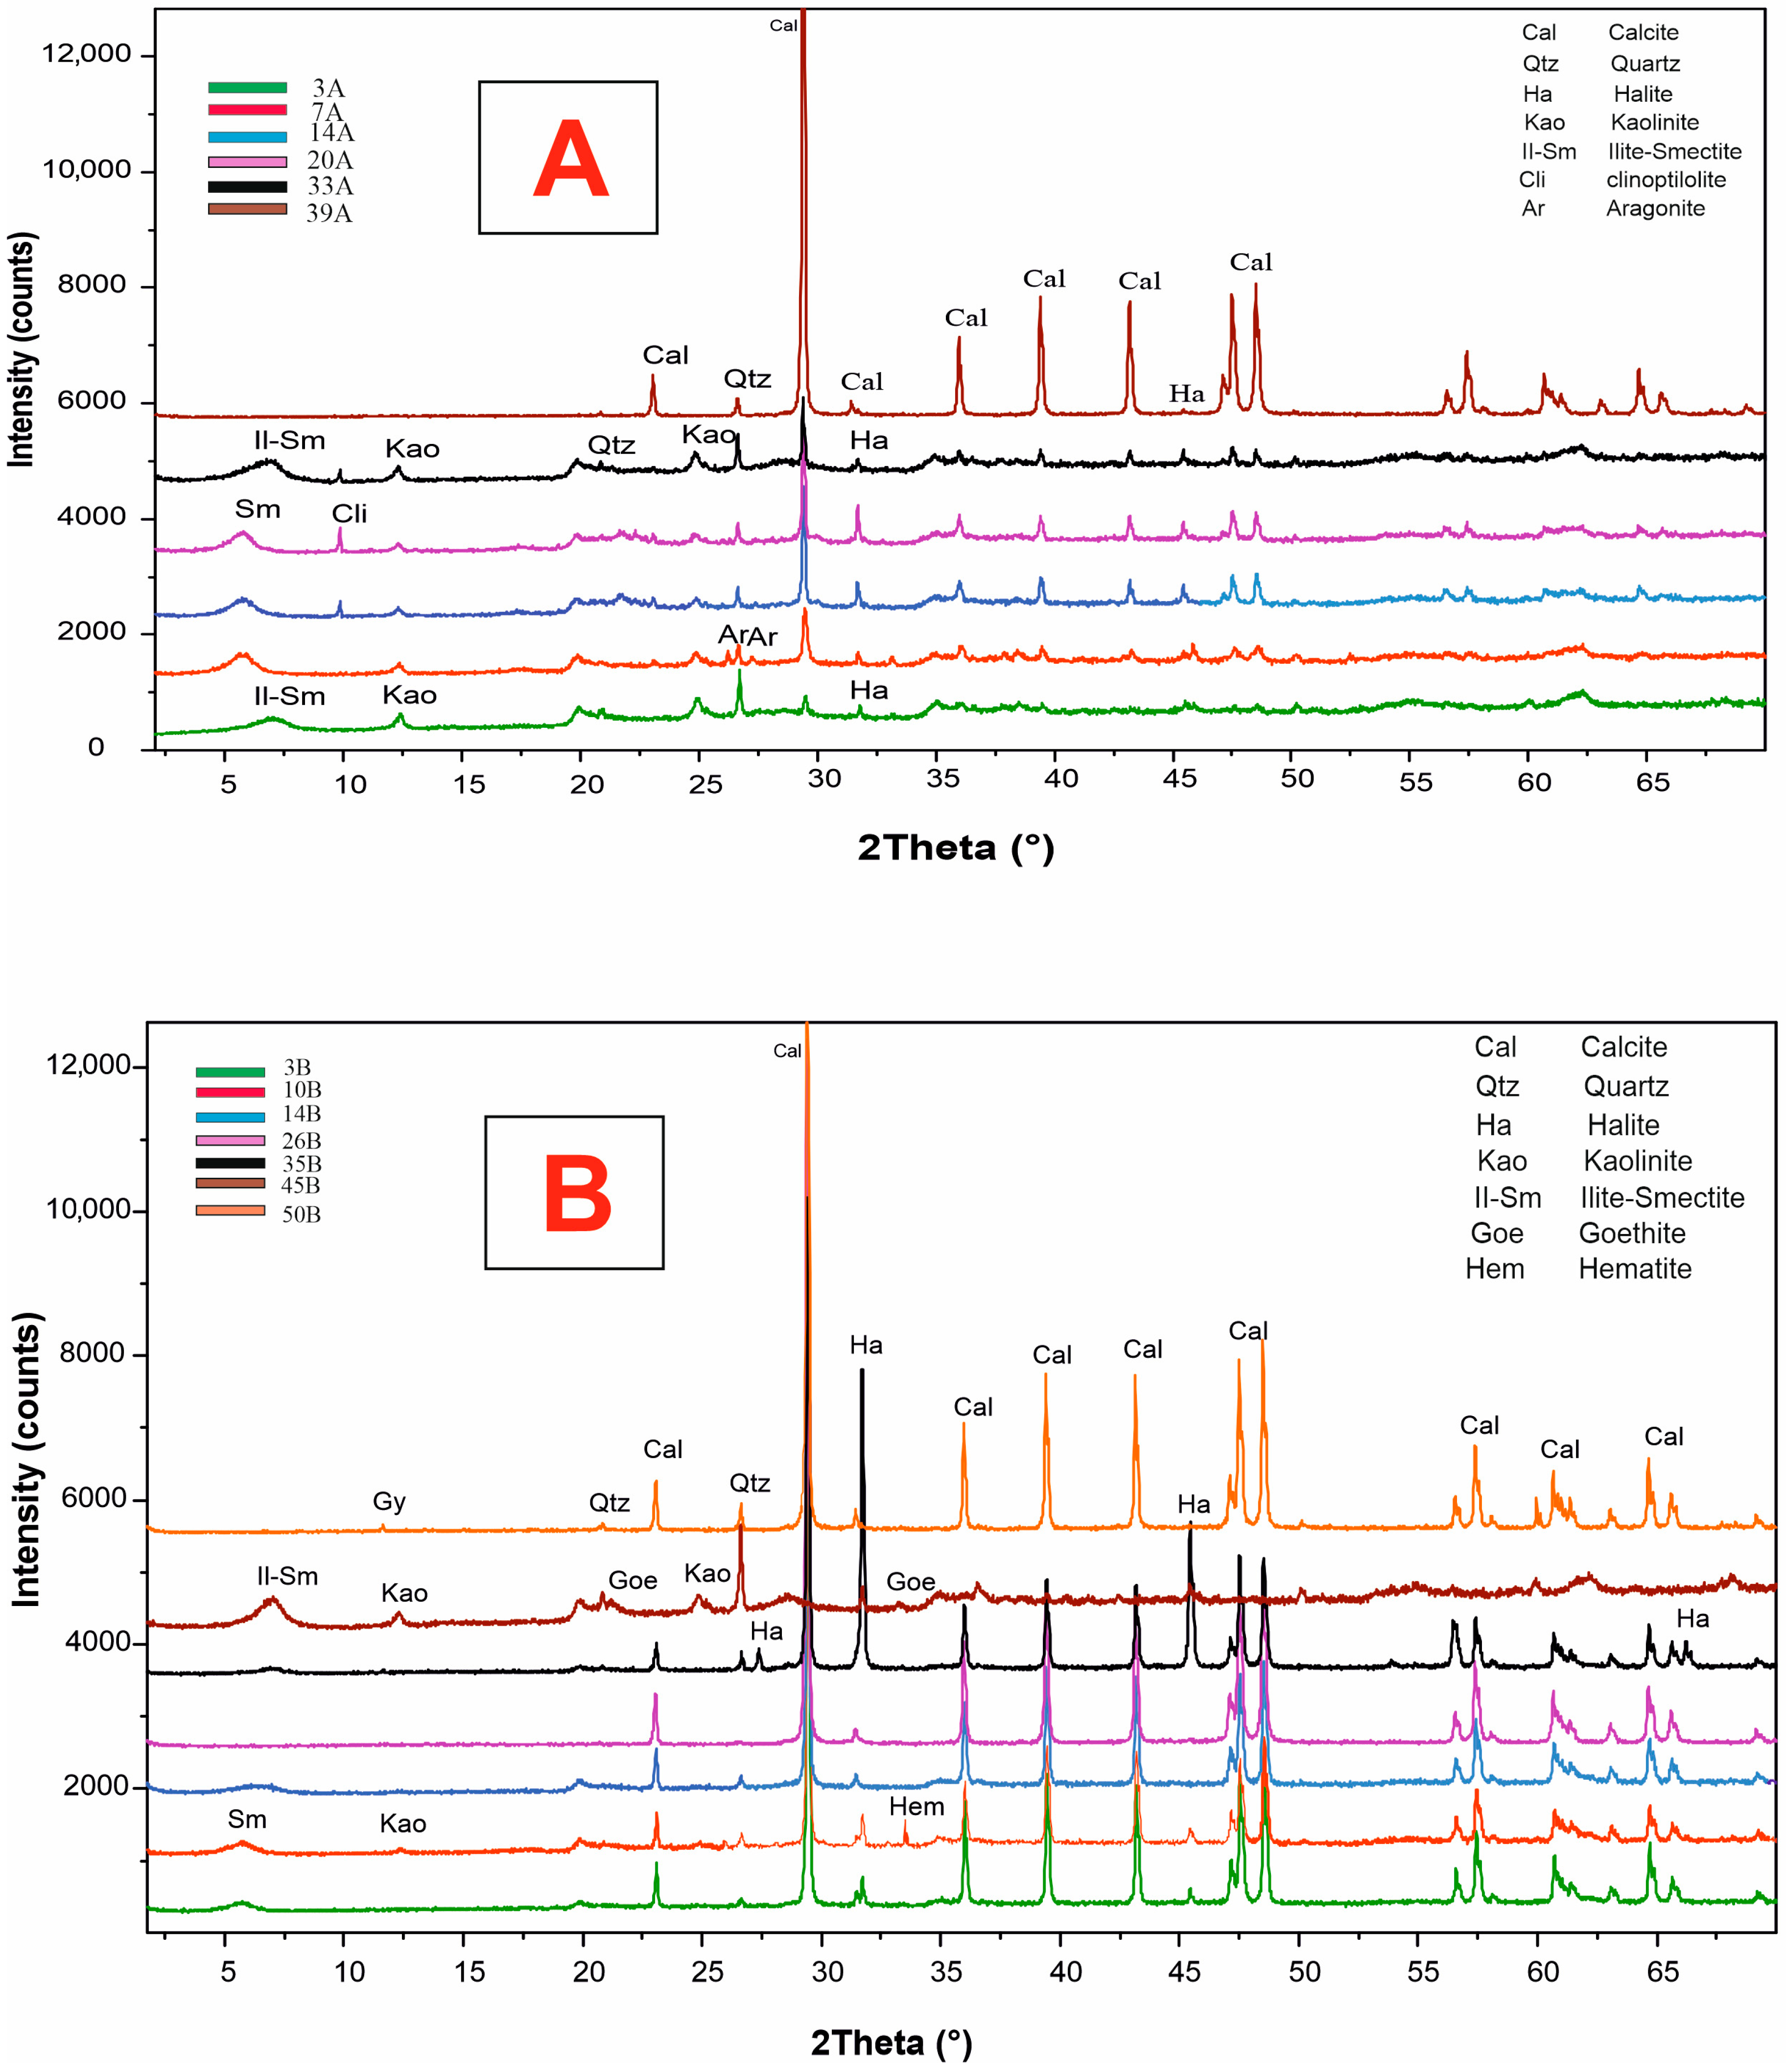
X-ray diffraction (XRD) analyses reveal that calcite is the dominant mineral in both A and B samples (primary peak at 3.03 Å). Quartz is consistently present across all samples (primary peak at 3.34 Å) (Figure 3). Additional minerals have been identified, including halite, gypsum (sample 50B), aragonite (sample 7A), clinoptilolite (samples 14A, 20A, 33A), goethite (sample 45B), and hematite (sample 10B), Figure 3.
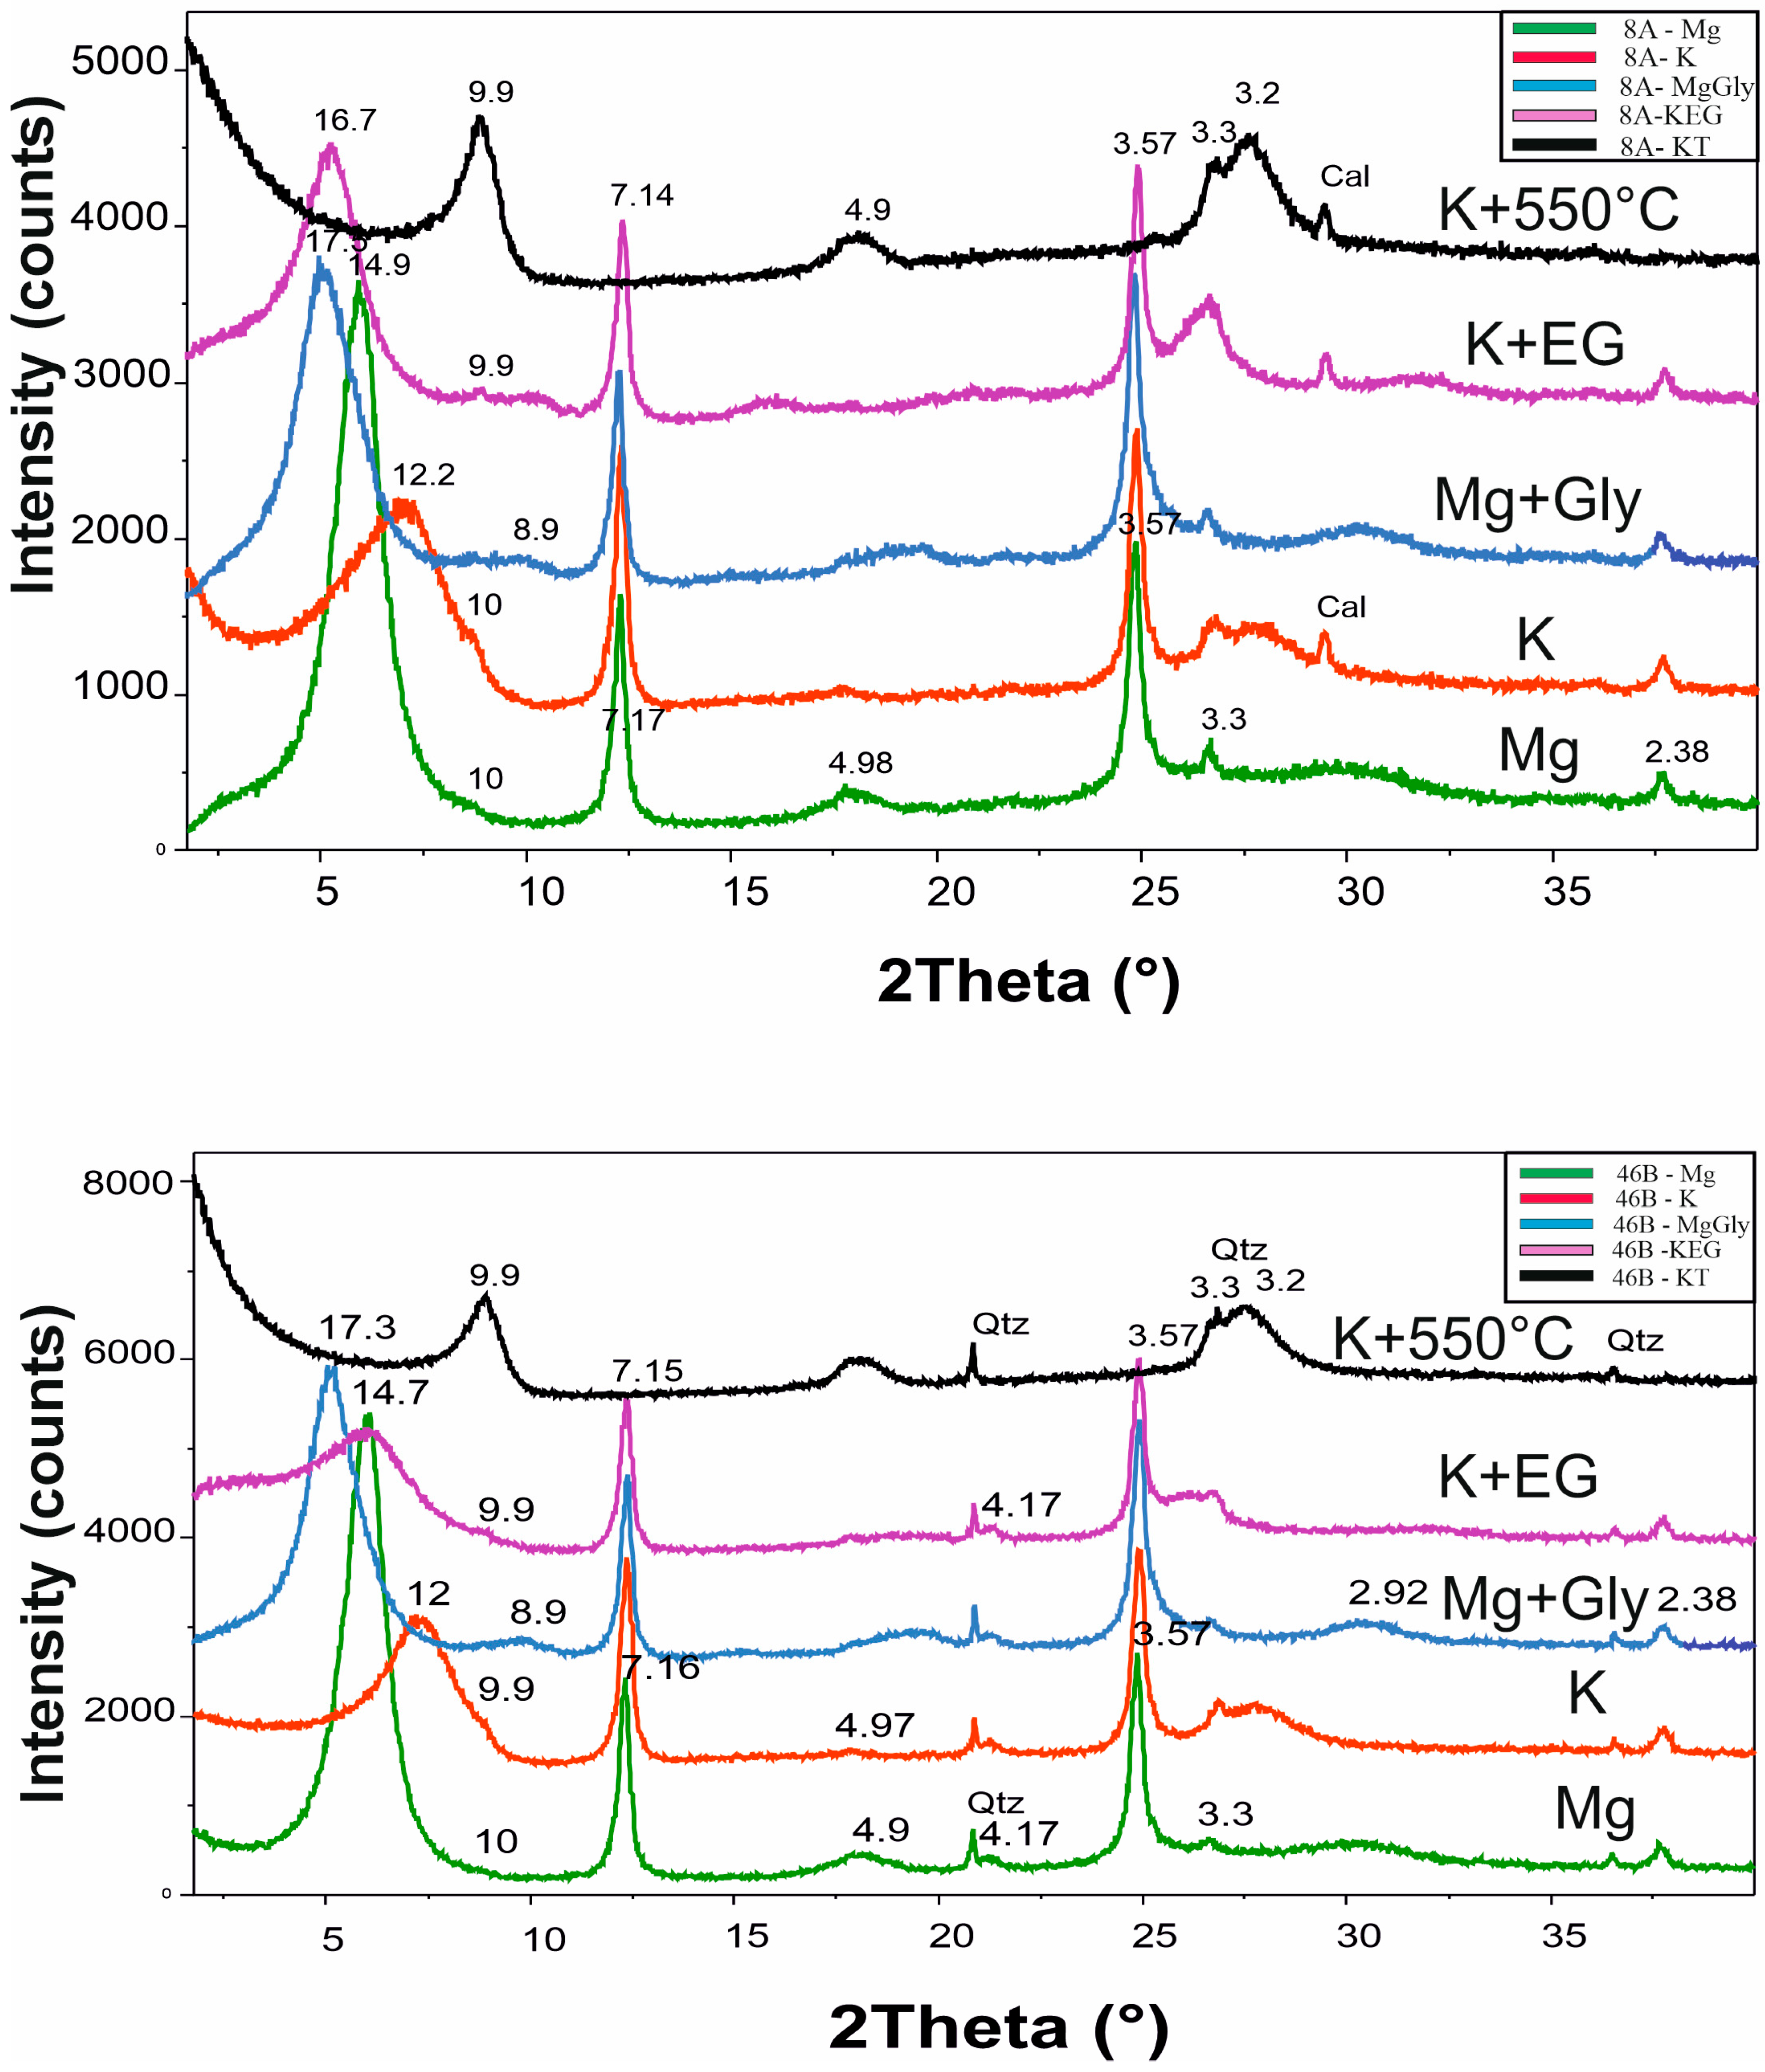
The clay mineral assemblage is characterized by the predominance of smectite, mixed-layer illite–smectite, and kaolinite. In sample 8A, the Mg-saturated clay fraction (Figure 4) displays a broad basal reflection at 14.9 Å, diagnostic of smectite. Illite is distinguished by reflections at 10 Å, 4.98 Å, and 3.3 Å, while kaolinite exhibits characteristic peaks at 7.17 Å and 3.57 Å. Heating the K-saturated sample to 550 °C results in the collapse of smectite to 9.9 Å and the disappearance of kaolinite. In contrast, the untreated K-saturated sample shows a (001) smectite reflection at 12.2 Å, which expands to 17.5 Å after Mg–glycerol treatment, and to 16.7 Å following K–ethylene glycol treatment. Semi-quantitative estimates indicate that the clay fraction of sample 8A is dominated by smectite (84%), with lesser amounts of kaolinite (14%) and illite (2%) (Figure 4).

4.1.1. Major Oxides and Trace Elements

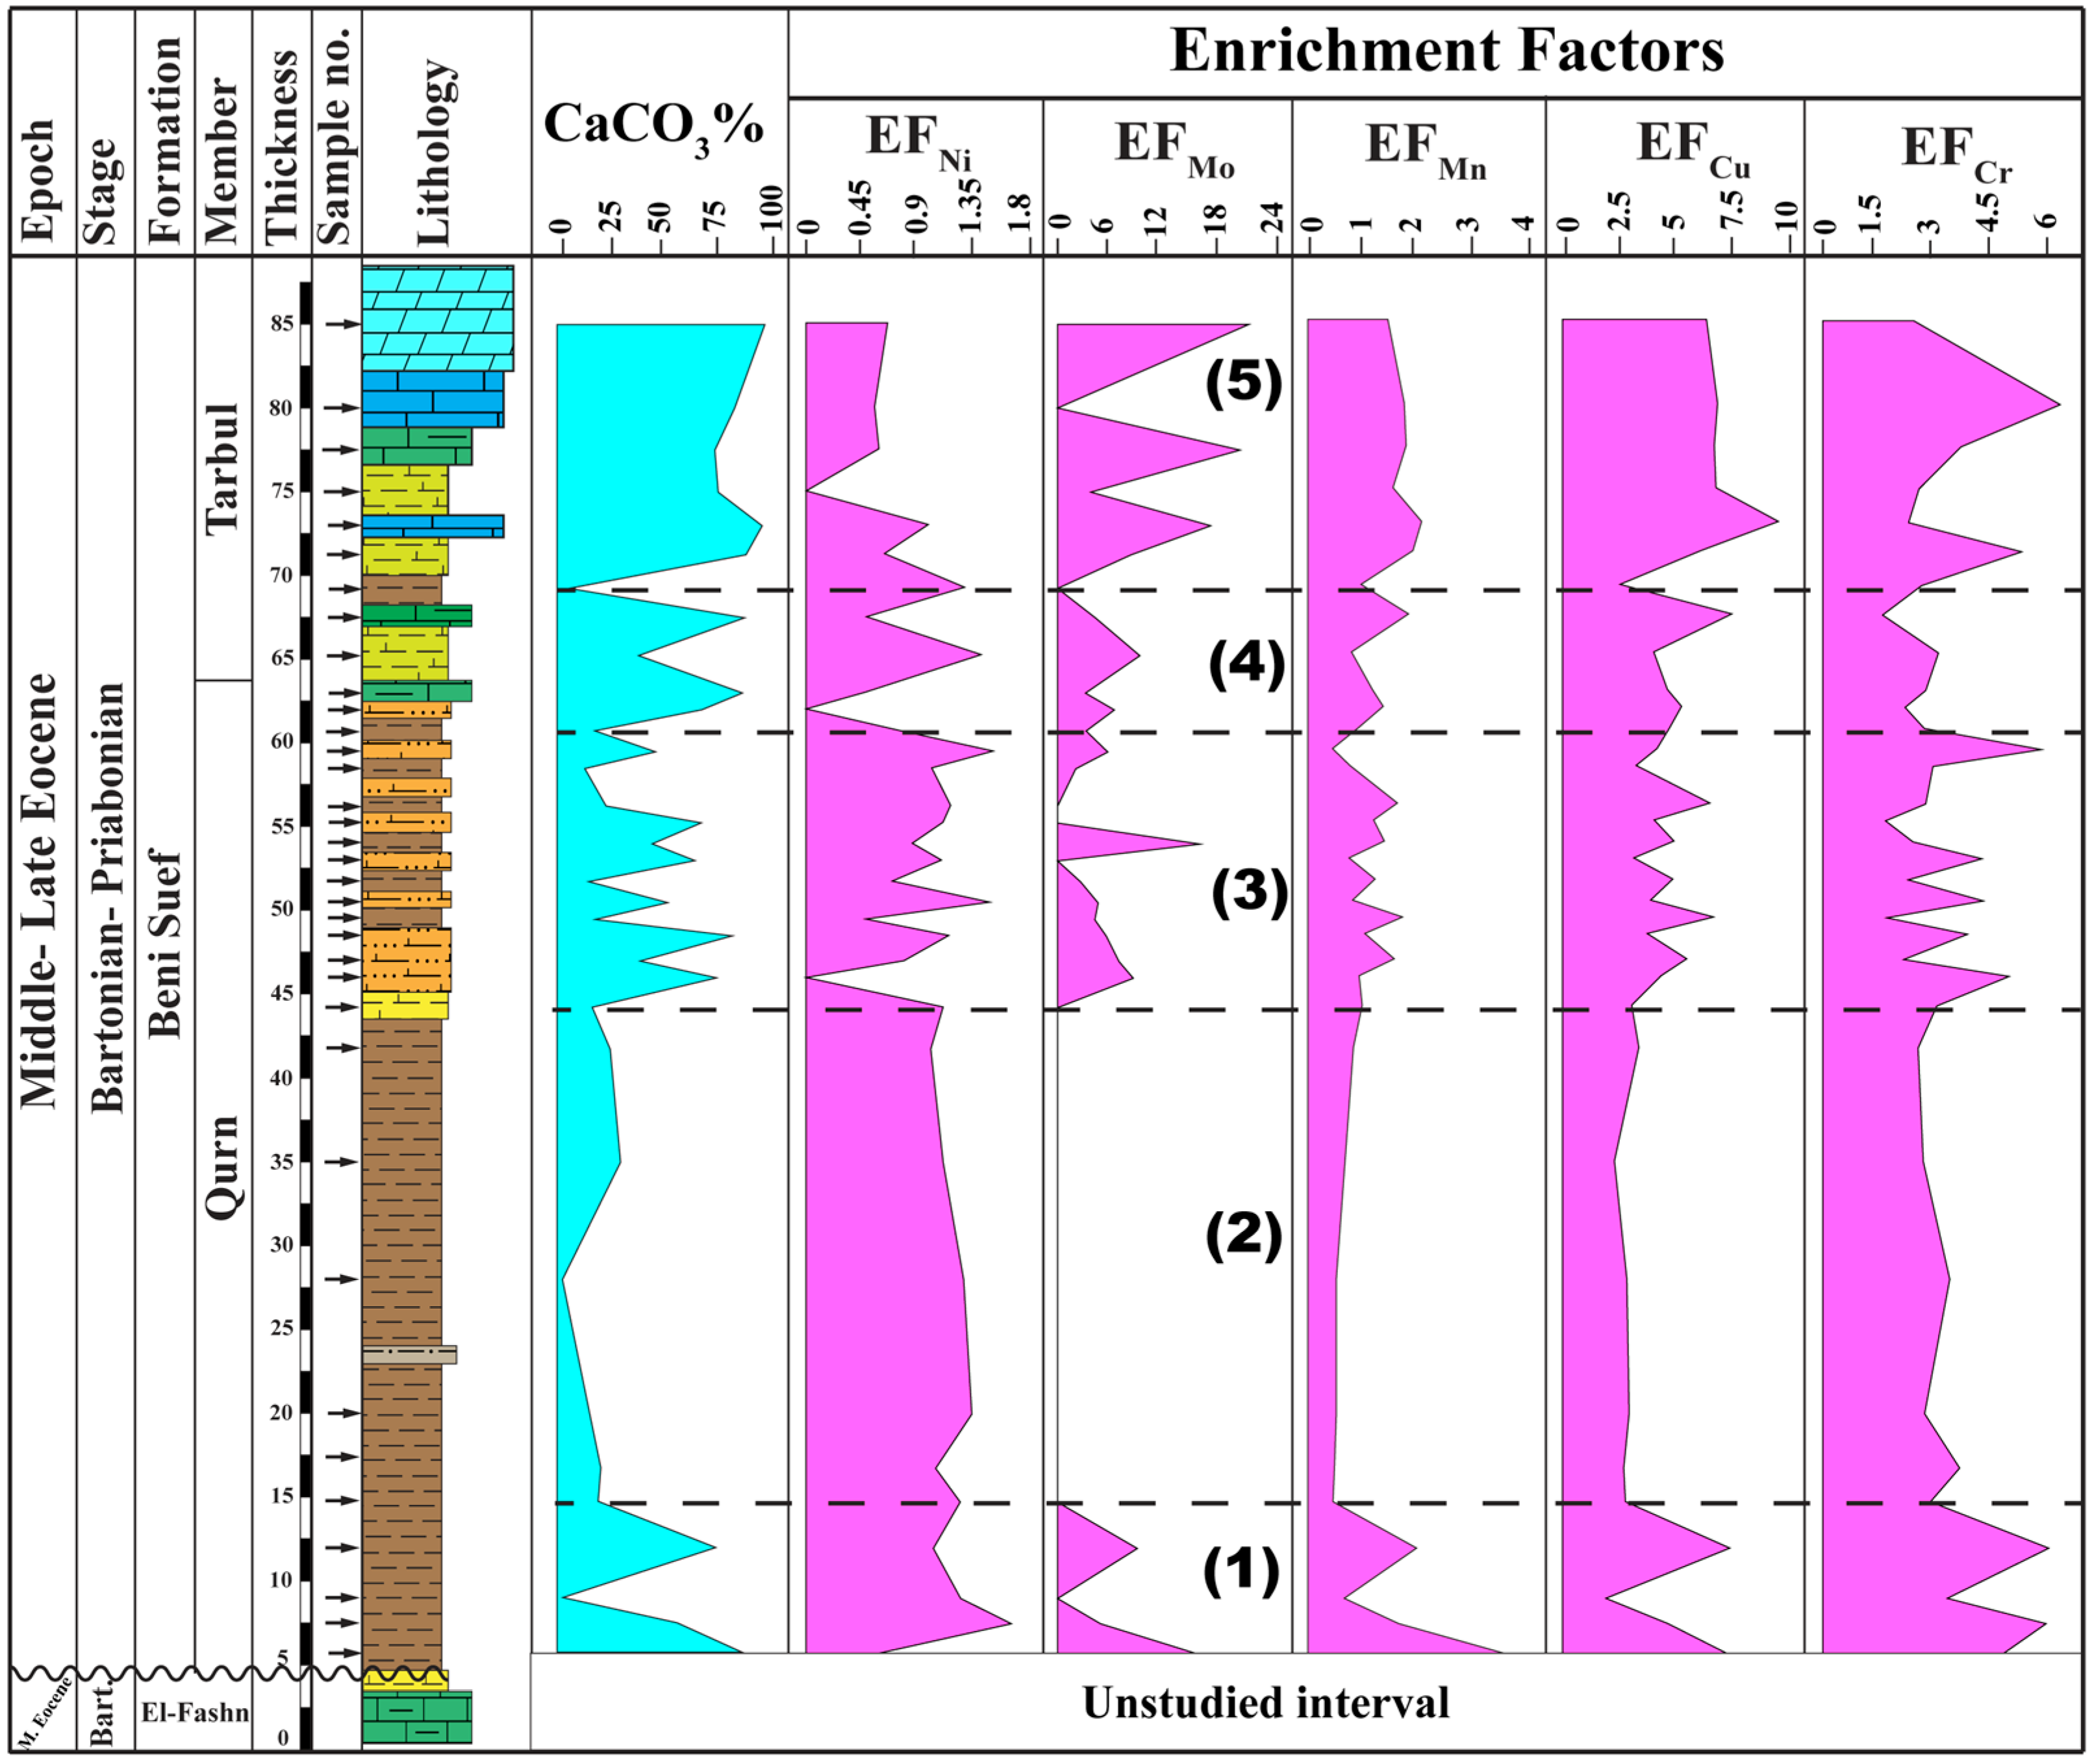
Five zones have been discriminated based on variations in major oxides, trace elements, CaCO3, and TOC content in the analyzed sediment samples. In section A, Zone (1) is characterized by high CaO (18%–31%; Supplementary Materials) and CaCO3 (54%–84%; see Figure 5), accompanied by low siliciclastic indicators (SiO2 7%–9%, Al2O3 1.4%–2.6%, TiO2, Fe2O3, Zr), low trace-metal concentrations (Cr, Ni, Zn, As, Mo, Cd, Pb), relatively high Sr values, and low to moderate TOC (0.10%–0.30%; Figure 5). Zone (2) records a pronounced shift marked by decreased CaO (2%–8%) and CaCO3 and increased siliciclastic components, including SiO2 (12%–16%), Al2O3 (4%–6%), TiO2, Fe2O3 (>4%–5%), and Zr, together with enriched trace elements (Cr, Ni, Zn, As, Mo, Cd) and moderate TOC values (0.25%–0.34%). Zone (3) displays fluctuating geochemical conditions, with CaO ranging from ~5%–16% and CaCO3 from 16%–73%, moderate but variable siliciclastic proxies (SiO2, Al2O3, TiO2, Zr), heterogeneous trace-element concentrations with localized enrichments (Mo, Pb, Zn), and the highest TOC values (up to ~0.39%). Zone (4) shows increased CaO (20%–30%) and CaCO3 (66%–86%), accompanied by reduced siliciclastic indicators and generally low, stable trace metals, while TOC values remain low (<0.14%). Zone (5) comprises two subunits: a lower interval at 69.25 m characterized by elevated SiO2 (16.5%), Al2O3 (5.17%), and Fe2O3 (5.43%) with very low CaCO3 (~5.6%), followed upward by an interval (71.25–85 m) showing very high CaO (25%–36%) and CaCO3 (73%–95%), very low Al2O3 and SiO2, minimal trace-metal concentrations, and very low TOC values (≤0.10%).
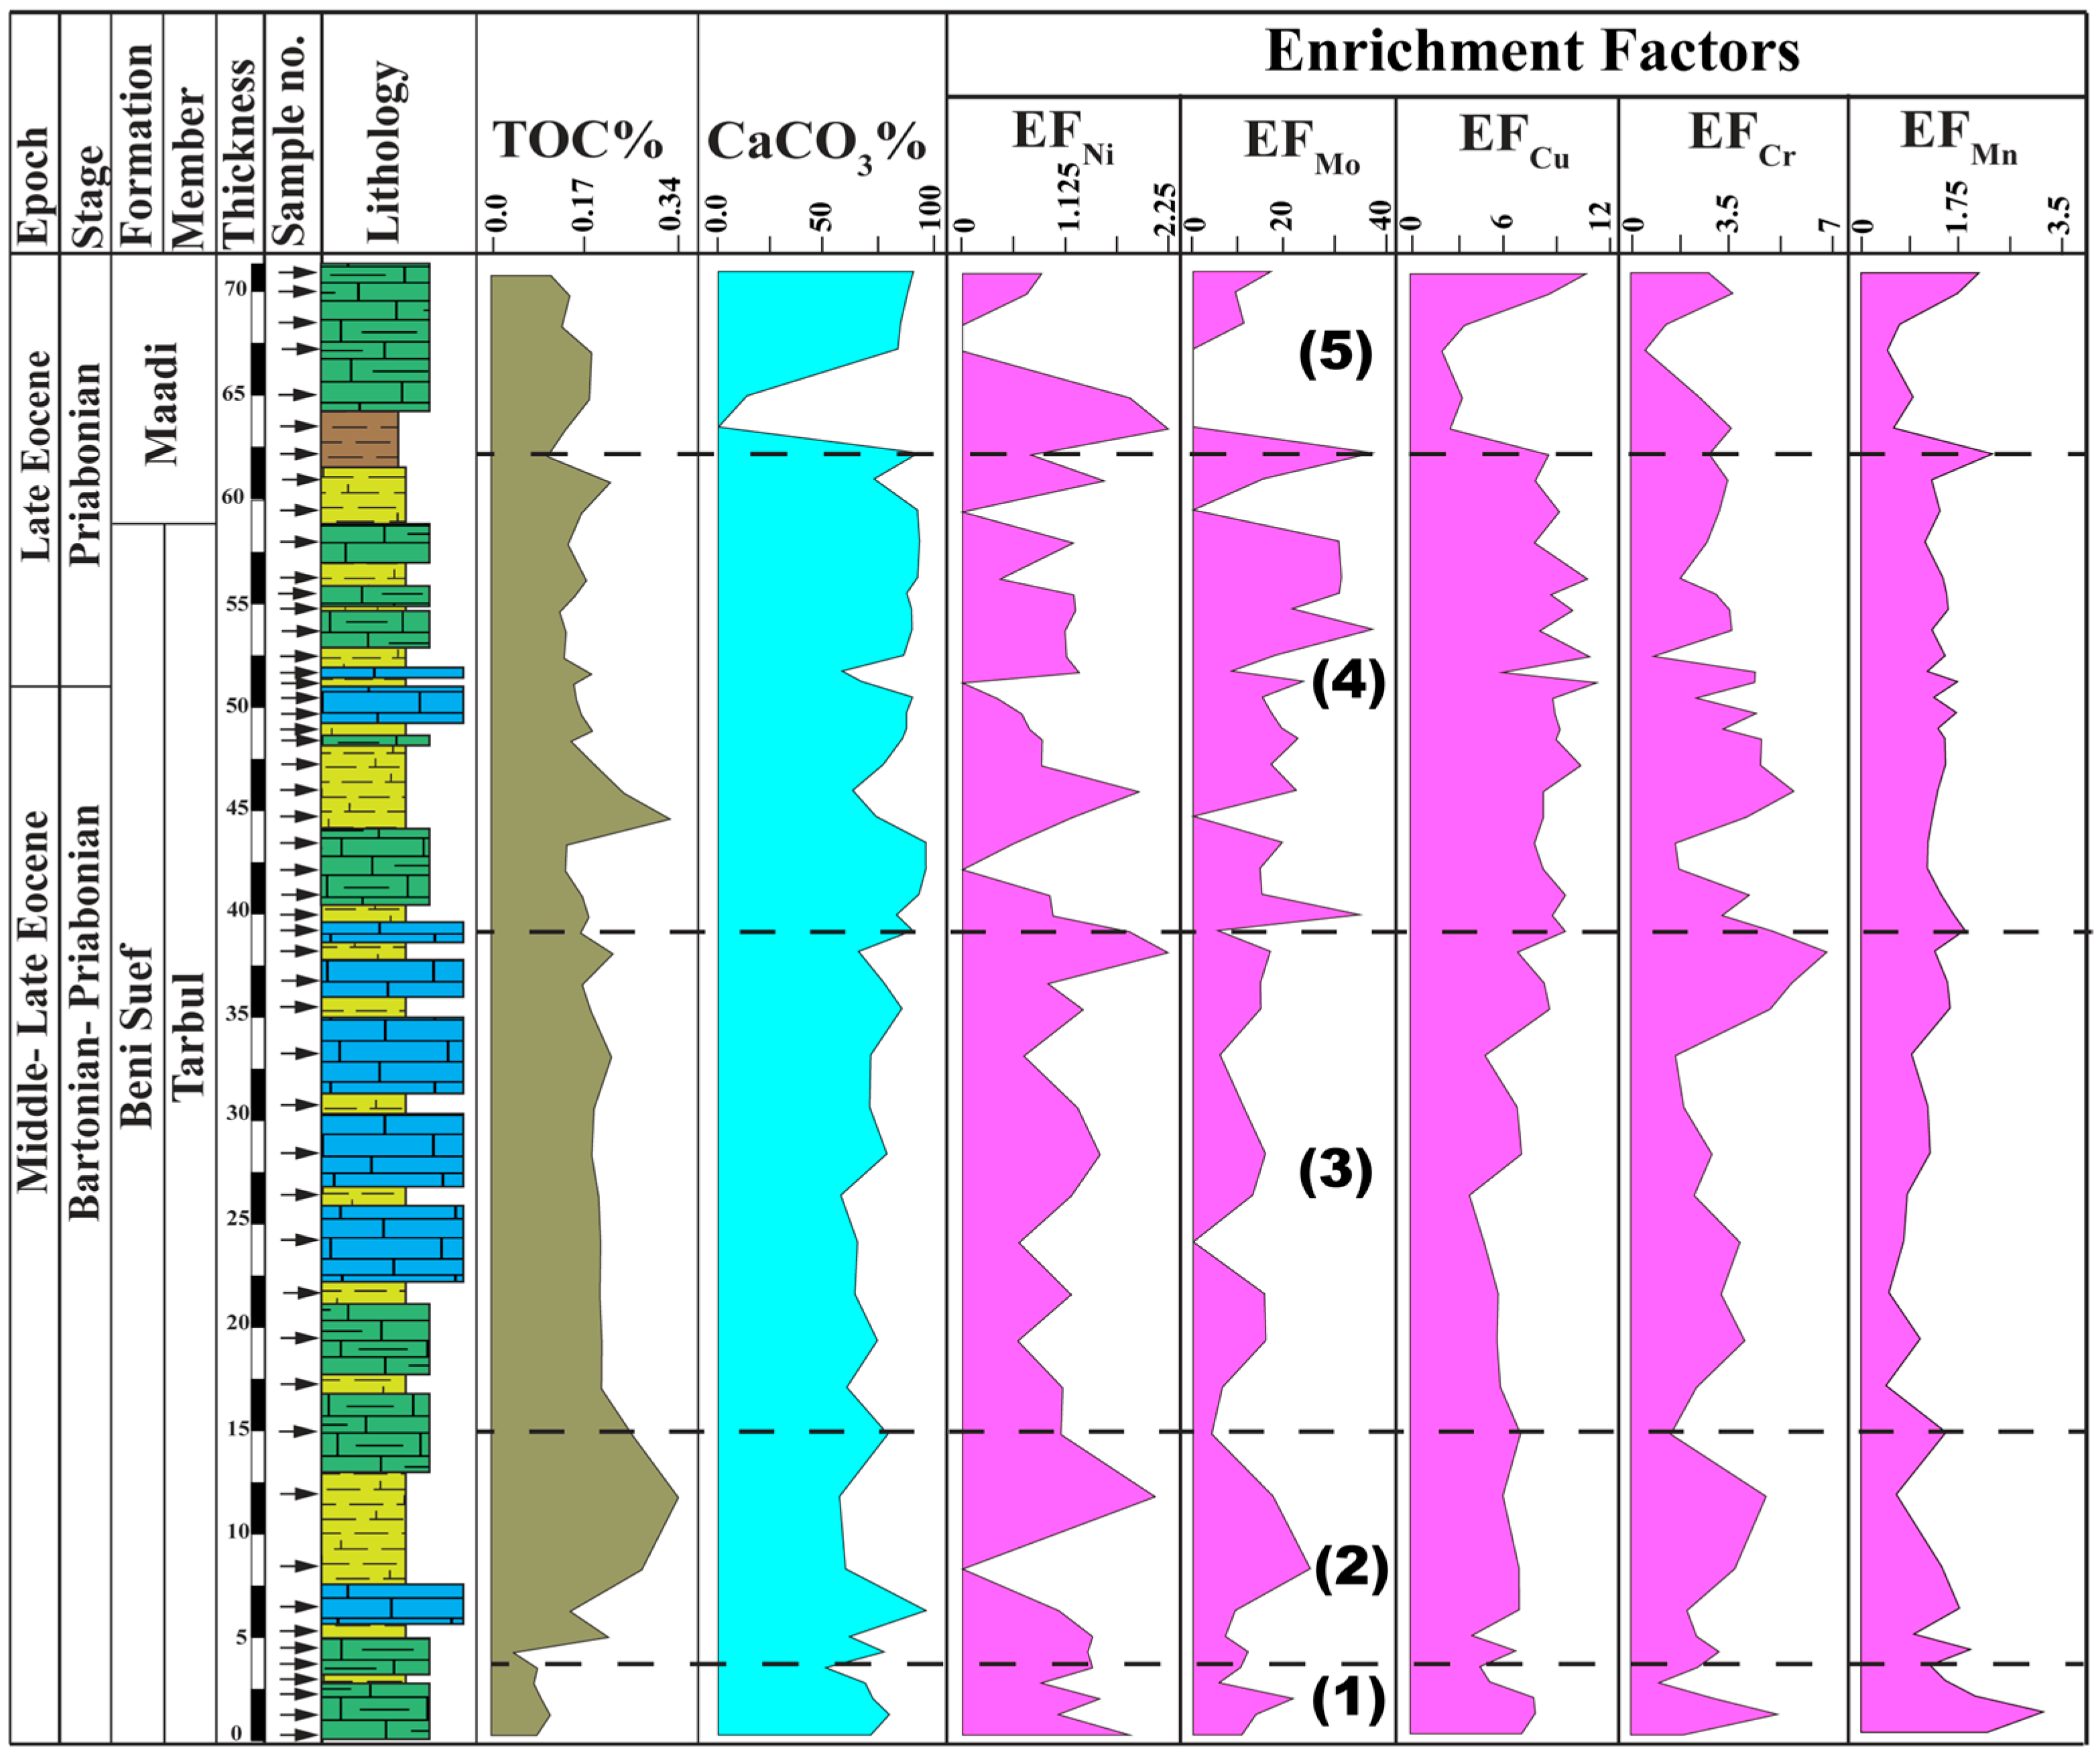
Also, five geochemical zones were identified in Section B, Zone (1) is characterized by relatively high CaO (21%–27%, Supplementary Materials) and CaCO3 (69%–80%; Figure 6), low siliciclastic proxies including SiO2 (4%–7%), Al2O3 (1.3%–1.6%), TiO2, and Fe2O3, low to moderate trace-metal concentrations (Cr, Ni, Zn, As, Cd, Pb), and low TOC values (0.07%–0.10%). Zone (2) shows decreased CaO (17%–22%) and CaCO3, accompanied by increased SiO2 (up to 21.7%), Al2O3, TiO2, and Fe2O3, elevated trace elements (Cr, Zn, Pb, Cd), locally high Sr values, and TOC reaching up to ~0.33%. Zone (3) records increased CaO (23%–30%) and CaCO3 (65%–86%), moderate SiO2 (6%–10%) and Al2O3 (1.7%–2.6%), reduced Fe2O3 and TiO2 relative to Zone 2, stabilized trace-metal concentrations, and moderate TOC values (~0.18%–0.21%). Zone (4) is characterized by very high CaO (31%–38%) and CaCO3 (83%–97%), very low SiO2 (2%–5%) and Al2O3 (~1.2%–1.4%), consistently low Fe2O3 and TiO2, minimal trace-metal concentrations, and TOC values of 0.13%–0.17%. Zone (5) comprises two subunits: a lower interval with very low CaO (down to 1.04%) and CaCO3 (0.2%–13.5%) associated with elevated Al2O3 (4%–5%), SiO2 (13%–14%), TiO2, Fe2O3 (up to ~7%), and strongly enriched trace metals, followed by an upper interval marked by increased CaO (29%–37%) and CaCO3 (84%–92%), reduced siliciclastic proxies, decreased trace metals, and relatively low TOC values (0.10%–0.14%).

4.1.2. Correlation Analysis

The correlation matrix of section A shows that Al2O3 is strongly positively correlated with K2O (r = 0.95), TiO2 (r = 0.96), Fe2O3 (r = 0.91), Zn (r = 0.86), Rb (r = 0.84), and Cr2O3 (r = 0.79), while exhibiting strong negative correlations with CaO (r = −0.89) and CaCO3% (r = −0.69) (Table 1). The SiO2 follows the same pattern, correlating positively with Al2O3, TiO2, Fe2O3, Zn, and Rb, and negatively with CaO and CaCO3%. The CaO shows a positive correlation with CaCO3% (r = 0.63) and strong negative correlations with Al2O3 (r = −0.89), K2O (r = −0.92), TiO2 (r = −0.94), Fe2O3 (r = −0.91), and Zn (r = −0.88), whereas Sr has a moderate positive relationship with CaO (r = 0.39). The Mo is negatively correlated with Al2O3 (r = −0.66), Fe2O3 (r = −0.64), and TiO2 (r = −0.63), and positively correlated with CaCO3% (r = 0.57). Cd correlates positively with Zr (r = 0.76) and Fe2O3 (r = 0.71), and negatively with CaO (r = −0.68). As shows positive correlations with Fe2O3 (r = 0.71), Zn (r = 0.74), and Rb (r = 0.69). Ni correlates positively with Al2O3 (r = 0.65), K2O (r = 0.65), TiO2 (r = 0.61), and Fe2O3 (r = 0.56). Zn exhibits very strong positive correlations with Fe2O3 (r = 0.93), TiO2 (r = 0.92), K2O (r = 0.91), and Al2O3 (r = 0.86). The Cu shows weaker moderate correlations with detrital elements and MnO, while Pb displays generally weak correlations. The P2O5 correlates positively with MnO (r = 0.52), CaO (r = 0.13), Sr (r = 0.47), and TOC (r = 0.57). The TOC shows positive correlations with K2O (r = 0.50), Fe2O3 (r = 0.51), Zn (r = 0.45), As (r = 0.49), and Rb (r = 0.60), and a negative correlation with CaO (r = −0.44), in addition to moderate positive correlations with Cd (r = 0.42) and Ni (r = 0.38). Zr correlates positively with Cd (r = 0.76), Fe2O3 (r = 0.73), TiO2 (r = 0.66), and K2O (r = 0.62), and negatively with CaO (r = −0.63).
At section B, correlation analysis reveals strong positive relationships among Al2O3, SiO2, K2O, TiO2, Fe2O3, Zn, Rb, Zr, Ni, and Cd (e.g., SiO2–TiO2 r = 0.85; SiO2–Fe2O3 r = 0.87; TiO2–Fe2O3 r = 0.94; Fe2O3–Zn r = 0.92; Table 2). Zr shows strong correlations with Fe2O3 (r = 0.83), Rb, Zn, and Cd. CaO and CaCO3 exhibit a very strong positive correlation (r = 0.97) and strong negative correlations with K2O (−0.90), TiO2 (−0.85), Fe2O3 (−0.76), Zn (−0.73), and SiO2 (−0.46). Sr correlates positively with CaO (r = 0.59) and CaCO3 (r = 0.61). Fe2O3, Zn, TiO2, and Rb display strong mutual correlations (e.g., Zn–Fe2O3 r = 0.92; Zn–TiO2 r = 0.90). Moderate correlations are observed between selected elements and Fe2O3 (0.52), Zn (0.44), Cr2O3 (0.50), and Cd (0.60). Ni and Cd show moderate to strong positive correlations with siliciclastic proxies (e.g., Ni–SiO2 r = 0.64; Cd–Fe2O3 r = 0.73). Mo exhibits weak or negative correlations with detrital elements but moderate positive correlations with CaO (0.43) and CaCO3 (0.41). Pb shows generally weak correlations, whereas Ba displays modest positive relationships with Fe2O3, Zn, and As. P2O5 correlates strongly with MnO (r = 0.81) and moderately with Ni (0.71). TOC shows weak correlations overall, including modest positive relationships with SiO2 (0.38), Cd (0.30), and Rb (0.27), and a negative correlation with MnO (−0.42).

4.2. Elemental Ratios

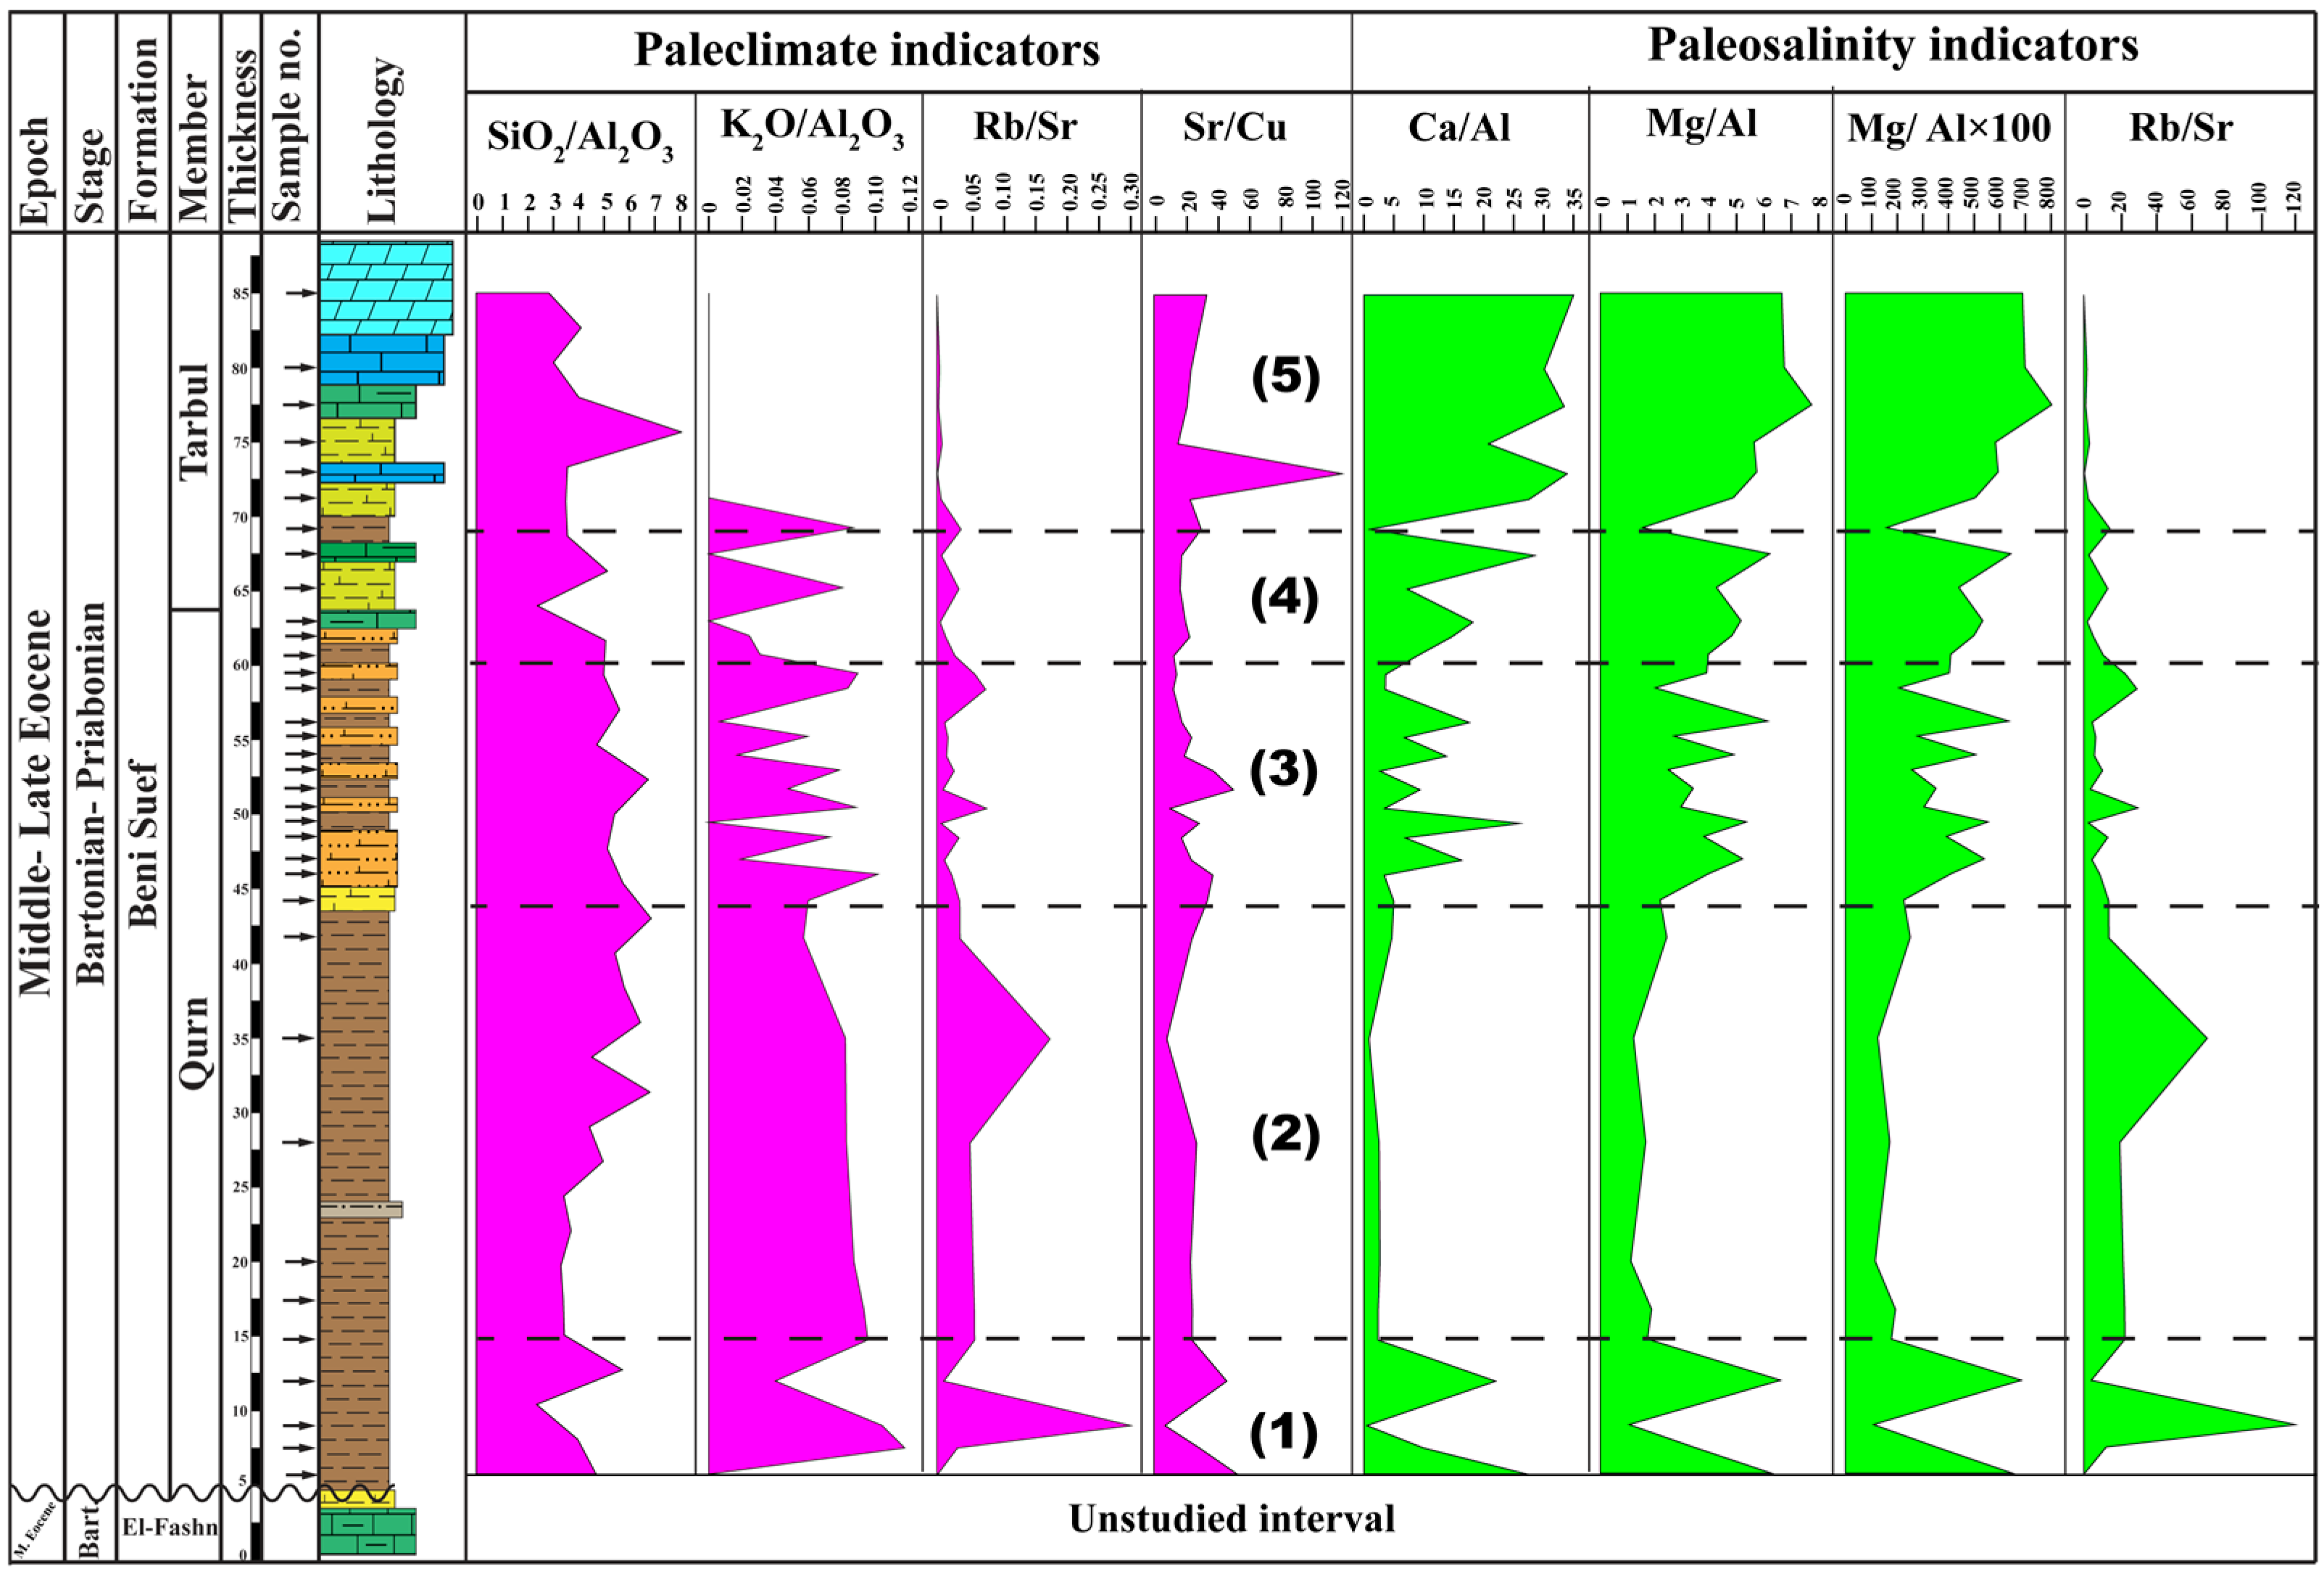
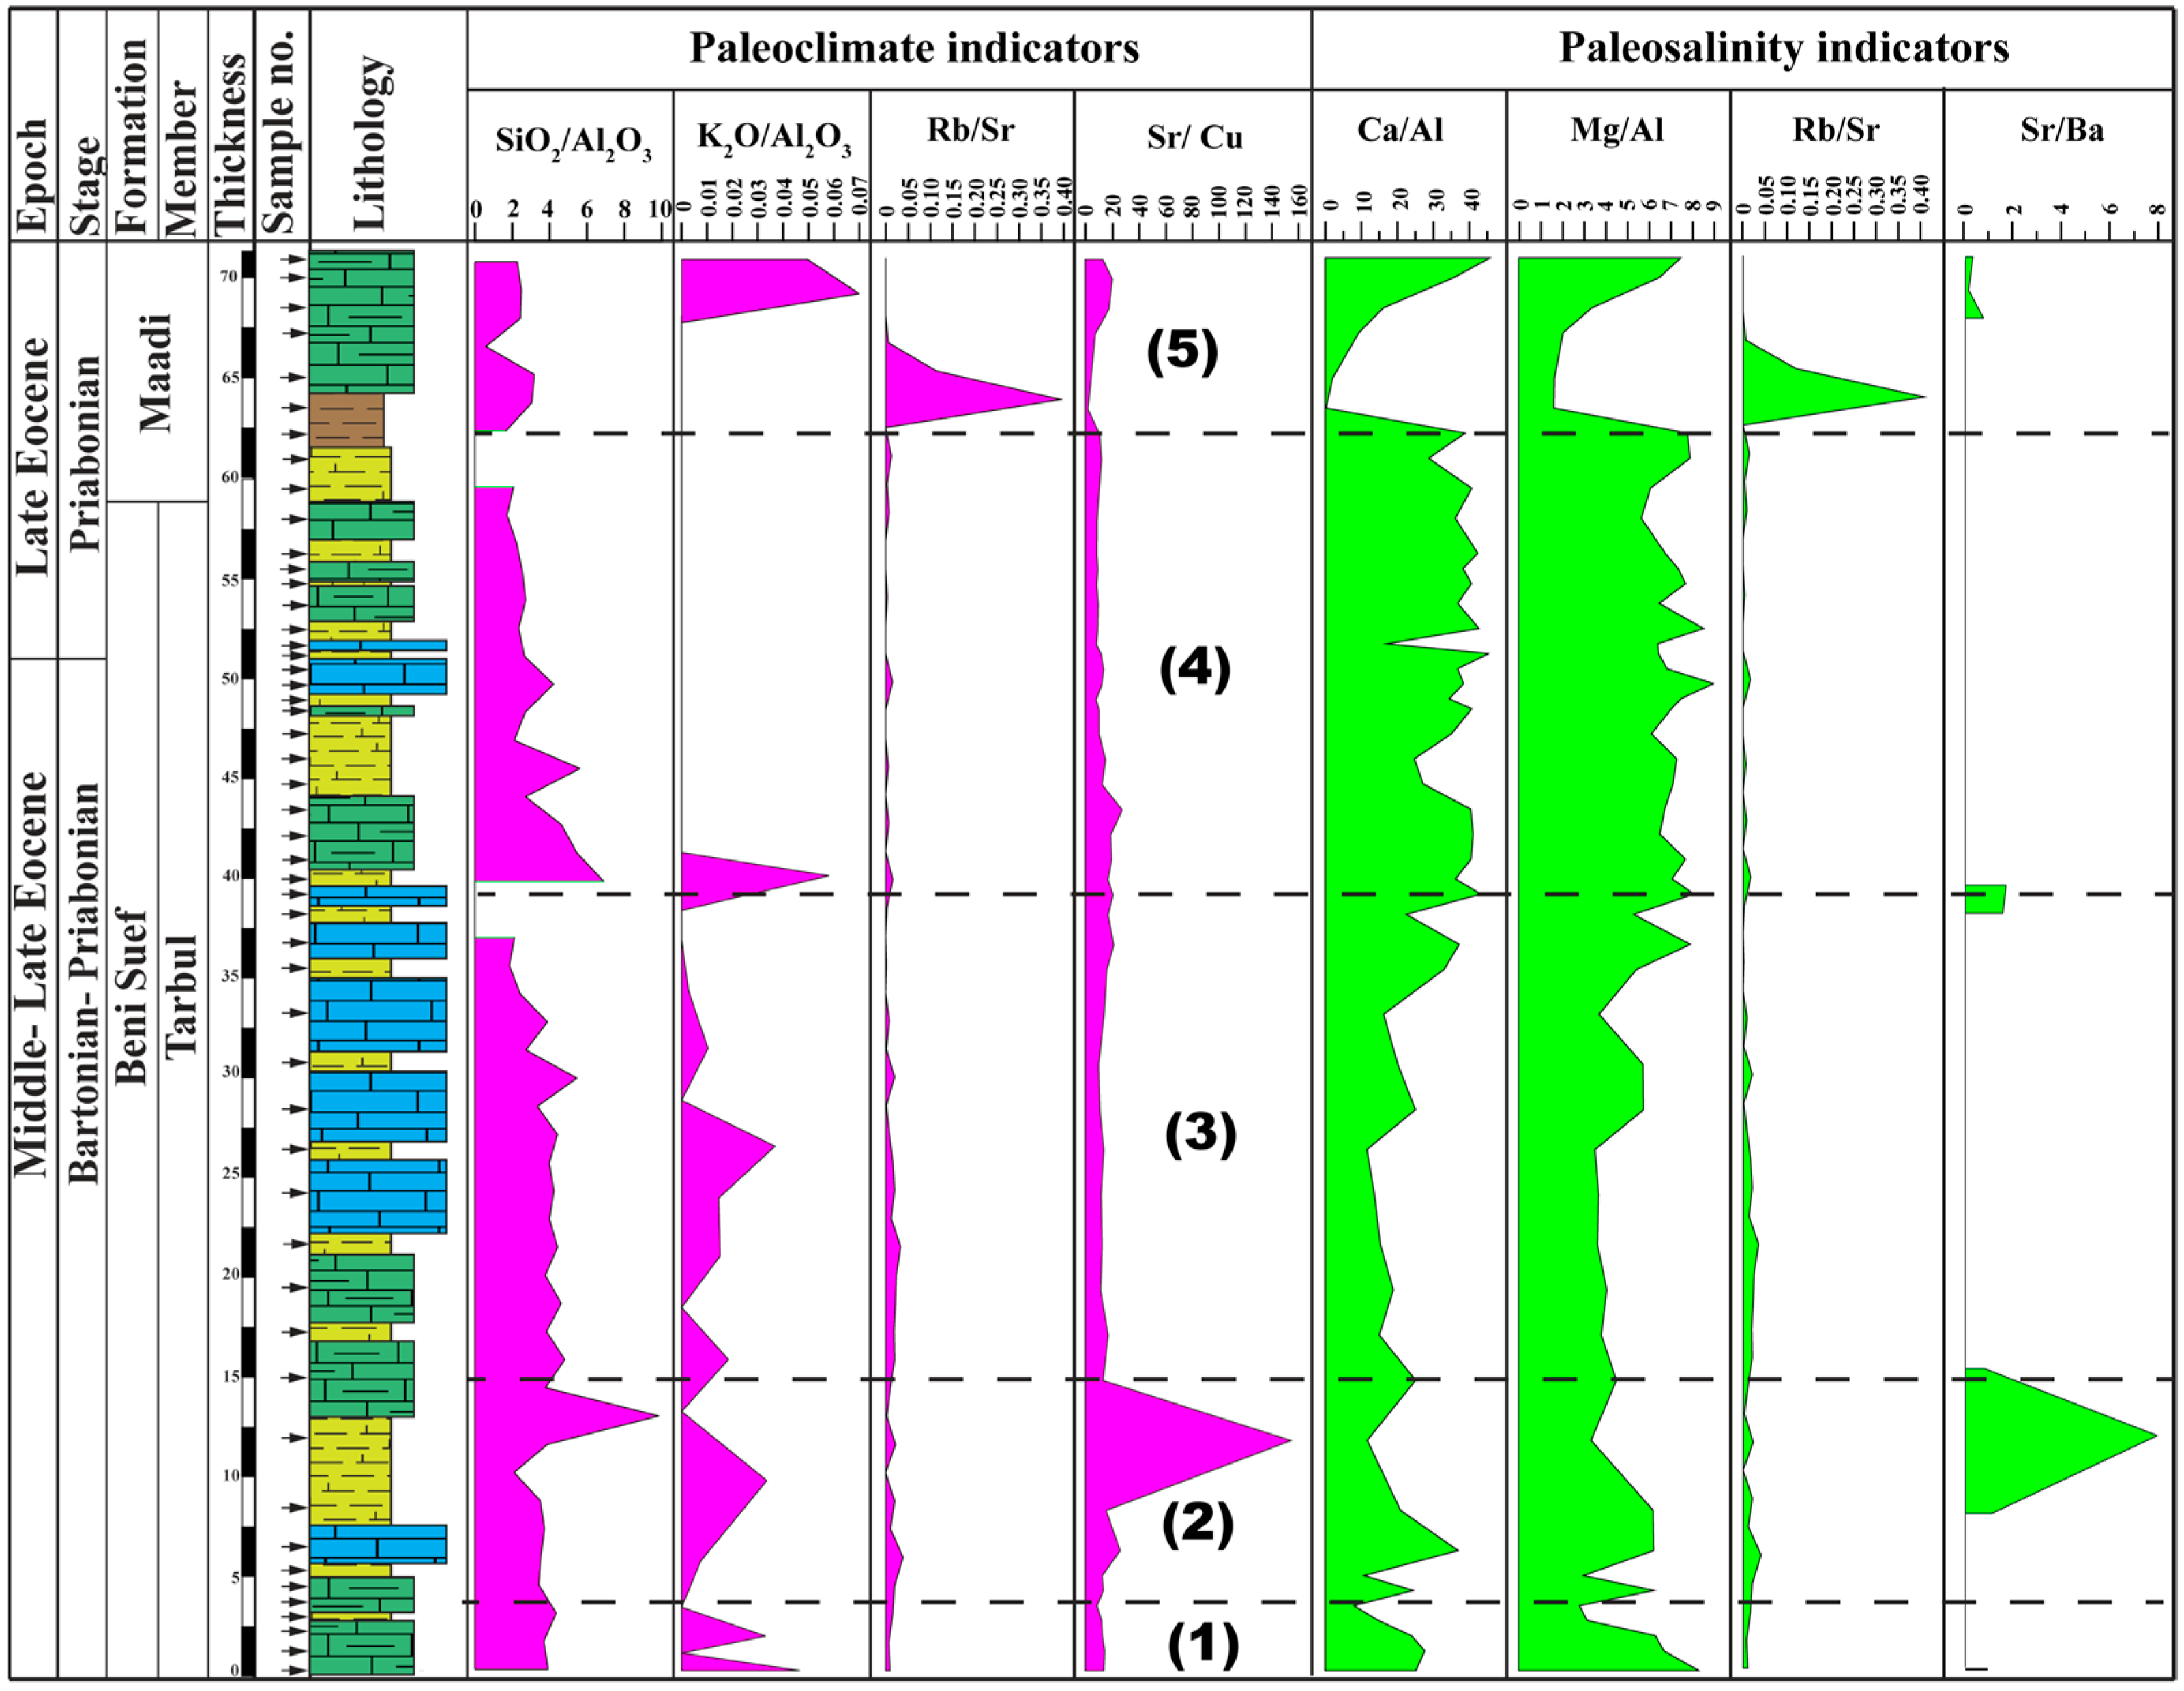
The enrichment factors (EFs) for Mo, Cr, Ni, Cu, and Zr in the Eocene sediments show marked variability across the studied succession (Figure 5). The MoEF varies from 0 to 21.46, with exceptionally high peaks near the top of section A (85 m), and at 26.5 m, 40 m, 53.75 m, and 62.25 m in section B. CrEF values vary between 0.51 and 6.91 (mean = 3.10), whereas CuEF values range from 1.94 to 9.67 (mean = 4.85). In contrast, NiEF values are generally low, ranging from 0 to 2.1, with a mean of 0.97. ZrEF values show moderate enrichment, ranging from 0 to 3.67, with an average of 2.01.
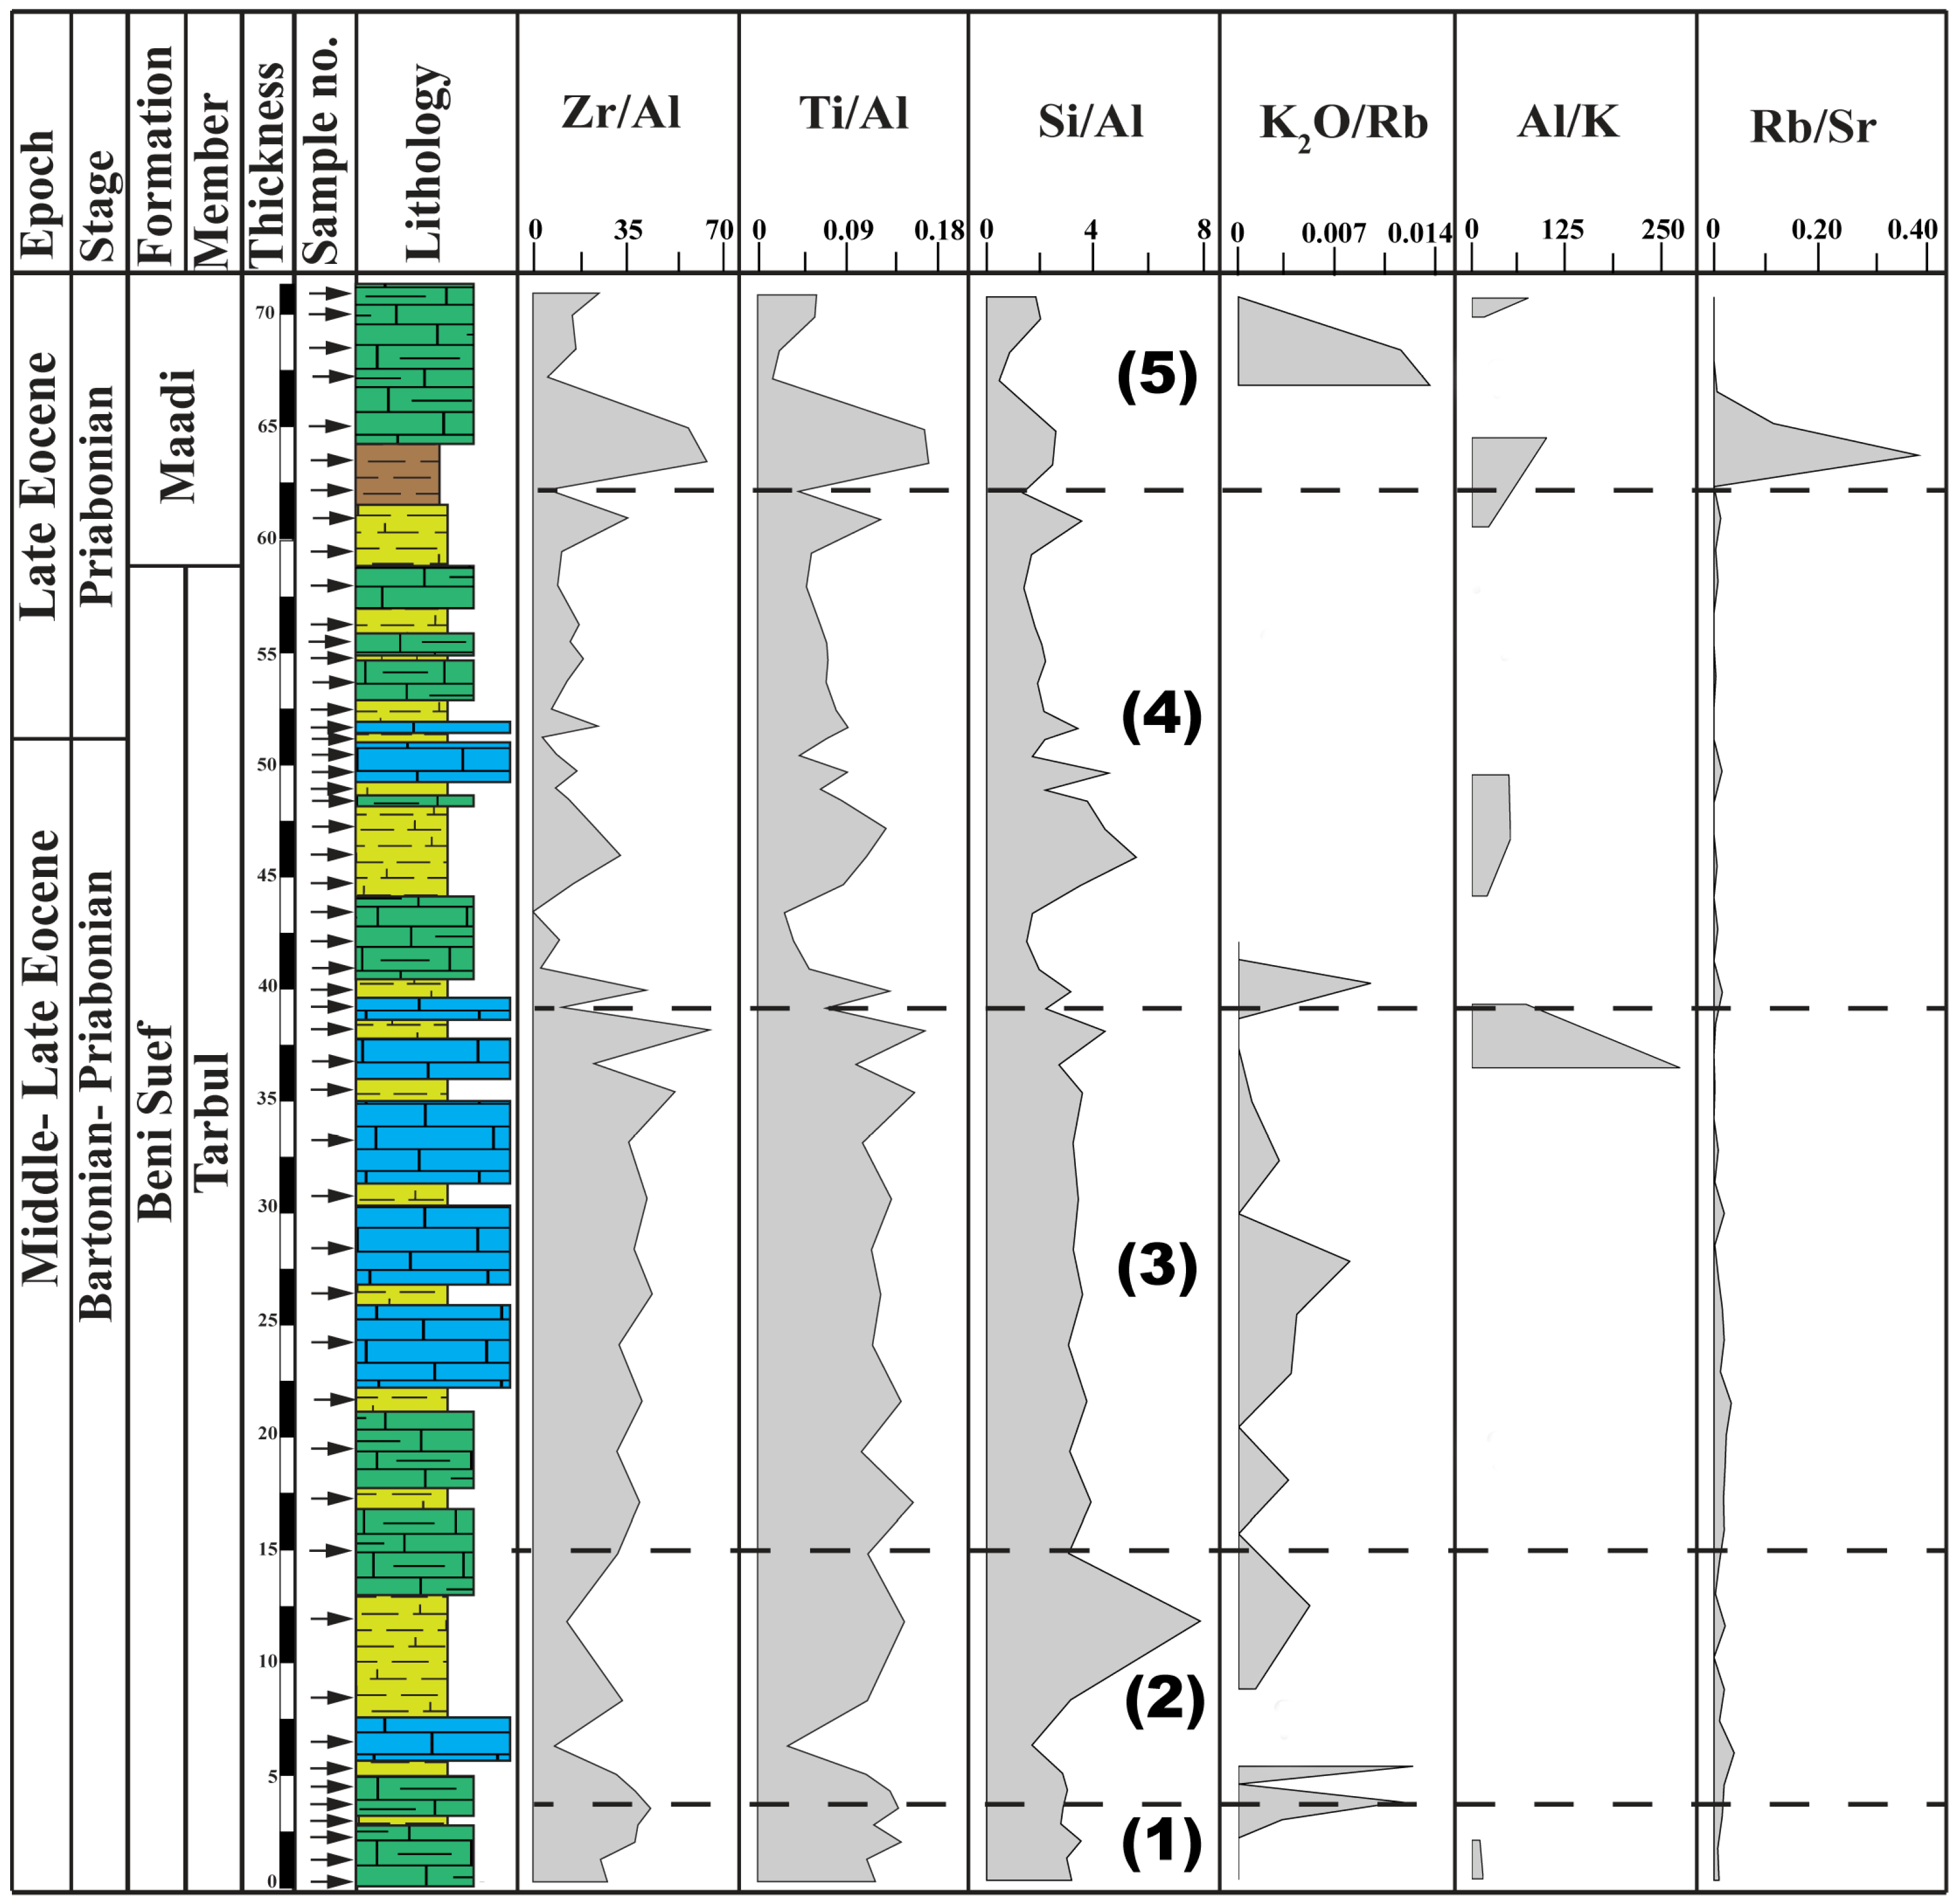
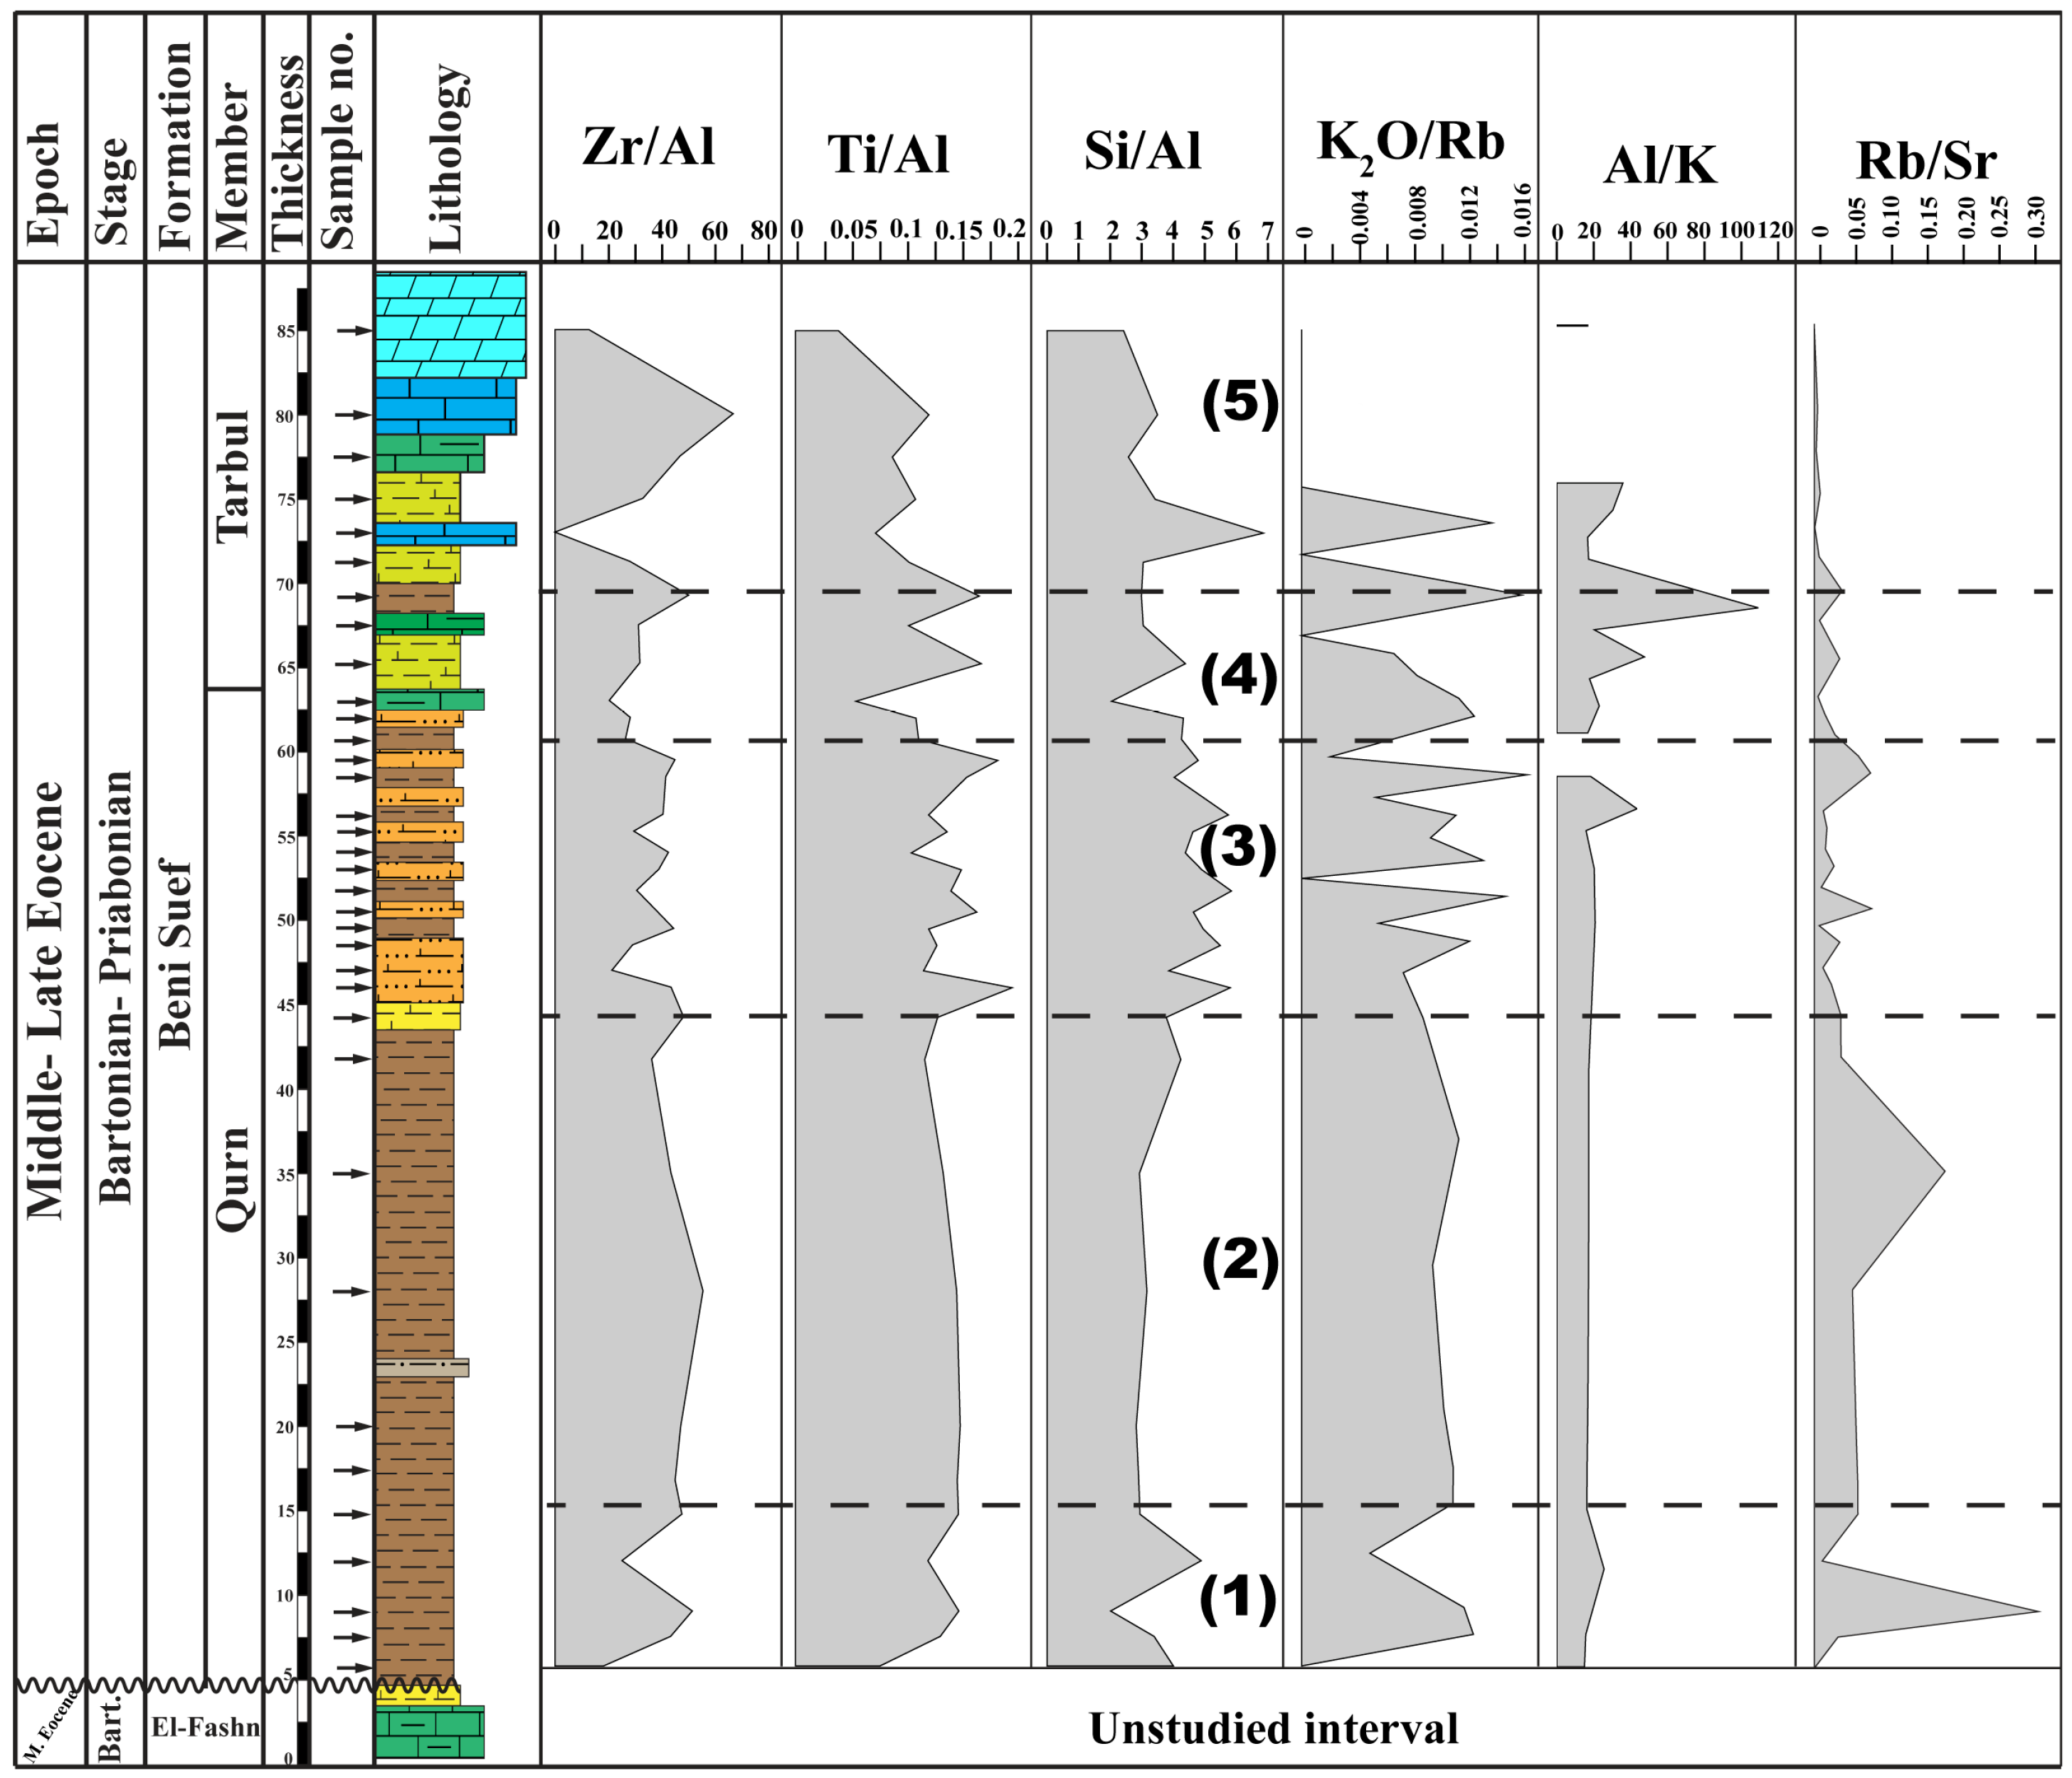
The detrital proxies, including Si/Al, Ti/Al, and Zr/Al ratios, show considerable variations (Figure 7 and Figure 8; Supplementary Materials). In section A, the lower and middle parts of the Qurn Member (samples 1–10) are characterized by relatively low Si/Al ratios, ranging from 1.89 to 4.60, with an average of 3.04. These values are lower than the Upper Continental Crust (UCC; average = 4.33) and the Post-Archaean Australian Shale (PAAS; average = 3.32) [54]. On the other hand, the upper part of the same rock unit (samples 12–30) is marked by a significant increase in the Si/Al ratios (mean = 4.03). Upsection, the Tarbul Member of the Beni Suef Formation in both sections A and B records intermediate Si/Al values, averaging between 3.09 and 3.41, whereas the Maadi Formation exhibits lower values, with an average of 1.68. The Zr/Al and Ti/Al ratios generally follow trends comparable to those of Si/Al. The lower and middle parts of the Qurn Member show elevated average Zr/Al and Ti/Al ratios (41.85 and 0.12, respectively, see Supplementary Materials, Figure 7 and Figure 8). These values decrease in the upper part of the same unit, where the average Zr/Al ratio declines to 35.56, while the Ti/Al ratio remains relatively stable at 0.12. A further downward trend is observed in the Tarbul Member of the Beni Suef Formation, with average Zr/Al and Ti/Al ratios of 33.38 and 0.09, respectively, and in the Maadi Formation, where the lowest averages are recorded (Zr/Al = 25.68; Ti/Al = 0.07).
The calculated Rb/Sr ratios of the investigated samples ranged from 0.0007 to 0.37. The Sr/Cu ratio, ranging from 1.91 to 153.7 (Figure 9 and Figure 10, Supplementary Materials), where high values (e.g., 106.9 at 73 m in section A; and 153.7 at 12 m; 27.5 at 43.5 m; 26 at 6.5 m in section B).
Sr/Ba ratios range from 0.5 to 7.92, with a mean value of 1.21. Ca/Al ratios varied between 1.89 and 40.84 (mean = 18.47; Supplementary Materials), while Mg/Al ratios ranged from 0.96 to 8.203 (mean = 3.64). Accordingly, Mg/Al × 100 values are relatively high, ranging from 96 to 820.27, with an average of 447.15 (Figure 9 and Figure 10).
Paleohydrodynamic and paleo-water depth proxies such as Zr/Rb ratios ranged from 1.01 to 13, with a mean value of 6.28, while Fe/Mn ratios consistently display elevated values, varying between 15.51 and 451.55 (Supplementary Materials).
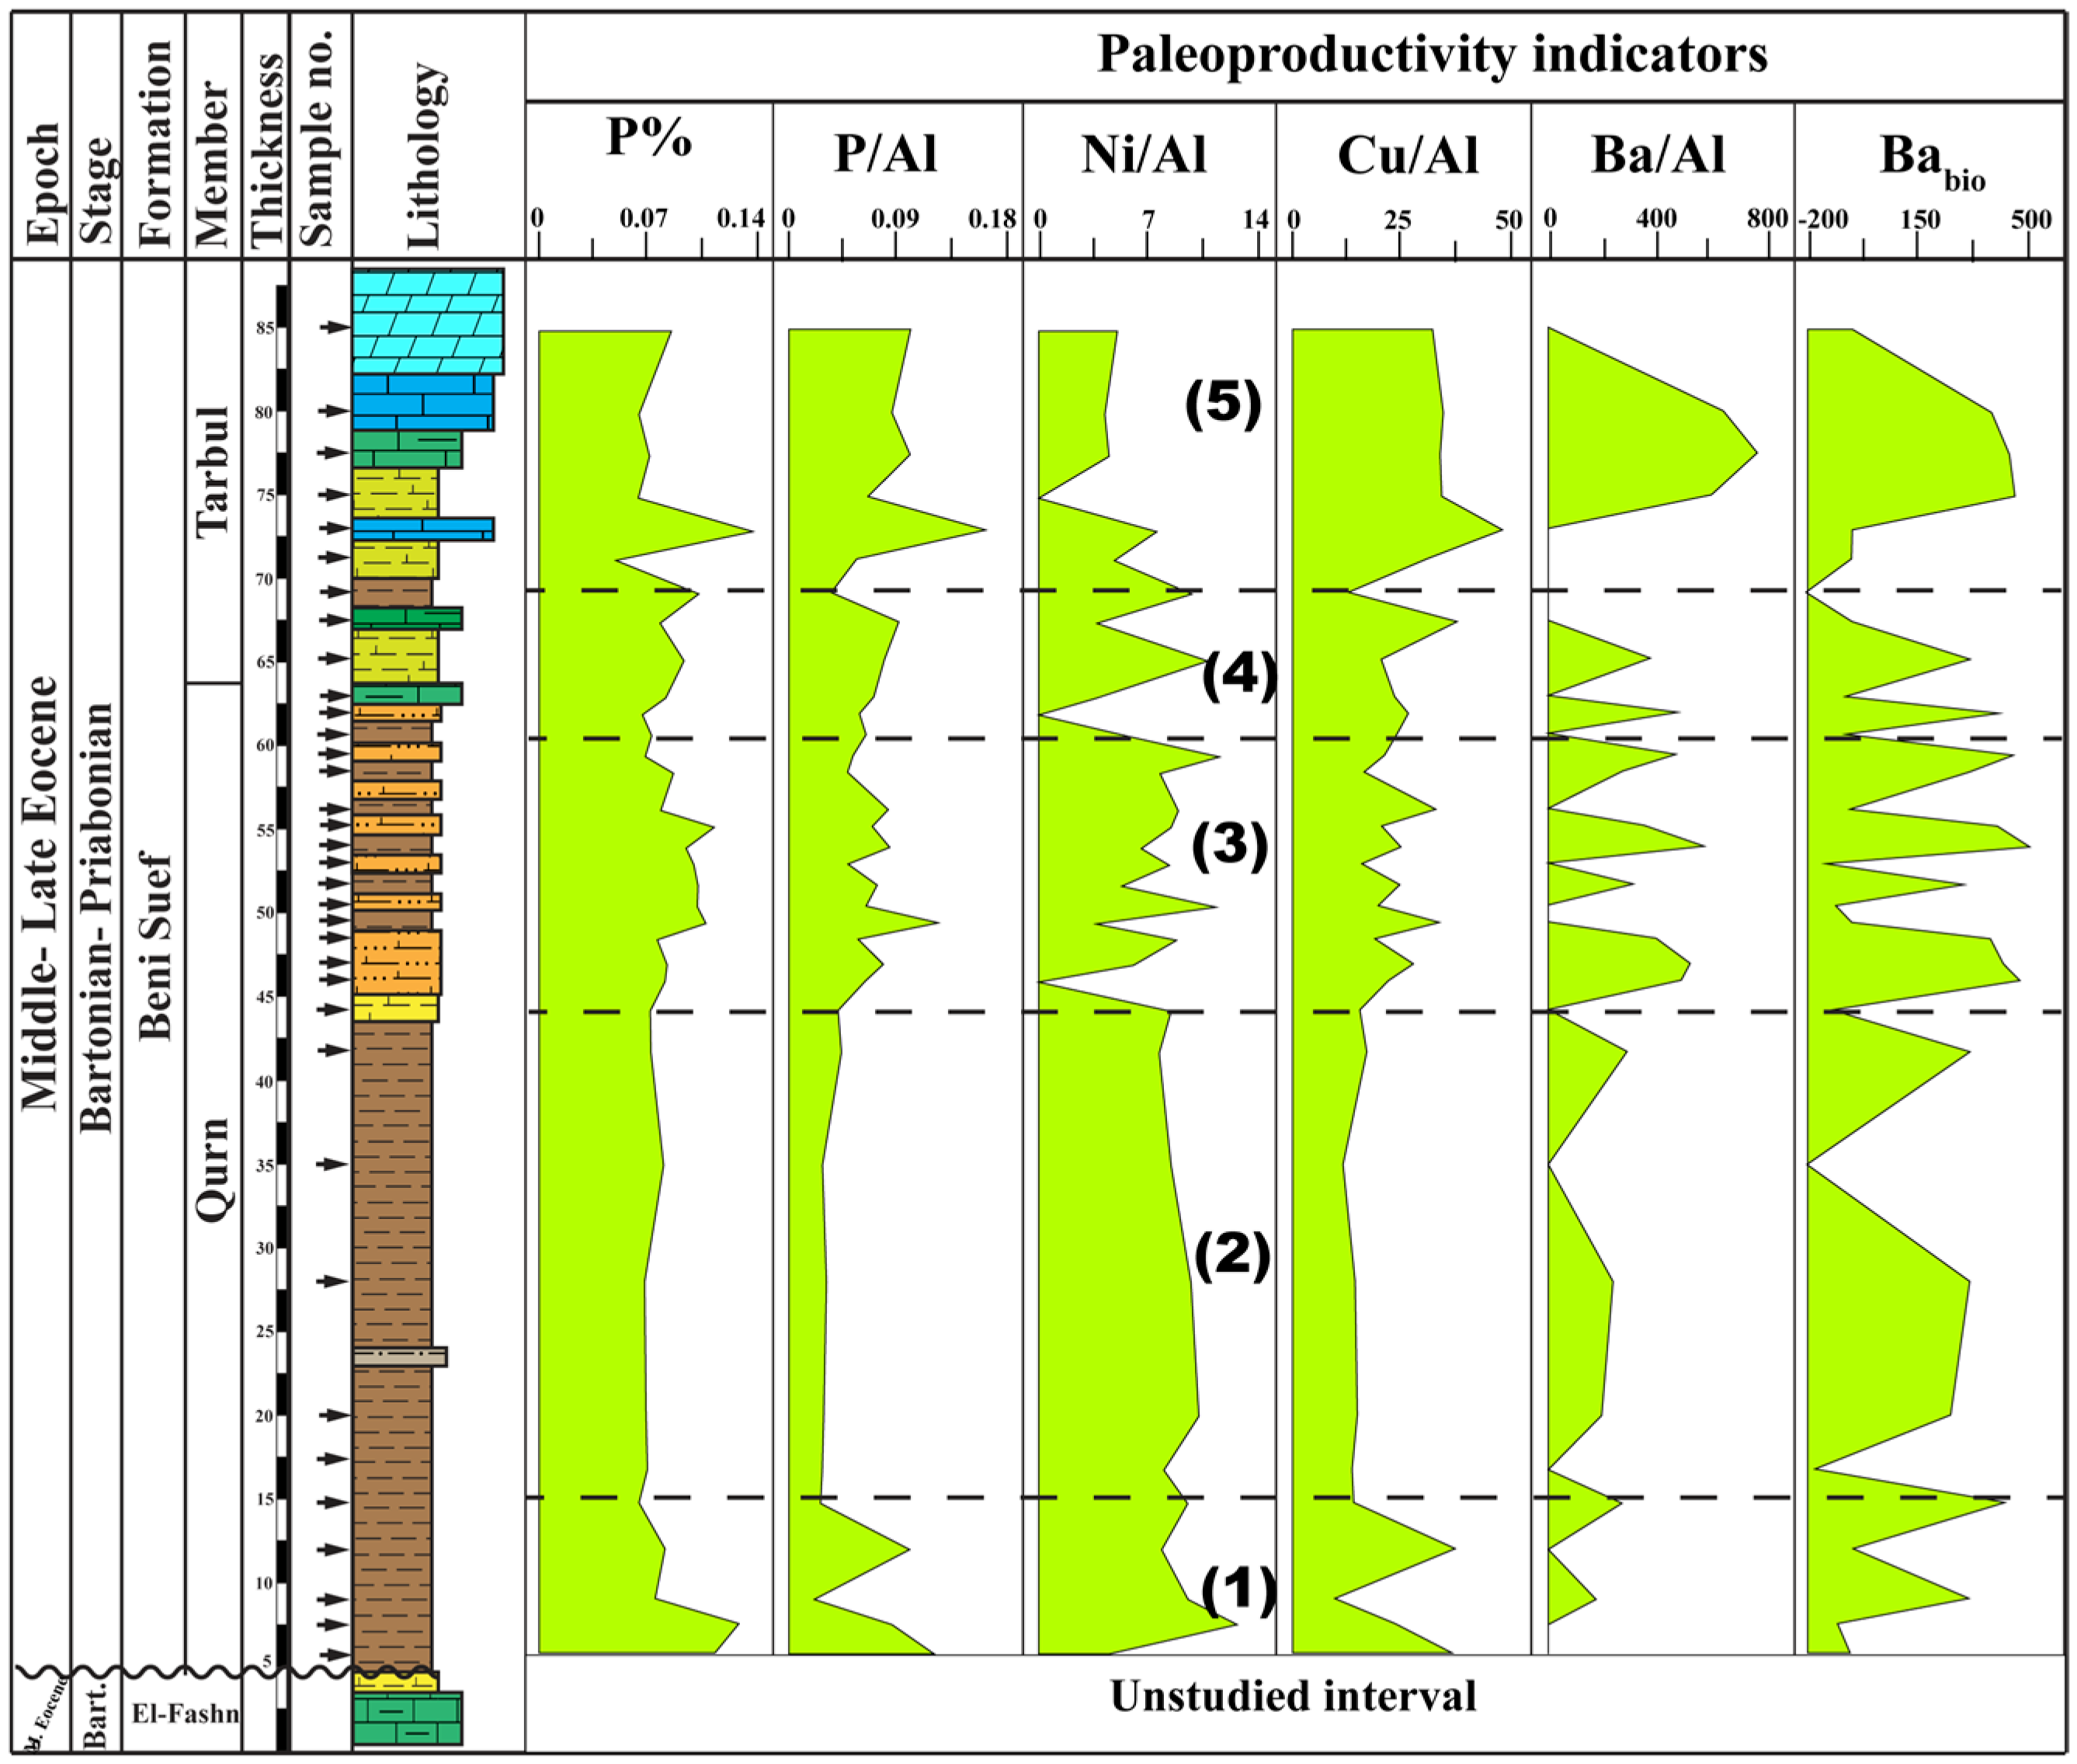
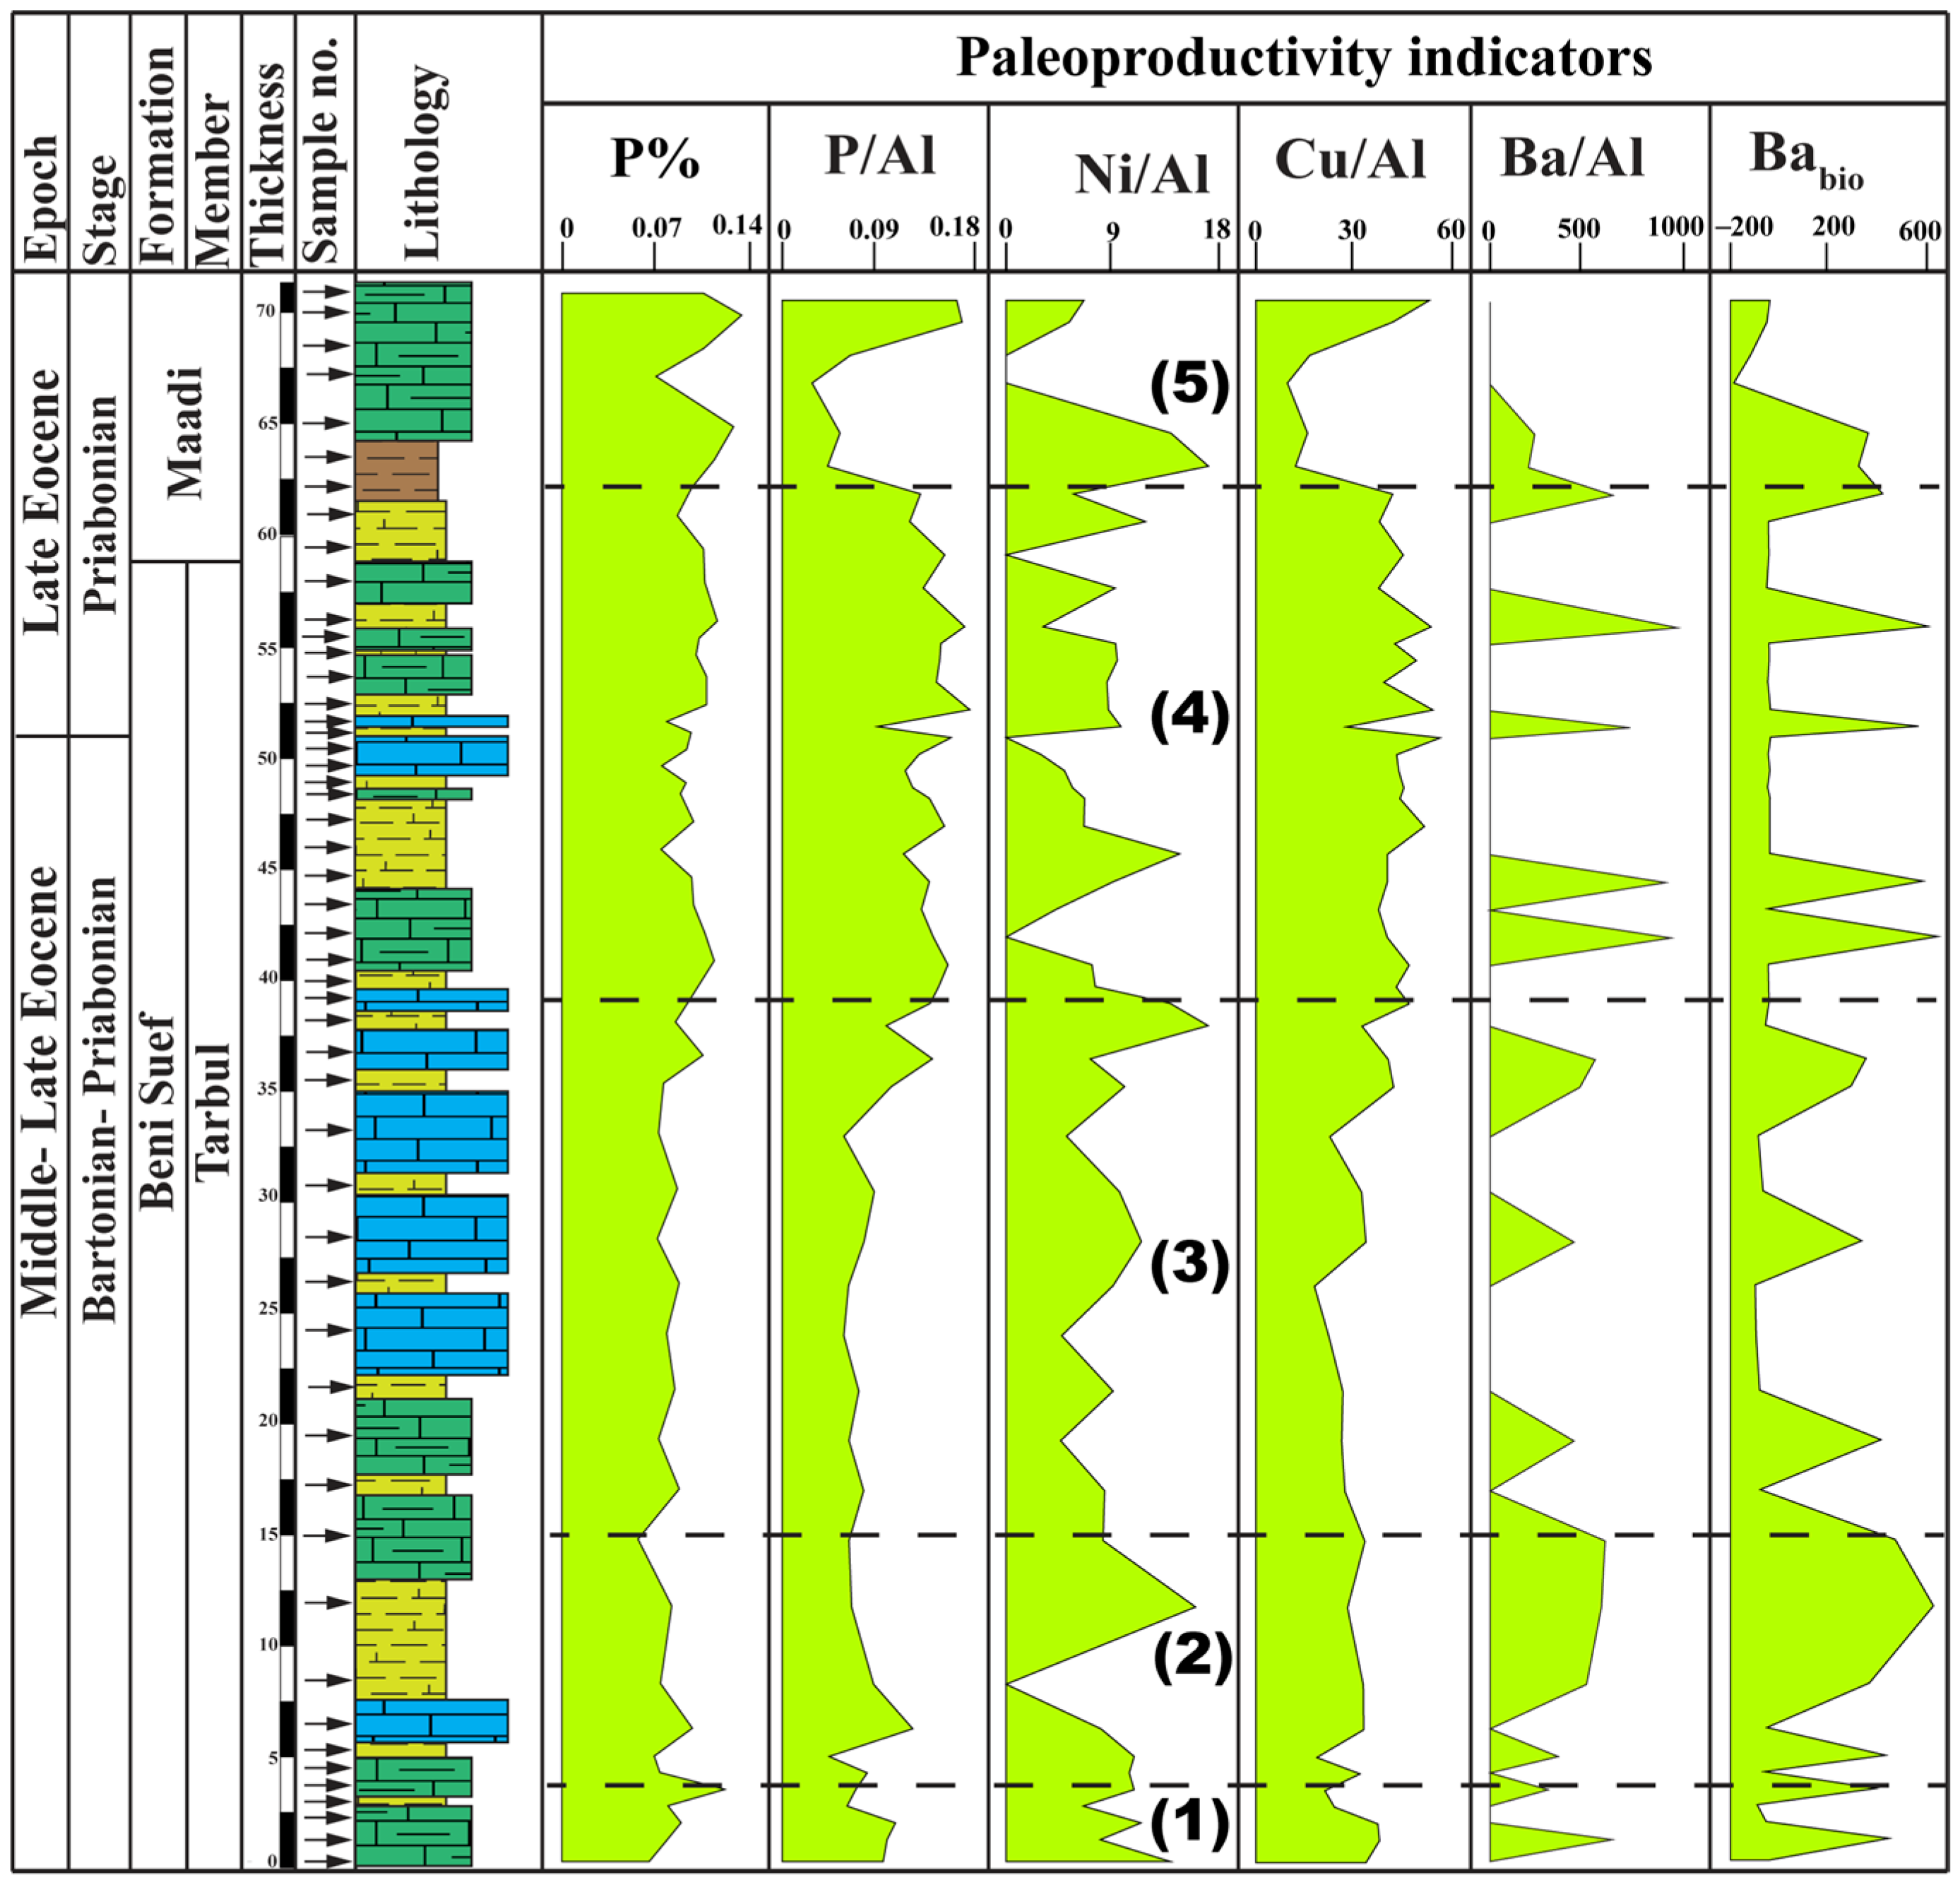
Paleoproductivity indicators display significant differences (Supplementary Materials). Phosphorus (P) concentrations exhibit generally low values, vary between 0.04 and 0.13% (mean = 0.081%), coinciding with the low P/Al ratios (0.022%–0.168%; mean = 0.070%), and P/Ti ratios (0.15%–3.03%; mean = 1.13%; Figure 11 and Figure 12). Ba/Al ratios in the dataset span a wide range (0–915) and averaged 174.46, with several exceptionally high pulses marking distinct export productivity episodes (e.g., at 56.25 m (915), 42.25 m (883), 44.75 m (858), and 1.5 m (596), see Supplementary Materials). The Ni/Al across the studied interval ranged from 0 to 16.25, while the Cu/Al ratios ranged from 9.6 to 56.35. Biogenic Ba values also exhibit strong fluctuations, ranging from −205 to 500 ppm.

4.3. Assessment of Harmonic Signals in Mn/Fe Ratios

The log [Mn/Fe] signature measured in section A shows an initial drop from log [Mn/Fe] −1.5 to −2.3, fluctuating around −2 between 10 and 21 m, followed by an increase to −1.2, only to rebound back to −1.8 at 29 m. Above 29 m, the series fluctuates between −1.7 and 1.2, then drops again to −2.4, followed by a final increase to −1.5 between 49 and 51 m.
The by almost 30 m thinner section A shows an initial drop from log [Mn/Fe] −1.3 to −2.6 between 0 and 8 m. This is followed by a plateau phase, during which values fluctuate between −1.8 and −2.3. Inflicted by a drop to −2.7 at ~28 m, we can document an increase to almost −1.3 in the last metres of section A. Upon evaluating the log [Mn/Fe] values for harmonic signals, the log [Mn/Fe] values hint at the preservation of a cyclic pattern in section B, while the assessment of the spectral density of section A was hampered by the low sample density and resolution. Spectral analysis of the Mn/Fe series of section B (Figure 13) reveals a prominent low-frequency peak centred at ~0.03. The resulting band-passed signal shows a wavelength of approximately ~33 sample periods.

5. Discussion

5.1. Enrichment Factors

The behaviour of specific trace elements, such as molybdenum (Mo), uranium (U), chromium (Cr), and cobalt (Co), is greatly influenced by the dominant redox state of the bottom waters, where these elements tend to be concentrated under anoxic conditions [16]. In anoxic environments, Mo is less soluble, which enhances its transfer from the water column to sediments, leading to pronounced authigenic enrichment. Similarly, Cr and Co also exhibit this behaviour. In contrast, other trace elements, such as Nickel (Ni), Copper (Cu), and Zinc (Zn), are typically deposited under better, well-oxygenated conditions alongside organic matter enrichment during periods of increased biological productivity [16]. Furthermore, these elements are associated with pyrite in sediments after the decomposition of organic matter by sulphate-reducing bacteria.
In the present work, the observed variability in the enrichment factors for Mo, Cr, Ni, Cu, and Zr reflects the dynamic depositional conditions in the Eocene sediments of the Beni Suef area. The elevated Mo values indicate intervals of restricted bottom-water circulation and the development of suboxic conditions, which facilitated strong Mo sequestration in sulphur-rich sediments. This is consistent with the well-established behaviour of Mo as a redox-sensitive trace metal in marine environments [55,56]. Moderate enrichment of Cr and Cu suggests fluctuating redox conditions but generally suboxic environments. Similar enrichment levels for Cr and Cu have been linked to intermittent oxygenation in marginal marine settings [16,57]. In contrast, the low Ni enrichment implies limited organic complexation under dominantly oxidizing depositional conditions, although localized increases may reflect short-term episodes of enhanced productivity or fine-grained detrital input [16]. The moderate Zr enrichment primarily reflects detrital control rather than true enrichment, consistent with findings from modern shelf and hemipelagic deposits [55]. Consequently, the trace element patterns of the present study imply alternating oxic–suboxic depositional conditions, potentially linked to sea-level oscillations and to productivity-driven oxygen depletion during the Late Eocene.

5.2. Geochemical Zonation and Elemental Associations: Implications for Depositional Processes

The geochemical zonation in section A reflects repeated shifts between carbonate-dominated sedimentation and episodes of increased siliciclastic input, a pattern commonly observed in Tethyan carbonate platform systems, where variations in terrigenous supply control sediment composition [59]. Notably, the high CaO and CaCO3 contents, coupled with low siliciclastic proxies and trace-metal concentrations, indicate phases of dominant carbonate-platform sedimentation under limited terrigenous influence, a geochemical signature typical of shallow-marine carbonate shelves within the Tethyan realm [60,61]. In contrast, intervals characterized by reduced carbonate contents and elevated SiO2, Al2O3, Fe2O3, TiO2, Zr, and trace metals record episodes of enhanced detrital supply and increased siliciclastic influx derived from nearby continental sources [53,54]. Intermediate zones showing strong fluctuations in carbonate and siliciclastic proxies indicate unstable depositional conditions with alternating dominance of carbonate production and clastic input, a characteristic response of carbonate platforms to variations in sea level and continental runoff [59]. The upward transition toward intervals with increased carbonate components and reduced siliciclastic indicators reflects a return to more stable carbonate sedimentation with limited continental influence, consistent with periods of enhanced carbonate productivity in clear-water Tethyan shelf environments [61]. Short-lived siliciclastic pulses marked by elevated detrital proxies interrupt this trend, but these are followed by renewed carbonate accumulation characterized by very high CaCO3 contents, low trace-metal enrichment, and reduced TOC values, indicating re-establishment of clear-water carbonate platform conditions typical of low-detrital carbonate systems [59].
The geochemical evolution of section B similarly records alternating phases of carbonate-dominated sedimentation and enhanced siliciclastic input. Intervals characterized by high CaO and CaCO3, together with low siliciclastic proxies and trace-metal concentrations, reflect periods of reduced continental influence and stable carbonate-platform deposition, a common geochemical expression of carbonate-platform development across the Tethyan margin [61]. In contrast, zones showing decreased carbonate contents and enrichment in SiO2, Al2O3, Fe2O3, TiO2, and trace elements indicate intensified terrigenous influx and dilution of carbonate sediments [53], locally accompanied by improved organic matter preservation under enhanced sediment supply [62]. Transitional intervals with moderate siliciclastic contents suggest gradual stabilization following detrital input events, during which carbonate production resumed while clastic supply persisted at lower levels [59]. Highly homogeneous carbonate-rich intervals represent phases of sustained platform development under relatively clear marine conditions, which are typical of stable carbonate shelves in the Tethyan domain [61]. The pronounced siliciclastic pulse recorded in the lower part of Zone 5 reflects a major disturbance marked by strong detrital and metal enrichment, followed by rapid geochemical recovery and re-establishment of carbonate sedimentation, indicating renewed stabilization of the depositional system after the disturbance [58].
The correlation patterns indicate the presence of two principal geochemical associations reflecting contrasting sediment sources. A tightly coupled group composed of aluminosilicate- and Fe-bearing elements represents a common siliciclastic fraction derived from terrigenous input, with strong inter-element relationships and contributions from heavy minerals typical of continental detrital assemblages [53]. In contrast, the strong coupling between CaO and CaCO3 defines a carbonate-dominated component that varies inversely with the detrital assemblage, reflecting dilution between carbonate production and siliciclastic supply in mixed carbonate–siliciclastic systems [53,60]. The positive relationship between Sr and carbonate components supports its incorporation into carbonate mineral phases through substitution for Ca in carbonate lattices [63]. Trace metals such as Zn, Ni, and Cd show strong affinities with Fe-rich and aluminosilicate fractions, suggesting that their distribution is largely controlled by detrital input rather than exclusively by redox processes [17,64]. Mo displays a distinct behaviour compared with the detrital group, indicating localized enrichment related to redox-sensitive processes within marine sediments [55]. The association of P2O5 with Mn-bearing phases suggests redox-related scavenging processes commonly observed in marine sediments [65]. In contrast, the weak and inconsistent correlations of TOC imply that organic matter accumulation was only weakly linked to both carbonate productivity and siliciclastic supply, reflecting multiple environmental controls on organic matter preservation, such as oxygenation, sedimentation rate, and productivity [62,66].

5.3. Detrital Proxies

Variations in terrigenous sediment flux can strongly affect the geochemical composition of sediments. Changes in the intensity of sediment transport processes such as wind and wave action can influence the grain size of siliciclastic minerals and their associated elements, including Ti, Zr, Si, Al, Fe, and K [31]. Zirconium (Zr) predominantly occurs in heavy minerals, particularly within silt-sized detrital zircon, whereas titanium (Ti) is distributed across silt- and sand-sized fractions as well as within clay minerals [54]. Aluminum (Al) is primarily present in clay minerals, while silicon (Si) is commonly found in both quartz and clay minerals. Thus, the evaluation of detrital and siliciclastic input is performed by analyzing the elemental ratios of Si/Al, Ti/Al, and Zr/Al [54,67,68,69].
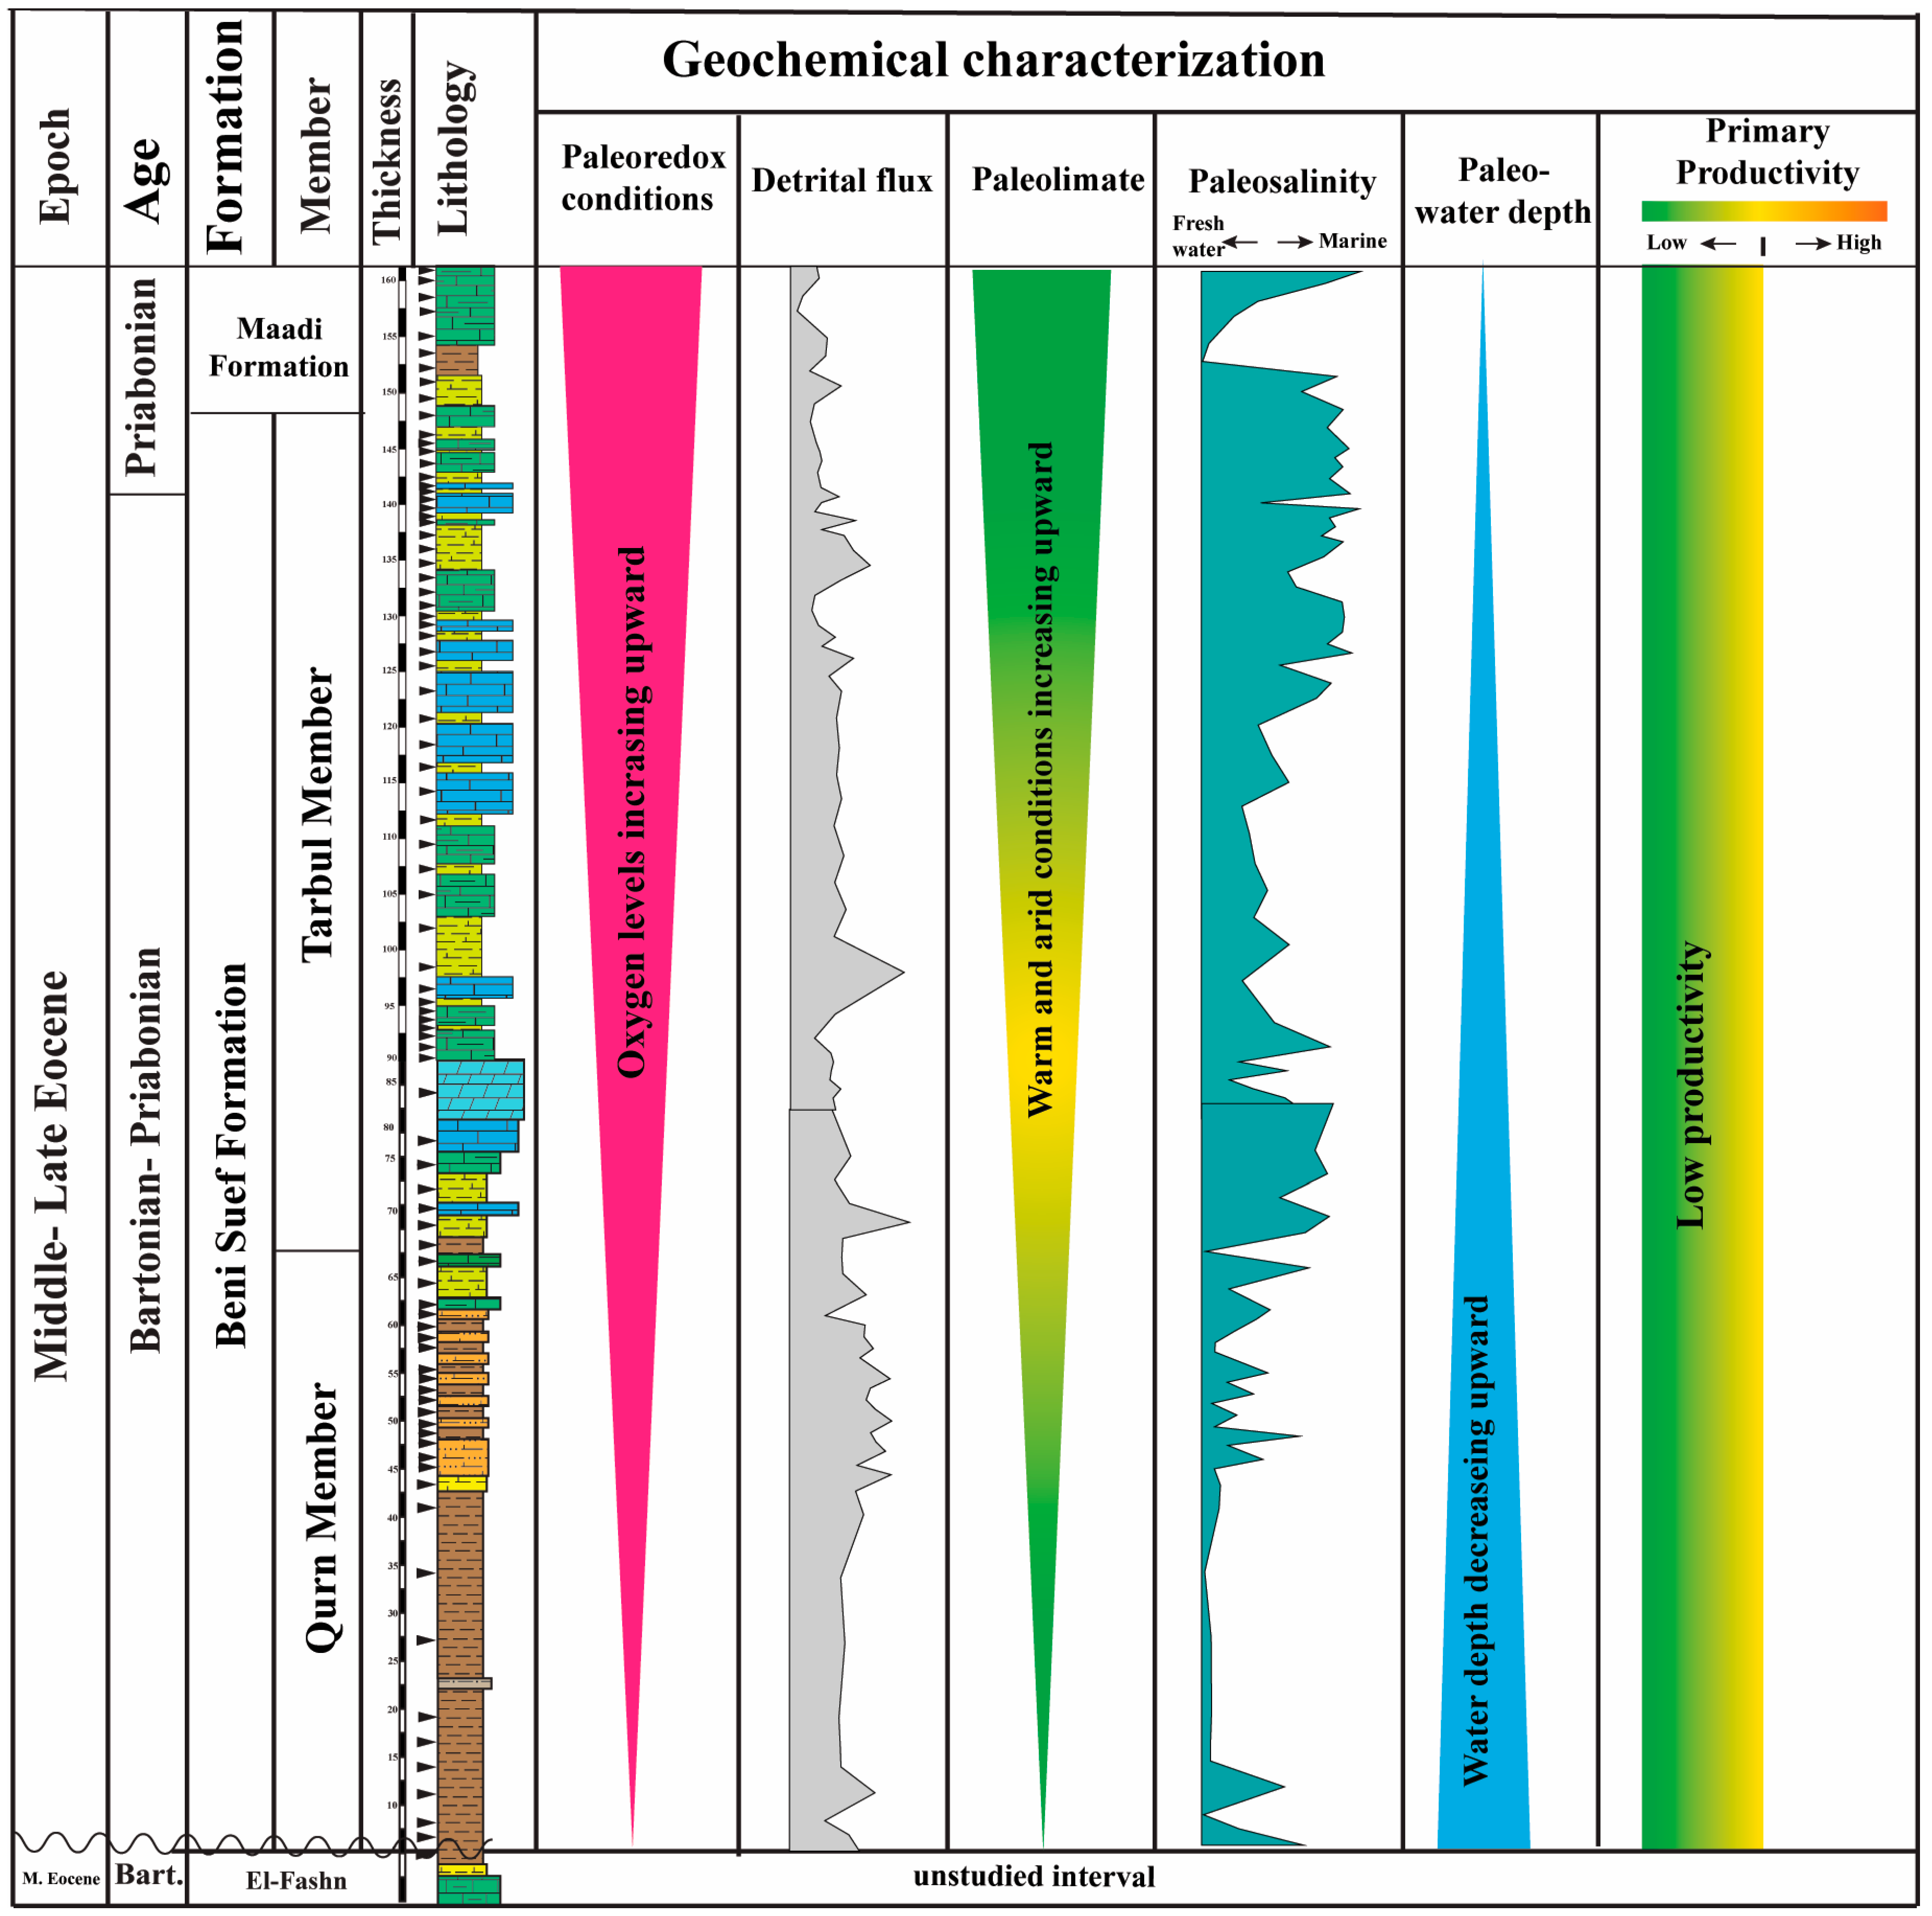
The studied succession displays a considerable variation in these detrital proxies, indicating fluctuations in the input of siliciclastic material (Figure 7 and Figure 8). These variations likely reflect changes in sedimentary dynamics and/or shifts in the composition of the source material. The upward increase in Si/Al ratios within the Qurn Member indicates an increase in terrigenous sediment flux and a gradual coarsening of sediment grain size, as shown by the transition from well-bedded shales to coarse siltstones and silty marls (Figure 14). This also suggests episodes of intensified continental influx, likely linked to pulses of higher weathering and transport under relatively humid conditions [30,70]. The facies change could be attributed to a shallowing event, probably caused by a drop in sea level, in good agreement with the interpretations previously documented in the same section, which were primarily based on micropaleontological data [20,24,25], and aligns with the Bartonian eustatic sea-level fall [71].
Following upward, the progressive decline in detrital proxy ratios within the Tarbul Member and the overlying Maadi Formation reflects a marked reduction in siliciclastic influx and a shift toward more carbonate-dominated sedimentation. This transition indicates a significant change in sediment supply dynamics, with carbonate productivity increasingly surpassing terrigenous input. The concomitant fining of grain size and facies shift toward carbonate lithologies further corroborate this interpretation, as reflected by the elevated carbonate content documented in these units (Figure 5 and Figure 6). Micropaleontological data provide additional evidence for this environmental transformation, where the Beni Suef Formation records a pronounced decrease in planktonic foraminifera, culminating in their complete absence in the Maadi Formation [24,25]. This decline is accompanied by a distinct increase in shallow-water benthic foraminiferal and ostracod taxa, suggesting a transition toward shallower and more restricted depositional conditions (Figure 14) [20,24]. The similar behaviour of Zr/Al and Ti/Al ratios with Si/Al strengthens the interpretation that these changes primarily reflect variations in terrigenous input.
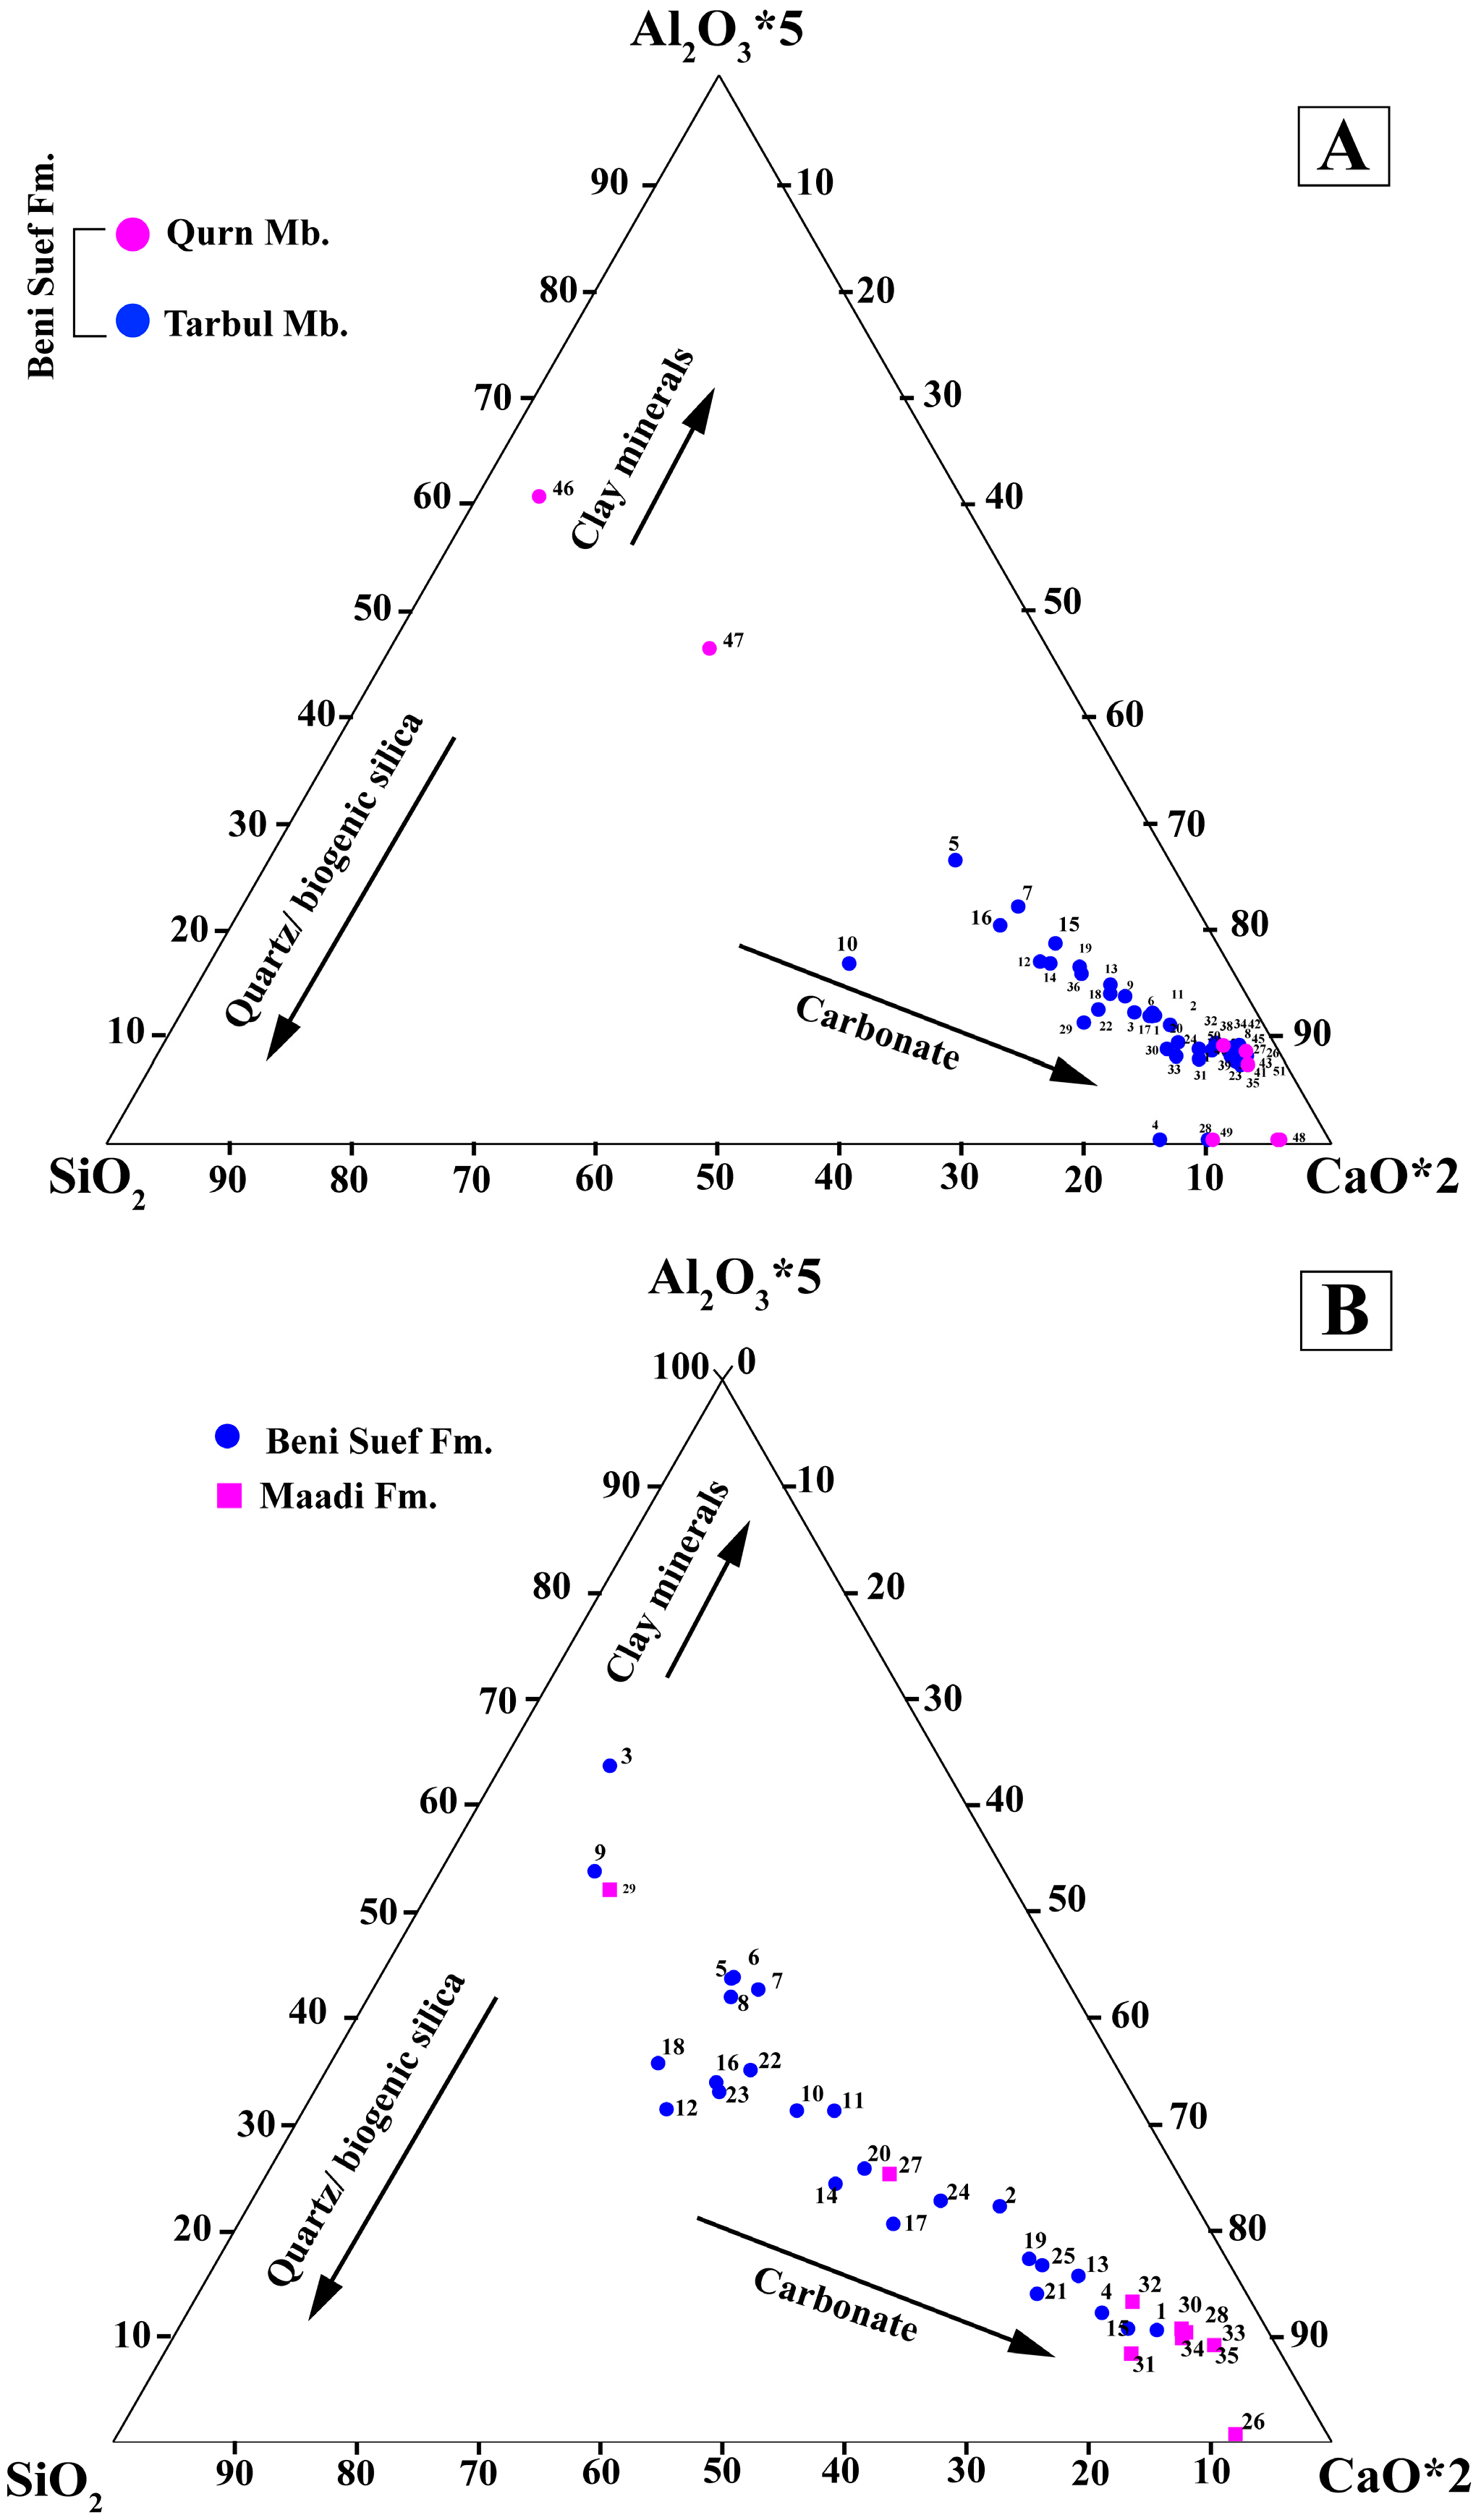
The significant geochemical changes between siliciclastic and carbonate facies correspond with the mineralogical characteristics of the studied section. This is supported by the SiO2–Al2O3–CaO ternary diagram [39], where most samples from the middle part of the Qurn Member are plotted near the quartz-enriched zone, suggesting lithological compositions characterized by higher proportions of silt- and sand-sized sediments (Figure 15). Meanwhile, the samples from the upper part of the Qurn Member, as well as all samples from the Tarbul Member and the Maadi Formation, are plotted in the carbonate content corner. Moreover, some samples are located near the average shale composition line, which is further consistent with abundant clay-size fractions, as evidenced by the Si/Al, Ti/Al, and Zr/Al ratios (Figure 15).

5.4. Paleoclimate Proxies

The Rb/Sr ratios of the studied samples (Figure 9 and Figure 10) indicate strongly arid, oxidizing conditions, with enhanced Sr availability due to carbonate precipitation and low Cu concentration, mostly resulting from restricted terrestrial input. Notably, the low Sr/Cu values suggest relatively humid conditions, in which increased Cu delivery from continental sources reduces the Sr/Cu ratio [72]. Additionally, Sr/Ba and K2O/Al2O3 ratios, when integrated with these proxies, suggest predominantly hot and arid climatic conditions (Figure 14), in line with regional Late Eocene aridification across the Tethys realm [73]. Occasional decreases in both Sr/Cu and Sr/Ba ratios could be attributed to humid-to-semiarid intervals interrupting the prevailing arid climate regime.
The clay minerals also provide valuable insights into the prevailing paleoclimatic conditions [74]. In particular, chlorite and illite, the dominant clay minerals, are typically associated with relatively cool, arid environments. Conversely, kaolinite forms through the intensive chemical weathering of feldspar and mica under warm, humid conditions [75,76]. Smectite, on the other hand, generally develops under seasonally humid to semi-arid climates, where moderate chemical weathering and fluctuating wet–dry conditions promote its formation from volcanic ash or the alteration of mafic silicate minerals [74,77]. The clay mineral composition of the selected samples (8A, 46B, Figure 4) further supports the interpretation of humid to semi-arid episodes during sediment deposition [77,78,79], as evidenced by the dominance of smectite (83%–84%), followed by kaolinite (14%–15%) and minor traces of illite (up to 2%), as shown in Figure 4.
Diagnosing the Middle Eocene Climatic Optimum (MECO) is regionally challenging, making it difficult to detect precisely in the stratigraphic record. Furthermore, it is hard to understand the influence of the MECO on the associated climatic and paleoecological conditions. For instance, the MECO in Turkey has been linked to a transition to warmer and more humid conditions [80,81]. In Italy, the MECO was placed based on the elevated values of the TOC, and high amounts of sulphur/pyrite [82,83], which were further correlated to eutrophic conditions, as inferred from the benthic foraminiferal assemblages [84]. Meanwhile, the Bartonian nummulitic carbonate shoals in southern Spain were interpreted as oligotrophic conditions during the MECO interval [85]. Fluvial sedimentary successions also serve as valuable archives for reconstructing the global climate changes. Sharma et al. [86] employed a multiproxy study, integrating carbon and oxygen stable isotope analysis, chemical weathering proxies, and clay mineralogy of fluvial sediments in the southern Pyrenees, Spain, to evaluate the regional impact of the MECO. Their findings revealed that the Middle Eocene interval was characterized by warmer, drier climatic conditions. The previously documented regional variability in the MECO-related climate signals areas underscores the importance of an integrated, high-resolution, multi-proxy study to accurately define its stratigraphic position and paleoenvironmental impact.
The Late Eocene is marked by a gradual global cooling, culminating at the Eocene Oligocene Transition (EOT), associated with an increase in deep-sea oxygen isotope values and a significant decline in atmospheric CO2, together with evidence of a transient ice sheet in the polar areas, suggesting a minor warming in global temperatures [1,87]. Geochemical proxies indicate an arid, warm climate, transitioning to semi-humid conditions at times, consistent with the global climate pattern during this interval. These findings align well with similar patterns reported from the Upper Eocene of Oman [88]. Similar climatic fluctuations have also been reported from the Middle-Upper Eocene sediments of the Pearl River Mouth Basin in northern China, where pollen and geochemical data reflect changes from a warm and humid climate to warm, semi-humid/semi-arid conditions [89]. Meanwhile, geochemical, sedimentological, and palynological criteria from the southeastern Tibet plateau pointed to more humid conditions [90,91]. In North America, particularly in Oregon, Montana, and Nebraska, paleosol records revealed regional variability in moisture availability during the Late Eocene. Meanwhile, Oregon and Nebraska experienced increased humidity, and Montana remained only sub-humid due to its position within the rain shadow of the Rocky Mountains [92]. These global variations show that the Late Eocene climate fluctuated and likely correspond to regional paleogeographic and tectonic settings.
Our findings indicate that the observed arid conditions most likely correspond to the MECO, coinciding with a global warming peak reflecting a major hyperthermal event, as similarly recorded in regions including the Southern Atlantic, Southern Tethys, Indian Ocean, Spain, and Turkey [4,11,21,80,93,94]. Moreover, the transition from semi-arid to humid conditions recorded during the Late Eocene is consistent with the climate patterns reported from the Late Eocene deposits of Oman [88] and recent findings from Egypt [11]. While the elemental geochemistry and clay mineralogy presented in this work support the interpretation of warm, arid conditions typically associated with the MECO, the lack of high-resolution isotope stratigraphy limits the ability to accurately locate this event.

5.5. Paleosalinity Proxies

In this study, salinity-sensitive ratios exhibit notable stratigraphic variation (Figure 9 and Figure 10). Accordingly, elevated Sr/Ba ratios characterizing intervals enriched in biogenic carbonate, consistent with enhanced marine influence and high carbonate productivity (e.g., foraminifera, coralline algae), as commonly observed in shallow-marine carbonate platforms [95]. The Ca/Al and Mg/Al ratios display a progressive upward increase, denoting enhanced carbonate accumulation and marine-dominated deposition, possibly linked to Late Eocene sea-level highstands within the Tethys realm [96]. High Mg/Al × 100 values further corroborate this trend, reflecting intensified dolomitization or marine cation enrichment during transgressive pulses.
These geochemical indicators collectively suggest a predominantly marine depositional setting, with minor episodes of freshwater influence (Figure 14), inferred from intervals showing reduced Sr/Ba values (<0.5, reaching 0.3) and low Ca/Al ratios (reaching 0.28; see Figure 9 and Figure 10 and Supplementary Materials).

5.6. Paleohydrodynamics and Paleo-Water Depth Proxies

Paleohydrodynamics and paleo-water-depth proxies are widely used to evaluate the energy regime of the water column and to determine depositional settings. Notably, Zr is a stable and widely occurring element that typically remains unaltered in continental and shallow-marine environments [97]. In contrast, rubidium (Rb) is a more mobile element that preferentially accumulates in deeper, low-energy depositional settings [98,99]. Consequently, the Zr/Rb ratio serves as a reliable proxy for reconstructing paleohydrodynamic conditions: low values in deeper environments indicate weak hydrodynamic water circulation, whereas high values imply shallower, stronger hydrodynamic conditions. Accordingly, in the investigated sections, Zr/Rb ratios below 0.92 indicate weak hydrodynamic activity; values between 1.25 and 4.76 indicate an intermediate to strong regime; and ratios above 4.76 indicate more energetic settings with stronger water circulation. Furthermore, Iron and manganese (Mn) exhibit distinct behaviours during sedimentation and transport processes [41]. Iron tends to oxidize readily and precipitate under oxidizing conditions, whereas the greater solubility and stability of manganese enable its transport into deeper water settings [41]. Consequently, the Fe/Mn ratio serves as a useful proxy for reconstructing paleo-water depth, with higher ratios generally indicating shallower depositional environments. In the present work, the observed geochemical patterns of Zr/Rb and Fe/Mn ratios donate a moderate to high-energy paleohydrodynamic regime and within an overall shallow marine environment (Figure 14). This interpretation is further corroborated by the abundance of disoriented and fragmented macrofaunal assemblages (gastropods and bivalves), the occurrence of large benthic foraminifera (Nummulites spp.), and intense Thalassinoides spp.’s bioturbation activity. These are characteristic of inner-shelf settings with well-oxygenated, clear, and warm environmental conditions [10,20,21,24].

Cyclic Behaviour of the Mn/Fe Ratios

The extracted low-frequency Mn/Fe cycle (~0.03) may represent part of a long (low-frequency) oscillation in bottom-water redox conditions that could have been driven by orbitally paced sea-level and climate variations. Orbital forcing can modulate global climate and ice volume, which in turn affects ocean circulation and eustatic sea level. Such astronomically driven variations are commonly expressed in the stratigraphic record as fourth-order depositional sequences. The low-frequency component isolated here through spectral filtering may tentatively reflect the expression of such orbitally paced variability in the Mn/Fe signal.
Considering the total thickness of section B, the prominent signal at a frequency of 0.03 in section B (Figure 13) could represent a longer stable orbital signal, probably related to an eccentricity signal that is one of the drivers behind sea-level fluctuations [100]. Considering an average sedimentation rate of ~0.6 m per Kyr, consistent with published rates for Eocene carbonate ramps of the southern Tethys—e.g., Sayed et al. and Bohaty and Zachos [10,11]. Thus, the combined 140 m thickness of the Beni Suef and Maadi sections accounts for ~230 Kyr. Oscillations in the Mn/Fe series appear to track shifts between more oxic versus more dysoxic depositional conditions, likely linked to eustatic sea-level changes and associated climate forcing.

5.7. Primary Productivity Proxies

In this work, paleoproductivity indicators display significant variations (Supplementary Materials and Figure 11 and Figure 12). Overall low phosphorus, Ni/Al, and Cu/Al ratios suggest generally limited nutrient availability and low primary productivity during deposition, and also correspond to more oxygenated or energy-dominated depositional conditions [101]. The pronounced variability in Ba/Al ratios, including distinct peaks, indicates intervals of enhanced barite formation, typically associated with increased organic carbon export to the seafloor [102]. In contrast, the numerous zero values indicate settings dominated by carbonate sedimentation, where barite is diluted or fails to precipitate due to oxygenated bottom waters, shallow depth, or limited export flux [103]. The Ni/Al across the studied interval points to low to moderate Ni enrichment relative to aluminosilicate background levels. Most values cluster between 5 and 11, suggesting a dominantly detrital origin for Ni with minor contributions from authigenic or organic-associated phases. Isolated higher ratios may reflect intervals of enhanced paleoproductivity or increased organic-matter export to the sediment. In contrast, intervals with low Ni/Al ratios represent phases of extremely low organic-matter flux or strong dilution by carbonate or siliciclastic sediment, a pattern comparable to the low-productivity or high-dilution horizons documented by Calvert and Pedersen [67] in open-marine settings. Consequently, the alternation between pronounced Ni/Al peaks and near-zero supports a depositional system characterized by fluctuating productivity, possibly linked to episodic nutrient supply, shifts in circulation, or changes in detrital dilution, consistent with patterns recognized in global paleoceanographic studies. Similarly, the Cu/Al exhibits a broader range, signifying generally moderate to high Cu enrichment relative to aluminosilicate inputs. The observed peaks at some intervals likely indicate periods of enhanced organic matter flux and reducing diagenetic conditions, as copper is strongly scavenged by organic ligands and sulphide phases in low-oxygen environments [16]. Accordingly, the elevated Cu/Al intervals therefore reflect episodic suboxia, possibly linked to transient stratification or high biological productivity, consistent with shallow-restricted marine basins. Intermediate values, which dominate much of the profile, correspond to mixed redox conditions and moderate organic matter burial, typical of nearshore–lagoonal settings with fluctuating oxygenation [104]. The lowest enrichments suggest well-oxygenated, high-energy conditions, in which copper remains mostly in detrital aluminosilicates rather than in authigenic phases [57]. Overall, Cu/Al variability records shift between oxygen-rich intervals and short-lived episodes of reduced conditions, paralleling Ni/Al trends and reinforcing evidence for dynamic bottom-water chemistry.
Biogenic Ba values exhibit strong fluctuations, reflecting a highly dynamic paleoproductivity system (Figure 11 and Figure 12). Notably, strong positive peaks represent robust episodes of enhanced production, corresponding to sustained biological activity and efficient transfer of organic matter to the seafloor. These intervals coincide with water-column stratification, reduced oxygenation, or increased nutrient regeneration, conditions favourable for barite nucleation [103,105]. The negative Babio values found throughout large parts of the sections reflect intervals of carbonate or detrital dilution, where biogenic barite is either absent or overwhelmed by non-biogenic sediment components [106]. Such oscillations between negative and positive Babio regimes are characteristic of shallow restricted marine basins, where freshwater pulses, carbonate productivity, and changing circulation strongly modulate barite preservation.
Finally, we interpret the observed low paleoproductivity as due to strong hydrodynamic circulation in shallow marine environments and/or a high input of terrestrial detritus, both of which could have constrained the establishment of favourable ecological conditions for productivity (Figure 14). The low primary productivity is further reflected in the low TOC content (Figure 5 and Figure 6), which is widely recognized as a key factor controlling organic matter preservation. Moreover, the reduced TOC values may be associated with prevailing oxic depositional conditions, high sedimentation rates, and/or arid climatic conditions, which together create unfavourable settings for organic matter accumulation [11,21].

6. Conclusions

The Middle–Upper Eocene succession of the northeastern Desert of Egypt comprises two lithostratigraphic units: the Beni Suef Formation (Bartonian–Priabonian) and the Maadi Formation (Priabonian). Geochemical proxies collectively indicate that deposition occurred in predominantly shallow-marine, inner-neritic environments under moderate to high-energy hydrodynamic conditions. Variations in the log [Fe/Mn] curve indicate cyclic changes linked to sea-level fluctuations. The Beni Suef Formation reflects increased siliciclastic influx during the late Middle Eocene, indicating intensified continental runoff and relative sea-level fall. In contrast, the Maadi Formation records more carbonate-dominated sedimentation under oxic shallow-marine conditions. Low TOC values and paleoproductivity proxies confirm limited organic carbon accumulation, primarily controlled by oxic bottom waters, strong hydrodynamic circulation, high sedimentation rates, and/or arid climatic conditions. Paleoclimate indicators document a clear transition from relatively humid conditions in the Middle Eocene to progressively arid conditions in the Late Eocene, consistent with regional aridification across the southern Tethyan margin. Paleosalinity elemental ratios suggest predominantly normal marine conditions with minor, short-lived freshwater influence.

Supplementary Materials

The following supporting information can be downloaded at: https://www.mdpi.com/article/10.3390/min16040361/s1.

Author Contributions

Conceptualization, M.W., M.W., P.H. and I.M.A.E.-G.; methodology, M.M.S., I.M.A.E.-G., D.M.S., R.M.E.-K., E.W., R.A.H., A.M. and S.G.; validation, M.W., P.H. and I.M.A.E.-G.; formal analysis, M.M.S., R.M.E.-K., S.G., D.M.S., E.W., A.A., R.A.H. and I.M.A.E.-G.; investigation, S.G., M.M.S., R.M.E.-K. and I.M.A.E.-G.; data curation, M.W., P.H. and I.M.A.E.-G.; writing—original draft preparation, M.M.S., P.H., M.W., R.M.E.-K. and A.M., D.M.S., E.W. and I.M.A.E.-G.; writing—review and editing, M.M.S., R.M.E.-K., A.A., D.M.S., P.H., M.W. and I.M.A.E.-G.; visualization, P.H., M.W., R.M.E.-K. and I.M.A.E.-G.; supervision, M.W., P.H. and I.M.A.E.-G. All authors have read and agreed to the published version of the manuscript.

Funding

This research received no external funding.

Institutional Review Board Statement

Not applicable.

Informed Consent Statement

Not applicable.

Data Availability Statement

The original contributions presented in this study are included in the article.

Acknowledgments

The authors are grateful to the Ministry of Higher Education of the Arab Republic of Egypt for funding this work. We also acknowledge Beatrix Bethke from the University of Vienna for laboratory support. We thank the support provided by UNESCO IGCP 732 LANGUAGE of the Anthropocene. Open Access Funding by the University of Vienna.

Conflicts of Interest

The authors declare no conflicts of interest.

References

  1. Zachos, J.; Pagani, M.; Sloan, L.; Thomas, E.; Billups, K. Trends, rhythms, and aberrations in global climate 65 Ma to present. Science 2001, 292, 686–693. [Google Scholar] [CrossRef]
  2. Coxall, H.K.; Pearson, P.N. The Eocene–Oligocene Transition; Geological Society of London: London, UK, 2007. [Google Scholar]
  3. Lear, C.H.; Bailey, T.R.; Pearson, P.N.; Coxall, H.K.; Rosenthal, Y. Cooling and ice growth across the Eocene-Oligocene transition. Geology 2008, 36, 251–254. [Google Scholar] [CrossRef]
  4. Bohaty, S.M.; Zachos, J.C. Significant Southern Ocean warming event in the late middle Eocene. Geology 2003, 31, 1017–1020. [Google Scholar] [CrossRef]
  5. Tripati, A.K.; Roberts, C.D.; Eagle, R.A. Coupling of CO2 and ice sheet stability over major climate transitions of the last 20 million years. Science 2009, 326, 1394–1397. [Google Scholar] [CrossRef]
  6. Pszonka, J.; Žecová, K.; Wendorff, M. Oligocene turbidite fans of the Dukla Basin: New age data from the calcareous nannofossils and paleoenvironmental conditions (Cergowa beds, Polish–Slovakian borderland). Geol. Carpathica 2019, 70, 311–324. [Google Scholar] [CrossRef]
  7. Westerhold, T.; Marwan, N.; Drury, A.J.; Liebrand, D.; Agnini, C.; Anagnostou, E.; Barnet, J.S.; Bohaty, S.M.; De Vleeschouwer, D.; Florindo, F. An astronomically dated record of Earth’s climate and its predictability over the last 66 million years. Science 2020, 369, 1383–1387. [Google Scholar] [CrossRef]
  8. De Lira Mota, M.A.; Dunkley Jones, T.; Sulaiman, N.; Edgar, K.M.; Yamaguchi, T.; Leng, M.J.; Adloff, M.; Greene, S.E.; Norris, R.; Warren, B. Multi-proxy evidence for sea level fall at the onset of the Eocene-Oligocene transition. Nat. Commun. 2023, 14, 4748. [Google Scholar] [CrossRef]
  9. Rodrigues de Faria, G.; Lazarus, D.; Renaudie, J.; Stammeier, J.; Özen, V.; Struck, U. Late Eocene to early Oligocene productivity events in the proto-Southern Ocean and correlation to climate change. Clim. Past 2024, 20, 1327–1348. [Google Scholar] [CrossRef]
  10. Sayed, M.M.; Heinz, P.; Abd El-Gaied, I.M.; El-Kahawy, R.M.; Sayed, D.M.; Salama, Y.F.; Al-Hashim, M.H.; Wagreich, M. Paleobiodiversity, Paleobiogeography, and Paleoenvironments of the Middle–Upper Eocene Benthic Foraminifera in the Fayum Area, Western Desert, Egypt. J. Mar. Sci. Eng. 2025, 13, 663. [Google Scholar] [CrossRef]
  11. Sayed, M.M.; Heinz, P.; El-Gaied, A.; Ibrahim, M.; Gier, S.; El-Kahawy, R.M.; Sayed, D.M.; Salama, Y.F.; Abuamarah, B.A.; Wagreich, M. Paleoenvironments and Paleoclimate Reconstructions of the Middle–Upper Eocene Rocks in the North–West Fayum Area (Western Desert, Egypt): Insights from Geochemical Data. Minerals 2025, 15, 227. [Google Scholar] [CrossRef]
  12. Abu Bakr, S.; Abd El-Gaied, I.M.; Abd El-Aziz, S.M.; Sayed, M.M.; Mahmoud, A. Planktonic Foraminifera of the Middle and Upper Eocene Successions at the Northwestern and Northeastern Sides of the Nile Valley, Egypt: Stratigraphic and Paleoenvironmental Implications. Diversity 2025, 17, 116. [Google Scholar] [CrossRef]
  13. Powell, J.H.; Moh’d, B.K. Evolution of Cretaceous to Eocene alluvial and carbonate platform sequences in central and south Jordan. GeoArabia 2011, 16, 29–82. [Google Scholar] [CrossRef]
  14. Höntzsch, S.; Scheibner, C.; Kuss, J.; Marzouk, A.M.; Rasser, M.W. Tectonically driven carbonate ramp evolution at the southern Tethyan shelf: The Lower Eocene succession of the Galala Mountains, Egypt. Facies 2011, 57, 51–72. [Google Scholar] [CrossRef]
  15. Straume, E.O.; Nummelin, A.; Gaina, C.; Nisancioglu, K.H. Climate transition at the Eocene–Oligocene influenced by bathymetric changes to the Atlantic–Arctic oceanic gateways. Proc. Natl. Acad. Sci. USA 2022, 119, e2115346119. [Google Scholar] [CrossRef]
  16. Bennett, W.W.; Canfield, D.E. Redox-sensitive trace metals as paleoredox proxies: A review and analysis of data from modern sediments. Earth-Sci. Rev. 2020, 204, 103175. [Google Scholar] [CrossRef]
  17. Calvert, S.; Pedersen, T. Geochemistry of recent oxic and anoxic marine sediments: Implications for the geological record. Mar. Geol. 1993, 113, 67–88. [Google Scholar] [CrossRef]
  18. Messaoud, J.H.; Thibault, N.; Bomou, B.; Adatte, T.; Monkenbusch, J.; Spangenberg, J.E.; Aljahdali, M.H.; Yaich, C. Integrated stratigraphy of the middle-upper Eocene Souar Formation (Tunisian dorsal): Implications for the middle eocene climatic optimum (MECO) in the SW Neo-Tethys. Palaeogeogr. Palaeoclimatol. Palaeoecol. 2021, 581, 110639. [Google Scholar] [CrossRef]
  19. Raafat, S.A.; Kora, M.A.; Abdel-Fattah, Z.A.; Al Menoufy, S.G. Middle to late Eocene Nummulites from the southern Tethys, Fayum, Egypt: Taxonomic, biostratigraphic, and paleobiogeographic context. J. Paleontol. 2025, 99, 1–25. [Google Scholar] [CrossRef]
  20. Sayed, M.M.; Abd El-Gaied, I.M.; Abdelhady, A.A.; Abd El-Aziz, S.M.; Wagreich, M. Ostracods sensitivity to reconstructing water depths and oxygen levels: A case study from the Middle–Late Eocene of the Beni Suef area (Egypt). Mar. Micropaleontol. 2022, 175, 102155. [Google Scholar] [CrossRef]
  21. Sayed, M.M.; Heinz, P.; Abd El-Gaied, I.M.; Wagreich, M. Paleoclimate and paleoenvironment reconstructions from middle eocene successions at beni-suef, Egypt: Foraminiferal assemblages and geochemical approaches. Diversity 2023, 15, 695. [Google Scholar] [CrossRef]
  22. Abu Bakr, S.; El-Gaied, I.M.A.; Sayed, M.M.; Heinz, P.; Wagreich, M.; Mahmoud, A. Biostratigraphy, Paleoenvironments, and Paleobiogeography of the Middle–Upper Eocene Ostracods from Northwestern and Northeastern Banks of the Nile Valley, Egypt. Diversity 2025, 17, 293. [Google Scholar] [CrossRef]
  23. Tawfik, M.; El-Sorogy, A.; Moussa, M. Metre-scale cyclicity in Middle Eocene platform carbonates in northern Egypt: Implications for facies development and sequence stratigraphy. J. Afr. Earth Sci. 2016, 119, 238–255. [Google Scholar] [CrossRef]
  24. Abd El-Gaied, I.M.; Salama, Y.F.; Saber, S.G.; Sayed, M.M. Benthic foraminiferal communities of the Eocene platform, north Eastern Desert, Egypt. J. Afr. Earth Sci. 2019, 151, 121–135. [Google Scholar] [CrossRef]
  25. Salama, Y.; Sayed, M.; Saber, S.; Abd El-Gaied, I. Eocene planktonic foraminifera from the north Eastern Desert, Egypt: Biostratigraphic, paleoenvironmental and sequence stratigraphy implications. Palaeontol. Electron. 2021, 24, a11. [Google Scholar] [CrossRef]
  26. Amin, A.T.; El-Mezayen, A.M.; Elkholy, D.M.; Abu-Zeid, E.K.; Khamis, H.A.; Fahmy, W.; Sarhan, H.K. Structural setting, facies characteristics, and geochemical aspects of the Middle-Upper Eocene outcrops along Beni Suef-El Zaafarana New Road, east of Beni Suef, Egypt. Egypt. J. Geol. 2024, 68, 97–113. [Google Scholar] [CrossRef]
  27. King, C.; Underwood, C.; Steurbaut, E. Eocene stratigraphy of the Wadi Al-Hitan world heritage site and adjacent areas (Fayum, Egypt). Stratigraphy 2014, 11, 185–234. [Google Scholar] [CrossRef]
  28. Said, R. The Geology of Egypt; Balkema: Rotterdam, The Netherlands; Brookfield, WI, USA, 1990; 734p. [Google Scholar]
  29. Sallam, E.; Wanas, H.; Osman, R. Stratigraphy, facies analysis and sequence stratigraphy of the Eocene succession in the Shabrawet area (north Eastern Desert, Egypt): An example for a tectonically influenced inner ramp carbonate platform. Arab. J. Geosci. 2015, 8, 10433–10458. [Google Scholar] [CrossRef]
  30. Abou El-Anwar, E.A. Geochemical studies of carbonates of the Tayiba Formation (upper Eocene), Abu Zenima area, west central Sinai. Bull. Natl. Res. Cent. 2019, 43, 209. [Google Scholar] [CrossRef]
  31. Mansour, A.; Wagreich, M.; Tahoun, S.S.; Ahmed, M.S.; Gentzis, T. Paleoredox conditions, paleoproductivity, and terrigenous sediment influx of the lower-middle cenomanian strata in the abu gharadig basin, northern Egypt. Minerals 2024, 14, 632. [Google Scholar] [CrossRef]
  32. Wedepohl, K.H. The composition of the continental crust. Geochim. Cosmochim. Acta 1995, 59, 1217–1232. [Google Scholar] [CrossRef]
  33. Meyers, P.A. Applications of organic geochemistry to paleolimnological reconstructions: A summary of examples from the Laurentian Great Lakes. Org. Geochem. 2003, 34, 261–289. [Google Scholar] [CrossRef]
  34. Bishay, Y. Studies on the larger Foraminifera of the Eocene of the Nile Valley between Assiut, Cairo and SW Sinai. Ph.D. Thesis, Alexandria University, Alexandria, Egypt, 1966. [Google Scholar]
  35. Mansour, H.; Philobbos, E.; Abdu, F. Contribution to the Geology of the East and Northeast of Beni Suef, Nile Valley, Egypt. Qatar Univ. Sci. Bull. 1982, 11, 52–65. [Google Scholar]
  36. Said, R. The Geology of Egypt; Elsevier: Amsterdam, The Netherlands; New York, NY, USA, 1962; 377p. [Google Scholar]
  37. von Zittel, K.A. Beiträge zur Geologie und Paläontologie der Libyschen Wüste und der Angrenzenden Gebiete von Ägypten; T. Fischer: Kassel, Germany, 1883; Volume 1. [Google Scholar]
  38. Selim, S.S.; Hosni, A.B.; AbdelGawad, M.K.; El-Kahawy, R.M. Sedimentology and Evolution of A Mixed-Energy Deltaic System, Upper Eocene Maadi Formation, North Eastern Desert, Egypt. J. Sediment. Res. 2026, 96, 190–217. [Google Scholar] [CrossRef]
  39. Wedepohl, K. The composition of the upper Earth’s crust and the natural cycles of selected metals. In Metals and Their Com pounds in the Environment; Merian, E., Ed.; VCH-Verlagsgesellschaft: Weinheim, Germany, 1991; pp. 3–17. [Google Scholar]
  40. Awan, R.S.; Liu, C.; Gong, H.; Dun, C.; Tong, C.; Chamssidini, L.G. Paleo-sedimentary environment in relation to enrichment of organic matter of Early Cambrian black rocks of Niutitang Formation from Xiangxi area China. Mar. Pet. Geol. 2020, 112, 104057. [Google Scholar] [CrossRef]
  41. Wang, X.; He, S.; Dong, T.; Xie, X.; Xu, Q.; Li, S.; Cheng, T. Characterizations and accumulation of lacustrine source rocks in the Zhu I Depression, Pearl River Mouth Basin, China. Geol. J. 2019, 54, 4034–4050. [Google Scholar] [CrossRef]
  42. Fathy, D.; Abart, R.; Wagreich, M.; Gier, S.; Ahmed, M.S.; Sami, M. Late campanian climatic-continental weathering assessment and its influence on source rocks deposition in southern Tethys, Egypt. Minerals 2023, 13, 160. [Google Scholar] [CrossRef]
  43. Hussain, S.H.; Al-Juboury, A.I.; Al-Haj, M.A.; Armstrong-Altrin, J.S.; Al-Lhaebi, S.F. Mineralogy and geochemistry of the late Triassic Baluti formation, northern Iraq. J. Afr. Earth Sci. 2021, 181, 104243. [Google Scholar] [CrossRef]
  44. Omietimi, E.J. Sedimentology, Palaeoenvironment and Structural Interpretation of the Cretaceous SW Anambra Basin, Nigeria. Ph.D. Thesis, University of Pretoria, Pretoria, South Africa, 2022. [Google Scholar]
  45. Omar, N.; McCann, T.; Al-Juboury, A.I.; Franz, S.O. Petrography and geochemistry of the Middle-Upper Jurassic Banik section, northernmost Iraq—Implications for palaeoredox, evaporitic and diagenetic conditions. N. Jb. Geol. Paleont. Abh. 2020, 297, 125–152. [Google Scholar] [CrossRef]
  46. Song, Y.; Liu, Z.; Meng, Q.; Xu, J.; Sun, P.; Cheng, L.; Zheng, G. Multiple controlling factors of the enrichment of organic matter in the Upper Cretaceous oil shale sequences of the Songliao basin, NE China: Implications from geochemical analyses. Oil Shale 2016, 33, 142–166. [Google Scholar] [CrossRef]
  47. Xu, J.; Liu, Z.; Bechtel, A.; Meng, Q.; Sun, P.; Jia, J.; Cheng, L.; Song, Y. Basin evolution and oil shale deposition during Upper Cretaceous in the Songliao Basin (NE China): Implications from sequence stratigraphy and geochemistry. Int. J. Coal Geol. 2015, 149, 9–23. [Google Scholar] [CrossRef]
  48. Lerman, A.; Imboden, D.M.; Gat, J.R.; Chou, L. Physics and Chemistry of Lakes; Springer: Berlin/Heidelberg, Germany, 1995. [Google Scholar]
  49. Sawyer, E. The influence of source rock type, chemical weathering and sorting on the geochemistry of clastic sediments from the Quetico metasedimentary belt, Superior Province, Canada. Chem. Geol. 1986, 55, 77–95. [Google Scholar] [CrossRef]
  50. Wang, C.; Wang, Q.; Chen, G.; He, L.; Xu, Y.; Chen, L.; Chen, D. Petrographic and geochemical characteristics of the lacustrine black shales from the Upper Triassic Yanchang Formation of the Ordos Basin, China: Implications for the organic matter accumulation. Mar. Pet. Geol. 2017, 86, 52–65. [Google Scholar] [CrossRef]
  51. Bai, Y.; Liu, Z.; Sun, P.; Liu, R.; Hu, X.; Zhao, H.; Xu, Y. Rare earth and major element geochemistry of Eocene fine-grained sediments in oil shale-and coal-bearing layers of the Meihe Basin, Northeast China. J. Asian Earth Sci. 2015, 97, 89–101. [Google Scholar] [CrossRef]
  52. Naeher, S.; Gilli, A.; North, R.P.; Hamann, Y.; Schubert, C.J. Tracing bottom water oxygenation with sedimentary Mn/Fe ratios in Lake Zurich, Switzerland. Chem. Geol. 2013, 352, 125–133. [Google Scholar] [CrossRef]
  53. McLennan, S.M. Relationships between the trace element composition of sedimentary rocks and upper continental crust. Geochem. Geophys. Geosyst. 2001, 2, 1021. [Google Scholar] [CrossRef]
  54. Taylor, S.R.; McLennan, S.M. The Continental Crust: Its Composition and Evolution; Stony Brook University: Stony Brook, NY, USA, 1985. [Google Scholar]
  55. Algeo, T.J.; Tribovillard, N. Environmental analysis of paleoceanographic systems based on molybdenum–uranium covariation. Chem. Geol. 2009, 268, 211–225. [Google Scholar] [CrossRef]
  56. Scott, C.; Lyons, T.W. Contrasting molybdenum cycling and isotopic properties in euxinic versus non-euxinic sediments and sedimentary rocks: Refining the paleoproxies. Chem. Geol. 2012, 324, 19–27. [Google Scholar] [CrossRef]
  57. Brumsack, H.-J. The trace metal content of recent organic carbon-rich sediments: Implications for Cretaceous black shale formation. Palaeogeogr. Palaeoclimatol. Palaeoecol. 2006, 232, 344–361. [Google Scholar] [CrossRef]
  58. Schenau, S.J.; Reichart, G.J.; De Lange, G.J. Phosphorus burial as a function of paleoproductivity and redox conditions in Arabian Sea sediments. Geochimica et Cosmochimica Acta 2005, 69, 919–931. [Google Scholar] [CrossRef]
  59. Pomar, L.; Hallock, P. Carbonate factories: A conundrum in sedimentary geology. Earth-Sci. Rev. 2008, 87, 134–169. [Google Scholar] [CrossRef]
  60. Morse, J.W.; Mackenzie, F.T. Geochemistry of Sedimentary Carbonates; Elsevier: Amsterdam, The Netherlands, 1990; Volume 48. [Google Scholar]
  61. Flügel, E. Microfacies of Carbonate Rocks: Analysis, Interpretation and Application; Springer: Berlin/Heidelberg, Germany, 2013; Volume 976. [Google Scholar]
  62. Tyson, R. Sedimentary Organic Matter; Chapman & Hall: London, UK, 1995. [Google Scholar]
  63. Veizer, J. Chemical Diagenesis of Carbonates: Theory and Application of Trace Element Technique; SEPM Society for Sedimentary Geology: Claremore, OK, USA, 1983. [Google Scholar]
  64. Tribovillard, N.; Algeo, T.J.; Lyons, T.; Riboulleau, A.J. Trace metals as paleoredox and paleoproductivity proxies: An update. Chem. Geol. 2006, 232, 12–32. [Google Scholar] [CrossRef]
  65. Filippelli, G.M. The global phosphorus cycle. Rev. Mineral. Geochem. 2002, 48, 391–425. [Google Scholar] [CrossRef]
  66. Meyers, P.A. Organic geochemical proxies of paleoceanographic, paleolimnologic, and paleoclimatic processes. Org. Geochem. 1997, 27, 213–250. [Google Scholar] [CrossRef]
  67. Calvert, S.; Pedersen, T. Chapter fourteen elemental proxies for palaeoclimatic and palaeoceanographic variability in marine sediments: Interpretation and application. Dev. Mar. Geol. 2007, 1, 567–644. [Google Scholar]
  68. Chen, H.-F.; Yeh, P.-Y.; Song, S.-R.; Hsu, S.-C.; Yang, T.-N.; Wang, Y.; Chi, Z.; Lee, T.-Q.; Chen, M.-T.; Cheng, C.-L. The Ti/Al molar ratio as a new proxy for tracing sediment transportation processes and its application in aeolian events and sea level change in East Asia. J. Asian Earth Sci. 2013, 73, 31–38. [Google Scholar] [CrossRef]
  69. Mansour, A.; Gentzis, T.; Ied, I.M.; Ahmed, M.S.; Wagreich, M. Paleoenvironmental Conditions and Factors Controlling Organic Carbon Accumulation during the Jurassic–Early Cretaceous, Egypt: Organic and Inorganic Geochemical Approach. Minerals 2022, 12, 1213. [Google Scholar] [CrossRef]
  70. Liu, L.; Jiang, G.; Mao, X.; Zhao, H.; Zhao, Y.; Li, Y.; Zhao, H.; Bi, Z. Geochemical Composition of Surface Sediments in the Bashang Area, North China and its Environmental Significance. Front. Earth Sci. 2022, 10, 891032. [Google Scholar] [CrossRef]
  71. Haq, B.U.; Hardenbol, J.; Vail, P.R. Chronology of fluctuating sea levels since the Triassic. Science 1987, 235, 1156–1167. [Google Scholar] [CrossRef]
  72. Yan, K.; Wang, C.-L.; Mischke, S.; Wang, J.-Y.; Shen, L.-J.; Yu, X.-C.; Meng, L.-Y. Major and trace-element geochemistry of Late Cretaceous clastic rocks in the Jitai Basin, southeast China. Sci. Rep. 2021, 11, 13846. [Google Scholar] [CrossRef] [PubMed]
  73. Zachos, J.C.; Dickens, G.R.; Zeebe, R.E. An early Cenozoic perspective on greenhouse warming and carbon-cycle dynamics. Nature 2008, 451, 279–283. [Google Scholar] [CrossRef] [PubMed]
  74. Thiry, M. Palaeoclimatic interpretation of clay minerals in marine deposits: An outlook from the continental origin. Earth-Sci. Rev. 2000, 49, 201–221. [Google Scholar] [CrossRef]
  75. Won, C.D.; Hong, H.; Pak, K.R. Origin of clay minerals on section of Luochuan loesspalaeosol in Shaanxi Province, northwest China. Front. Earth Sci. 2020, 14, 684–694. [Google Scholar] [CrossRef]
  76. Jubeir, S.A.; Faiyad, A.S.; Mohammed, I.Q. Lithofacies and Clay Mineral Analysis of the upper Cenomanian Ms’ ad Formation, Rutbah Area, Western Iraq. Iraqi Geol. J. 2023, 56, 204–222. [Google Scholar] [CrossRef]
  77. Singer, A. The paleoclimatic interpretation of clay minerals in sediments—A review. Earth-Sci. Rev. 1984, 21, 251–293. [Google Scholar] [CrossRef]
  78. Gingele, F.X.; De Deckker, P.; Hillenbrand, C.-D. Clay mineral distribution in surface sediments between Indonesia and NW Australia—Source and transport by ocean currents. Mar. Geol. 2001, 179, 135–146. [Google Scholar] [CrossRef]
  79. Moriarty, K.C. Clay minerals in southeast Indian Ocean sediments, transport mechanisms and depositional environments. Mar. Geol. 1977, 25, 149–174. [Google Scholar] [CrossRef]
  80. D’Onofrio, R.; Zaky, A.S.; Frontalini, F.; Luciani, V.; Catanzariti, R.; Francescangeli, F.; Giorgioni, M.; Coccioni, R.; Özcan, E.; Jovane, L. Impact of the Middle Eocene Climatic Optimum (MECO) on foraminiferal and calcareous nannofossil assemblages in the Neo-Tethyan Baskil Section (Eastern Turkey): Paleoenvironmental and paleoclimatic reconstructions. Appl. Sci. 2021, 11, 11339. [Google Scholar] [CrossRef]
  81. Giorgioni, M.; Jovane, L.; Rego, E.S.; Rodelli, D.; Frontalini, F.; Coccioni, R.; Catanzariti, R.; Özcan, E. Carbon cycle instability and orbital forcing during the Middle Eocene Climatic Optimum. Sci. Rep. 2019, 9, 9357. [Google Scholar] [CrossRef]
  82. Spofforth, D.; Agnini, C.; Pälike, H.; Rio, D.; Fornaciari, E.; Giusberti, L.; Luciani, V.; Lanci, L.; Muttoni, G. Organic carbon burial following the middle Eocene climatic optimum in the central western Tethys. Paleoceanography 2010, 25, PA3210. [Google Scholar] [CrossRef]
  83. Agnini, C.; Fornaciari, E.; Giusberti, L.; Grandesso, P.; Lanci, L.; Luciani, V.; Muttoni, G.; Pälike, H.; Rio, D.; Spofforth, D.J. Integrated biomagnetostratigraphy of the Alano section (NE Italy): A proposal for defining the middle-late Eocene boundary. Bulletin 2011, 123, 841–872. [Google Scholar] [CrossRef]
  84. Luciani, V.; Giusberti, L.; Agnini, C.; Fornaciari, E.; Rio, D.; Spofforth, D.J.; Pälike, H. Ecological and evolutionary response of Tethyan planktonic foraminifera to the middle Eocene climatic optimum (MECO) from the Alano section (NE Italy). Palaeogeogr. Palaeoclimatol. Palaeoecol. 2010, 292, 82–95. [Google Scholar] [CrossRef]
  85. Martín-Martín, M.; Guerrera, F.; Tosquella, J.; Tramontana, M. Middle Eocene carbonate platforms of the westernmost Tethys. Sediment. Geol. 2021, 415, 105861. [Google Scholar] [CrossRef]
  86. Sharma, N.; Spangenberg, J.E.; Adatte, T.; Vennemann, T.; Kocsis, L.; Vérité, J.; Valero, L.; Castelltort, S. Middle Eocene Climatic Optimum (MECO) and its imprint in the continental Escanilla Formation, Spain. Clim. Past 2024, 20, 935–949. [Google Scholar] [CrossRef]
  87. Katz, M.E.; Miller, K.G.; Wright, J.D.; Wade, B.S.; Browning, J.V.; Cramer, B.S.; Rosenthal, Y. Stepwise transition from the Eocene greenhouse to the Oligocene icehouse. Nat. Geosci. 2008, 1, 329–334. [Google Scholar] [CrossRef]
  88. Dill, H.; Wehner, H.; Kus, J.; Botz, R.; Berner, Z.; Stüben, D.; Al-Sayigh, A. The Eocene Rusayl Formation, Oman, carbonaceous rocks in calcareous shelf sediments: Environment of deposition, alteration and hydrocarbon potential. Int. J. Coal Geol. 2007, 72, 89–123. [Google Scholar] [CrossRef]
  89. Peng, G.; Chen, W.; Jia, P.; Luo, M.; He, Y.; Jin, Y.; Xu, C.; Shan, X. Middle-late Eocene climate in the Pearl River Mouth Basin: Evidence from a palynological and geological element record in the Xijiang main subsag. Minerals 2023, 13, 374. [Google Scholar] [CrossRef]
  90. Cui, H.; Tang, H.; Liu, Z.; Bai, J.; Chen, J.; Wei, G. Geochemical evidence for Late Eocene to Oligocene climate change in the Lühe Basin of the southeastern Tibetan Plateau. J. Asian Earth Sci. 2025, 288, 106612. [Google Scholar] [CrossRef]
  91. Sorrel, P.; Eymard, I.; Leloup, P.-H.; Maheo, G.; Olivier, N.; Sterb, M.; Gourbet, L.; Wang, G.; Jing, W.; Lu, H. Wet tropical climate in SE Tibet during the Late Eocene. Sci. Rep. 2017, 7, 7809. [Google Scholar] [CrossRef]
  92. Retallack, G.J. Cenozoic paleoclimate on land in North America. J. Geol. 2007, 115, 271–294. [Google Scholar] [CrossRef]
  93. Bohaty, S.M.; Zachos, J.C.; Florindo, F.; Delaney, M.L. Coupled greenhouse warming and deep-sea acidification in the middle Eocene. Paleoceanography 2009, 24, PA2207. [Google Scholar] [CrossRef]
  94. Huyghe, D.; Castelltort, S.; Mouthereau, F.; Emmanuel, L.; Serra-Kiel, J.; Renard, M. Disappearance of a carbonate ramp at the Lutetian-Bartonian boundary in the Pyrenees (Spain): Evidences for the first glaciations of the Cenozoic? In Proceedings of the EGU General Assembly Conference, Vienna, Austria, 19–24 April 2009; p. 5411. [Google Scholar]
  95. Wang, A.; Wang, Z.; Liu, J.; Xu, N.; Li, H. The Sr/Ba ratio response to salinity in clastic sediments of the Yangtze River Delta. Chem. Geol. 2021, 559, 119923. [Google Scholar] [CrossRef]
  96. Speijer, R.; Pälike, H.; Hollis, C.; Hooker, J.; Ogg, J. The paleogene period. In Geologic Time Scale 2020; Elsevier: Amsterdam, The Netherlands, 2020; pp. 1087–1140. [Google Scholar]
  97. Pehlivanlı, B.Y. Factors controlling the paleo-sedimentary conditions of Çeltek oil shale, Sorgun-Yozgat/Turkey. Bull. Miner. Res. Explor. 2019, 158, 251–263. [Google Scholar]
  98. Li, D.; Li, R.; Zhu, Z.; Xu, F. Elemental characteristics of lacustrine oil shale and its controlling factors of palaeo-sedimentary environment on oil yield: A case from Chang 7 oil layer of Triassic Yanchang Formation in southern Ordos Basin. Acta Geochim. 2018, 37, 228–243. [Google Scholar] [CrossRef]
  99. Vd’ačný, M.; Madzin, J.; Plašienka, D. Geochemical characteristics of the Upper Cretaceous to Lower Eocene sedimentary rocks from the Pieniny Klippen Belt (Western Carpathians, Slovakia): Implications for tectonic setting, paleoenvironment and paleoclimate. Geosci. J. 2019, 23, 731–745. [Google Scholar] [CrossRef]
  100. Wolfgring, E.; Wagreich, M.; Hohenegger, J.; Böhm, K.; Turell, J.D.; Gier, S.; Sames, B.; Spötl, C.; Jin, S. An integrated multi-proxy study of cyclic pelagic deposits from the north-western Tethys: The Campanian of the Postalm section (Gosau Group, Austria). Cretac. Res. 2021, 120, 104704. [Google Scholar] [CrossRef]
  101. Slomp, C.; Van Cappellen, P. The global marine phosphorus cycle: Sensitivity to oceanic circulation. Biogeosciences 2007, 4, 155–171. [Google Scholar] [CrossRef]
  102. Dymond, J.; Suess, E.; Lyle, M. Barium in deep-sea sediment: A geochemical proxy for paleoproductivity. Paleoceanography 1992, 7, 163–181. [Google Scholar] [CrossRef]
  103. Paytan, A.; Kastner, M.; Chavez, F. Glacial to interglacial fluctuations in productivity in the equatorial Pacific as indicated by marine barite. Science 1996, 274, 1355–1357. [Google Scholar] [CrossRef]
  104. Morford, J.L.; Emerson, S. The geochemistry of redox sensitive trace metals in sediments. Geochim. Cosmochim. Acta 1999, 63, 1735–1750. [Google Scholar] [CrossRef]
  105. Martinez-Ruiz, F.; Jroundi, F.; Paytan, A.; Guerra-Tschuschke, I.; Abad, M.d.M.; González-Muñoz, M.T. Barium bioaccumulation by bacterial biofilms and implications for Ba cycling and use of Ba proxies. Nat. Commun. 2018, 9, 1619. [Google Scholar] [CrossRef]
  106. Bishop, J.K. The barite-opal-organic carbon association in oceanic particulate matter. Nature 1988, 332, 341–343. [Google Scholar] [CrossRef]
Figure 1. (X). Location map for the study area, (Y). geologic map, and (Z). lithostratigraphic units of the studied sections.
Minerals 16 00361 g001
Figure 2. (A) Field photographs of the Beni Suef Formation in section A; (B) Basal part of the Qurn Member of the Beni Suef Formation in section A, consisting of shales, marls and silty marls; (C,D) The Tarbul Member of the Beni Suef Formation in section B, consisting of fossiliferous marls and marly limestones; (E) The macro-faunal content (bivalves) in the middle parts of the Tarbul Member in section B; (F) The Maadi Formation in the topmost part of section B; (G,H) Close views of the macro-faunal content (bivalves, echinoids, corals, and gastropods) in the Maadi Formation.
Minerals 16 00361 g002
Figure 3. X-ray diffraction pattern of the bulk samples from the studied rock units. Note: the colour guide characterizing the analyzed samples is illustrated in the upper left side of each sub-figure. (A) section A; (B) section B.
Minerals 16 00361 g003
Figure 4. X-ray diffraction patterns of the clay fraction of two selected samples from the two sections (8A and 46B) saturated with Mg, K, Mg, and glycerol (Gly), K, and ethylene glycol (EG), and heated to 550 °C.
Minerals 16 00361 g004
Figure 5. TOC, CaCO3, and enrichment factors of the studied samples in section A.
Minerals 16 00361 g005
Figure 6. TOC, CaCO3, and enrichment factors of the studied samples in section B.
Minerals 16 00361 g006
Figure 7. Stratigraphic distributions of the values of the Zr/Al, Ti/Al, Si/Al, K2O/Rb, Al/K, and Rb/Sr ratios of the analyzed samples for detrital flux determinations in section A.
Minerals 16 00361 g007
Figure 8. Stratigraphic distributions of the values of the Zr/Al, Ti/Al, Si/Al, K2O/Rb, Al/K, and Rb/Sr ratios of the analyzed samples for detrital flux determinations in section B.
Minerals 16 00361 g008
Figure 9. Stratigraphic distributions of the values of K2O/Al2O3, K2O/Al2O3, Rb/Sr, Sr/Cu, Ca/Al, Mg/Al, and Sr/Ba of the analyzed samples in section A for paleoclimate and paleosalinity reconstructions.
Minerals 16 00361 g009
Figure 10. Stratigraphic distributions of the values of SiO2/Al2O3, K2O/Al2O3, Rb/Sr, Sr/Cu, Ca/Al, Mg/Al, and Sr/Ba of the analyzed samples in section B for paleoclimate and paleosalinity reconstructions.
Minerals 16 00361 g010
Figure 11. Stratigraphic distributions of the values of P, P/Al, Ni/Al, Cu/Al, Ba/Al, and Babio of the studied samples in section A for primary productivity evaluation.
Minerals 16 00361 g011
Figure 12. Stratigraphic distributions of the values of P, P/Al, Ni/Al, Cu/Al, Ba/Al, and Babio of the studied samples in section B for primary productivity evaluation.
Minerals 16 00361 g012
Figure 13. Spectral analysis of section B. (X) Multitaper (MTM) analysis assessing the spectral density of the log [Mn/Fe] series at section B, dominant frequencies marked with “1” (at frequency = 0.03) and “2” (at 0.48). (Y) Log [Mn/Fe] series band-passed to a dominant frequency of 0.03. (Z) Stratigraphic profile of section B.
Minerals 16 00361 g013
Figure 14. Geochemical characterization of the studied sections: paleoredox conditions, detrital flux, paleoclimate, paleosalinity, paleo-water depth, and primary productivity.
Minerals 16 00361 g014
Figure 15. Ternary geochemical diagram based on Al2O3 × 5, SiO2, and CaO × 2 proportions showing compositional variability and depositional trends, highlighting shifts between carbonate-dominated and siliciclastic-influenced sedimentation in the analyzed succession. (A) section A; (B) section B.
Minerals 16 00361 g015
Table 1. Pearson correlation matrix for major oxides, trace elements, CaCO3, and TOC in the studied succession of outcrop A. Note, the bold values show significance level at p < 0.05.
Al2O3SiO2P2O5K2OCaOTiO2Cr2O3MnOFe2O3NiCuZnAsRbSrZrMoCdBaPbCaCO3TOC
Al2O31.00
SiO20.761.00
P2O5−0.050.231.00
K2O0.950.74−0.031.00
CaO−0.89−0.760.13−0.921.00
TiO20.960.78−0.070.97−0.941.00
Cr2O30.790.56−0.080.88−0.800.821.00
MnO−0.14−0.130.52−0.180.28−0.19−0.081.00
Fe2O30.910.83−0.080.92−0.910.960.78−0.191.00
Ni0.650.510.180.65−0.540.610.57−0.090.561.00
Cu0.450.440.450.39−0.220.410.310.400.360.241.00
Zn0.860.790.020.91−0.880.920.82−0.090.930.500.351.00
As0.770.66−0.030.73−0.670.700.63−0.080.710.490.260.741.00
Rb0.840.88−0.030.87−0.840.890.75−0.220.940.570.360.870.691.00
Sr−0.210.030.47−0.230.39−0.23−0.190.38−0.26−0.140.44−0.12−0.07−0.151.00
Zr0.620.37−0.410.62−0.630.660.57−0.220.730.33−0.100.680.560.60−0.501.00
Mo−0.66−0.470.28−0.550.52−0.63−0.440.17−0.64−0.46−0.32−0.49−0.49−0.570.13−0.571.00
Cd0.520.54−0.350.55−0.680.590.47−0.470.710.30−0.270.610.460.70−0.520.76−0.381.00
Ba0.110.14−0.310.14−0.190.17−0.01−0.360.22−0.13−0.240.120.160.17−0.240.26−0.010.381.00
Pb0.240.07−0.270.29−0.250.250.26−0.150.22−0.040.140.170.150.18−0.340.06−0.050.020.281.00
CaCO3−0.69−0.500.13−0.650.63−0.70−0.480.12−0.66−0.52−0.28−0.57−0.53−0.600.18−0.500.57−0.34−0.17−0.121.00
TOC0.440.45−0.100.50−0.440.450.49−0.290.510.380.210.450.490.60−0.100.38−0.310.420.190.19−0.081.00
Table 2. Pearson correlation matrix (r values) for major oxides, trace elements, CaCO3, and TOC in the studied succession of outcrop B. Note, the bold values show significance level at p < 0.05.
Al2O3SiO2P2O5K2OCaOTiO2Cr2O3MnOFe2O3NiCuZnAsRbSrZrMoCdBaPbCaCO3TOC
Al2O31.00
SiO20.441.00
P2O5−0.05−0.331.00
K2O0.620.620.251.00
CaO−0.51−0.62−0.10−0.901.00
TiO20.620.85−0.010.89−0.851.00
Cr2O30.260.62−0.010.53−0.500.581.00
MnO0.520.290.040.51−0.450.520.221.00
Fe2O30.650.87−0.180.79−0.760.940.550.561.00
Ni0.220.64−0.050.50−0.470.630.420.290.571.00
Cu0.130.040.540.25−0.090.240.120.130.080.141.00
Zn0.640.80−0.090.79−0.730.900.600.520.920.500.171.00
As0.030.51−0.210.39−0.510.480.500.270.520.43−0.190.441.00
Rb0.470.88−0.410.57−0.580.810.530.350.830.52−0.080.770.541.00
Sr−0.28−0.04−0.09−0.440.59−0.36−0.07−0.32−0.31−0.110.10−0.19−0.32−0.141.00
Zr0.440.74−0.250.53−0.540.750.480.440.830.46−0.030.720.470.79−0.321.00
Mo−0.21−0.140.01−0.330.43−0.30−0.11−0.25−0.26−0.010.07−0.18−0.08−0.170.38−0.191.00
Cd0.260.74−0.450.43−0.560.620.390.330.730.44−0.260.570.600.68−0.340.65−0.261.00
Ba0.170.29−0.050.33−0.330.340.300.340.310.140.190.350.380.30−0.060.27−0.070.121.00
Pb0.080.150.080.29−0.300.250.060.140.150.230.090.150.170.17−0.190.14−0.140.040.371.00
CaCO3−0.47−0.46−0.19−0.860.97−0.75−0.45−0.39−0.63−0.38−0.14−0.64−0.40−0.430.61−0.420.41−0.39−0.29−0.301.00
TOC−0.130.38−0.280.04−0.070.110.28−0.420.150.04−0.080.200.230.270.250.13−0.150.300.270.080.011.00
Disclaimer/Publisher’s Note: The statements, opinions and data contained in all publications are solely those of the individual author(s) and contributor(s) and not of MDPI and/or the editor(s). MDPI and/or the editor(s) disclaim responsibility for any injury to people or property resulting from any ideas, methods, instructions or products referred to in the content.