Article

Metallogenic Prediction for Copper–Nickel Sulfide Deposits in the Eastern and Central Tianshan Based on Multi-Modal Feature Fusion


1
State Key Laboratory of Deep Earth and Mineral Exploration, Key Laboratory of Geochemical Exploration of Ministry of Natural Resources, Institute of Geophysical and Geochemical Exploration, Chinese Academy of Geological Sciences, Tianjin 300300, China
2
UNESCO International Centre on Global-Scale Geochemistry, Langfang 065000, China
3
College of Earth Sciences, Guilin University of Technology, Guilin 541006, China
*
Authors to whom correspondence should be addressed.
Minerals 2026, 16(3), 318; https://doi.org/10.3390/min16030318
Submission received: 6 February 2026 / Revised: 8 March 2026 / Accepted: 16 March 2026 / Published: 18 March 2026
(This article belongs to the Special Issue Geochemical Exploration for Critical Mineral Resources, 2nd Edition)

Abstract

The deep integration of machine learning technology with geological prospecting has brought to the forefront a key challenge: how to construct geological-mineralization models by fusing multi-source data, select model features with guidance from metallogenic factors, build multi-source metallogenic prediction models with geological constraints, and ultimately achieve a thorough integration of domain knowledge and machine intelligence. The Eastern-Central Tianshan region is one of China’s most important copper–nickel mineral resource bases, predominantly hosting magmatic copper–nickel sulfide deposits with significant resource potential. In this context, this paper proposes a metallogenic prediction model based on multi-modal feature fusion technology. The model employs a Residual Neural Network (ResNet) incorporating a Squeeze-and-Excitation (SE) attention mechanism and a Multi-Layer Perceptron (MLP) to extract features from different modalities. It integrates multi-source data, including geochemical information, geological metallogenic factors, and aeromagnetic data. A cross-modal feature interaction module, constructed using attention weighting and a gating mechanism, enables deep fusion of the features. After training, the model achieved a prediction accuracy of 97% on the test set. Compared to a unimodal model constructed using Random Forest, the confidence and discriminative capability of the training results were significantly enhanced, validating the effectiveness of multi-modal feature fusion. Applying the trained model to the study area, a total of 11 prospective metallogenic zones were delineated. These include 4 zones in the peripheries of known deposits and 7 zones in previously unexplored (blank) areas. Notably, some known mineral occurrences fall within the predicted blank-area targets, validating the feasibility and significant value of multi-modal feature fusion in mineral prediction. This work provides a novel methodology for the subsequent integrated processing of multi-source data.

1. Introduction

In recent years, mathematical geoscience, which integrates big data and artificial intelligence (AI), has ushered in the era of geological big data and AI [1,2,3,4,5]. Deep learning techniques have been widely applied in geosciences for tasks such as mineral prospectivity mapping [6,7,8,9], lithology identification [10,11], mineral recognition [12,13], and 3D geological modeling [14,15,16]. A particularly prominent area is the integration of multi-source prospecting information. The core objective is to integrate data obtained from multiple sources, diverse perspectives, and diverse methods to train models for a specific task. Since information integration can reduce the multiplicity of solutions and uncertainties associated with using a single data source [17], research on multi-modal data interaction—how to leverage multi-source information to enhance prediction accuracy and achieve comprehensive processing of diverse factors—remains a critical topic today. Modality refers to the specific form in which information is presented, such as text, image, or audio. When a research problem involves more than one modality, the process is termed multi-modal [18]. The fundamental motivation for using multi-modal data is that it allows for the synthesis of information from various modalities for a given learning task. Compared to using data from a single modality, this approach can significantly enhance model performance, leading to more accurate predictive results [19,20].
Numerous studies based on multi-source data fusion have been conducted. For instance, Li Zhongtan et al. (2022) used interpolation to convert geochemical and aeromagnetic data into regular grid data, constructed a 2D training dataset, and ultimately achieved mineral prospectivity prediction using a 2D Convolutional Neural Network (2DCNN) [21]. Ding et al. (2022) normalized representative values within regular grids of geological data, elemental geochemical anomaly data, and aeromagnetic data from the study area, partitioned the grids, and employed a Siamese neural network for training [22]. Soran Qaderi et al. (2025) used a Deep Adversarial Network to synthesize new 2D geochemical, geological, and remote sensing data, followed by training with a Random Forest model [23]. These and similar approaches [8,9,24,25] primarily operate at the data processing level, using various methods to scale data from different modalities to a common dimension, and then performing training on that unified data representation to achieve multi-source data fusion. However, multi-modal data fusion is not entirely equivalent to multi-modal feature fusion; it more closely resembles early fusion within the broader taxonomy of multi-modal fusion. Multi-modal fusion is generally categorized into three paradigms: early fusion, intermediate fusion, and late fusion. Early fusion occurs before feature extraction by the model and is a form of data-level fusion. Intermediate fusion takes place after feature extraction and is a form of feature-level fusion. Late fusion occurs at the decision-making stage and is a form of decision-level fusion [26]. For example, Zheng et al. (2024) harmonized features from geological models and simulated data, subsequently using a joint module for connection and extraction, thereby ensuring the interrelationship between geological structure and processes [27]. Peng et al. (2025) integrated features from multi-modal data to predict fracture paths in reservoir rocks, achieving superior prediction accuracy and stronger generalization capability compared to traditional single-modality models [28]. Guo et al. (2024) applied 12 different fusion schemes to various heterogeneous data obtained from local sensors, including soil images, net weight data, and TDR waveform data [29]. Their experimental results demonstrated that the complementarity offered by intermediate fusion is crucial for enhancing target prediction tasks and improving engineering application efficiency.
Intermediate fusion (feature-level fusion), owing to its unique advantages in information representation and interaction depth, is often regarded as a balanced and efficient approach. It occurs in the intermediate stage of data processing, where high-level features extracted independently from each modality are integrated. Compared to early fusion (data fusion), which faces challenges of high noise and heterogeneity from prematurely mixing raw data, and late fusion (decision fusion), which suffers from the loss of low-level correlations between modalities due to independent decision-making, intermediate fusion preserves the specificity of each modality while enabling deep cross-modal interaction and synergy at the feature level. This offers distinct advantages over both early and late fusion, and this method has been widely applied in various fields such as medicine [30,31,32,33], computer signal processing [26,34,35], and fault detection [36,37,38]. In light of this, previous deep learning-based mineral prospectivity modeling has largely focused on early (data) fusion, where data is either extracted into one-dimensional tables or visualized as two-dimensional images to train network models. Structured data offers precise information but has limited representational capacity, failing to fully exploit the data’s value. Conversely, while 2D data can accommodate more complex relational information, it suffers from scarce training data, increased difficulty in recognizing subtle features, and an exponential increase in model complexity. Intermediate (feature-level) fusion, however, can combine the strengths and weaknesses of different modalities to achieve complementarity, integrating subtle features with spatial information. Therefore, this paper attempts to establish a mineral prospectivity model using an improved intermediate (feature-level) fusion approach. By extracting features separately from different modal data and integrating the precision of geological prospecting elements with their complex interrelationships, we aim to achieve information complementarity, facilitate deeper data interaction, and ultimately obtain optimal mineralization prediction results.

2. Methods

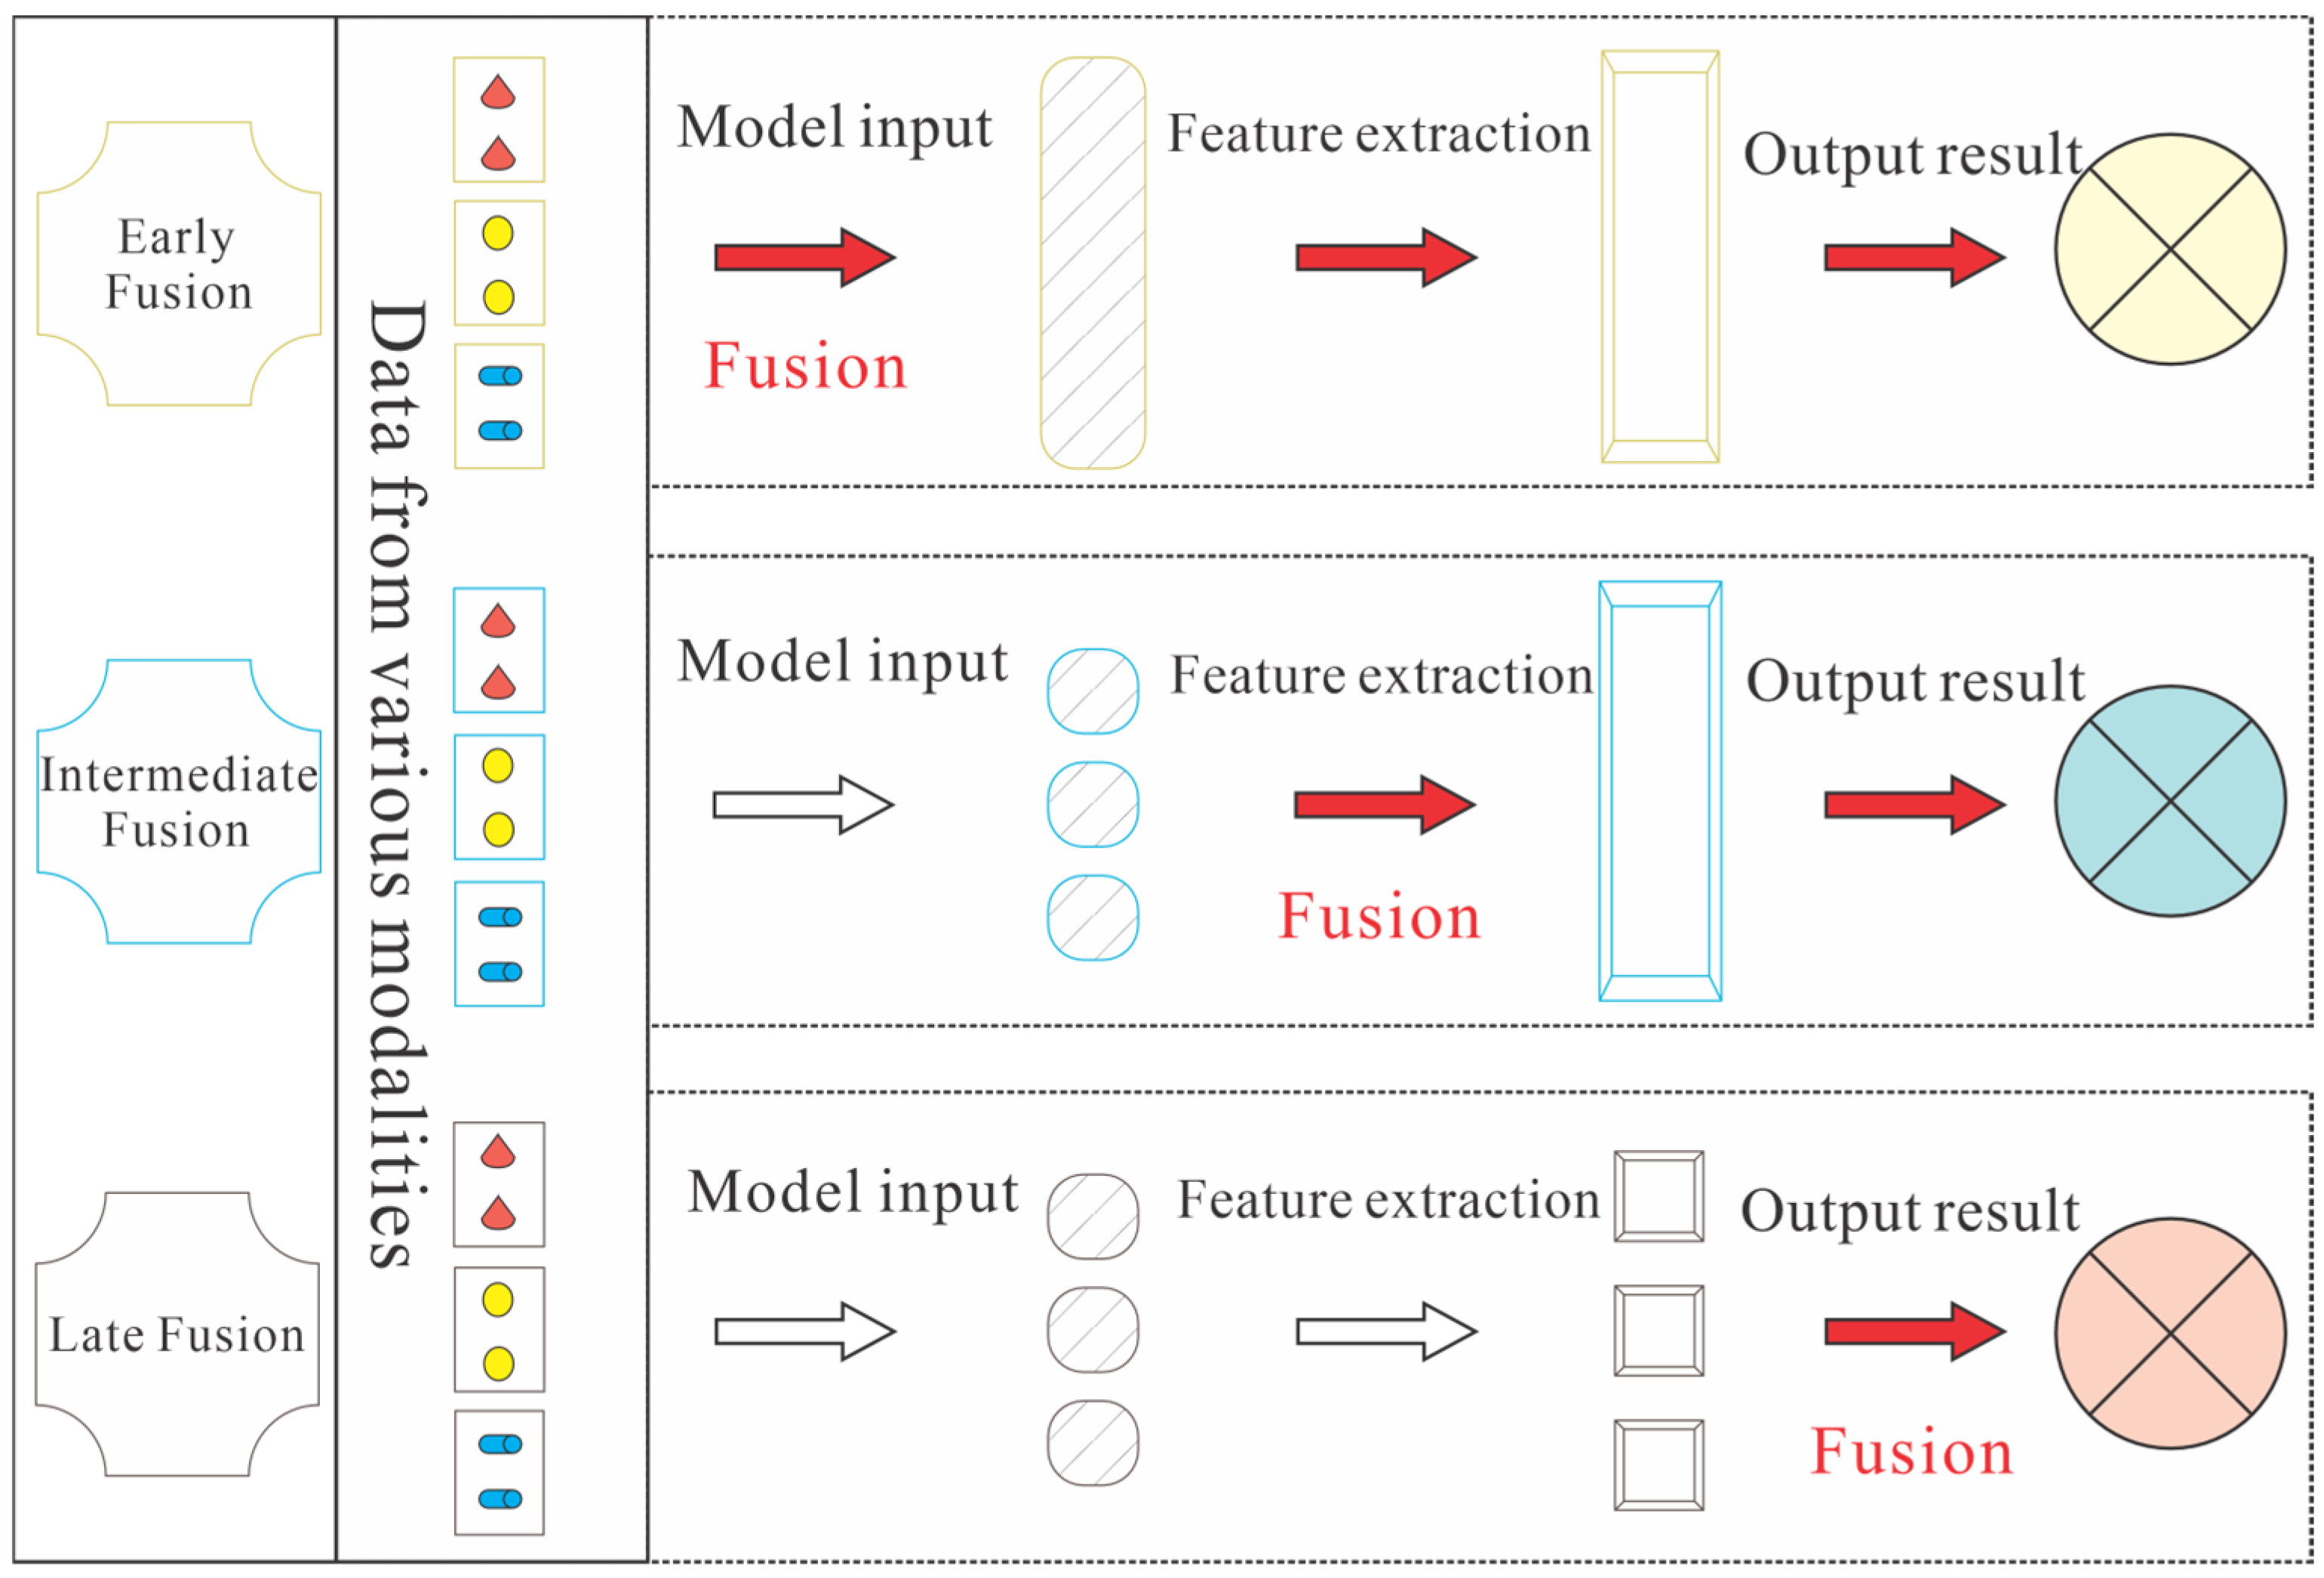
The core task of mineral prospectivity prediction lies in integrating multi-source, heterogeneous exploration data—such as geophysical, geochemical, geological, and remote sensing data—to construct comprehensive models capable of explaining genetic relationships of ore deposits and delineating prospective areas. In this context, the introduction of deep learning techniques aims to more efficiently uncover potential coupling relationships and deep-seated features within multi-source information [39]. Based on the fusion level and interaction mechanism, multi-modal feature fusion methods can be categorized into three core paradigms (Figure 1):
1. Early fusion (data-level fusion): Raw data or shallow features are directly combined at the model input stage through methods such as feature concatenation or tensor stacking. Theoretically, this allows for the learning of the most comprehensive correlations from the original information and offers significant computational efficiency advantages. However, it strictly requires modality alignment and is sensitive to misalignment noise, making it suitable for scenarios where modalities are highly coupled. In the field of geological exploration, the diversity of exploration methods generates heterogeneous data types, making it difficult to achieve highly coupled modalities; consequently, premature fusion may amplify data noise.
2. Intermediate fusion (feature-level fusion): Abstract features from heterogeneous modalities interact within deep networks. This allows each modality to first form its own feature representation before selective interaction occurs, thereby avoiding interference from raw noise. It supports fine-grained, non-linear feature interactions and is more robust to data heterogeneity and missing data. This approach is suitable for integrating data obtained from various exploration methods. However, the feature interaction module is central to the fusion process, and its architectural design directly impacts prediction outcomes.
3. Late fusion (decision-level fusion): Each modality is modeled independently, and their prediction results are then integrated. This approach is simple to implement, highly modular, and allows for the use of pre-existing, optimal single-modality models. Although it exhibits strong fault tolerance, it suffers from significant information loss and cannot deeply exploit complementary information. When predictions from different modalities conflict, they lack a basis in underlying features for effective arbitration, making it difficult to model fine-grained cross-modal correlations [26,40]. Given that mineralization is the result of the spatiotemporal coupling of multiple geological factors (such as structure, lithology, and element anomalies), this fusion approach may lose the deep interconnections among multi-modal data, hindering the model’s ability to effectively learn the conditions favorable for mineralization.
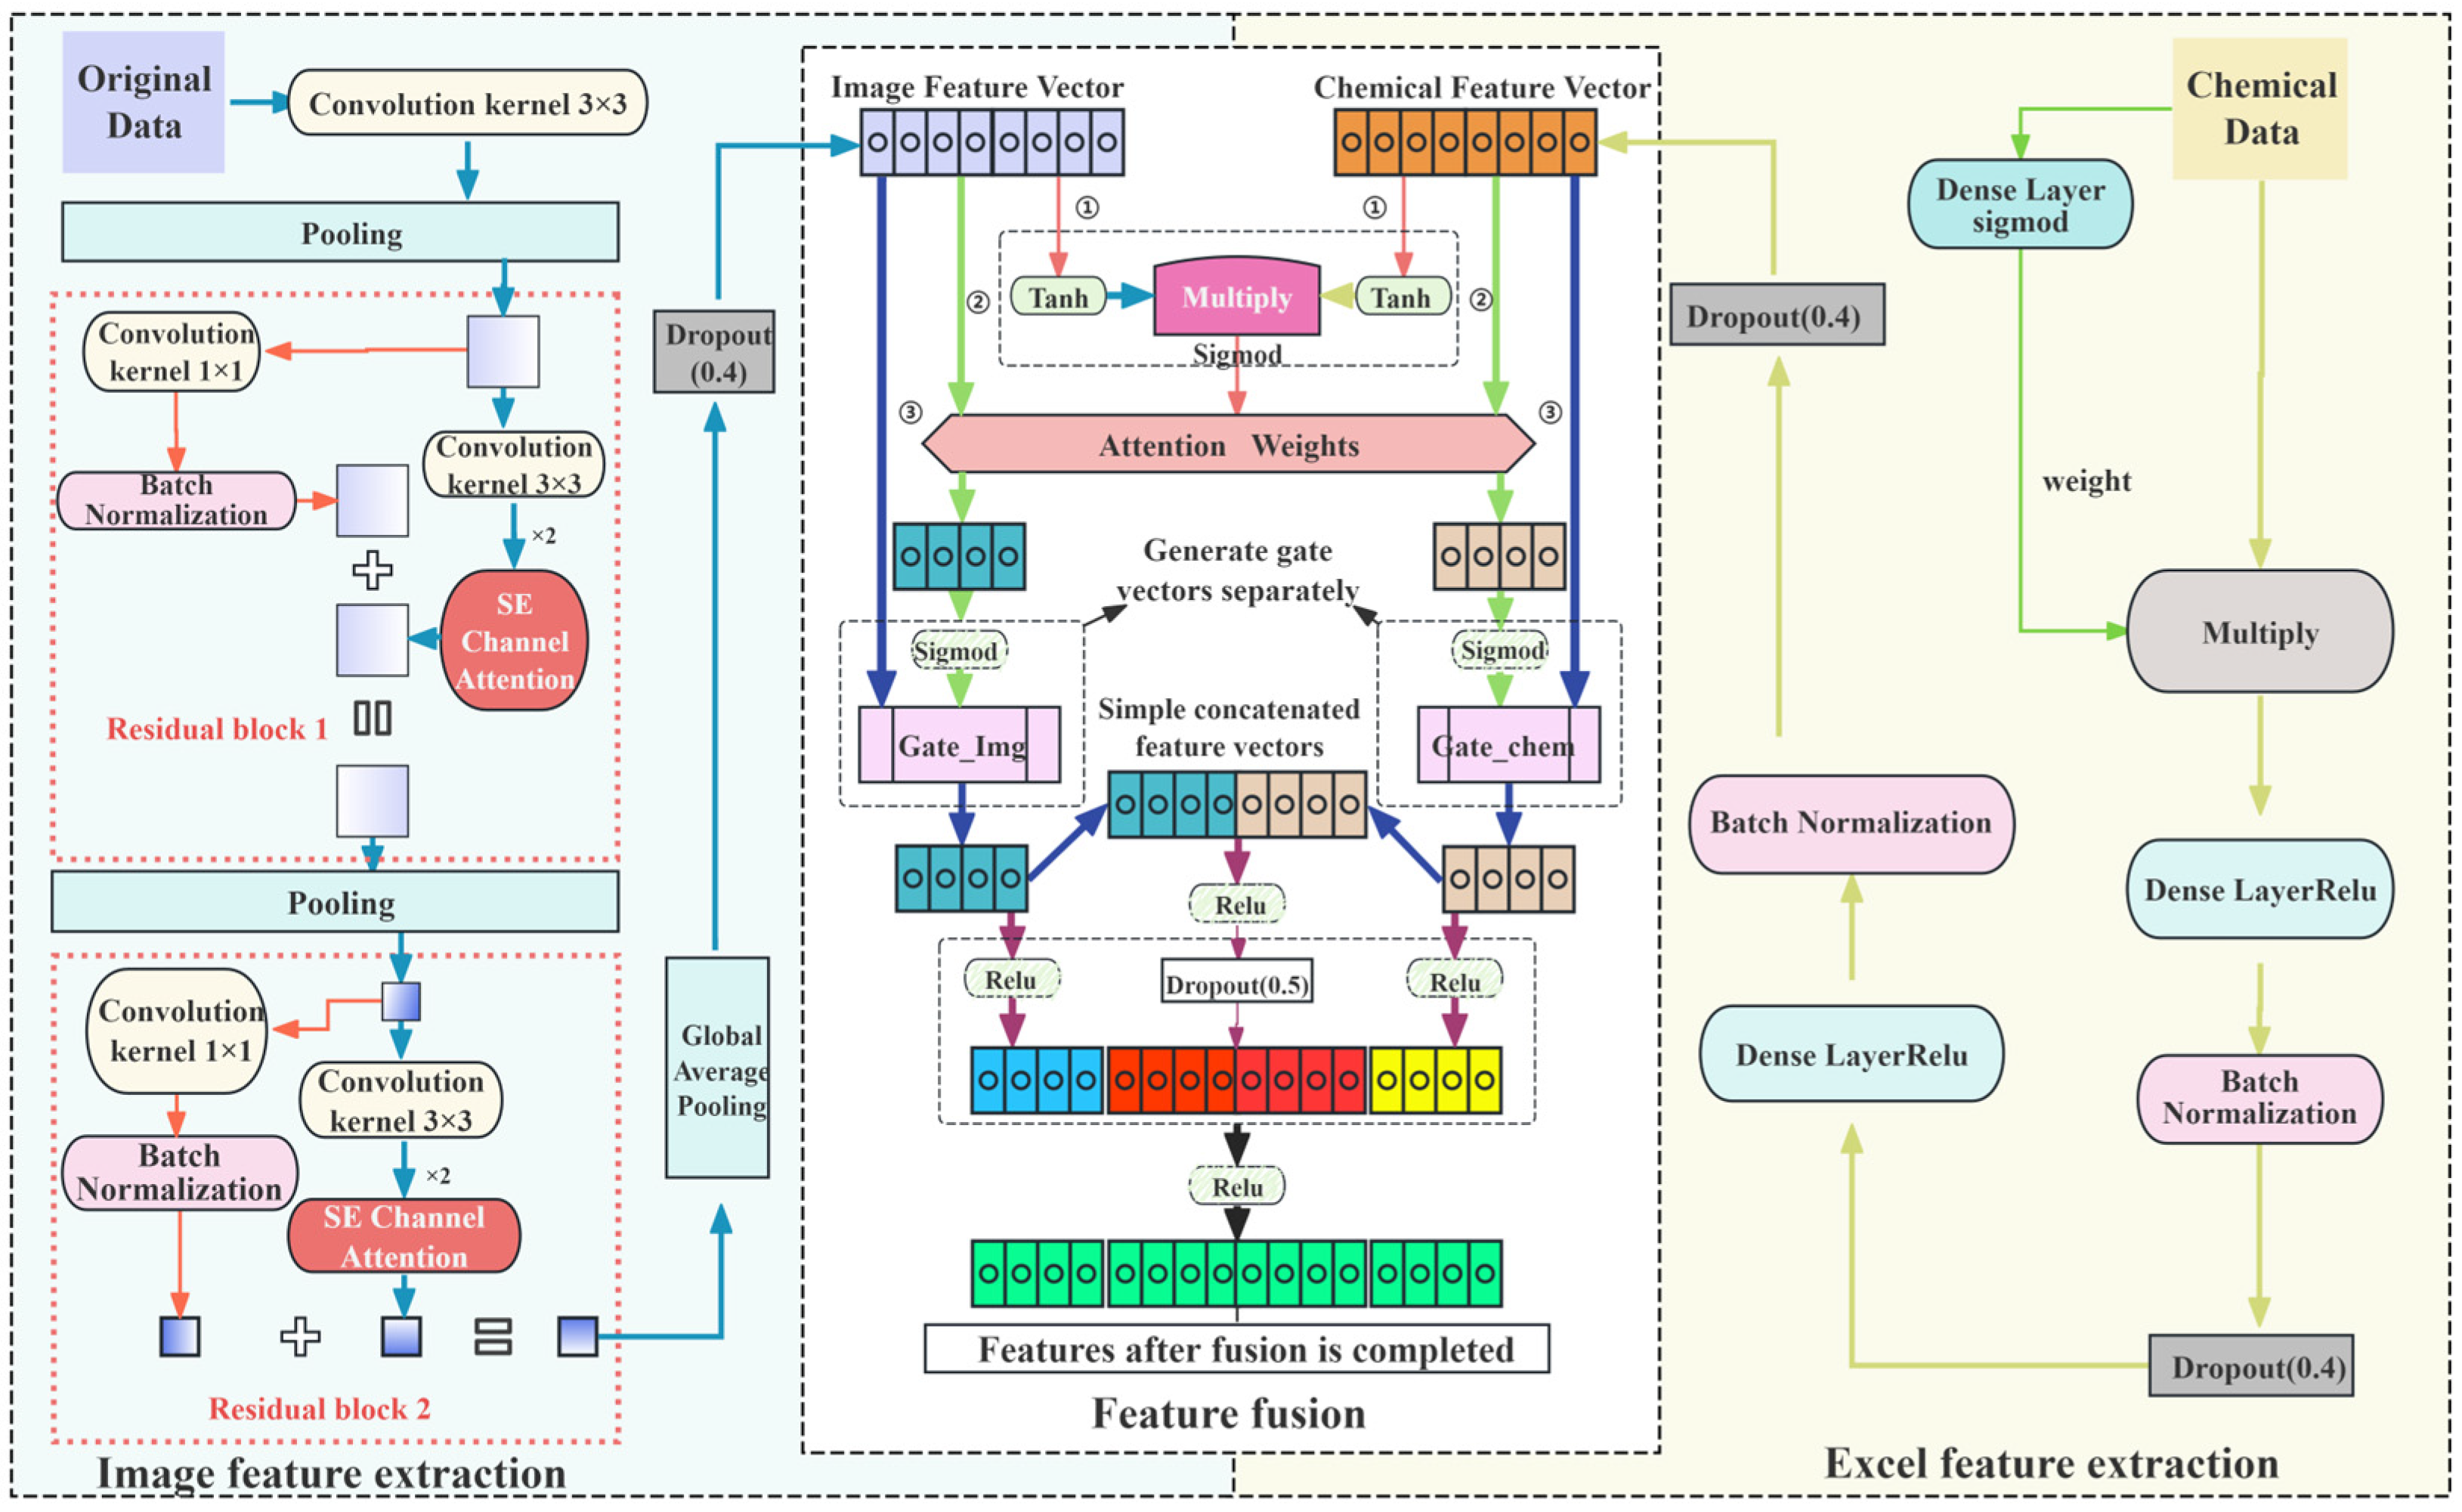
The core of intermediate fusion lies in its interaction module, which can dynamically model the nonlinearities and dependencies among features from different modalities [41]. Deep-level feature fusion can more effectively enhance data utilization, particularly for the multi-source coupling and integration of geological prospecting factors. Focusing on two data modalities—tabular data (from geochemistry, geophysics, and geology) and image data—this paper proposes a multi-modal deep learning model designed for the fusion of image and tabular data. The model aims to improve the performance of binary classification tasks through effective feature interaction and selection mechanisms. The primary focus is on extracting geochemical features, supplemented by fault structures, geological attributes, and aeromagnetic information. The overall model consists of three main components: dual-branch feature extraction and a cross-modal fusion module (Figure 2). The architecture is as follows:
Dual-Branch Feature Extraction
Image Branch: This branch processes various types of 2D image data derived from geological processes, including processed geochemical distribution maps, geological maps, and aeromagnetic images. Using labeled samples for classification, it comprehensively extracts subtle features related to prospective areas to enhance spatial information recognition. It employs an improved ResNet architecture by incorporating residual blocks with a Squeeze-and-Excitation (SE) attention mechanism. The input, after passing through convolution and pooling layers, is processed through residual connections to maintain gradient flow. Each residual block consists of two paths: a main path (two convolutional layers with 3 × 3 kernels, followed by batch normalization and the SE attention mechanism) and a residual path (a convolutional layer with a 1 × 1 kernel followed by batch normalization). The features from both paths are summed and then passed through a max-pooling layer. At the end of the branch, global average pooling is applied to compress the spatial features into a vector. Concurrently, a Dropout layer with a rate of 0.4 is used to randomly deactivate a portion of the neurons, mitigating overfitting. After feature extraction through two such residual blocks, the branch outputs feature representations containing comprehensive information from the 2D image data.
Geochemical Branch: This branch processes the 1D geochemical and fault structure data acquired from exploration activities. It employs the same labeling scheme as the image branch to ensure alignment, thereby facilitating a more comprehensive extraction of information related to geochemical elements and fault structures. First, a fully connected layer with a Sigmoid activation function generates adaptive feature weights, which are used to perform weighted screening of the original features. Subsequently, a three-layer Multilayer Perceptron (MLP) extracts deep nonlinear features, with each layer followed by batch normalization and a Dropout layer with a rate of 0.4. This process ultimately yields feature representations encapsulating the 1D geochemical and fault structure information.
Cross-Modal Fusion Module
As the most critical component of the entire model, this module operates as follows. First, attention weight generation: The image and geochemical feature vectors are each mapped to a common semantic space through a fully connected layer with Tanh activation. These transformed vectors are then multiplied element-wise, and the result is passed through a Sigmoid function to generate attention weights. These weights are applied to the features of both modalities individually. Subsequently, independent fully connected layers with Sigmoid activation generate gating network signals, which perform a secondary selection on the original features to retain salient information. The gated features from both modalities are then concatenated and fused through a fully connected layer with ReLU activation, followed by batch normalization and a Dropout layer with a rate of 0.5, producing the cross-modal fused features. Simultaneously, separate fully connected layers with ReLU activation are applied to the gated image and geochemical features to generate auxiliary supervisory features, aimed at preserving modality-specific information. The cross-modal fused features and the two auxiliary supervisory features are concatenated into a 768-dimensional vector. This vector is further integrated by a fully connected layer, followed by layer normalization and Dropout. Finally, a fully connected layer with Softmax activation outputs the classification probabilities. The model is trained using the Adam (Adaptive Moment Estimation) optimizer, which adaptively adjusts the learning rate. Evaluation metrics include accuracy, loss function, confusion matrix, and others. This design achieves adaptive cross-modal fusion through attention and gating mechanisms. By incorporating auxiliary supervisory branches to maintain the characteristics of each modality, it enhances feature representation capabilities while mitigating overfitting. Its core advantage lies in a deep and conservative multi-modal fusion strategy, as opposed to simple feature concatenation or late decision fusion. Centered on an “attention-gating” mechanism, it establishes a complete technical pipeline encompassing deep optimization of heterogeneous features, refined cross-modal interaction, and complementary fusion of multiple information streams.

3. Regional Geological Background

3.1. Geological Overview of the Study Area

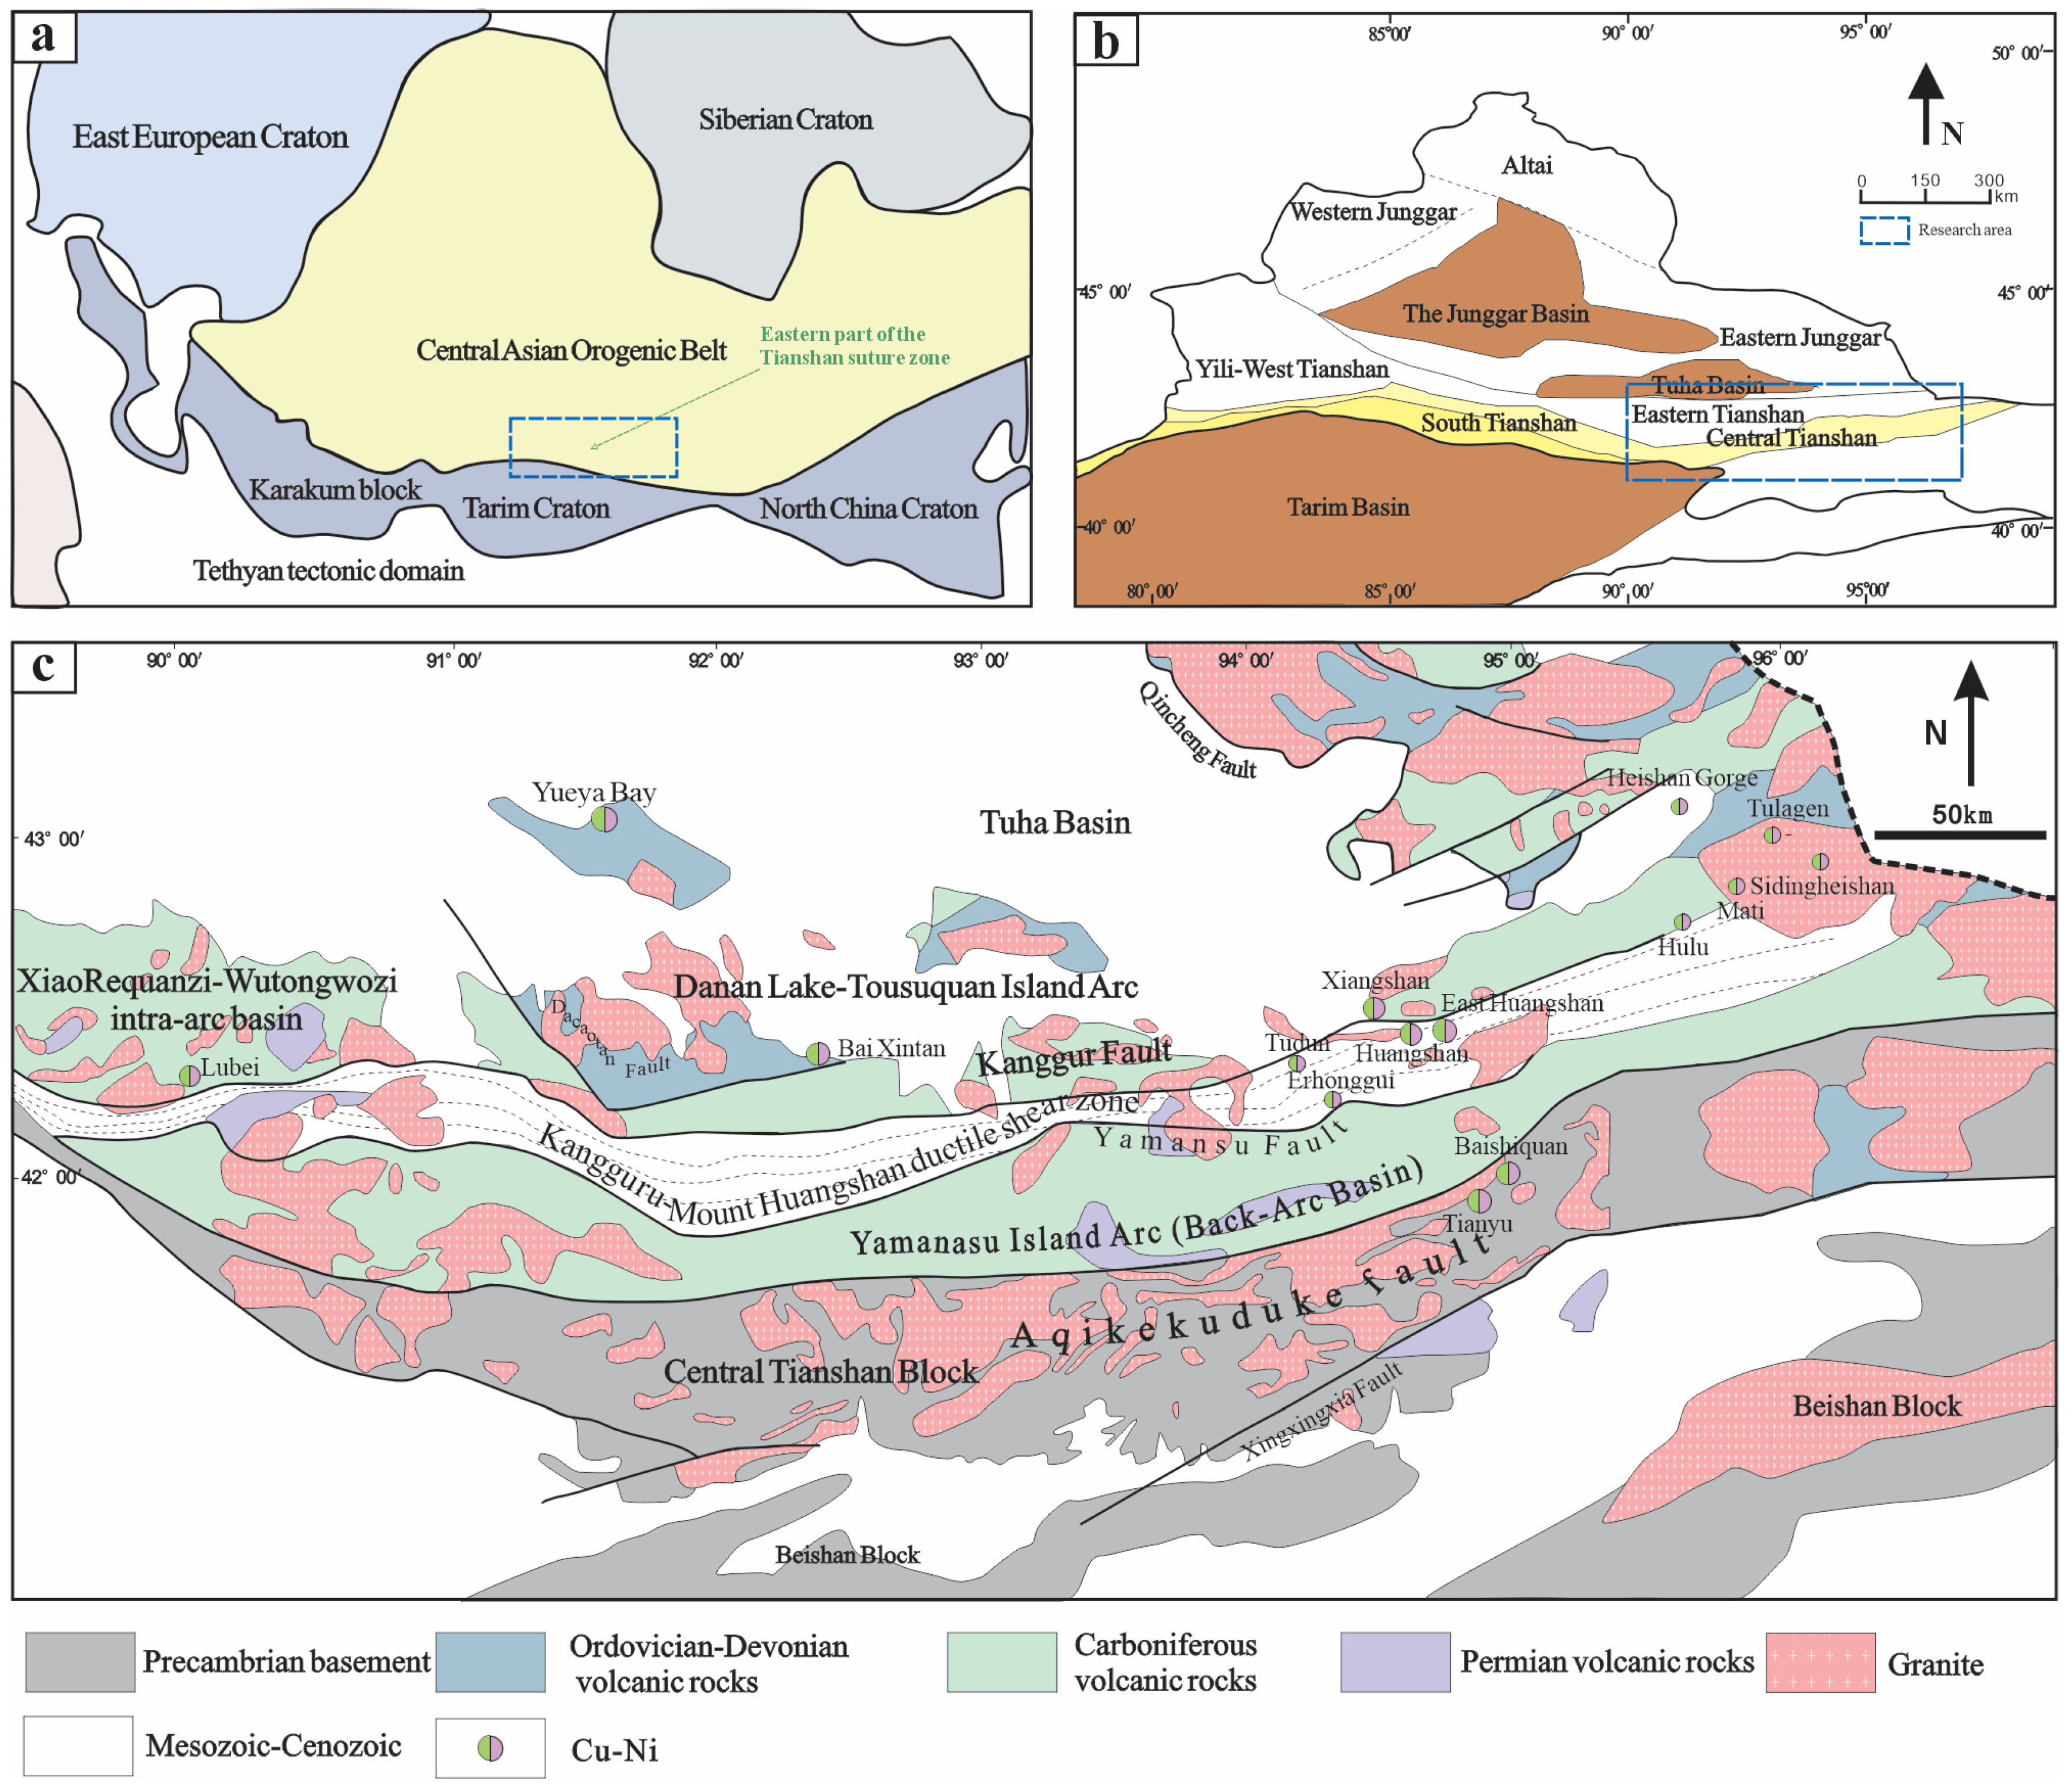
The Central Asian Orogenic Belt (CAOB) is an accretionary orogen and represents the largest and longest-evolving orogenic belt on Earth since the Phanerozoic [42]. It has undergone a complex tectonic evolution involving basement development, the formation and early evolution of the Paleo-Asian Ocean, late Paleozoic ocean evolution and initial continental collision, followed by post-collisional tectonics and intracontinental development stages [43,44]. The orogen is bounded to the north by the East European–Siberian Craton and to the south by the Karakum Block and the Tarim–North China Craton (Figure 3a). It hosts numerous magmatic sulfide deposits, most of which formed during the Permian. The Altai, Junggar, Tianshan, and Beishan regions are integral components of the CAOB and constitute one of the most significant mineral resource bases in northwestern China [45]. This study focuses on the eastern Tianshan region, specifically the East Tianshan and Central Tianshan areas. Located in the southwestern part of the CAOB, this area lies at the junction of the Mongolian and Kazakhstan tectonic domains [46] (Figure 3b).
The study area is located primarily within the East Tianshan-Central Tianshan Massif. Several major east–west trending fault zones constitute the fundamental structural framework of the East Tianshan and Central Tianshan orogenic belts [47], primarily including the Dacaotan Fault, Kangguer Fault, Yamansu Fault, Aqikekuduke Fault, and Xingxingxia Fault. The East Tianshan-Beishan region hosts numerous magmatic Cu-Ni-Co sulfide deposits associated with mafic–ultramafic rocks, making it a significant metallogenic belt for this deposit type in China [48]. From north to south, the area can be divided into the Dananhu-Tousuquan island arc belt, the Kangguer-Huangshan shear zone, the Yamansu island arc belt, and the Central Tianshan Massif (Figure 3c), hosting polymetallic deposits predominantly composed of Au, Cu, Ni, Pb, Zn, and Fe [49]. The exposed strata in the region are primarily Paleozoic, including the Lower Devonian Dananhu Formation, the Lower Carboniferous Yamansu Formation, and the Middle Carboniferous Gandun Formation and Wutongwozi Formation, with subordinate Cenozoic Tertiary and Quaternary sediments sporadically distributed. Cu-Ni mineralization is predominantly concentrated in the Permian, which represents one of the most significant Cu-Ni metallogenic epochs on the southern margin of the CAOB and holds particular importance within China’s Cu-Ni sulfide deposit metallogenic belts [50]. The discovered Cu-Ni deposits are mostly associated with mafic–ultramafic intrusions, concentrated within the Kangguer-Huangshan shear zone and hosted in Carboniferous volcanic–sedimentary rocks. These include notable deposits such as Tulaergen, Hulu, Huangshan, Huangshandong, Xiangshan, Tudun, and Erhongwa.
Figure 3. Structural sketch of the study area [51,52]. (a) Location of the Central Asian Orogenic Belt (CAOB) and adjacent tectonic units. (b) Tectonic position of the Eastern-Central Tianshan within the southwestern CAOB. (c) Geological and tectonic division of the East Tianshan-Central Tianshan study area.
Minerals 16 00318 g003

3.2. Typical Deposit

3.2.1. Baixintan Cu-Ni Deposit

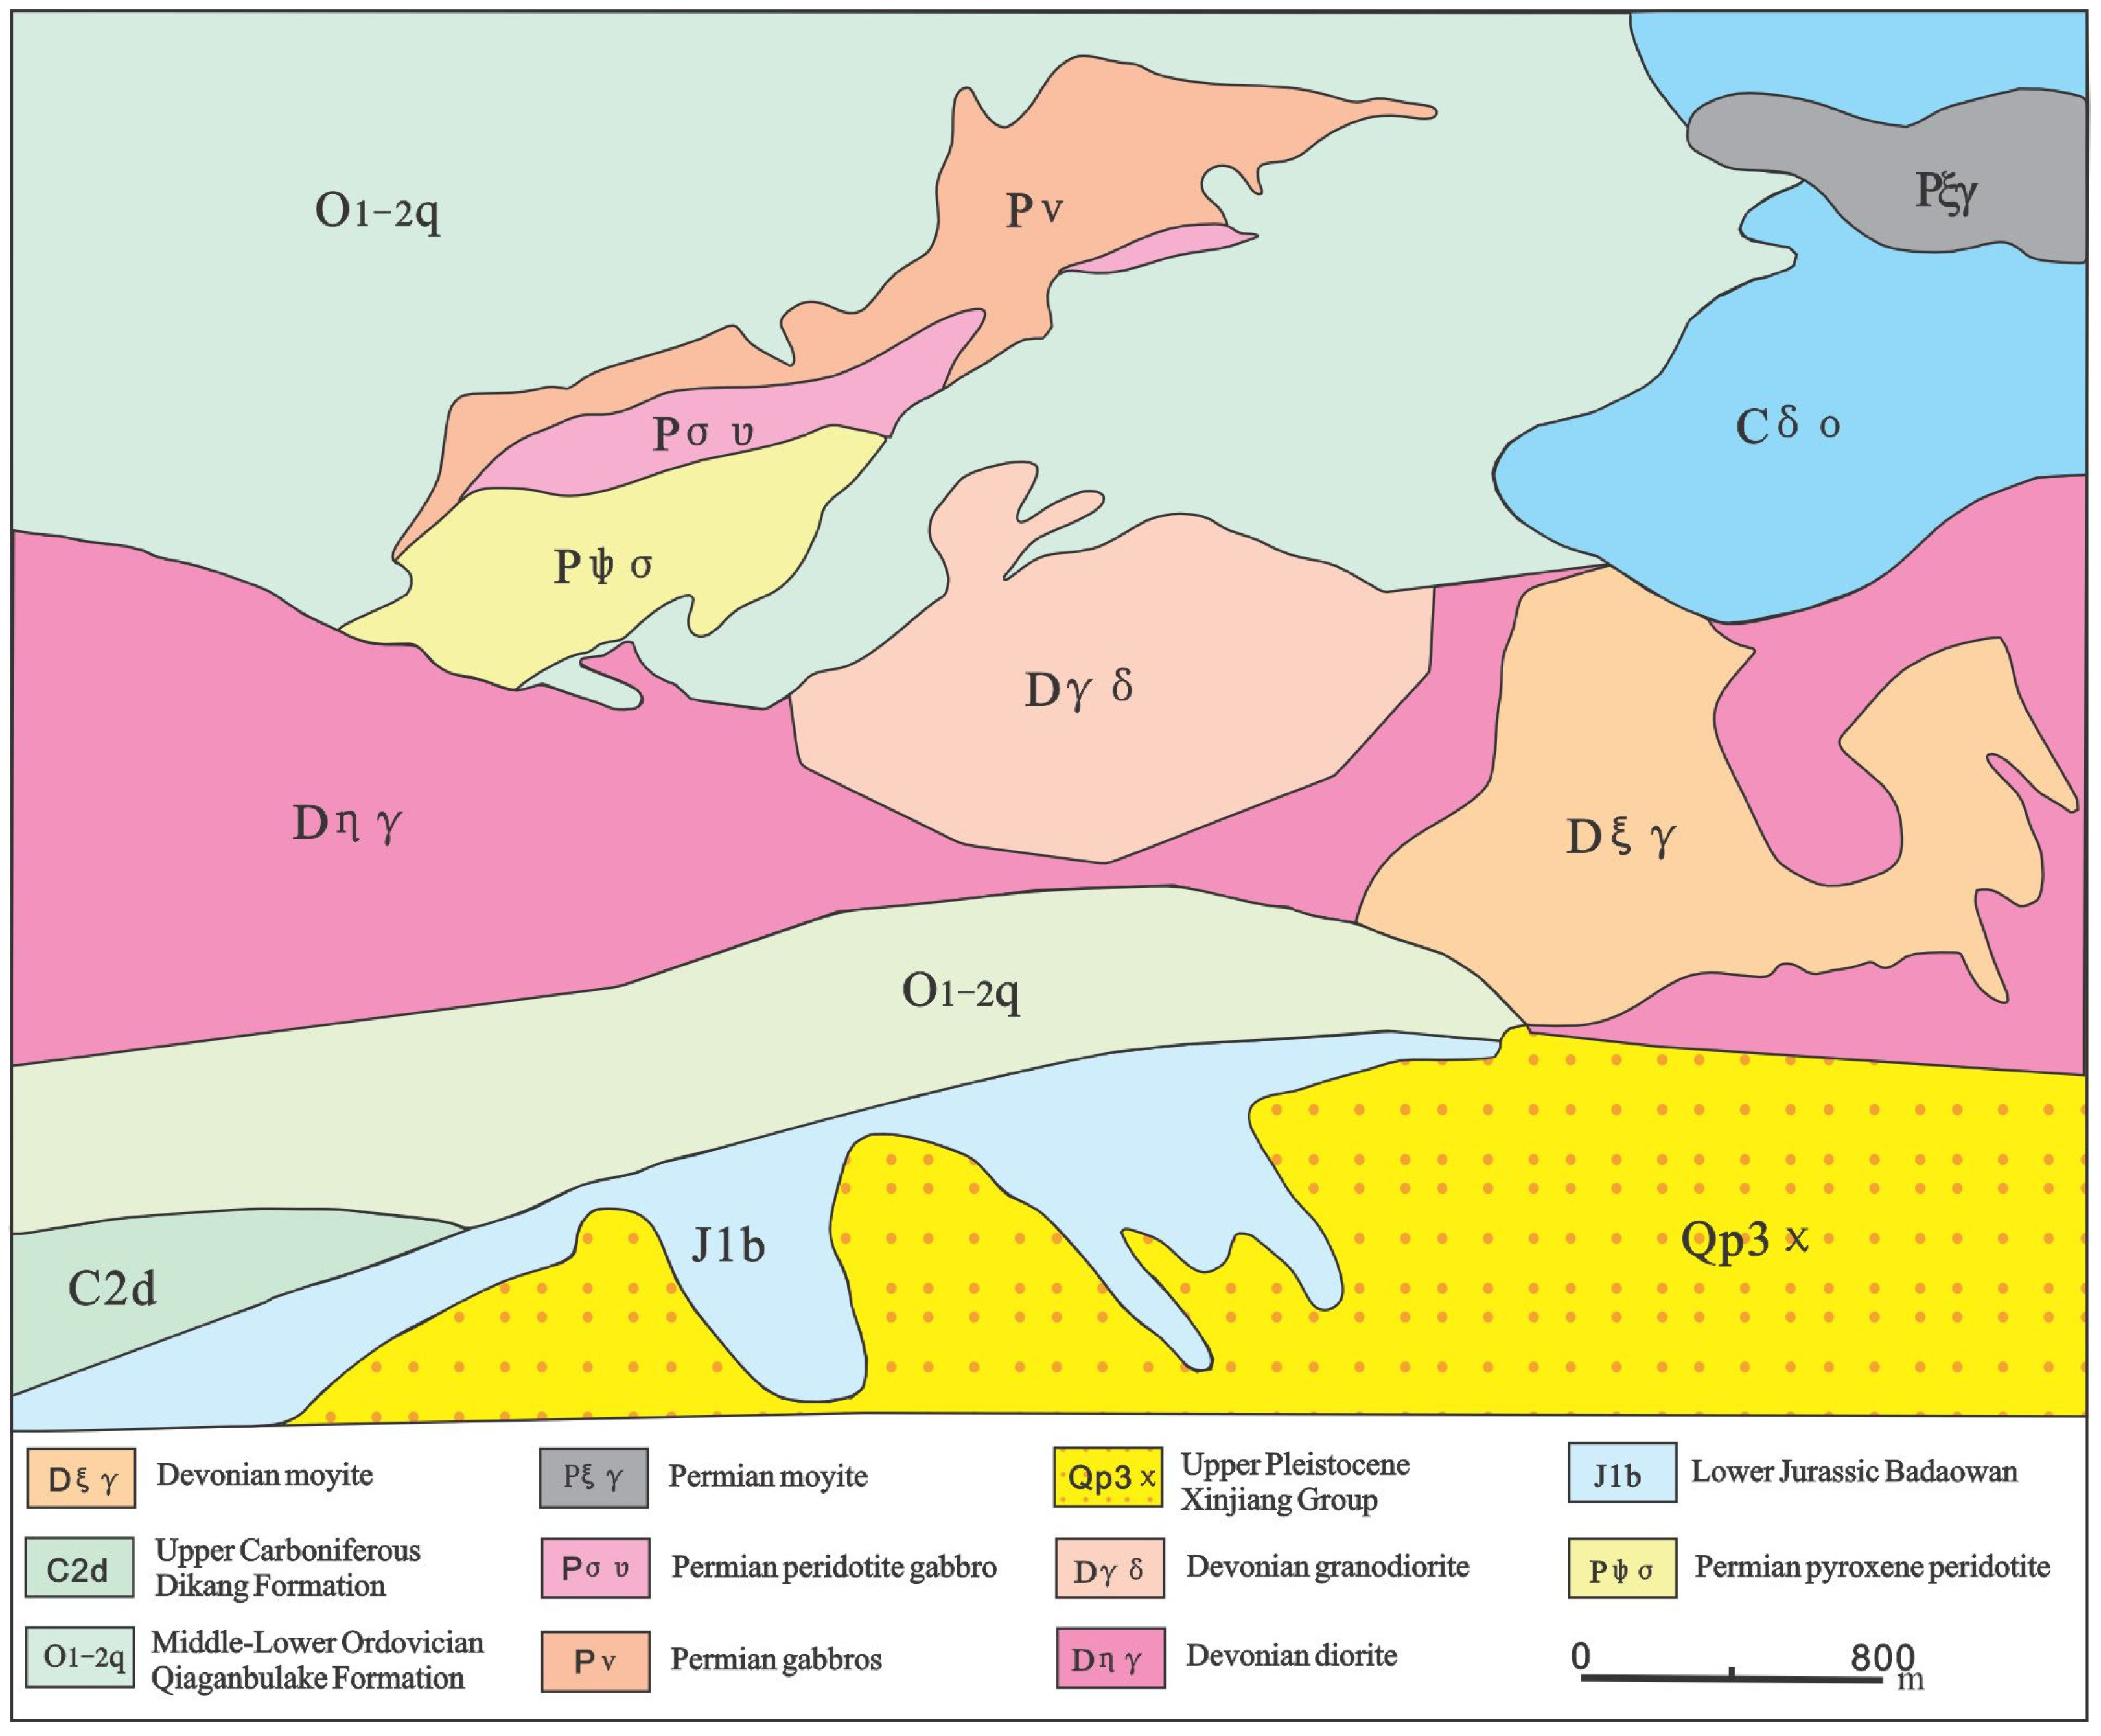
The Baixintan Cu-Ni deposit, hosted in a Permian mafic–ultramafic intrusion, is a typical magmatic Cu-Ni sulfide deposit. It is situated at the junction of the Tarim ancient continental margin block and the southern Junggar active belt [53]. Bounded by the Kangguertag Fault, the area to the north is assigned to the Harlik stratigraphic subzone of the Junggar stratigraphic region, while the area to the south belongs to the Qiugemingtash-Huangshan stratigraphic subzone of the North Tianshan stratigraphic region. The exposed strata consist mainly of the Ordovician, Devonian, Carboniferous, Jurassic, Paleogene-Neogene, and Quaternary systems. Magmatic rocks are well developed in the area and, based on intrusion age, can be categorized into Devonian, Carboniferous, and Permian intrusions (Figure 4). Devonian intrusive rocks are predominantly monzogranite, showing an overall compositional trend from intermediate to acidic, with acidity increasing in later stages. Carboniferous intrusions are second in abundance to the Devonian and exhibit a complete rock spectrum, ranging from ultramafic to acidic compositions. Permian intrusions mainly consist of normal granite and monzogranite, often occurring as irregular, elongated bodies, with weak thermal contact metamorphism observed in the surrounding rocks [54,55]. Geophysical data indicate that the Kangguer-Huangshan deep fault zone serves as a boundary for gravity and aeromagnetic anomalies in the region and is associated with beaded local magnetic anomalies, establishing it as the most important structure controlling both rock emplacement and mineralization in the area. The Dacaotan Fault, located north of the Kangguer-Huangshan deep fault, also exhibits beaded magnetic anomalies along its trend. The known mafic–ultramafic intrusions associated with these anomalies are mainly the Baixintan and Haibaotan intrusions. The discovery of the Baixintan deposit suggests that the Dacaotan Fault may also be a significant structure controlling rock emplacement and mineralization in the region, indicating potential for further Cu-Ni exploration along both sides of this fault [56].

3.2.2. Lubei Cu-Ni Deposit

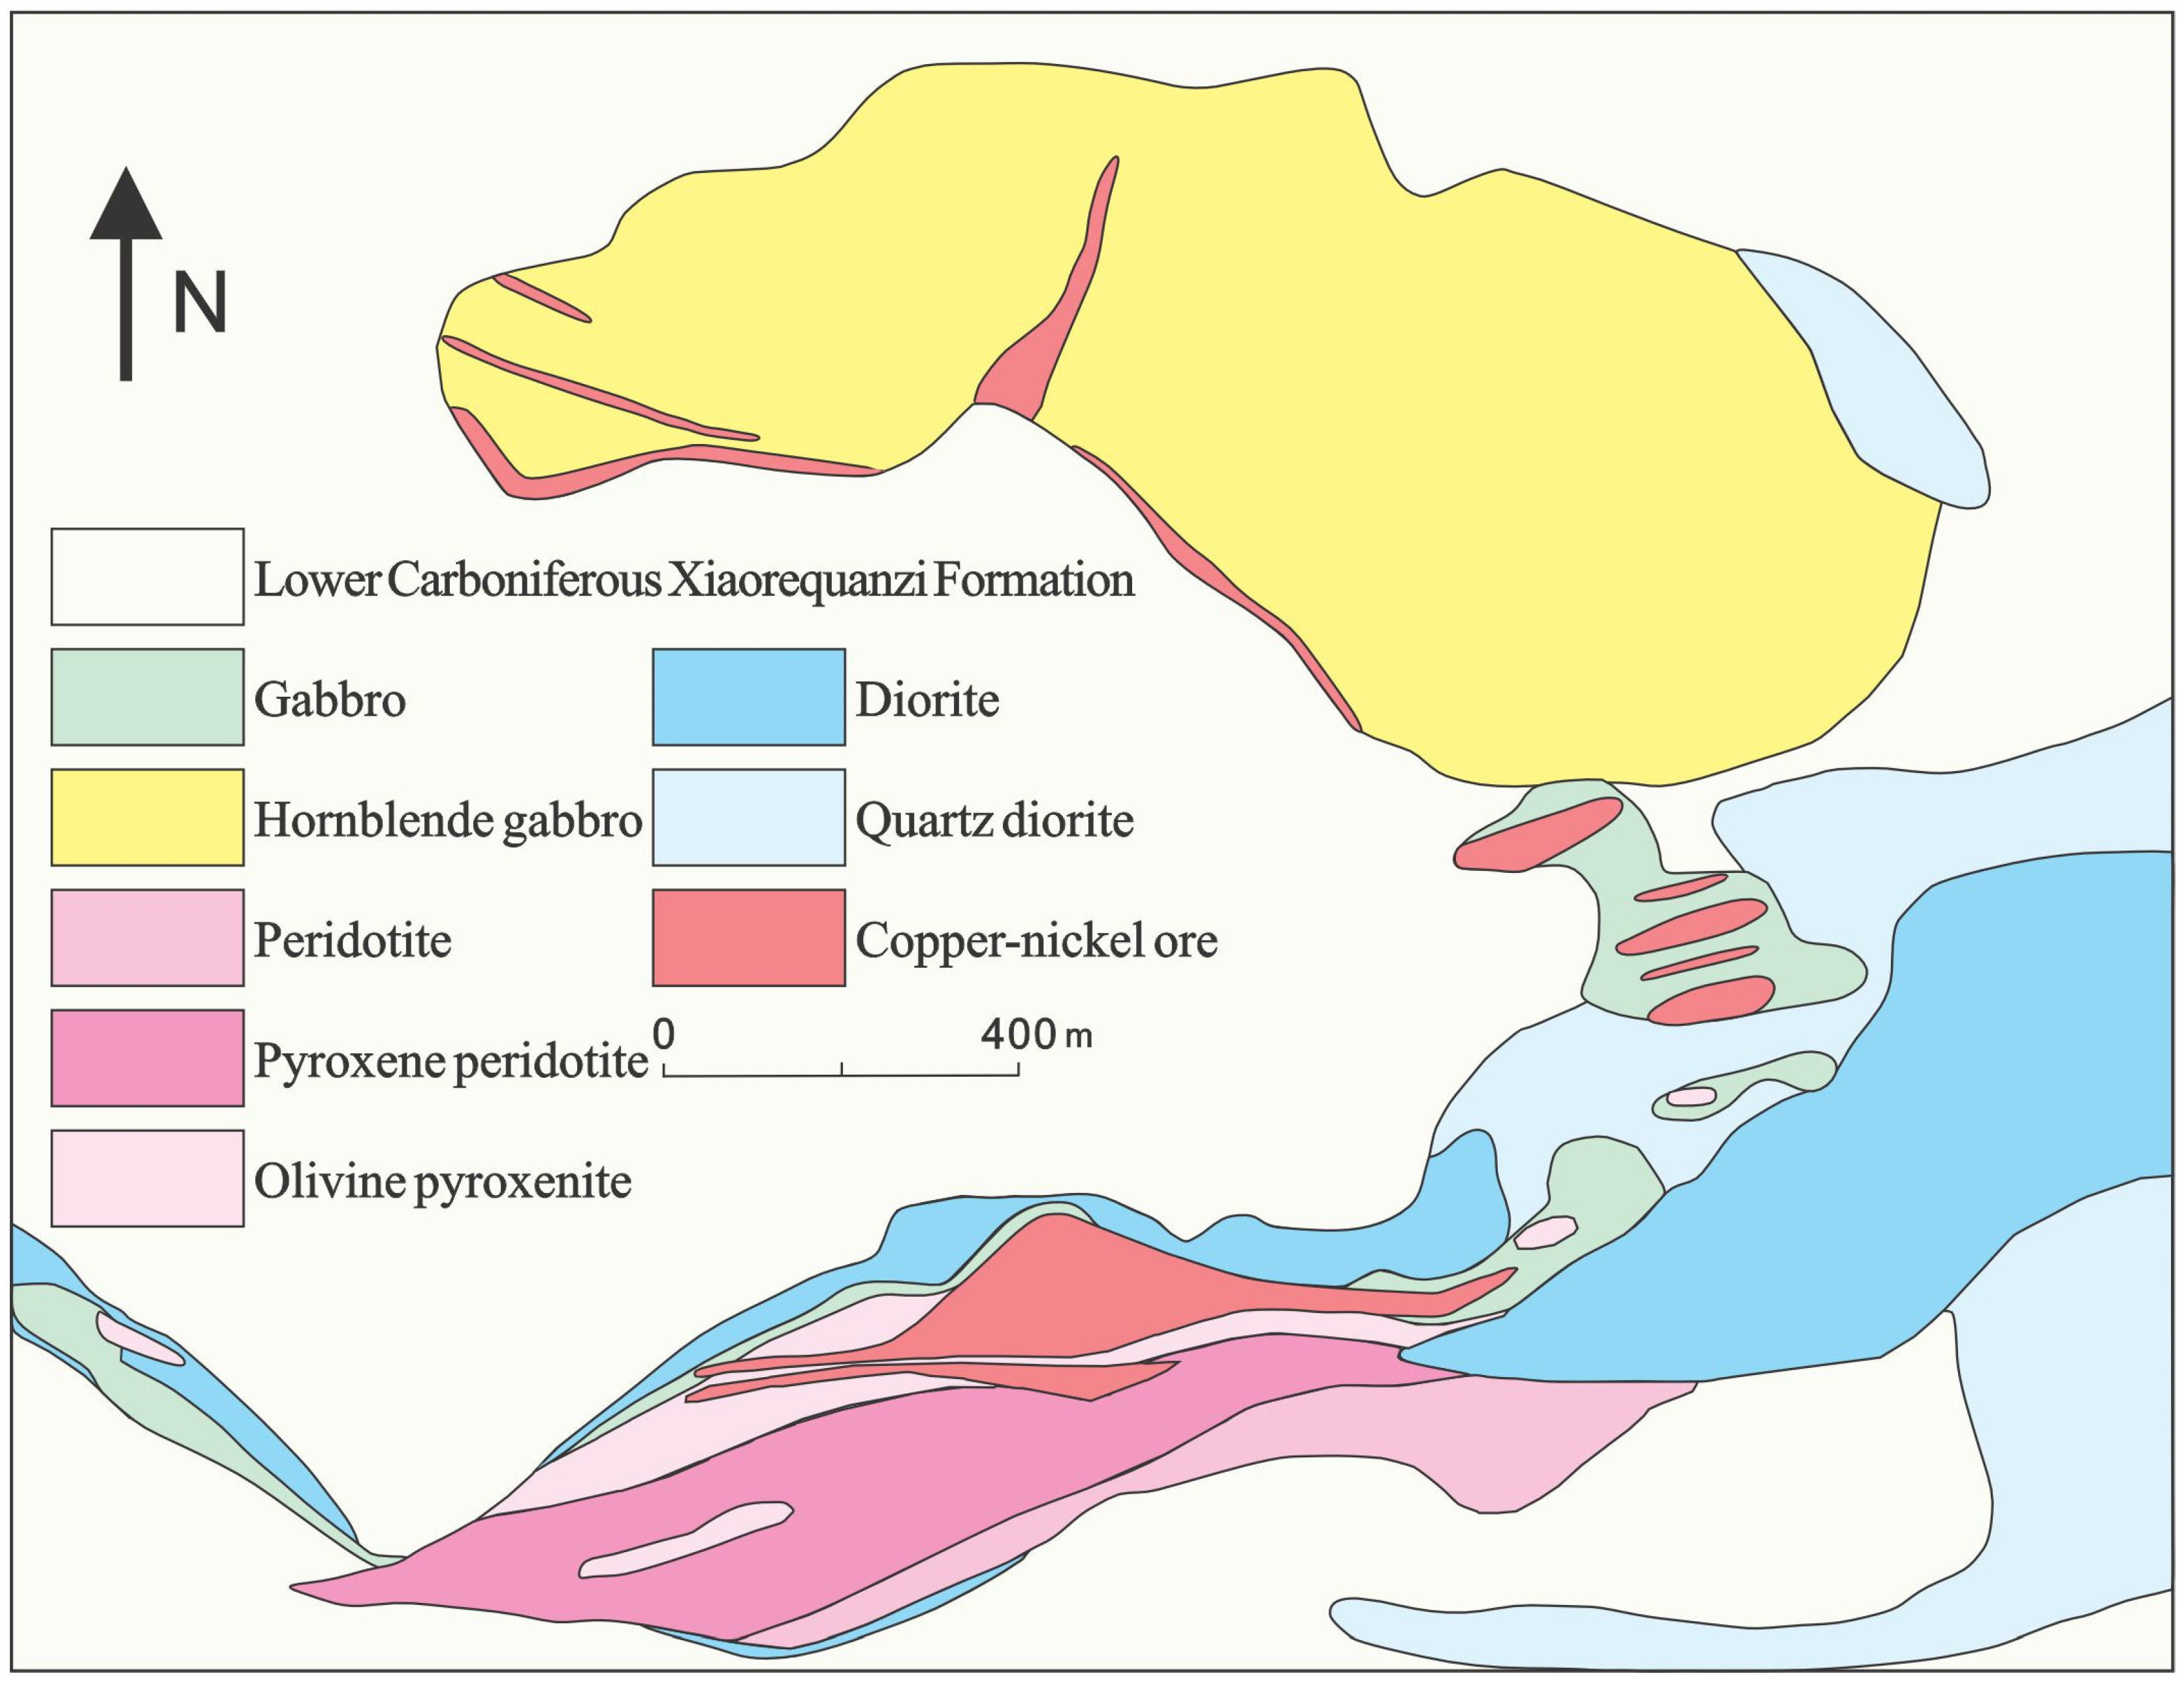
The Lubei Cu-Ni deposit is located on the northern side of the Kangguer Fault and is hosted within tuffaceous clastic rocks of the Lower Carboniferous Xiaorequanzi Formation. The deposit comprises northern and southern ore zones. The southern zone consists of ultramafic to mafic rocks, which serve as the host rocks for the rich ore bodies. The main lithologies here are peridotite, pyroxene peridotite, olivine pyroxenite, and pyroxenite, with minor amounts of gabbro, diorite, and quartz diorite in the periphery and margins. The northern zone is composed of mafic rocks, primarily gabbro and hornblende gabbro, with minor diorite in the periphery [57,58]. Intrusive rocks are well developed within the mining area, occurring as irregular apophyses and stocks. A mafic–ultramafic rock belt has developed along the Kangguer Fault and its secondary faults. The emplacement of these intrusions is closely related to sulfide mineralization, representing a direct manifestation of mineralization in the central segment of the East Tianshan metallogenic belt [59] (Figure 5). The Lubei Cu-Ni deposit is another Cu-Ni deposit discovered following the Baixintan Cu-Ni deposit, through anomaly verification using geochemical exploration techniques. The anomalous element assemblage is Cu-Ni-Cr-Co-(Sb-As-Mo-Zn) [60]. The discovery of this deposit demonstrates the potential for the extension of the western East Tianshan Cu-Ni metallogenic belt.

3.2.3. Huangshan-Jing’erquan-Tulaergen Cu-Ni Deposit

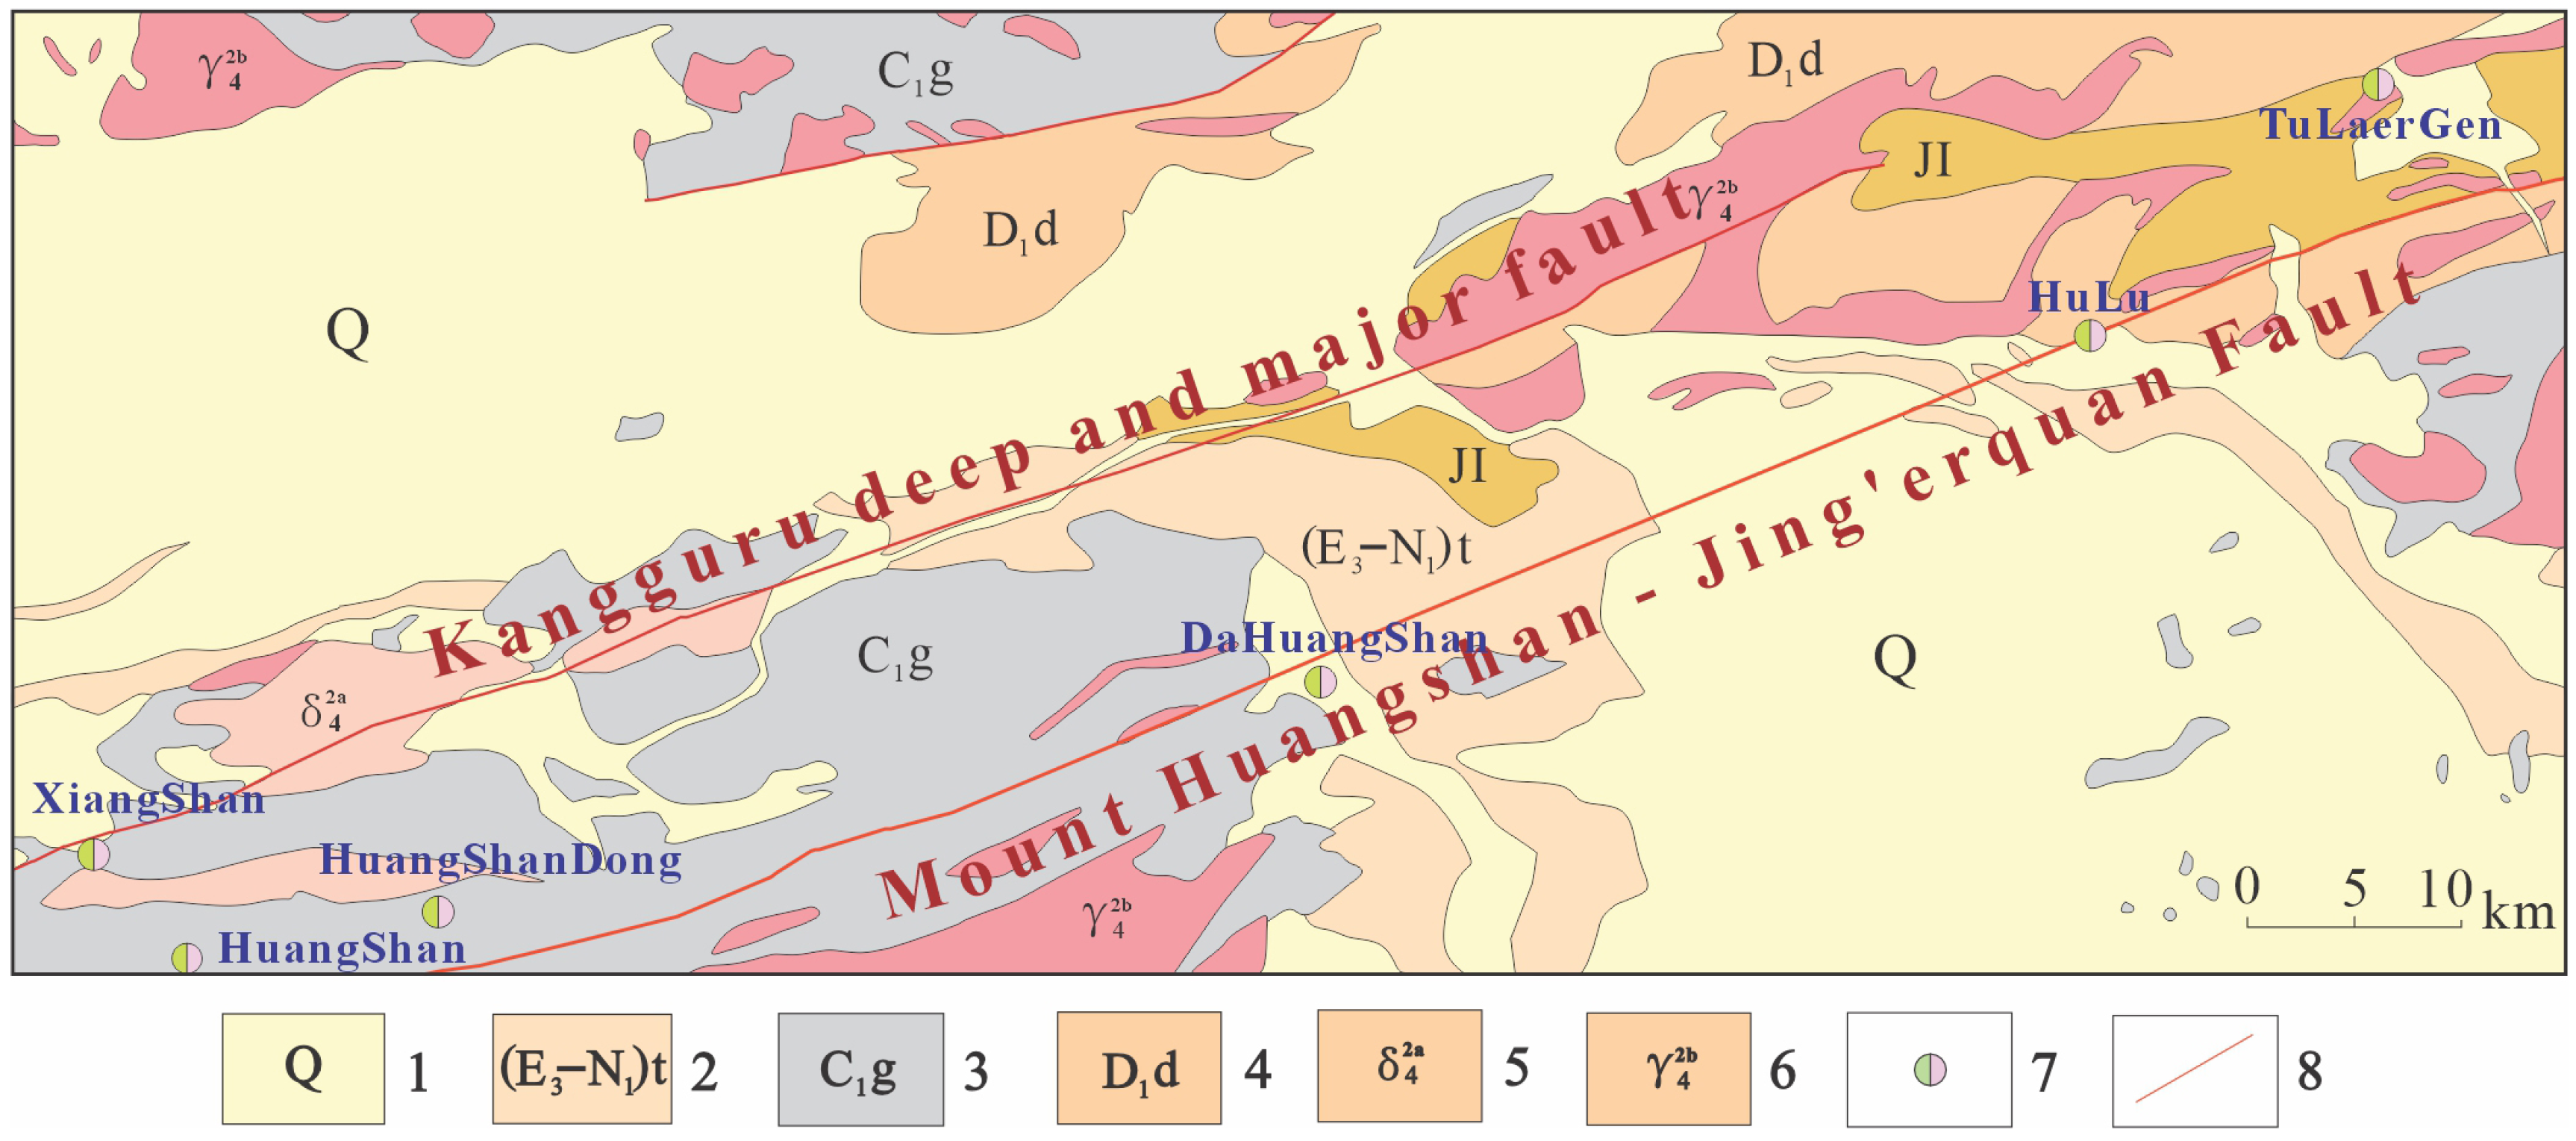
The Huangshan-Jing’erquan-Tulaergen area hosts the most concentrated Ni deposits in Xinjiang. The Cu-Ni deposits in this area are spatially distributed in two belts: the northern belt is controlled by the Kangguer Fault, while the southern belt is controlled by the Huangshan-Jing’erquan Fault. Magmatic activity was frequent in this region, with the Late Paleozoic being the most intense period, giving rise to mafic–ultramafic intrusions such as those at Huangshan, Huangshandong, Hulu, and Tulaergen [61,62] (Figure 6). The basic intrusions in the area are covered by Quaternary sediments [63]. In the Huangshan area, the exposed strata consist mainly of the Carboniferous Gandun Formation, Neogene, and Quaternary deposits. The intrusive rocks, primarily formed in the Permian, are distributed along the Kangguer Fault zone and are predominantly mafic–ultramafic and granitic in composition. Among these, intermediate-acidic rocks are the most widely distributed, followed by basic–ultrabasic rocks, indicating a close relationship with the mafic–ultramafic intrusions [64].
Previous exploration efforts for Cu-Ni deposits have largely focused on the Huangshan-Jing’erquan rock belt, where three large and six medium-sized Cu-Ni deposits have been discovered and evaluated. The basic–ultrabasic rock belt in the central segment of the East Tianshan is similar to the Huangshan-Jing’erquan rock belt in the eastern segment, both belonging to the same East Tianshan ore-bearing basic–ultrabasic rock belt. Their petrological and petrochemical characteristics, emplacement ages, magma sources, and evolutionary features are comparable to those of the Huangshan-Jing’erquan belt. Building upon previous research, You Minxin et al. investigated the mineralization processes and geochemical characteristics of the magma source regions of the newly discovered Baixintan and Lubei deposits, located west of Shalong in the East Tianshan, further demonstrating the favorable metallogenic conditions and exploration potential of the area east and south of Huangshan in the East Tianshan [52].

4. Multi-Source Metallogenic Factor Feature Processing

4.1. Geochemical Characteristics

The Cu-Ni deposits in northwestern China can be classified into three deposit types: the Kalatongke-type magmatic Cu-Ni deposit in Xinjiang, the Huangshan-type magmatic Cu-Ni deposit in Xinjiang, and the Pobei-type magmatic Cu-Ni deposit in Xinjiang [65]. The Kalatongke-type and Huangshan-type Cu-Ni deposits are genetically similar [66], but differ in their distribution areas. In the tectonic domains dominated by the East and West Tianshan, particularly in the East Tianshan region, predicted geochemical element anomalies primarily consist of Cu, Ni, along with assemblages of Cr, Co, Ag, Ti, V, MgO, and Fe2O3. In contrast, the Pobei-type magmatic Cu-Ni deposits are mainly characterized by geochemical anomalies of Cu and Ni.
1. Selection of one-dimensional geochemical characteristics
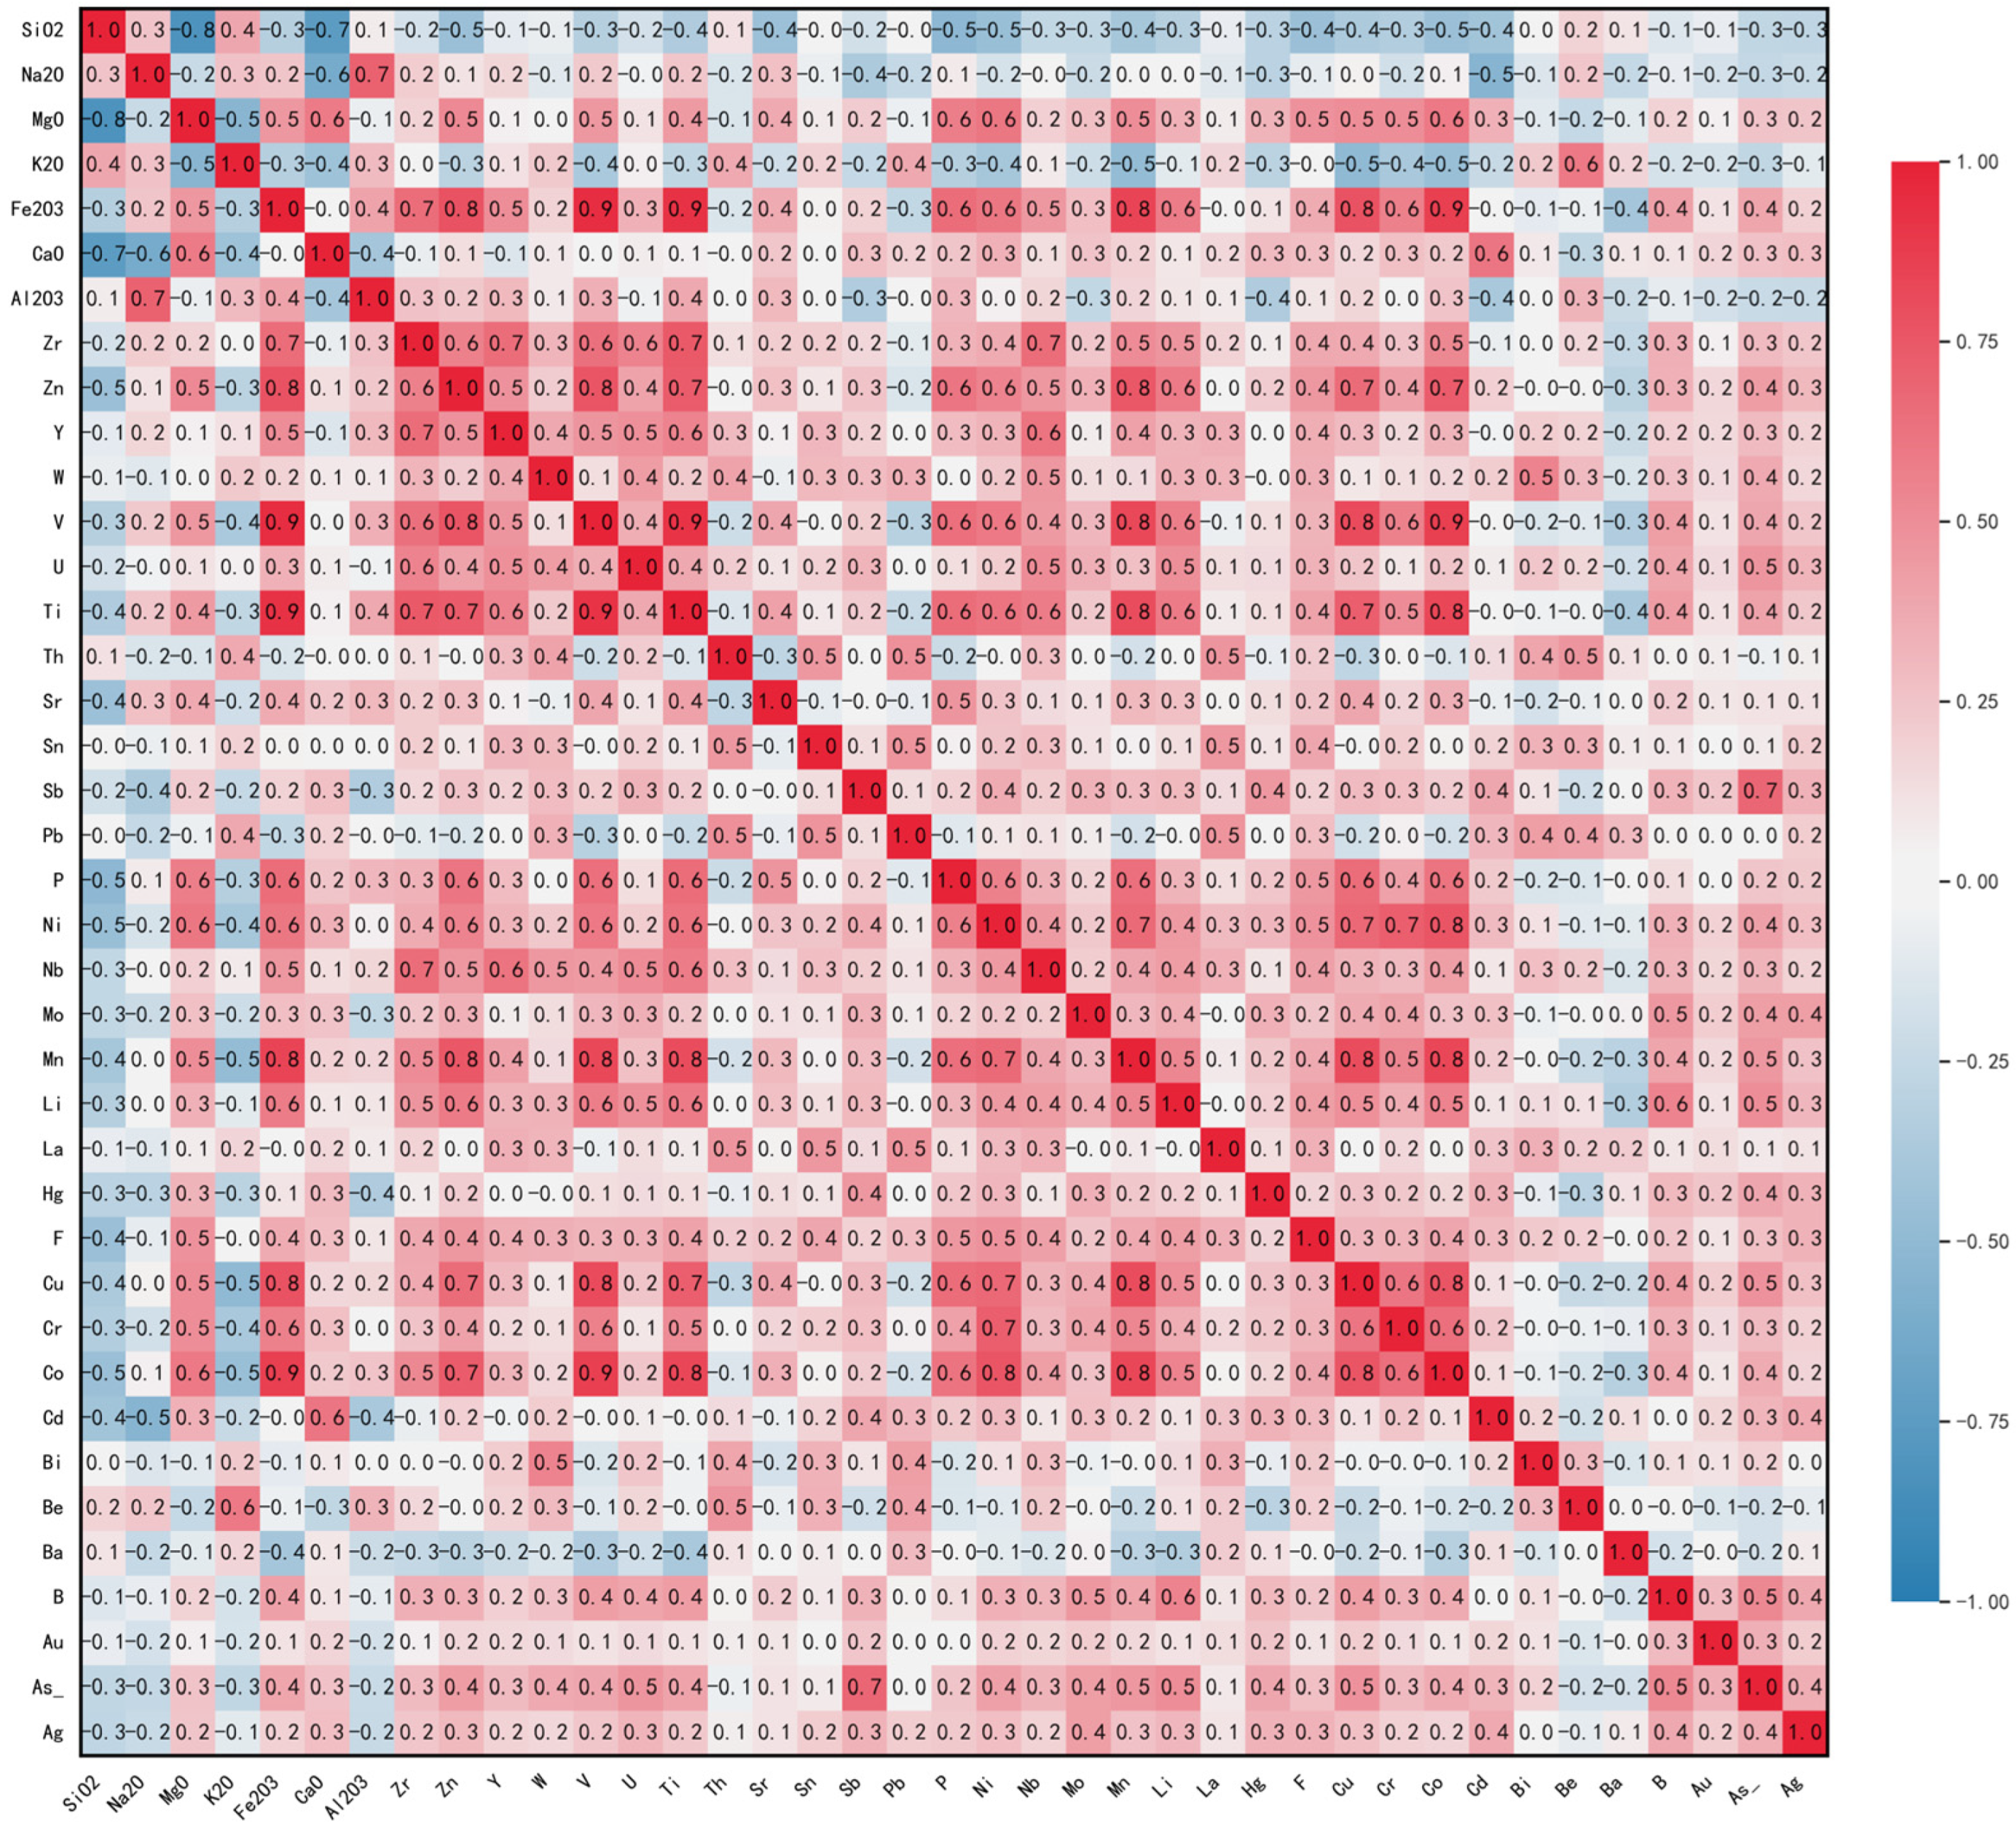
In the process of selecting geochemical features, beyond the previously identified elements (Cu, Ni, Cr, Co, Ag, Ti, V, MgO, and Fe2O3), a correlation analysis focusing on Cu and Ni was conducted to further refine feature selection and ensure no potential information was overlooked. Spearman correlation coefficients were calculated for the standardized data, and a correlation coefficient matrix was plotted (Figure 7). The results indicate that Cu and Ni exhibit strong positive correlations with Co (0.76), Cr (Cu: 0.61; Ni: 0.72), and V (Cu: 0.81; Ni: 0.60)—elements typically enriched in mafic–ultramafic systems as compatible elements [67]. Their relationships with Fe2O3 (Cu: 0.78; Ni: 0.61) and Mn (Cu: 0.80; Ni: 0.66) further suggest co-migration and enrichment under similar reducing conditions or within common sulfide/mineral phases. The stronger correlations of Ni with Cr and MgO reflect its higher compatibility in olivine and chromite [68]. Conversely, elements representing felsic or siliciclastic components, such as SiO2 (with Ni: −0.45) and K2O (with Cu: −0.51), show significant negative correlations with these metals, highlighting their antagonistic relationship with evolved magmas or crustal materials.
Additionally, elements such as As, Li, P, Ti, and Zn exhibit moderate positive correlations with both Cu and Ni, potentially related to secondary hydrothermal activity or specific mineral carriers. The exclusive positive correlations observed—B only with Cu, and F and Nb only with Ni—suggest that their respective transport and precipitation processes involved different local fluid phases or accessory minerals. Accordingly, each of the 18 geochemical elements identified through this analysis was selected as an individual 1D geochemical feature for subsequent feature extraction.
2. Selection of two-dimensional geochemical characteristics
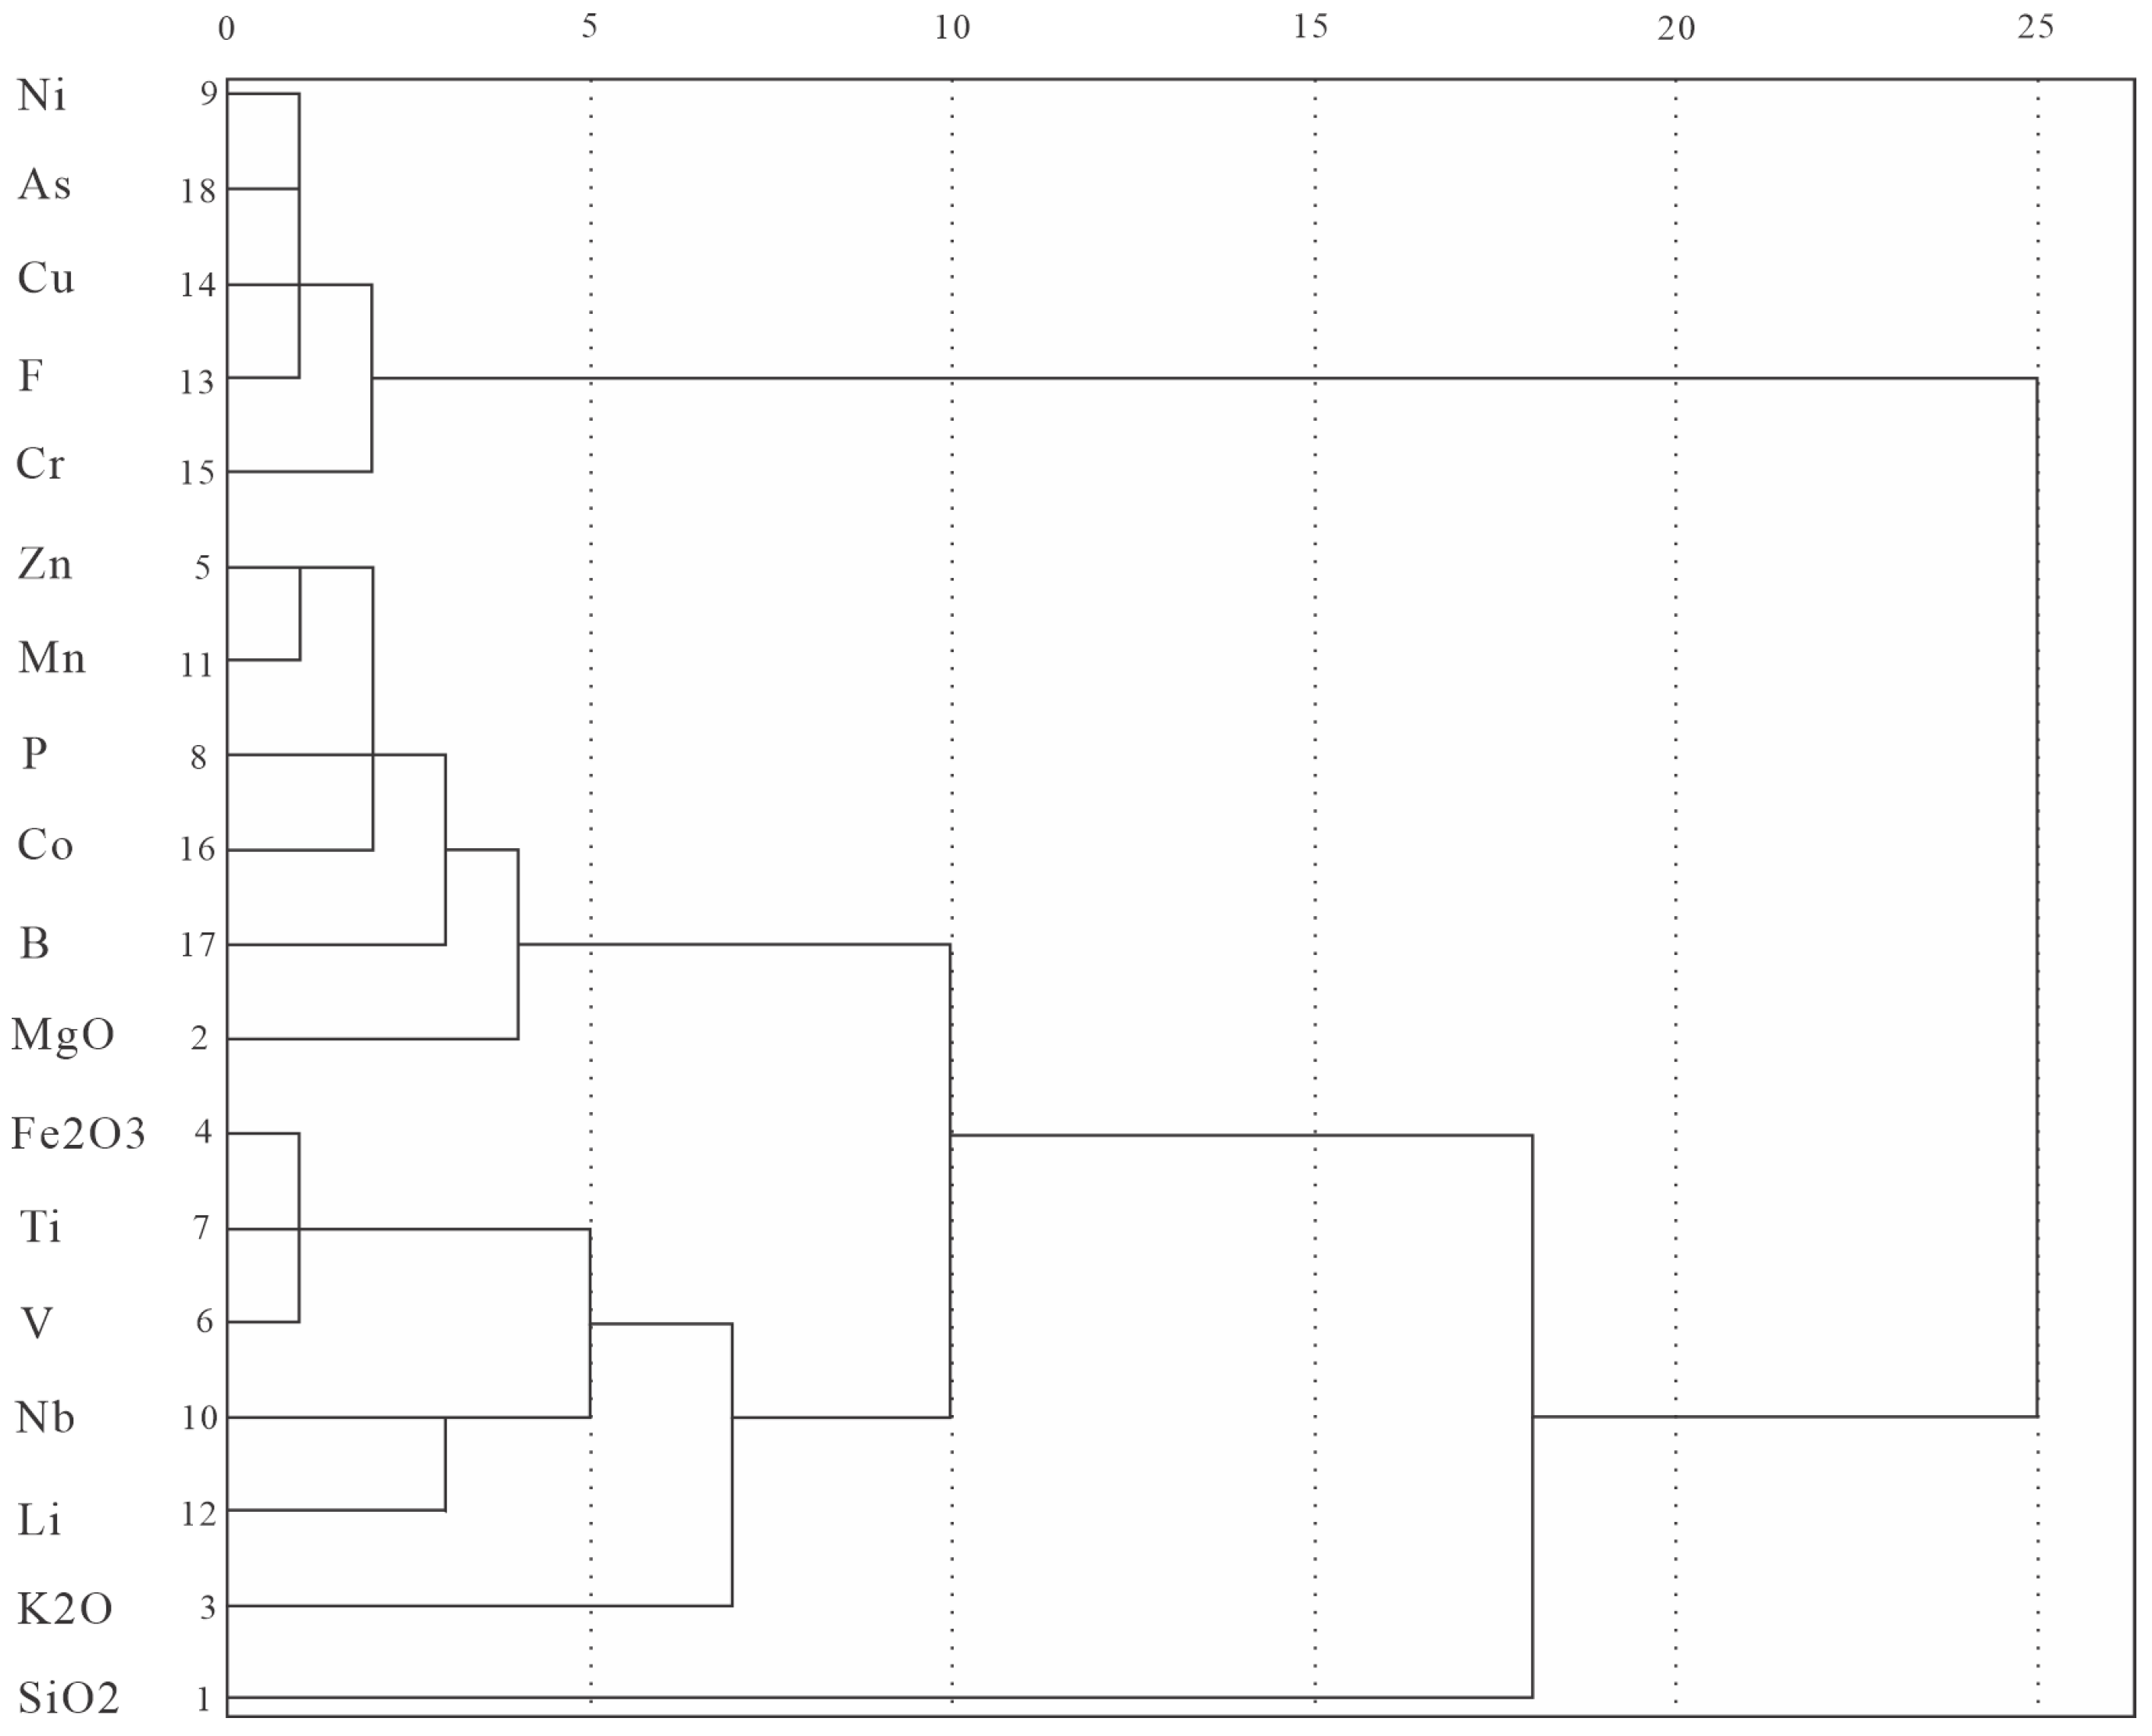
Through the aforementioned processing, treating single-element anomalies as 1D data rather than generating 2D images essentially constitutes a targeted extraction of features from strongly correlated elements, prioritizing these elements as key targets. Subsequently, processing these data to generate 2D representations aims to preserve the spatial anomaly relationships among the elements. Clustering analysis was performed on the extracted strongly correlated elements, classifying them into five groups based on the dendrogram (Figure 8). The elements were divided into five categories:
The first element assemblage (Cu, Ni, As, F, Cr) represents the metallogenic core associated with sulfide immiscibility and subsequent hydrothermal reworking. Regionally, this assemblage is closely related to the widely exposed mafic–ultramafic intrusions in the area. Cu and Ni are typically derived from partial melting of the mantle and become enriched during magmatic evolution due to sulfide immiscibility [69]. High Cr content indicates the presence of early crystallized minerals such as Cr-rich spinel. The association of As and F, on the other hand, suggests overprinting by later magmatic-hydrothermal or metamorphic fluids. These fluids may have leached volatiles and metals from the wall rocks (e.g., black shales or pyroclastic rocks in the region), leading to the remobilization and enrichment of sulfides [70].
The second assemblage (Zn, Mn, P, Co, B, MgO) reflects hydrothermal processes related to the alteration of ultramafic rocks. MgO and Co are characteristic components of ultramafic rocks, and their enrichment is directly associated with the alteration of olivine and pyroxene (e.g., serpentinization). Enrichment of Zn and Mn is typically accompanied by carbonatization, while B is a classic indicator element of hydrothermal activity. B tends to become significantly enriched in alteration zones, particularly during water-rock interaction with sedimentary rocks (e.g., clastic sediments or tuffs in the area) [71]. Anomalies in P may originate from the hydrothermal dissolution and reprecipitation of accessory minerals such as apatite. The development degree of this assemblage is often controlled by regional tectonic fracture zones, which provide pathways for hydrothermal fluid migration.
The third assemblage (Fe2O3, Ti, V, Nb, Li) indicates the fractional crystallization of Fe-Ti oxides during the late stage of magmatic evolution. The compatibility of Ti and V in magnetite and ilmenite makes them key tracers of early to middle stages of magmatic fractional crystallization [72]. Enrichment of total Fe2O3 directly corresponds to the accumulation of magnetite. As incompatible elements, Nb and Li gradually become enriched in the residual magma and are often associated with late-stage, volatile-rich pegmatitic phases. On a regional scale, the presence of this assemblage may suggest the existence of buried intermediate-acidic intrusions or layered intrusions at depth, whose fractional crystallization processes controlled the distribution pattern of regional Fe-Ti mineral resources.
K2O and SiO2, which form independent groups, serve as distinct geochemical boundary indicators. Their negative correlation with the ore-forming elements likely originates from the mafic–ultramafic intrusions in the area, as olivine websterite is characterized by low concentrations of SiO2 (36.41%–42.80%), CaO (0.78%–2.94%), Na2O (0.05%–0.41%), K2O (0.12%–0.64%), and TiO2 (0.18%–0.42%) [73].
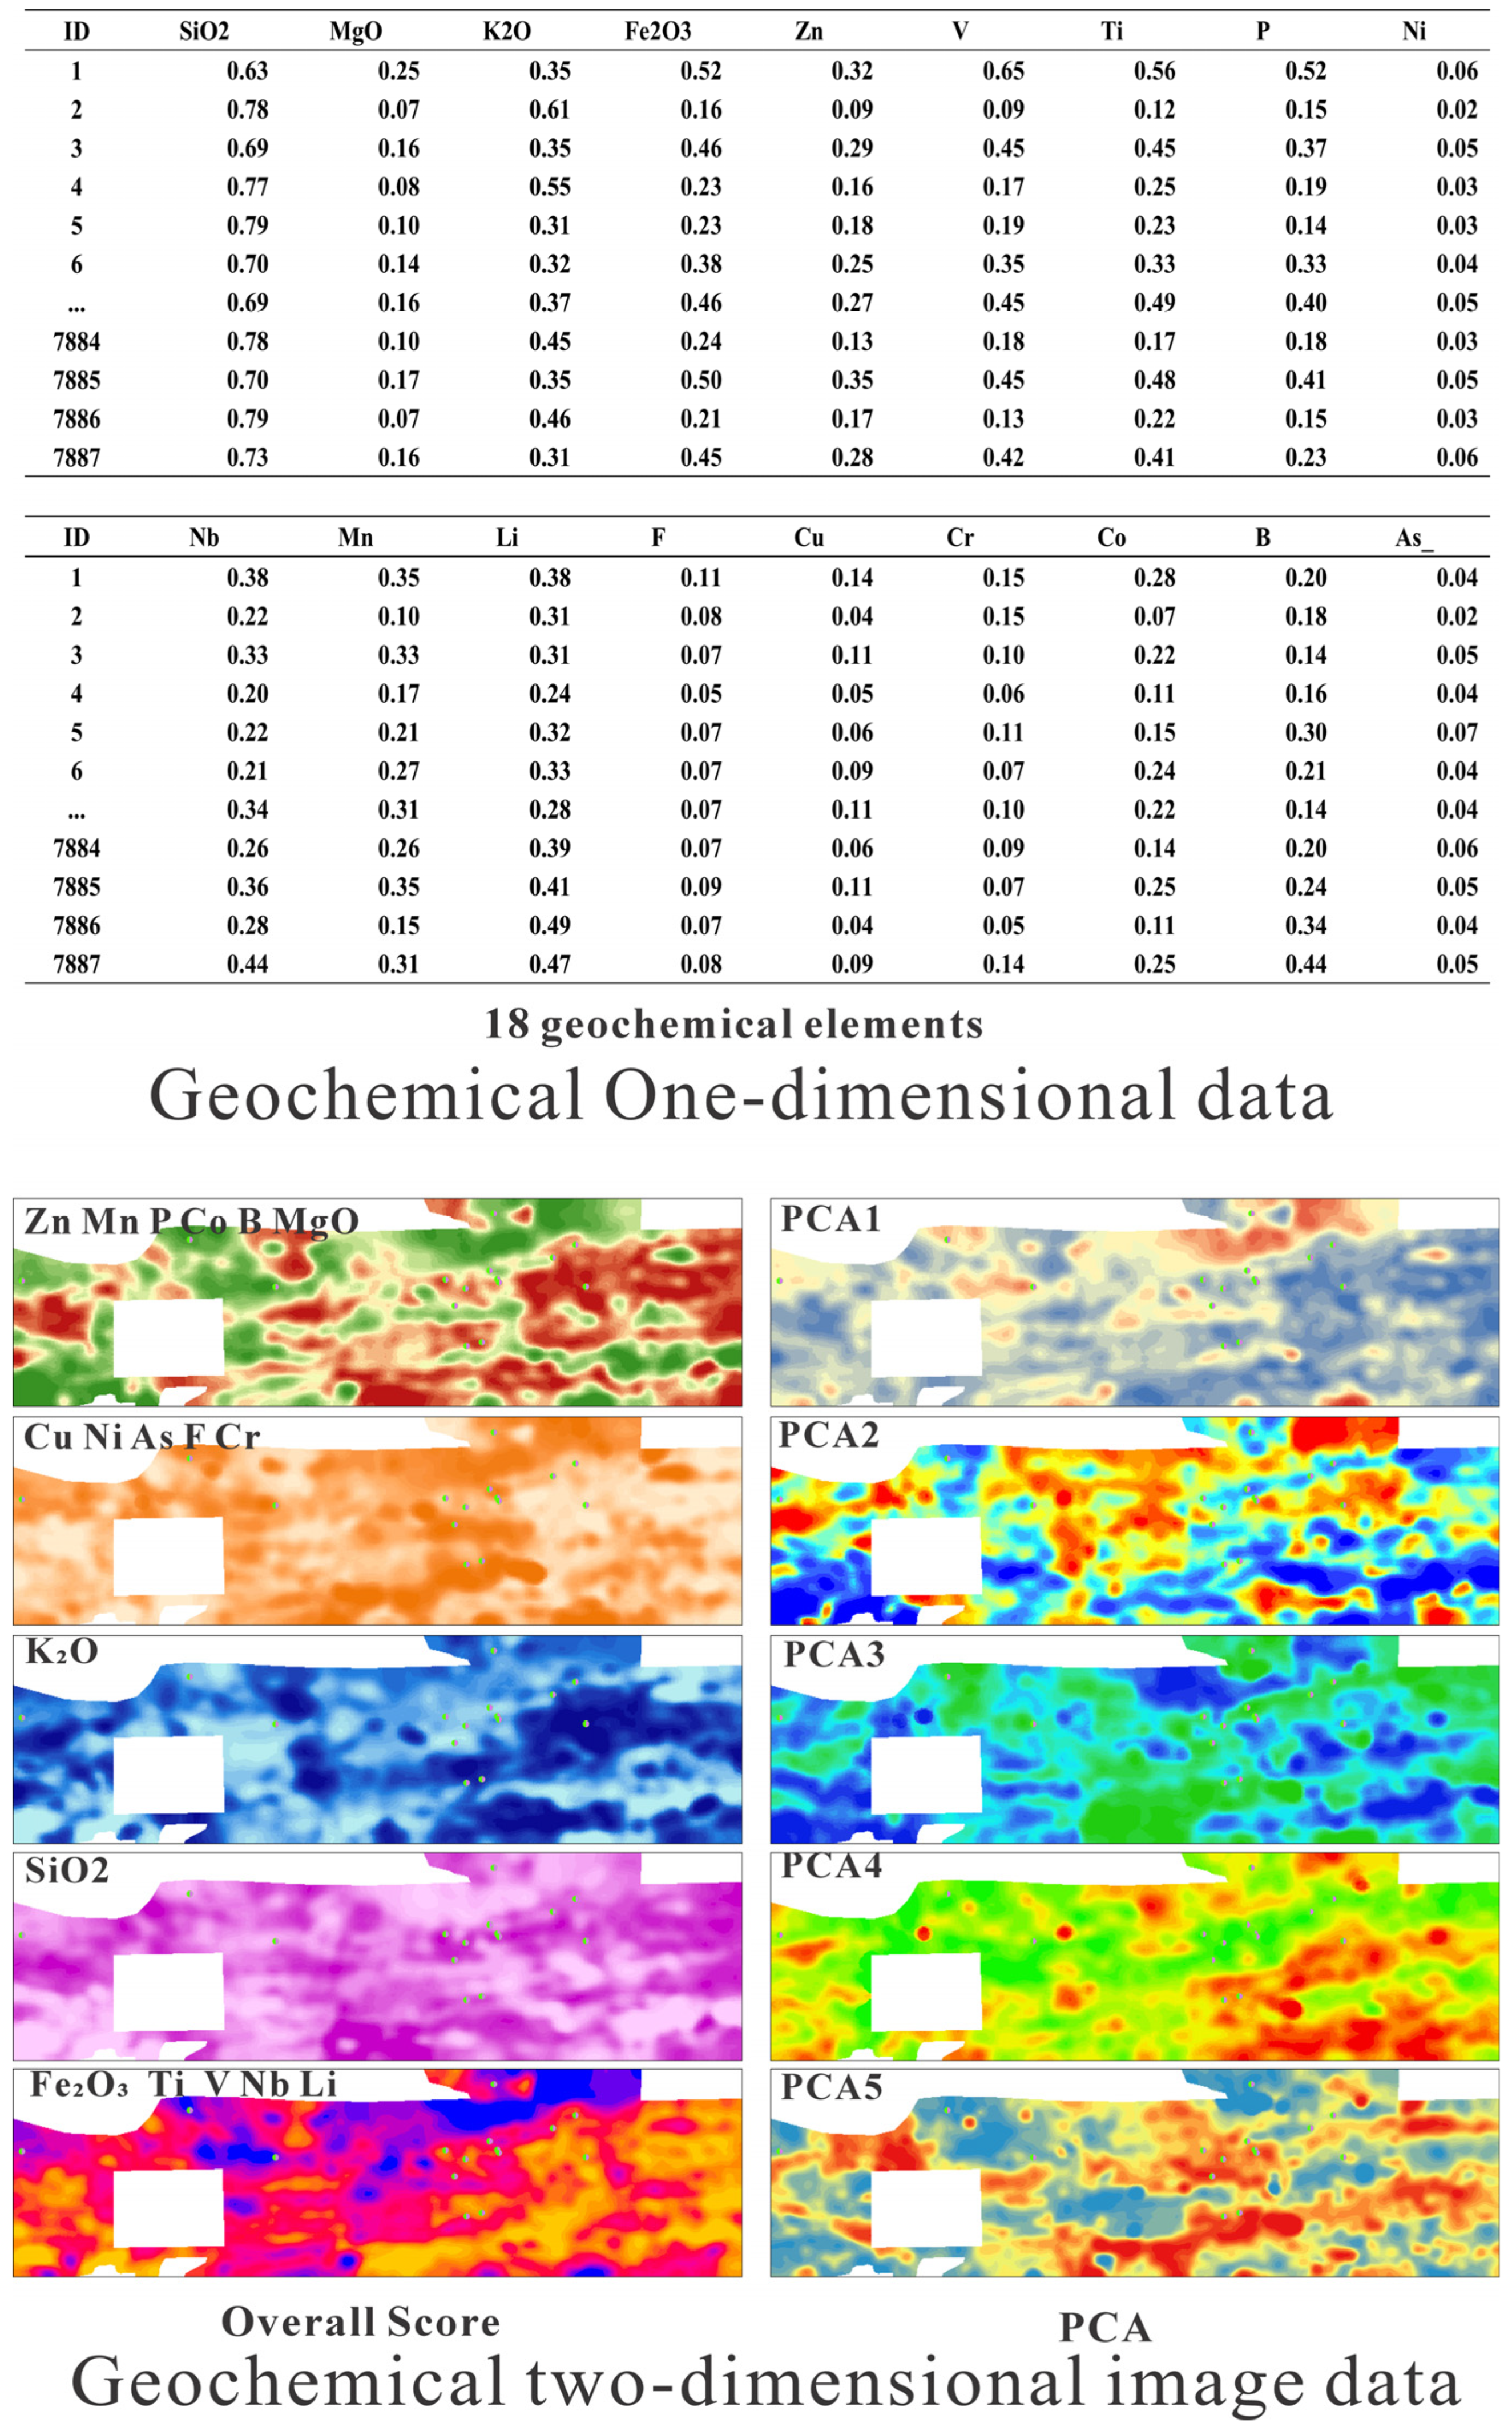
From a geochemical statistical perspective, this classification aligns consistently with the elemental distribution patterns and genetic mechanisms of the Cu-Ni metallogenic system in the study area. For the three selected element groups, comprehensive anomaly maps were generated by calculating composite score coefficients. For K2O and SiO2, single-element geochemical anomaly maps were produced.
Following feature selection and preliminary screening of the raw data through correlation and cluster analyses, the raw data underwent feature condensation during processing. To preserve the overall distribution characteristics of the various geochemical elements in the study area, Principal Component Analysis (PCA), a commonly used dimensionality reduction technique, was applied to the 39 geochemical elements used in this study. PCA was performed on the data using the SPSS 27.0 data processing tool. The results indicated that five components were sufficient to represent the overall characteristics of the data. Consequently, the five extracted PCA factors were interpolated and visualized as raster images using geostatistical tools. These images, representing the correlational characteristics among data variables, capture the overall features of the data at this scale and add data constraints. A total of five such images were generated as 2D outputs representing inter-data constraints.
In summary, the processing of the geochemical data yielded a total of 18 types of 1D single-element geochemical data, 3 comprehensive geochemical anomaly maps (derived from element groups), 2 single-element geochemical anomaly maps (for K2O and SiO2), and 5 principal component analysis maps. This resulted in a total of 18 1D features and 10 2D features (Figure 9).

4.2. Geological Features

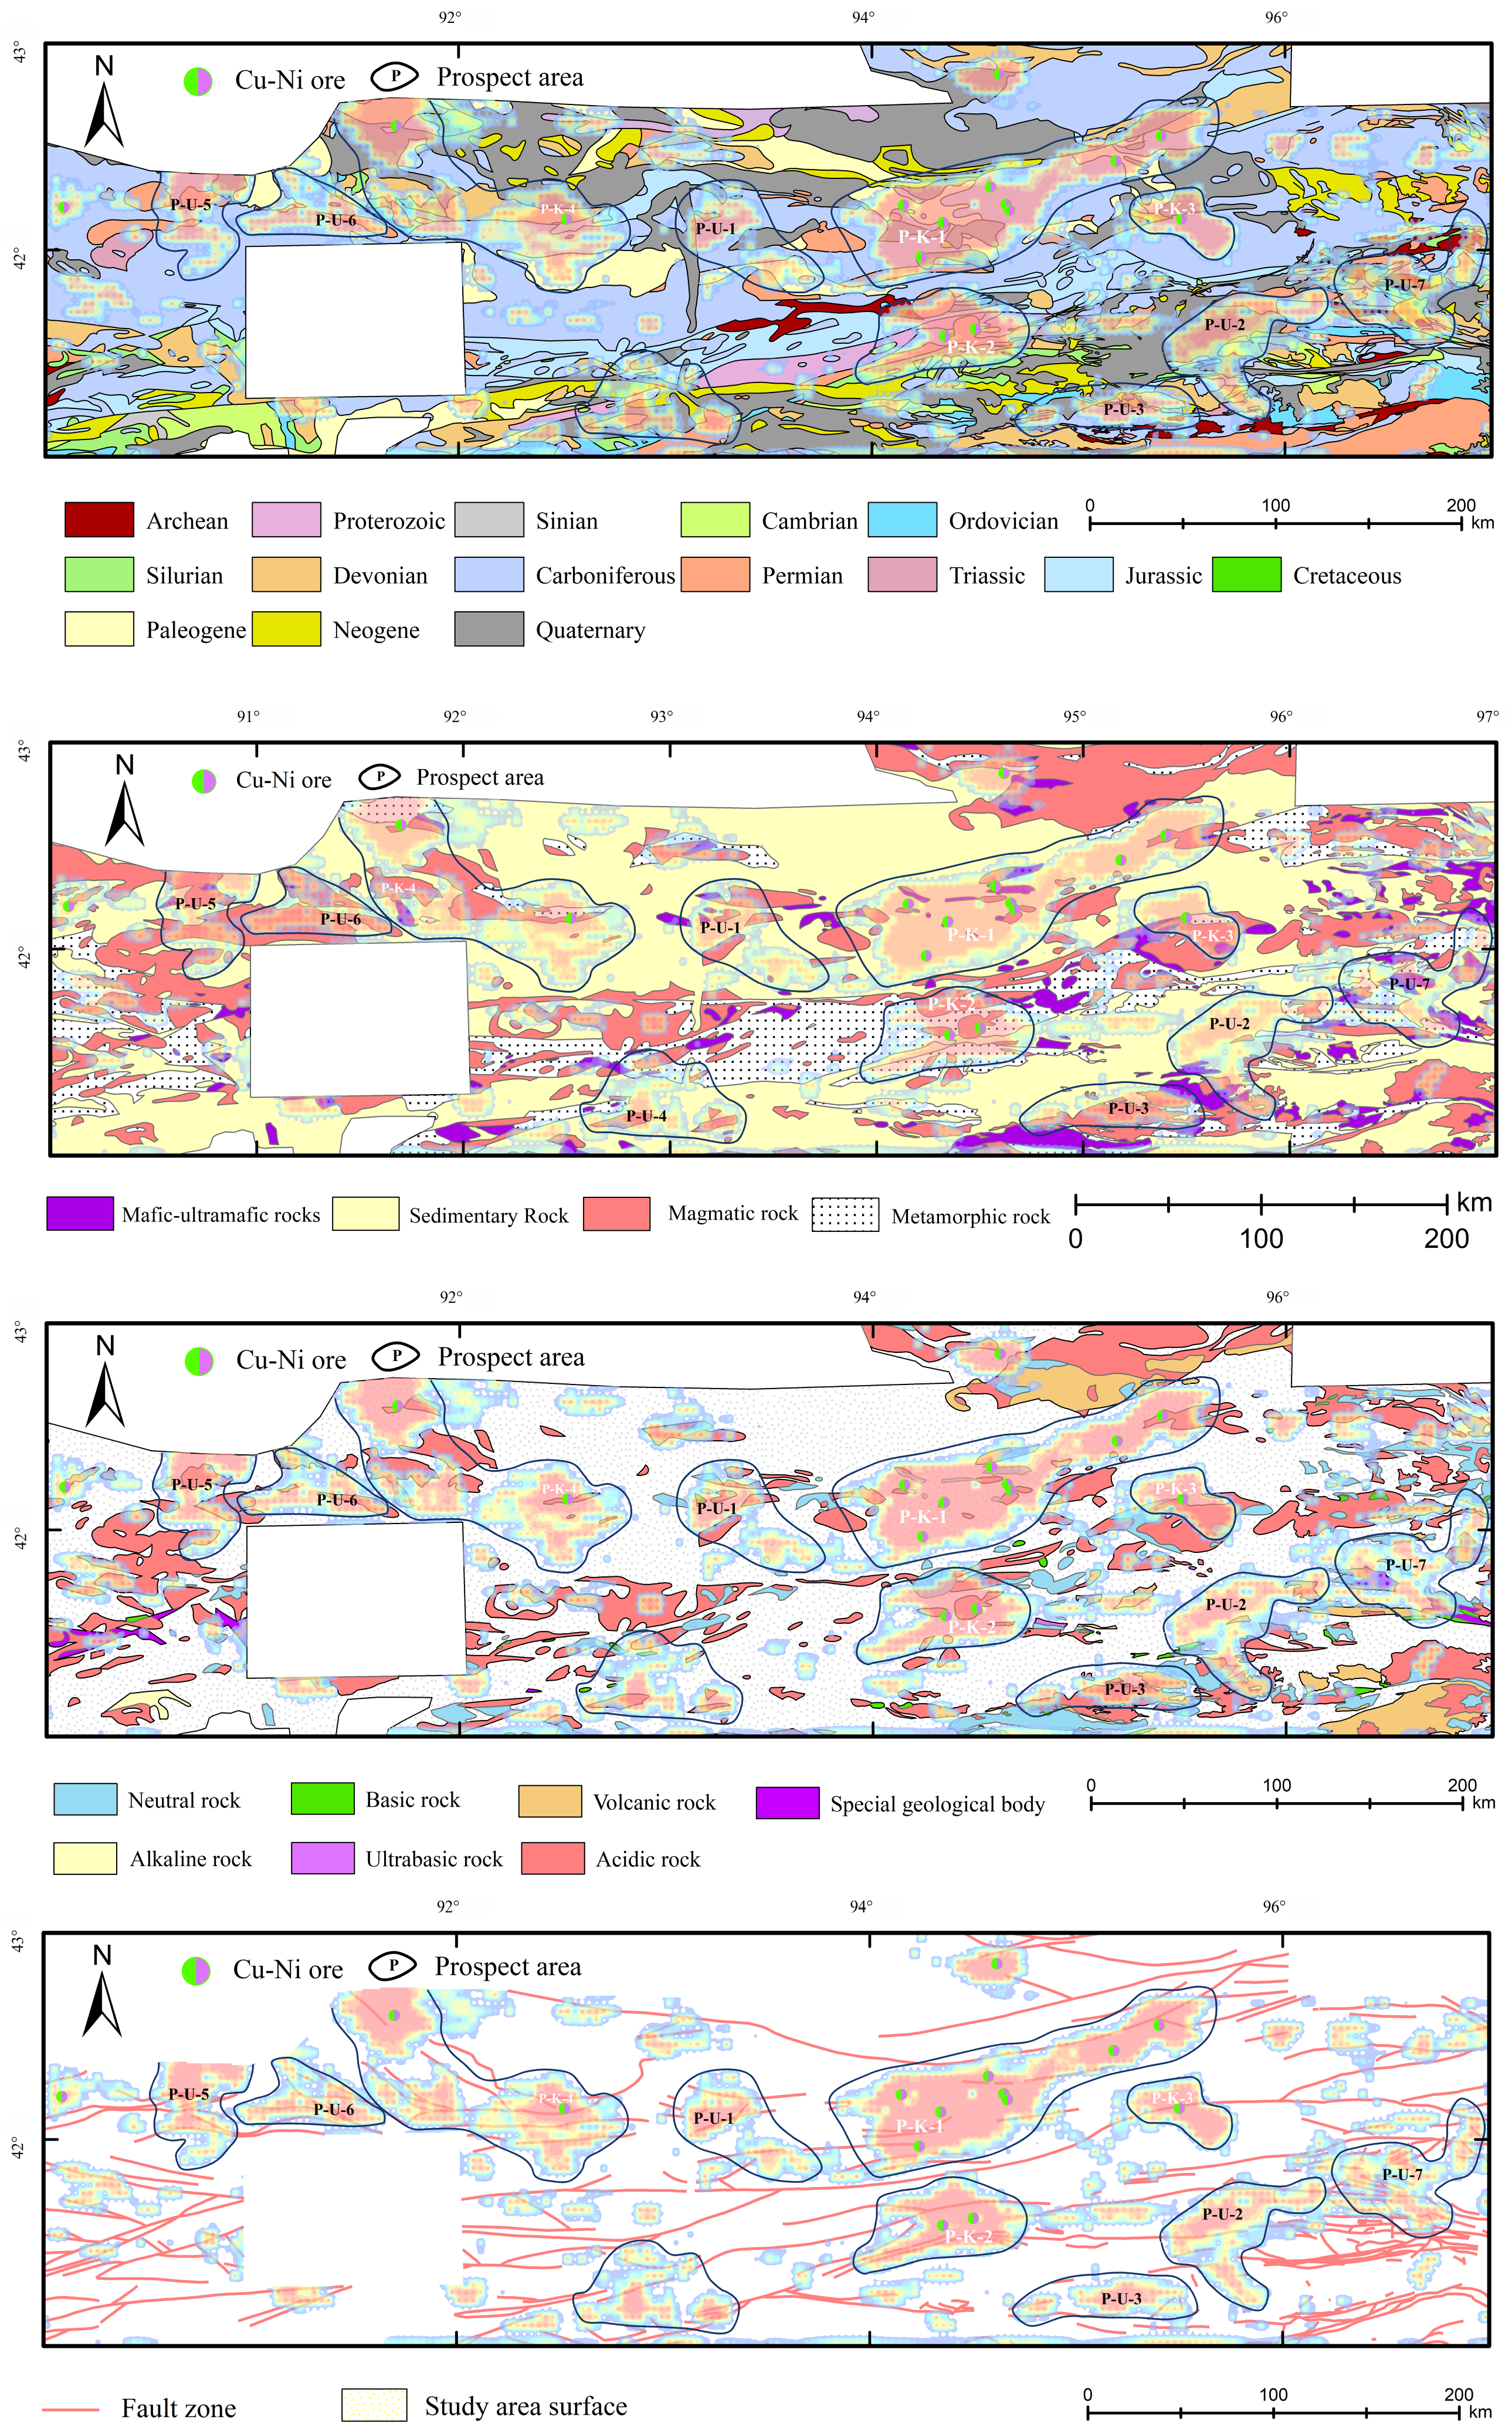
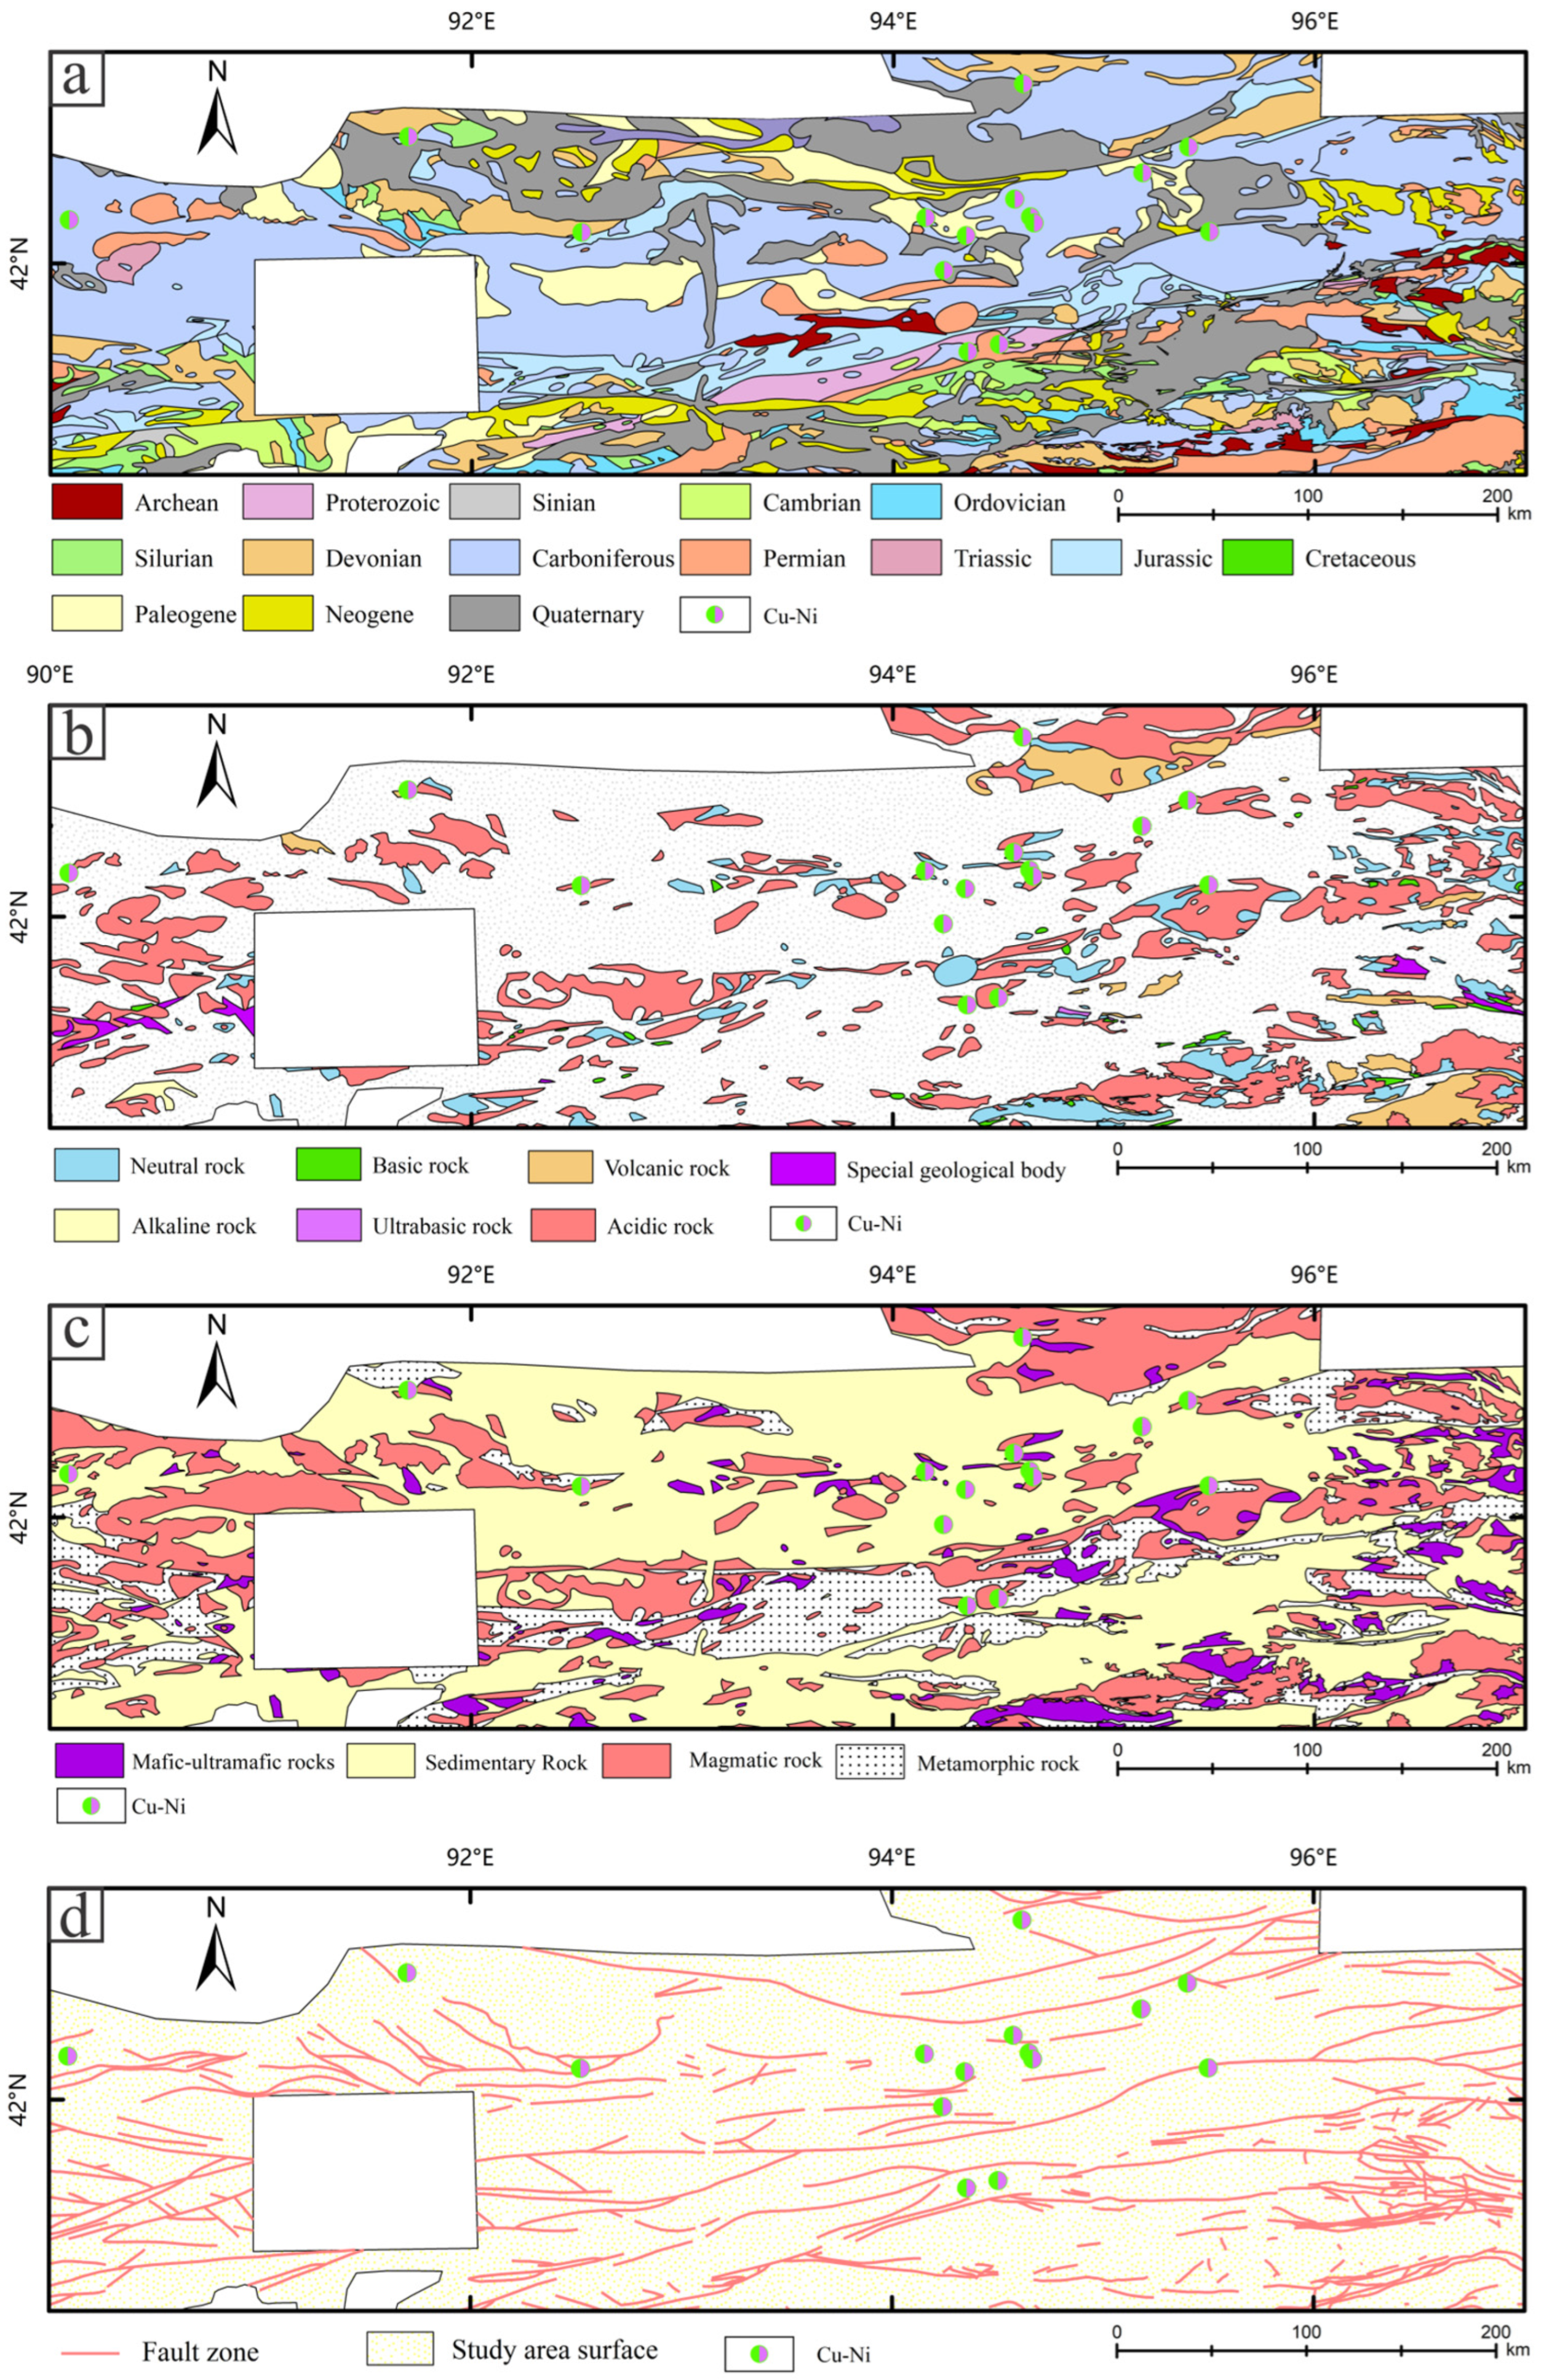
The fusion and integration of geological information are crucial for mineral prospectivity prediction [74]. Considering the geological characteristics of the study area, it was necessary to decompose the collected 1:2,500,000 scale geological data into distinct geological elements to construct a geological metallogenic model. First, 12 major geological periods, ranging from the Archean and Proterozoic to the Cenozoic, were selected as fundamental temporal units (Figure 10a). This classification aimed to establish a spatiotemporal framework for the study area and extract its spatiotemporal metallogenic characteristics. Second, the rocks were categorized based on their chemical properties. As the Cu-Ni deposits in the area are predominantly magmatic Cu-Ni-Co sulfide deposits closely related to the origin and differentiation degree of magma, the intrusions were classified based on rock type into seven categories: ultramafic, mafic, intermediate, volcanic, acidic, and alkaline rocks, with eclogite (representing high-pressure metamorphism) and ophiolite (with an affinity for Cu-Ni) treated as special geological bodies (Figure 10b). Third, the genetic types of rocks were determined, with key lithologies highlighted. The three major genetic types—igneous, sedimentary, and metamorphic rocks—were used as the background framework. Given that robust geological evidence and previous studies have unequivocally indicated a close genetic relationship between the Cu-Ni sulfide deposits in the area and mafic–ultramafic intrusions [75,76], this rock category was emphasized as a core predictive element. To achieve this, 17 specific rock types, including “peridotite,” “gabbro,” and “serpentinite,” were consolidated into a single “mafic–ultramafic rock” class based on their mineral assemblages. This consolidation served to narrow the feature space and, together with the three background genetic types, constituted a lithogenetic map comprising four main categories (Figure 10c). Ensuring that the metallogenic specialization is directly reflected in the feature space. Fourth, the characteristics of fault structures were quantified. As critical pathways controlling magmatic activity and hydrothermal fluid migration, fault systems directly govern the emplacement and spatial distribution of ore deposits. Therefore, spatial analysis techniques were employed to precisely calculate the distance from each gridded geochemical sampling point to the nearest fault zone (Figure 10d). This process transformed macroscopic fault structure information into a continuous distance variable applicable to each sample unit, thereby achieving quantitative extraction of the “fault-controlled mineralization” feature. Ultimately, this processing yielded a total of three sets of 2D geological maps (representing the temporal framework, geochemical background, and genetic-lithological associations) and one continuous 1D fault feature.

4.3. Geophysical Characteristics

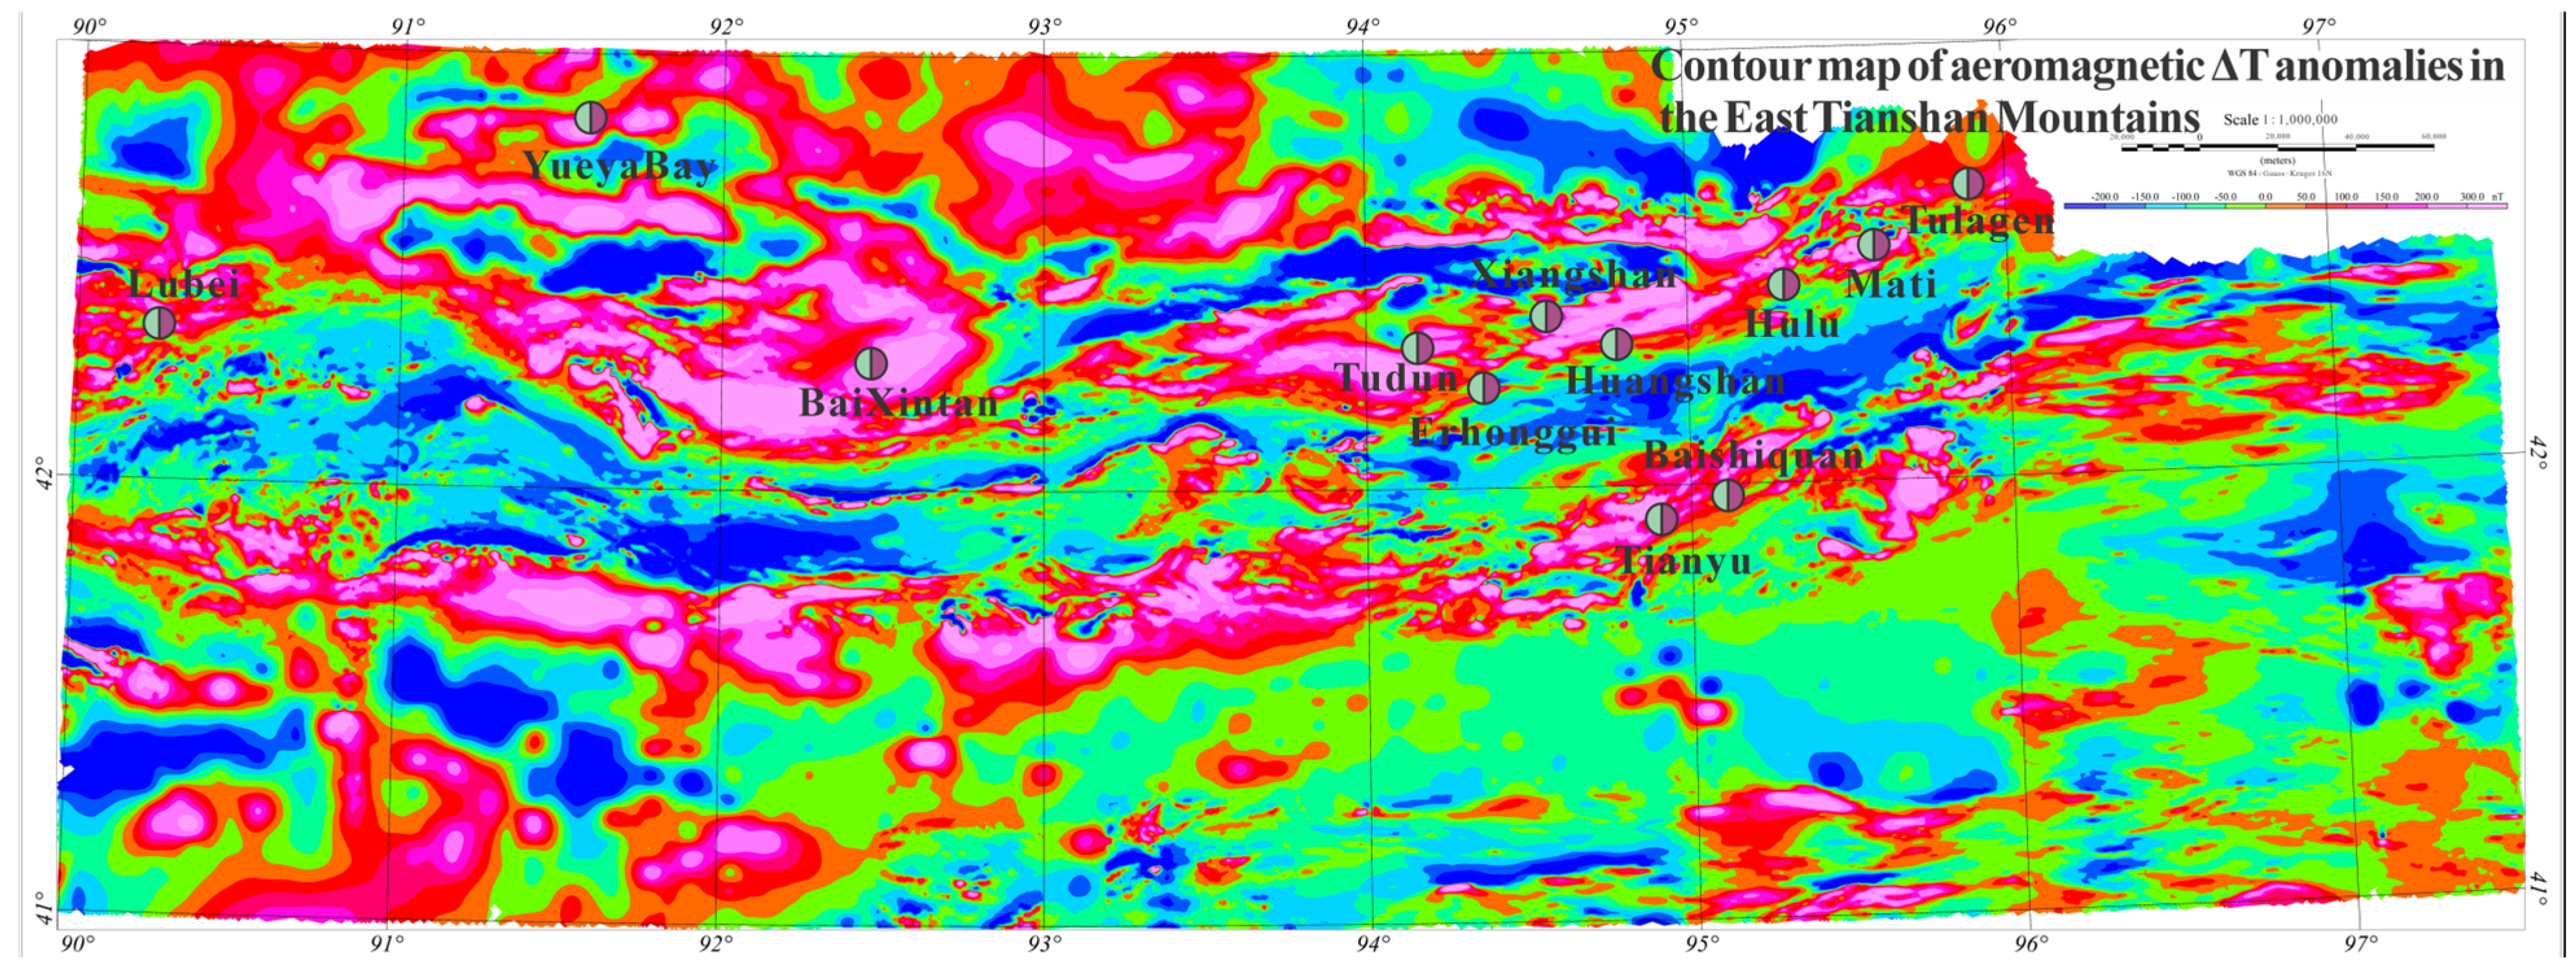
Regional aeromagnetic maps serve as important references for tectonic division. Typically, significant blocky positive anomalies correspond to Precambrian cratons or large sedimentary basins, while strong negative anomalies are associated with active orogenic belts [77]. The 1:1,000,000 scale aeromagnetic data used for this study area are shown in the figure (Figure 11). High-value anomalies in the region, delineated by the Yamansu Island Arc as a dividing zone, primarily occur south of the Central Tianshan Massif and north of the Kangguer-Huangshan ductile shear zone. Notable magnetic anomalies, generally exceeding 150 nT, are observed in metallogenic belts such as Huangshan, Xiangshan, and Tudun. Additionally, extensive enrichment areas with values exceeding 200 nT appear in the Baixintan and Yueyawan regions. Highly negative anomalies, below −200 nT, exhibit a zonal distribution, primarily concentrated around the Yamansu Island Arc. The boundary between positive and negative anomalies within the area is relatively distinct. Known Cu-Ni occurrences are closely associated with these high aeromagnetic value areas. The aeromagnetic map was processed and subsequently used as 2D geophysical data input for the model.

4.4. Summary of Multi-Source Metallogenic Factors

Based on the systematic extraction and integration of the multi-source data described above, a multi-source metallogenic prediction factor system has been constructed. This system integrates three core data categories—geochemistry, geology and structure, and geophysics—with the aim of achieving more refined preprocessing of training features. As detailed in Table 1, within the geochemical dimension, single-element anomalies of 18 key elements (1D data) are used as the primary geochemical field response; five synthetic maps derived from principal component analysis preserve the overall distribution characteristics of the geochemical data; and element association anomalies (2D images) reflect the underlying mineralization processes. Specifically, these associations include: the Cu-Ni-As-F-Cr assemblage, representing the core metallogenic signal of sulfide immiscibility overprinted by hydrothermal activity; the Zn-Mn-P-Co-B-MgO assemblage, indicating hydrothermal alteration halos associated with ultramafic rocks; the Fe2O3-Ti-V-Nb-Li assemblage, representing magmatic differentiation; and K2O and SiO2, treated independently, characterizing geochemical boundaries unfavorable for mineralization.
In the geological and structural dimension, constraints are applied from three levels: the spatiotemporal framework, lithological background, and structural control. A spatiotemporal metallogenic evolution framework was established using 15 major geological periods. Favorable metallogenic geological settings were delineated based on rock chemical properties (ultramafic to acidic) and four lithogenetic types, with particular emphasis on the specialization of mafic–ultramafic rocks. Furthermore, by quantifying the distance from each sampling point to fault zones, the ore-controlling role of fault structures was transformed into a continuous variable suitable for model computation.
Within the geophysical dimension, aeromagnetic data (2D images) were incorporated, providing crucial geophysical evidence for identifying deep-seated concealed intrusions and structures.
This feature extraction framework achieves multi-source information fusion spanning “elements-rocks-structures-geophysical fields,” transforming a qualitative geological metallogenic model into a series of quantifiable spatial variables. This provides substantial support for constructing an integrated prospectivity prediction model driven by both data and imagery.

5. Results and Discussion

5.1. Training Process

Following the data preprocessing steps outlined above, two types of datasets were ultimately generated: 1D tabular data and 2D image data. The tabular dataset consists of 18 geochemical element features and one fault distance feature, resulting in a total of 19 features. The image data were uniformly processed into grayscale images in TIFF format, with original dimensions of 8763 × 2504 pixels. These images were overlaid and merged into multi-channel TIFF files, with each channel representing a specific feature variable. Subsequently, according to the previously defined grid division criteria, the entire composite image was cropped into 10,000 sub-images, each with dimensions of 50 × 43 pixels and 16 channels (with aeromagnetic data accounting for two of these channels). After removing sub-images without valid information, a final set of 7887 multi-channel sample images was retained, corresponding to the entries in the tabular dataset. To ensure alignment between the image and tabular data, a “name” column was added to the tabular dataset. This column stores the filename of the corresponding sub-image for each sample point, establishing a lookup index during the training process.
In supervised learning, the definition of labels determines the direction in which the network learns features. When constructing labels, it is essential to maintain a close relationship with the original data features while facilitating the derivation of desired outcomes. Labeled data are critically important for reducing generalization error [78,79]. In this mineral prospectivity modeling, sample labels were determined using a distance-interval partitioning strategy, rather than the traditional binary classification of deposit versus non-deposit. This strategy helps alleviate the sample imbalance issue to some extent. Spatial units closer to known deposits generally exhibit higher metallogenic potential, which aligns with the fundamental principle of mineralization intensity decaying with distance in metallogenic systems. In regional metallogenic prediction, known deposits themselves serve as the most direct indicators of mineralization, and their surrounding areas are often enriched with geological and geochemical features closely related to mineralization processes. Considering the scale of deposits in the area, six categorical labels were defined based on distance intervals: A (0–5 km), B (5–10 km), C (10–15 km), D (15–20 km), E (20–30 km), and G (30–40 km). Among these, categories A and B, exhibiting close spatial association with known deposits, were designated as positive samples. Categories C and D, representing an intermediate zone, were designated as ambiguous samples. Categories E and G, located at greater distances, were designated as negative samples. Experimental testing and combination revealed that the binary classification performed best when categories A and B were used as positive samples and categories E and G as negative samples. In deep learning, two challenges are widely encountered. One is the presence of outliers in the data, which can introduce errors during model training and practical application. The other is data imbalance, which can skew model performance and introduce bias [9,80,81]. First, grid-based extraction integrates information from multiple adjacent data points, reducing the impact of outliers to some extent. Additionally, the multi-modal processing approach effectively enhances the model’s robustness to noise. Second, to ensure data balance and enhance model robustness, 500 samples each were randomly selected from the positive and negative classes as training data for the model, with 80% used for training and 20% for testing. A batch size of 32 was used for each training iteration. A learning rate adjustment mechanism (ReduceLROnPlateau) and an early stopping mechanism were incorporated. Specifically, if the validation loss did not improve for 10 consecutive epochs, the learning rate was reduced by half, with a minimum learning rate constraint of 1 × 10⁻⁷. Training was halted if no improvement was observed for 40 consecutive epochs, ensuring model convergence and preventing overfitting.

5.2. Training Results

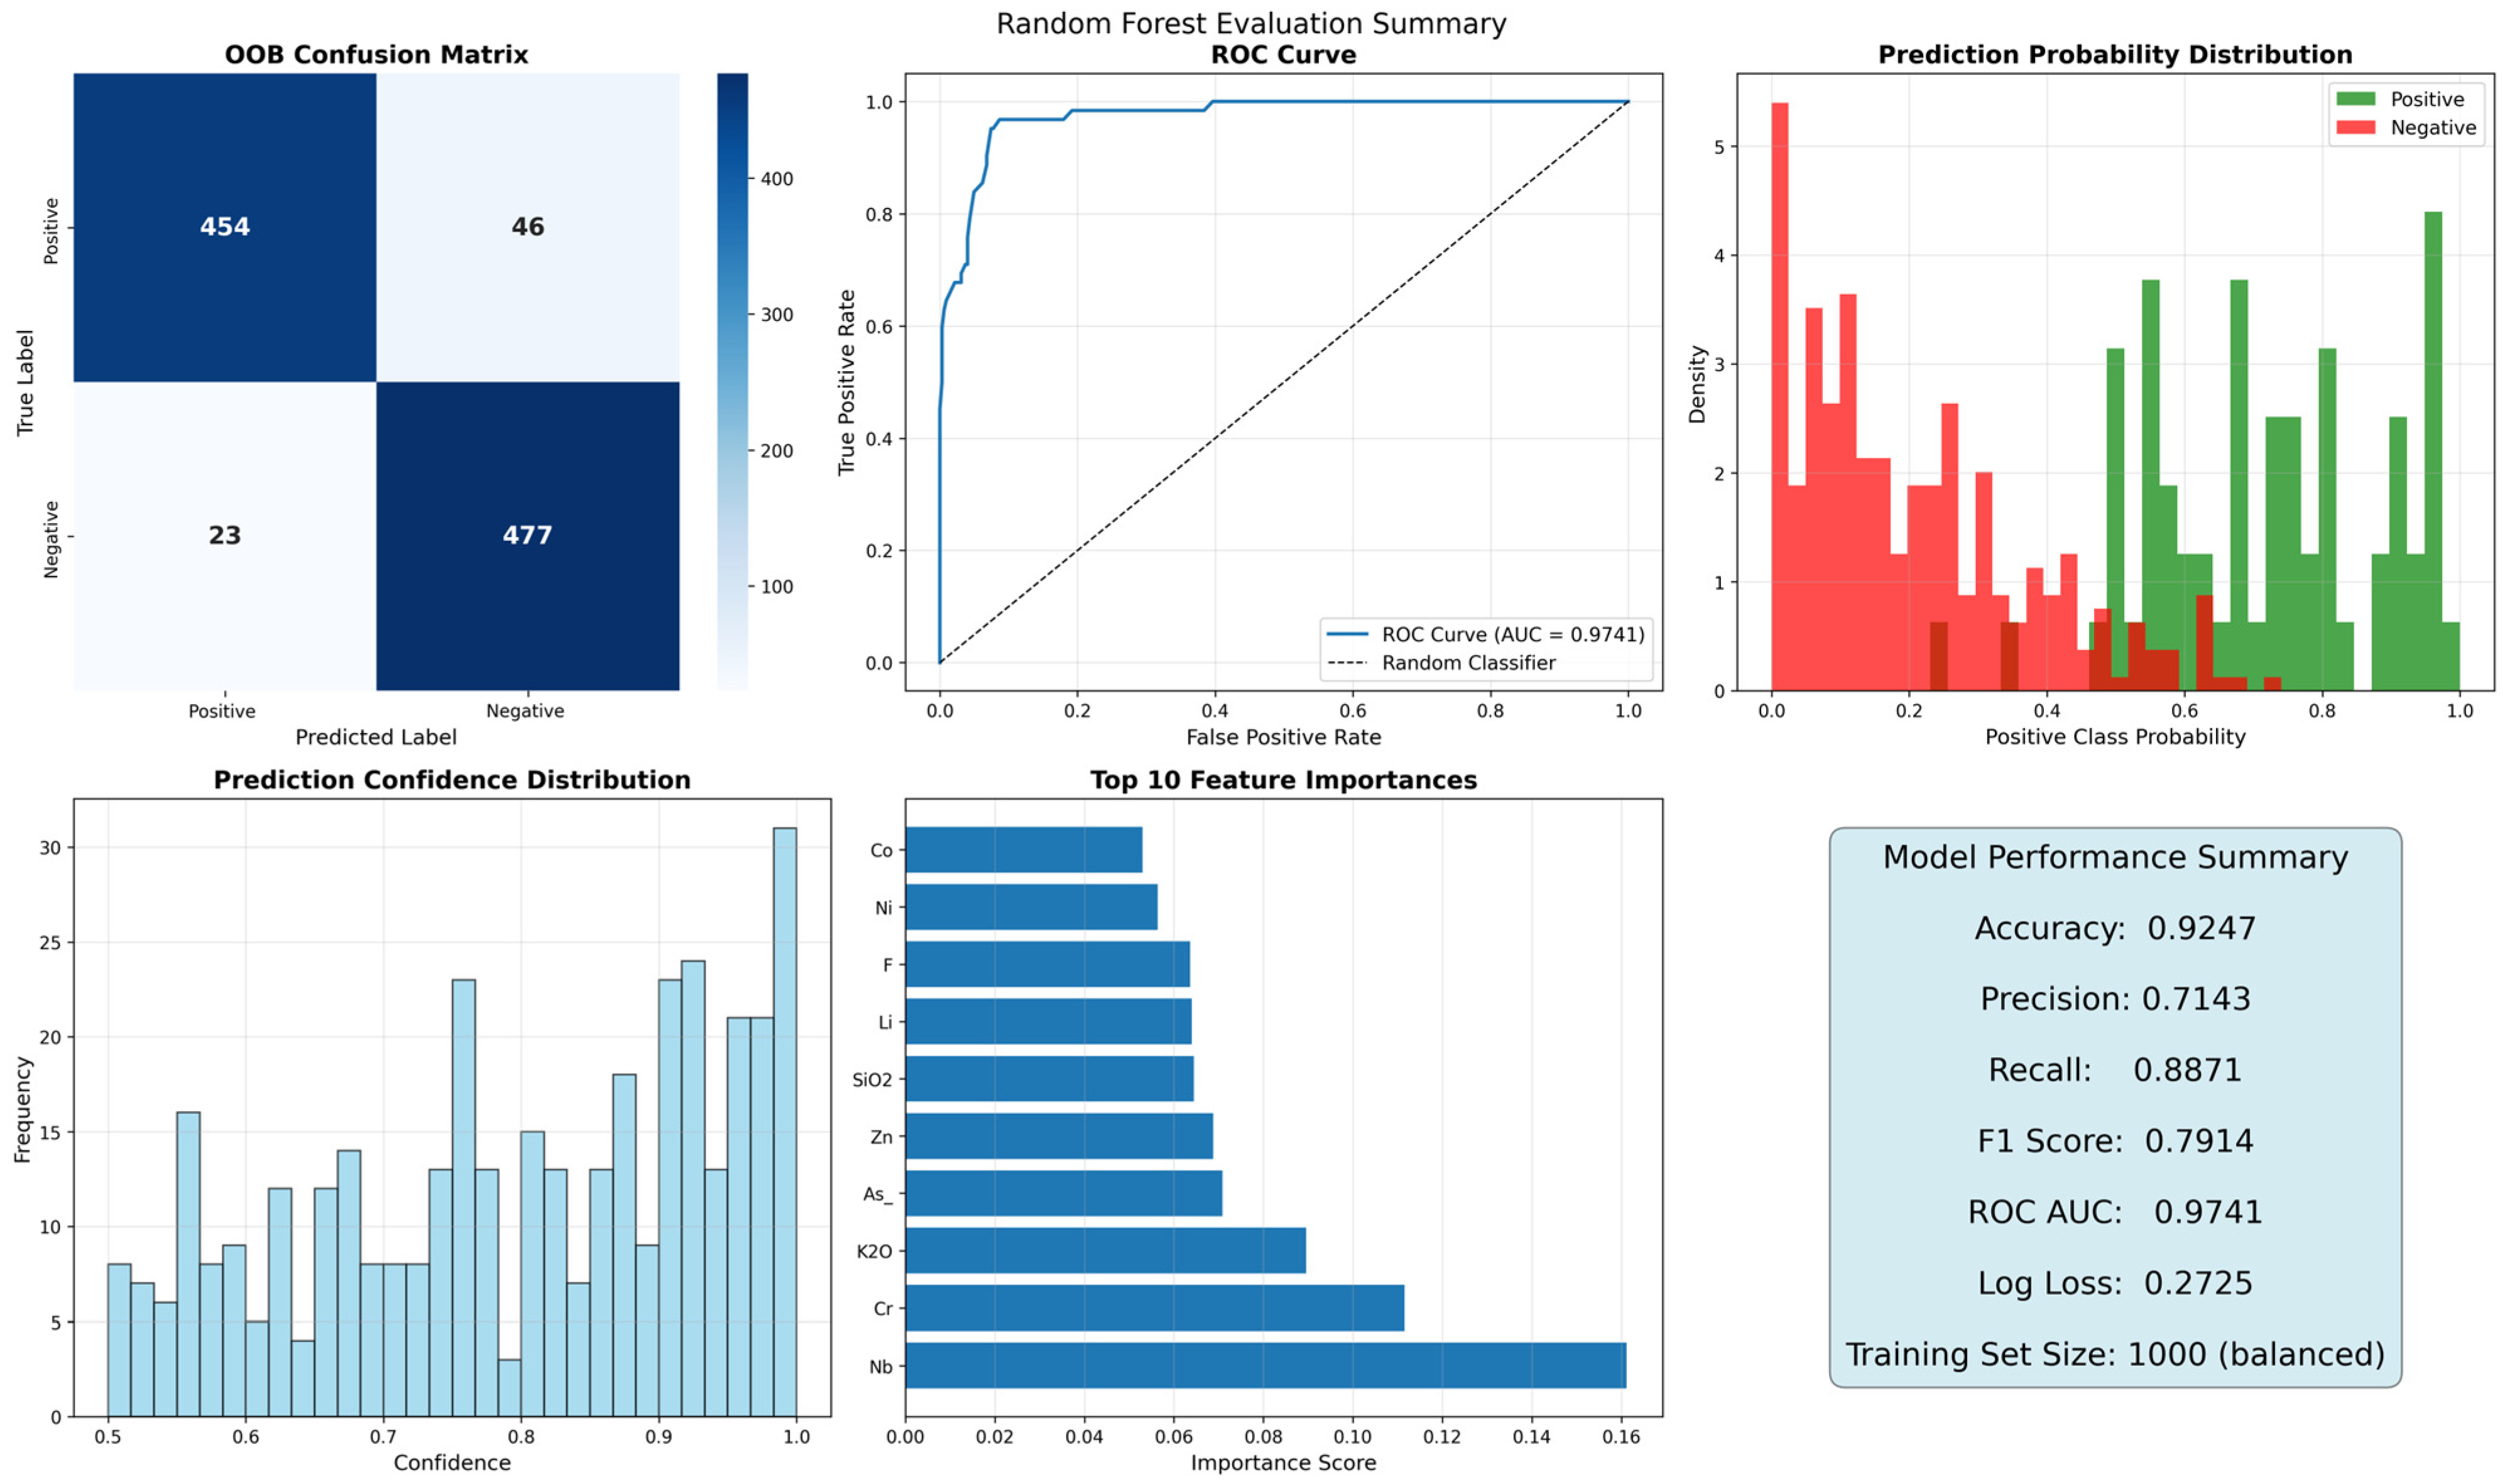
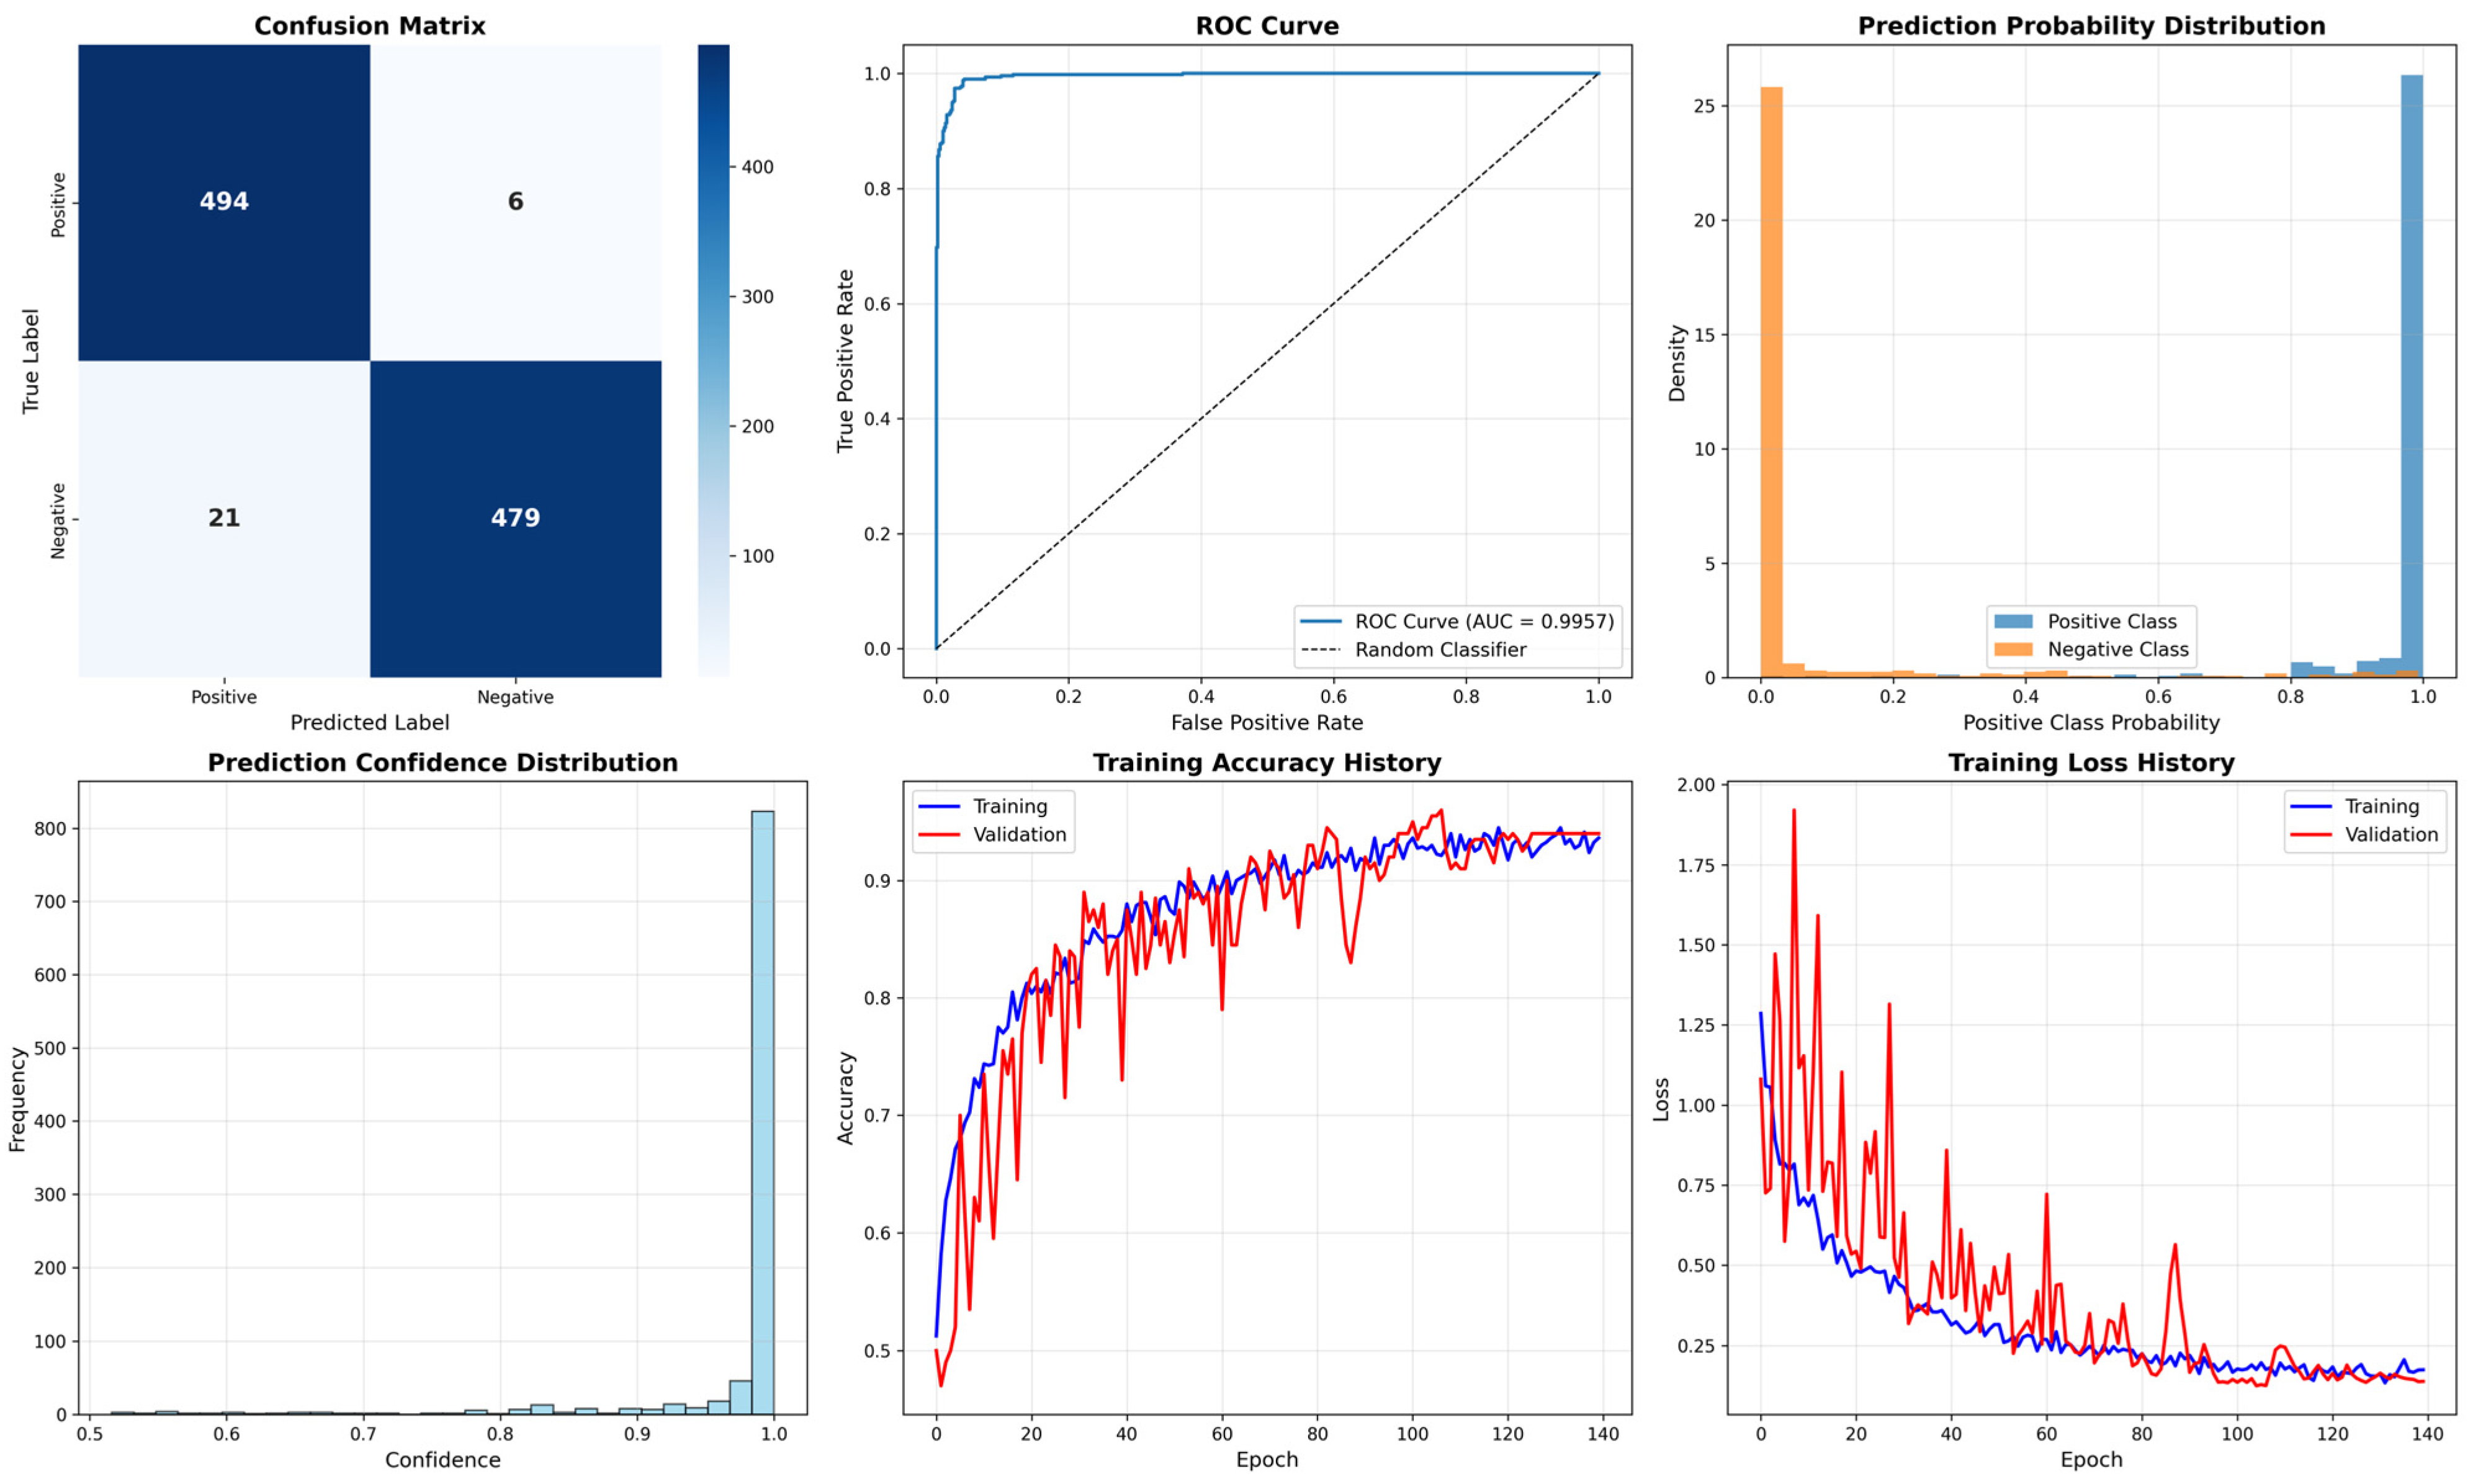
To validate the effectiveness of the multi-modal feature fusion method for mineral prospectivity prediction, a unimodal comparative experiment was designed as a baseline. This comparative experiment utilized the identical 1D dataset and labeling scheme as the multi-modal model. A classification model was constructed based on the Random Forest algorithm, with the number of decision trees set to 100, no limitation on tree depth, and performance evaluated using the Out-of-Bag (OOB) error. The training results, presented in Figure 12, show that the unimodal Random Forest model achieved a prediction accuracy of 92.4%. In comparison, the training results of the multi-modal feature fusion model are shown in Figure 13, where the prediction accuracy improved to 97%. Compared to the unimodal baseline, the multi-modal model demonstrated significant advantages across multiple evaluation metrics: accuracy increased by 4.6 percentage points, and notable improvements were also observed in the AUC value and ROC curve. Particularly noteworthy is that the confidence distribution and probability intervals of the model’s outputs were more concentrated and exhibited higher discriminative power, indicating that its sample ranking capability and decision reliability are significantly superior to those of the unimodal approach. This validates the superiority of the multi-modal feature fusion strategy for mineral prospectivity prediction.
The training process of the predictive model exhibits a characteristic three-phase dynamic, which clearly reflects the features of high-intensity regularization design and the collaborative learning of complex modules.
In the initial training phase (approximately epochs 1–50), several factors contributed to observed dynamics: multi-layer Dropout (40%–50%) randomly suppressed neurons during training, batch normalization was in its statistic accumulation phase, and the cross-attention and gating mechanisms were in a strategic exploration period following random initialization. This resulted in a systematic underestimation of training set accuracy, while the test set, utilizing the complete network, exhibited its potential performance but with significant fluctuations.
During the intermediate phase (approximately epochs 50–100), as the model progressively adapted to the regularization constraints, the attention and gating weights began to consolidate, and the optimization step size stabilized. Consequently, training and testing performance gradually aligned, and the amplitude of fluctuations decreased markedly.
In the later phase (after epoch 100), the model achieved a state of robust convergence, with training accuracy stabilizing at 98% and testing accuracy at 97%, maintaining a healthy generalization gap of approximately 1%. This outcome not only validates the role of the regularization mechanisms in safeguarding generalization capability but also demonstrates the ability of complex components, such as the attention and gating modules, to ultimately form a stable fusion strategy through adaptive learning.
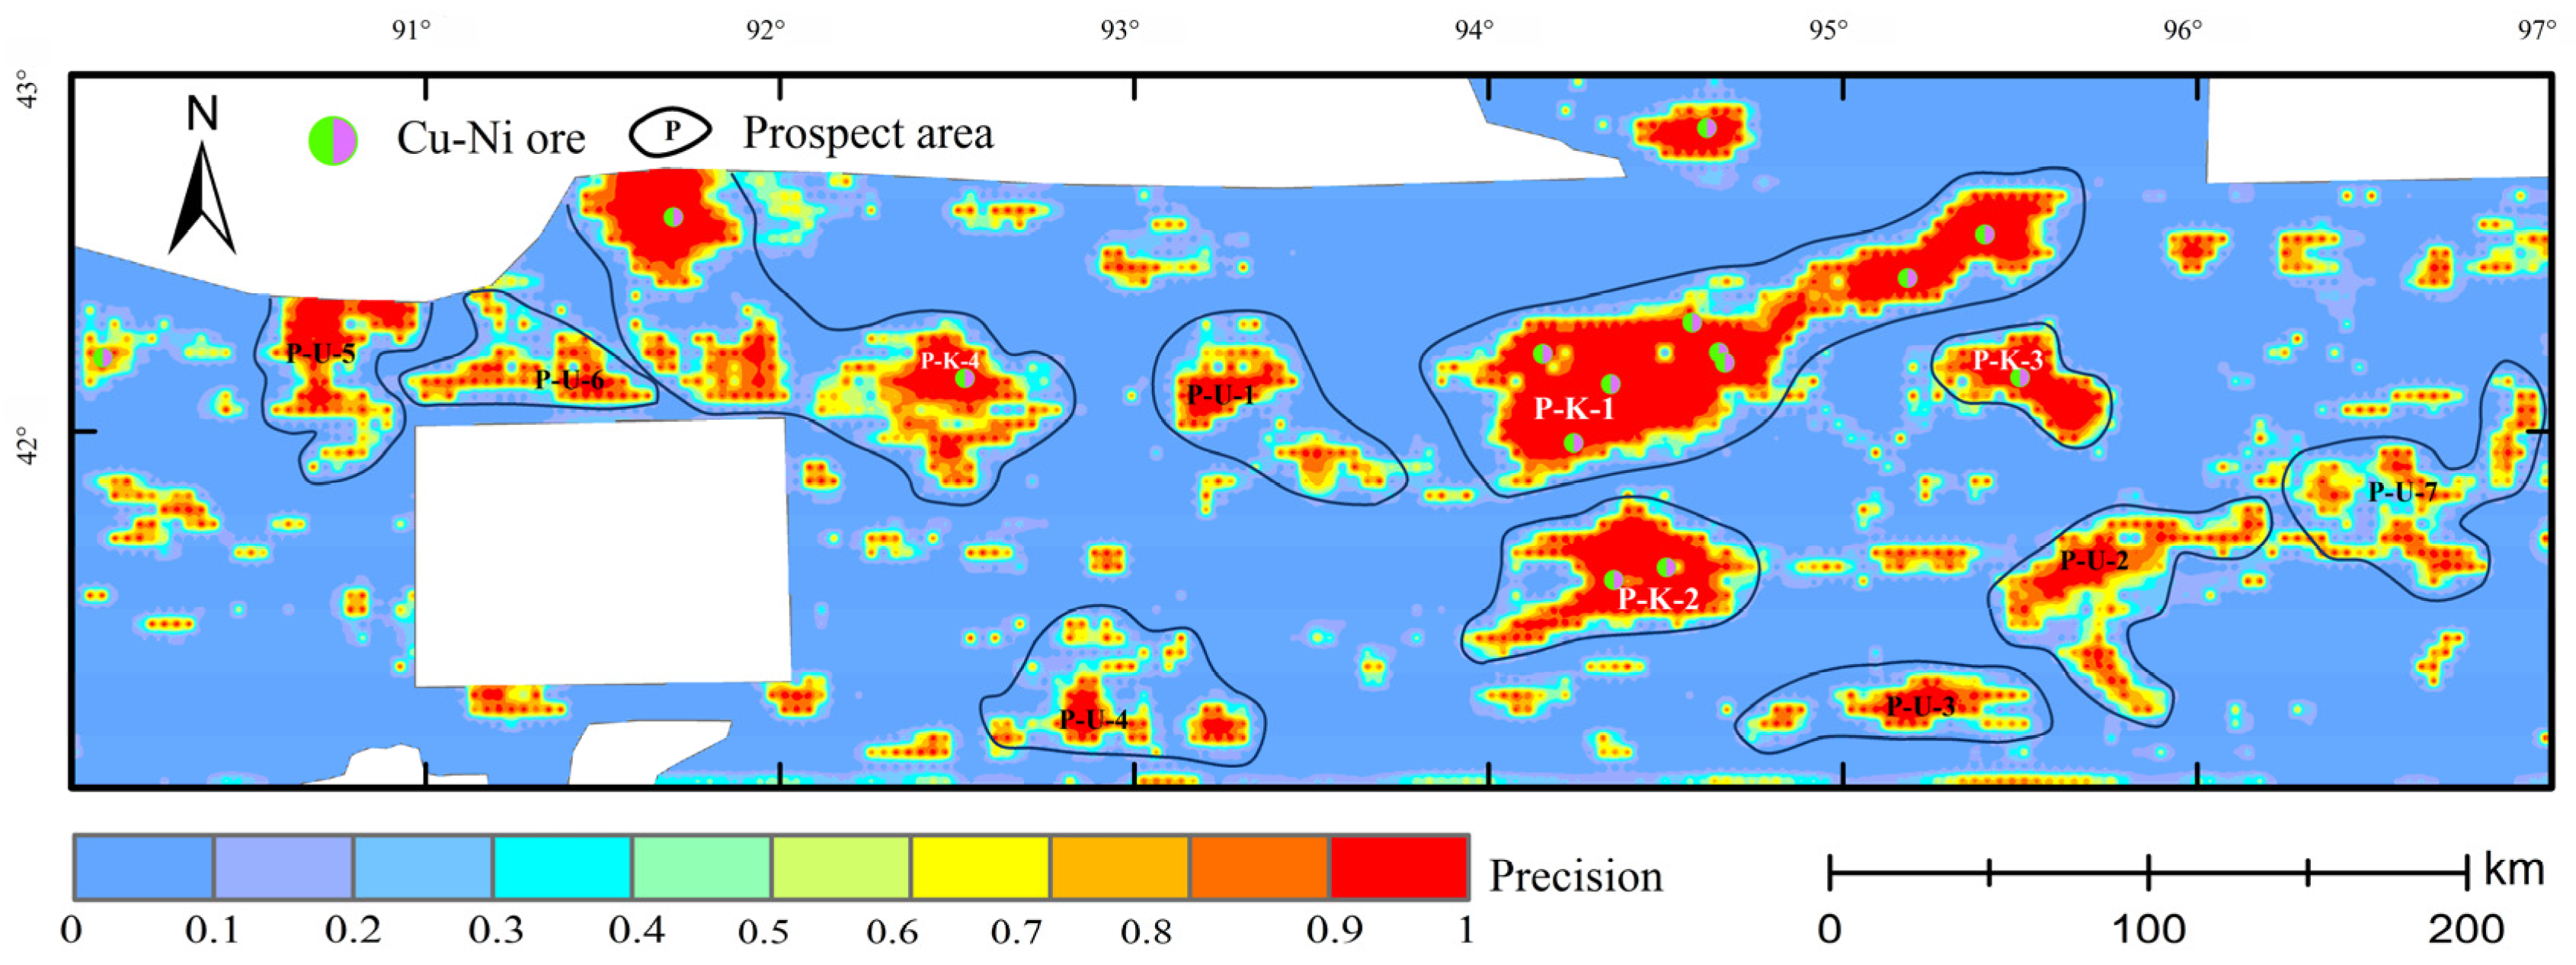
Using the trained predictive model, prospective areas for Cu-Ni mineralization within the study region were delineated and evaluated (Figure 14). The prediction work primarily comprised two aspects: first, conducting prospectivity forecasting in the peripheries of four known mining districts to provide direction for subsequent exploration efforts at depth and in surrounding areas; second, delineating a total of seven mineral prospectivity zones in blank areas, among which three exhibit high mineralization potential, two exhibit moderate potential, and two exhibit low potential.
Peripheries of Known Mining Areas:
P-K-1: Tulaergen–Huangshan–Tudun Prospectivity Zone. Located in the southeastern part of Yiwu County and the northeastern part of Yizhou District, this zone is situated in the eastern segment of the Kangguer ductile shear zone. The predicted prospective areas generally exhibit an east–west trend. Influenced by the Kangguer and Yamansu faults, volcanic rocks and mafic–ultramafic intrusions are prominently developed within the area. Numerous Cu-Ni deposits, including Tudun, Erhongwa, Huangshan, and Tulaergen, have already been discovered [76,82,83,84], demonstrating their high exploration potential. Future exploration efforts should focus on the areas southeast of Tudun and southwest of Huangshan, which exhibit favorable metallogenic prospects.
P-K-2: Tianyu–Baishiquan Prospectivity Zone. Located in the southeastern part of Yizhou District and northern Dunhuang City, this zone lies in the eastern part of the Central Tianshan Massif and is controlled by the Aqikekuduke and Xingxingxia faults. It is separated from the Tulaergen-Huangshan-Tudun prospectivity zone by the Yamansu Island Arc (back-arc basin), which may account for the distinct gap between the two zones. Tianyu-Baishiquan, together with Huangshan-Tudun and others, belongs to the same Cu-Ni sulfide ore concentration area. The structural trend within this zone is consistent with that of P-K-1. Future exploration should be directed towards the west-southwest, where metallogenic prospects are considered favorable.
P-K-3: Mati Prospectivity Zone. Situated in the eastern part of Yizhou District, on the eastern margin of the Kangguer-Huangshan shear zone, this zone is controlled by the Kangguer Fault and exhibits well-developed intrusions. Prediction results indicate that future exploration should be directed southeastward, where the metallogenic potential is promising.
P-K-4: Baixintan–Yueyawan Prospectivity Zone. Located on the southwestern margin of the Junggar Block, this zone is recognized as an important exploration area in the East Tianshan by numerous researchers [54,85,86,87]. Aligned with the Dacaotan Fault, the overall trend is NWW. Exploration should be concentrated towards the central part of this zone. The intersection area west of Baixintan and south of Yueyawan, located at a bend in the Dacaotan Fault, is identified by prediction results as a promising target for potential mineral discoveries.
Prospectivity Zones in Unexplored (Blank) Areas:
P-U-1: Located in central Yizhou District, on the northern margin of the Kangguer Fault zone and the western margin of the Dacaotan Fault, this area contains scattered mafic–ultramafic intrusions. Bordering the Baixintan-Yueyawan metallogenic domain to the west and the Huangshan-Tudun domain to the east, it is highly probable that it shares a common origin with P-K-4 and P-K-5, consistent with the east–west trend of the overall metallogenic belt. It exhibits relatively high metallogenic potential.
P-U-2, P-U-3: These zones are situated at the junction of Subei Mongol Autonomous County and Guazhou County, southeast of the Xingxingxia Fault, at the convergence of the eastern Central Tianshan Massif and the Beishan Block. Volcanic rocks and mafic–ultramafic intrusions are well developed, and fault structures are densely distributed. These two prospectivity zones may share a common origin, exhibiting an overall west-southwest trend, and possess relatively high metallogenic potential.
P-U-4: Located at the junction of the southern Yizhou District and Ruoqiang County, at the convergence of the southern Central Tianshan Massif and the Beishan Block, this area is controlled by the western segment of the Xingxingxia Fault and the Kawabulak Fault. Mafic–ultramafic intrusions are well developed. Comparison with relevant data indicates the presence of significant Cu-Ni sulfide deposits in the area, such as Xuanwoling and Hongshishan [88,89], suggesting strong metallogenic prospects.
P-U-5, P-U-6: Located in eastern Shanshan County, within the Xiaorequanzi-Wutongwozi intra-arc basin, these zones are controlled by the Dacaotan and Kangguer faults. The Lubei Cu-Ni deposit lies to the west of P-U-5, and Yueyawan is to its northeast. Future exploration is speculated to hold significant potential in the northeastern direction. P-U-6 is inferred to be influenced by the Dacaotan Fault and may be cogenetic with the central part of the P-K-4 prediction zone. The metallogenic potential is considered favorable.
P-U-7: Located in the eastern segment of the Central Tianshan Massif, between the Xingxingxia and Aqikekuduke faults. Intrusions in this area are sparsely developed, and the distribution of high-probability prediction values is relatively scattered. This may be due to a weaker representation of various features within the area, leading to lower discriminative capability of the model. Further research is required, and the metallogenic potential is considered low to moderate.

5.3. Discussion

In this mineral prospectivity modeling, positive and negative samples were defined using distance interval partitioning. The prediction results exhibit strong geological spatial regularity (Figure 15). Statistical analysis of each predicted prospectivity zone (Table 2) reveals the following key characteristics: The predicted zones are strictly controlled by fault structures, being concentrated along regional major faults and their intersections, with mineralization trends generally consistent with fault strikes. In terms of rock assemblages, they exhibit a characteristic association predominantly composed of acidic intrusive rocks frequently accompanied by mafic–ultramafic rocks, revealing a specific linkage between deep magmatic activity and multi-stage magmatic-hydrothermal mineralization. Regarding the spatiotemporal framework, the model shows a marked preference for areas where geological bodies of multiple ages (particularly the Late Paleozoic and Meso-Cenozoic) are superimposed, indicating the contribution of prolonged, multi-stage geological evolution to the enrichment of ore-forming materials. In summary, the integrated characteristics captured by the model—“favorable structural setting + specific magmatic rock assemblage + superposition of multi-stage events”—are consistent with the ore-forming conditions summarized in previous studies of typical deposits. This demonstrates that the predictions are grounded in a solid geological foundation and exhibit good interpretability.
The predictive capability of any mineral prospectivity model fundamentally stems from the alignment between the multi-source information fusion strategy and the complexity of the geological metallogenic system. In the initial stage of the research, the model was trained using only geological maps and aeromagnetic images, achieving a prediction accuracy of 73% with persistently high loss function values. This indicates that a single information source is insufficient to adequately characterize the complexity of the metallogenic system. Subsequently, geochemical element association anomaly maps were incorporated to provide spatial distribution information of elements. The model accuracy subsequently increased to 86%, preliminarily confirming that the addition of geochemical features effectively compensated for the deficiencies of the original information dimensions. Following the further integration of principal component analysis maps, the model accuracy reached 97%, demonstrating the necessity of deep extraction and fusion of geochemical information.
The experimental results indicate that the stepwise improvement in model performance is significantly correlated with the introduction and enhanced processing of geochemical spatial information, supporting the importance of “multi-factor coupling” analysis in geological prediction. However, the current results do not yet allow for a rigorous distinction between performance gains primarily attributable to the complementary information inherent in the multi-source data itself and those arising from the successful implementation of knowledge-driven cross-modal fusion by the model architecture. The performance leap may be partially attributed to increased data diversity and optimized feature representation. Therefore, the high performance of the model more directly reflects the critical role of integrating high-quality, multi-dimensional datasets. Interpreting this performance as evidence of deep integration of specific geological concepts requires further, more detailed validation of the model’s internal information interaction mechanisms through subsequent ablation experiments and controlled variable studies.
The data used in this study include a 1:2,500,000 scale geological map reflecting the regional tectonic framework, 1:200,000 scale geochemical data revealing local anomalies, and 1:1,000,000 scale aeromagnetic data indicating ore-controlling information. This introduces the challenge of scale mismatch inherent in multi-source heterogeneous data. Although the current model fuses this information at a certain level through feature engineering and deep learning, the “confidence level” and “geological significance” of the information contained in data of different scales are hierarchical. For a given point, data from different scales may lead to variations in its attribute values, thereby affecting model feature extraction. This may be one reason why certain high-confidence areas in the current prediction probability maps still require geological screening. Furthermore, the generalizability of the model requires further testing to determine whether it can achieve satisfactory prediction results when applied to larger or smaller areas.
In future research, building upon multi-modal fusion, it will be necessary to refine the fusion of multi-scale information features. This involves first identifying the spatial characteristic signatures of different scales, enabling the model to “understand” and distinguish between regional ore-controlling factors and local prospecting indicators. Subsequently, comparative experiments on different multi-modal fusion strategies should be conducted to construct a high-precision metallogenic prediction model synergistically driven by both multi-modal fusion of multi-source exploration data and regional-local multi-scale information.

6. Conclusions

Building upon the current research paradigm of machine learning-based mineral prospectivity prediction driven by multi-source data, this study proposes an innovative multi-modal feature fusion model for metallogenic prediction. Focusing on magmatic Cu-Ni sulfide deposits in the Central Tianshan region, this study integrated regional geological, geochemical, and geophysical metallogenic factors. A dual-branch network combining a ResNet architecture with a Squeeze-and-Excitation (SE) attention mechanism and a Multilayer Perceptron (MLP) was constructed to extract features from different data modalities. A feature fusion module, designed with attention weighting and gating mechanisms, was employed to compress and reconstruct the feature vectors. Regarding the fusion strategy, the model adopts a multi-layer hybrid fusion approach, which not only concatenates features from different modalities but also preserves modality-specific information, thereby achieving deep fusion of cross-modal features. Applied to prospectivity prediction in this region, the model demonstrated superior performance compared to the unimodal baseline constructed using the Random Forest algorithm, validating the superiority of the multi-modal intermediate feature fusion strategy for this type of mineral prediction.
The successful prediction for the target mineral type enabled high-precision intelligent delineation of metallogenic prospectivity zones. Applying this model to Cu-Ni prospectivity prediction in the East Tianshan–Central Tianshan region resulted in the delineation of 11 prospectivity zones, including four areas peripheral to known deposits and seven greenfield areas. Coupling analysis of the prediction results with geological factors (Figure 14) revealed that all high-probability prospectivity zones strictly conform to established geological metallogenic regularities, characterized by predominant fault-controlled distribution, intrusive rocks and specific rock assemblages as the main hosts, and prolonged, multi-stage geological evolution as a prerequisite. Furthermore, relevant data confirm that several mineral occurrences have already been identified within some of the greenfield prospectivity zones predicted by this model. This confirms the practicality and reliability of the prediction results obtained from the multi-modal intermediate feature fusion learning model.
An interpretable and transferable multi-source data fusion framework has been established. The multi-source predictor system (Table 1), comprising “geochemical element associations–geological structures–geophysical fields,” upon which the model relies, along with the captured metallogenic geological regularities, demonstrates that this framework not only achieves data-driven prediction but also aligns deeply with regional metallogenic understanding. The results indicate that adequate extraction of metallogenic information is fundamental for obtaining reliable prediction outcomes [74], providing a referable technical pathway for the intelligent prediction of similar deposit types.
This study still has certain limitations, primarily concerning the refinement of the multi-scale data fusion strategy and the validation of the model’s regional generalizability. In the current mineral prospectivity framework, the effective coupling of metallogenic factors relies not only on the multi-modal synergy of multi-source data but also on the organic integration of data across different scales. While the multi-modal intermediate feature fusion model constructed in this paper can effectively learn from raw data across different modalities, maximally preserving the original characteristics of each data source, it has not yet achieved effective decoupling and fusion processing for the feature discrepancies exhibited by data of different scales within the same region. In other words, the model still lacks a targeted mechanism to address the information inconsistencies arising from scale heterogeneity. From the perspective of regional generalizability, the deep learning architecture and feature engineering workflow proposed in this study do not rely on region-specific geological prior knowledge. Instead, they are constructed based on a generic fusion strategy for multi-source data, such as geochemistry, geophysics, and remote sensing. These data types are generally accessible across various metallogenic belts both domestically and internationally, providing a technical foundation for the framework’s potential transfer to other regions. The key features identified by the model—such as structural intersections, geochemical anomaly assemblages, and geophysical field gradients—are common ore-controlling factors shared by multiple types of mineral deposits. Although geological settings vary across regions, the intrinsic relationships between these fundamental features and mineralization processes often exhibit cross-regional similarities. The adaptive mechanism of deep learning enables it to automatically adjust weights and feature combinations based on the data characteristics of a new region. Therefore, when transferring this framework to a new area, theoretically, only fine-tuning or retraining with local training data is required to adapt to the specific geological characteristics. However, systematic cross-regional validation experiments have not yet been conducted in the current study, and the effectiveness of transfer learning, as well as the interpretability of the model outputs, still require further examination. Subsequent research will focus on in-depth exploration of optimizing multi-scale data fusion mechanisms, as well as investigating the model’s generalization capability and geological interpretability across different metallogenic belts.

Author Contributions

Writing—original draft preparation, H.W.; writing—review and editing, B.Z. and X.W.; data curation, M.X. and Y.S.; visualization, W.Y. and H.W.; Collecting the samples, C.D. and Z.Y.; resources, B.Z. All authors have read and agreed to the published version of the manuscript.

Funding

This research was funded by Deep Earth Probe and Mineral Resources Exploration-National Science and Technology Major Project (2024ZD1002400).

Data Availability Statement

Dataset available upon request from the authors.

Conflicts of Interest

The authors declare no conflicts of interest.

References

  1. Zhou, Y.; Zuo, R.; Liu, G.; Yuan, F.; Mao, X.; Guo, Y.; Xiao, F.; Liao, J.; Liu, Y. The Great-leap-forward Development of Mathematical Geoscience During 2010–2019: Big Data and Artificial Intelligence Algorithm Are Changing Mathematical Geoscience. Bull. Mineral. Petrol. Geochem. 2021, 40, 556–573+777. [Google Scholar] [CrossRef]
  2. Zhang, B.; Wang, X.; Zhou, J.; Wang, W.; Liu, H.; Liu, D.; Laolo, S.; Souksan, P.; Xie, M.; Dong, C.; et al. Copper mineralization patter and machine leaming-based copper prospectivity prediction in Laos. Earth Sci. Front. 2025, 32, 61–77. [Google Scholar] [CrossRef]
  3. Wang, J.; Zuo, R.; Xiong, Y. Mapping Mineral Prospectivity via Semi-Supervised Random Forest. Nat. Resour. Res. 2020, 29, 189–202. [Google Scholar] [CrossRef] [Scilit]
  4. Huang, Y.; Feng, Q.; Zhang, W.; Zhang, L.; Gao, L. Prediction of Prospecting Target Based on Selective Transfer Network. Minerals 2022, 12, 1112. [Google Scholar] [CrossRef] [Scilit]
  5. Chen, L.; Wang, L.; Miao, J.; Gao, H.; Zhang, Y.; Yao, Y.; Bai, M.; Mei, L.; He, J. Review of the Application of Big Data and Artificial Intelligence in Geology. J. Phys. Conf. Ser. 2020, 1684, 12007. [Google Scholar] [CrossRef] [Scilit]
  6. Sun, T.; Li, H.; Wu, K.; Chen, F.; Zhu, Z.; Hu, Z.; Sun, T.; Li, H.; Wu, K.; Chen, F.; et al. Data-Driven Predictive Modelling of Mineral Prospectivity Using Machine Learning and Deep Learning Methods: A Case Study from Southern Jiangxi Province, China. Minerals 2020, 10, 102. [Google Scholar] [CrossRef] [Scilit]
  7. Mahboob, M.A.; Celik, T.; Genc, B. Predictive Modelling of Mineral Prospectivity Using Satellite Remote Sensing and Machine Learning Algorithms. Remote. Sens. Appl. Soc. Environ. 2024, 36, 101316. [Google Scholar] [CrossRef] [Scilit]
  8. Yang, N.; Zhang, Z.; Yang, J.; Hong, Z.; Shi, J. A Convolutional Neural Network of GoogLeNet Applied in Mineral Prospectivity Prediction Based on Multi-Source Geoinformation. Nat. Resour. Res. 2021, 30, 3905–3923. [Google Scholar] [CrossRef] [Scilit]
  9. He, H.; Zhu, H.; Yang, X.; Zhang, W.; Wang, J. Mineral Prospectivity Prediction Based on Convolutional Neural Network and Ensemble Learning. Sci. Rep. 2024, 14, 22654. [Google Scholar] [CrossRef] [Scilit]
  10. Khalilian, P.; Rezaei, F.; Darkhal, N.; Karimi, P.; Safi, A.; Palleschi, V.; Melikechi, N.; Tavassoli, S.H. Jewelry Rock Discrimination as Interpretable Data Using Laser-Induced Breakdown Spectroscopy and a Convolutional LSTM Deep Learning Algorithm. Sci. Rep. 2024, 14, 5169. [Google Scholar] [CrossRef] [Scilit]
  11. Lu, Y.; Yang, C.; Meng, Z.; Lu, Y.; Yang, C.; Meng, Z. Lithology Discrimination Using Sentinel-1 Dual-Pol Data and SRTM Data. Remote Sens. 2021, 13, 1280. [Google Scholar] [CrossRef] [Scilit]
  12. Liu, Y.; Wang, X.; Zhang, Z.; Deng, F. Deep Learning Based Data Augmentation for Large-Scale Mineral Image Recognition and Classification. Miner. Eng. 2023, 204, 108411. [Google Scholar] [CrossRef] [Scilit]
  13. Zhang, S.; Yang, Y.; Sun, F.; Fang, B. Application of Image Sensing System in Mineral/Rock Identification: Sensing Mode and Information Process. Adv. Intell. Syst. 2023, 5, 2300206. [Google Scholar] [CrossRef] [Scilit]
  14. Zhuang, C.; Zhu, H.; Wang, W.; Liu, B.; Ma, Y.; Guo, J.; Liu, C.; Zhang, H.; Liu, F.; Cui, L. Research on Urban 3D Geological Modeling Based on Multi-Modal Data Fusion: A Case Study in Jinan, China. Earth Sci. Inform. 2023, 16, 549–563. [Google Scholar] [CrossRef] [Scilit]
  15. Shi, L.; Zuo, R. Foundation model for mineral prospectivity mapping. Earth Sci. 2025, 1–22. Available online: https://link.cnki.net/urlid/42.1874.P.20250916.1824.002 (accessed on 15 March 2026).
  16. Kong, Y.; Chen, G.; Liu, B.; Xie, M.; Yu, Z.; Li, C.; Wu, Y.; Gao, Y.; Zha, S.; Zhang, H.; et al. 3D Mineral Prospectivity Mapping of Zaozigou Gold Deposit, West Qinling, China: Machine Learning-Based Mineral Prediction. Minerals 2022, 12, 1361. [Google Scholar] [CrossRef] [Scilit]
  17. Zuo, R. Deep Learning-Based Mining and Integration of Deep-Level Mineralization Information. Bull. Mineral. Petrol. Geochem. 2019, 38, 53–60+203. [Google Scholar] [CrossRef]
  18. Han, P.; Chen, W.; Ye, D. Research on Multimodal Knowledge Graph Construction Method for Chinese Electronic Medical Record. Libr. Inf. Serv. 2024, 68, 30–40. [Google Scholar] [CrossRef]
  19. Ramachandram, D.; Taylor, G.W. Deep Multimodal Learning: A Survey on Recent Advances and Trends. IEEE Signal Process. Mag. 2017, 34, 96–108. [Google Scholar] [CrossRef] [Scilit]
  20. Bayoudh, K. A Survey of Multimodal Hybrid Deep Learning for Computer Vision: Architectures, Applications, Trends, and Challenges. Inf. Fusion 2024, 105, 102217. [Google Scholar] [CrossRef] [Scilit]
  21. Li, Z.; Xue, L.; Ran, X.; Li, Y.; Dong, G.; Li, Y.; Dai, J. Intelligent Prospect Prediction Method Based on Convolutional Neural Network:A Case Study of Copper Deposits in Longshoushan Area, Gansu Province. J. Jilin Univ. (Earth Sci. Ed.) 2022, 52, 418–433. [Google Scholar] [CrossRef]
  22. Ding, K.; Xue, L.; Ran, X.; Wang, J.; Yan, Q. Siamese Network Based Prospecting Prediction Method: A Case Study from the Au Deposit in the Chongli Mineral Concentrate Area in Zhangjiakou, Hebei Province, China. Ore Geol. Rev. 2022, 148, 105024. [Google Scholar] [CrossRef] [Scilit]
  23. Qaderi, S.; Maghsoudi, A.; Pour, A.B.; Rajabi, A.; Yousefi, M.; Qaderi, S.; Maghsoudi, A.; Pour, A.B.; Rajabi, A.; Yousefi, M. DCGAN-Based Feature Augmentation: A Novel Approach for Efficient Mineralization Prediction through Data Generation. Minerals 2025, 15, 71. [Google Scholar] [CrossRef] [Scilit]
  24. Yang, N.; Zhang, Z.; Yang, J.; Hong, Z. Mineral Prospectivity Prediction by Integration of Convolutional Autoencoder Network and Random Forest. Nat. Resour. Res. 2022, 31, 1103–1119. [Google Scholar] [CrossRef] [Scilit]
  25. Xu, Y.; Li, Z.; Xie, Z.; Cai, H.; Niu, P.; Liu, H. Mineral Prospectivity Mapping by Deep Learning Method in Yawan-Daqiao Area, Gansu. Ore Geol. Rev. 2021, 138, 104316. [Google Scholar] [CrossRef] [Scilit]
  26. Zhao, F.; Zhang, C.; Geng, B. Deep Multimodal Data Fusion. ACM Comput. Surv. 2024, 56, 216. [Google Scholar] [CrossRef] [Scilit]
  27. Zheng, Y.; Deng, H.; Wu, J.; Xie, S.; Li, X.; Chen, Y.; Li, N.; Xiao, K.; Pfeifer, N.; Mao, X. Deep Multimodal Fusion for 3D Mineral Prospectivity Modeling: Integration of Geological Models and Simulation Data via Canonical-Correlated Joint Fusion Networks. Comput. Geosci. 2024, 188, 105618. [Google Scholar] [CrossRef] [Scilit]
  28. Peng, L.; Li, M.; Fu, T.; Hu, M.; Liu, D.; Jeong, J.; Zuo, J. A Novel Multimodal Data Fusion Neural Network for Predicting the Crack Paths in Reservoir Rocks. Comput. Geotech. 2025, 188, 107559. [Google Scholar] [CrossRef] [Scilit]
  29. Guo, Q.-M.; Zhan, L.-T.; Yin, Z.-Y.; Feng, H.; Yang, G.-Q.; Chen, Y.-M. Multi-Modal Fusion Deep Learning Model for Excavated Soil Heterogeneous Data with Efficient Classification. Comput. Geotech. 2024, 175, 106697. [Google Scholar] [CrossRef] [Scilit]
  30. Azam, M.A.; Khan, K.B.; Salahuddin, S.; Rehman, E.; Khan, S.A.; Khan, M.A.; Kadry, S.; Gandomi, A.H. A Review on Multimodal Medical Image Fusion: Compendious Analysis of Medical Modalities, Multimodal Databases, Fusion Techniques and Quality Metrics. Comput. Biol. Med. 2022, 144, 105253. [Google Scholar] [CrossRef] [Scilit] [PubMed]
  31. Kaczmarczyk, R.; Wilhelm, T.I.; Martin, R.; Roos, J. Evaluating Multimodal AI in Medical Diagnostics. npj Digit. Med. 2024, 7, 205. [Google Scholar] [CrossRef] [Scilit]
  32. Tirupal, T.; Mohan, B.C.; Kumar, S.S. Multimodal Medical Image Fusion Techniques—A Review. Curr. Signal Transduct. Ther. 2021, 16, 142–163. [Google Scholar] [CrossRef] [Scilit]
  33. Zheng, H.; Luo, Y.; Ling, K.; Fan, G. Multimodal Cross-scale Feature Fusion for Drug-Target Affinity Prediction. J. Zhengzhou Univ. (Eng. Sci.) 2025, 47, 1–8. [Google Scholar] [CrossRef]
  34. Dou, Y.; Li, Q. Signal modulation recognition method based on multimodal and CGB-ResNet. J. Anhui Univ. (Nat. Sci. Ed.) 2025, 49, 60–70. [Google Scholar]
  35. Lu, B.; Liu, J.; Wang, H.; Zhang, Y.; Chen, R. A Multimodal Information Fusion-Guided Graphical Interface Code Generation Framework for OpenFOAM. J. Front. Comput. Sci. Technol. 2025, 19, 3243–3256. [Google Scholar]
  36. Qu, N.; Wei, W.; Hu, C.; Qu, N.; Wei, W.; Hu, C. Series Arc Fault Detection Based on Multimodal Feature Fusion. Sensors 2023, 23, 7646. [Google Scholar] [CrossRef] [Scilit] [PubMed]
  37. Xu, Z.; Chen, X.; Li, Y.; Xu, J.; Xu, Z.; Chen, X.; Li, Y.; Xu, J. Hybrid Multimodal Feature Fusion with Multi-Sensor for Bearing Fault Diagnosis. Sensors 2024, 24, 1792. [Google Scholar] [CrossRef] [Scilit]
  38. Kullu, O.; Cinar, E.; Kullu, O.; Cinar, E. A Deep-Learning-Based Multi-Modal Sensor Fusion Approach for Detection of Equipment Faults. Machines 2022, 10, 1105. [Google Scholar] [CrossRef] [Scilit]
  39. Battalgazy, N.; Valenta, R.; Gow, P.; Spier, C.; Forbes, G. Addressing Geological Challenges in Mineral Resource Estimation: A Comparative Study of Deep Learning and Traditional Techniques. Minerals 2023, 13, 982. [Google Scholar] [CrossRef] [Scilit]
  40. Mu, S.; Cui, M.; Huang, X.; Mu, S.; Cui, M.; Huang, X. Multimodal Data Fusion in Learning Analytics: A Systematic Review. Sensors 2020, 20, 6856. [Google Scholar] [CrossRef] [Scilit]
  41. He, K.; Dong, J.; Ma, H.; Cai, Y.; Feng, R.; Dong, Y.; Wang, L. Remote Sensing Image Interpretation of Geological Lithology via a Sensitive Feature Self-Aggregation Deep Fusion Network. Int. J. Appl. Earth Obs. Geoinf. 2025, 137, 104384. [Google Scholar] [CrossRef] [Scilit]
  42. Liu, Y.; Li, W.; Feng, Z.; Wen, Q.; Neubauer, F.; Liang, C. A review of the Paleozoic tectonics in the eastern part of Central Asian Orogenic Belt. Gondwana Res. 2017, 43, 123–148. [Google Scholar] [CrossRef] [Scilit]
  43. Gao, J.-F.; Wang, H.-H. Permian Mafic-Ultramafic Magmatism and Sulfide Mineralization in the Central Asian Orogenic Belt: A Review. J. Asian Earth Sci. 2024, 264, 106071. [Google Scholar] [CrossRef] [Scilit]
  44. Mao, Q.; Wang, J.; Xiao, W.; Windley, B.F.; Schulmann, K.; Ao, S.; Yu, M.; Zhang, J.; Fang, T. From Ordovician Nascent to Early Permian Mature Arc in the Southern Altaids: Insights from the Kalatage Inlier in the Eastern Tianshan, NW China. Geosphere 2021, 17, 647–683. [Google Scholar] [CrossRef] [Scilit]
  45. Şengör, A.M.C.; Natal’In, B.A.; Burtman, V.S. Evolution of the Altaid tectonic collage and Palaeozoic crustal growth in Eurasia. Nature 1993, 364, 299–307. [Google Scholar] [CrossRef] [Scilit]
  46. Xiao, W.; Windley, B.F.; Han, C.; Liu, W.; Wan, B.; Zhang, J.; Ao, S.; Zhang, Z.; Song, D. Late Paleozoic to Early Triassic Multiple Roll-Back and Oroclinal Bending of the Mongolia Collage in Central Asia. Earth-Sci. Rev. 2018, 186, 94–128. [Google Scholar] [CrossRef] [Scilit]
  47. Liu, Y.; Xiao, W.; Ma, Y.; Li, S.; Peskov, A.Y.; Chen, Z.; Zhou, T.; Guan, Q. Oroclines in the Central Asian Orogenic Belt. Natl. Sci. Rev. 2023, 10, nwac243. [Google Scholar] [CrossRef] [Scilit] [PubMed]
  48. Li, W. Study of ore-forming theoretical innovation and prospecting breakthrough of magmatic copper –nickel –cobalt sulfide deposits in China. J. Geomech. 2022, 28, 793–820. [Google Scholar]
  49. Tan, Z.; Deng, X.; Liu, X.; He, X.; Yin, Y.; Wen, H. Cobalt enrichment mechanism of the Yueyawan copper-nickel deposit in the Eastern Tianshan. Earth Sci. Front. 2025, 1–27. [Google Scholar] [CrossRef]
  50. Wang, X.; Xue, S.; Wang, Q.; Wang, L.; Wang, Y.; Li, Y.; Xu, J. PGE and Re⁃Os isotope geochemistry and their constraints on mineralization of the Tulaergen Ni⁃Cu sulfide deposit in the East Tianshan. Acta Petrol. Sin. 2022, 38, 1685–1701. [Google Scholar] [CrossRef] [Scilit]
  51. Wu, Y.; Zhou, H.; Zhao, G.; Han, Y.; Zhang, D.; Wang, M.; Zhao, S.; Pei, X.; Zhao, Q.; Tserendash, N.; et al. Carboniferous-Permian Magmatism of Southern Mongolia, Central Asian Orogenic Belt and Its Tectonic Implications. Northwestern Geol. 2024, 57, 11–28. [Google Scholar] [CrossRef]
  52. You, M. Origin and genetic mechanism of magmatic Ni-Cu sulfide deposits in the western part of Eastern Tianshan region, Xinjiang, China. Chin. Acad. Geol. Sci. 2022, 251. [Google Scholar] [CrossRef]
  53. Xiang, D.; Mao, Q.; Xiao, W.; Wei, J.; Chew, D.; He, Z.; Zhao, H.; Ma, G.; Zhang, M.; Wu, L.; et al. Exhumation and Preservation of the Baixintan Magmatic Ni-Cu Sulphide Deposit: Insights from (U-Th)/He and Fission Track Thermochronology. Ore Geol. Rev. 2025, 176, 106411. [Google Scholar] [CrossRef] [Scilit]
  54. Zhao, B.; Deng, Y.; Zhou, T.; Yuan, F.; Zhang, D.; Deng, G.; Li, W.; Li, Y. Petrogenesis of the Baixintan Ni-Cu sulfide-bearing mafic-ultramafic intrusion, East Tianshan: Evidence from geochronology, petrogeochemistry and Sr-Nd isotope. Acta Petrol. Sin. 2018, 34, 2733–2753. [Google Scholar]
  55. You, M.; Li, W.; Li, H.; Zhang, Z.; Li, X. Petrogenesis and Tectonic Significance of the ~276 Ma Baixintan Ni-Cu Ore-Bearing Mafic-Ultramafic Intrusion in the Eastern Tianshan Orogenic Belt, NW China. Minerals 2021, 11, 348. [Google Scholar] [CrossRef] [Scilit]
  56. Wang, Y.; Zhang, Z.; You, M.; Li, X.; Li, K.; Wang, B. Chronological and gechemical charcateristics of the Baixintan Ni-Cu deposit in Eastern Tianshan Mountains, Xinjiang, and their implications for Ni-Cu mineralization. Geol. China 2015, 42, 452–467. [Google Scholar]
  57. Li, P.; He, L.; Liang, T.; Zhao, T.; Tian, J.; Li, D. Platinum-group Elements Geochemistry and Its Significances of Lubei Cu-Ni-Co Sulfide Deposit in eastern Tianshan, NW China. Xinjiang Geol. 2021, 39, 424–430. [Google Scholar]
  58. Li, P.; Liang, T.; Feng, Y.; Zhao, T.; Tian, J.; Li, D.; Li, J.; Chen, G.; Wu, C. The Metallogeny of the Lubei Ni–Cu–Co Sulfide Deposit in Eastern Tianshan, NW China: Insights from Petrology and Sr–Nd–Hf Isotopes. Front. Earth Sci. 2021, 9, 648122. [Google Scholar] [CrossRef] [Scilit]
  59. Yin, Z.; Tu, Q.; Wen, H.; Li, D.; Yin, Y.; Chen, S.; Feng, B. Application of Zhendan 3D induced polarization system in the exploration of Lubei Cu-Ni deposit, Xinjiang. Miner. Explor. 2025, 16, 1186–1197. [Google Scholar] [CrossRef]
  60. Yang, W.; Ren, Y.; Tian, J.; She, J.; Yang, G. The Discovery of Lubei Cu-Ni Sulfide Deposit in Eastern Tianshan, NW China and Its Significant. Bull. Mineral. Petrol. Geochem. 2017, 36, 112–120. [Google Scholar]
  61. Wang, X.; Cao, J.; Zhang, G. Origin of Ore⁃Forming Magmas Associated with Ni⁃Cu Sulfide Deposits in Orogenic Belts: Case Study of Permian Huangshannan Magmatic Ni⁃Cu Sulfide Deposit, East Tianshan, NW China. Earth Sci. 2021, 46, 3829–3849. [Google Scholar]
  62. San, J.; Qin, K.; Tang, Z.; Tang, D.; Su, B.; Sun, H.; Xiao, Q.; Liu, P. Precise zircon U Pb age dating of two mafic-ultramafic complexes at Tulargen large Cu-Ni district and its geological implications. Acta Petrol. Sin. 2010, 26, 3027–3035. [Google Scholar]
  63. Li, W.; Xie, D.; Zou, Z.; Han, F.; Zhong, X.; Meng, Z.; Zhang, Z.; Jie, W. Discovery of the Dahuangsan Cu-Ni Deposit and Its Singnificance in Hami Country, Xinjiang Province. Xinjiang Geol. 2020, 38, 457–462. [Google Scholar]
  64. Zhang, L.; Dong, Z.; Chen, B.; Zhang, X.; Zhang, B.; Zhu, M.; Ji, W.; Feng, J. Ore-forming System and Regularity of Important Metallogenetic Belts in East Tianshan, China. J. Earth Sci. Environ. 2021, 43, 12–35. [Google Scholar] [CrossRef]
  65. Sun, T.; Wang, D. Geology of Mineral Resources in China-Nickel Ore; Geological Publishing House: BeiJing, China, 2019. [Google Scholar]
  66. Kang, Z.; Qin, K.Z.; Mao, Y.J.; Tang, D.M.; Yao, Z.S. The formation of a magmatic CuNi sulfide deposit in mafic intrusions at the Kalatongke, NW China: Insights from amphibole mineralogy and composition. Lithos 2020, 352, 105317. [Google Scholar] [CrossRef] [Scilit]
  67. Otamendi, J.E.; Tiepolo, M.; Walker, B.A.; Cristofolini, E.A.; Tibaldi, A.M. Trace Elements in Minerals from Mafic and Ultramafic Cumulates of the Central Sierra de Valle Fértil, Famatinian Arc, Argentina. Lithos 2016, 240–243, 355–370. [Google Scholar] [CrossRef] [Scilit]
  68. Sui, Y.; Wu, G.; Qi, C. Mafic-ultramafic rock association and the mineralization-forming specialization of Cr-Ni deposit. J. Jilin Univ. (Earth Sci. Ed.) 2004, 34, 201–205. [Google Scholar] [CrossRef]
  69. Ripley, E.M.; Li, C. Sulfide Saturation in Mafic Magmas: Is External Sulfur Required for Magmatic Ni-Cu-(PGE) Ore Genesis? Econ. Geol. 2013, 108, 45–58. [Google Scholar] [CrossRef] [Scilit]
  70. Large, R.; Thomas, H.; Craw, D.; Henne, A.; Henderson, S. Diagenetic Pyrite as a Source for Metals in Orogenic Gold Deposits, Otago Schist, New Zealand. N. Z. J. Geol. Geophys. 2012, 55, 137–149. [Google Scholar] [CrossRef] [Scilit]
  71. Harder, H. Boron Content of Sediments as a Tool in Facies Analysis. Sediment. Geol. 1970, 4, 153–175. [Google Scholar] [CrossRef] [Scilit]
  72. Charlier, B.; Namur, O.; Bolle, O.; Latypov, R.; Duchesne, J.-C. Fe–Ti–V–P Ore Deposits Associated with Proterozoic Massif-Type Anorthosites and Related Rocks. Earth-Sci. Rev. 2015, 141, 56–81. [Google Scholar] [CrossRef] [Scilit]
  73. Li, L.; Sun, F.; Li, B.; Li, S.; Chen, G.; Wang, W.; Yan, J.; Zhao, T.; Dong, J.; Zhang, D. Geochronology, Geochemistry and Sr-Nd-Pb-Hf Isotopes of No. I Complex from the Shitoukengde Ni–Cu Sulfide Deposit in the Eastern Kunlun Orogen, Western China: Implications for the Magmatic Source, Geodynamic Setting and Genesis. Acta Geol. Sin.–Engl. Ed. 2018, 92, 106–126. [Google Scholar] [CrossRef] [Scilit]
  74. Zhang, Z.; Cheng, Q.; Yang, J.; Wu, G.; Ge, Y. A case study of iron-polymetallic mineral prospectivity in south western Fujian. Earth Sci. Front. 2021, 28, 221–235. [Google Scholar] [CrossRef]
  75. Han, B.; Ji, J.; Song, B.; Chen, L.; Li, Z. Shrimp zircon U-Pb ages of the Kalatongke and Huangshan East Cu Ni bearing mafic ultramafic complexes in Xinjiang and their geological significance. Chin. Sci. Bull. 2004, 49, 2324–2328. [Google Scholar]
  76. Zhou, G.; Wang, Y.; Wang, J.; Shi, Y.; Xie, H.; Li, D.; Cheng, X. Sr-Nd-Pb-S Isotopic Characteristics and Its Geological Significance of the Yueyawan Cu-Ni Sulfide Deposit in East Tianshan, Xinjiang. Xinjiang Geol. 2025, 58, 87–101. [Google Scholar] [CrossRef]
  77. Jiao, L.; Lei, Y.; Tu, J.; Zhao, J. A Review on the Analysis of Aeromagnetic Anomaly and Its Geological and Tectonic Applications. Rev. Geophys. Planet. Phys. 2021, 53, 331–358. [Google Scholar]
  78. Sun, H.; Li, M. Enhancing Unsupervised Domain Adaptation by Exploiting the Conceptual Consistency of Multiple Self-Supervised Tasks. Sci. China Inf. Sci. 2023, 66, 142101. [Google Scholar] [CrossRef] [Scilit]
  79. Cord, M.; Cunningham, P. (Eds.) Machine Learning Techniques for Multimedia: Case Studies on Organization and Retrieval; Springer Science & Business Media: Berlin/Heidelberg, Germany, 2008. [Google Scholar]
  80. Huang, C.; Li, Y.; Loy, C.C.; Tang, X. Deep Imbalanced Learning for Face Recognition and Attribute Prediction. IEEE Trans. Pattern Anal. Mach. Intell. 2020, 42, 2781–2794. [Google Scholar] [CrossRef] [Scilit] [PubMed]
  81. Li, S.; Chen, J.; Liu, C.; Li, S.; Chen, J.; Liu, C. Overview on the Development of Intelligent Methods for Mineral Resource Prediction under the Background of Geological Big Data. Minerals 2022, 12, 616. [Google Scholar] [CrossRef] [Scilit]
  82. Shi, Y.; Wang, Y.; Wang, J.; Zhao, L.; Xie, H.; Long, L.; Zou, T.; Li, D.; Zhou, G. Physicochemical Control of the Early Permian Xiangshan Fe-Ti Oxide Deposit in Eastern Tianshan (Xinjiang), NW China. J. Earth Sci. 2018, 29, 520–536. [Google Scholar] [CrossRef] [Scilit]
  83. Deng, Y.-F.; Song, X.-Y.; Xie, W.; Chen, L.-M.; Yu, S.-Y.; Yuan, F.; Hollings, P.; Wei, S. The Role of External Sulfur in Triggering Sulfide Immiscibility at Depth: Evidence from the Huangshan-Jingerquan Ni-Cu Metallogenic Belt, NW China. Econ. Geol. 2022, 117, 1867–1879. [Google Scholar] [CrossRef] [Scilit]
  84. Shi, Y.; Wang, Y.; Wang, J.; Zhou, G.; Wang, H. Petrogenesis and Metallogenesis Mechanism of the Ore-Bearing Ultramafic Rocks from the Huangshandong and Huangshanxi Ni⁃Cu Sulfide Deposits, Eastern Tianshan: Constraints from Plagioclase Compositions. Earth Sci. 2022, 47, 3244–3257. [Google Scholar]
  85. Feng, Y.; Qian, Z.; Duan, J.; Xu, G.; Ren, M.; Jiang, C. Geochronological and Geochemical Study of the Baixintan Magmatic Ni-Cu Sulphide Deposit: New Implications for the Exploration Potential in the Western Part of the East Tianshan Nickel Belt (NW China). Ore Geol. Rev. 2018, 95, 366–381. [Google Scholar] [CrossRef] [Scilit]
  86. Zhou, G.; Wang, Y.; Shi, Y.; Xie, H.; Li, D.; Guo, B. Geochronology and geochemistry of mafic intrusions in the Kalatag area, eastern Tianshan. Acta Petrol. Sin. 2019, 35, 3189–3212. [Google Scholar]
  87. Zhou, G.; Wang, Y.; Shi, Y.; Xie, H.; Guo, B. Petrogenesis and Sulfide Saturation in the Yueyawan Cu-Ni Sulfide Deposit in Eastern Tianshan, NW China. Ore Geol. Rev. 2021, 139, 104596. [Google Scholar] [CrossRef] [Scilit]
  88. Xin, H.; Niu, W.; Tian, J.; Teng, X.; Duan, X. Spatio-temporal structure of Beishan orogenic belt and evolution of PaleoAsian Ocean, Inner Mongolia. Geol. Bull. China 2020, 39, 1297–1316. [Google Scholar]
  89. Wang, Y.; Zhang, Z.; Zhang, J.; Gao, Y.; Guo, Z.; Li, K.; Qian, B. Tectonic geological setting and metallogenic potential of Beishan mafic ultramafic rock belt in Xinjiang. Miner. Depos. 2012, 31, 715–716. [Google Scholar] [CrossRef]
Figure 1. Three fusion paradigms [28].
Minerals 16 00318 g001
Figure 2. Model Architecture Diagram.
Minerals 16 00318 g002
Figure 4. Geological sketch of Baixintan (According to the survey report of the first geological brigade of Xinjiang).
Minerals 16 00318 g004
Figure 5. Geological sketch of Lubei [57].
Minerals 16 00318 g005
Figure 6. Geological map of Huangshan–Jingerquan–Tulaergen area [63]. 1. Quaternary system; 2. Sandstone and mudstone of the Putao Gully Formation; 3. Volcaniclastic rocks of the Gandun Formation; 4. Diorite; 5. Quartz diorite; 6. Granite porphyry; 7. Copper–nickel occurrence; 8. Major fault.
Minerals 16 00318 g006
Figure 7. Correlation coefficient matrix heat map.
Minerals 16 00318 g007
Figure 8. Cluster analysis pedigree.
Minerals 16 00318 g008
Figure 9. Summary of geochemical data processing.
Minerals 16 00318 g009
Figure 10. Selection of geological elements. (a) Spatiotemporal framework based on 12 major geological periods. (b) Lithological classification based on chemical properties (7 categories plus special bodies). (c) Lithogenetic map highlighting mafic-ultramafic rocks as core predictive elements. (d) Distance from each sampling point to the nearest fault zone.
Minerals 16 00318 g010
Figure 11. Aeromagnetic image.
Minerals 16 00318 g011
Figure 12. Unimodal baseline training results.
Minerals 16 00318 g012
Figure 13. Multi-modal feature fusion training results.
Minerals 16 00318 g013
Figure 14. Forecast results.
Minerals 16 00318 g014
Figure 15. Overlay map of prediction area.
Minerals 16 00318 g015
Table 1. Multi-source Data Extraction and Integration.
Data TypeOre-Controlling Geological Conditions & AnomaliesMetallogenic Prediction FactorsFeature DimensionFeatures
GeochemistrySingle-element anomalyAs, Co, Cr, Fe2O3, Li, MgO, Mn, Ni, Cu, P, Ti, V, Zn, K2O, B, F, Nb, SiO21DMajor geochemical element anomalies
Principal Component AnalysisPCA1, PCA2, PCA3, PCA4, PCA502DExtracting the overall features of 39 elements from the data level
Element association anomaly map (with K2O and SiO2 presented as single elements)Cu, Ni, As, F, Cr2DOre-forming core element assemblage of sulfide immiscibility overprinted by hydrothermal alteration
Zn, Mn, P, Co, B, MgOHydrothermal alteration element assemblage related to ultramafic rock alteration
Fe2O3, Ti, V, Nb, LiFractional crystallization of Fe-Ti oxide accessory minerals during magmatic evolution
K2O, SiO2Distinct geochemical boundary indicators
Geological StructureAge of diagenesis15 major geological periods from the Archean to the CenozoicConstructing the spatiotemporal framework of the study area
Lithochemical classificationUltrabasic, basic, intermediate, acidic, and alkaline rocksKey to metallogenic geochemical background and element paragenetic association patterns
Genetic Rock TypesIgneous, sedimentary, metamorphic, and mafic–ultramafic rocksDirect manifestation of metallogenic specialization in feature space
Quantification of Fault Structural FeaturesDistance to Faults1DQuantitative extraction of fault-controlled mineralization elements
GeophysicsAeromagnetic DataAeromagnetic Data2DPhysical magnetic characteristics
Table 2. Summary Table of Geological Background for the Prediction Zones.
Prediction ZoneAcid-Alkaline PropertiesLithogenesis PeriodRock PropertiesFault Distribution
P-K-1Acidic rocks, with minor intermediate rocksQuaternary and PaleogenePredominantly sedimentary rocks, with sporadic magmatic and mafic–ultramafic rocksBetween major faults, the predicted trend is parallel to the fault strike
P-K-2Acidic rocks, with minor intermediate rocksPermian and Precambrian Predominantly magmatic rocks At the convergence of multiple regional faults, the predicted trend aligns with the fault strike
P-K-3Acidic rocksQuaternary, Carboniferous and Paleogene Predominantly magmatic and mafic–ultramafic rocks Adjacent to a single major fault, the predicted trend is perpendicular to the fault strike
P-K-4Acidic rocksPaleogene, Devonian, Quaternary and PermianPredominantly sedimentary rocks, with magmatic and mafic–ultramafic rocksAt the convergence of multiple regional faults, the predicted trend aligns with the fault strike
P-U-1Acidic rocks, with minor alkaline rocksCarboniferous and PaleogenePredominantly magmatic and mafic–ultramafic rocksBetween major faults with multiple small faults, the predicted trend is perpendicular to the fault strike
P-U-2Predominantly acidic rocksQuaternary and PermianPredominantly sedimentary and mafic–ultramafic rocksAt the convergence of multiple regional faults, the predicted trend aligns with the fault strike
P-U-3Predominantly acidic rocksNeogene and QuaternaryPredominantly magmatic rocksAround a major fault, the predicted trend is consistent with the fault strike
P-U-4Predominantly acidic rocks, with minor basic rocksPermian, Quaternary, and NeogenePredominantly magmatic rocksAt the convergence of multiple regional faults, the predicted trend aligns with the fault strike
P-U-5Acidic rocksPermian and CarboniferousPredominantly magmatic and mafic–ultramafic rocksIn areas containing multiple small faults, the predicted trend is perpendicular to the fault strike
P-U-6Acidic rocksPermian and CarboniferousPredominantly magmatic and mafic–ultramafic rocksAt the convergence of multiple regional faults, the predicted trend aligns with the fault strike
P-U-7Acidic rocks, with minor special geological bodiesNeogene and ArcheanSporadically distributed mafic–ultramafic, sedimentary, and magmatic rocksConvergence of multiple regional faults, a zone of superimposed faults
Disclaimer/Publisher’s Note: The statements, opinions and data contained in all publications are solely those of the individual author(s) and contributor(s) and not of MDPI and/or the editor(s). MDPI and/or the editor(s) disclaim responsibility for any injury to people or property resulting from any ideas, methods, instructions or products referred to in the content.