Article

Optimization of Operating Variables of Molybdenite Column Flotation Using Factorial Design and Statistical Techniques

Department of Advanced Energy Engineering, Chosun University, Gwangju 61452, Republic of Korea
*
Author to whom correspondence should be addressed.
Minerals 2026, 16(2), 192; https://doi.org/10.3390/min16020192
Submission received: 29 December 2025 / Revised: 5 February 2026 / Accepted: 10 February 2026 / Published: 11 February 2026
(This article belongs to the Section Mineral Processing and Extractive Metallurgy)

Abstract

In this study, column flotation was used to recover high-grade molybdenite (MoS2) concentrate. Factorial design and statistical analysis were used to evaluate the relationships between the main variables affecting separation efficiency. The main variables were particle size (A), superficial gas velocity (E), depressant dosage (B), superficial wash water velocity (C), and frother concentration (D). MoS2 grades and recovery of 96.4% and 95.7%, respectively, were obtained under the optimized conditions. ANOVA results indicated that the primary variables affecting the MoS2 grade were in the following order: E > A > B > C. The interaction terms of AE and CE were identified as critical factors. The main variables affecting the MoS2 recovery were in the following order: C > B > D > E > A. The interactions of BC, BD, and CD were found to be significant. Furthermore, empirical model equations were derived to predict the grade (G) and recovery (R) based on column flotation variables. The optimal conditions were identified as A: 37.5 µm, B: 200 g/ton, C: 0.1 cm/s, D: 150 ppm, and E: 0.7 cm/s.

1. Introduction

Molybdenite (MoS2) is chemically stable and exhibits excellent heat and corrosion resistance. MoS2 concentrates with a purity of over 50% are used in various industries, such as steel production, whereas those with a purity of over 98% are used in solid lubricants, catalysts, and batteries [1,2]. MoS2 is used in lubricants to reduce friction and enhance durability due to its layered structure and excellent lubricating performance under high-temperature and high-pressure conditions [2].
Molybdenum (Mo) occurs primarily as MoS2 and is recovered using a conventional flotation using mechanically agitated cells process [3]. It is recovered either as a primary Mo ore or as a byproduct of sulfide mineral recovery. MoS2 is a byproduct of copper sulfide mineral ores, particularly from the Sierrita, Bingham Canyon, and Robinson mines in the US [4]. In the separation of MoS2 from complex sulfide ores, single and combined depressants (e.g., NaHS, NaCN, and sodium silicate (Na2SiO3)) are used, particularly to depress minerals such as chalcopyrite, pyrite, and galena [5]. Yin et al. [6] extracted MoS2 concentrate with a grade of 53.15% and recovery of 86% from Cu-Mo ore using a combination of depressants P-nokes, sodium trithiocarbonate, and dextrin (MD). The flotation of Mo ore is affected by various factors, including particle size, grinding, pH, reagent type, and dosage. Aydin and Gul [7] studied the effects of particle size, pH, frother agent type, and dosage on MoS2 extraction and achieved a concentrate grade of 52.15% and recovery of 72.3%.
Primary Mo mines in the US, such as the Climax and Henderson mines, produce MoS2 concentrates with grades ranging from 85% to 92%. These concentrates are obtained through crushing, grinding, cycloning, and conventional flotation using mechanically agitated cells [8]. Yin et al. [9] reported that the grade and recovery of MoS2 concentrates can be improved by the conventional flotation using mechanically agitated cells of Mo ore using depressants such as Na2SiO3, lime, and sodium sulfide. These reagents effectively depress gangue minerals, thereby enhancing separation efficiency. Du and Luo [10] recovered MoS2 from Mo ore through seven cleaning stages with grades and recoveries of 45.31% and 65.98%, respectively. Despite extensive research on molybdenum benefication, studies achieving lubricant-grade purity (>98%) remain limited [9,10]. Column flotation is used as a separation method to improve the grade of concentrate from rougher flotation and has the advantages of small footprint, fine particle treatment, as well as providing a single-stage system which incorporates rougher, cleaner, and scavenger stages [11].
In column flotation, the counter-current mixing of rising bubble flow and descending wash water flow minimizes turbulence compared to mechanically agitated cells. Furthermore, the combination of a deep froth bed and wash water eliminates fine gangue particles non-selectively entrained in the inter-bubble water, which significantly improves the concentrate grade [12]. The optimization of column flotation is influenced by various variables including superficial wash water velocity, superficial gas velocity, gas hold-up, bias, bubble size, carrying rate, bubble surface area flux, particle size, reagent dosage, and pH [13]. The separation efficiency of column flotation can be enhanced by optimizing the interactions between these variables. As the superficial wash water velocity increases, the floating entrainment gangue minerals in the froth zone are effectively removed, thereby improving the concentrate grade. However, this may lead to the loss of valuable mineral particles [13,14]. Santana et al. [15] indicated that smaller particles have a higher probability of adhering to bubbles, and that recovery improves as the concentration of the collector increases in the column flotation of apatite ore.
The superficial gas velocity within a column plays an important role in bubble generation, mineral recovery, gas dispersion characteristics, and system stability. However, an excessive increase in gas velocity can lead to a larger bubble size and generate turbulence, which may reduce the selective attachment between particles and bubbles while increasing the entrainment and entrapment of gangue minerals [15,16]. According to Bu et al. [16], graphite recovery increased from 79.34% to 88.93% using column flotation. Abdel-Khalek et al. [17] obtained P2O5 concentrates with grades and recoveries of 23.4%–29.0% and 54.9%–80.2%, respectively, depending on the experimental conditions. It has been reported that each variable acts independently while interacting with others to influence the final recovery and grades. Column flotation involves various variables that affect separation efficiency. The factorial design method was used to obtain the maximum information with a minimum number of experiments by considering multiple variables [18] simultaneously because various variables affect the separation efficiency of column flotation [19].
Statistical methods, such as Design of Experiments (DOE), are primarily used to shorten the experimental time and optimize the experimental variables [20]. Badri and Khanchi [21] evaluated the significance of various variables in the processing of low-grade U-Mo ore using factorial design and statistical analysis, and suggested optimized conditions based on the experimental results. Sobhy et al. [22] and Bahrami et al. [23] used an experimental design method to develop a prediction model to identify the main variables and improve the separation efficiency of column flotation. This approach successfully reduces experimental time and costs. Martinez et al. [24] used a factorial design and statistical analysis to evaluate the effects of various variables on grade and recovery. Using this approach, they successfully achieved a celestine (SrSO4) concentrate with a grade of 96% and recovery of 98%. Hence, statistical analysis using factorial design is an effective method for column flotation to analyze the interactions among operational variables. It enables optimization by identifying complex relationships through the simultaneous variation of multiple variables and enhances separation efficiency [25,26].
Current industrial molybdenum flotation plants predominantly rely on conventional cells, which are typically limited to concentrate grades of 85%–90% due to fine gangue entrainment and complex ore mineralogy. Consequently, producing lubricant-grade MoS2 (>98%) remains a significant industrial challenge. To address this, this study utilized single molybdenum sulfide ore from the Samyang mine and applied a full factorial design to rigorously optimize column flotation parameters. Although publicly available data on MoS2 column flotation is limited, Table 1 compares the results of this study with representative academic studies and typical commercial plant performance. As summarized in Table 1, while conventional operations often struggle to exceed 90% grade, our optimized process achieved a grade of 96.1% and recovery of 95.2%, significantly outperforming results reported in previous studies. These results provide critical data for scaling up to pilot operations, contributing to the domestic production of high-value lubricant-grade concentrates.
Currently, the conventional flotation plant using mechanically agitated cells at the Samyang Mine produces a MoS2 concentrate with a grade of 86%. However, achieving a high-grade concentrate (98% or higher) is challenging in lubricant applications. Therefore, this study aims to determine the optimal conditions for the main variables in column flotation using factorial design and statistical analysis to produce a high-grade MoS2 concentrate with a grade of over 98%.

2. Materials and Methods

2.1. Materials

The sample used in this study was a conventional flotation concentrate (CFC) using mechanically agitated cells produced by the Samyang Mine (Jecheon) in South Korea. The CFC sample was characterized by a grade of 88%, a median particle size (D50) of 149 μm, and an 80% passing size (D80) of 371 μm. A mineralogical characteristic investigation was conducted using the following equipment. The structure and morphology of each sample were evaluated using field-emission scanning electron microscopy (SEM; S-4800, Hitachi, Kyoto, Japan) with backscattered electrons (BSE; YAG-BSE, Hitachi, Kyoto, Japan) and X-ray diffraction spectrometer (XRD; X’Pert Pro MRD, PANalytical, Almelo, The Netherlands). The chemical composition was analyzed using X-ray fluorescence (XRF; S4 PIONEER, Bruker AXS, Karlsruhe Germany). The average particle size of MoS2 was determined using a particle size analyzer (Mastersizer 2000, Malvern Panalytical Ltd., Worcestershire, UK). The Mo content was measured using inductively coupled plasma optical emission spectroscopy (ICP-OES; Perkin Elmer Optima Model 5300DV, PerkinElmer, Waltham, MA, USA).

2.2. Equipment and Procedure

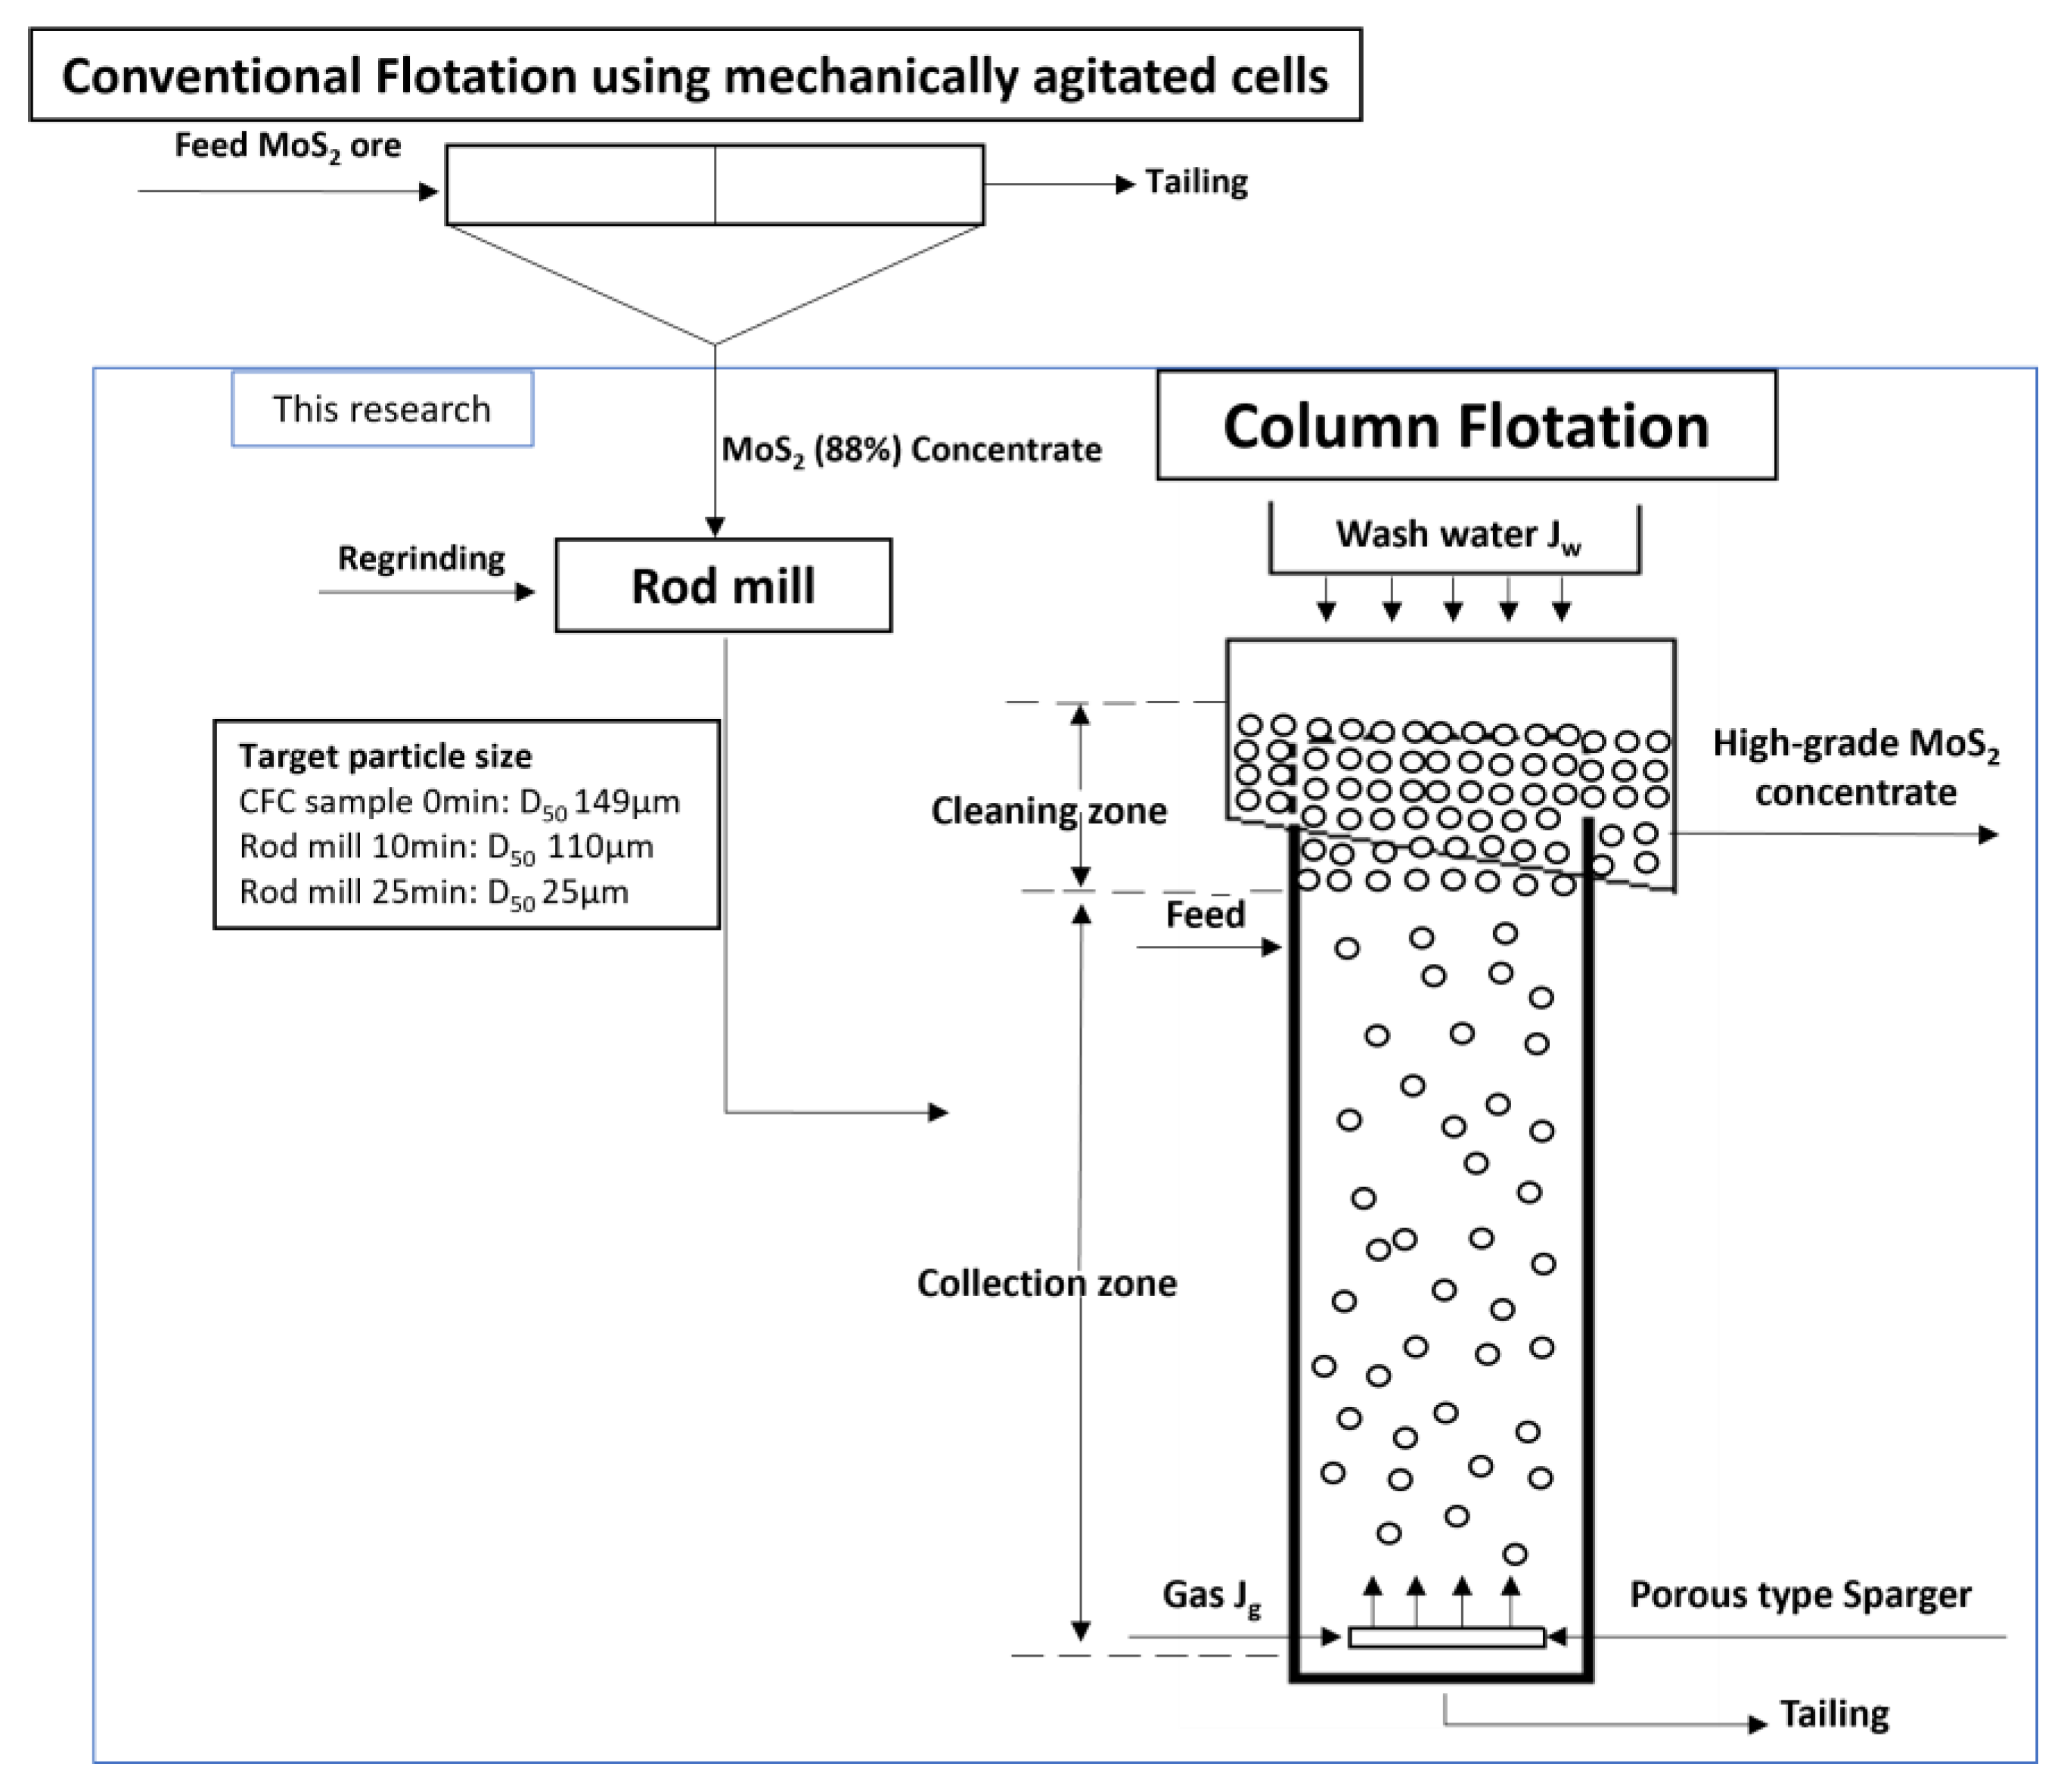
Figure 1 shows the experimental process and a schematic of the column flotation used in this study. The flotation column was made of acrylic with a diameter of 4 cm and length of 180 cm. Column flotation was divided into collection and washing zones, with the feed inlet section located at 1/3 of the total height of the column. For bubble generation, a porous sparger was installed at the bottom of the column, where compressed air was injected via a regulator. Furthermore, a frother was continuously fed into the column bottom from a conditioning tank. A washing device was installed at the top of the column to remove floating gangue minerals with valuable minerals. The experimental method involved first regrinding the CFC samples for 10 and 20 min using a rod mill to improve liberation, followed by their use in the column flotation experiment.
Table 2 lists the experimental conditions for the column flotation experiments using a full factorial experimental design (25) with a combination of two levels and five variables. The experimental conditions included particle sizes of 37.5 and 87 µm, depressant dosages of 20 and 200 g/ton, superficial wash water velocities of 0.1 and 0.6 cm/s, frother concentrations of 50 and 150 ppm, and superficial gas velocities of 0.7 and 1.5 cm/s. Constant operating parameters were maintained, including a feed velocity of (0.20 cm/s), frother velocity (0.25 cm/s), and pulp density (5%). The reagents used for column flotation were Aero Froth 65, a polyglycol ether-type frother and Na2SiO3 as a depressant, which is effective in depressing silicate minerals. The final concentrate and tailings were dried at 105 °C, weighed, and analyzed for Mo content using ICP-OES after acid pretreatment.

2.3. Experimental Design

The primary objective of the experimental design was to identify significant factors among the many that affect the experimental results and construct a mathematical model for prediction using statistical techniques. In addition, the optimal conditions were derived based on the derived mathematical model [20]. This study used a full factorial experimental design (25) with a combination of two levels and five variables to investigate the effects of the parameters on the MoS2 grade and recovery in column flotation. The coding levels are shown in Table 1. The main variables selected were particle size (A), depressant dosage (B), superficial wash water velocity (C), frother concentration (D), and superficial gas velocity (E). Using a factorial design method, 32 experiments were performed, and each variable was coded between high level “+1” and low level “−1” to facilitate the derivation of statistical data.
Regression analysis was used to analyze and predict the relationships between variables and determine the importance of individual variables. Analysis of variance (ANOVA) was used to analyze the differences between groups, explore factor effects, and assess interaction effects [20,21]. In this study, ANOVA and multiple regression analyses were performed using the SPSS 29 software to derive a model equation for predicting MoS2 grade and recovery.

3. Results and Discussion

3.1. Regrinding of CFC

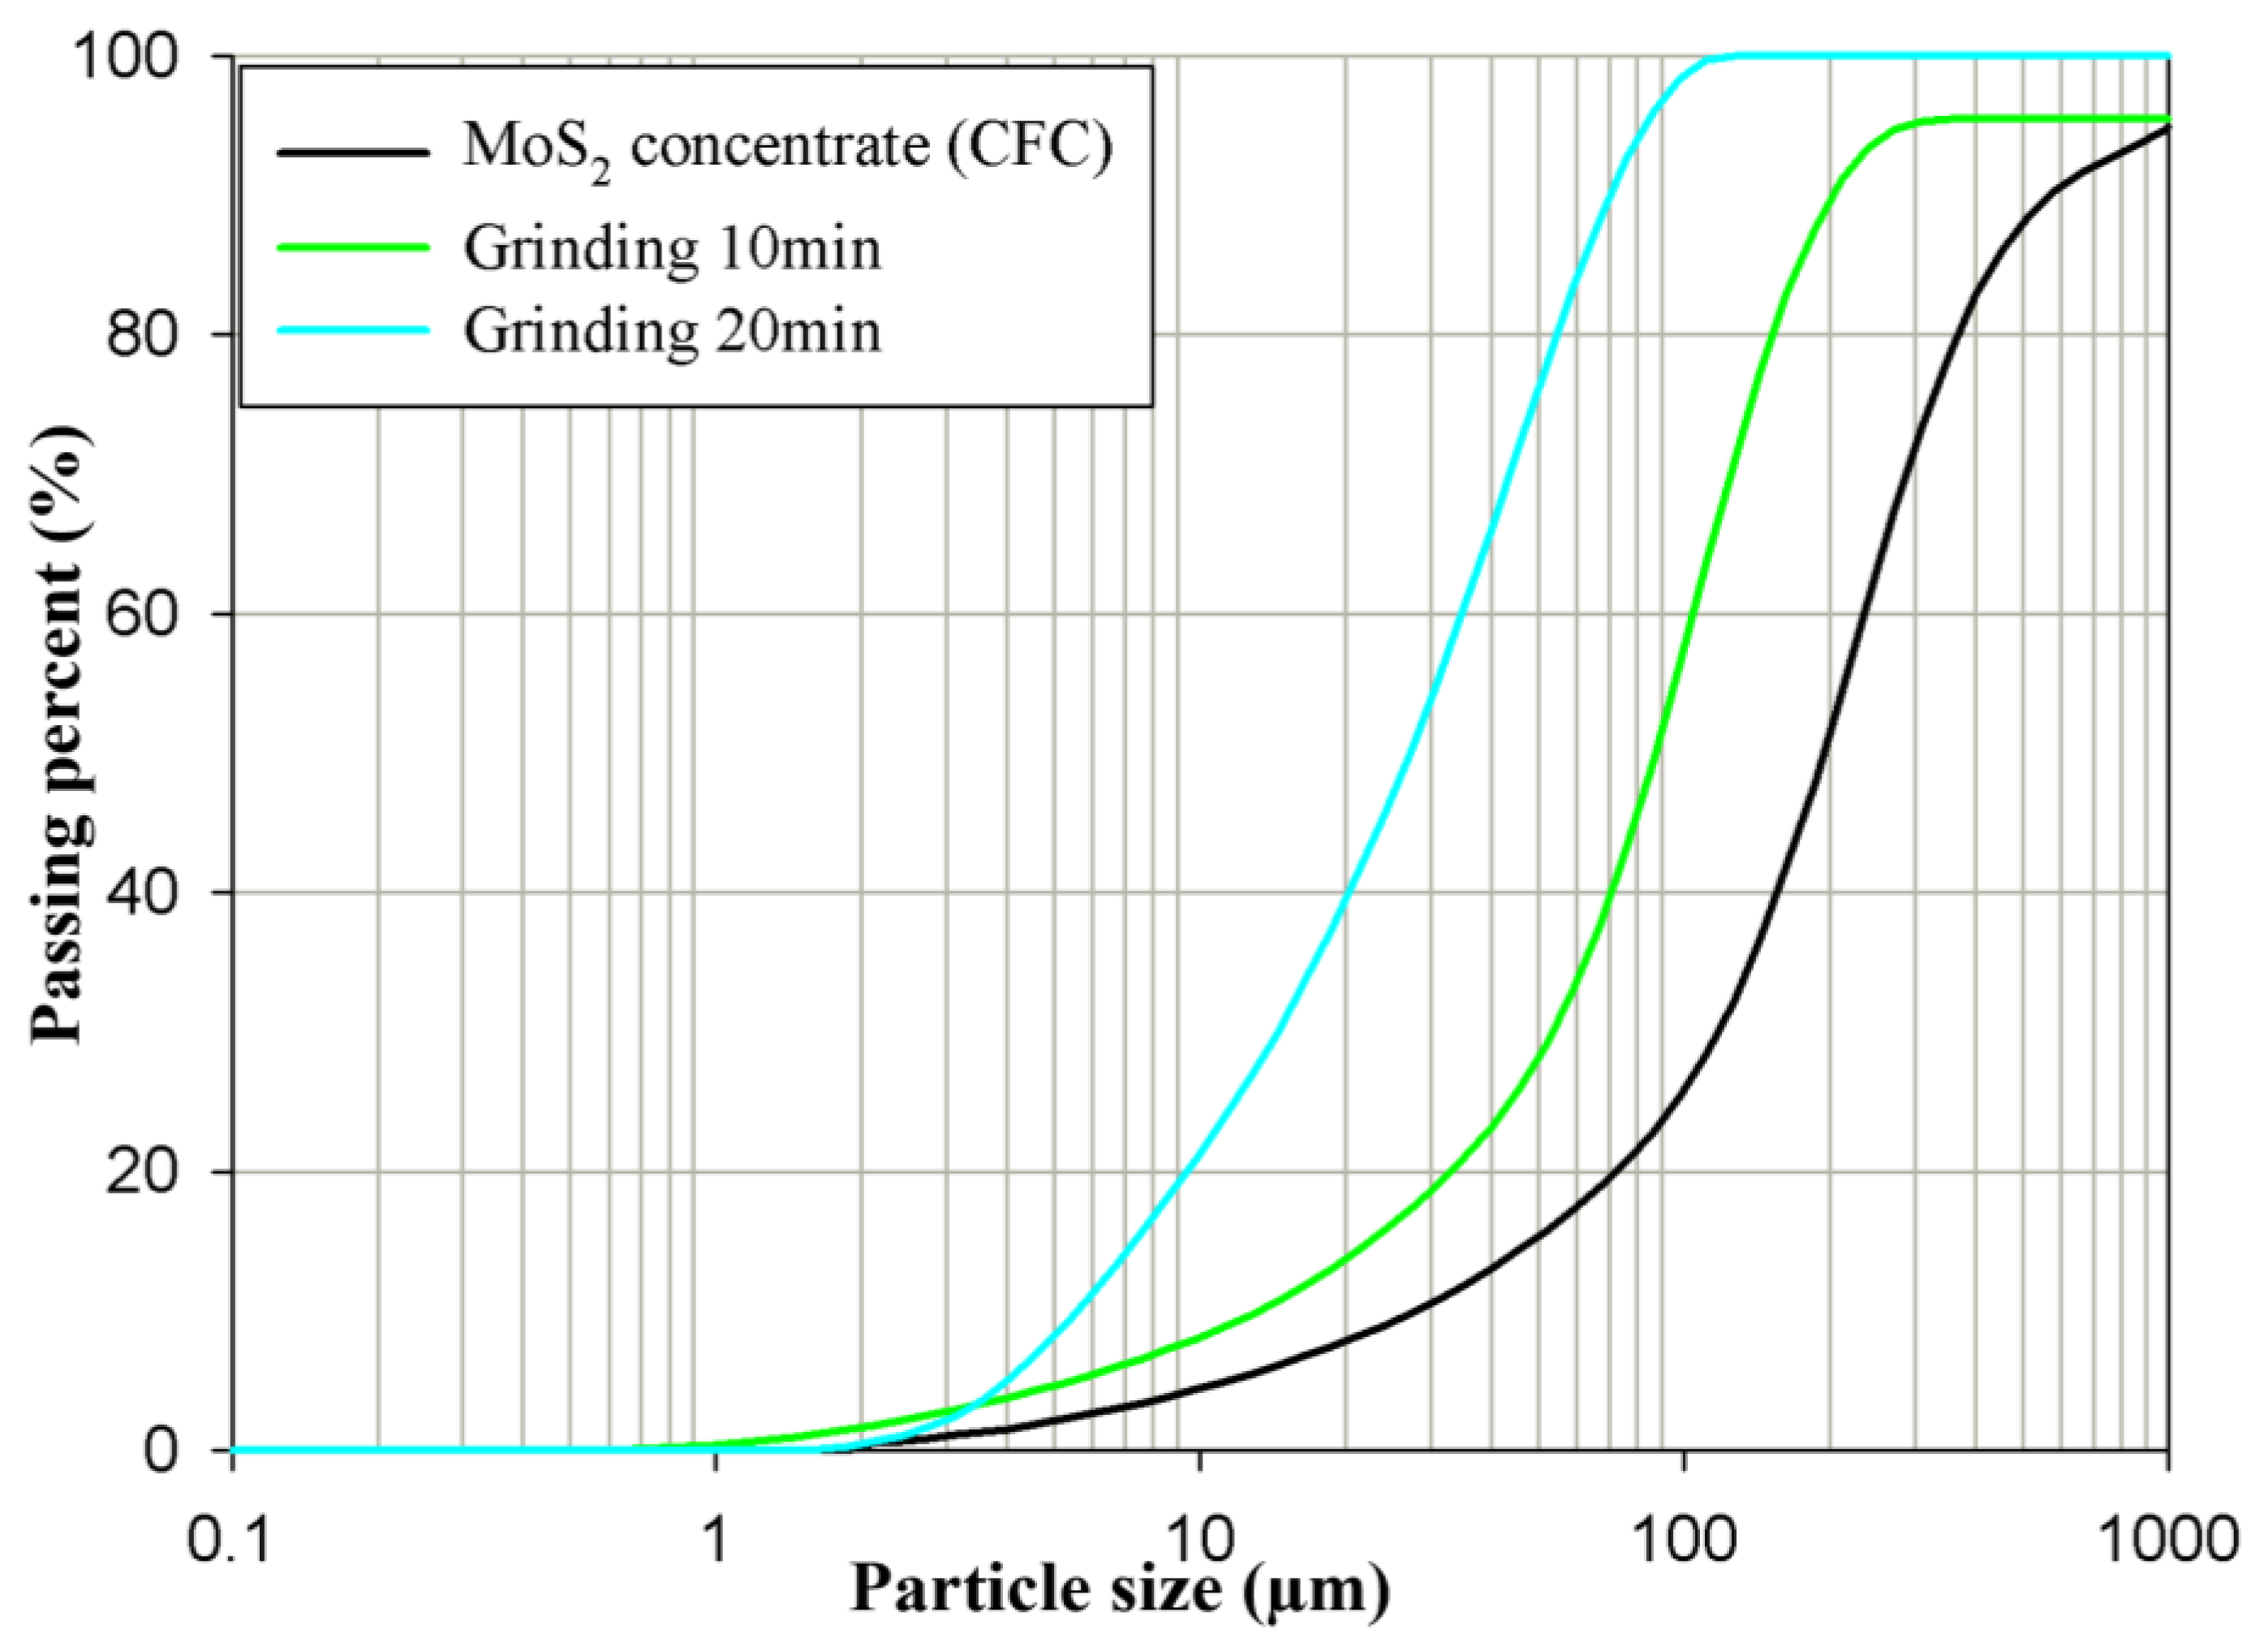
Table 3 lists the results of the chemical analysis of the CFC of MoS2 using XRF. The MoS2 content was 88.6%, and impurities consisted of SiO2 (4.48%), CaO (1.54%), Fe2O3 (2.17%), Al2O3 (0.66%), K2O (0.09%), and MgO (1.79%). In addition, Cu, Pb, and Zn-bearing sulfide minerals that can cause a reduction in separation efficiency were in trace amounts. The XRD pattern of the CFC sample (Figure S1) confirms high crystallinity, with major peaks matching the molybdenite phase (MoS2, JCPDS No. 37-1492). However, minor peaks associated with silicate gangue minerals, such as quartz (SiO2) and chlorite, were detected. This presence of residual impurities aligns with XRF data, underscoring the limitations of conventional flotation and validating the necessity of column flotation to produce high-grade concentrates. The CFC sample for improving the liberation was reground using a rod mill for 10 min and 20 min. The results of particle size analysis are shown in Figure 2. The CFC sample had a median particle size (D50) of 149 μm and an 80% passing size (D80) of 371 μm. After regrinding for 10 and 20 min, the (D50) values decreased to 87 μm and 37.5 μm, with corresponding (D80) values of 107 μm and 55 μm, respectively.
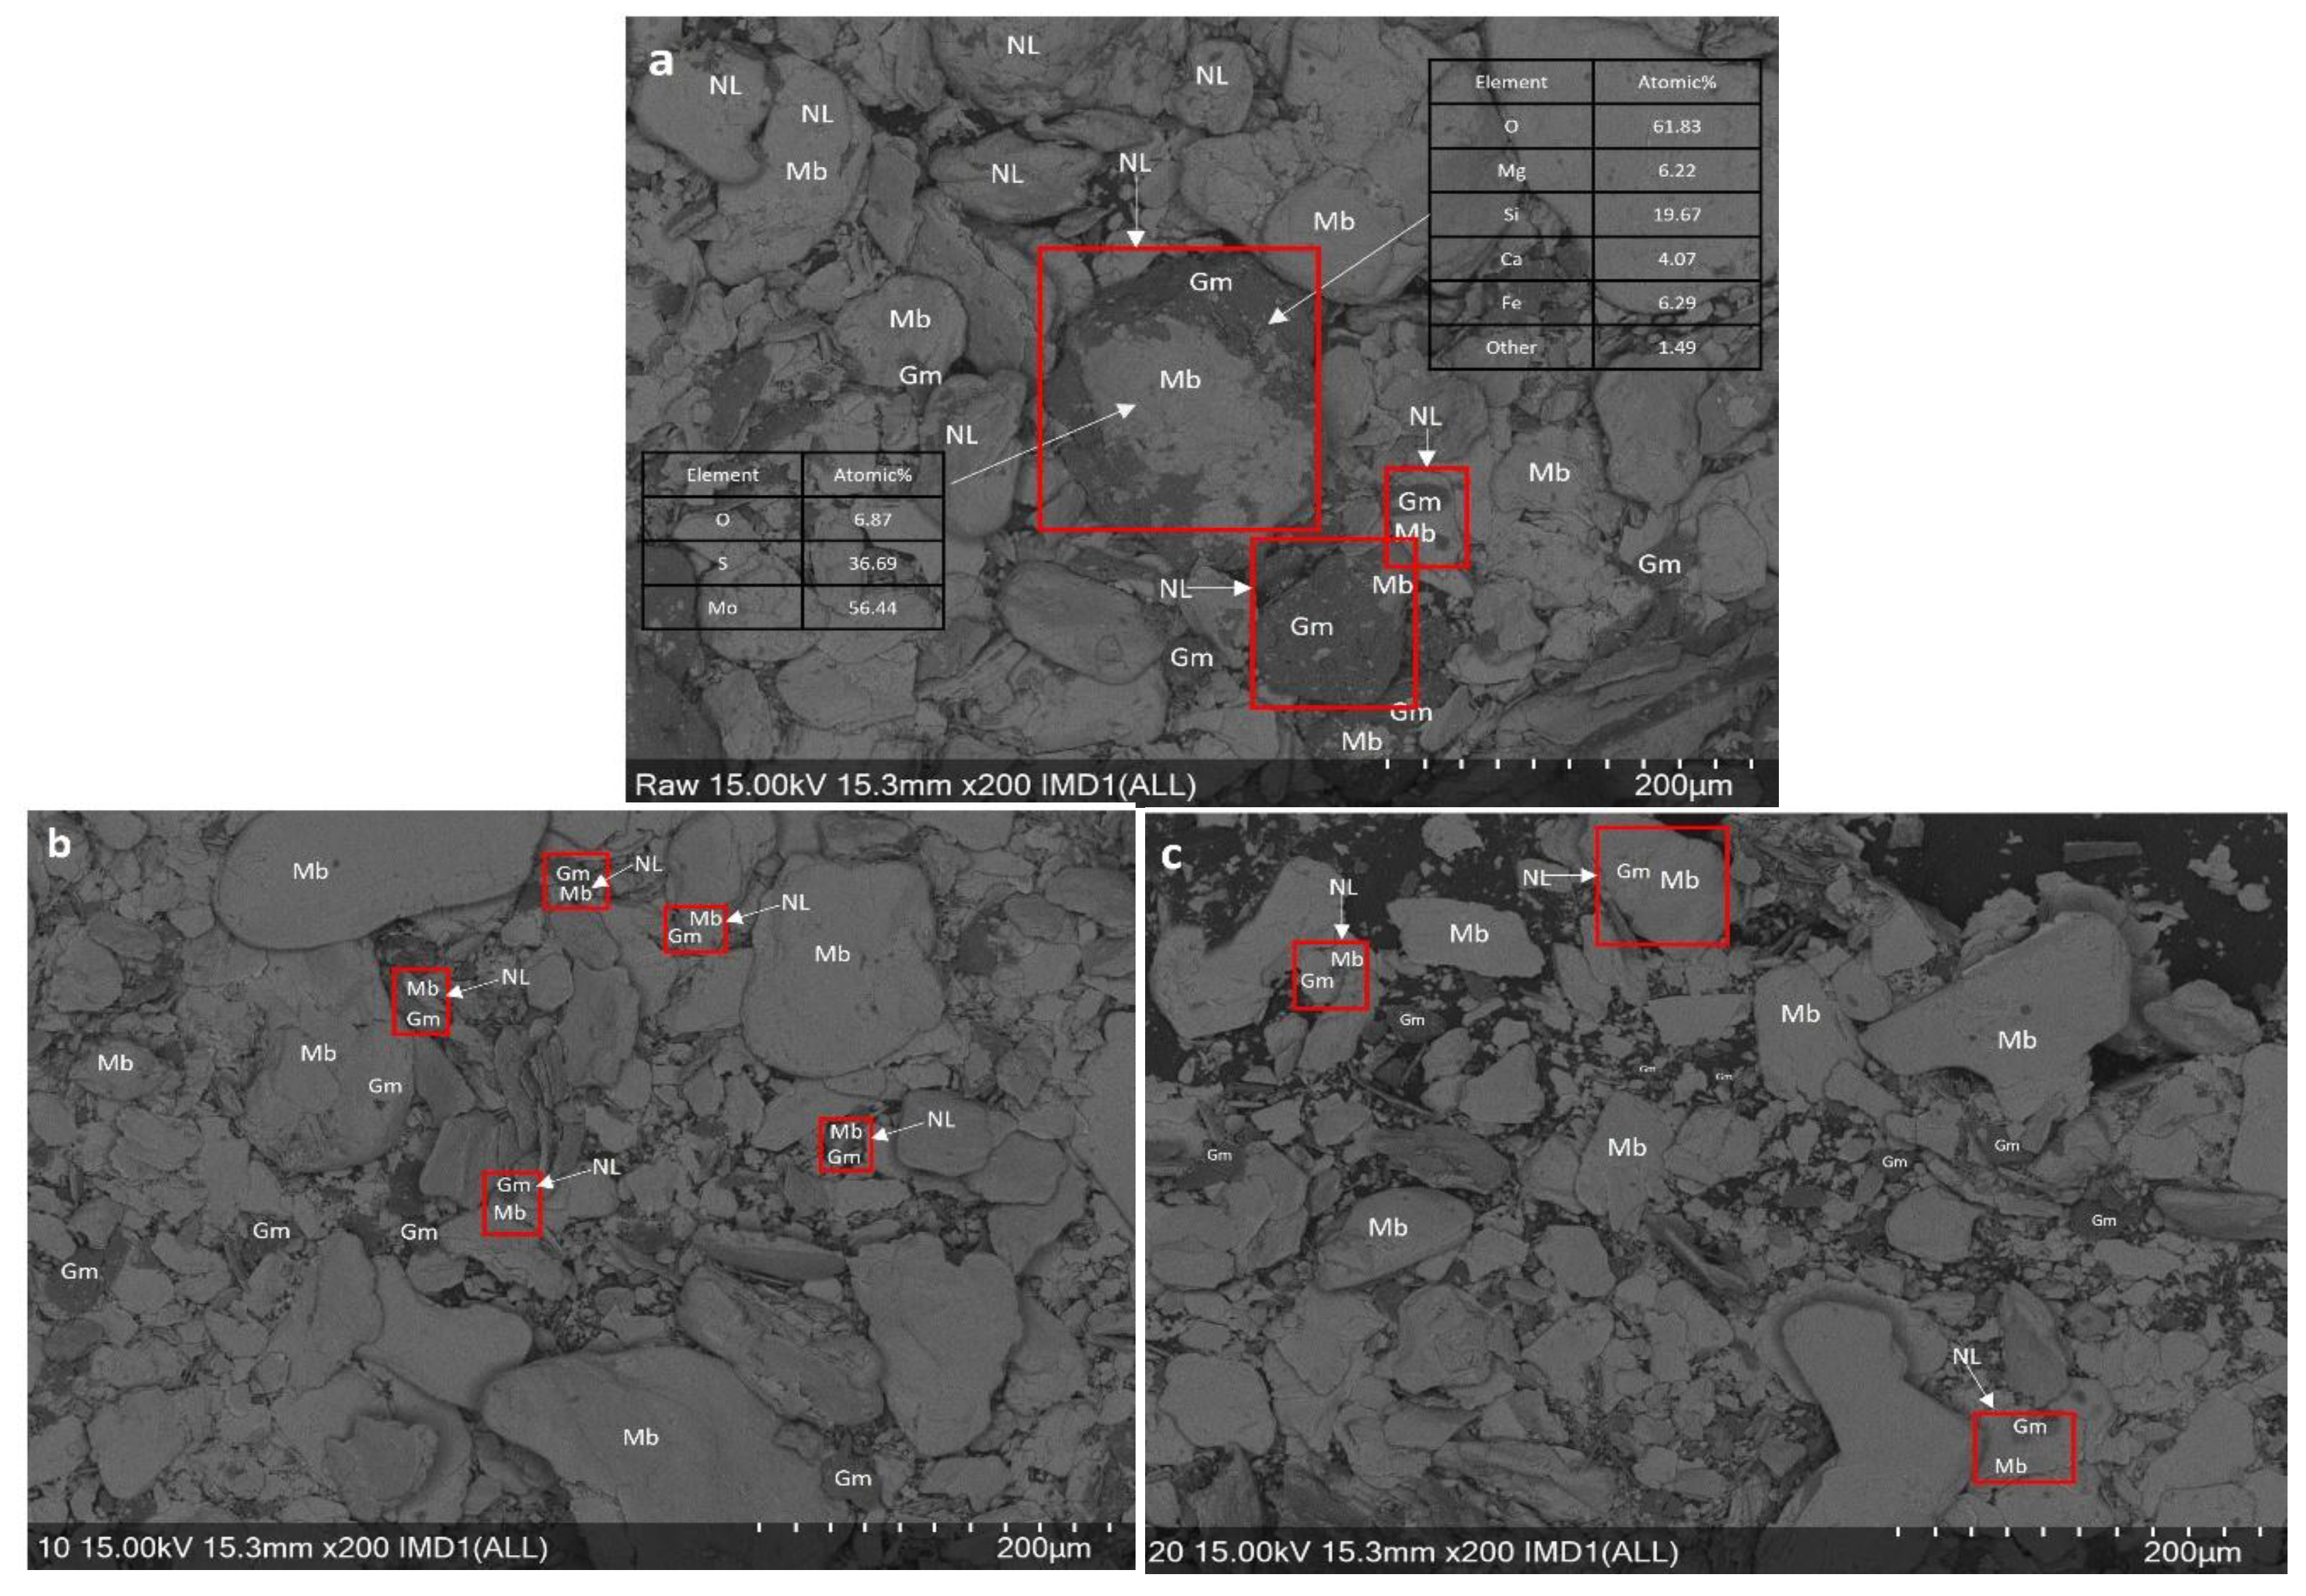
Figure 3 shows the SEM/BSE analysis of the samples reground for 0, 10, and 20 min to improve the liberation of CFC. In terms of mineral morphology, MoS2, compared to gangue minerals, exhibits a plate-like shape owing to its malleability. At 0 min, as shown in Figure 3a, some of the particles between the MoS2 (light grey) and gangue minerals (dark grey) were not liberated. However, as shown in Figure 3b,c, the liberation of CFC improved with a decrease in the amount of non-liberated particles from 10 min to 20 min. Hence, column flotation by factorial design was performed using samples reground for 10 and 20 min.

3.2. Effect of Main Variables

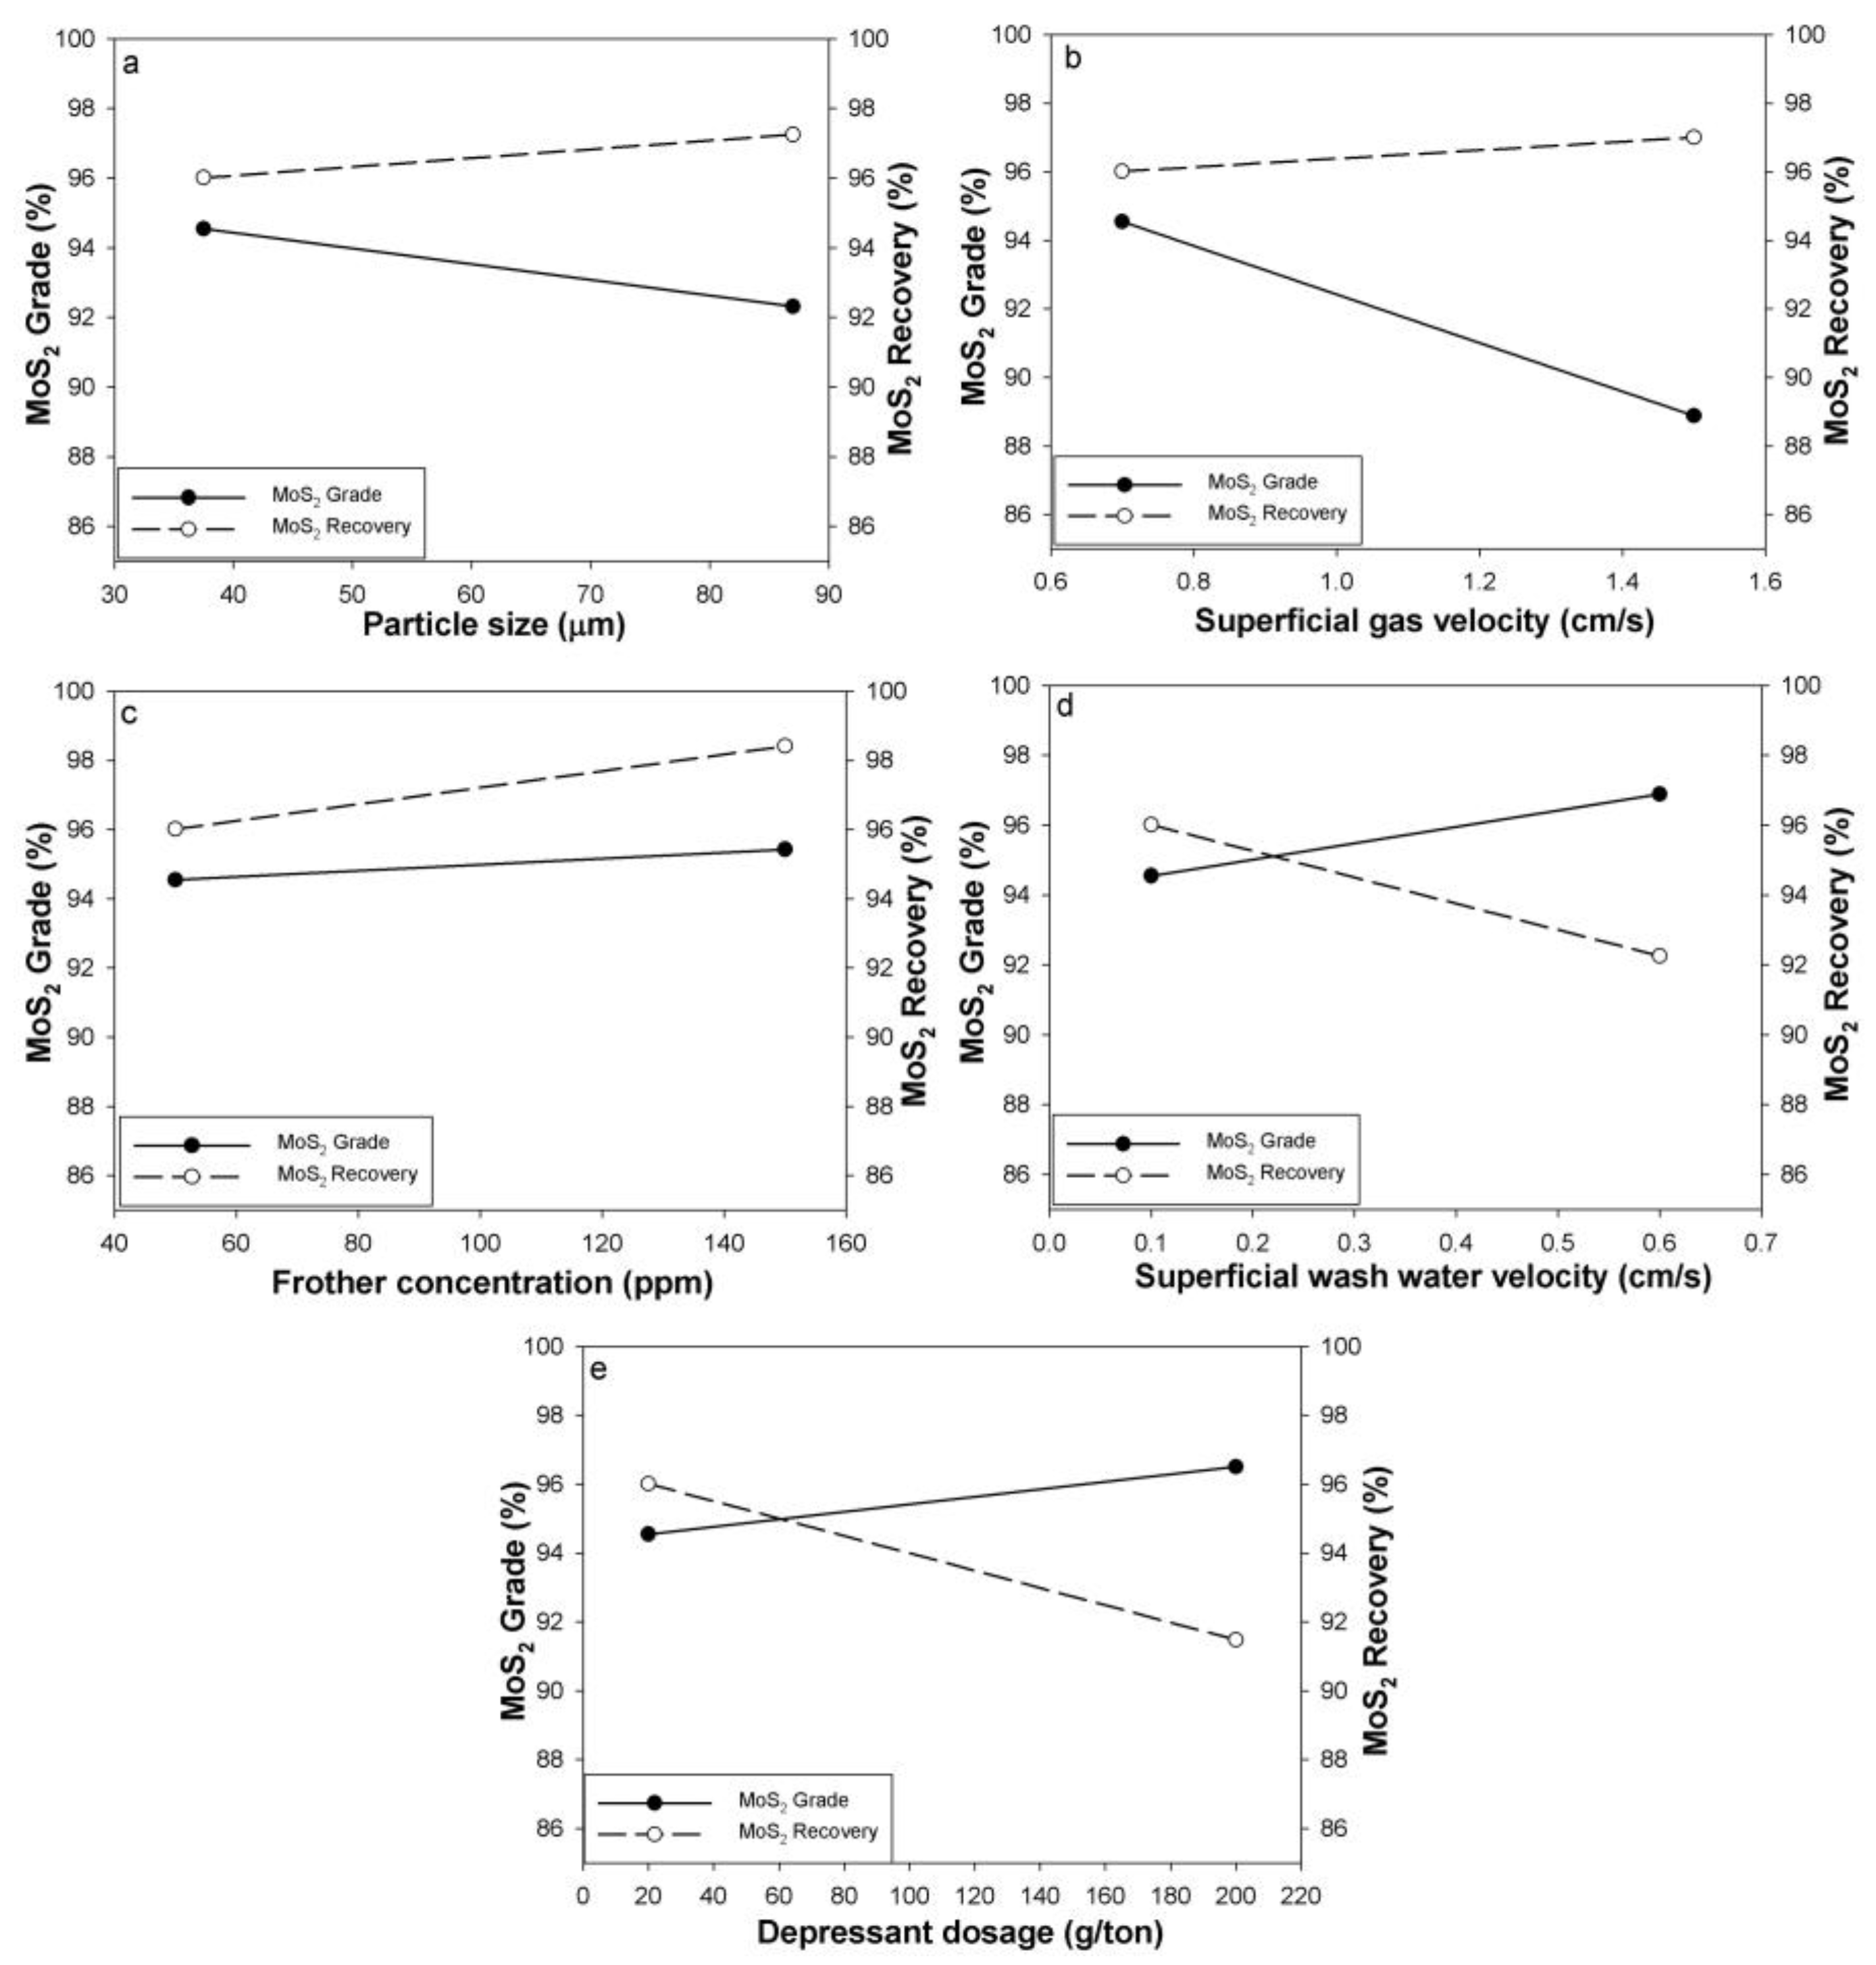
Figure 4 shows the effects of the main variables on MoS2 grade and recovery using a factorial design method. The changes in the independent variables in the plots represent the individual main effects of particle size, depressant dosage, superficial wash water velocity, frother concentration, and superficial gas velocity on the dependent variables of grade and recovery.
Figure 4a shows the effect of particle size on MoS2 grade and recovery. Its grade increased as the particle size decreased, whereas its recovery increased as the particle size increased. When the particle size (D50) was 87 µm, the MoS2 grade and recovery were 92.3% and 97.3%, respectively, while at a particle size (D50) of 37.5 µm, the MoS2 grade and recovery were 95.7% and 92.2%, respectively. The reason for the increase in MoS2 grade at finer particle sizes, as shown in Figure 3, is that the selective attachment between liberated MoS2 and bubbles in column flotation is high with increasing liberation in fine particles.
In particle recovery related to collision, attachment, and detachment mechanisms between particles and bubbles, coarse particles have a high probability of collision with bubbles, but fine particles have difficulty colliding and attaching to bubbles, resulting in low recovery [27]. The attachment of MoS2 particles and the bubbles may have reduced as the particle size (D50) of 37.5 µm was over-ground more than that of 87 µm, and the floatability of MoS2 particles weakened due to interference from fine particle gangue minerals [28]. It was reported that once particle size is coarser than 200 µm, it may not float efficiently owing to an increase in the settling rate with a high probability of detachment between the particle and bubble, as well as a decrease in froth stability. Conversely, finer particles have difficulty attaching to bubbles, resulting in lower recovery by entrainment [29]. Hence, it was demonstrated that suitable control of particle size by comminution is important for MoS2 flotation efficiency.
Superficial gas velocity considerably affects flotation efficiency, including bubble generation, gas holdup, and mixing in column flotation [28,29]. Figure 4b shows the effect of superficial gas velocity on the MoS2 grade and recovery. A rapid decrease in concentrate grade was observed with increasing superficial gas velocity; however, the recovery does not change considerably. The MoS2 grade and recovery at a superficial gas velocity of 0.7 cm/s were 94.55% and 96.01%, respectively, whereas those at a superficial gas velocity of 1.5 cm/s, were 88.89% and 97.00%, respectively. With a decrease in the MoS2 grade, it is considered that sufficient collision, attachment, and detachment between the bubbles and particles do not occur because the bubble residence time decreases with increasing bubble size and rising velocity as the superficial gas velocity increases [30,31]. Additionally, gangue minerals may have been entrapped and entrained in the concentrate owing to the formation of strong turbulence in the column and the phenomenon of upward flow as the superficial gas velocity increased [27]. Hence, controlling the superficial gas velocity for column operation is important for maintaining stable fluid flow and improving separation efficiency.
Figure 4c shows the effect of frother concentration on MoS2 grade and recovery. Frother AF65 of the polyglycol ether type, which produces a more persistent and stable froth at a low cost, has been used in the flotation of various minerals, including coal and graphite with natural floatability [32]. When the frother concentration was 50 ppm, the MoS2 grade and recovery were 94.55% and 96.01%, respectively. However, at 150 ppm, the MoS2 grade and recovery were 94.43% and 98.41%, respectively. As the frother concentration increased, the grade and recovery increased slightly. The slight improvement in the grade and recovery with an increase in frother concentration may be due to the formation of a stable froth layer, which can increase the flotation efficiency. Entrapment can occur if the bubbles are too small, whereas larger bubbles with higher rising velocities may lead to entrainment of gangue minerals, potentially reducing the grade. Hence, optimizing the frother concentration can improve the flotation efficiency by considering its relationship with operating variables, such as particle size, superficial gas velocity, and superficial wash water velocity [32,33,34].
Figure 4d shows the effect of superficial wash water velocity on MoS2 grade and recovery. As the superficial wash water velocity increased, the grade increased, but the recovery decreased. The MoS2 grade and recovery at a superficial wash water velocity of 0.1 cm/s were 94.55% and 96.01%, respectively, whereas those at a superficial wash water velocity of 0.6 cm/s were 96.89% and 92.25%, respectively. Increasing the superficial wash water velocity facilitated the supply of water to the overflow of non-floating minerals in the column and improved the grade by expanding the wash zone interface and reducing entrainment.
When the tailings discharge rate was constant, an excessive increase in the wash water reduced the width of the washing zone and increased the interface. This may have reduced the washing effect of superficial wash water velocity and intensified the negative bias, thereby reducing the grade. Hence, it is important to measure the bias and control the tailing discharge to maintain a constant interfacial depth [35,36]. Figure 4e shows the effect of the depressant (Na2SiO3) dosage on MoS2 grade and recovery. As the depressant dosage increased, the grade increased; however, the recovery decreased slowly. When the depressant dosage was 20 g/ton, the MoS2 grade and recovery were 94.55% and 96.01%, respectively. At a depressant dosage of 200 g/ton, the MoS2 grade and recovery were 96.51% and 91.48%, respectively. In addition, the pH of the pulp changed from 8 to 10 while increasing the depressant dosage from 20 g/ton to 200 g/ton. The depressant renders gangue minerals hydrophilic or disperses the slimes, preventing them from flocculating in the concentrate. Na2SiO3 is a multifunctional reagent that considerably improves flotation by acting as a pH modifier, depressant, and dispersant [5,37,38]. Therefore, in this study, Na2SiO3 was used to effectively depress silicate minerals, which are the main gangue minerals in the concentrate. Three anionic species were formed in the pulp of Na2SiO3: OH, HSiO3−, and SiO32−. The OH ions are produced through the reaction Na2SiO3 + H2O ⇌ NaHCO3 + NaOH, which generates sodium hydroxide and raises the pH of the pulp. HSiO3 and SiO32− play a role in dispersing and depressing the silicate minerals [37]. The Na2SiO3 used in this study acted as a pH regulator, depressant, and dispersant for slimes, preventing them from coating the surface of MoS2, and improving the MoS2 grade.

3.3. Statistical Analysis

Table 4 shows the t-test and p-values of each independent variable of the MoS2 grade. The ANOVA revealed a determination coefficient of (R2) = 0.958, explaining 95.8% of the variability in the response. In addition, the p-values for the particle size, depressant dosage, superficial wash water velocity, and superficial gas velocity were all less than 0.05, indicating a statistically significant effect on the MoS2 grade. The F-values of 309.73 and 113.35 for superficial gas velocity and particle size, respectively, were the highest among the ANOVA values [38,39]. These variables were considered to have the greatest influence on the MoS2 grade. The F-values for the depressant dosage and superficial wash water velocity were 89.19 and 43.4, respectively, which were relatively low compared to those of the other variables.
Increasing the superficial wash water velocity can further improve the grade compared with the conditions shown in Figure 4d. However, the p-value of the frother concentration was 0.09, which was greater than 0.05, indicating a minor effect on the MoS2 grade.
Table 5 shows the t-test results and p-values for each independent variable of MoS2 recovery. The ANOVA revealed a determination coefficient of (R2) = 0.993, explaining 99.3% of the variability in the response. In addition, the p-values of the particle size, depressant dosage, superficial wash water velocity, frother concentration, and superficial gas velocity factors on the recovery were less than 0.05, indicating a notable MoS2 recovery. The F-values of 314.20, 179.00, and 149.90 for superficial wash water velocity, depressant dosage, and frother concentration, respectively, were the highest among the ANOVA values [39]. These variables were considered to have the greatest influence on MoS2 recovery. The F-values of the superficial gas velocity and particle size were 30.30 and 17.93, respectively, which were relatively low compared with those of the other variables. Hence, a decrease in the superficial gas velocity can further improve the grade and recovery compared to the conditions shown in Figure 4b.
The adequacy of the models was further evaluated by comparing R2 and Adjusted R2 values obtained from the ANOVA results in Table 4 and Table 5. For MoS2 grade, the R2 and Adjusted R2 were 0.958 and 0.918, respectively. For recovery, these values were 0.993 and 0.987, showing extremely close agreement. These high adjusted R2 values confirm that the selected operating variables are statistically significant, providing a reliable predictive model for the column flotation process.
The statistical validity of the developed models was rigorously assessed through residual analysis. As shown in Figures S2 and S3 (Supplementary Materials), the residuals for both MoS2 grade and recovery follow a normal distribution, as indicated by the linearity in the normal probability plots. Furthermore, the random distribution observed in the ‘Versus Fits’ and ‘Versus Order’ plots confirms that the assumptions of constant variance (homoscedasticity) and independence are fully satisfied.
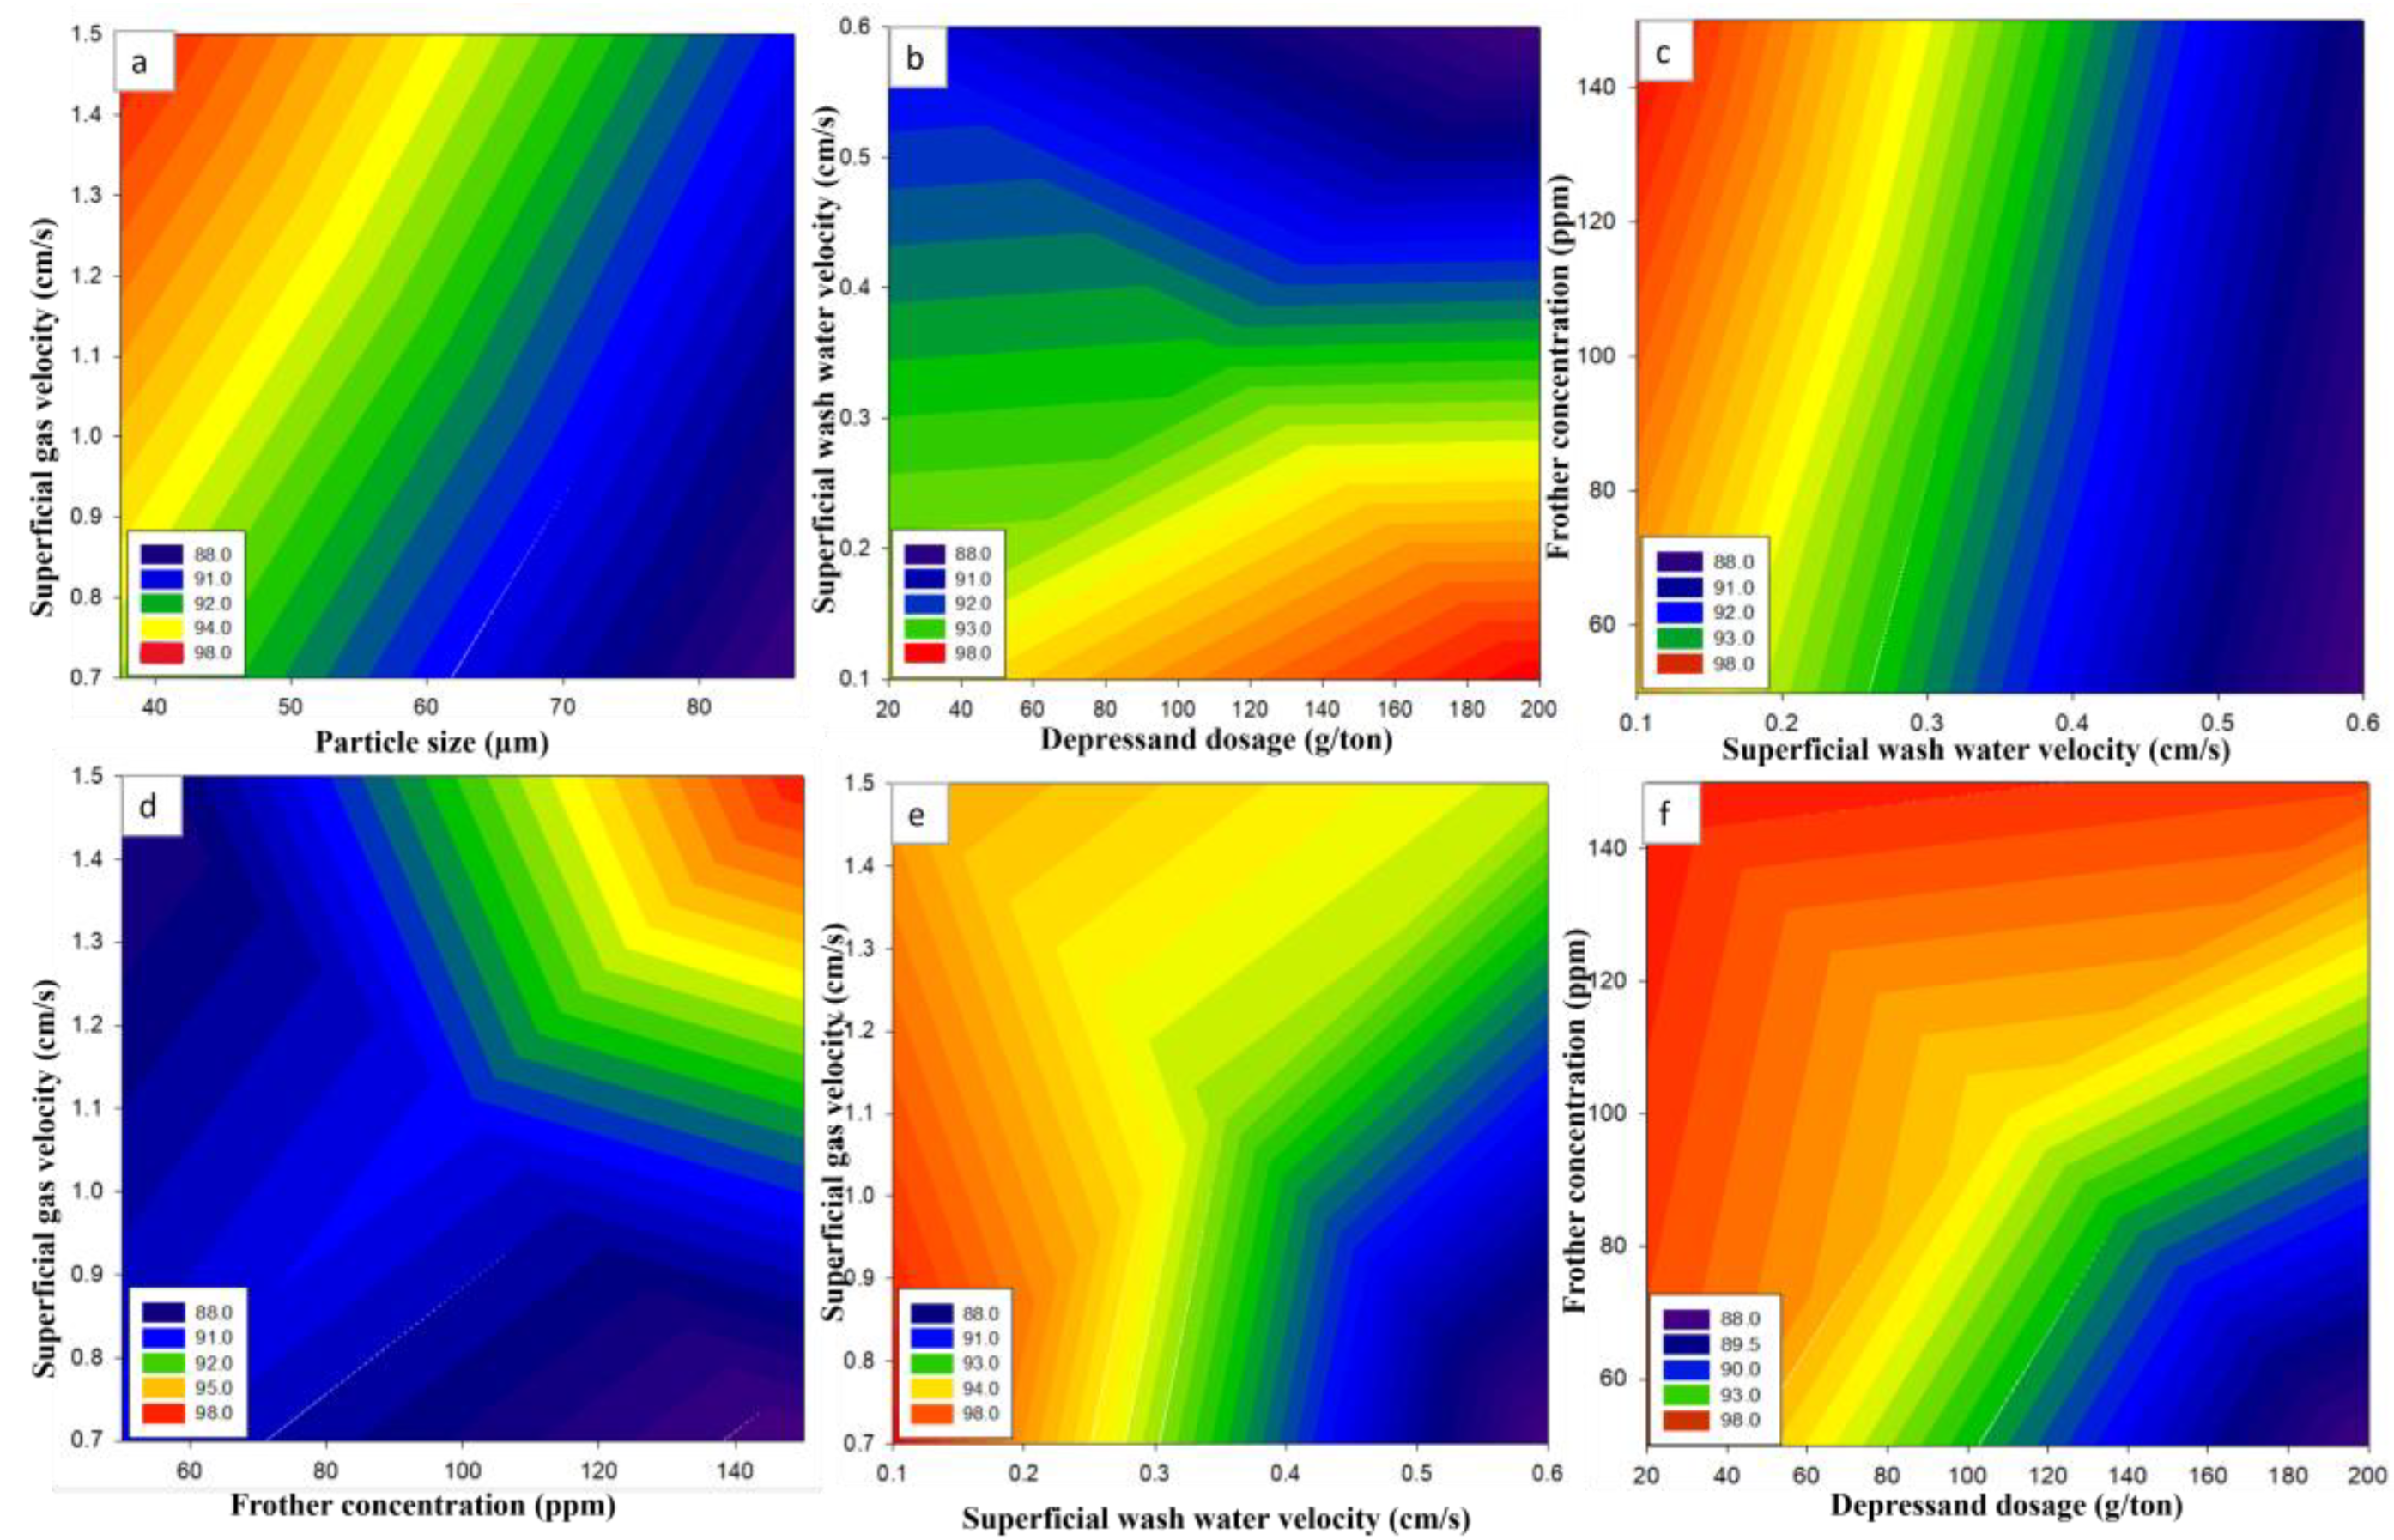
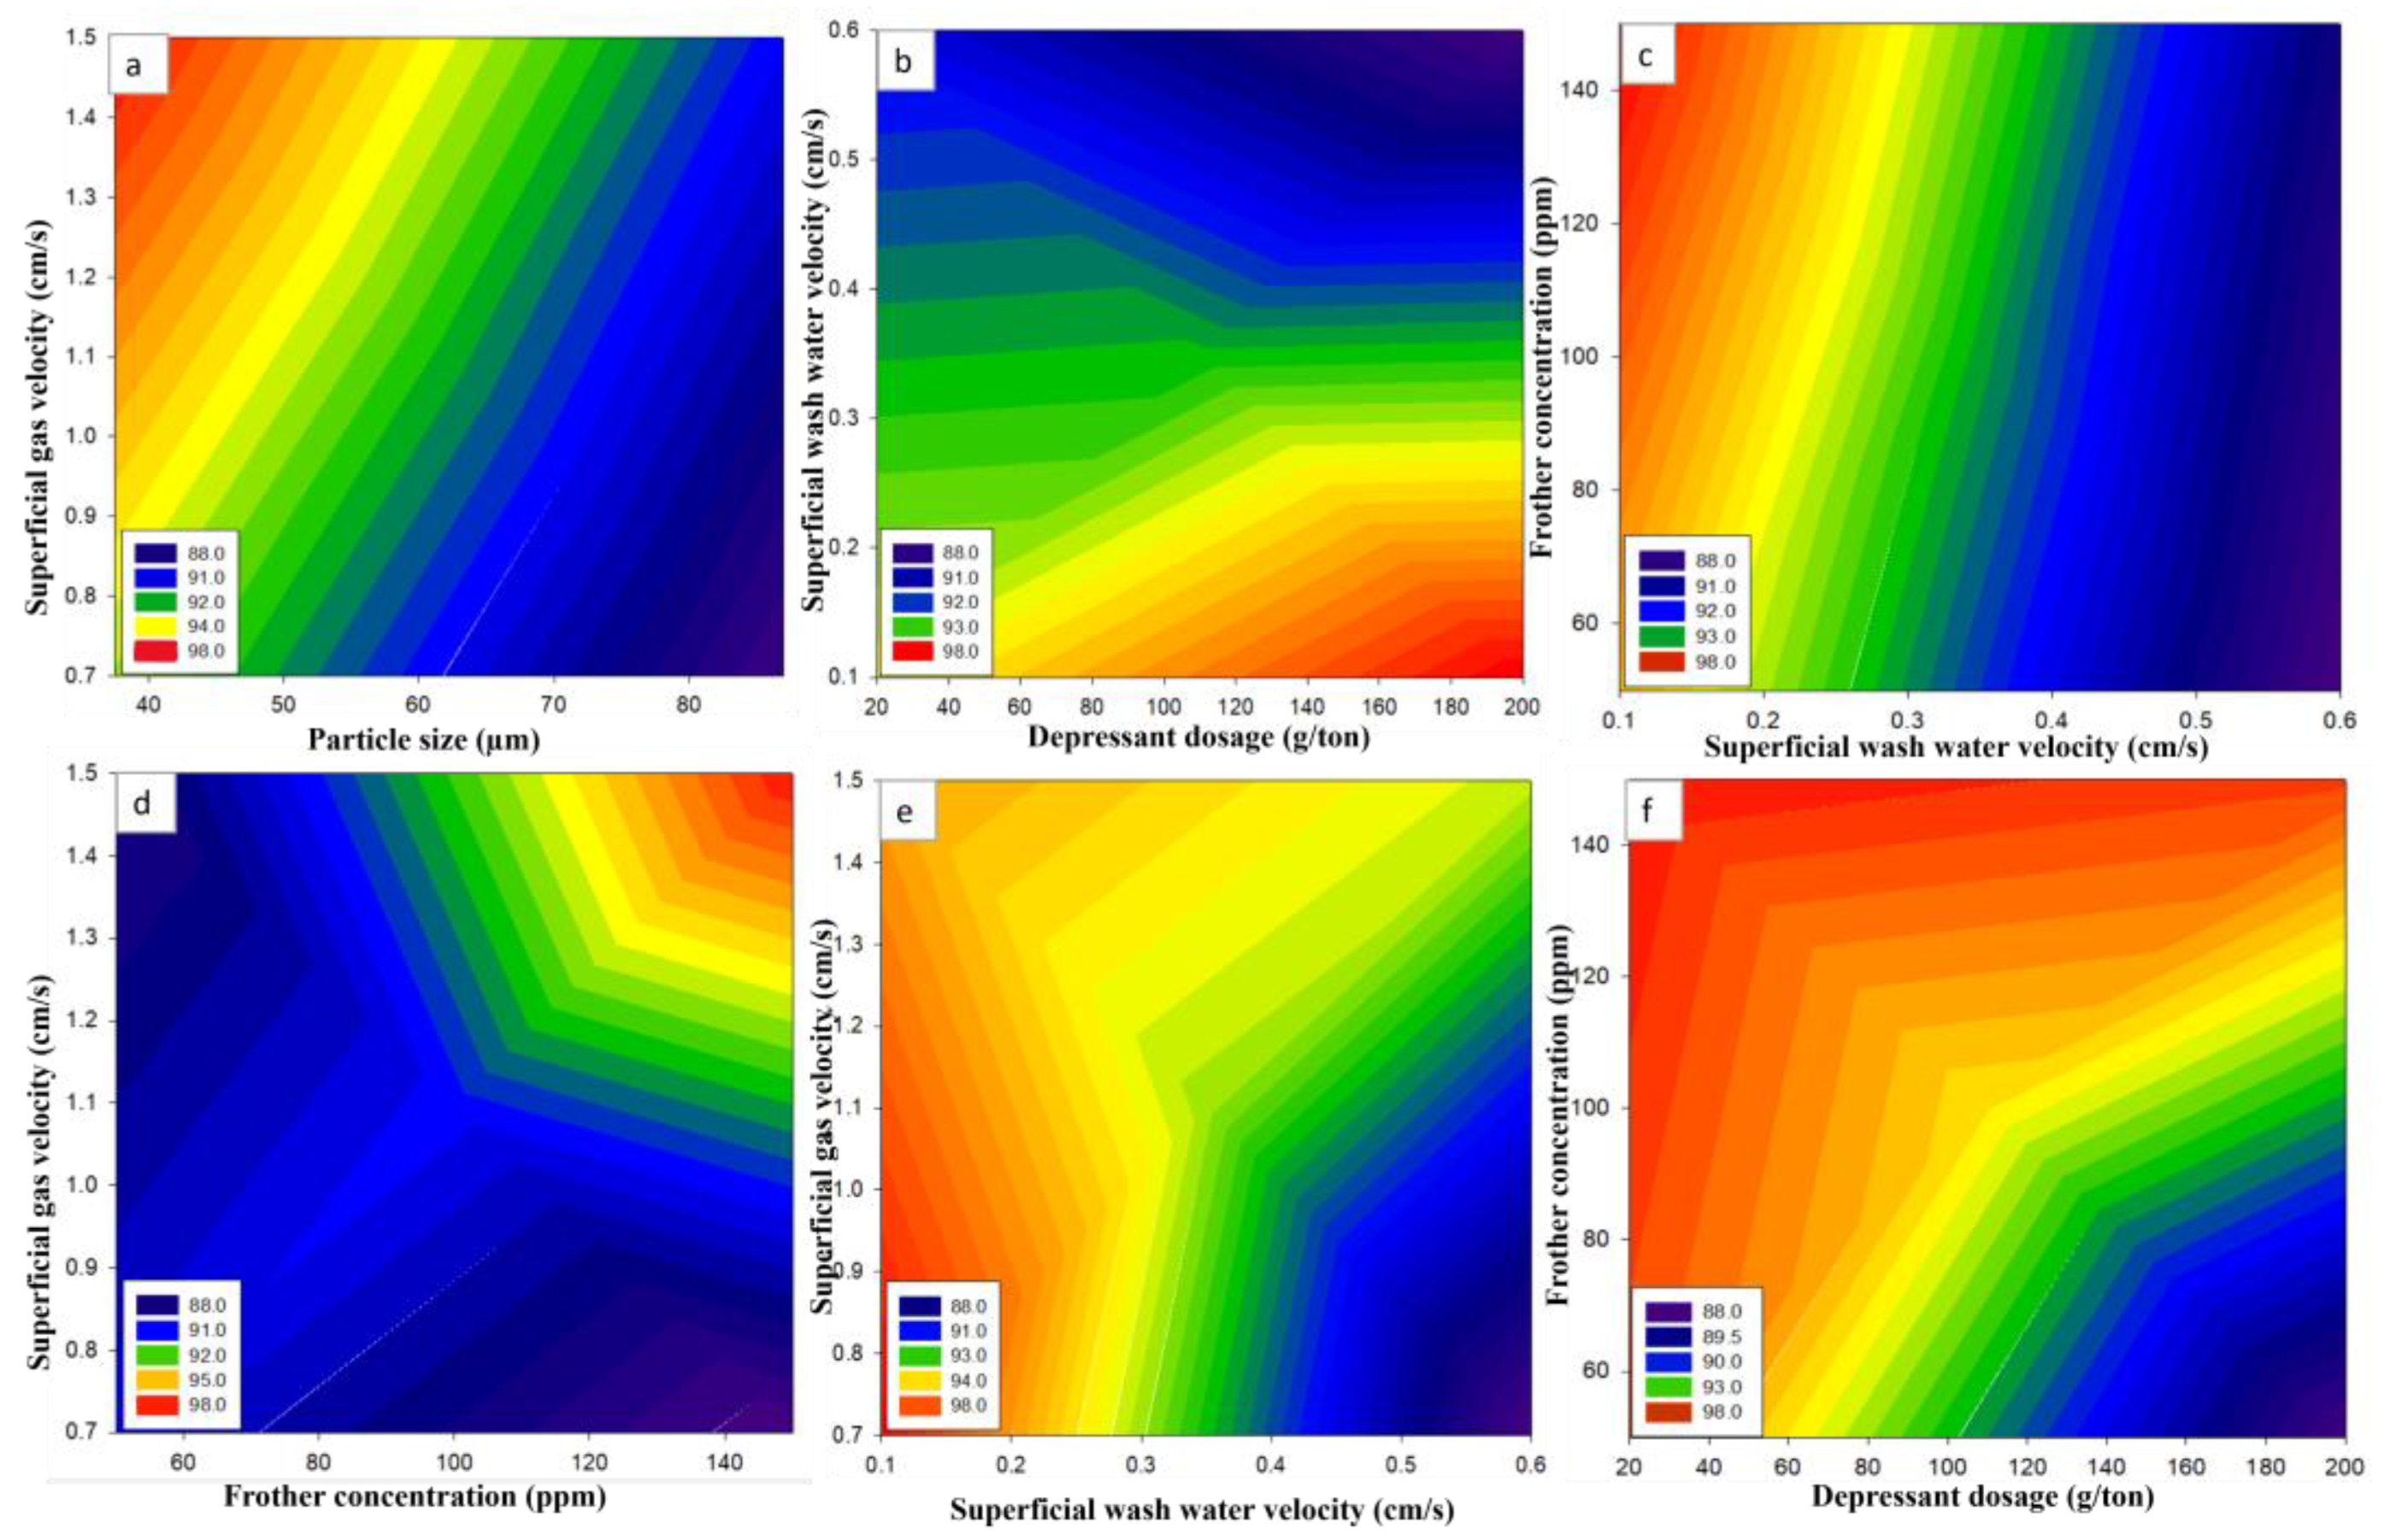
Figure 5 and Figure 6 show the 2D counter-plot relationship between the two independent variables for MoS2 grade and recovery, respectively. Based on the ANOVA results in Table 3, a contour plot between the two variables for the MoS2 grade is plotted in Figure 5. The p-values of the interactions between particle size (A) and superficial gas velocity (E), depressant dosage (B), superficial wash water velocity (C), superficial wash water velocity (C), frother concentration (D), frother concentration (D), superficial gas velocity (E), superficial wash water velocity (C), and superficial gas velocity (E) were less than 0.05, indicating a significant positive impact on MoS2 grade. The F-values for the interaction between the two variables affecting the grade were 23.62, 28.15, 4.45, 21.93, and 12.69. A larger F-value indicates a greater effect on the grade. In Figure 5c–f, the two-variable combinations were confirmed not to affect MoS2 grade, as the p-value in the ANOVA result was higher than 0.05.
Figure 5b shows that the grade improved as the depressant concentration and superficial wash water velocity increased, with a p-value of less than 0.05, and the highest F value of 28.15. It is possible that the interaction between the two variables plays the greatest role in increasing the concentrate grade by reducing gangue minerals. The grade increases with decreasing gas velocity and particle size, as shown in Figure 5a. Therefore, it is predicted that controlling these conditions can improve the MoS2 grade. For the combination of superficial gas and superficial wash water velocities shown in Figure 5e, a decrease in superficial gas velocity and an increase in superficial wash water velocity affected the grade, with an F-value of 12.69. Hence, to improve the grade of MoS2, controlling the increase in superficial wash water velocity and depressant dosage, and decreasing the superficial gas velocity and particle size in the column should be considered [40].
From the ANOVA results in Table 4, a contour plot between the two variables for MoS2 recovery is shown in Figure 6. The p-values of the interactions between depressant dosage (B) and superficial wash water velocity (C), superficial wash water velocity (C), frother concentration (D), depressant dosage (B), and frother concentration (D) were less than 0.05, indicating a significant positive impact on MoS2 recovery. The F-values for the interaction between the two variables affecting recovery were 49.03, 40.48, and 74.94. A larger F value indicates a greater effect on the recovery [39,40].
In Figure 6f, the interaction between depressant dosage and frother concentration on MoS2 recovery shows a p-value of less than 0.05 and a higher F-value of 74.94 [38]. MoS2 recovery improved with decreasing depressant dosage and increasing frother concentration. In Figure 6b, the interaction between depressant dosage and superficial wash water velocity on MoS2 recovery shows a p-value of less than 0.05 and a high F-value of 49.03. The recovery improved with a decrease in the combination of these two variables. In Figure 6c, the interaction between superficial wash water velocity and frother concentration on MoS2 recovery shows a p-value of less than 0.05 and the highest F value of 40.48. The recovery improved with increasing frother concentration and decreasing superficial wash water velocity. In Figure 6a,d,e, the two-variable combinations were confirmed not to affect MoS2 recovery, as the p-value in the ANOVA result was higher than 0.05. As shown in Figure 6d, it is possible that the combination of superficial gas velocity and frother concentration can improve MoS2 recovery if the range is increased beyond the current experimental conditions. In the case of the combination of superficial gas velocity and superficial wash water velocity, as shown in Figure 6e, the recovery can be improved by reducing the superficial gas velocity and increasing the superficial wash water velocity.
As shown in the ANOVA results in Table 4, the MoS2 grade was considerably affected by a decrease in particle size and superficial gas velocity and an increase in depressant dosage and superficial wash water velocity. MoS2 recovery was considerably affected by a decrease in depressant dosage, an increase in frother concentration, and a decrease in frother concentration and superficial wash water velocity. In particular, the interaction between depressant dosage and superficial wash water velocity had the greatest impact on MoS2 grade and recovery. Hence, the main purpose of this study was to highlight the importance of controlling the rates of these two variables to produce high-grade MoS2 concentrates [41].

3.4. Regression Model of Column Flotation Performance

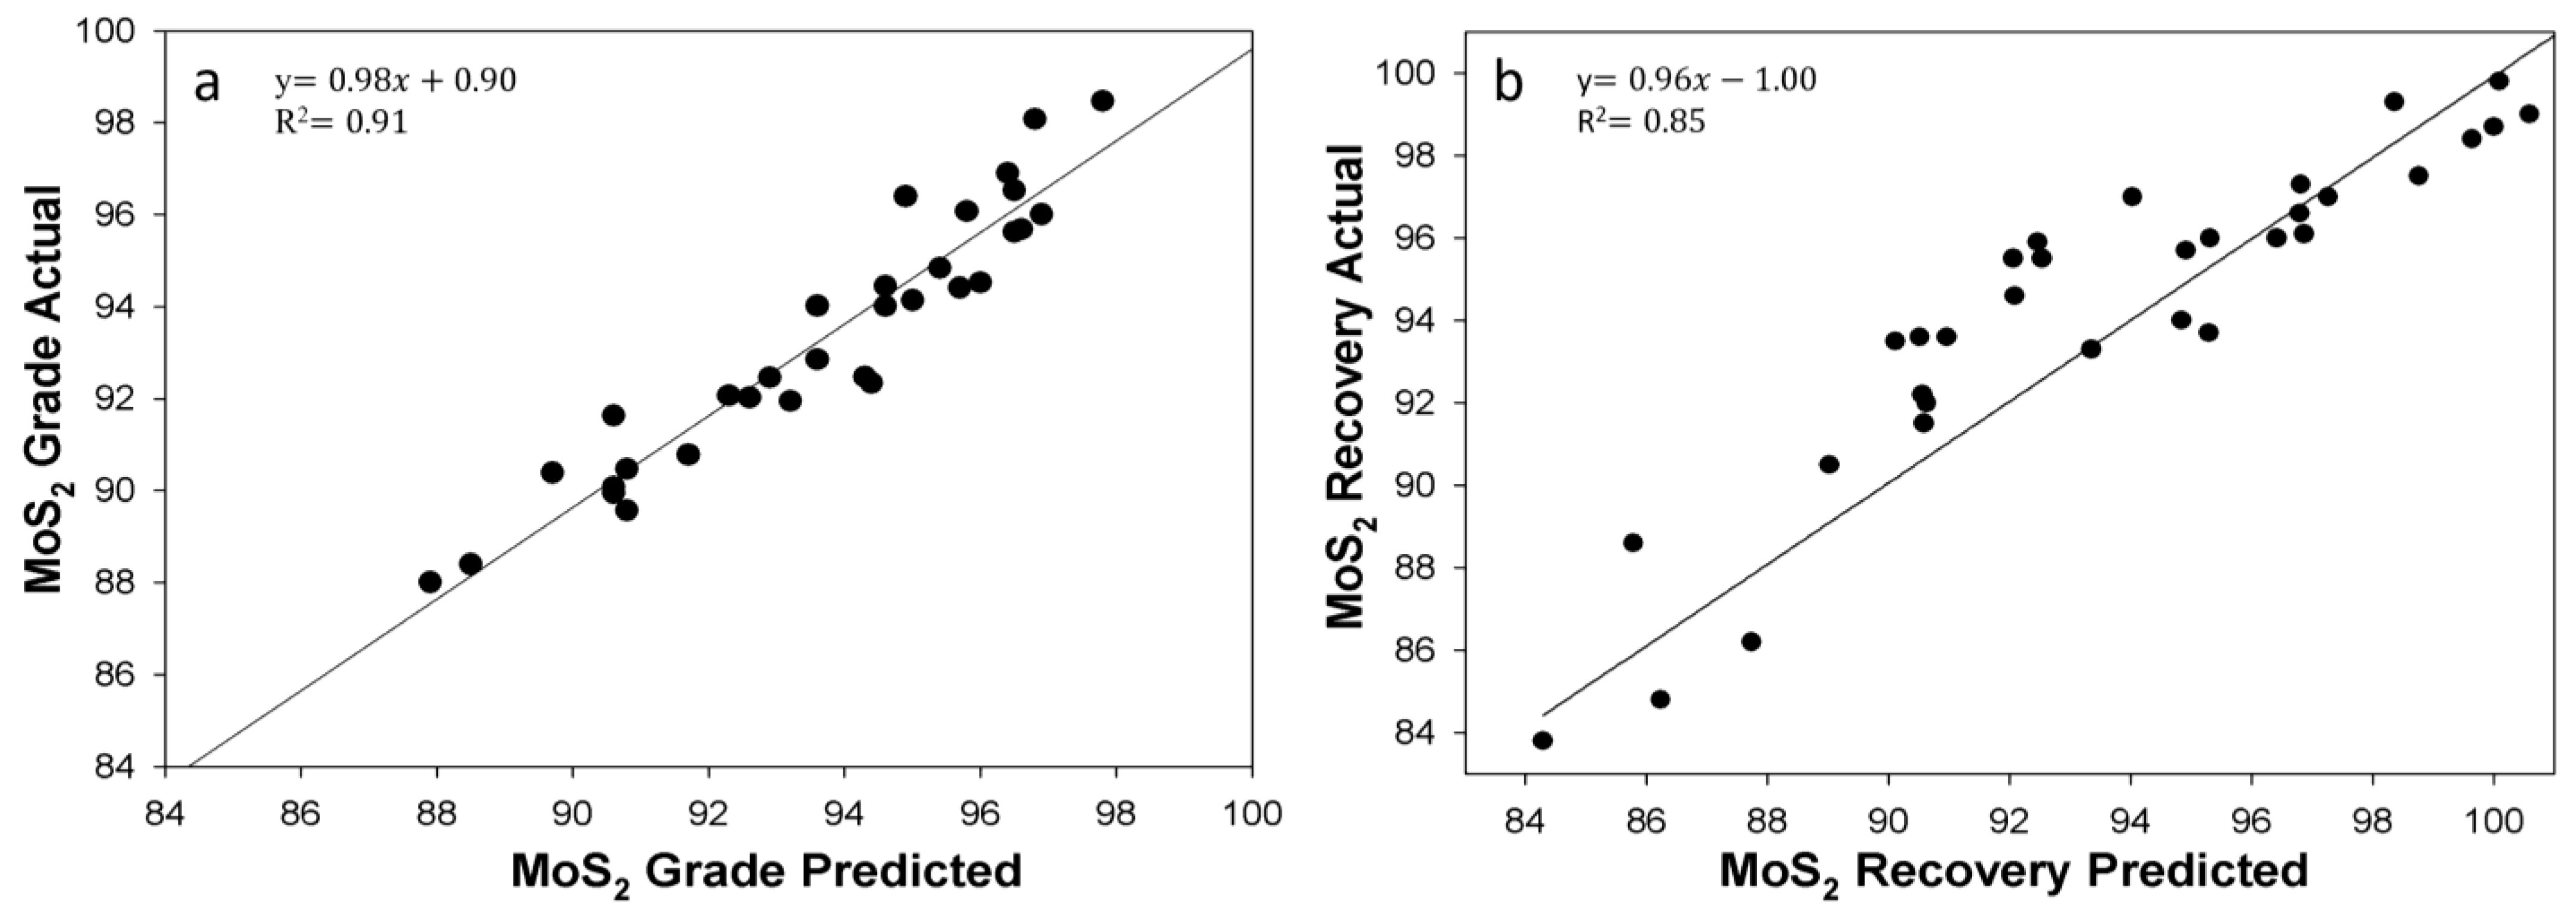
The relationship between actual and predicted values is shown in Figure 7. The model equation for predicting the MoS2 grade and recovery was derived by performing multiple regression analysis on the experimental data using a full factorial design. Equations (1) and (2) for the MoS2 concentrate represent the G (MoS2 grade) and R (MoS2 recovery), respectively, with coefficients of determination (R2) of 0.85 and 0.91 for grade and recovery, respectively. In the model equation, a negative sign (−) indicates an antagonistic effect, whereas a positive sign (+) indicates a synergistic effect. In addition, a large constant value of the factor coefficient in the model equation suggests a greater impact on the grade and recovery.
The empirical models for MoS2 concentrate grade and recovery in column flotation are expressed as follows:
G = 98.10 + 0.05A + 0.021B + 1.096C − 7.037E − 0.027AE + 3.945CE
R = 96.13 + 0.016A − 0.041B − 15.70C − 0.025D + 2.43E − 0.055BC + 0.001BD + 0.092CD
where G is the MoS2 grade (%), R is the MoS2 recovery (%), A is the particle size (µm), B is the depressant dosage (g/ton), C is the superficial wash water velocity (cm/s), D is the frother concentration (ppm), and E is the superficial gas velocity (cm/s). As shown in Figure 7, the MoS2 grade and recovery predicted by the multiple regression model under optimal conditions were 96.91% and 94.91%, respectively. Based on this study, further research on variable optimization and gas dispersion characteristics is required to enhance the efficiency of column flotation.
To validate the optimization model, confirmation experiments were conducted under the predicted optimal conditions. The comparison between the experimental results and the predicted values is summarized in Table 6. The measured MoS2 grade and recovery were 96.40% and 95.70%, respectively. These values demonstrate excellent agreement with the predicted values, with relative errors of less than 1% (0.53% for grade and 0.83% for recovery), thereby confirming the high reliability and predictive accuracy of the developed regression models.
Further experimental studies regarding the fundamental gas dispersion characteristics, such as bubble diameter and gas holdup, are underway to complement the current empirical results.

4. Conclusions

In this study, a full factorial design was utilized to evaluate flotation parameters, and regression models were developed to optimize the influencing variables and predict MoS2 grade and recovery.
  • The MoS2 grade of the CFC sample and average particle size (D50) used in this study were 88% and 149 μm, respectively. As a result of the reground time, the particle size (D50) decreased from 87 μm to 37.5 μm after 10 min and 20 min, respectively, due to improved liberation.
  • For single variables, the MoS2 grade was influenced by the particle size, depressant dosage, superficial wash water velocity, and superficial gas velocity. MoS2 recovery was influenced by the particle size, depressant dosage, superficial wash water velocity, superficial gas velocity, and frother concentration. All identified variables exhibited p-values < 0.05, confirming their statistical significance.
  • In the analysis of two-variable combinations, the simplified interaction model revealed that the MoS2 grade was most critically affected by the interactions of particle size and superficial gas velocity (AE) and superficial wash water velocity and superficial gas velocity (CE). Regarding recovery, the interactions of depressant dosage with superficial wash water velocity (BC), depressant dosage with frother concentration (BD), and superficial wash water velocity with frother concentration (CD) were identified as the most significant factors. Therefore, it can be concluded that optimizing these interacting variables is crucial for producing a high-grade MoS2 concentrate.
  • Empirical model regression Equations (1) and (2) were developed to predict the grade and recovery of the MoS2 concentrate using multiple regression analysis of the full factorial design experimental data. Under the predicted optimal conditions, the MoS2 grade and recovery rate were 96.91% and 94.91%, respectively.

Supplementary Materials

The following supporting information can be downloaded at: https://www.mdpi.com/article/10.3390/min16020192/s1, Figure S1: X-ray diffraction pattern of the CFC sample; Figure S2: Residual plots for the MoS2 grade; Figure S3: Residual plots for the MoS2 recovery.

Author Contributions

O.P.: writing—original draft, formal analysis, and investigation; C.-H.P.: writing—original draft, writing—review and editing, conceptualization, and methodology. All authors have read and agreed to the published version of the manuscript.

Funding

This study was supported by research fund from Chosun University, 2025.

Data Availability Statement

All data generated or analyzed during this study are included in this published article.

Conflicts of Interest

The authors declare no conflicts of interest.

References

  1. Vazirisereshk, M.R.; Martini, A.; Strubbe, D.A.; Baykara, M.Z. Solid lubrication with MoS2: A review. Lubricants 2019, 7, 57. [Google Scholar] [CrossRef] [Scilit]
  2. Kang, J.X.; Li, X.K. Thoughts on the development of molybdenum beneficiation technology. IOP Conf. Ser. Earth Environ. Sci. 2021, 647, 012001. [Google Scholar] [CrossRef] [Scilit]
  3. Dorfler, R.; Laferty, J. Review of molybdenum recovery processes. JOM 1981, 33, 48–55. [Google Scholar] [CrossRef] [Scilit]
  4. Yi, G.; Macha, E.; van Dyke, J.; Macha, R.E.; McKay, T.; Free, M.L. Recent progress on research of molybdenite flotation: A review. Adv. Colloid Interface Sci. 2021, 295, 102466. [Google Scholar] [CrossRef] [Scilit]
  5. Miki, H.; Hirajima, T.; Muta, Y.; Suyantara, G.P.W.; Sasaki, K. Effect of Sodium Sulfite on Floatability of Chalcopyrite and Molybdenite. Minerals 2018, 8, 172. [Google Scholar] [CrossRef] [Scilit]
  6. Yin, Z.; Sun, W.; Liu, J.; Hu, Y.; Guan, Q.; Zhang, C.; Tang, H.; Guan, C. Investigation into the flotation response of refractory molybdenum ore to depressant mixtures: A case study. Int. J. Min. Sci. Technol. 2016, 26, 1089–1094. [Google Scholar] [CrossRef] [Scilit]
  7. Aydin, S.B.; Gul, A. Optimization of flotation parameters for benefication of a molybdenum ore. Physicochem. Probl. Miner. Process. 2017, 53, 524–540. [Google Scholar]
  8. Ludington, S.; Plumlee, G.S. Climax-Type Porphyry Molybdenum Deposits; Scientific Investigations Report 2010–5070-J.; U.S. Geological Survey: Reston, VA, USA, 2009. [CrossRef] [Scilit]
  9. Yin, W.-Z.; Zhang, L.-R.; Feng, X. Flotation of Xinhua molybdenite using sodium sulfide as modifier. Trans. Nonferrous Met. Soc. China 2010, 20, 702–706. [Google Scholar] [CrossRef] [Scilit]
  10. Du, S.; Luo, Z. Flotation technology of refractory low-grade molybdenum ore. Int. J. Min. Sci. Technol. 2013, 23, 255–260. [Google Scholar] [CrossRef] [Scilit]
  11. Yianatos, J.B. Column Flotation Modelling and Technology; University of Concepcion: Concepcion, Chile, 1989. [Google Scholar]
  12. Sastri, S.R.S. Column Flotation: Theory and Practice; Trans Tech Publications: Clausthal-Zellerfeld, Germany, 1998. [Google Scholar]
  13. Tsave, P.K.; Kostoglou, M.; Lazaridis, N.K.; Karapantsios, T.D. Hydrodynamic Study of a Hybrid Electro-Flotation Column. Minerals 2024, 14, 344. [Google Scholar] [CrossRef] [Scilit]
  14. Choung, J.; Luttrell, G.; Yoon, R. Characterization of operating parameters in the cleaning zone of microbubble column flotation. Int. J. Min. Process. 1993, 39, 31–40. [Google Scholar] [CrossRef] [Scilit]
  15. Santana, R.C.; Farnese, A.C.; Fortes, M.C.; Ataíde, C.H.; Barrozo, M.A. Influence of particle size and reagent dosage on the performance of apatite flotation. Sep. Purif. Technol. 2008, 64, 8–15. [Google Scholar] [CrossRef] [Scilit]
  16. Bu, X.; Zhang, T.; Chen, Y.; Peng, Y.; Xie, G.; Wu, E. Comparison of mechanical flotation cell and cyclonic microbubble flotation column in terms of separation performance for fine graphite. Physicochem. Probl. Miner. Process. 2018, 54, 732–740. [Google Scholar]
  17. Abdel-Khalek, N.A. Factorial design for column flotation of phosphate wastes. Part. Sci. Technol. 2000, 18, 57–70. [Google Scholar] [CrossRef] [Scilit]
  18. Hacifazlioglu, H.; Sutcu, H. Optimization of some parameters in column flotation and a comparison of conventional cell and column cell in terms of flotation performance. J. Chin. Inst. Chem. Eng. 2007, 38, 287–293. [Google Scholar] [CrossRef] [Scilit]
  19. Bedekovic, G. A study of the effect of operating parameters in column flotation using experimental design. Physicochem. Probl. Miner. Process. 2016, 52, 523–535. [Google Scholar]
  20. Montgomery, D.C. Design and Analysis of Experiments, 9th ed.; John Wiley & Sons: New York, NY, USA, 2017. [Google Scholar]
  21. Badri, R.; Khanchi, A.; Rahmani, A. Optimization of molybdenite flotation using response surface method. Min. Miner. Depos. 2018, 12, 12–18. [Google Scholar] [CrossRef] [Scilit]
  22. Sobhy, A.; Yehia, A.; Hosiny, F.E.; Ibrahim, S.; Amin, R. Statistical analysis of Egyptian oil shale column flotation. Int. J. Coal Prep. Util. 2022, 42, 524–535. [Google Scholar] [CrossRef] [Scilit]
  23. Bahrami, A.; Ghorbani, Y.; Hosseini, M.R.; Kazemi, F.; Abdollahi, M.; Danesh, A. Combined effect of operating parameters on separation efficiency and kinetics of copper flotation. Min. Metall. Explor. 2019, 36, 409–421. [Google Scholar] [CrossRef] [Scilit]
  24. Martínez-L, A.; Ortiz, J. Study of celestite flotation efficiency using sodium dodecyl sulfonate collector: Factorial experiment and statistical analysis of data. Int. J. Min. Process. 2003, 70, 83–97. [Google Scholar] [CrossRef] [Scilit]
  25. Espinosa-Gomez, R.; Finch, J.A.; Yianatos, J.B.; Dobby, G.S. Effect of column height on flotation column performance. Min. Metall. Explor. 1988, 5, 11–14. [Google Scholar]
  26. Sarhan, A.R.; Azizli, S.N.; Ghani, N.S.; Gill, C.K.S.; Hussin, M.Z.J. Optimization of column flotation design and operating parameters for copper-molybdenum sulfide ore. J. Mater. Res. Technol. 2017, 6, 271–278. [Google Scholar]
  27. Yoon, R.H.; Soni, G.; Huang, K.; Park, S.; Pan, L. Development of a turbulent flotation model from first principles and its validation. Int. J. Min. Process. 2016, 156, 43–51. [Google Scholar] [CrossRef] [Scilit]
  28. Tao, D. Role of bubble size in flotation of coarse and fine particles—A review. Sep. Sci. Technol. 2005, 39, 741–760. [Google Scholar] [CrossRef] [Scilit]
  29. Achaye, I.; Wiese, J.; McFadzean, B. Effect of mineral particle size on froth stability. Miner. Process. Extr. Metall. Trans. Inst. Min. Metall. 2021, 130, 253–261. [Google Scholar] [CrossRef] [Scilit]
  30. Xu, M.; Finch, J.A.; Uribe-Salas, A. Maximum gas and bubble surface rates in flotation columns. Int. J. Min. Process. 1991, 32, 213–222. [Google Scholar] [CrossRef] [Scilit]
  31. Reis, A.S.; Reis Filho, A.M.; Demuxer, L.R.; Barrozo, M.A.S. Effect of bubble size on the performance flotation of fine particles of a low-grade Brazilian apatite ore. Powder Technol. 2019, 356, 884–891. [Google Scholar] [CrossRef] [Scilit]
  32. Bulatovic, S.M. Handbook of Flotation Reagents: Chemistry, Theory and Practice; Elsevier: Amsterdam, The Netherlands, 2007. [Google Scholar]
  33. Finch, J.A.; Nesset, J.E.; Acuña, C. Role of frother on bubble production and behaviour in flotation. Miner. Eng. 2008, 21, 949–957. [Google Scholar] [CrossRef] [Scilit]
  34. Goodall, C.M.; O’Connor, C.T. Pulp-froth interactions in a laboratory column flotation cell. Miner. Eng. 1991, 4, 1343–1350. [Google Scholar] [CrossRef] [Scilit]
  35. Finch, J.A.; Dobby, G.S. Column flotation: A selected review. Part I. Int. J. Min. Process. 1991, 33, 103–125. [Google Scholar] [CrossRef] [Scilit]
  36. Bouchard, J.; Desbiens, A.; del Villar, R. Recent advances in bias and froth depth control in flotation columns. Miner. Eng. 2005, 18, 709–720. [Google Scholar] [CrossRef] [Scilit]
  37. Park, C.H.; Jeon, H.S. The effect of sodium silicate as pH modifier and depressant in the froth flotation of molybdenite ores. Mater. Trans. 2010, 51, 1367–1369. [Google Scholar] [CrossRef] [Scilit]
  38. Tanyildizi, M.S.; Özer, D.; Elibol, M. Optimization of α-amylase production by Bacillus sp. using response surface methodology. Process Biochem. 2005, 40, 2291–2296. [Google Scholar] [CrossRef] [Scilit]
  39. Vazifeh, Y.; Jorjani, E.; Bagherian, A. Optimization of reagent dosages for copper flotation using statistical technique. Trans. Nonferrous Met. Soc. China 2010, 20, 2371–2378. [Google Scholar] [CrossRef] [Scilit]
  40. Azizi, A.; Masdarian, M.; Hassanzadeh, A.; Bahri, Z.; Niedoba, T.; Surowiak, A. Parametric optimization in rougher flotation performance of a sulfidized mixed copper ore. Minerals 2020, 10, 660. [Google Scholar] [CrossRef] [Scilit]
  41. Sobota, I.; Bedeković, G. The Effect of Operating Variables on the Performance of Column Flotation of Silica Sand. Minerals 2024, 14, 341. [Google Scholar] [CrossRef] [Scilit]
Figure 1. Schematic of the flow sheet (Hollow circles: air bubbles; Arrows: flow direction).
Minerals 16 00192 g001
Figure 2. Comparison of cumulative particle size distributions by regrinding time for CFC.
Minerals 16 00192 g002
Figure 3. BSE-EDS analysis of samples reground for (a) 0 min (CFC), (b) 10 min, and (c) 20 min, (Mb: Molybdenite, Gm: Gangue mineral, NL: Non-liberation).
Minerals 16 00192 g003
Figure 4. Effect of main variables on MoS2 grade and recovery: (a) particle size; (b) superficial gas velocity; (c) frother concentration; (d) superficial wash water velocity; and (e) depressant dosage.
Minerals 16 00192 g004
Figure 5. Contour plot between column flotation variables for MoS2 grade: (a) particle size and superficial gas velocity; (b) depressant dosage and superficial wash water velocity; (c) superficial wash water velocity and frother concentration; (d) frother concentration and superficial gas velocity; (e) superficial wash water velocity and superficial gas velocity; and (f) depressant dosage and frother concentration. The color gradient indicates the MoS2 grade, ranging from blue (low) to red (high).
Minerals 16 00192 g005
Figure 6. Contour plot between column flotation variables for MoS2 recovery: (a) particle size and superficial gas velocity; (b) depressant dosage and superficial wash water velocity; (c) superficial wash water velocity and frother concentration; (d) frother concentration and superficial gas velocity; (e) superficial wash water velocity and superficial gas velocity; and (f) depressant dosage and frother concentration. The color gradient indicates the MoS2 recovery, ranging from blue (low) to red (high).
Minerals 16 00192 g006
Figure 7. Relationship between actual and predicted MoS2 grade (a) and recovery (b).
Minerals 16 00192 g007
Table 1. Comparison of MoS2 flotation performance with previous studies.
StudyProcess TypeOre CharacteristicsMoS2
Grade/Recovery
Key Limitation/Feature
Espinosa-Gomez et al. [25]Standard ColumnMixed SulfideG: ~88.0%/R: 85.0%Early-stage column study
Sarhan et al. [26]Optimized ColumnComplex OreG: 92.3%/R: 89.5%Single-variable optimization
Commercial Operations [4] *Conventional CellsMixed/StandardG: 85%–90%/R: ~90%Fine particle entrainment
This StudyOptimized ColumnSingle MoS2G: 96.1%/R: 95.2%Full factorial design and Interaction effect
* Based on operational data from [Climax and Henderson mines].
Table 2. Column flotation parameters for two-level five-factor full factorial design.
Column Flotation ParametersCodeLow Level (−1)High Level (+1)
Particle size (µm)A37.5133
Depressant dosage (g/ton)B20200
Superficial wash water velocity (cm/s) C0.10.6
Frother concentration (ppm)D50150
Superficial gas velocity (cm/s) E0.71.5
Table 3. Chemical composition of CFC sample.
ElementMoS2SiO2CaOFe2O3Al2O3K2OMgOCuOZnO
Content (%)88.604.481.542.170.660.091.790.540.30
Table 4. ANOVA results for MoS2 grade.
No.SourceDegree of FreedomThe Sum of SquareMean Square F-Valuep-Value
1Model31634.6520.4723.66<0.001
2Intercept1548,801.80548,801.80634,224.40<0.001
3A198.0898.08113.35<0.001
4B177.1777.1789.19<0.001
5C137.6137.6143.46<0.001
6D12.632.633.040.09
7E1268.01268.01309.73<0.001
8A * B10.270.270.320.58
9A * C10.030.030.030.86
10A * D12.482.482.860.10
11A * E120.4420.4423.62<0.001
12B * C124.3624.3628.15<0.001
13B * D11.081.081.240.27
14B * E10.680.680.780.38
15C * D13.853.854.450.05
16C * E110.9810.9812.690.001
17D * E118.9718.9721.93<0.001
18Estimated3227.690.87--
R2 = 0.958; adj. R2 = 0.918
Table 5. Results of ANOVA for MoS2 recovery.
No.Source Degree of FreedomThe Sum of SquareMean SquareF-Valuep-Value
1Model311909.31909.330.79<0.01
2Intercept1549,811.10549,811.10274,905.60<0.01
3A135.8535.8517.93<0.01
4B1358.06358.06179.00<0.01
5C1634.40634.40314.20<0.01
6D1299.90299.90149.90<0.01
7E160.6060.6030.30<0.01
8A * B11.171.170.590.45
9A * C10.250.250.120.73
10A * D10.320.320.160.69
11A * E12.122.121.060.31
12B * C198.0698.0649.03<0.01
13B * D1149.88149.8874.94<0.01
14B * E19.669.664.830.05
15C * D180.9680.9640.48<0.01
16C * E11.421.420.710.41
17D * E15.975.972.980.09
18Estimated3264.0064.00--
R2 = 0.993; adj. R2 = 0.987
Table 6. Validation of the predicted optimal conditions for MoS2 grade and recovery.
Response VariablePredicted Value (A)Experimental Value (B)Relative Error (%)
MoS2 Grade (%)96.9196.400.53
MoS2 Recovery (%)94.9195.700.83
Disclaimer/Publisher’s Note: The statements, opinions and data contained in all publications are solely those of the individual author(s) and contributor(s) and not of MDPI and/or the editor(s). MDPI and/or the editor(s) disclaim responsibility for any injury to people or property resulting from any ideas, methods, instructions or products referred to in the content.