Author Contributions
Conceptualization, H.L.; methodology, M.G.; validation, V.M.; formal analysis, S.W.; investigation, H.J. and R.L.; resources, Y.G.; data curation, S.W. and H.J.; writing—original draft preparation, S.W.; writing—review and editing, V.M. and H.L.; visualization, V.M. and R.L.; supervision, H.L.; project administration, M.G. All authors have read and agreed to the published version of the manuscript.
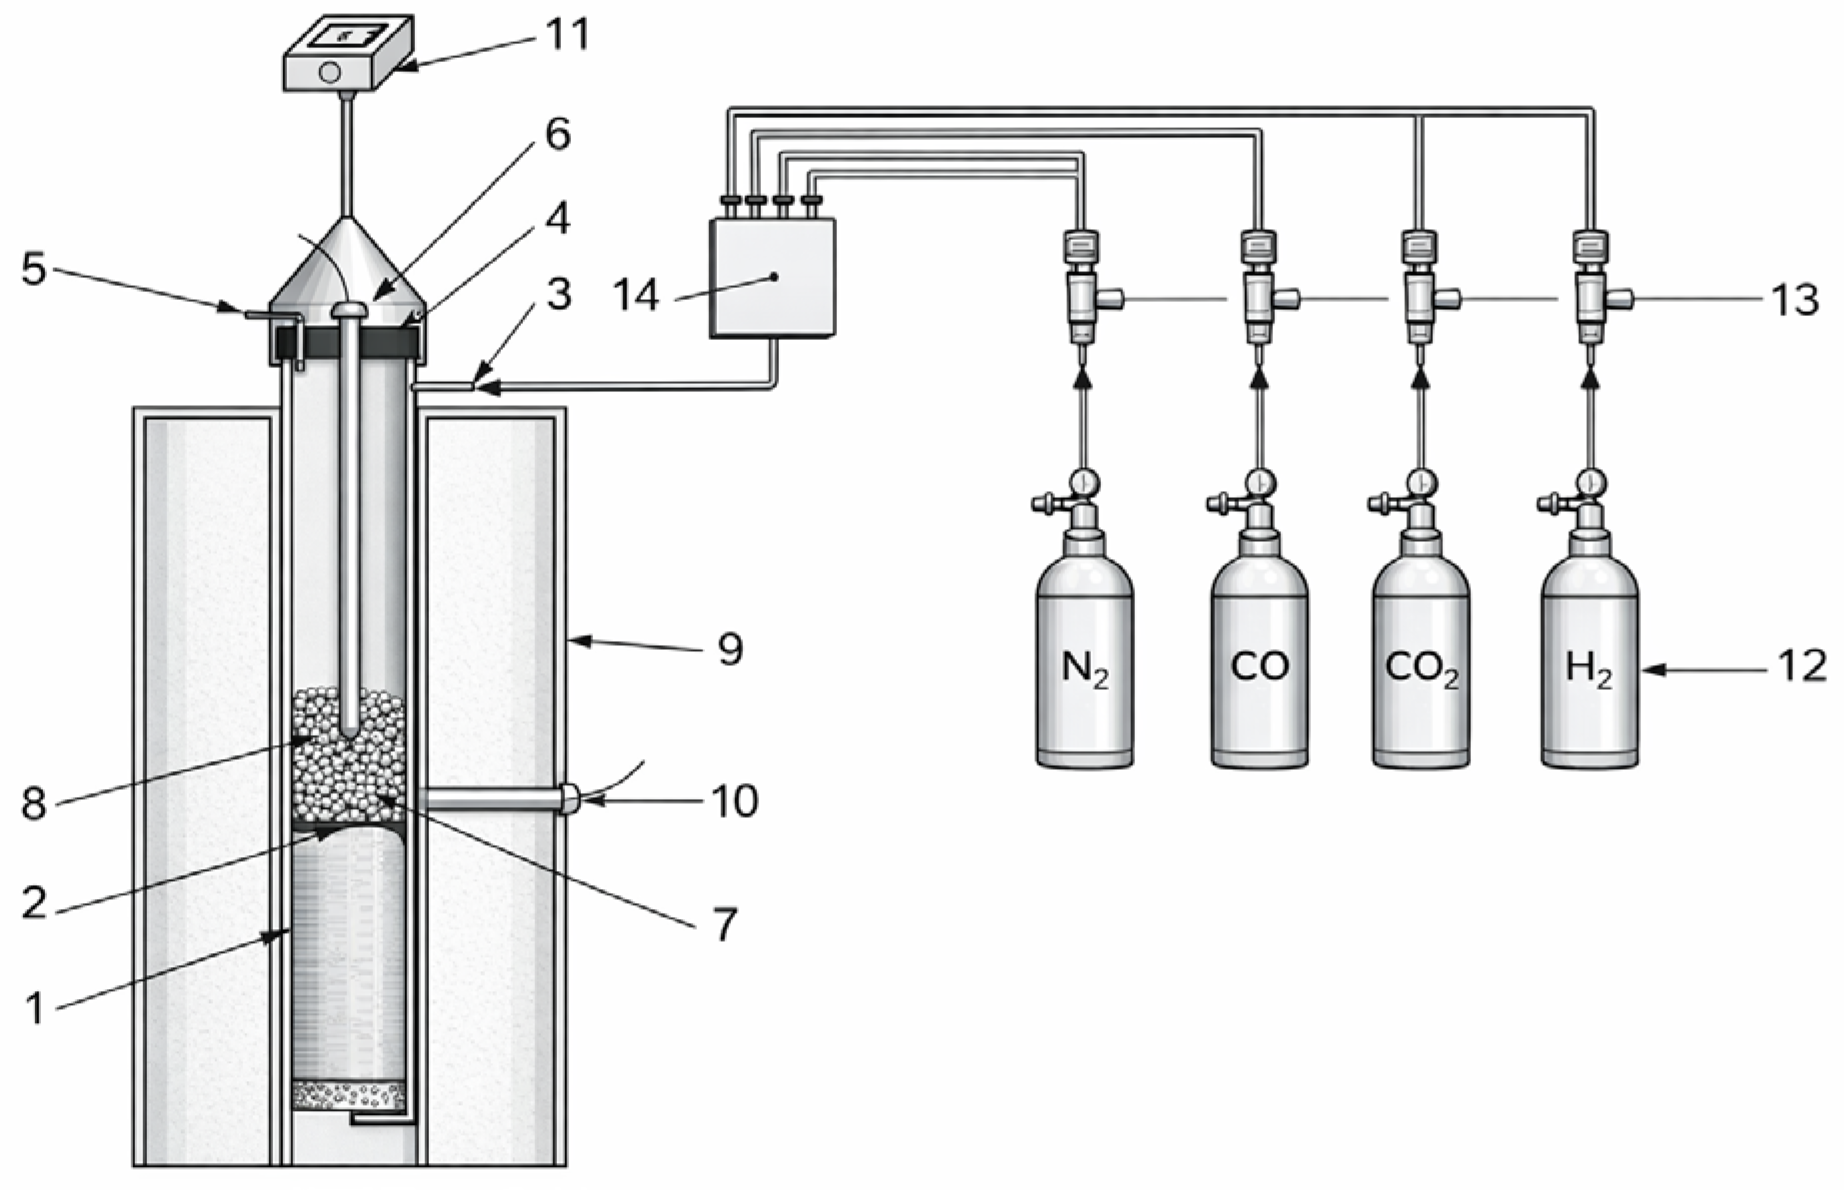
Figure 1.
Schematic of the laboratory hydrogen-based pellet reduction system: (1) thermocouple sheath, (2) pellet bed, (3) gas inlet connector, (4) gas distributor, (5) sealing flange, (6) exhaust outlet, (7) reaction tube, (8) porous support plate, (9) electric furnace, (10) furnace controller, (11) temperature controller, (12) gas cylinders, (13) mass flow controllers, and (14) gas mixing manifold.
Figure 1.
Schematic of the laboratory hydrogen-based pellet reduction system: (1) thermocouple sheath, (2) pellet bed, (3) gas inlet connector, (4) gas distributor, (5) sealing flange, (6) exhaust outlet, (7) reaction tube, (8) porous support plate, (9) electric furnace, (10) furnace controller, (11) temperature controller, (12) gas cylinders, (13) mass flow controllers, and (14) gas mixing manifold.
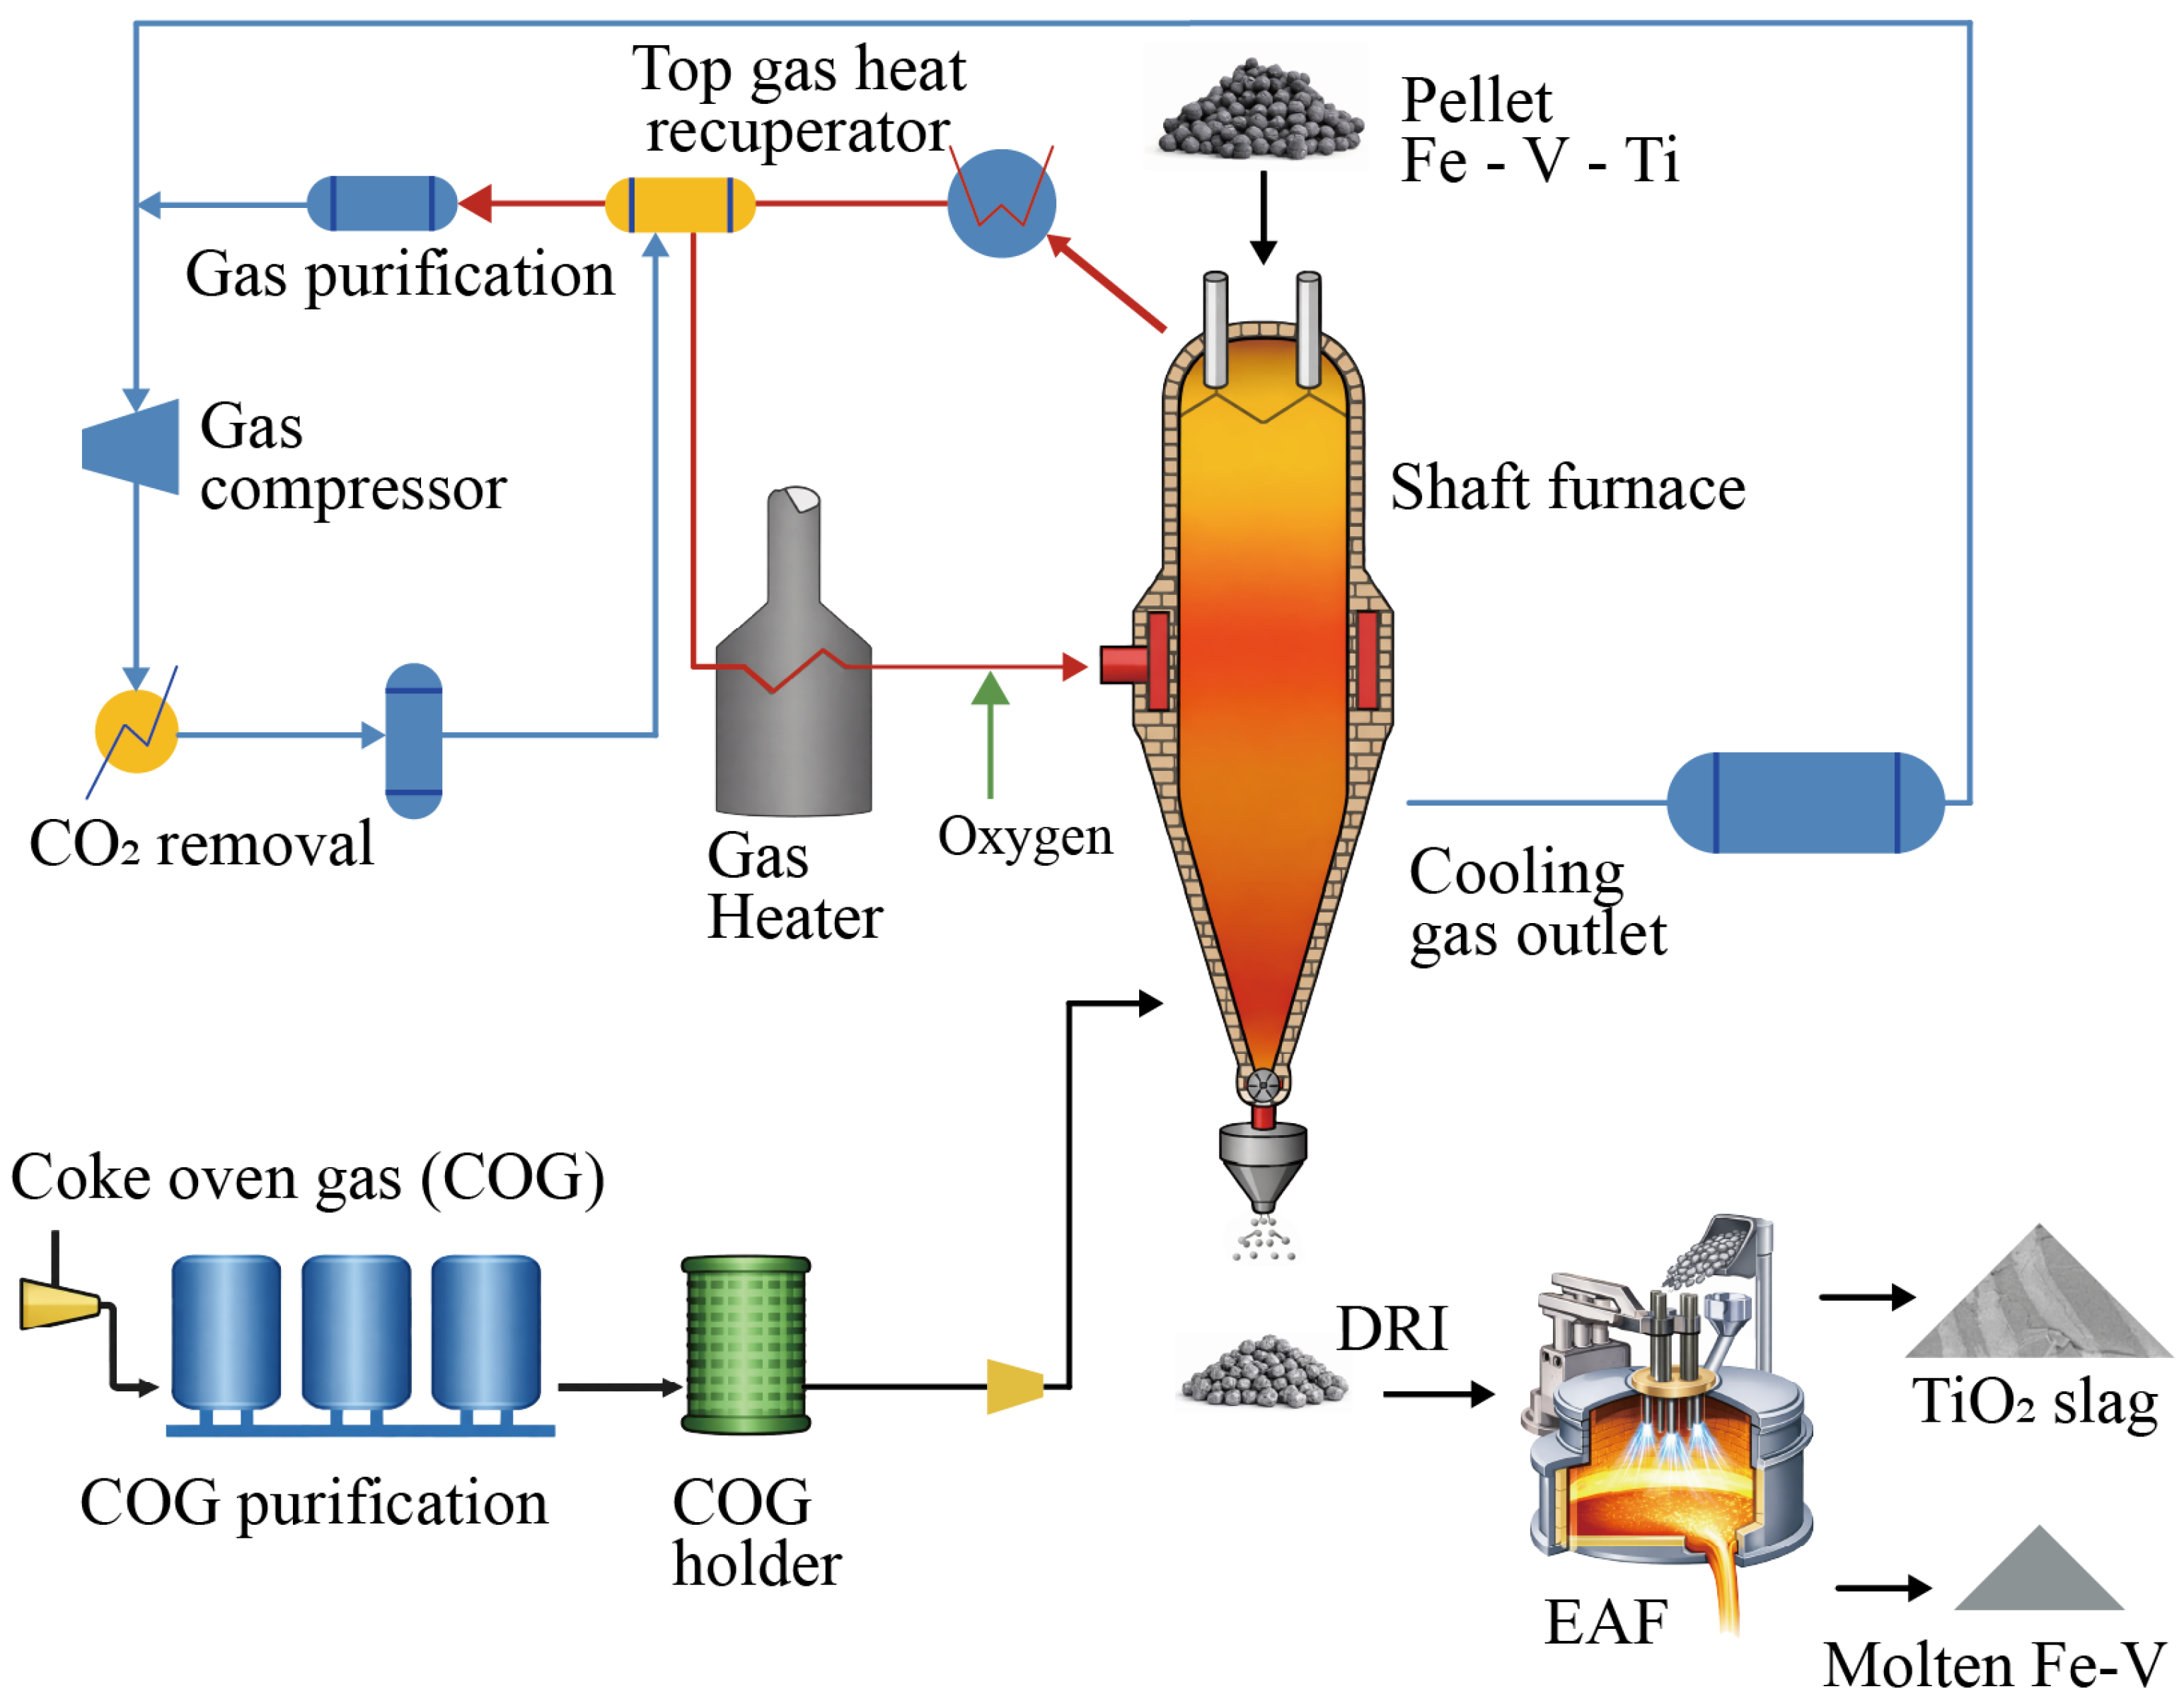
Figure 2.
Schematic flowsheet of a hydrogen-based shaft furnace direct-reduction process with top-gas heat recovery, gas purification and recycling, and downstream EAF steelmaking, illustrating hot and cold DRI production routes.
Figure 2.
Schematic flowsheet of a hydrogen-based shaft furnace direct-reduction process with top-gas heat recovery, gas purification and recycling, and downstream EAF steelmaking, illustrating hot and cold DRI production routes.
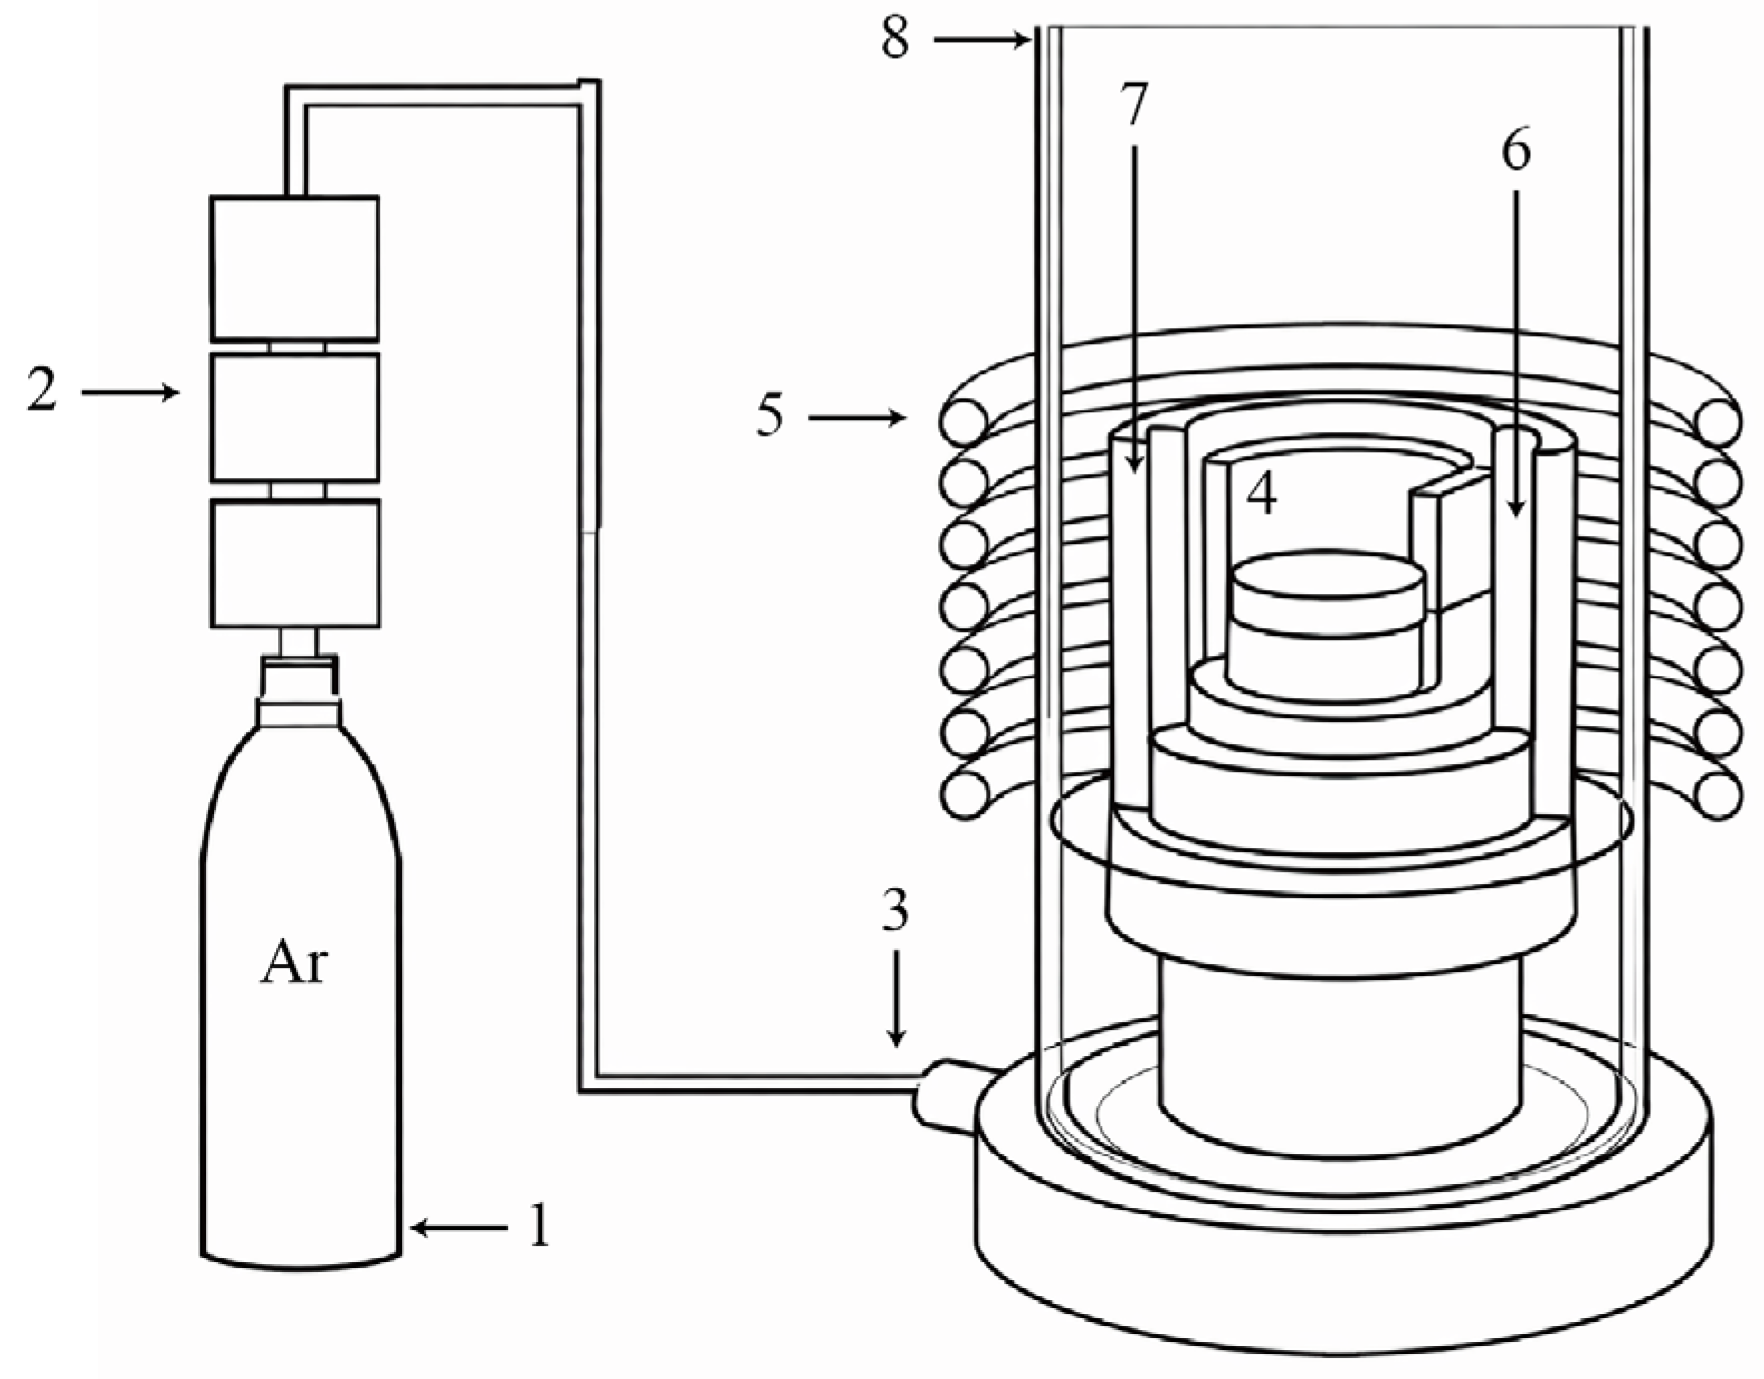
Figure 3.
A schematic illustration of the experimental induction furnace setup, including: (1) Ar cylinder, (2) mass flow controller, (3) gas inlet, (4) graphite crucible, (5) induction coil, (6) thermal insulation layer, (7) furnace chamber, and (8) outer shell.
Figure 3.
A schematic illustration of the experimental induction furnace setup, including: (1) Ar cylinder, (2) mass flow controller, (3) gas inlet, (4) graphite crucible, (5) induction coil, (6) thermal insulation layer, (7) furnace chamber, and (8) outer shell.
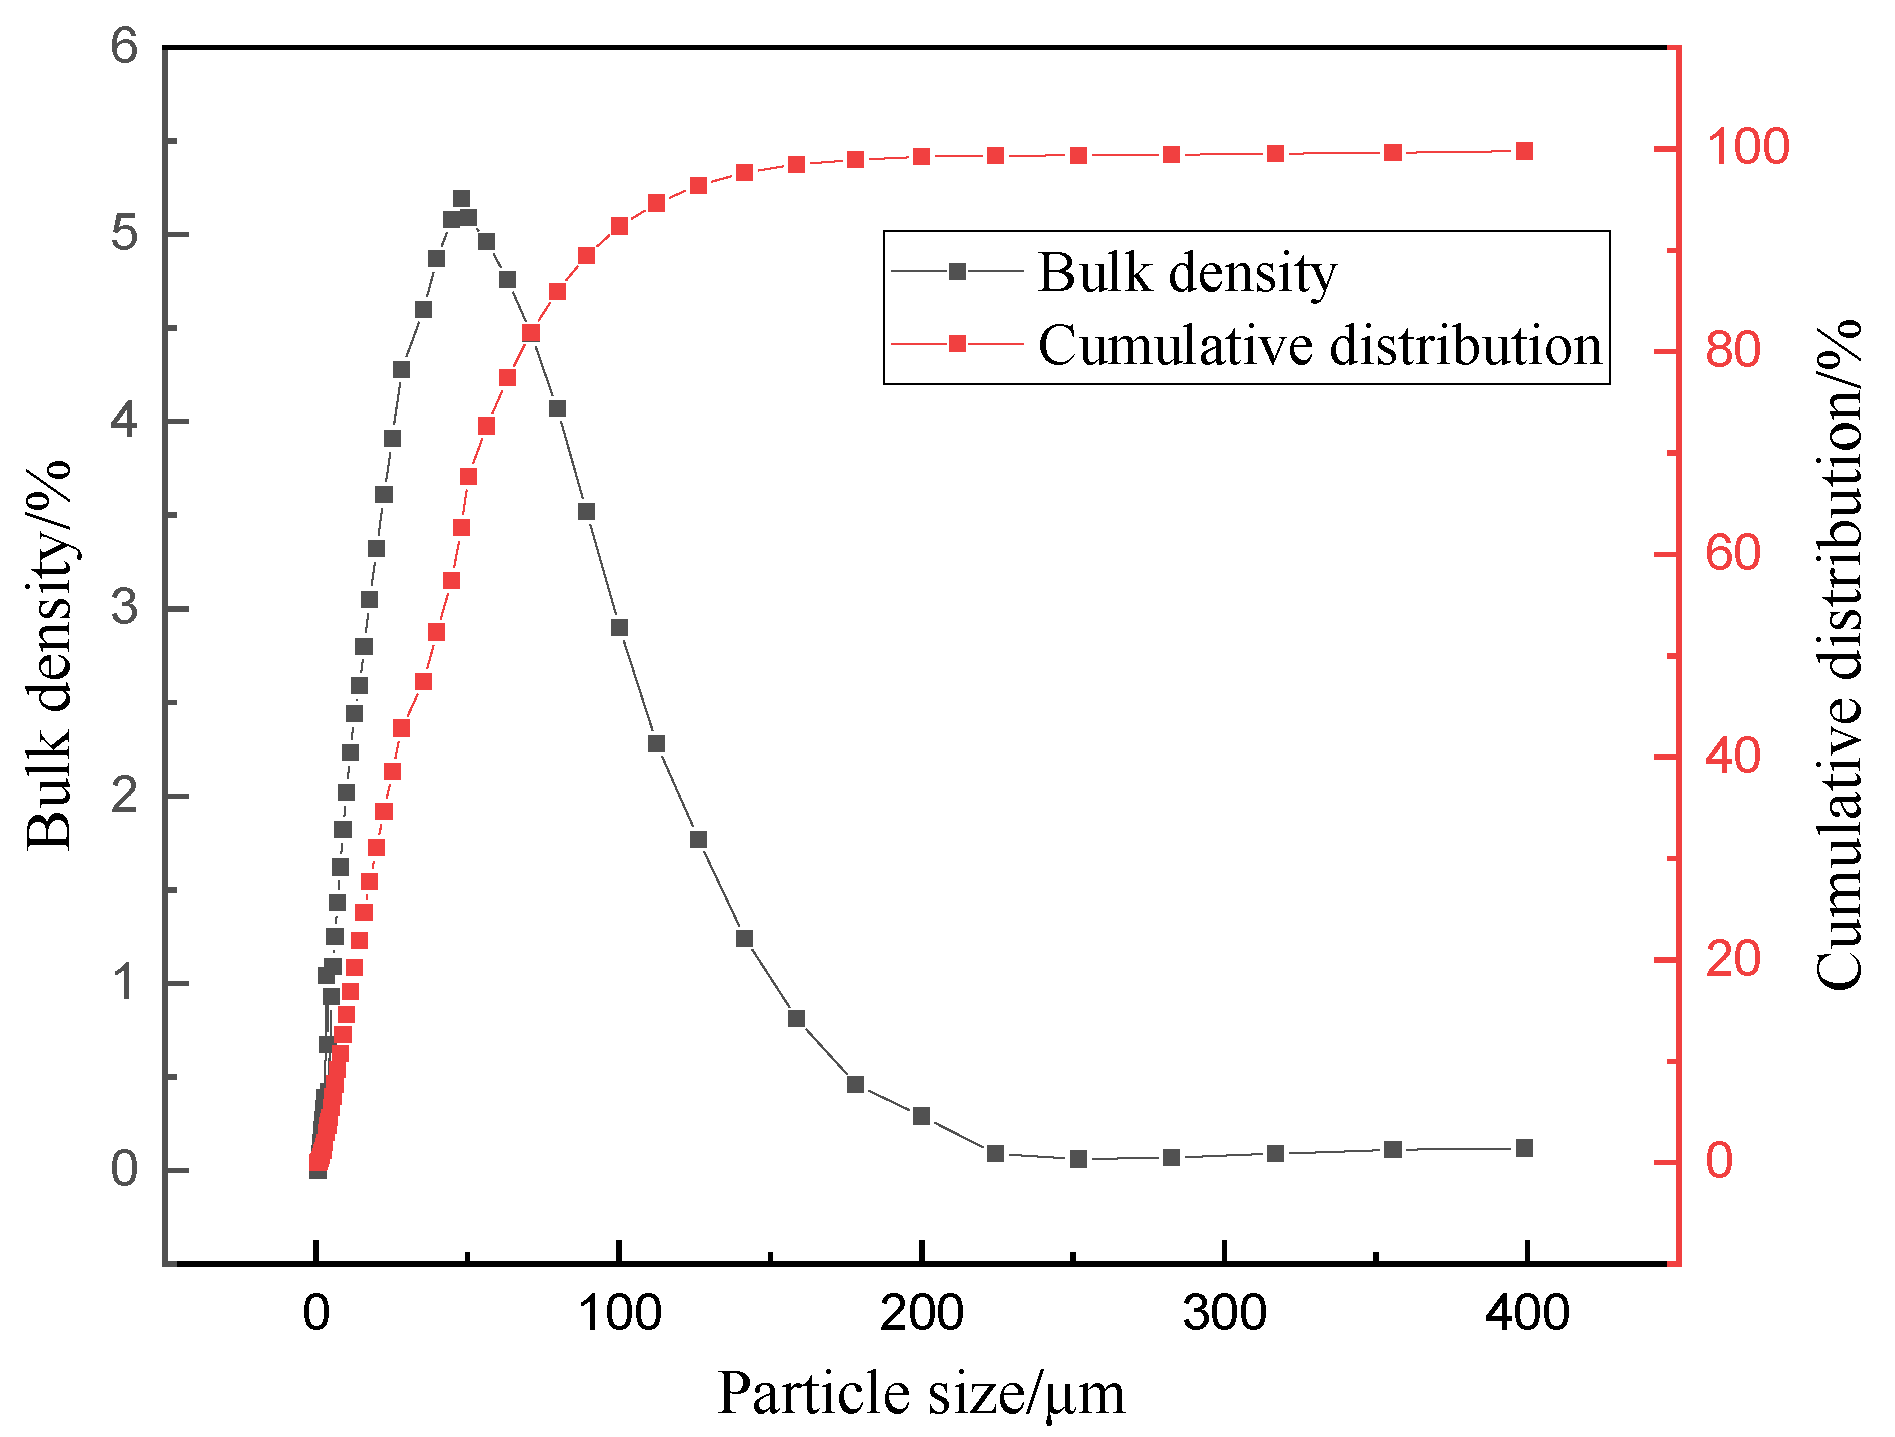
Figure 4.
Particle size distribution of finely ground vanadium–titanium magnetite used for pellet preparation.
Figure 4.
Particle size distribution of finely ground vanadium–titanium magnetite used for pellet preparation.
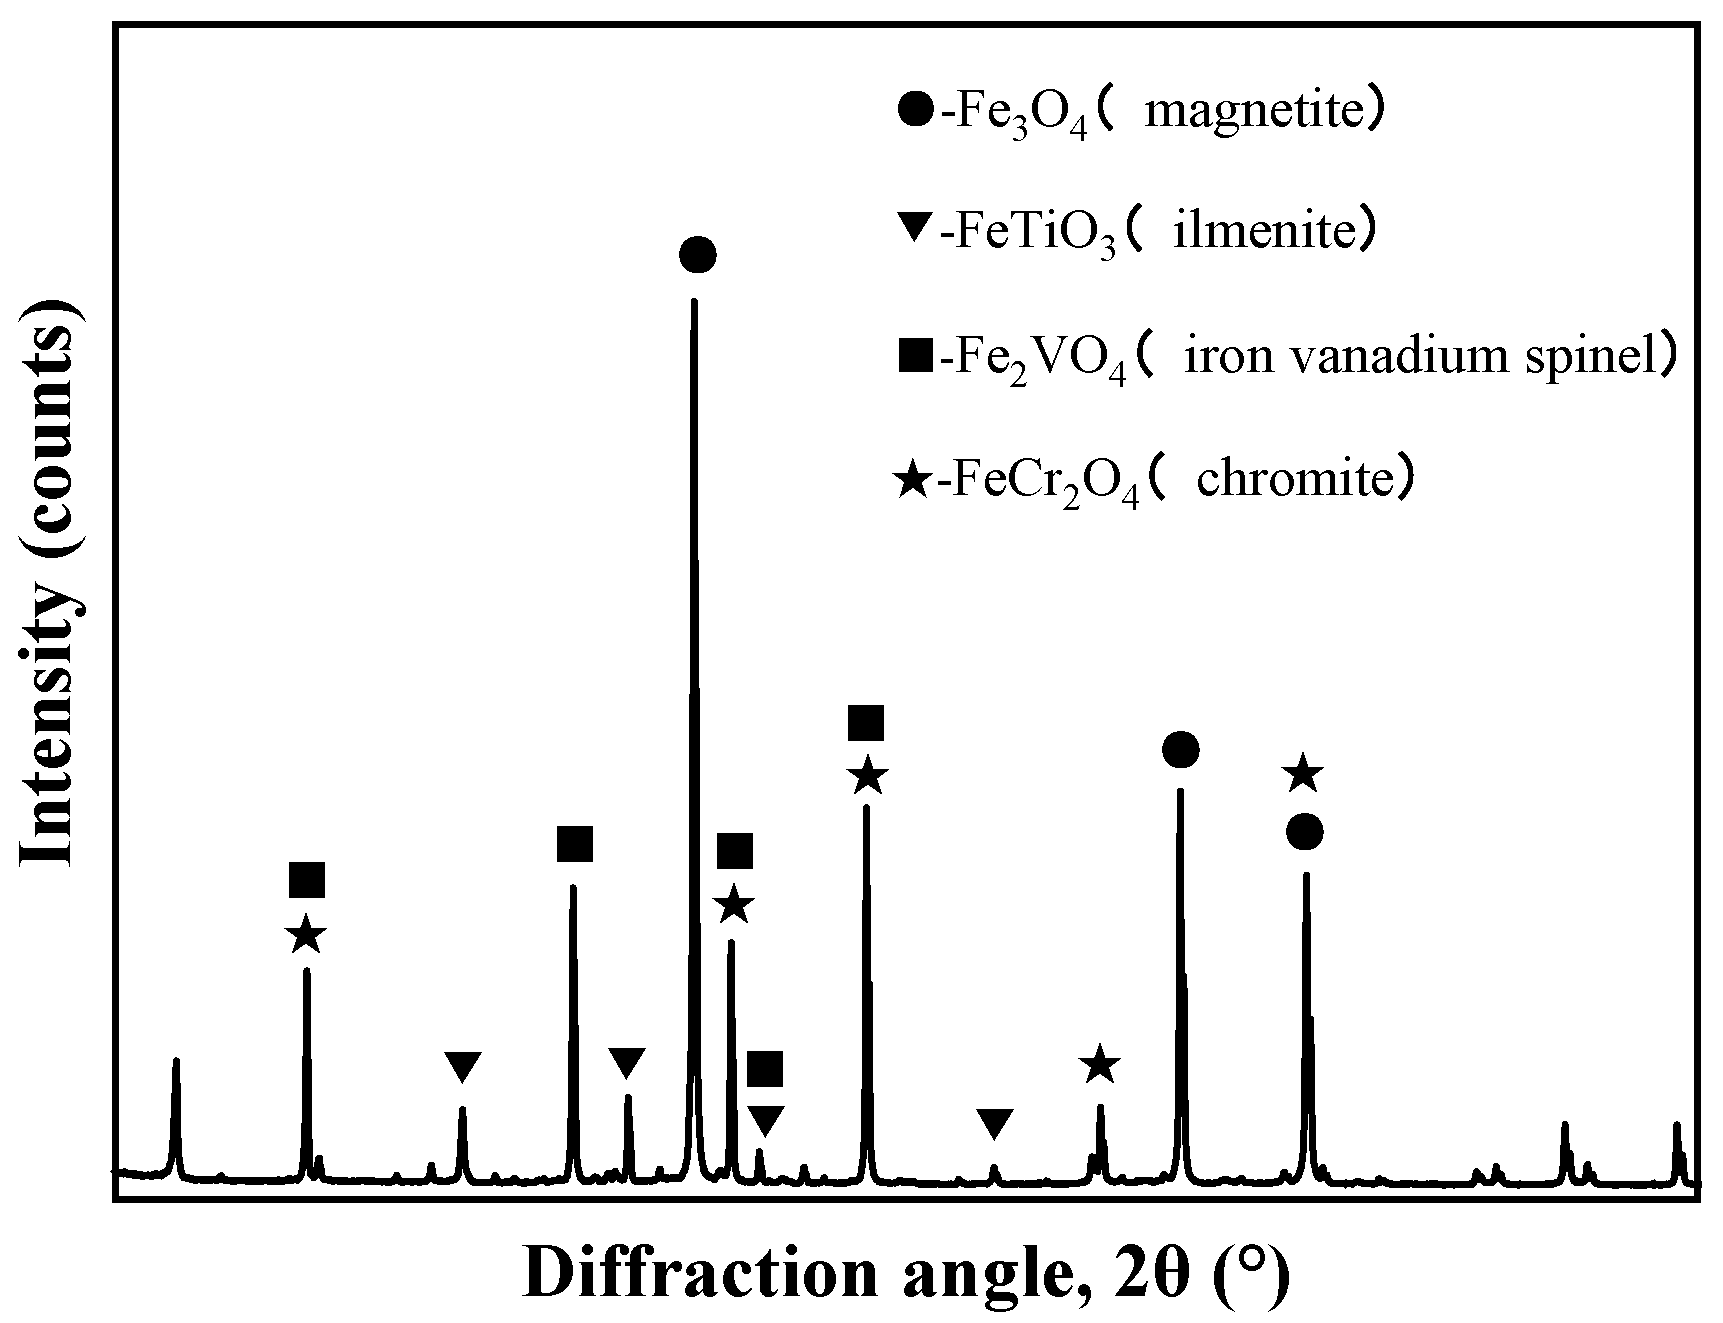
Figure 5.
Phase composition of vanadium-titanium magnetite determined by XRD.
Figure 5.
Phase composition of vanadium-titanium magnetite determined by XRD.
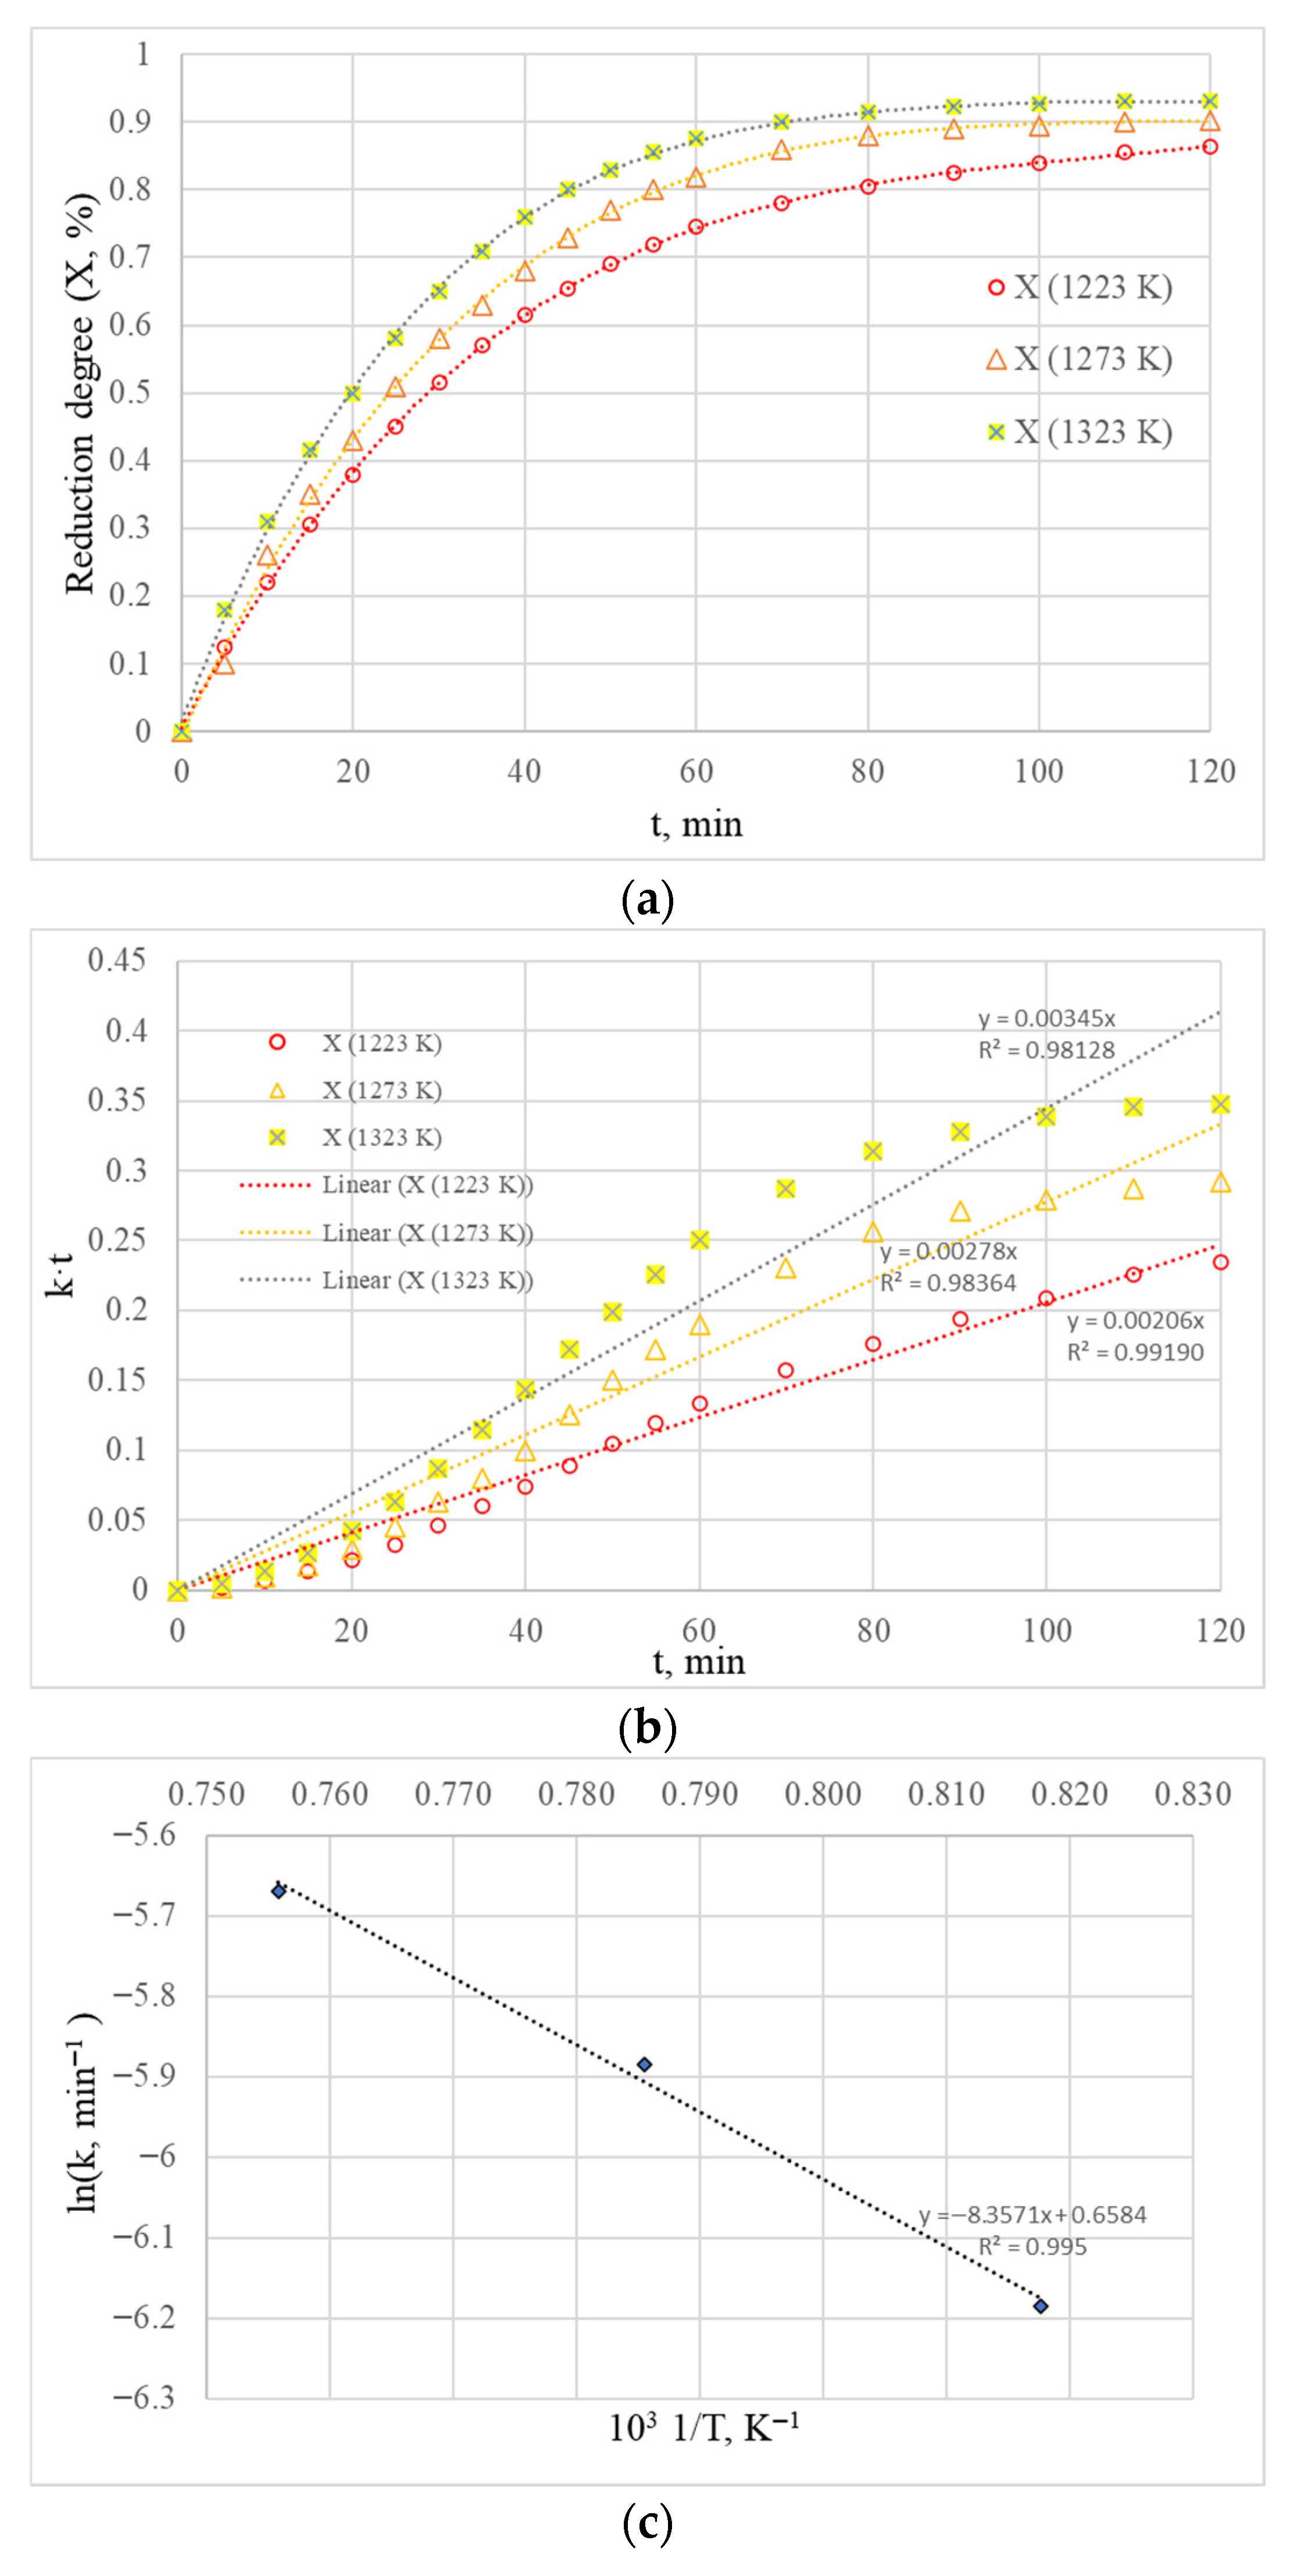
Figure 6.
Kinetic analysis of hydrogen-based reduction of blended vanadium–titanium magnetite pellets: (a) Experimental reduction degree as a function of time at different temperatures; (b) Isothermal kinetic fitting using the D3 diffusion model and determination of apparent rate constants k(T); (c) Arrhenius plot of lnk versus 1/T used to estimate the apparent activation energy Ea.
Figure 6.
Kinetic analysis of hydrogen-based reduction of blended vanadium–titanium magnetite pellets: (a) Experimental reduction degree as a function of time at different temperatures; (b) Isothermal kinetic fitting using the D3 diffusion model and determination of apparent rate constants k(T); (c) Arrhenius plot of lnk versus 1/T used to estimate the apparent activation energy Ea.
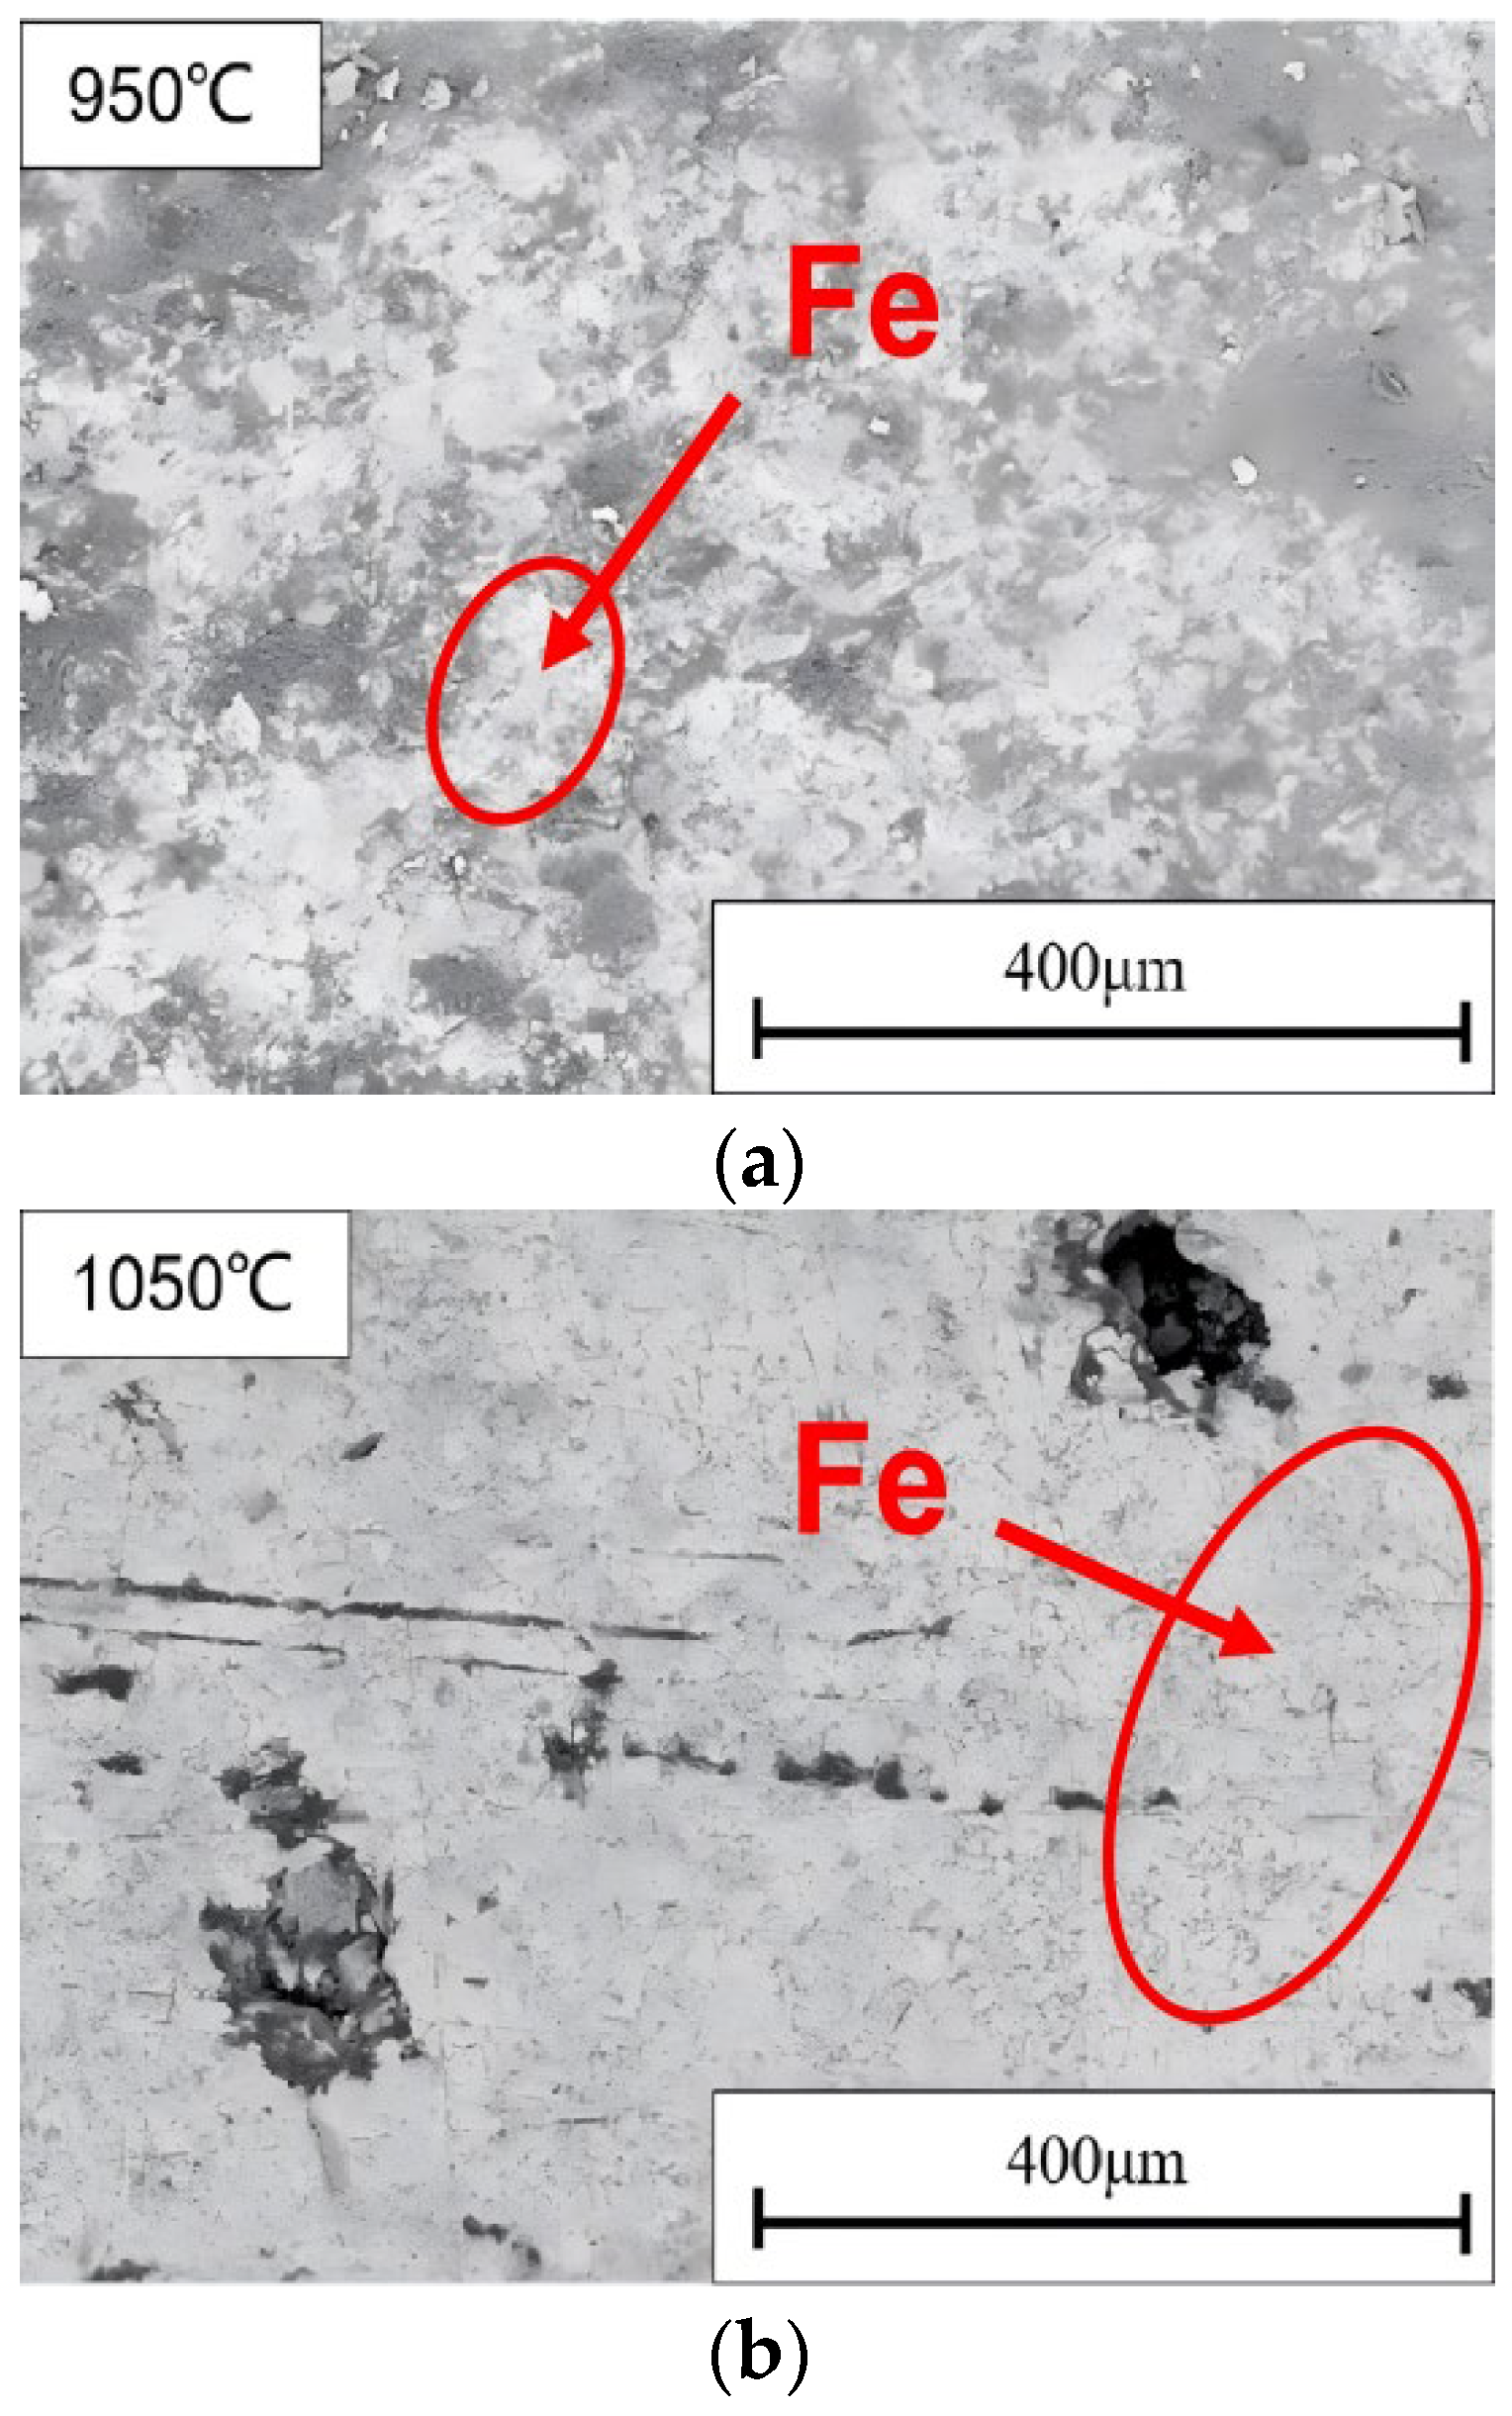
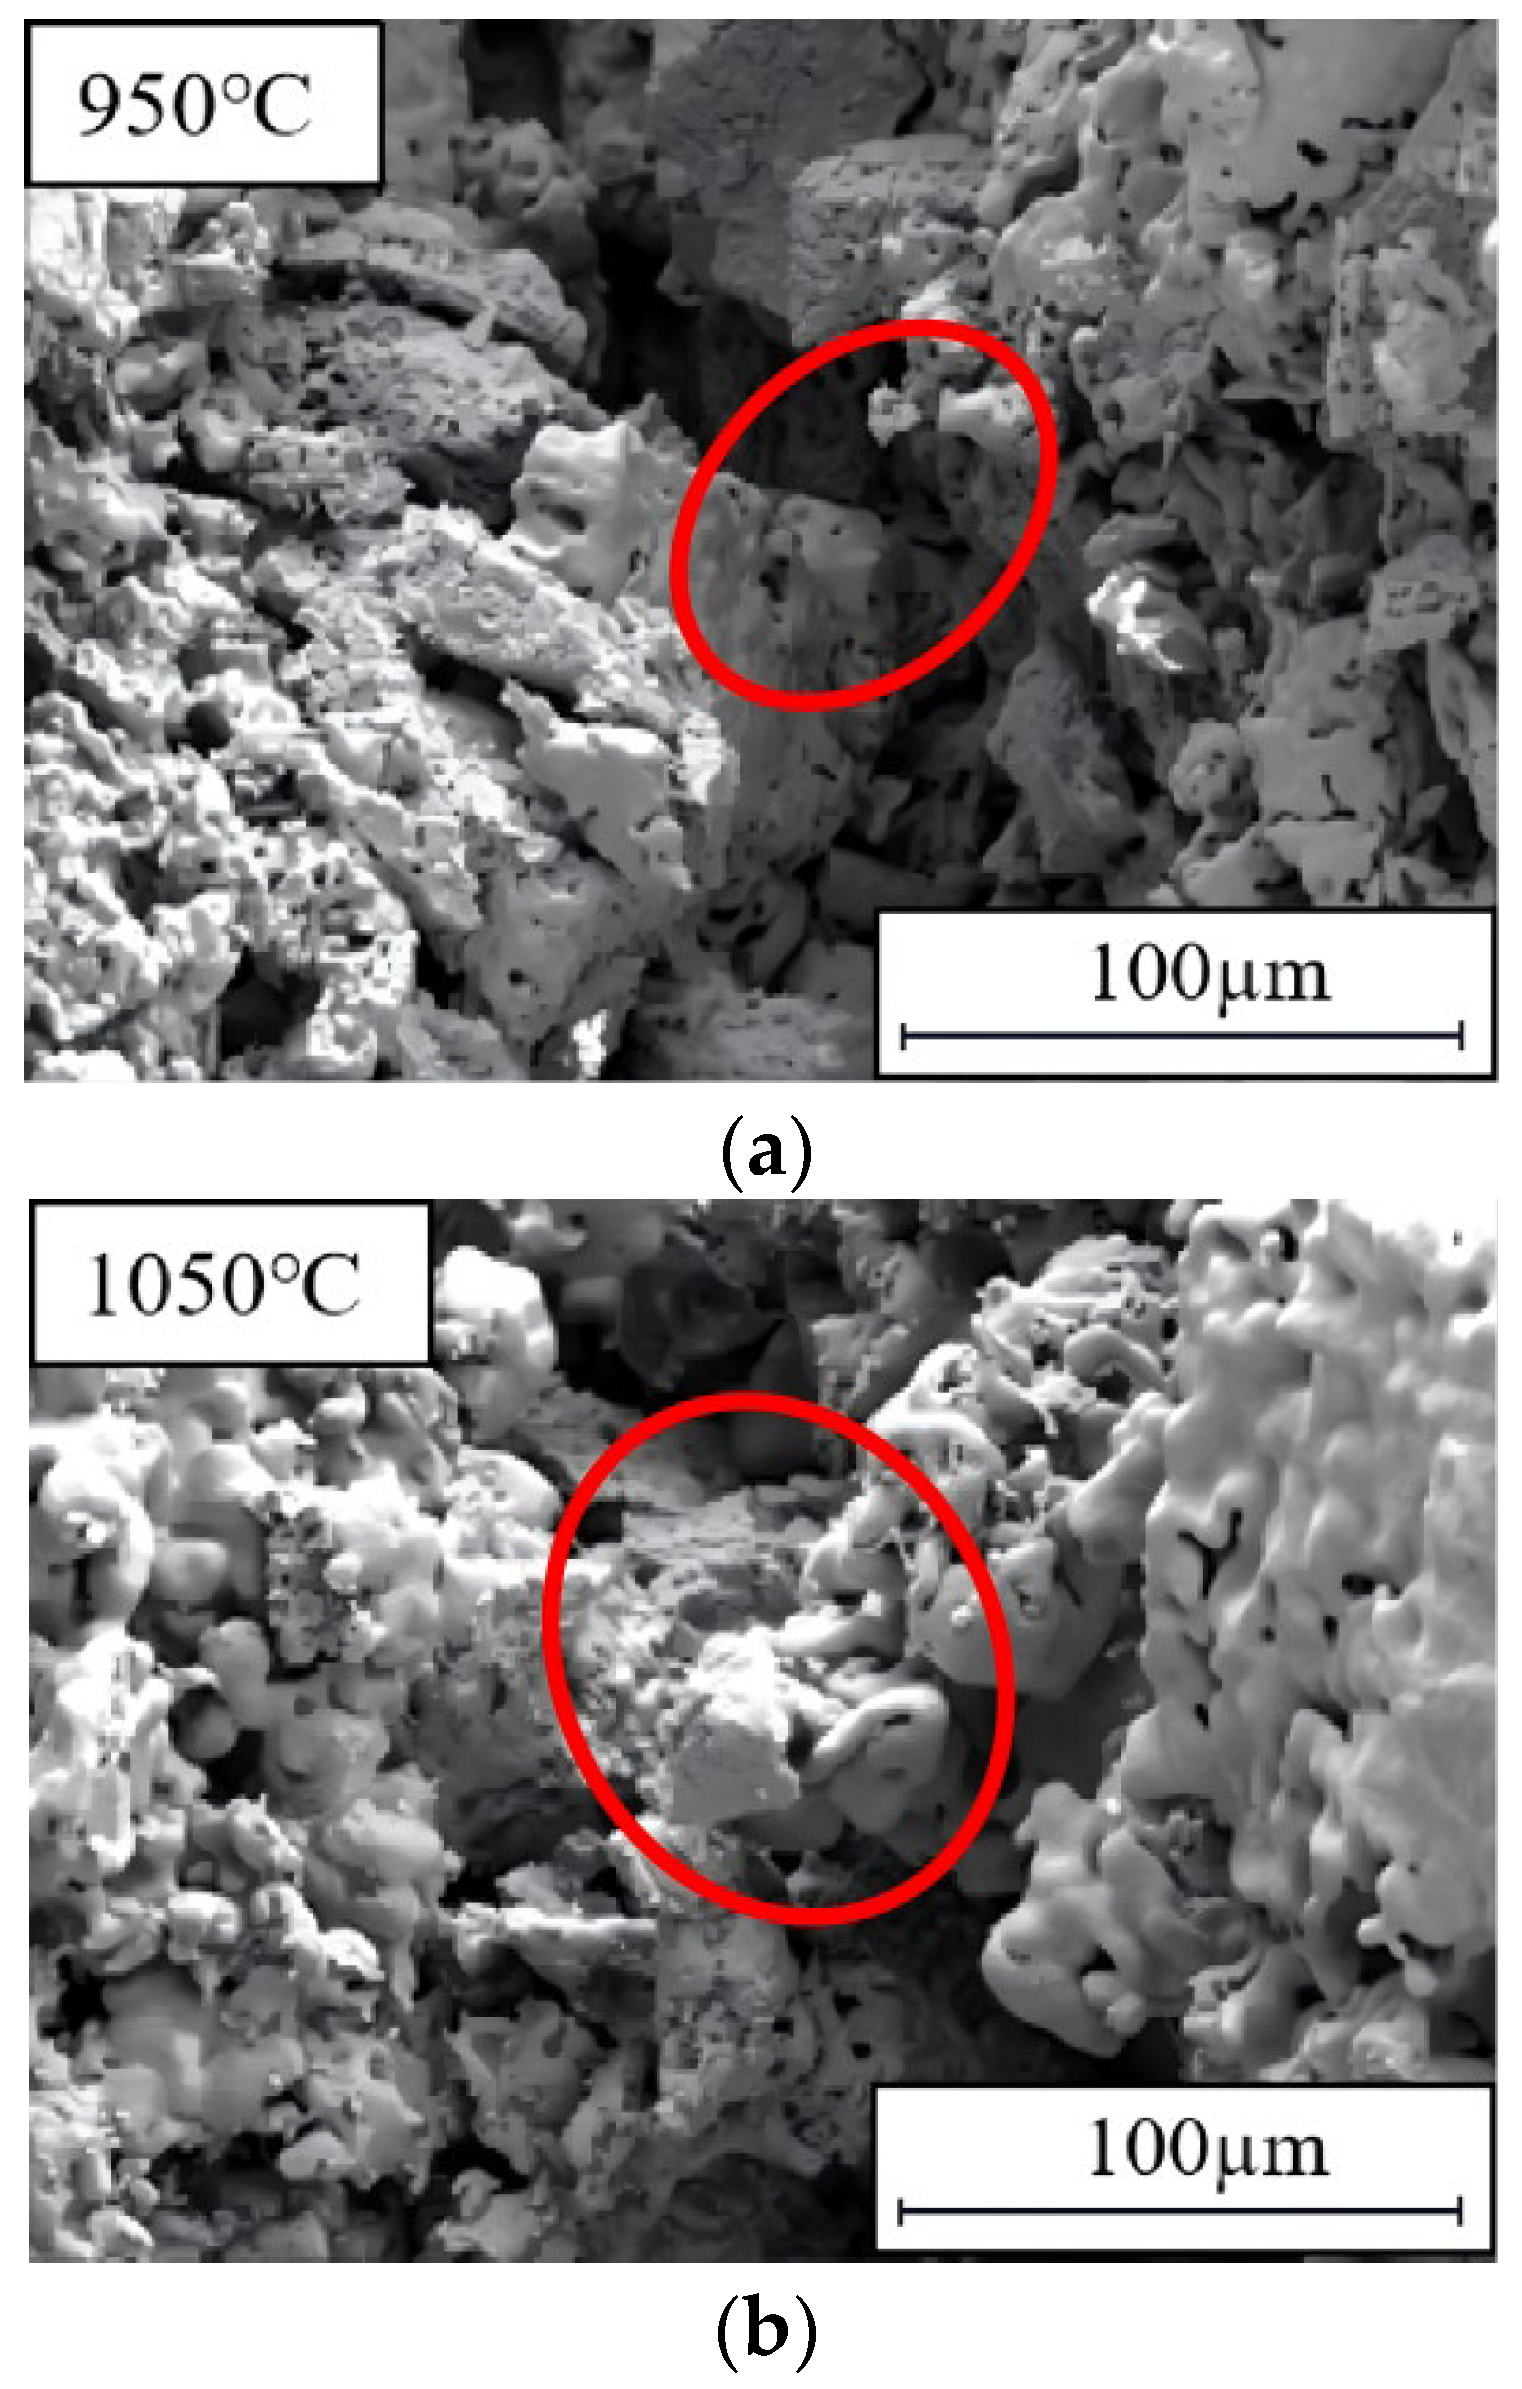
Figure 7.
SEM images showing the formation and growth of metallic iron in blended pellets reduced at (a) 950 °C and (b) 1050 °C, illustrating enhanced iron coalescence with increasing temperature.
Figure 7.
SEM images showing the formation and growth of metallic iron in blended pellets reduced at (a) 950 °C and (b) 1050 °C, illustrating enhanced iron coalescence with increasing temperature.
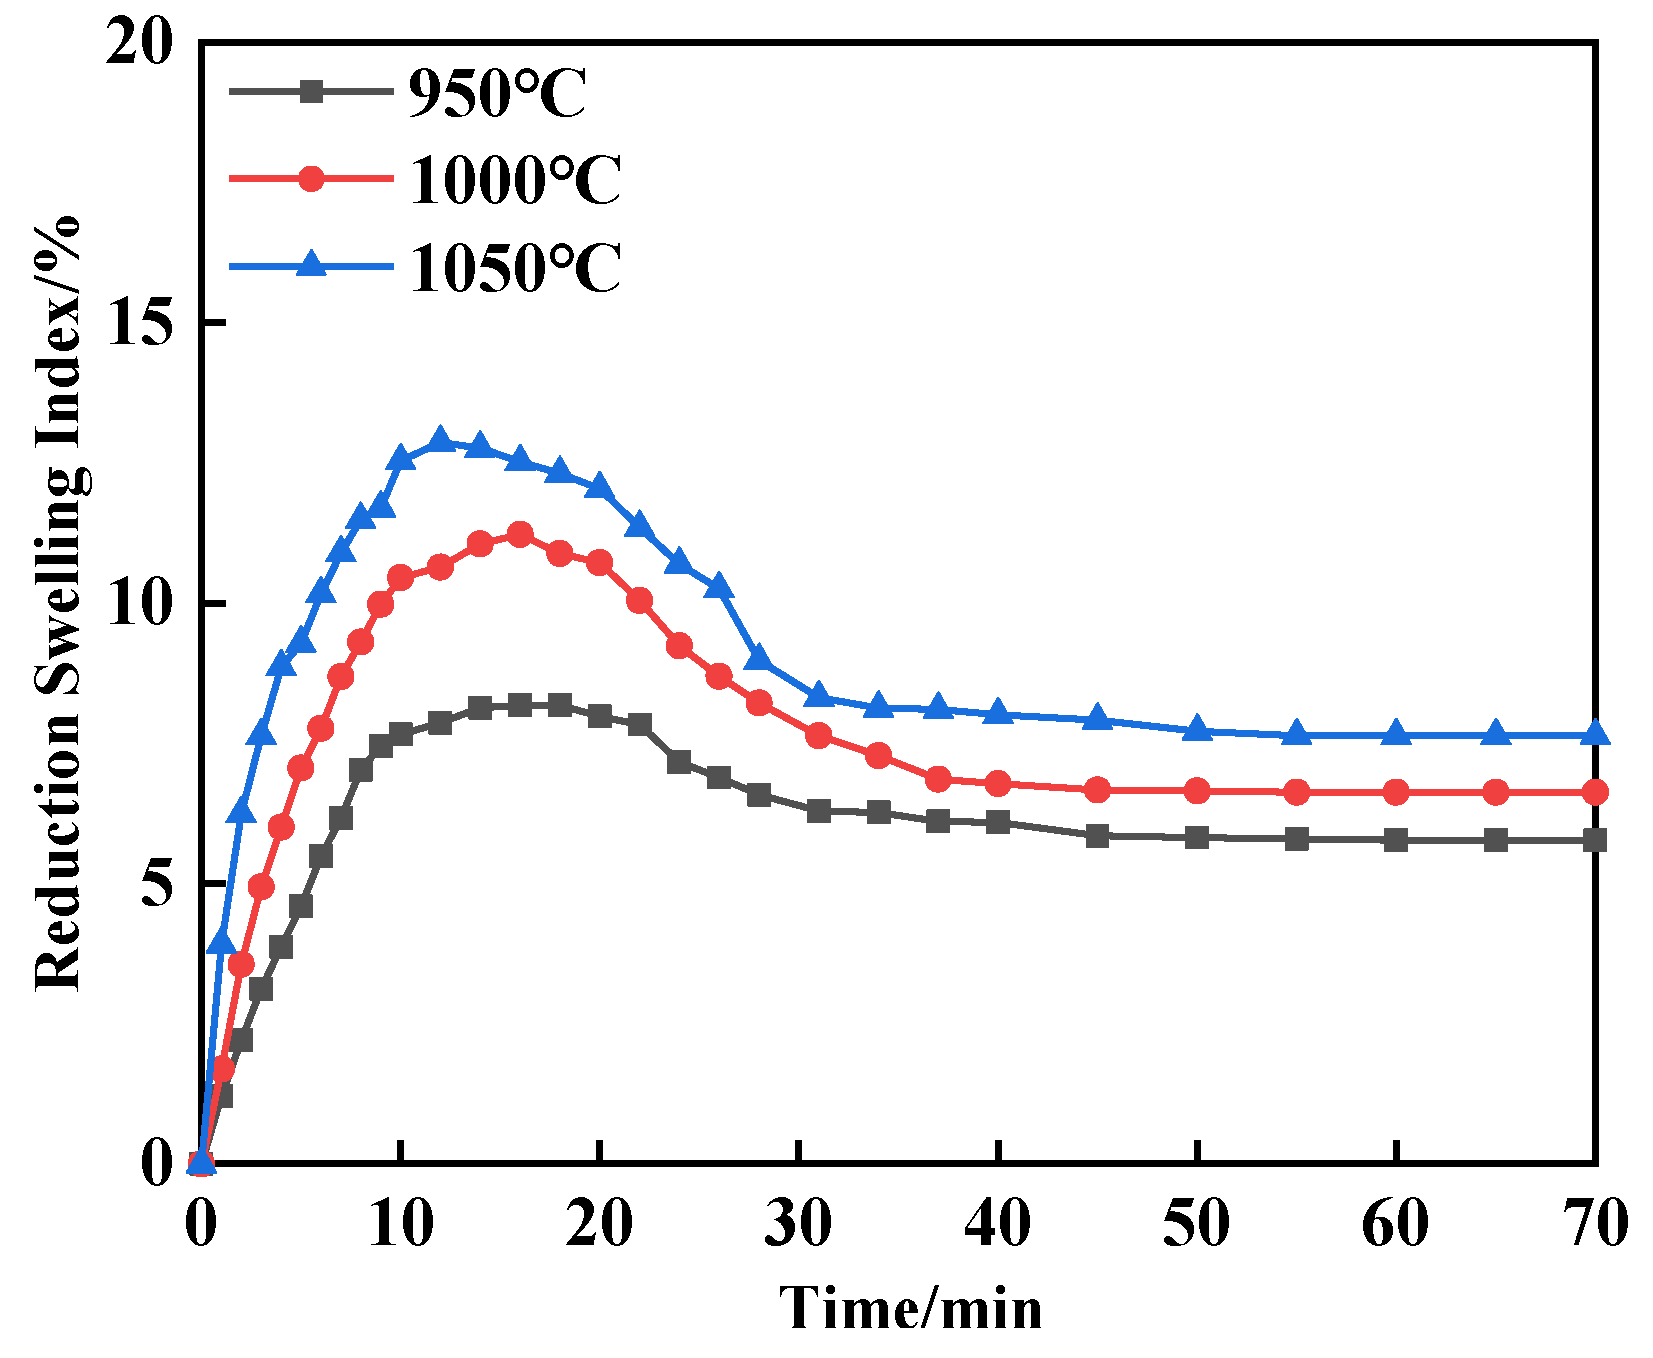
Figure 8.
Reduction swelling behavior of pellets during hydrogen-based reduction at different temperatures.
Figure 8.
Reduction swelling behavior of pellets during hydrogen-based reduction at different temperatures.
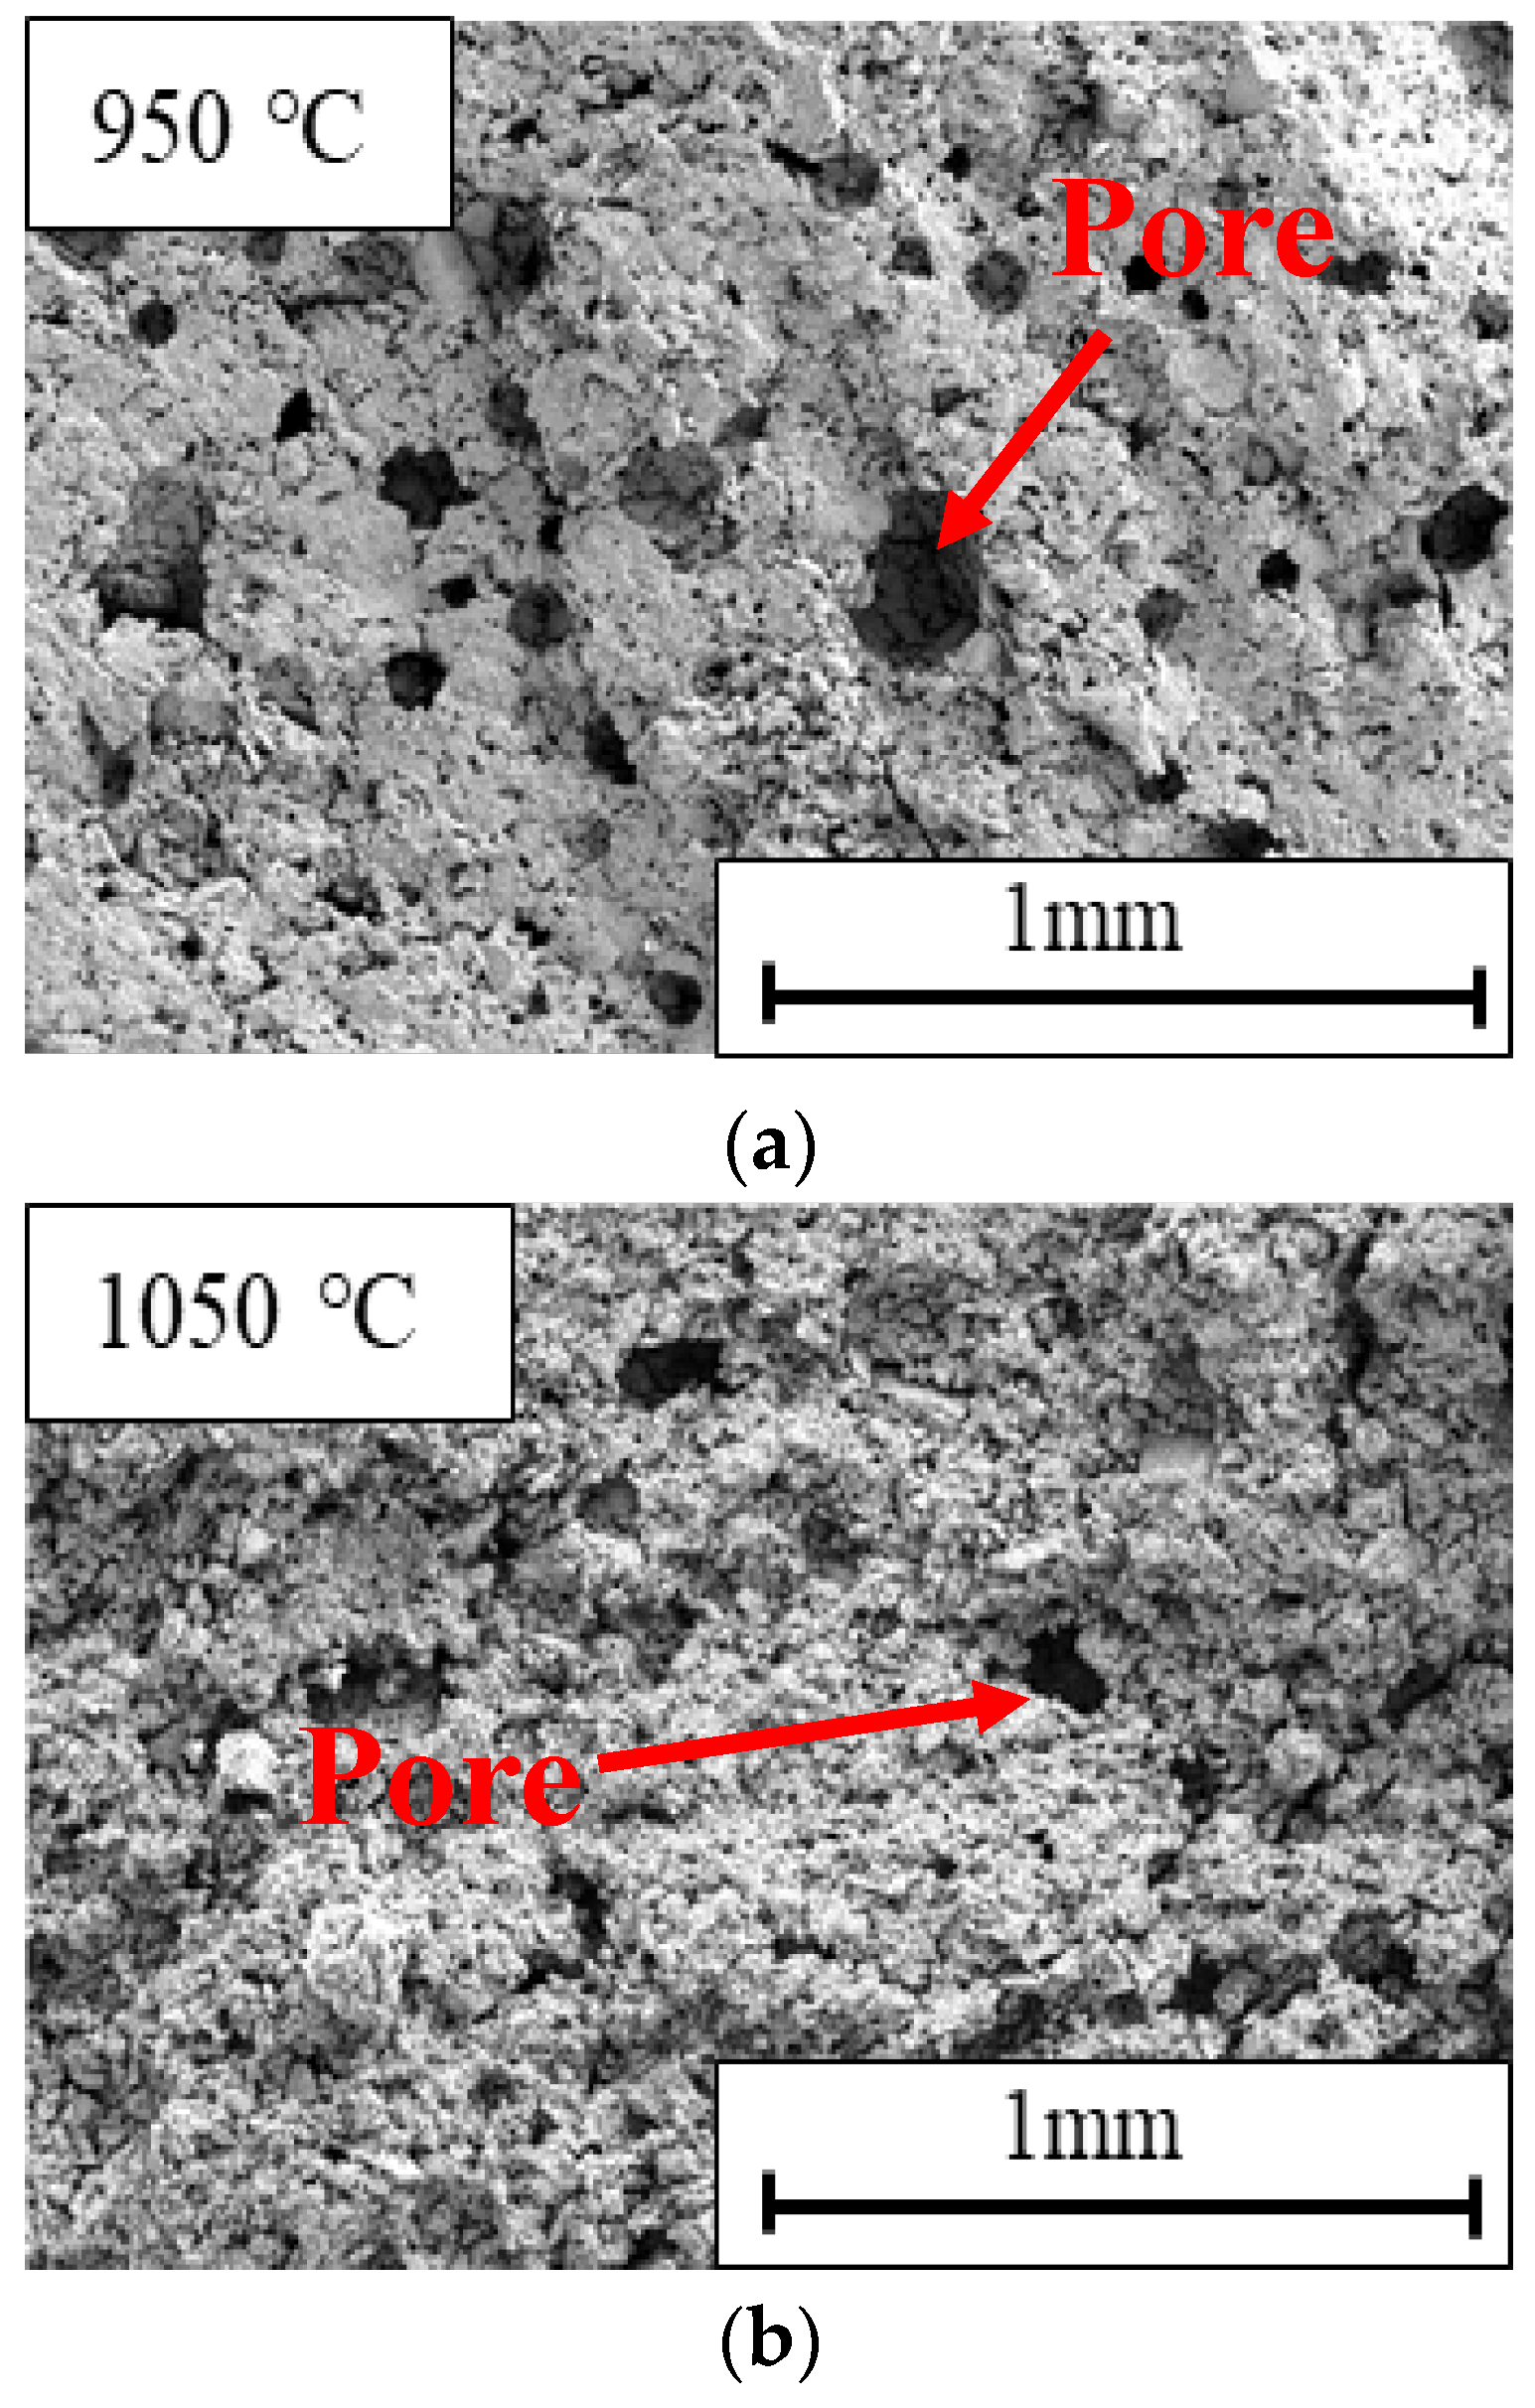
Figure 9.
SEM observation of pore formation and crack development associated with reduction swelling after 120 min of isothermal reduction at different temperatures: (a) 950 °C and (b) 1050 °C.
Figure 9.
SEM observation of pore formation and crack development associated with reduction swelling after 120 min of isothermal reduction at different temperatures: (a) 950 °C and (b) 1050 °C.
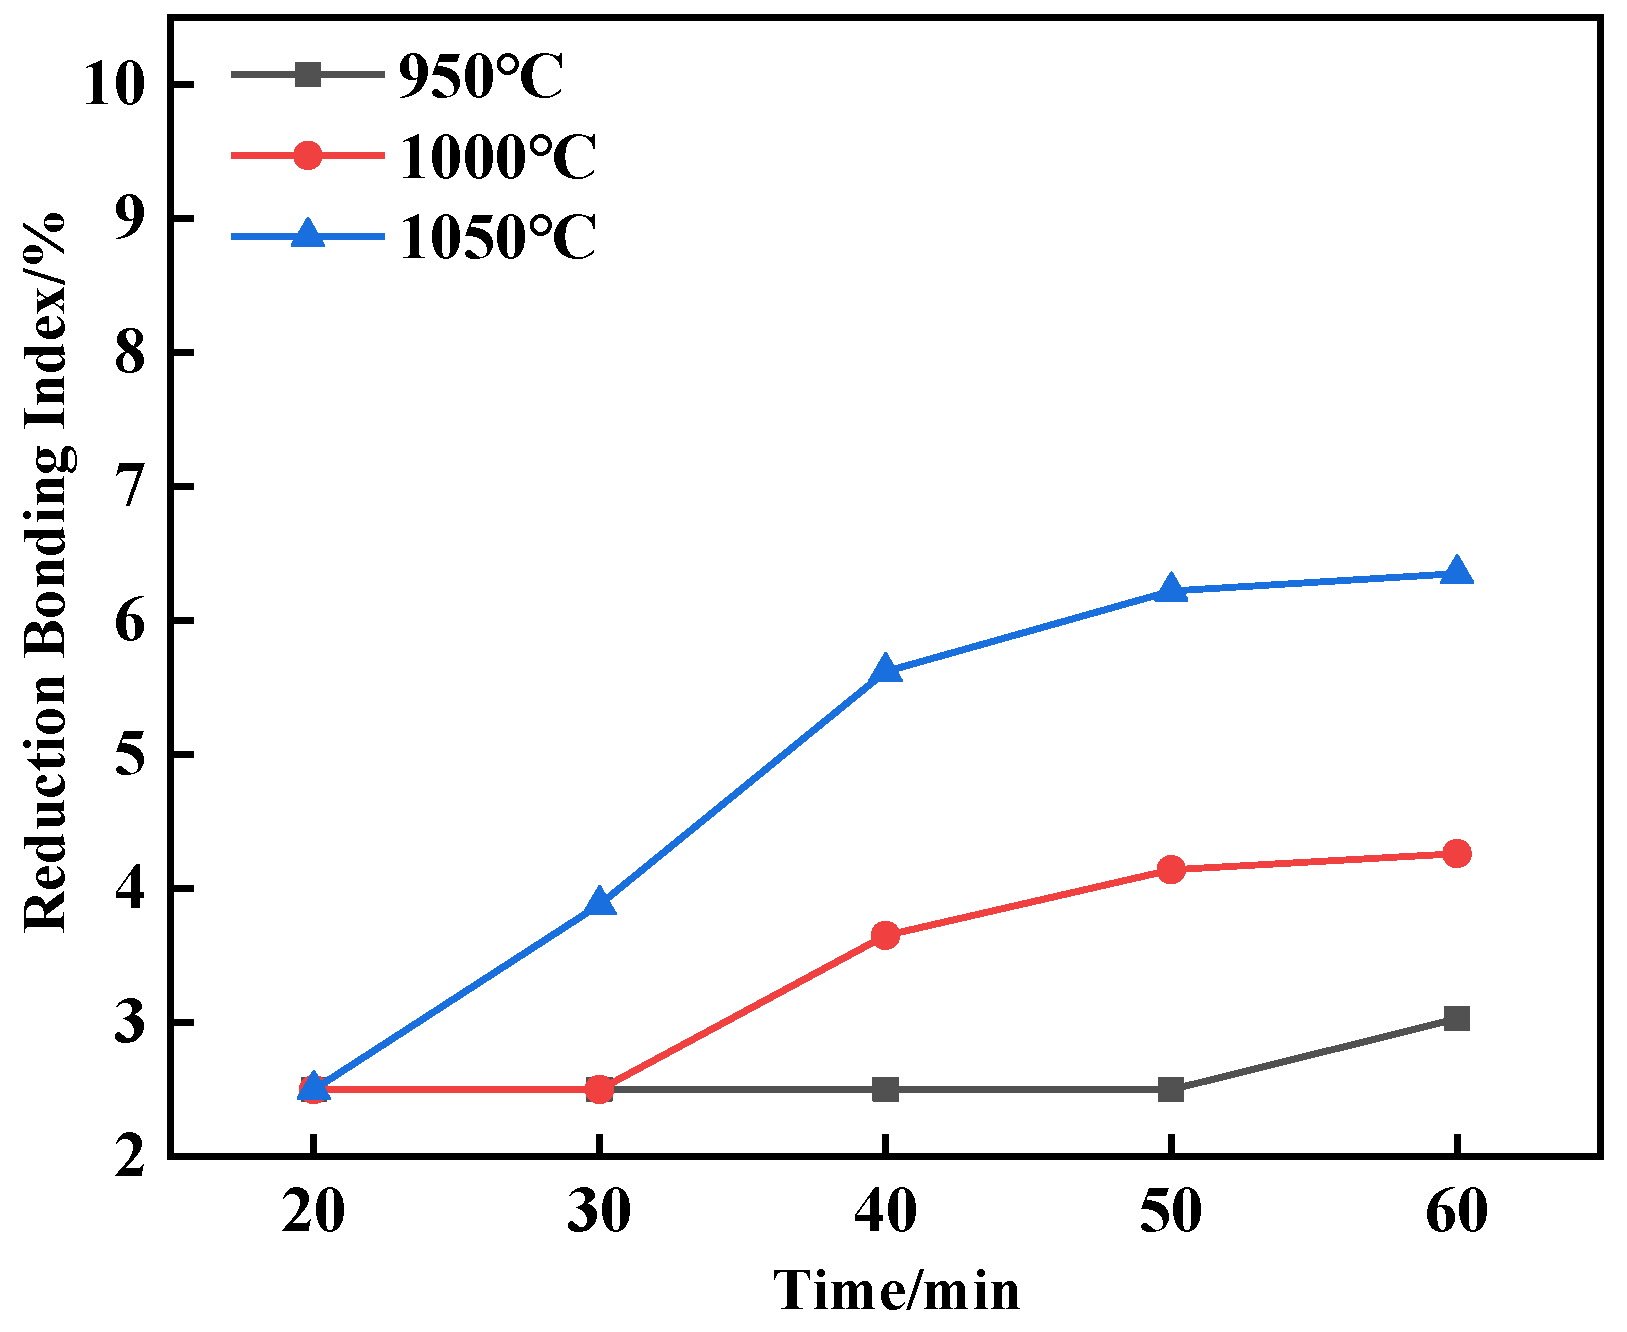
Figure 10.
Evolution of reduction bonding behavior of pellets during hydrogen-based reduction.
Figure 10.
Evolution of reduction bonding behavior of pellets during hydrogen-based reduction.
Figure 11.
SEM evidence of metallic iron intergrowth and bonding enhancement at elevated reduction temperatures: (a) 950 °C and (b) 1050 °C.
Figure 11.
SEM evidence of metallic iron intergrowth and bonding enhancement at elevated reduction temperatures: (a) 950 °C and (b) 1050 °C.
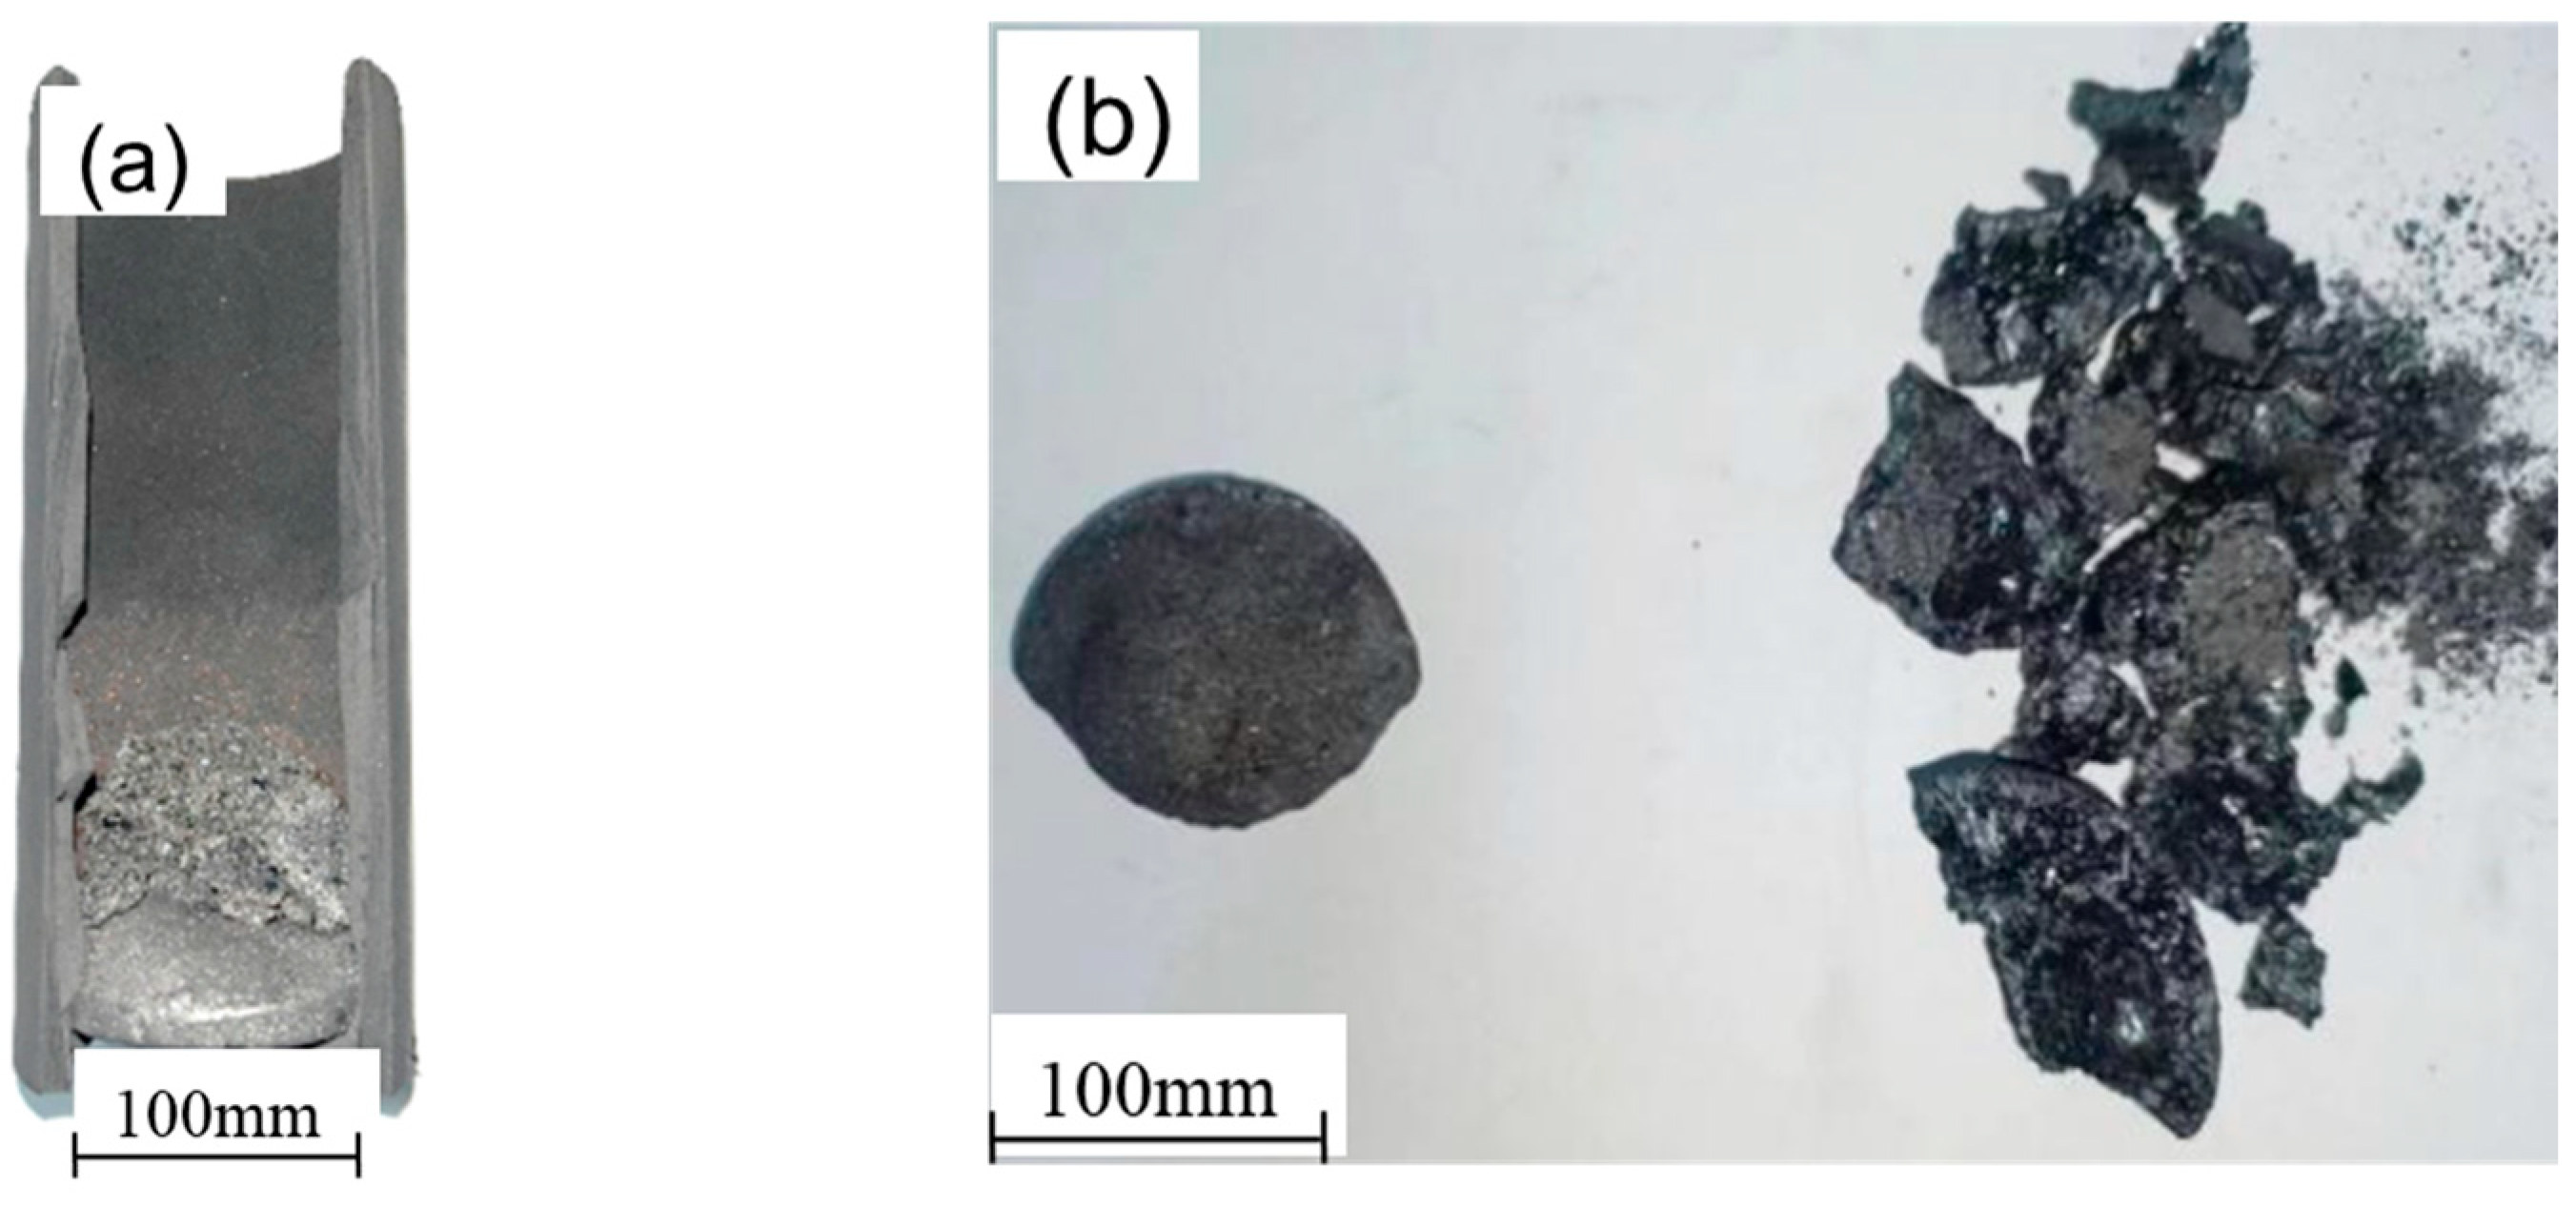
Figure 12.
Sample after smelting in the electric furnace (a), showing good separation between slag and metal phases (b).
Figure 12.
Sample after smelting in the electric furnace (a), showing good separation between slag and metal phases (b).
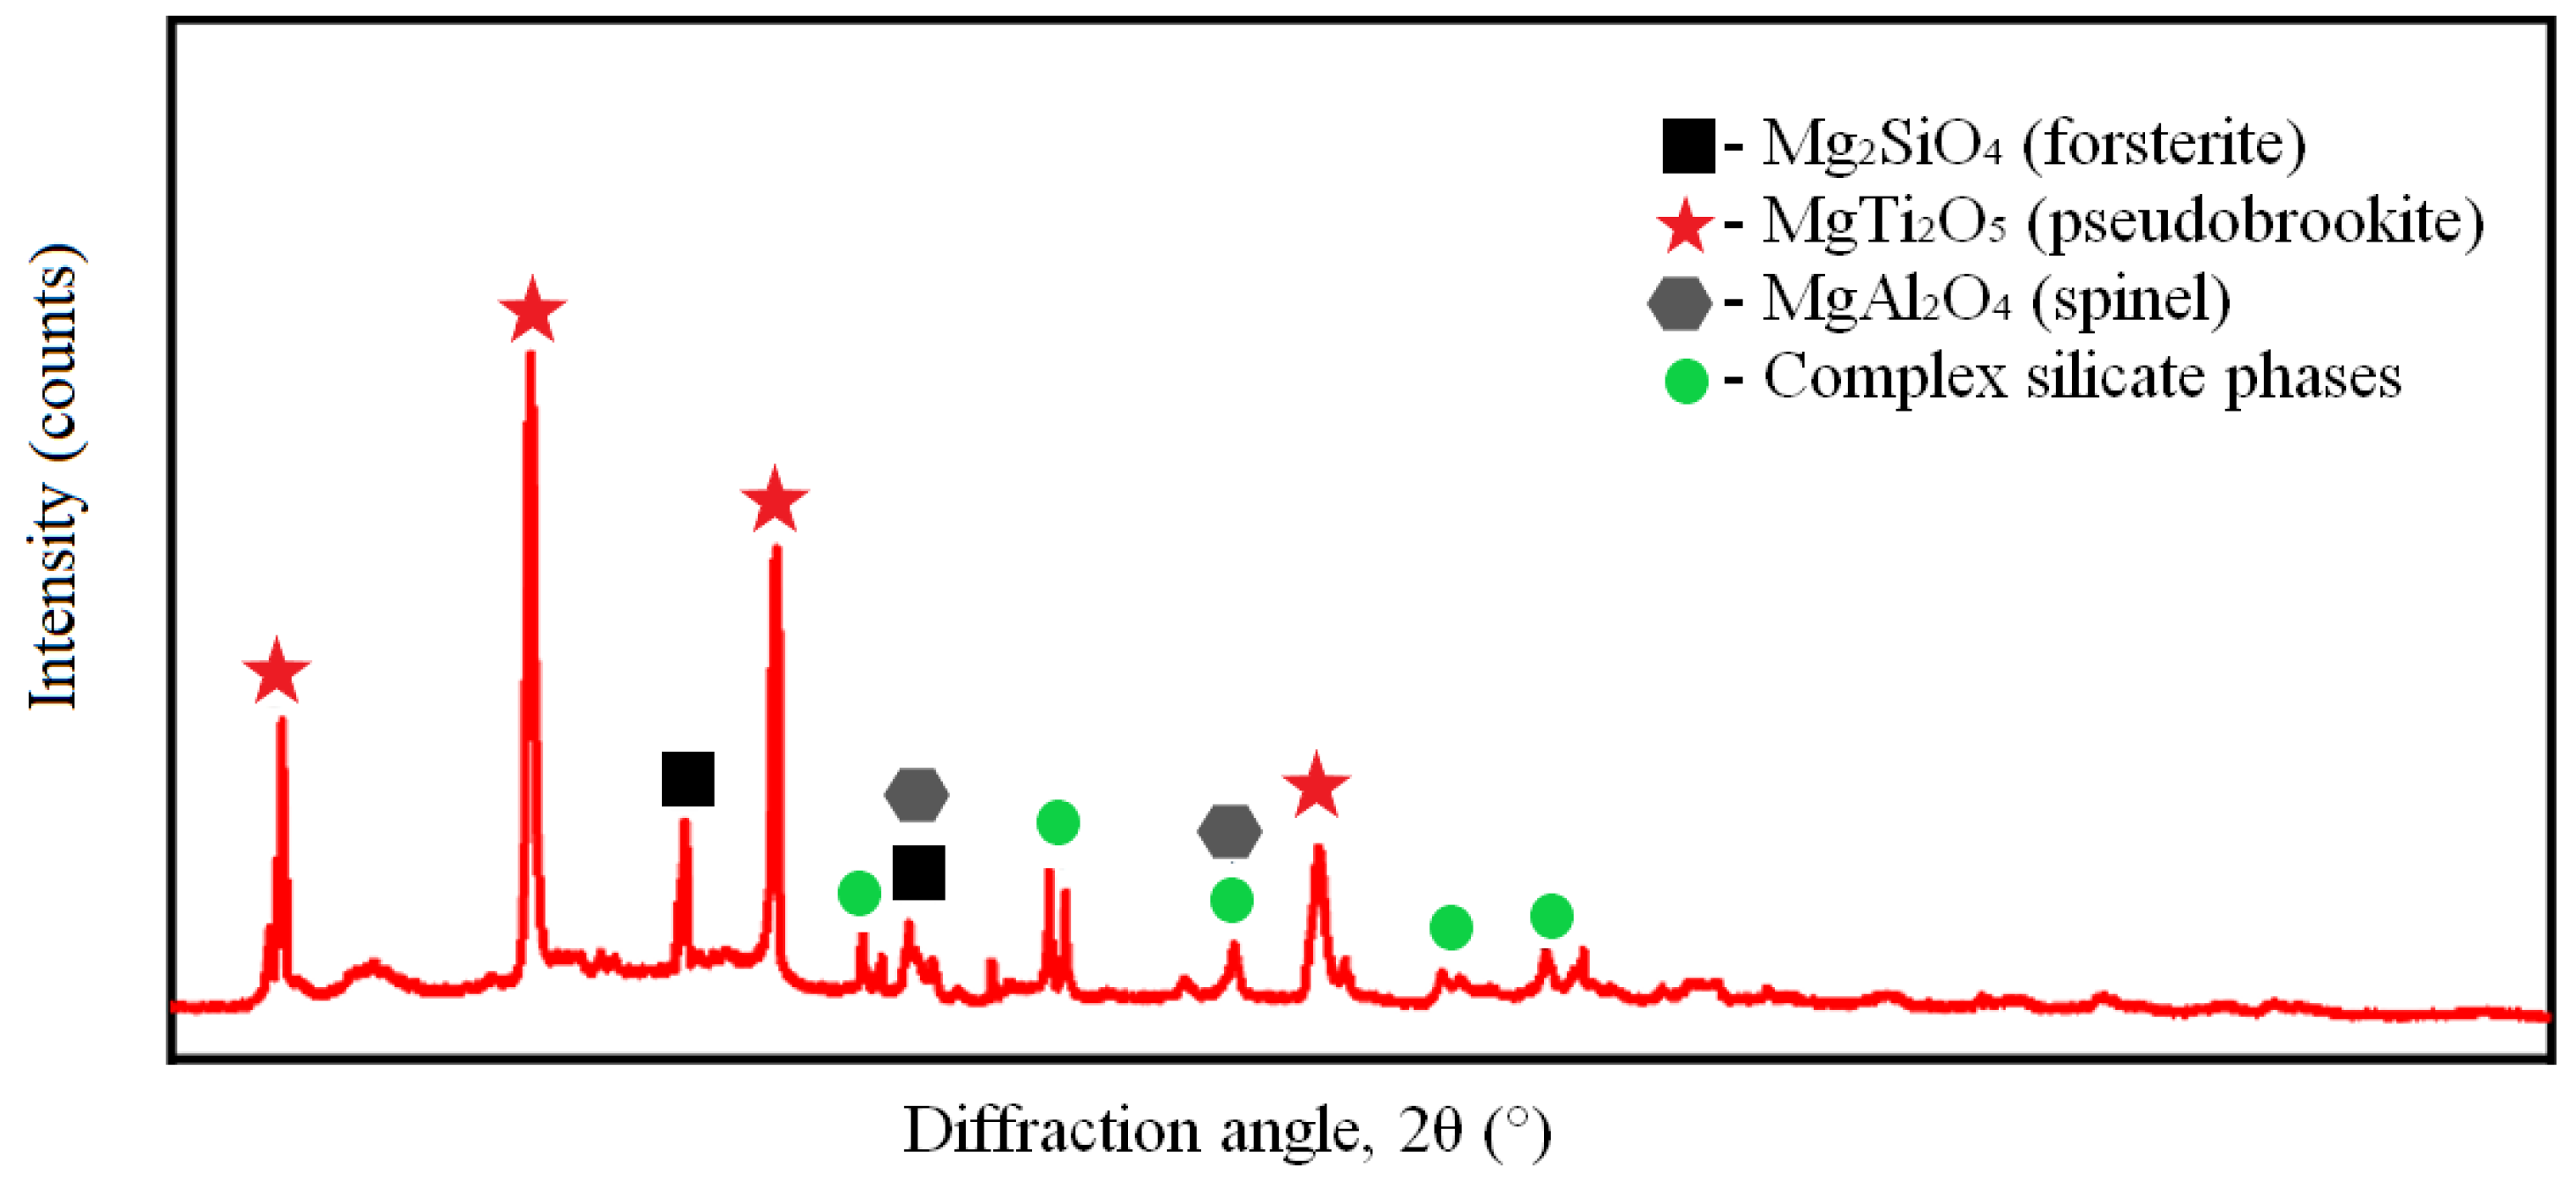
Figure 13.
XRD pattern of titanium-bearing slag obtained under optimized melting separation conditions.
Figure 13.
XRD pattern of titanium-bearing slag obtained under optimized melting separation conditions.
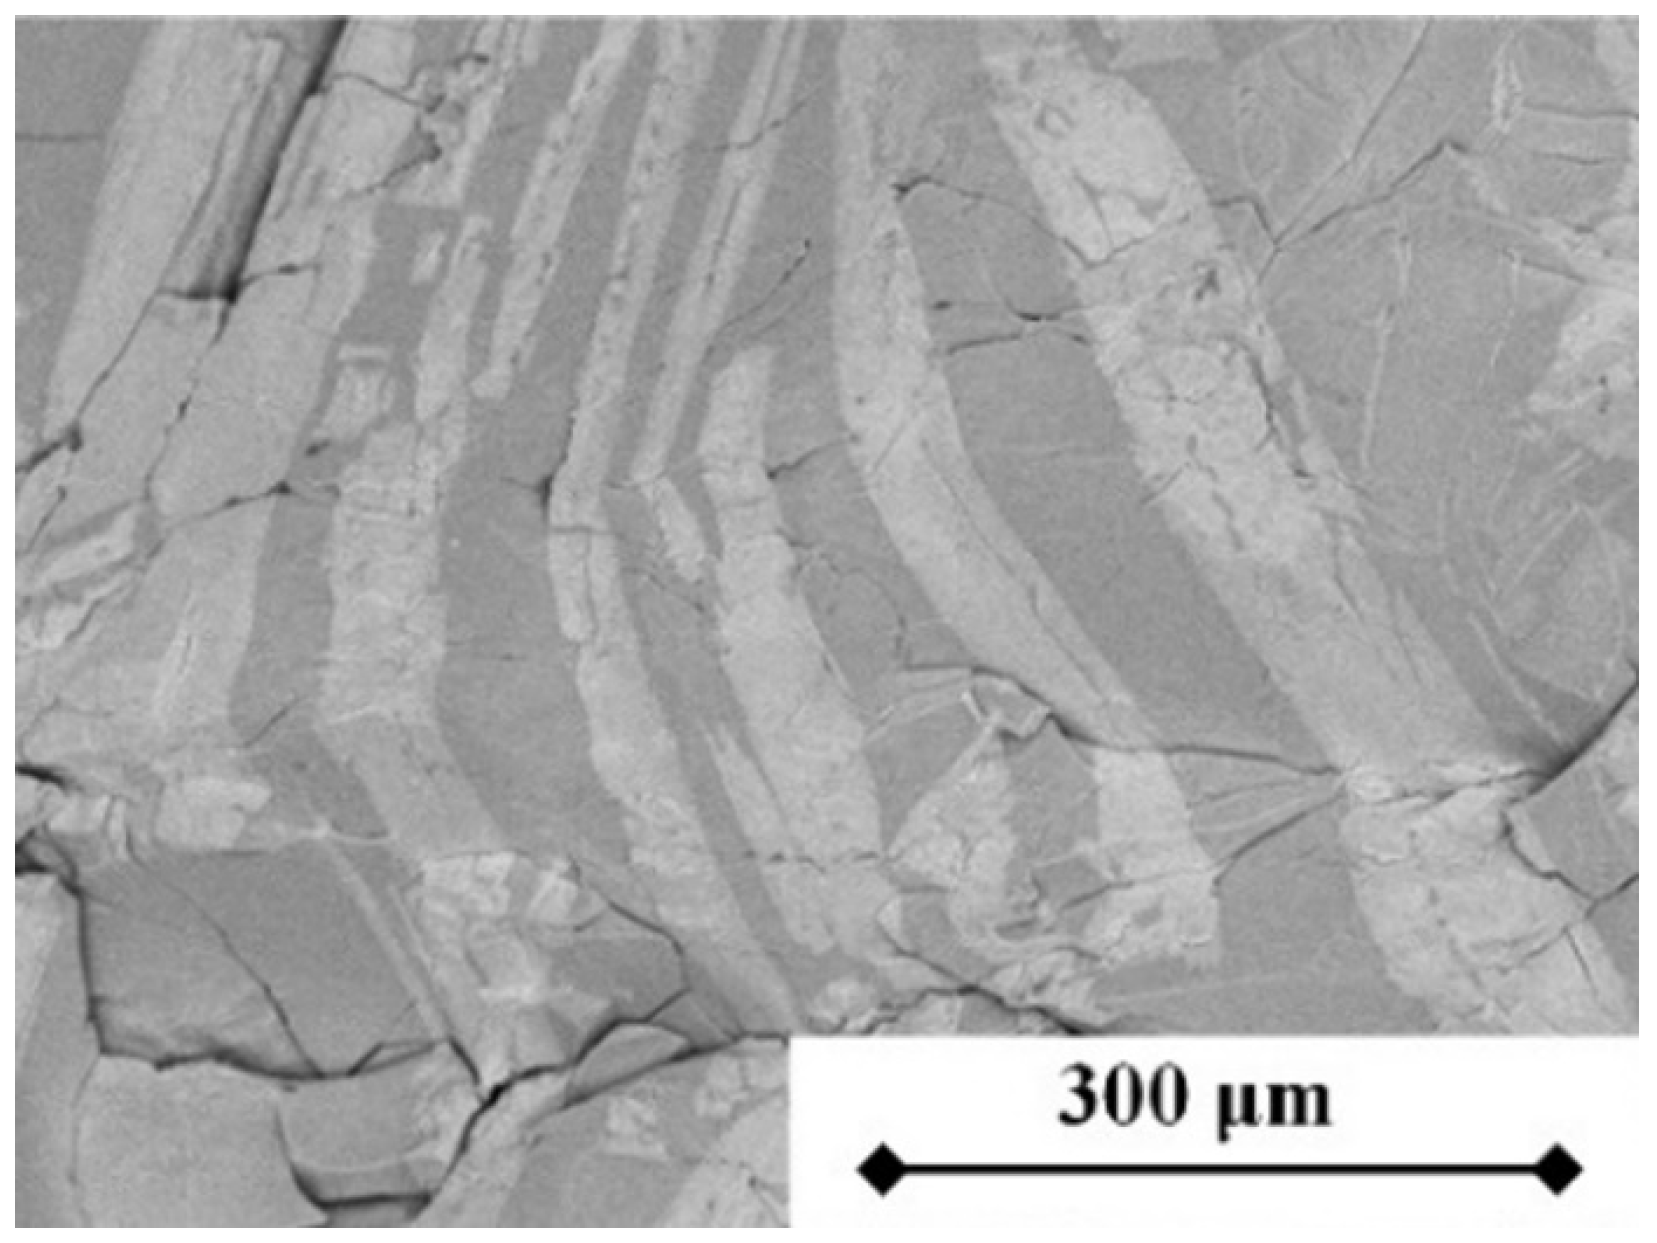
Figure 14.
SEM micrograph of titanium-bearing slag under optimized melting separation conditions.
Figure 14.
SEM micrograph of titanium-bearing slag under optimized melting separation conditions.
Table 1.
HYL recommended requirements for pellets used in hydrogen-based shaft furnaces.
Table 1.
HYL recommended requirements for pellets used in hydrogen-based shaft furnaces.
| Pellet Strength | Reduction Degree | Reduction Swelling Index | Reduction Bonding Index | IRD (+6.3) | IRD (−3.2) | IRD(Up) |
|---|
| 2000 N·p−1 | >90% | <15% | <20% | >80% | <10% | >60% |
Table 2.
Main chemical composition of different ore powders (wt.%).
Table 2.
Main chemical composition of different ore powders (wt.%).
| Ore Type | TFe | FeO | CaO | SiO2 | MgO | Al2O3 | TiO2 | V2O5 | Cr2O3 |
|---|
| Vanadium–titanium magnetite | 61.51 | 30.17 | 0.42 | 2.12 | 1.12 | 2.71 | 6.41 | 0.73 | 0.66 |
| High-grade iron ore | 69.25 | 28.67 | 0.23 | 2.43 | 0.42 | 0.59 | 0.15 | 0.09 | <0.01 |
| Titanium concentrate | 36.12 | 28.85 | 1.29 | 5.29 | 0.88 | 1.36 | 42.47 | 0.15 | <0.01 |
Table 3.
Hydrogen-based reduction metallurgical performance indicators of vanadium–titanium magnetite blended pellets.
Table 3.
Hydrogen-based reduction metallurgical performance indicators of vanadium–titanium magnetite blended pellets.
| No. | VTM/wt.% | High-Grade Ore/wt.% | Ti—Concentrate/wt.% | Pellet Strength/(N·p−1) | Reduction Degree/% | Reduction Swelling Index/% | Reduction Bonding Index/% | IRD (+6.3)/% | IRD (−3.2)/% | IRD (Up)/% |
|---|
HYL
criteria | | | | >2000 | >90 | <15 | <20 | >80 | <10 | >60 |
| 1 | 70 | 30 | 0 | 2716 | 91.24 | 7.25 | 2.90 | 63.6 | 34.3 | 79.7 |
| 2 | 60 | 40 | 0 | 2948 | 92.47 | 8.63 | 2.90 | 77.5 | 21.4 | 90.3 |
| 3 | 50 | 50 | 0 | 3123 | 93.53 | 9.18 | 3.69 | 90.22 | 9.40 | 98.59 |
| 4 | 40 | 50 | 10 | 2823 | 90.32 | 6.62 | 4.23 | 89.03 | 9.60 | 98.14 |
Table 4.
Chemical compositions of vanadium–titanium magnetite DRI with two blending ratios (wt.%).
Table 4.
Chemical compositions of vanadium–titanium magnetite DRI with two blending ratios (wt.%).
| wt.% | Metallization Rate | MFe | TFe | CaO | SiO2 | MgO | Al2O3 | TiO2 | V2O3 |
|---|
| VTM | High-Grade Ore | Ti—Concentrate |
|---|
| 50 | 50 | 0 | 91.03 | 77.43 | 85.06 | 0.43 | 2.19 | 1.23 | 1.92 | 7.21 | 0.52 |
| 40 | 50 | 10 | 88.26 | 71.34 | 80.83 | 0.52 | 3.71 | 1.18 | 1.63 | 9.25 | 0.41 |
Table 5.
Reduction swelling index of blended pellets (40 wt.% VTM, 50 wt.% high-grade ore, 10 wt.% titanium concentrate) measured at different temperatures.
Table 5.
Reduction swelling index of blended pellets (40 wt.% VTM, 50 wt.% high-grade ore, 10 wt.% titanium concentrate) measured at different temperatures.
| Reduction Temperature | 950 °C | 1000 °C | 1050 °C |
|---|
| Maximum swelling index/% | 8.18 | 11.22 | 12.86 |
| Final swelling index/% | 5.77 | 6.62 | 7.63 |
Table 6.
Chemical composition of pellets (wt.%) used in industrial hydrogen-based shaft furnace in reference and trial operations.
Table 6.
Chemical composition of pellets (wt.%) used in industrial hydrogen-based shaft furnace in reference and trial operations.
| Item | TFe | FeO | MgO | TiO2 | SiO2 | CaO | Al2O3 | V2O5 |
|---|
| Reference operation (iron ore) | 66.83 | 0.66 | 0.42 | 0.48 | 2.47 | 0.37 | 0.50 | 0.17 |
| Trial period (optimized ore blend) | 62.31 | 1.32 | 0.86 | 6.58 | 2.08 | 0.63 | 1.36 | 0.38 |
| Difference | −4.52 | 0.66 | 0.44 | 6.10 | −0.39 | 0.26 | 0.86 | 0.21 |
Table 7.
Physical and mechanical properties of finished pellets applied in the industrial hydrogen-based shaft furnace.
Table 7.
Physical and mechanical properties of finished pellets applied in the industrial hydrogen-based shaft furnace.
| Stage | Compressive Strength/(N·p−1) | Tumbler Index/% | Size Fraction 10–16 mm/% | Abrasion Index/% |
|---|
| | 10–12.5 mm | 12.5–16 mm | >16 mm | |
| Reference operation | 2831 | 3379 | 3885 | 96.9 |
| Trial period | 2635 | 2872 | 2928 | 94.2 |
| Difference | −196 | −507 | −957 | −2.7 |
Table 8.
Chemical composition of direct reduced iron (DRI) obtained under reference and trial operating conditions in the industrial hydrogen-based shaft furnace (wt.%).
Table 8.
Chemical composition of direct reduced iron (DRI) obtained under reference and trial operating conditions in the industrial hydrogen-based shaft furnace (wt.%).
| Item | Metallization Rate | MFe | TFe | C | SiO2 | Al2O3 | MgO | CaO | TiO2 | V2O3 |
|---|
| Reference operation | 94.67 | 84.81 | 89.58 | 2.71 | 2.98 | 0.70 | 0.59 | 0.56 | 0.58 | 0.21 |
| Trial period | 88.37 | 70.93 | 80.26 | 2.63 | 2.61 | 1.31 | 0.70 | 0.65 | 9.15 | 0.45 |
| Difference | −6.30 | −13.88 | −9.32 | −0.08 | −0.37 | 0.61 | 0.11 | 0.09 | 8.57 | 0.24 |
Table 9.
Composition of smelting slag.
Table 9.
Composition of smelting slag.
| Component | TFe | V | SiO2 | CaO | MgO | Al2O3 | TiO2 |
|---|
| Content/wt.% | 2.45 | <0.05 | 14.78 | 10.02 | 6.35 | 11.80 | 45.12 |
Table 10.
Composition of smelted metal phase.
Table 10.
Composition of smelted metal phase.
| Component | TFe | Ti | C | V | Si |
|---|
| Content/wt.% | 95.36 | 0.16 | 3.67 | 0.24 | 0.19 |




 ,
,