Article

Reactive Transport Model of Steel/Bentonite Interactions in the FEBEX In Situ Test

Interdisciplinary Center of Chemistry and Biology (CICA), Civil Engineering School and Department, Campus de Elviña, University of A Coruña, 15071 A Coruña, Spain
*
Author to whom correspondence should be addressed.
Minerals 2025, 15(9), 940; https://doi.org/10.3390/min15090940
Submission received: 21 July 2025 / Revised: 28 August 2025 / Accepted: 31 August 2025 / Published: 3 September 2025

Abstract

Steel corrosion plays a major role in the geochemical evolution at the canister/bentonite interface of the engineered barrier systems of geological radioactive waste repositories. The interactions between corrosion products and bentonite can significantly affect bentonite properties and performance. These interactions have been investigated by resorting to in situ tests conducted in underground laboratories, such as the FEBEX (Full-scale Engineered Barrier Experiment) test. The FEBEX in situ test, which was conducted at the Grimsel underground research laboratory in Switzerland from 1997 to 2015, demonstrated substantial corrosion of the steel liner in areas without a heater, primarily due to the presence of O2. Here we report a reactive transport model that simulates steel corrosion products and their interactions with bentonite. The model builds on a previously published conceptual geochemical model and addresses its limitations by integrating a more detailed representation of temperature and unsaturated flow conditions, leveraging prior thermo–hydrodynamic–mechanical–chemical (THMC) models. Given the prevailing uncertainties in O2 and redox conditions during the test and the limited data on liner corrosion and gas conditions at the liner–bentonite interface, liner corrosion was modeled by using a prescribed time-dependent function for the corrosion rate. Goethite, hematite, and magnetite were the Fe minerals allowed to precipitate in the model. The corrosion rate and the specific surface area of the hematite and magnetite were calibrated based on the profiles of goethite, hematite, and total Fe (including dissolved, exchanged and sorbed forms) observed at the post mortem analysis of the FEBEX in situ test. The model reproduces the observed goethite and hematite precipitation near the liner but underestimates the measured values at greater distances from the liner. The pattern of total calculated Fe concentrations reproduce the measured values except at a distance between 15 and 50 mm from the liner. Goethite is the predominant corrosion product in the model results, even under reducing conditions, owing to kinetic constraints on magnetite and hematite precipitation and to the enhanced stability of goethite driven by pH increase and thermal evolution.

Graphical Abstract

1. Introduction

Compacted bentonite and the carbon steel canister are key components of the engineered barrier system (EBS) within the multi-barrier concept of some deep geological repository designs for spent fuel and high-level radioactive waste (HLW). A review of the main characteristics of various national nuclear waste disposal programs in terms of waste type (spent fuel and/or HLW), type of container (carbon steel or copper), buffer (bentonite, cementitious, or none), and host rock (mainly granite or clays) is presented by Ref. [1]. Compressive strength is generally not a design constraint for bentonite because the bentonite is intended to deform plastically and swell to fill voids and create a tight seal. Its swelling pressure and ability to limit water and radionuclide transport are far more critical. The requirements of permeability and swelling pressure are presented by Refs. [2,3]. Steel corrosion plays a major role in the geochemical evolution of the canister/bentonite interfaces in the EBS of geological radioactive waste repositories. Reactive transport models are used to assess the performance of EBS and the geochemical evolution at the container/bentonite interface corrosion and the interactions of the corrosion products and bentonite [4,5].
In the last 15 years, several extensive compilations of steel/iron–clay interactions in laboratory tests, in situ tests, and reactive transport models have been reported by Refs. [6,7,8,9,10,11,12,13,14,15,16,17,18,19]. In the early post-closure phase of a repository, the transition from aerobic to anaerobic corrosion occurs alongside evolving temperature conditions and chemical gradients caused by bentonite hydration. In situ tests conducted in underground laboratories provide very useful information and data for the early transient stage and evolution of these interfaces. FEBEX (Full-scale Engineered Barrier EXperiment) was a demonstration and research project dealing with the engineered barrier system designed for sealing and containment of a radioactive waste repository [20]. Besides the laboratory tests, FEBEX included the following two main large-scale tests, which started in February 1997: (1) the full-scale in situ test conducted in a granite tunnel at the Grimsel underground research laboratory (URL) in Switzerland [21,22,23], which involved emplacing heaters to simulate radioactive waste canisters surrounded by compacted bentonite in order to study the long-term behavior of the engineered barrier system (see Section 2.1 for further details), and (2) the mock-up test operated at the Centre for Energy, Environmental and Technological Research (CIEMAT) facilities in Spain [20,21,22]. The FEBEX heating and hydration in situ test was performed in two operation periods. The first operational period lasted from 1997 to 2002, when the first half of the test around heater 1 was dismantled, and the second one started in 2002 and finished when heater 2 was switched off and the full test was dismantled in 2015. Although the FEBEX in situ test was not specifically designed to study steel corrosion and iron–bentonite interactions, post mortem analyses at the end of the test in 2015 showed significant evidence of corrosion and iron/bentonite interactions [23,24,25].
The first coupled thermo–hydrodynamic–chemical–mechanical (THCM) models of the first period of the FEBEX in situ test focused on the geochemical evolution on the compacted bentonite [26,27]. A revisited THCM model presented by Ref. [28] showed the two operational periods of the FEBEX in situ test, which extended the THCM model of Ref. [27] by improving the boundary condition at the heater/bentonite interface, refining the spatial discretization of the finite element mesh near the heater, revising the dispersivities of the bentonite and the granite, and revisiting the back-diffusion of solutes from the bentonite barrier into the granite. Predictions of the geochemical conditions at the end of the second operational period with a revisited THCM model of the FEBEX in situ test were presented by Ref. [28]. These models did not account for iron corrosion or its interactions with compacted bentonite, as experimental evidence of steel corrosion after the dismantling of the first heater was still very limited at the time.
A geochemical model of the iron–bentonite interactions at the FEBEX in situ test is presented by Ref. [24]. They concluded that (1) some oxygen was likely to have been present immediately after the emplacement of the bentonite barrier, and (2) the color zonation in some areas suggests a possible redox gradient, with conditions going from aerobic to anaerobic from the liner–bentonite interface into the bentonite. They indicated that this pattern differs from most previously published studies of iron–bentonite or iron–claystone interactions in which simulations assume anaerobic conditions from the start with anaerobic steel corrosion and H2(g) production [24]. They concluded that the models were able to replicate Fe(III)-dominated aerobic or Fe(II)-dominated anaerobic conditions, but not both.
Experimental studies of the steel–iron interactions at the contact of the corroding Fe source and compacted bentonite in the FEBEX in situ test are reported by Refs. [25,29]. Bentonite samples in contact with the metal liner showed an increase in the Fe content, which was mainly present as goethite. Aerobic corrosion was explained by the air that was entrapped between the heater and the liner [29]. No signs of corrosion were detected in bentonite blocks in direct contact with the heater surface [29]. Hadi et al. (2019) reported that several steel components of the FEBEX in situ test retrieved after the second operational period, such as the liner, the heater, the dummy, the extensometers, the fissure meters, the drilling rods and the cable ducts, exhibited clear signs of corrosion, appearing as concentric, colored halos [25]. Complex Fe–bentonite interaction patterns were observed in the FEBEX in situ test. They also reported a convex Fe accumulation front with distinct colored halos around the corroding steel liner (a convex profile or function is a function where a line segment connecting any two points on the function’s graph lies above the graph itself). They proposed a conceptual model of Fe diffusion at the steel–bentonite interface where diffusion of Fe(II) occurs only when anaerobic corrosion starts occurring once oxygen is depleted at the surface of the steel and sufficient water saturation conditions are met. Fe diffusion takes place in two stages: (1) First, Fe(II) diffuses into the bentonite and competes with O2 diffusion toward the interface and Fe is accumulated as Fe(III) oxyhydroxides (mainly goethite) near the interface. (2) Then, once O2 is depleted in the bentonite, Fe(II) diffuses from the corrosion layer into the bentonite.
The corrosion processes at steel–bentonite interfaces in four in situ experiments with different types of steel and bentonite as well as in different geological and geochemical environments were discussed and compared in Ref. [16]. One such experiment was the FEBEX in situ test. They concluded that general consistent patterns could be deduced irrespective of carbon steel grade, type of bentonite and degree of compaction, geochemical environment, or experimental setup. Moreover, a clear dependence of the corrosion rates on temperature and exposure period, as well as on the availability of H2O and O2 provided by the surrounding bentonite buffer, was observed. They also highlighted the usefulness of reactive transport modeling in understanding the coupled corrosion and iron–clay interaction processes.
A reactive transport model for the FEBEX in situ test that accounts for both aerobic and anaerobic corrosion stages, oxygen transport in gas and liquid phases, and the chemical evolution of the steel–bentonite interface over the 18 years of the test was reported by Ref. [17]. The model accounts for the aerobic corrosion phase, which is characterized by goethite accumulation in the corrosion layer, and the anaerobic corrosion phase, which contains mixed Fe(II)/Fe(III) corrosion products and also re-dissolves the aerobic corrosion products. During the anaerobic phase, some Fe(II) diffuses into the bentonite, reacting partially with residual oxygen to form Fe(III) precipitates or interacting with clay minerals via surface complexation or cation exchange. Their model qualitatively reproduces the convex profile of the Fe accumulation front within the bentonite, revealing a distinct zonation: an iron oxide precipitation-dominated region adjacent to the steel and an Fe(II) sorption-dominated region deeper within the bentonite. Sensitivity analyses of bentonite hydration and transport parameters emphasize the critical role of rapid oxygen diffusion in the gas phase in forming these interface features. The modeled thickness of the Fe–bentonite interaction zone is smaller than that observed experimentally. They attributed this discrepancy to complex flow patterns in the FEBEX in situ test and electron transport across oxide-enriched layers.
Here we report a reactive transport model that simulates steel corrosion products and their interactions with bentonite during the 18 years of the FEBEX in situ test. The model builds on the conceptual geochemical framework of Ref. [25] and addresses its limitations by integrating a more detailed representation of temperature and unsaturated flow conditions, leveraging prior THMC models. Given the uncertainties in O2 and redox conditions during the test and the limited data on liner corrosion and gas conditions at the liner–bentonite interface, liner corrosion was modeled using a time-dependent function for the corrosion rate. The calibration was based on the convex profiles of goethite, hematite, and total Fe (including dissolved, exchanged, and sorbed forms) observed after dismantling the FEBEX in situ test. Compared with the study of Ref. [17], this paper introduces two main advances: (1) The model specifically addresses al the stages described by Ref. [25], focusing on stages 2 and 3, in which the anaerobic Fe corrosion begins once oxygen is depleted at the steel surface on the FEBEX in situ test while Fe diffusion into the bentonite competes with oxygen diffusion toward the Fe–bentonite interface; and (2) it incorporates a more realistic representation of the thermal, hydrodynamic, and transport conditions within the bentonite barrier. Together, these improvements enable the model to reproduce the observed spatial extent of Fe–bentonite interactions.
The paper starts with a description of the FEBEX in situ test and the available corrosion and Fe–bentonite data. Then, the conceptual and numerical reactive transport models are presented. Next, model results are presented together with a comparison with experimental data.

2. Materials and Methods

2.1. FEBEX In Situ Test Description

The FEBEX in situ test was performed in a gallery excavated in granite in the URL of Grimsel operated by the National Cooperative for the Disposal of Radioactive Waste (NAGRA) in Switzerland [20]. The test began in February 1997. The first operational period lasted from 1997 to 2002, when heater 1 was switched off and the surrounding area was dismantled. The second operational period began in 2002 with the emplacement of a metallic cylinder (dummy) and a shotcrete plug and ended in June 2015, when the entire bentonite barrier was dismantled after 18 years of heating and hydration.
The FEBEX in situ test included the heating system, the clay barrier of compacted bentonite, and the instrumentation, monitoring, and control system. The drift was 70.4 m long and 2.27 m in diameter [20]. The test zone was in the last 17.4 m of the drift, where the heaters, bentonite, and instrumentation were installed. The main elements of the heating system were two heaters separated horizontally by 1 m, which simulated full-sized canisters. The layout of the FEBEX in situ test for the first and the second operational periods is shown in Figure 1.
The heaters were placed inside a cylindrical carbon steel liner with a diameter of 0.93 m, which had been installed concentrically with the drift. Each heater was made of carbon steel, measured 4.54 m in length and 0.90 m in diameter, had a wall thickness of 0.10 m, and weighed 11 metric tons [20]. The heaters were designed to maintain a maximum temperature of 100 °C at the liner–bentonite interface. The liner enveloped both heaters, and it was surrounded by the clay barrier. The carbon steel used for the liner had the following composition: 99.04 wt.% Fe, 0.16 wt.% C, 0.30 wt.% Si, and 0.60 wt.% Mo.
The clay barrier of the FEBEX in situ test was made of blocks of highly compacted bentonite, which were situated in vertical sections normal to the axis of the tunnel, with a diameter of 2.28 m. Weighted average values of the initial dry density and water content of the bentonite blocks were 1.7 g/cm3 and 14.4%, respectively [20].

2.2. Post Mortem Analysis

Once the entire bentonite barrier of the FEBEX in situ test was fully dismantled, a comprehensive post mortem bentonite sampling and analysis program was performed to characterize the solid and liquid phases, analyze the physical and chemical changes induced by the combined effect of heating and hydration, and test THM and THC model predictions [30,31].
The available corrosion data used to compare the calculated results of the FEBEX in situ test were taken from Ref. [25]. They characterized the colored interaction zones observed in two bentonite blocks, the newly formed Fe phases and the effect of corrosion on bentonite chemistry. These two blocks of the same section 41 were located between the two heaters during the first operational period of the test and after the dismantling of heater 1 between the dummy and heater 2 (Figure 1).
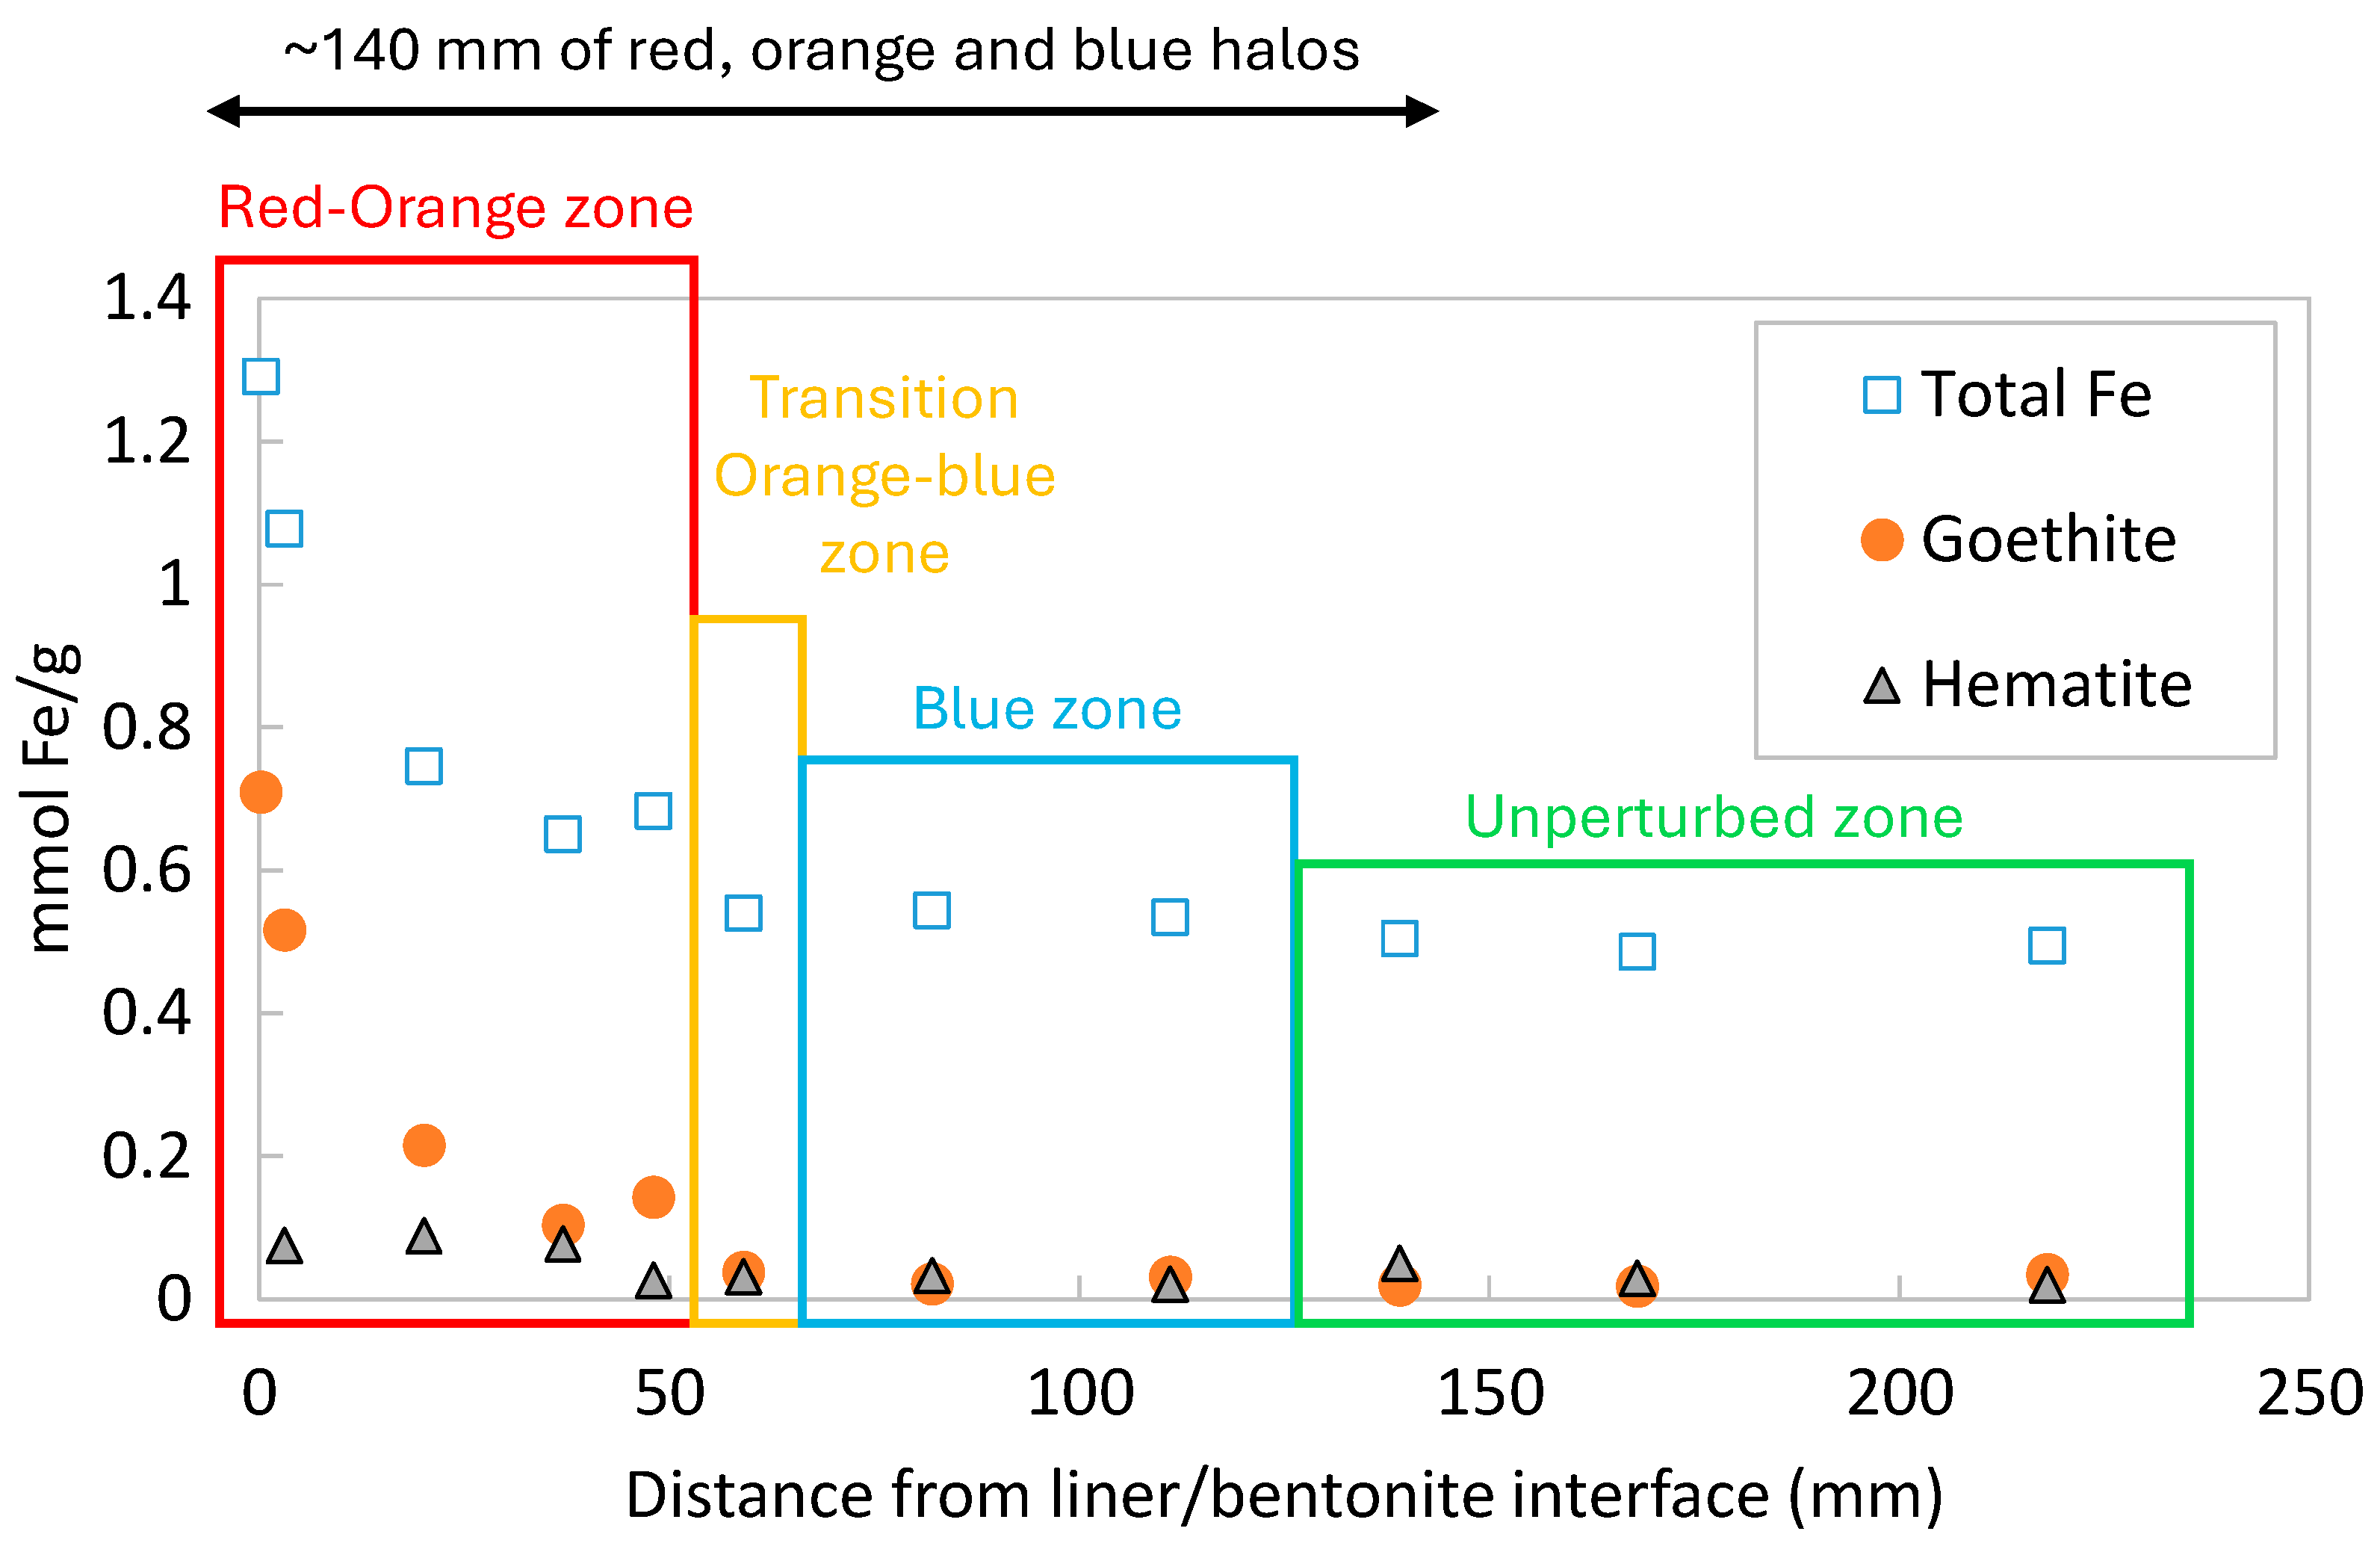
According to Ref. [25], a colored corrosion halo was observed in the bentonite buffer between the dummy and the second heater. This halo was asymmetric and preferentially located on the upper part of the liner, while the opposite side of the liner appeared almost unaffected by corrosion. Goethite was the main newly formed Fe-bearing phase present in the red-orange zone observed in the bentonite (at a distance from the steel–bentonite interface of less than 50 mm), while additional Fe(II) was found at a wider and Fe-poor blue zone in the bentonite (at a distance between 50 and 120 mm from the steel–bentonite interface).
The measured data for total Fe and the precipitated goethite and hematite in 11 FEBEX bentonite samples of the bentonite block BM-B-41-1 [25] were selected for the calibration of the reactive transport model of the FEBEX in situ test. These bentonite samples together with the raw bentonite sample were characterized by X-ray fluorescence (XRF), transmission 57Fe Mössbauer spectrometry, and X-ray diffraction (XRD). According to Ref. [25], the Fe distribution was inferred by combining XRF (total Fe) and Mössbauer data (Fe (II), Fe(II), goethite, and hematite distribution). It is important to point out that there was an initial amount of Fe in the raw bentonite sample of approximately 0.49–0.50 mmol/g [25]. Figure 2 shows the spatial distribution of the measured total Fe, goethite, and hematite data in the 11 selected bentonite samples taken from bentonite block BM-B-41-1 [25]. The profile of Fe versus distance from the liner–bentonite interface shows a correlation between the coloration of the bentonite, the amount of additional Fe, and the nature of the Fe species [25]. Although Fe accumulation is more obvious in the red-orange zone (first 45 mm from the steel liner contact), the measured data show that Fe diffused deeper into the bentonite throughout the entire blue area up to a distance of between 50 and 120 mm.
One of the objectives of the FEBEX in situ experiment was to analyze the gases generated and transported through the bentonite barrier. The main gases detected in the FEBEX in situ during the 18 years of experimentation were O2, N2, CO2, CO, H2, CH4, and other saturated and unsaturated aliphatic hydrocarbons [32]. Part of the gases identified were consumed in different (bio)-geochemical processes. Although the concentration of O2 decreased over time, it was never depleted completely, showing minimum values of between 3 and 0.2 vol.%. However, the presence of H2 and CH4 indicated anoxic/anaerobic conditions, which was confirmed by the reducing redox potential.

2.3. Conceptual Reactive Transport Model

The main thermo–hydrodynamic processes in the bentonite buffer of the FEBEX in situ model include (1) advective and diffusive solute transport and (2) heat transport (conduction).
The reactive transport model presented here includes all the stages described by Ref. [27], with particular emphasis on stages 2 and 3. Stage 2 represents the onset of anaerobic Fe corrosion, which begins once O2 is depleted at the steel liner surface. Nevertheless, O2 persists in the surrounding bentonite, creating a redox gradient across the Fe–bentonite interface. In this context, Fe(II) produced at the anaerobic corrosion front can diffuse from the liner surface into the bentonite, where it encounters oxidizing conditions. Under such conditions, Fe(II) is oxidized to Fe(III) in the presence of residual O2, resulting in the formation of aerobic corrosion products such as goethite and hematite, or in its retention through surface complexation and cation exchange. Stage 3 corresponds to the continuation of anaerobic Fe corrosion. It is noteworthy that Fe(III) corrosion products remain thermodynamically stable under reducing conditions at pH > 8.
The geochemical model accounts for aqueous complexation; acid–base reactions; mineral dissolution/precipitation; cation exchange of Ca2+, Mg2+, Na+, K+, and Fe2+; and surface complexation of H+ and Fe2+ on three types of sorption sites (strong SsOH, weak site #1, Sw1OH, and weak site #2, Sw2OH) according to the triple-site sorption model of Ref. [33]. The geochemical system was defined in terms of 12 primary species (H2O, O2(aq), H+, Cl, Ca2+, Mg2+, Na+, K+, SO42−, HCO3, H4SiO4(aq), and Fe2+), 34 secondary aqueous species identified from speciation runs performed with the thermodynamic database ThermoChimie [34], and 7 minerals (calcite, gypsum, quartz, Fe(s), goethite, magnetite, and hematite). The Gaines–Thomas convention was used for cation exchange reactions [35]. Ni(II) surface complexation constants from [36] were used as a proxy for Fe(II), owing to their similarity in charge, ionic radius, and hydrolysis behavior. This substitution has been employed in previous studies as a first-order approximation. Fe(II) sorption reactions were assigned only to the SsOH and Sw1OH sites, as Sw2OH sites are generally restricted to protolysis [34]. The chemical reactions and their equilibrium constants at 25 °C for secondary species and mineral dissolution/precipitation as well as the selectivity coefficients for exchanged cations and the protolysis constants for the triple-site model are listed in Table 1.
Although several gases (O2, N2, CO2, CO, H2, CH4, and others) were detected during the FEBEX in situ experiment [33], explicit gas transport was not incorporated into the present model. The exclusion is justified by the following considerations: (i) The experiment was not specifically designed to investigate gas transport, (ii) the available data consist primarily of chemical compositions from discrete samples, without information on gas pressures or fluxes, and (iii) the data are therefore qualitative rather than quantitative. The results of the gas sampling campaigns are nevertheless consistent with the assumptions of the reactive transport model, and omission of gas transport is not expected to affect the main conclusions of this study.
The anaerobic corrosion in the steel liner is assumed to proceed according to:
Fe(s) + 2H2O ⇔ Fe2+ + 2OH + H2(g)
H2(g) migration is neglected and only the diffusion of H2(aq) is accounted for in the model [10]. Similar to Refs. [10,11,14], this reaction is rewritten in terms of the primary species used in the numerical model:
Fe(s) + 2H+ + 0.5O2 (aq) ⇔ Fe2+ + H2O
Kinetically controlled mineral dissolution/precipitation was modeled with the following rate law [9,10,11,12]:
r m = s m k m e E a R T i = 1 N T a i p m i Ω m θ 1 η
where rm is the dissolution/precipitation rate (mol/m2/s); km is the kinetic rate constant (mol/m2/s) at 25 °C; Ea is the activation energy; R is the gas constant; T is the temperature (K); Ωm is the saturation index, which is equal to the ratio of the ion activity product to the equilibrium constant (dimensionless); ϴ and η are empirical parameters; sm is equal to −1 for precipitation and 1 for dissolution; and i = 1 N T a i p m i is a catalytic term that accounts for the activities ai of the aqueous species, where pmi is the exponent for the i-th aqueous species in the m-th mineral phase and NT is the total number of aqueous species considered in the catalytic term.
The steel liner corrosion rate rc in μm/year is calculated as:
r c = r m M w ρ
where rm is the corrosion rate per unit mineral surface (mol/m2/year), ρ is the density of the carbon steel (7860 kg/m3), and Mw is its molecular weight (55.85 g/mol).
Under non-isothermal conditions, the equilibrium constants for aqueous complexes and minerals are temperature-dependent. They were calculated using the following expression, valid for temperatures T ranging from 0 to 300 °C:
l o g   K T = b 1 T 2 + b 2 T + b 3 l n T + b 4 + b 5 T
where b 1 to b 5 are coefficients obtained by fitting Equation (5) to measured logK values at 0, 25, 60, 100, and 300 °C [37].

2.4. Numerical Reactive Transport Model

The numerical model of the FEBEX in situ test was constructed using a 1D row of triangular elements (Figure 3) at section 41, located between the two heaters (Figure 1). The model represents a radial section that includes both the steel liner and the bentonite barrier, extending from the inner side of the liner (r = 0.44 m) to the bentonite/granite (r = 1.44 m). The spatial discretization is non-uniform and consists of 272 nodes and 270 elements. The liner is represented by two triangular elements within the interval 0.44 m < r < 0.45 m. Grid size increases progressively: Δr = 2 mm for 0.45 m < r < 0.50 m, Δr = 2.5 mm for 0.50 m < r < 0.60 m, Δr = 5 mm for 0.60 m < r < 0.75 m, and Δr = 10 mm for 0.75 m < r < 1.14 m.
The simulation time horizon covers the entire duration of the FEBEX in situ test from February 1997 to 2015 (18 years). The numerical model accounts for the heating stages and the cooling phases after switching off the heaters at the end of the two operation periods (heater 1 after 5 years of operation in the first operational phase and heater 2 after 18 years of operation in the second operational phase).
Bentonite has an initial porosity of 0.41; a volumetric water content of 24.5%, which corresponds to a gravimetric water content of around 14.5%; a liquid saturation degree of 59%; and a suction of 1.1 × 10⁵ kPa. This gravimetric water content is very similar to the mean value reported by Ref. [38]. The initial temperature is uniform and equal to 12 °C. The thermal, hydrodynamic, and transport parameters of the bentonite are listed in Table 2. The parameters of the bentonite were assigned to the liner as an informed approximation. Although this assumption lacks a strict scientific basis, it has no significant impact on the results, since the liner functions only as the source of corrosion products in the model. It was considered an effective diffusion coefficient for a liner 100 times larger than that for the bentonite in order to facilitate the Fe release. The diffusion coefficient is the same for all aqueous species. The effective diffusion coefficient is equal to 4.07 × 10⁻¹² m2/s (Table 2).
The water content and the temperature evolution at the boundaries (r = 0.45 m and r = 1.14 m) were taken from the previous model of Ref. [28]. Figure 4a,b show the time function of the temperature and water content imposed at the boundaries. The temperature increases to 70 °C at r = 0.45 m and to 40 °C at r = 1.14 m, and then it decreases when the heater 1 is switched off. The water content in the bentonite at r = 1.14 m increases quickly and becomes fully saturated. At r = 0.45 m, however, the water content increases slowly.
A Neuman boundary condition was used for solute transport, according to which solute flux is equal to the product of water flux times the solute concentration of the inflow water. The initial concentration of the FEBEX bentonite porewater at a water content of 14% was taken from Ref. [39], while the composition of the granite groundwater was derived from experimental data [21] as reported by Ref. [26] (see Table 3). The concentration of the boundary water at r = 0.45 m is equal to the bentonite porewater, and the granite groundwater was adopted as the boundary water at r = 1.14 m.
The cation exchange capacity (CEC) of the bentonite is equal to 102 meq/100 g [40]. The initial exchangeable cation concentrations are equal to 23.5, 2.2, 36.8, 39, and 0.5 meq/100 g for Na+, K+, Ca2+, Mg2+, and Fe2+, respectively. The total concentration of sorption sites in bentonite is 0.626 mol/L (per liter of pore water), which is equivalent to 0.093 mol/kg (kg of bentonite) [33]. Strong sites exhibit a high binding affinity but occur at low concentrations (0.015 mol/L or 0.002 mol/kg). In contrast, weak site types #1 and #2 have lower binding constants (Table 1) but higher concentrations, of 0.307 mol/L (0.045 mol/kg) each, compared with the strong sites. Surface complexation and cation exchange reactions are assumed to occur only within the bentonite.
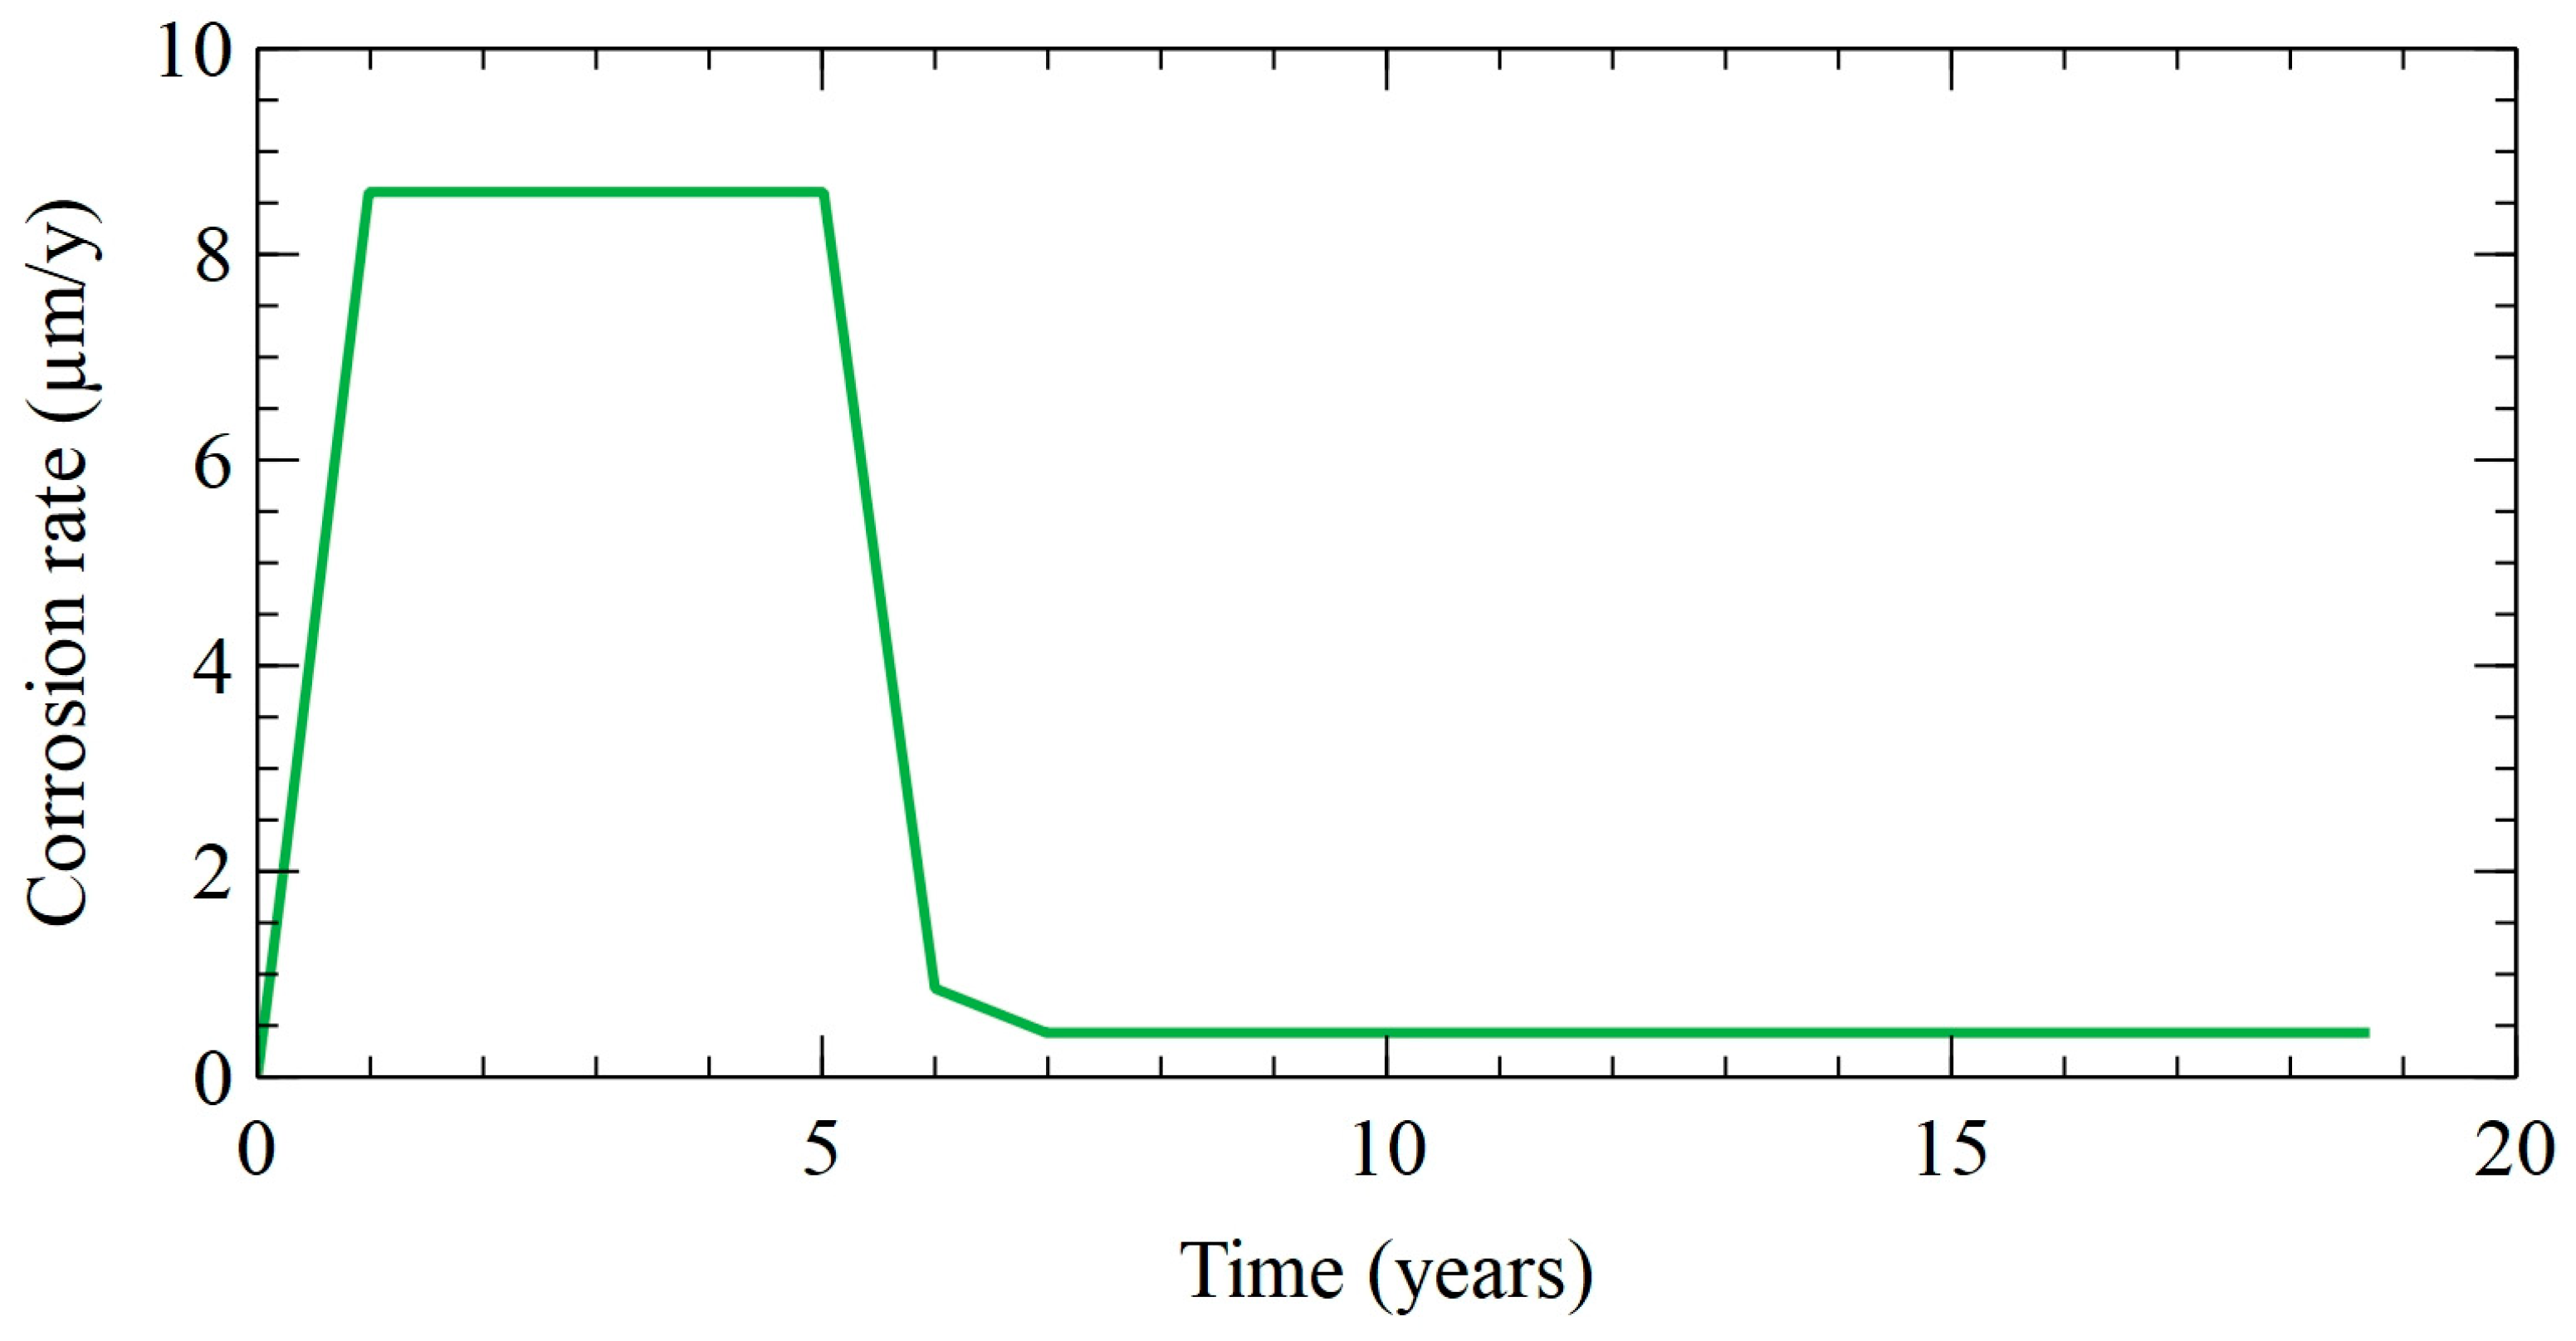
The numerical model presented here covers all the stages of Ref. [25]; however, the model is focused on stages 2 and 3, when the oxygen is depleted in the steel liner surface and begins the anaerobic Fe corrosion but is still available in the bentonite. The numerical model assumes that there is no external oxygen source; therefore, the system is closed, and the only available oxygen is the initial oxygen present in the bentonite. Steel liner corrosion was simulated by prescribing a time function, which is shown in Figure 5. Due to the complexity of simulating the aerobic corrosion process in the numerical model and the lack of detailed data of the aerobic phase in the FEBEX in situ test, the first aerobic corrosion stage was represented in a simplified manner in the reactive transport model. The corrosion rate was assumed to increase linearly up to 8.5 µm/y at the end of the first year and remain constant for 4 years. Later, the corrosion decreased drastically to 0.5 µm/y and remained constant until the end of the test (t = 18 years) (Figure 5). The corrosion rate function was calibrated over time to reproduce the experimental measurements of total Fe.
The model accounts for the following Fe minerals: goethite, hematite, and magnetite. Goethite precipitation is modeled at chemical equilibrium, while hematite and magnetite precipitation are modeled with kinetic rate laws taken from Ref. [41]. The specific surface areas of hematite and magnetite were calibrated to 210 m2/kg and 10 m2/kg, respectively, in order to reproduce the measured amounts of goethite and hematite, and to prevent the formation of magnetite, which was not observed in the bentonite samples.
Porosity changes due to the precipitation of corrosion products were not considered, as the associated volume is small compared to the bentonite pore space and is not expected to affect the transport processes significantly.

2.5. Computer Code

The reactive transport model of the FEBEX in situ test was performed with the finite element reactive transport code CORE2D V5 [42], which is a code for transient saturated and unsaturated water flow, heat transport, and multicomponent reactive solute transport under both local chemical equilibrium and kinetic conditions in heterogeneous and anisotropic media. The flow and transport equations are solved with Galerkin triangular finite elements and a Euler scheme for time discretization. The chemical formulation is based on the ion association theory and uses an extended version of the Debye–Hückel equation (B-dot) for the activity coefficients of aqueous species. CORE2D V5 relies on the thermodynamic database ThermoChimie v10.a [34]. The code is based on the sequential iteration approach and considers the changes in porosity due to mineral dissolution/precipitation reactions and their feedback effect on the flow and transport parameters. The code has been benchmarked against other reactive transport codes [43] and extensively used for modeling laboratory and in situ experiments [44,45].

3. Model Results

3.1. Thermal and Hydrodynamic Results

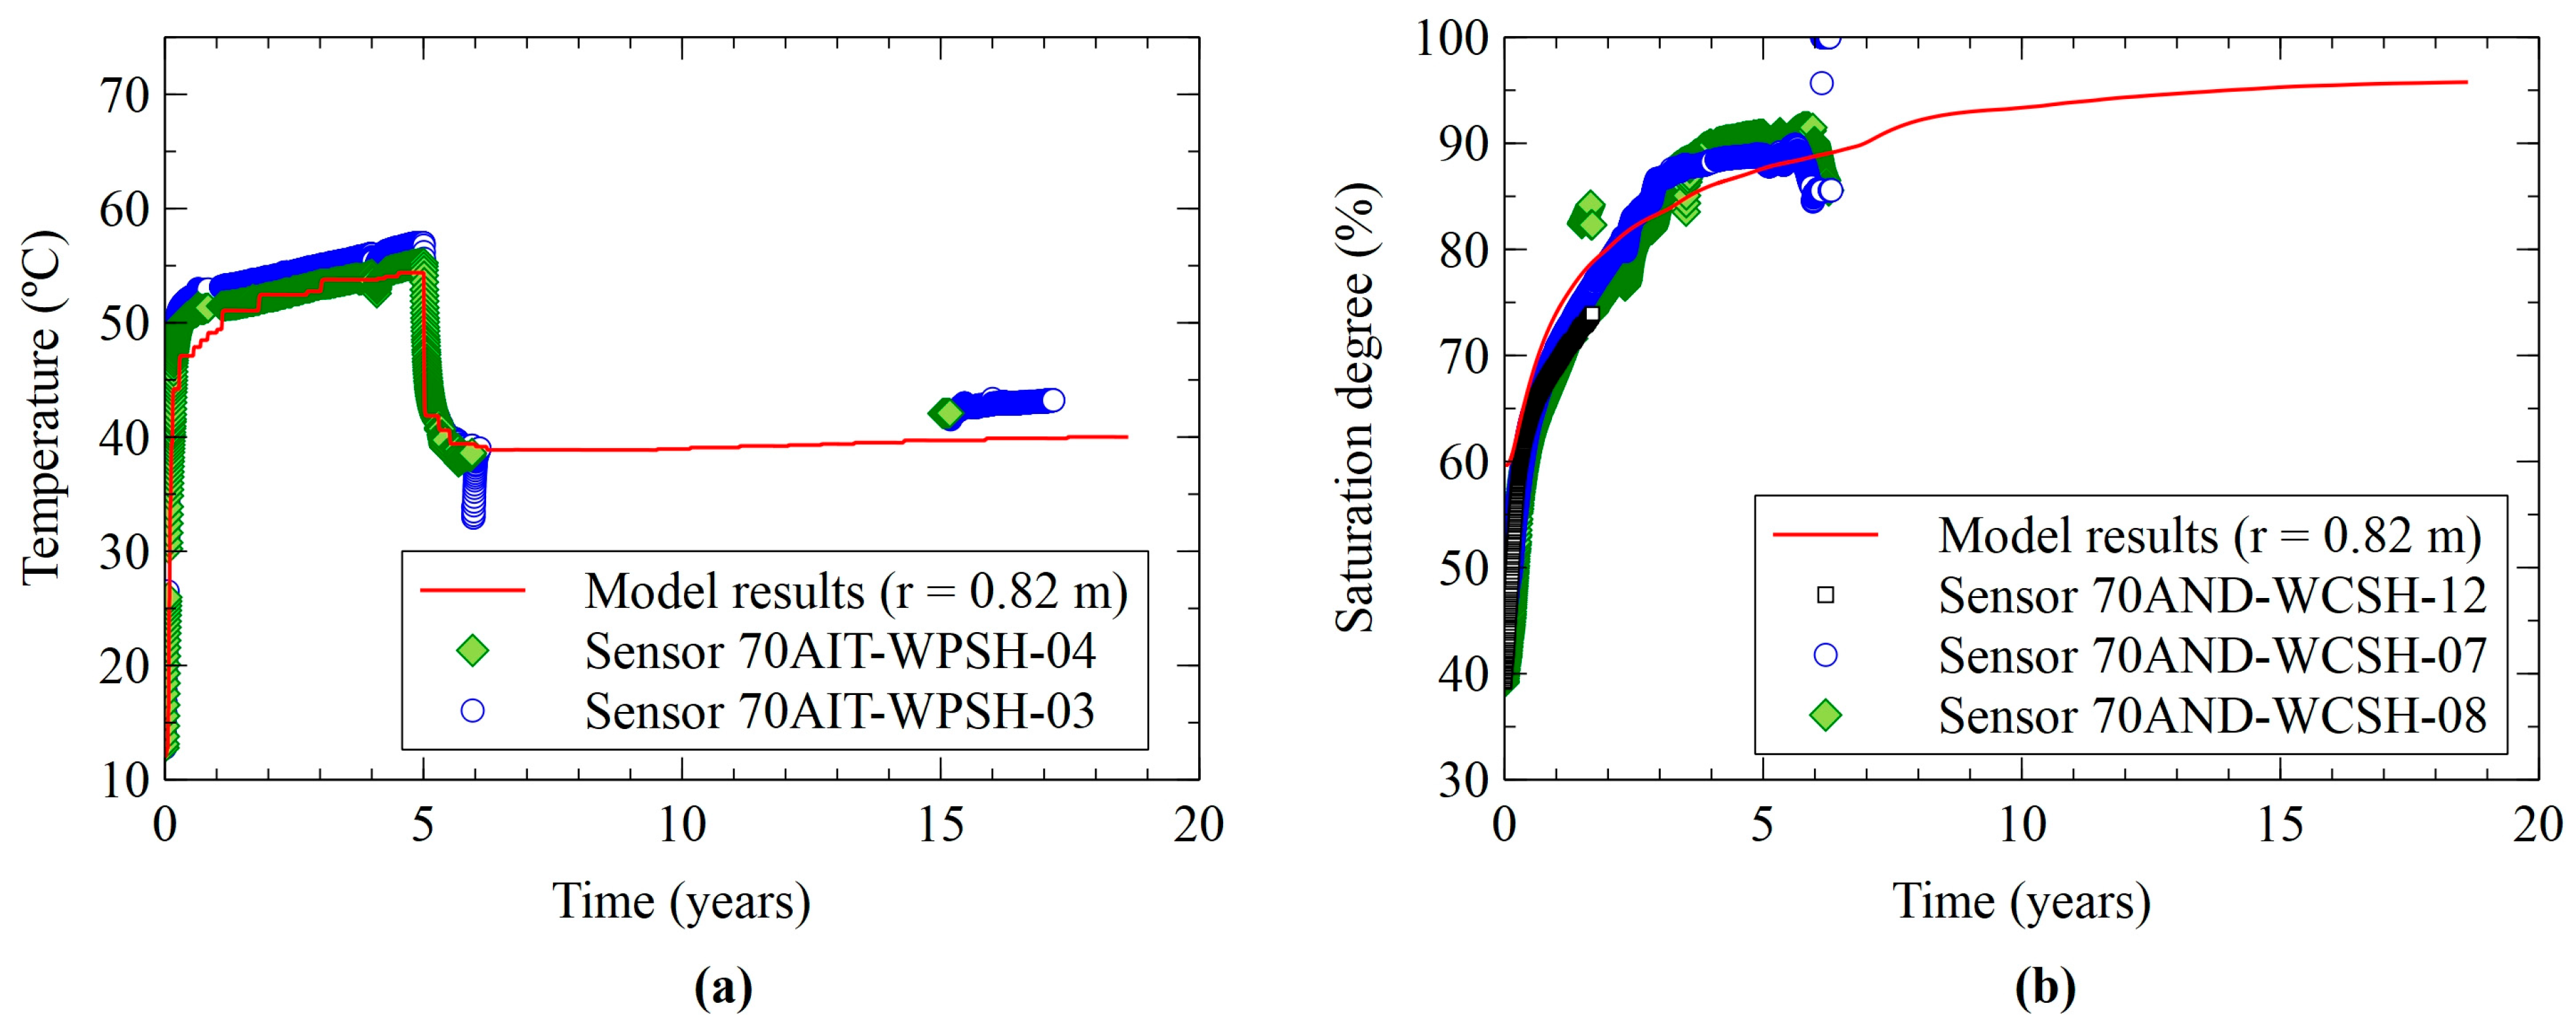
To verify the validity of the temperatures and water contents prescribed at the boundaries of the reactive transport model, the computed saturation degree and temperature at an intermediate radial distance of r = 0.82 m were compared with measured data from section H, which is located close to section 41 (see Figure 1). The saturation increases with time, with a faster evolution closer to the granite interface. The computed results reproduce the measured saturation trend (see Figure 6a). The temperature increases while heater 1 is operating and decreases once it is switched off. The computed temperatures show good agreement with the measured data (see Figure 6b).

3.2. Geochemical Model Results

3.2.1. Dissolved Species Model Results

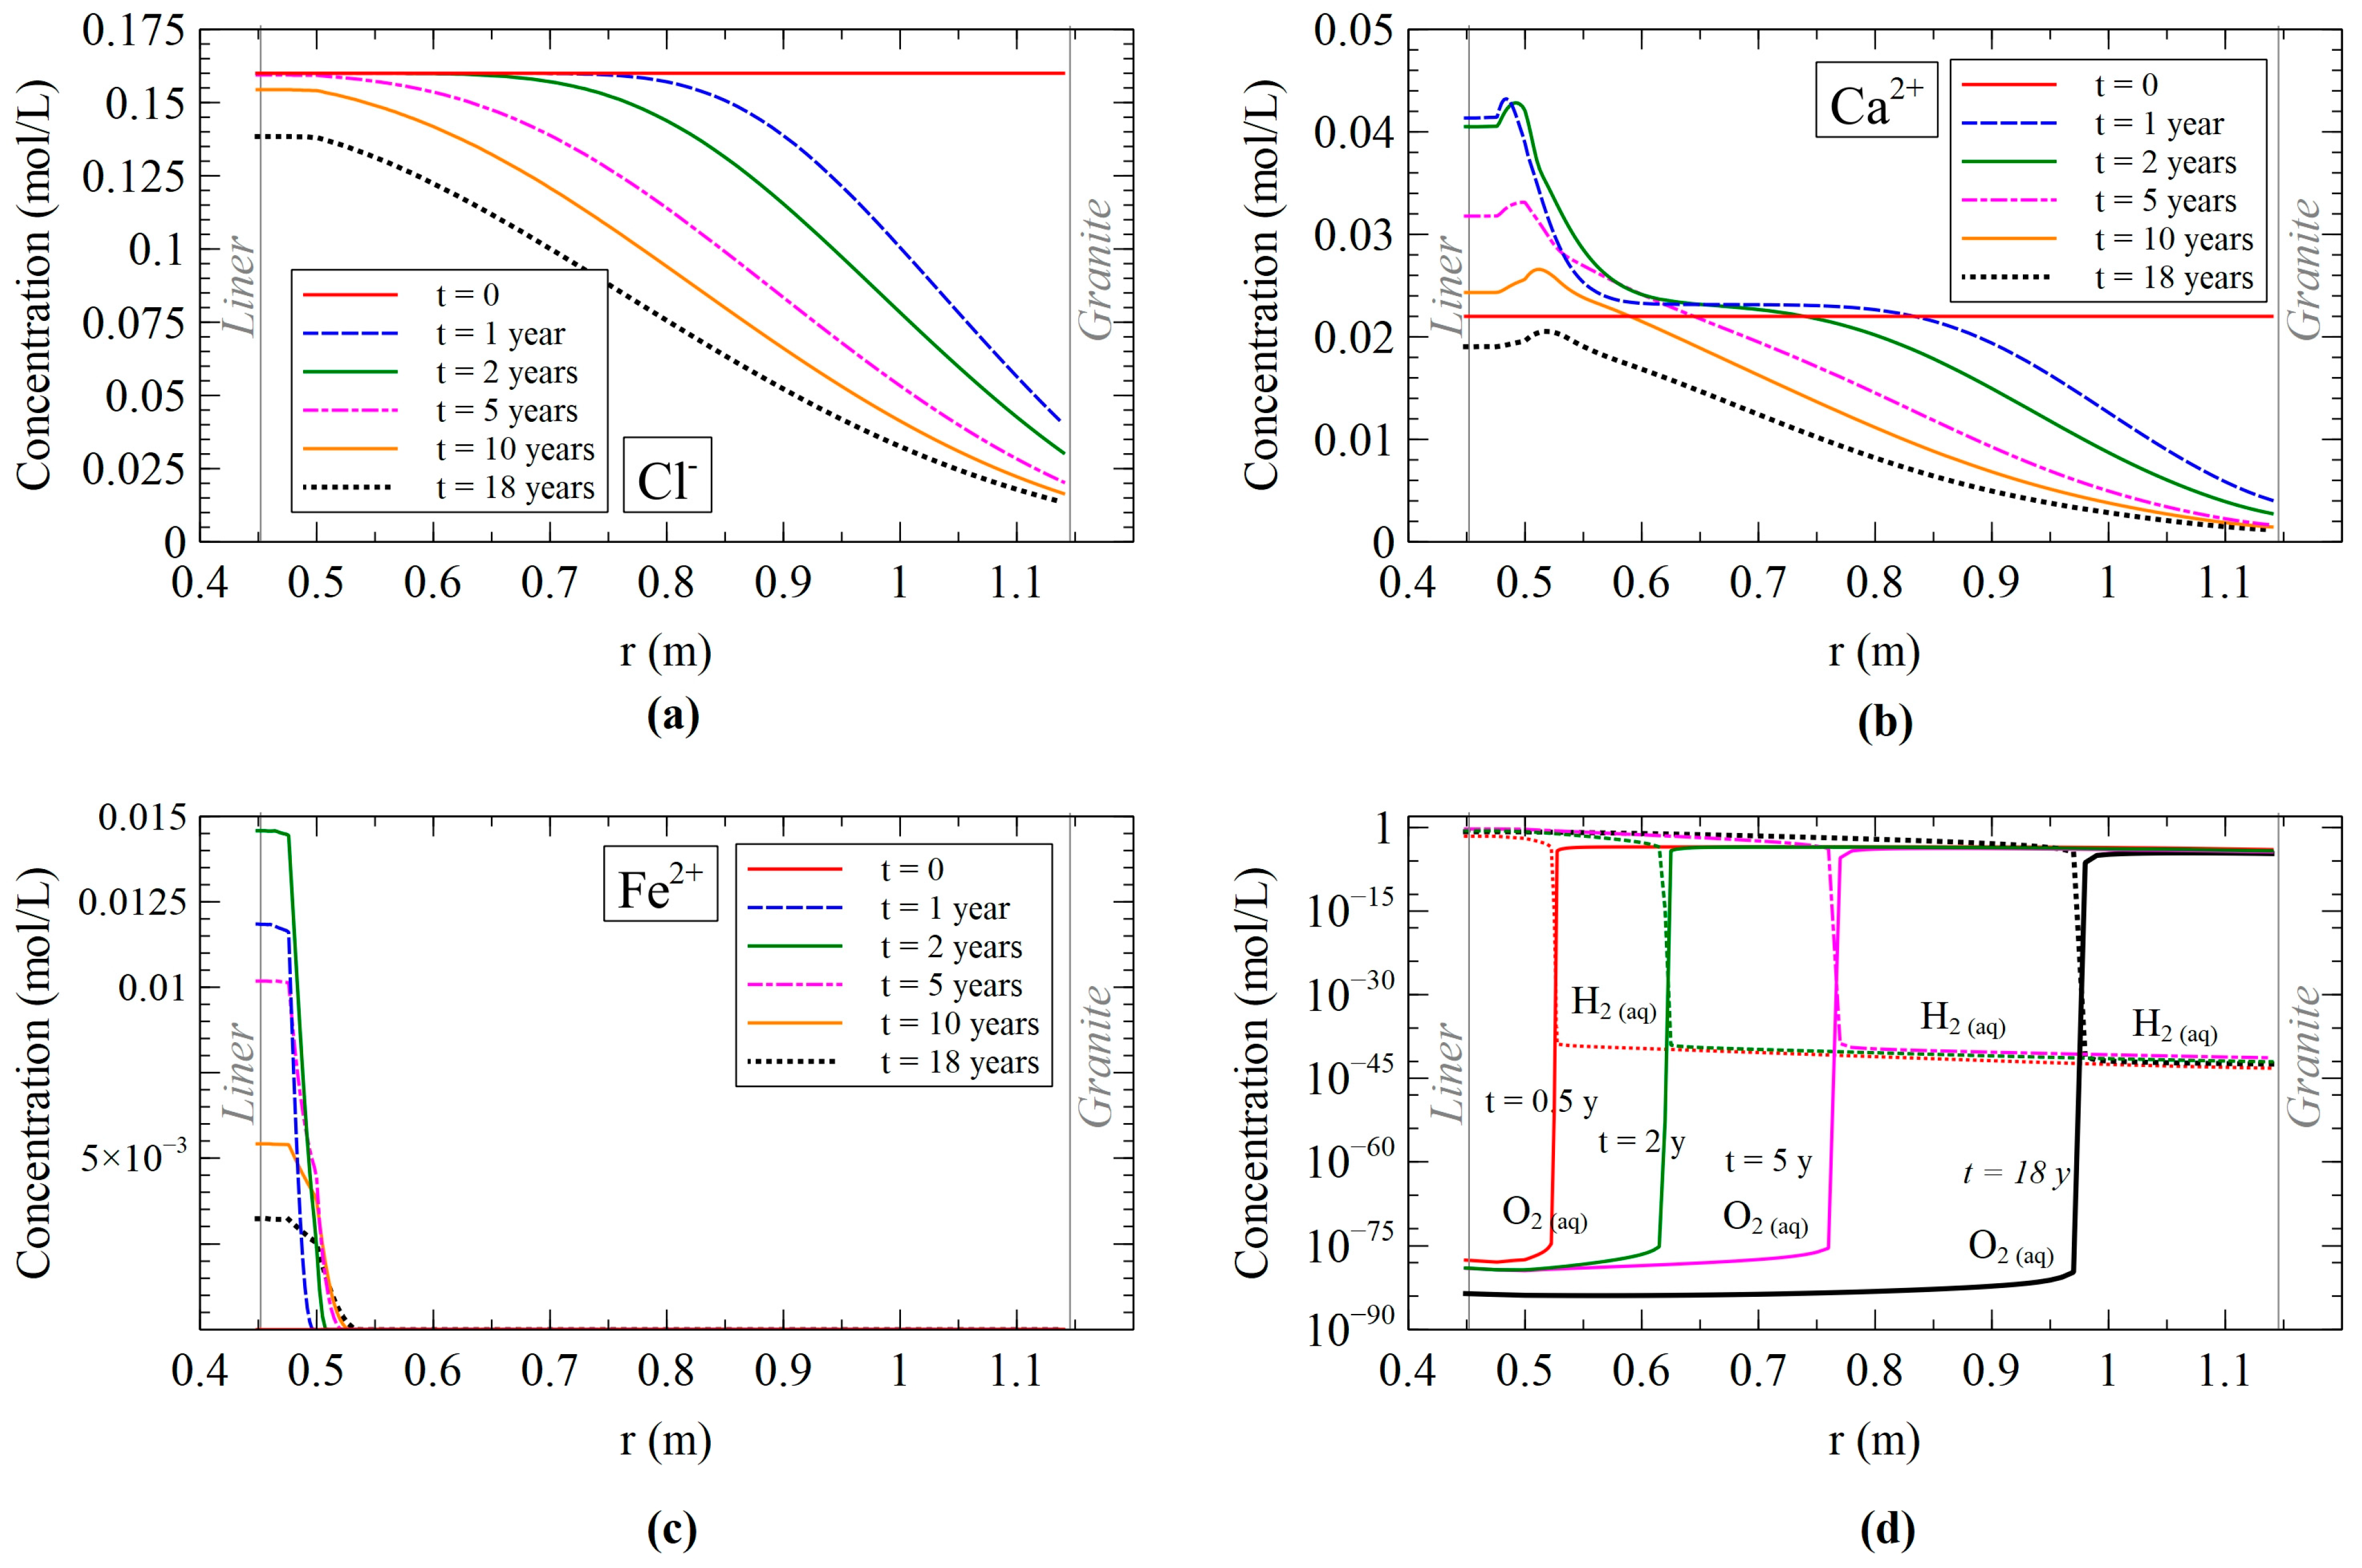
The computed concentration of dissolved Cl in the bentonite decreases near the granite interface (right boundary) due to the hydration from the granite and the low Cl concentration of the granite pore water boundary (Figure 7a). The concentration of Cl also decreases near the liner due to the dilution from the granite pore water. The computed concentration of dissolved Cl in the FEBEX in situ test shows an advective–diffusive front from the granite boundary into the bentonite, which progresses with time. The computed dissolved concentrations of Na+, K+, Ca2+, and Mg2+ (see Figure 7b and Figure S1) show similar patterns to those of Cl, but they are also affected by mineral dissolution/precipitation and cation exchange reactions.
During the first two years, the computed concentration of dissolved Ca2+ increases in the bentonite adjacent to the liner (0.45 m < r < 0.55 m) and decreases near the granite interface (0.75 m < r < 1.15 m). At later times, the dissolved Ca2+ concentration decreases throughout the bentonite (Figure 7b). These concentration patterns result from the combined effects of solute transport, calcite dissolution/precipitation, and calcium cation exchange.
The computed concentration of dissolved HCO3 in the bentonite increases due to calcite dissolution (Figure S1). The computed concentration of dissolved sulphate shows patterns similar to those of Cl concentrations because gypsum neither dissolves nor precipitates. The computed concentration of dissolved H4SiO4 shows minor changes because the granite boundary concentration is similar to that of the bentonite and quartz precipitation/dissolution is small (Figure S1).
The computed concentration of dissolved Fe is largest in the liner and in the bentonite near the liner interface (0.45 m < r < 0.55 m) (Figure 7c). The largest concentration of dissolved Fe concentration (0.0146 mol/L) occurs at t = 2 years, when the corrosion rate is largest. Then, the concentration near the liner decreases due to goethite and hematite precipitation, Fe sorption, and Fe diffusion into bentonite. Variations in the concentration of dissolved Fe are further coupled to pH changes, which limit and control goethite solubility.
The high Fe concentrations predicted in the model (exceeding 10 mmol/L) result from the suppressed precipitation of Fe(II) secondary mineral phases, particularly magnetite. While magnetite is included in the model, its precipitation kinetics were intentionally slowed down to such an extent that its formation is nearly suppressed, leaving goethite as the solubility-controlling Fe phase. This modeling choice was made to enable the reproduction of the experimentally observed thickness of the Fe–bentonite interaction zone in the FEBEX in situ test. Simulations with faster Fe(II) precipitation kinetics failed to reproduce the extent of the Fe diffusion front observed in the experiment.
The high concentrations of dissolved Fe predicted in the model (>10 mmol/L) result from the kinetic restrictions imposed on the precipitation of Fe(II) mineral phases, especially magnetite. Magnetite precipitation was assumed to be kinetically controlled with a very low-rate constant, chosen to reproduce the observed profiles of goethite and hematite and the extent of the Fe–bentonite interaction zone. Although these concentrations exceed those commonly observed in natural systems, they enable a closer match to experimental data. In contrast, the model of Kiczka et al. (2024) [16] predicted Fe concentrations of ~0.1 mmol/L, two orders of magnitude lower, but underestimated the thickness of the interaction zone. This contrast illustrates the trade-off between geochemical realism in solute concentrations and the accurate reproduction of transport–reaction fronts.
The initial concentration of dissolved O2 is relatively high but decreases over time as O2 is consumed by corrosion and the precipitation of corrosion products (Figure 7d). The spatial distribution of O2 in the bentonite develops into sharp concentration fronts that migrate from the liner toward the granite boundary. Across these fronts, O2 concentrations are ~3.30 × 10⁻⁴ mol/L on the oxic side and <10−75 mol/L on the anoxic side. Dissolved H2 exhibits profiles with the opposite trend. Figure 7d indicates that aerobic conditions prevailed near the liner for at least the first 0.5 years.
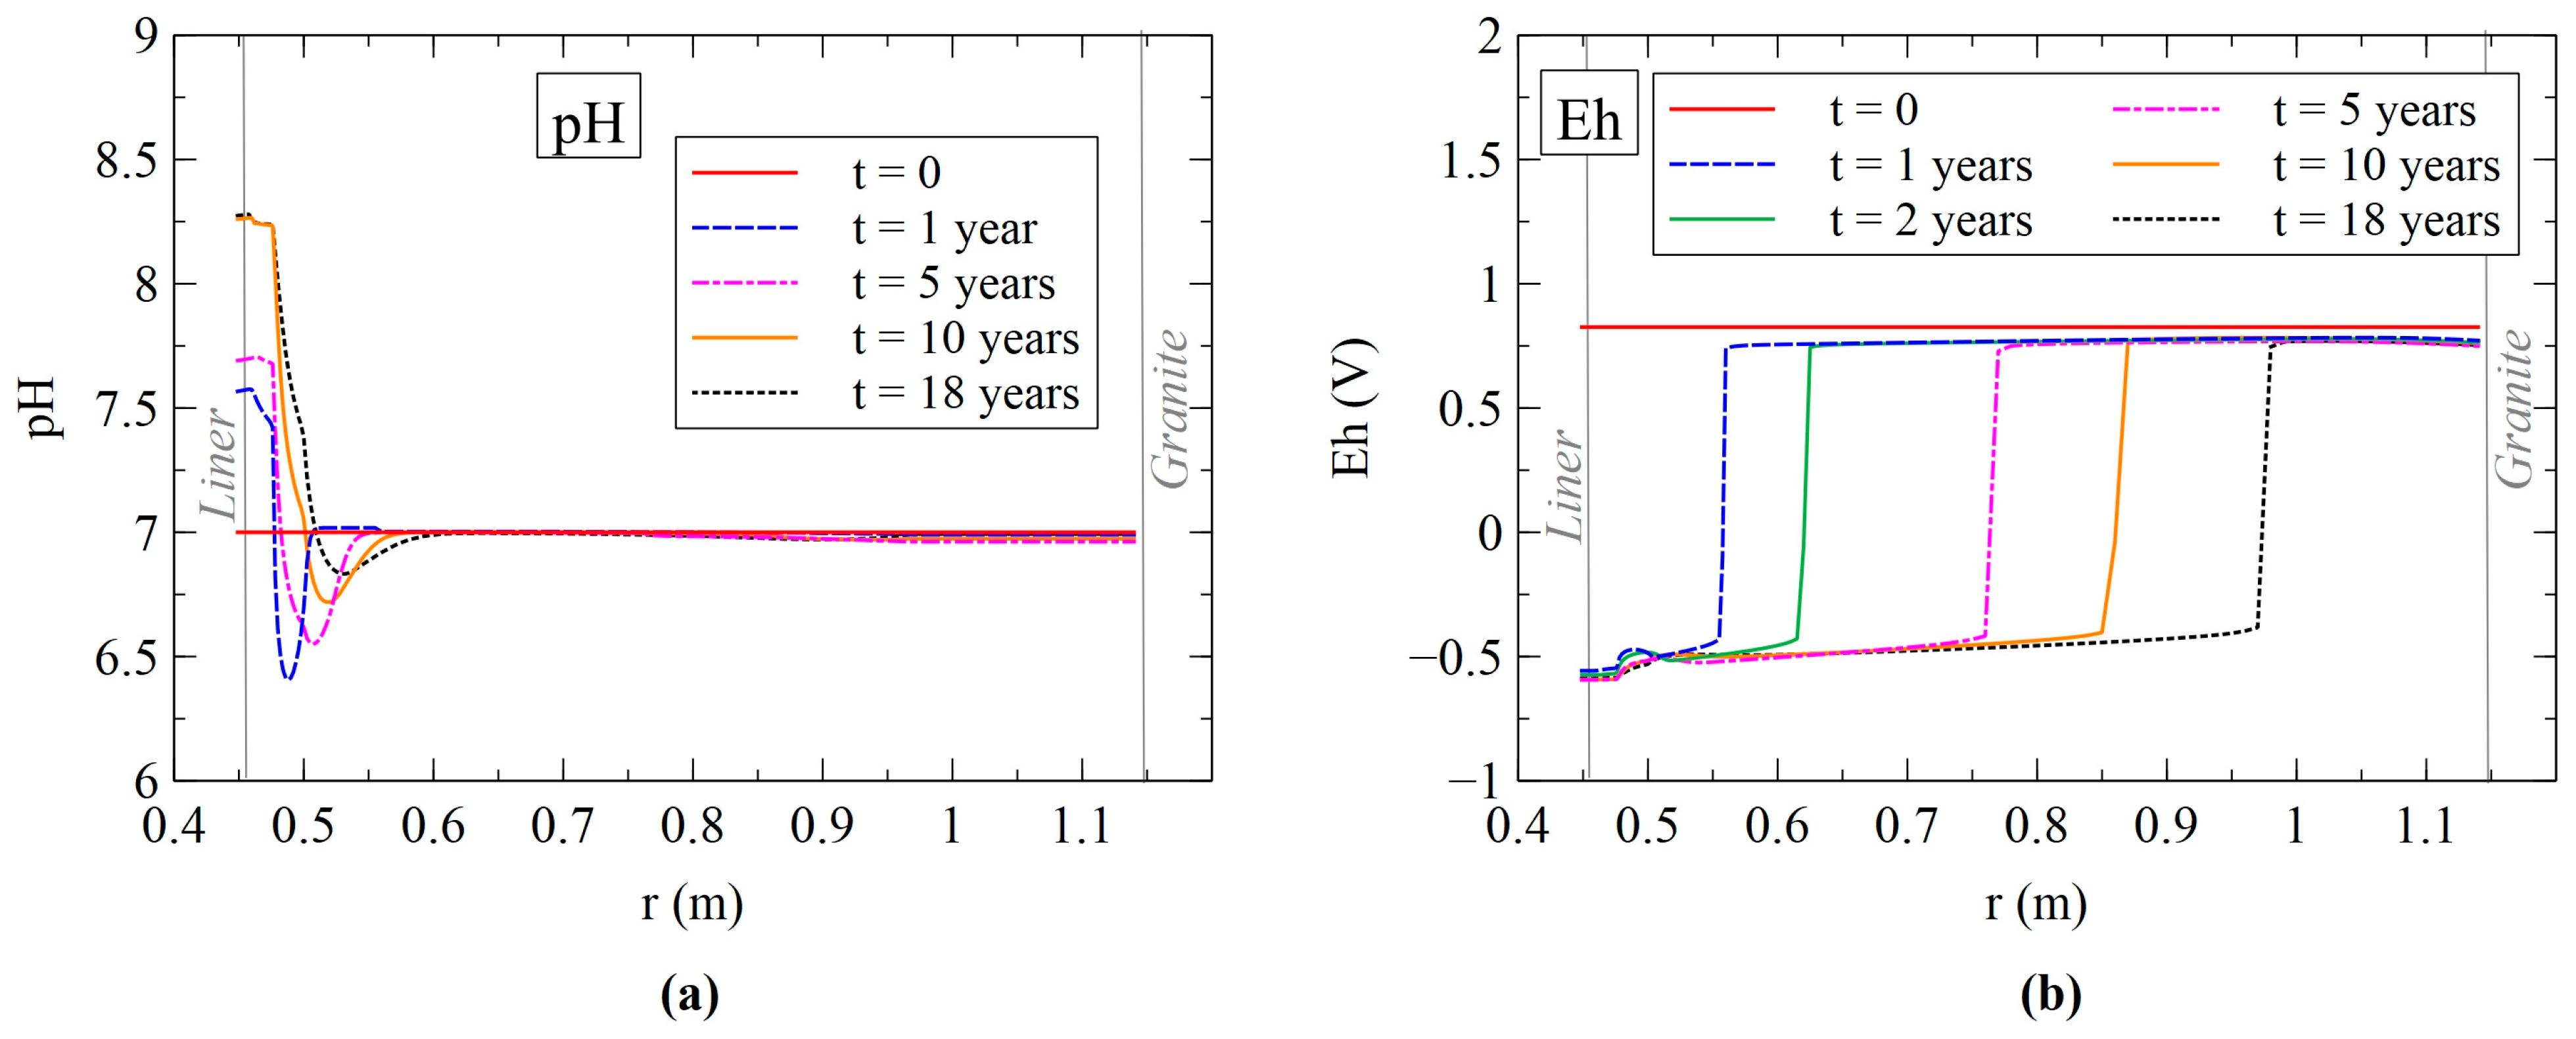
The time evolution of pH and the concentration of dissolved Fe are controlled by the dissolution/precipitation of corrosion products, Fe exchange, and Fe and proton surface complexation reactions. Liner corrosion caused an increase in pH in the liner and in the bentonite near the liner (0.45 m < r < 0.475 m) from 7 to 8.15 at 18 years (Figure 8a). In addition, the pH decreases in bentonite (0.475 m < r < 0.60 m) due to goethite and hematite precipitation (Figure 8a). The computed pH in the rest of the bentonite does not change. The computed Eh decreases with time to −0.57 V in the bentonite near the liner and −0.46 V in the rest of the bentonite due to liner corrosion and the precipitation of corrosion products (Figure 8b). The calculated values of pH and Eh in the bentonite near the liner are similar to those calculated in the reactive transport model of the FEBEX in situ test of Ref. [16], in which pH increases from 7.8 to 8.3 while Eh decreases from 0.7 to −0.27 V.

3.2.2. Mineral Precipitation/Dissolution Model Results

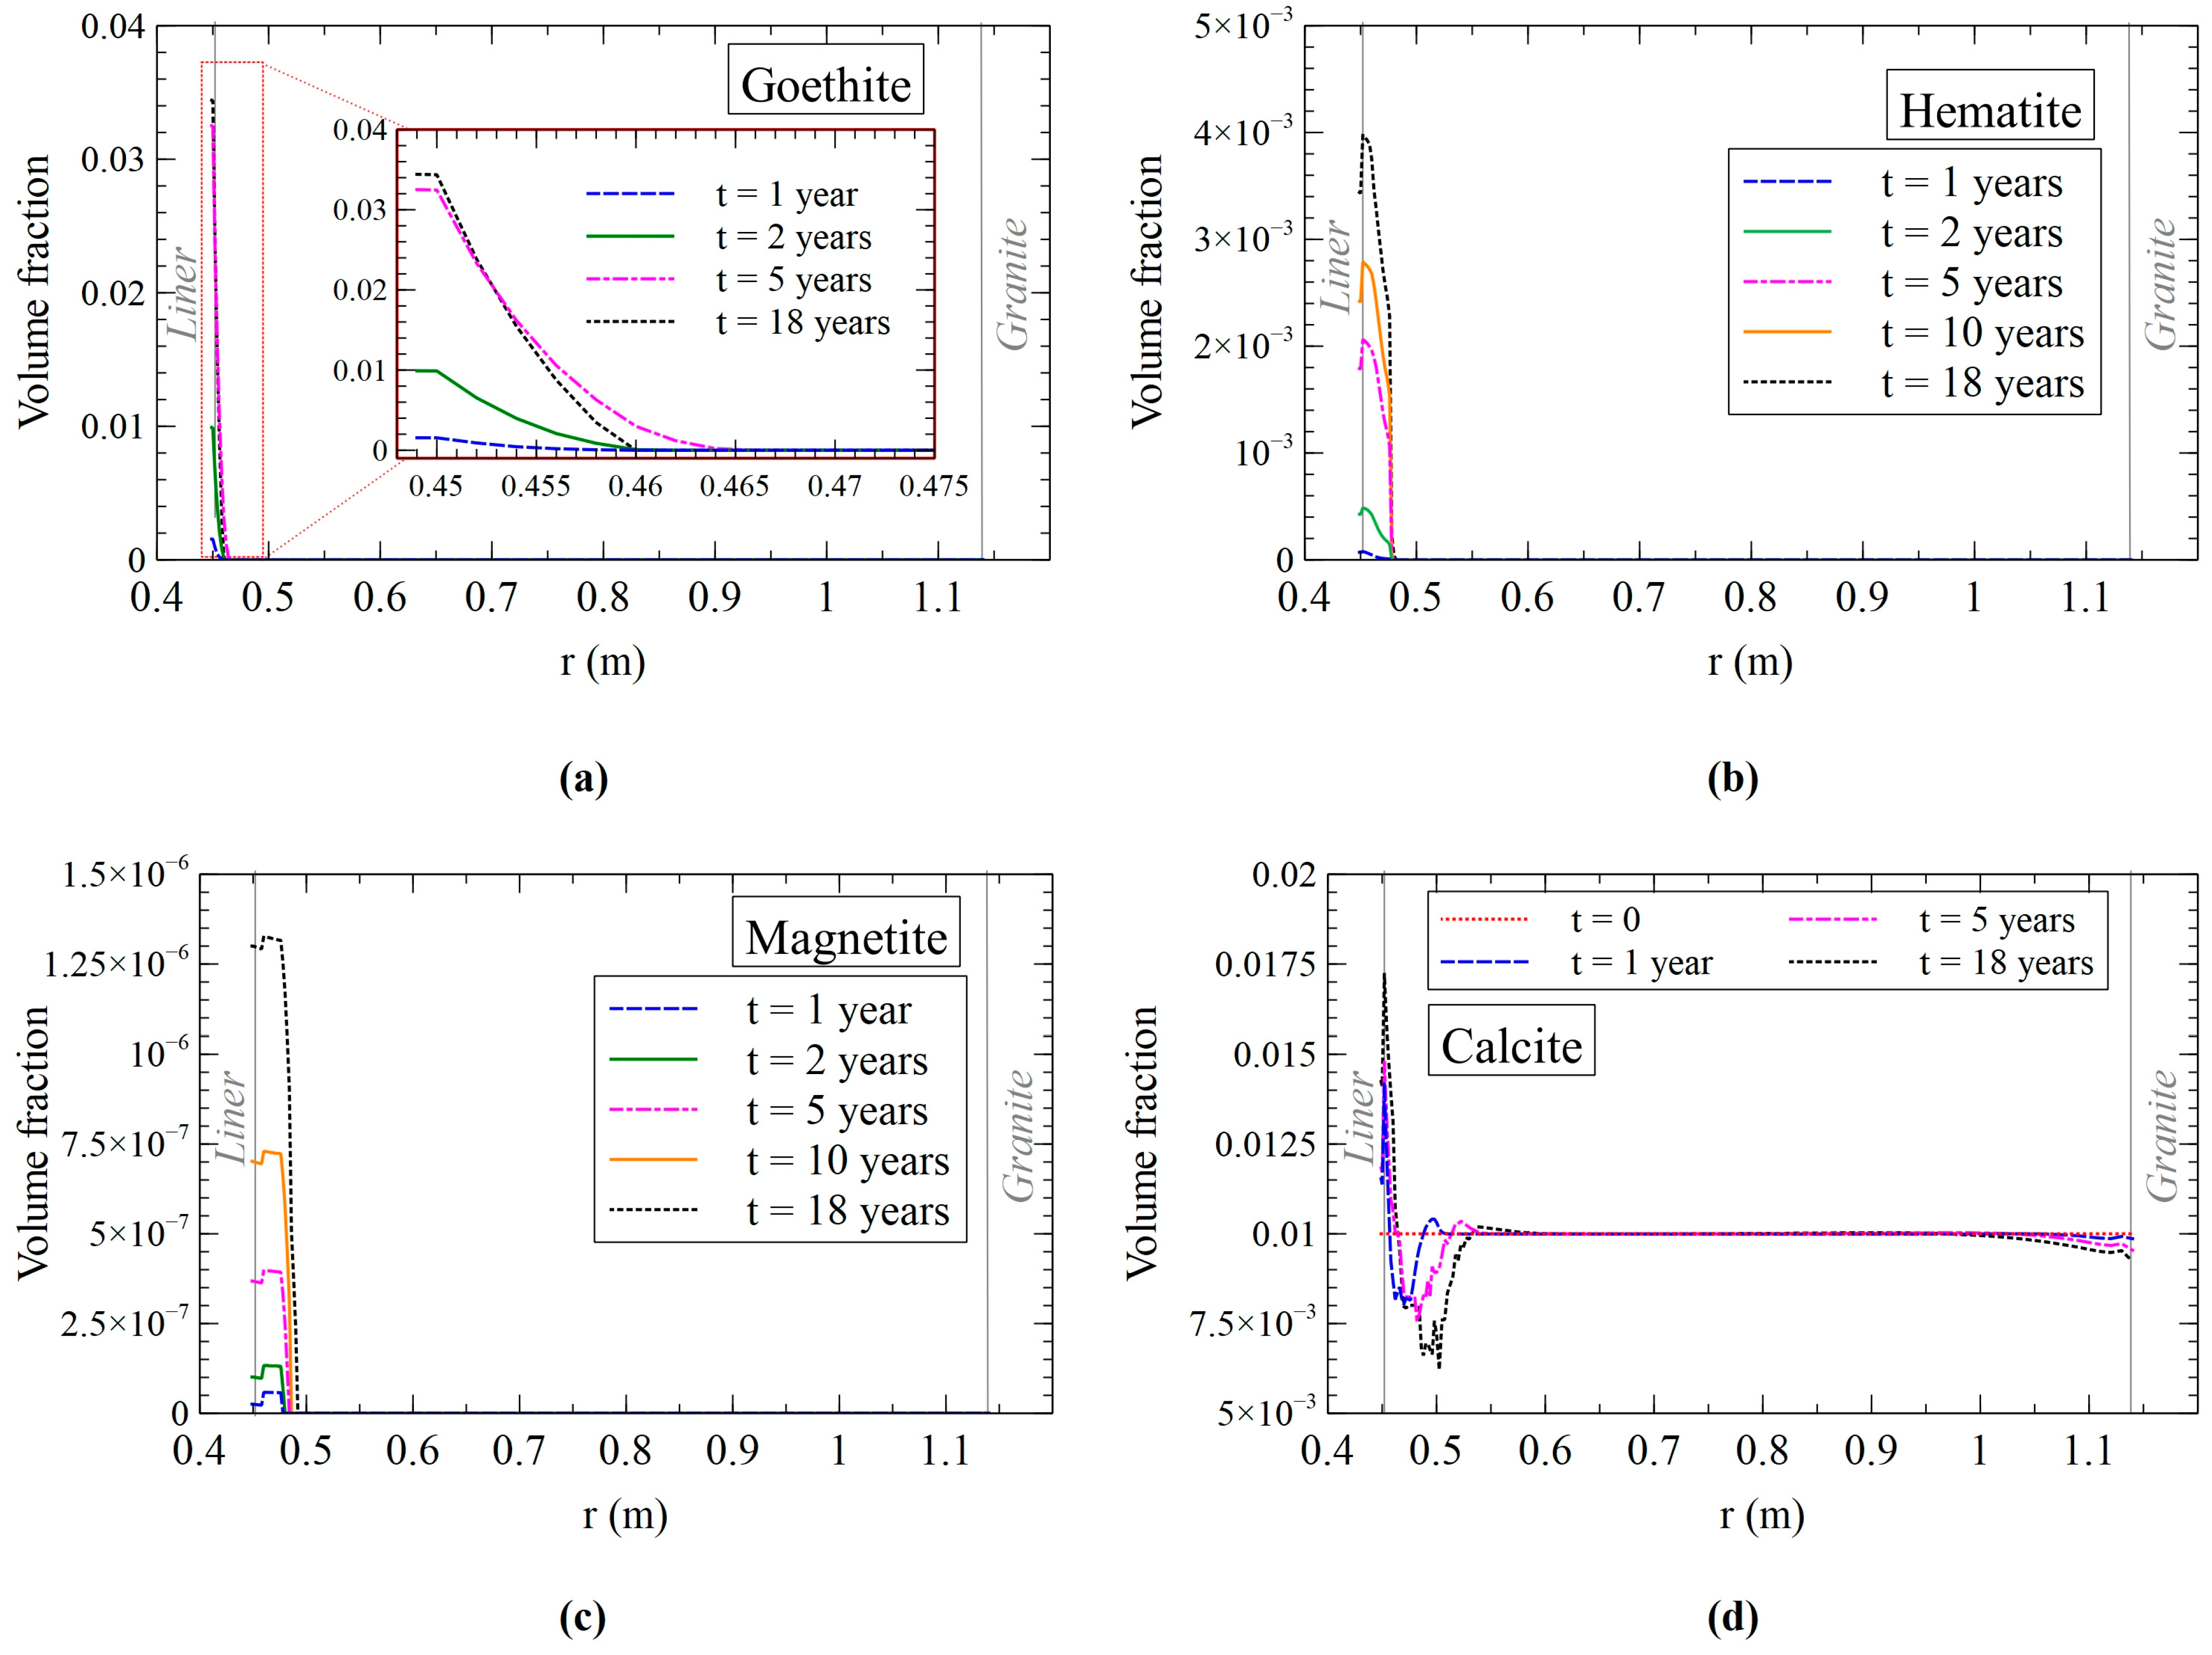
The model results indicate that goethite precipitates in the bentonite near the liner (Figure 9a), with the precipitation zone extending up to 10 mm into the bentonite (0.45 m < r < 0.46 m). The most significant accumulation occurs within a band about 5 mm thick. Goethite precipitation decreases after 5 years as the corrosion rate declines. In contrast, hematite precipitates over a broader zone, extending about 30 mm into the bentonite, but the total amount is an order of magnitude smaller than that of goethite due to the calibrated kinetic constraint on hematite precipitation (Figure 9b). The kinetic limitation is even stronger for magnetite, whose precipitation is nearly negligible (Figure 9c).
The computed log saturation indices (log Ω) of goethite, hematite, and magnetite vary little with time. Near the liner (r = 0.452 m), the values at a time of high corrosion rate (t = 2 years) are similar to those at t = 18 years, equal to 4.5 × 10⁻¹³, 2, and 5, respectively. These results indicate that bentonite porewater is at equilibrium with goethite and strongly oversaturated with respect to hematite and magnetite. The large oversaturation indices arise from the kinetic control on hematite and goethite precipitation, with the calibrated rate laws restricting their precipitation so that the computed amounts remain consistent with experimental observations.
Calcite precipitates in a narrow band adjacent to the liner (0.45 m < r < 0.46 m) as a result of the pH increase induced by liner corrosion. In contrast, calcite dissolves in the interval of 0.46 m < r < 0.53 m, where pH decreases due to the precipitation of corrosion products. Calcite dissolution also occurs near the granite boundary, where granitic porewater is more dilute than that of the bentonite (Figure 9d). Quartz dissolves near the liner (0.45 m < r < 0.46 m) as a result of the pH increase induced by liner corrosion and precipitates within a very narrow zone (0.46 m < r < 0.47 m). Gypsum shows no significant changes (not shown).

3.2.3. Cation Exchange and Surface Complexation Model Results

The computed concentrations of exchanged cations in the bentonite show slight changes only in a narrow zone near the liner (0.455 m < r < 0.5 m) (see Figure S3) and near the granite boundary. The computed concentrations of exchanged Na+ and Mg2+ in the bentonite near the liner decrease from their initial values. In contrast, the computed concentration of exchanged Ca2+ increases from its initial value near the liner and the granite interface, where calcite dissolution increases the concentration of dissolved Ca2+ (Figure S3). The concentration of exchanged Fe2+ increases from its initial value as a result of Fe released by liner corrosion.
Fe2+ sorption takes place only in the strong site (SsOFe+) and weak site #1 (Sw1OFe+). The computed concentration of sorbed species is shown in Figure S4.

3.3. Dissolved, Precipitated, Exchanged, and Sorbed Iron Model Results and Comparison with the Measured Data

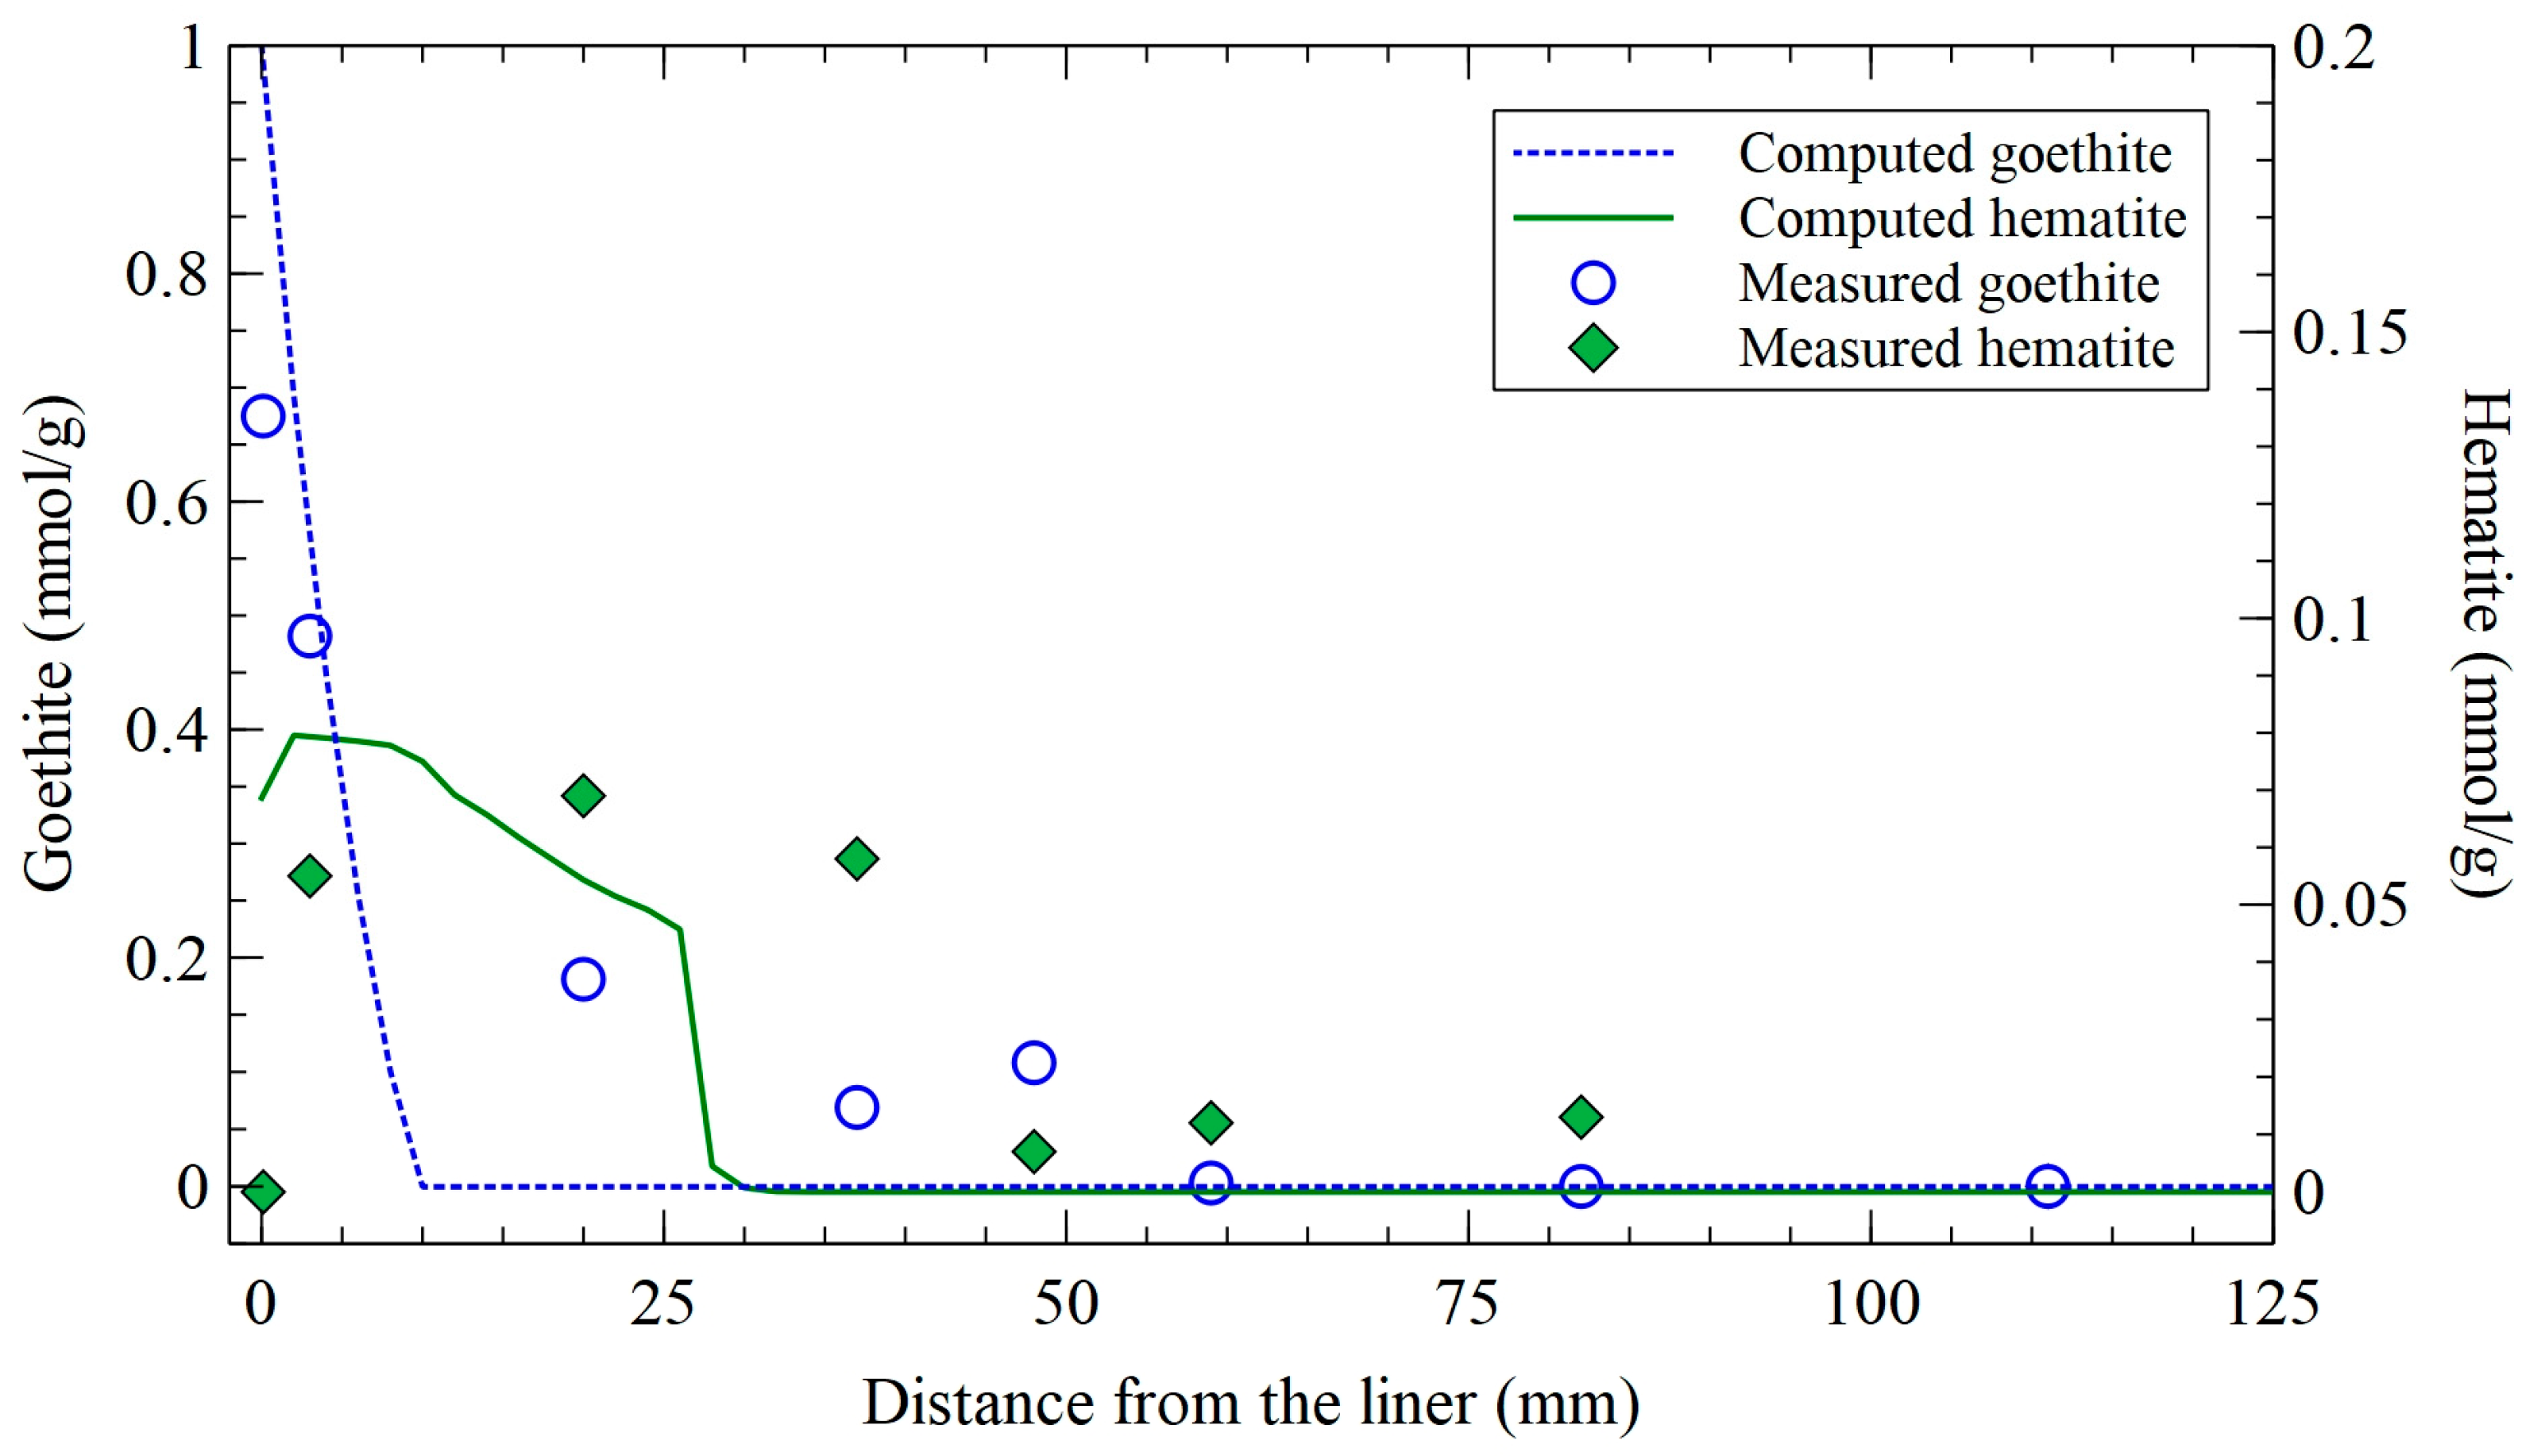
The comparison between model results and measured data was carried out in terms of differences between Fe content at t = 18 years and that of unaltered bentonite from the FEBEX in situ test. Computed goethite precipitation reproduces the overall trend of the measurements but underestimates the penetration depth: The modeled front extends ~10 mm into the bentonite, compared to the ~50 mm observed. Agreement is good near the liner (d < 10 mm, where d is the distance from the liner interface; Figure 10), but concentrations are underestimated between 20 and 50 mm. Computed hematite results match both the magnitude and the extent of measured hematite near the liner (0 < d < 25 mm), although values are slightly underestimated at d = 37 mm. Overall, the fit to hematite data is acceptable, with modeled concentrations consistent with observations within the reported variability. In contrast, for goethite, the model reproduces the shape of the measured profile but underestimates the width of the precipitation zone. These discrepancies likely reflect simplifications and uncertainties in representing reactive transport processes, particularly gas conditions, O2 availability, and Fe transport.
Figure 11a shows the spatial distribution of measured and computed total Fe concentrations at t = 18 years. The modeled profile reproduces the general trend of the measurements, although concentrations are slightly higher near the liner interface and somewhat lower in the bentonite interior. Figure 11b illustrates the partitioning of total Fe into its main components: Fe minerals, dissolved species, exchangeable Fe, and sorbed fractions. Using a logarithmic scale highlights these differences and clarifies the spatial domains where the various Fe components dominate. Corrosion products (Fe minerals) dominate at 0 < d < 30 mm, are sorbed Fe at 30 < d < 90 mm, and dissolve Fe at d > 90 mm. Exchanged Fe is the smallest contributor to total Fe throughout.
Although the model does not reproduce the full extent of Fe–bentonite interactions observed by Ref. [26], it overcomes the limitations of Kiczka et al. (2024) [16], whose model underestimated the thickness of the interaction zone.

3.4. Iron, O2, and H2 Mass Balance

Fe, O2, and H2 mass balances were quantified by comparing their initial (t = 0) and final (t = 18 years) inventories (Table 4). After 18 years, 6% of the liner has corroded, releasing 1.95 moles of Fe. Of this, 0.88 moles precipitate as goethite (43.8%), 0.30 moles as hematite (15.7%), and 1 × 10⁻⁴ moles as magnetite (0.01%). The remaining Fe is partitioned among 0.67 moles of sorbed Fe (34.6%), 0.17 moles of exchanged Fe (8.8%), and 7 × 10⁻³ moles of dissolved Fe (0.36%) (Table 4).
Initially, 6 × 10⁻³ moles of dissolved O2 are present. After 18 years, only 2% of the initial O2(aq) remains, while 1.551 moles of H2(aq) are generated through iron corrosion. The mass balance thus clearly indicates that anaerobic corrosion is the dominant process.

3.5. Sensitivity Analysis

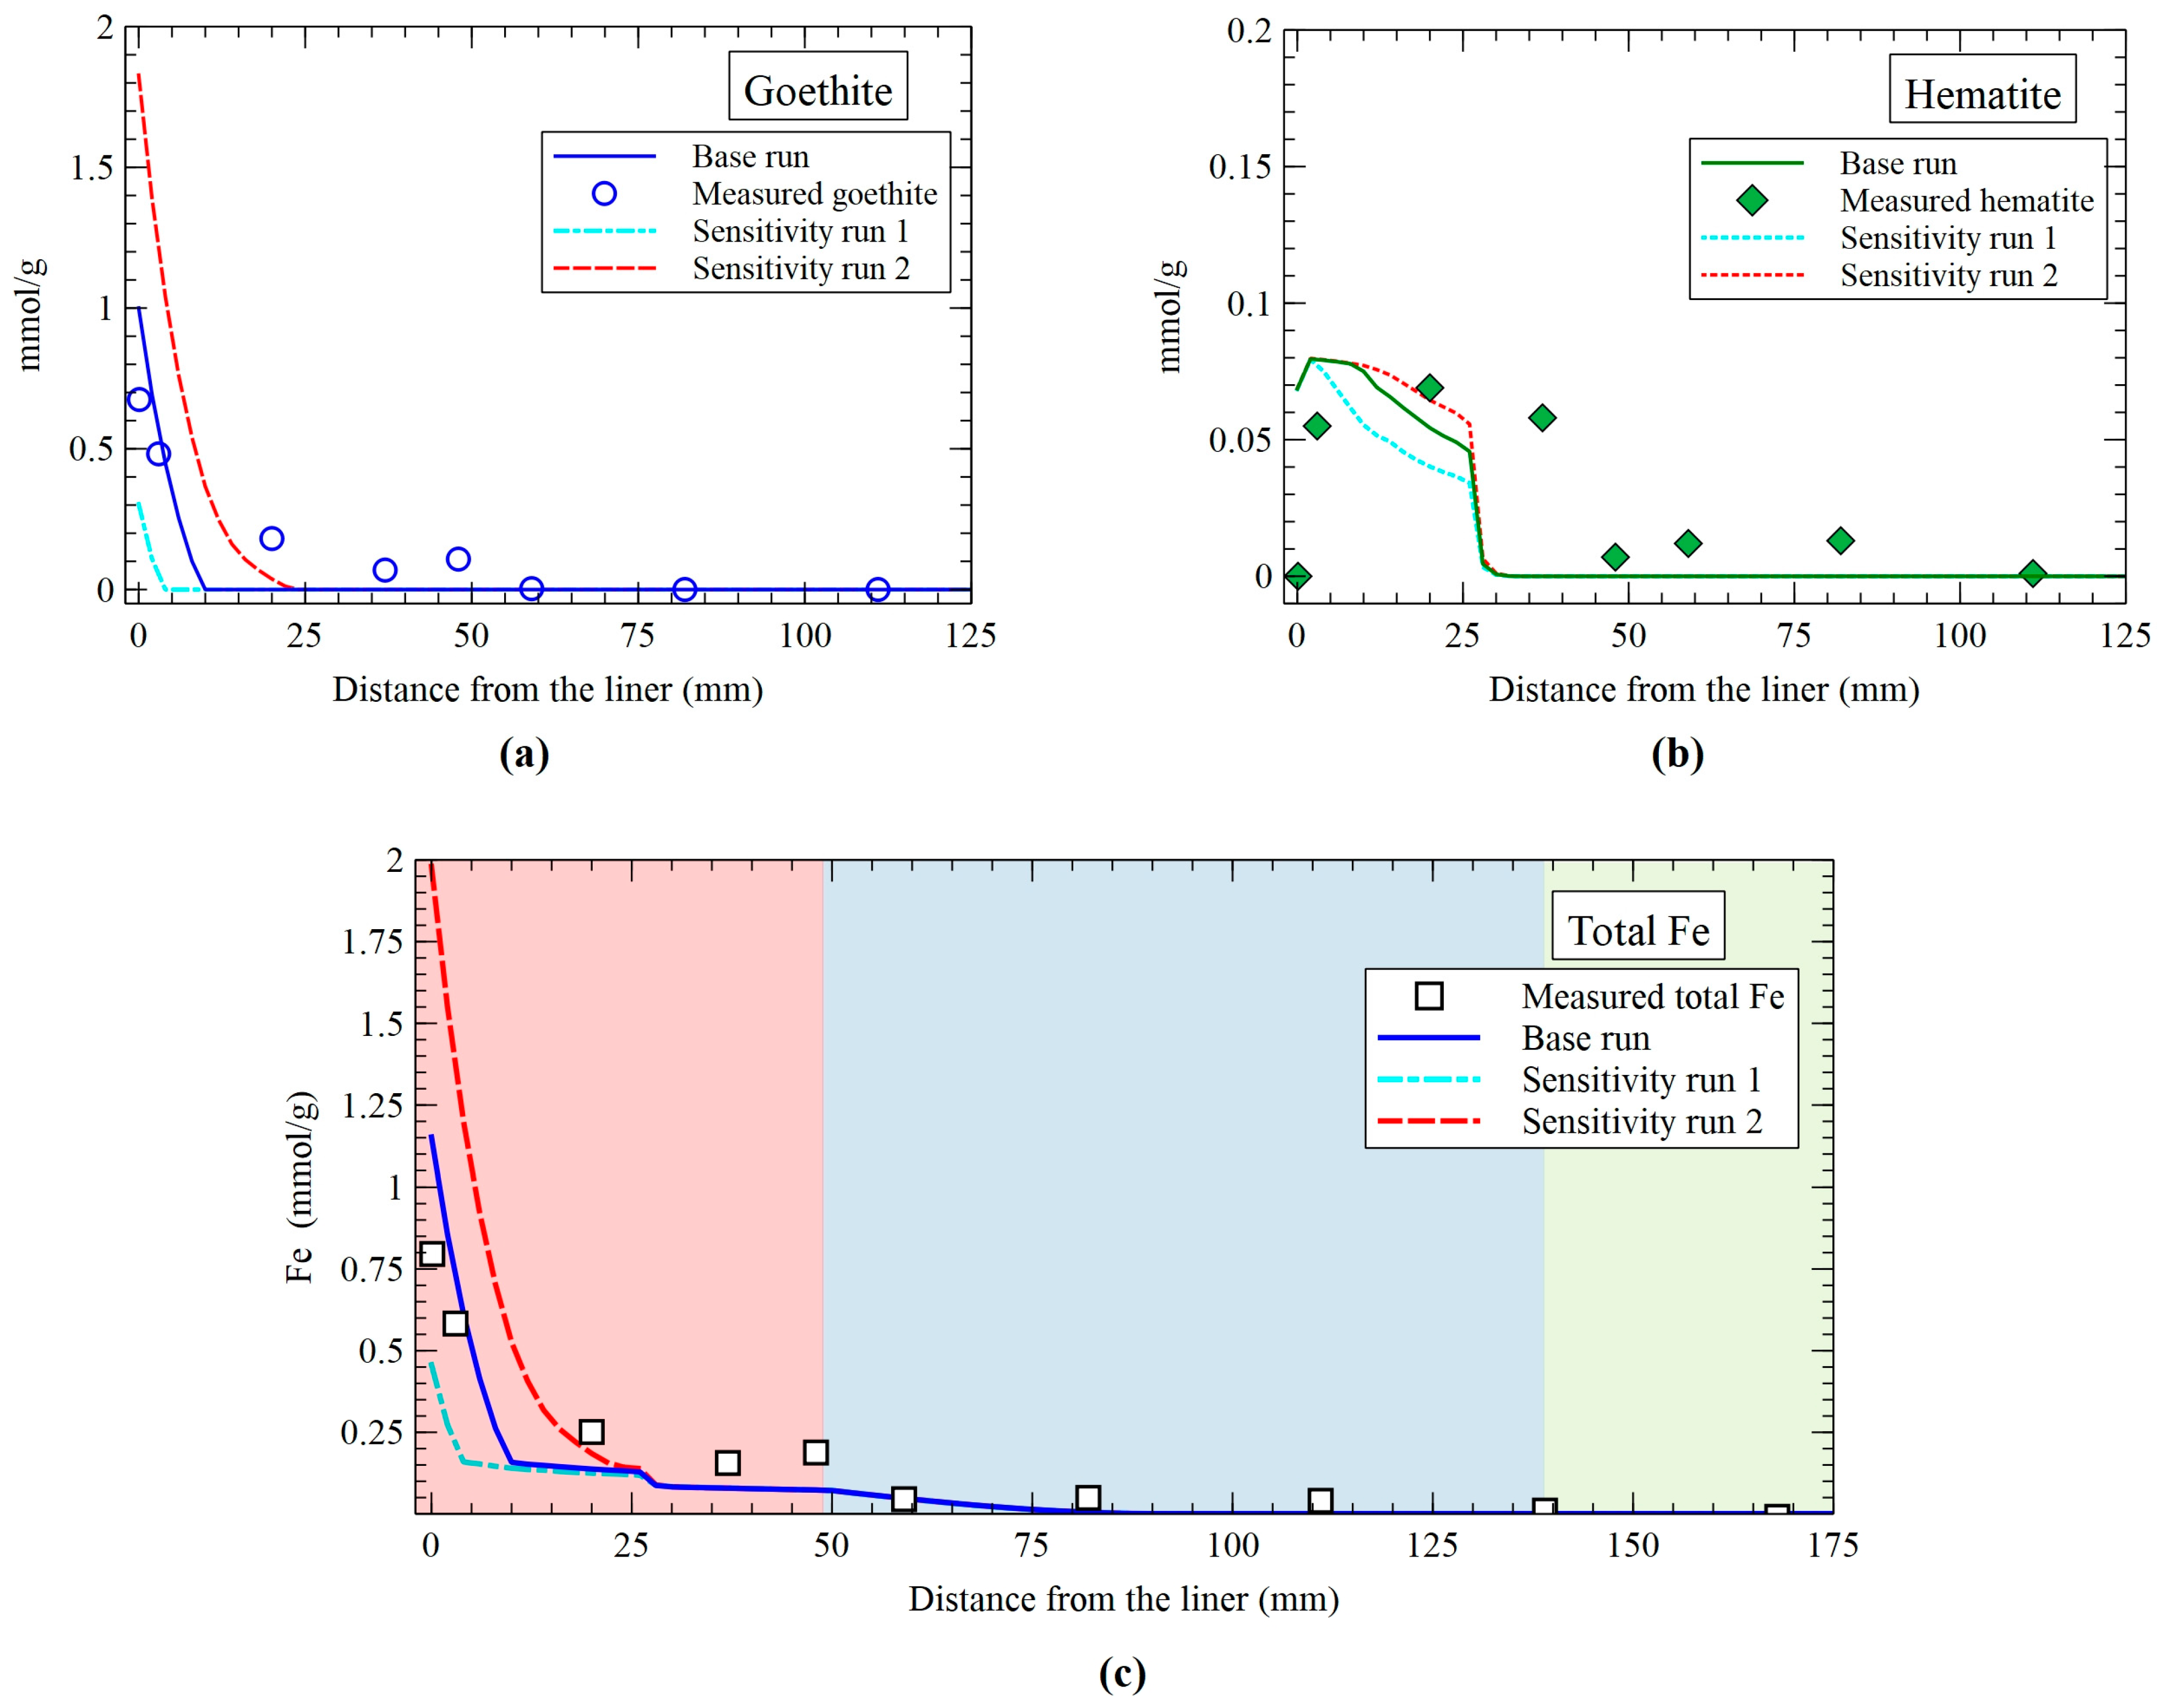
A sensitivity analysis was performed to study the sensitivity of the precipitation of corrosion products to changes in the time function of the corrosion rate. Two variants of the corrosion rate function of Figure 5 were considered in the sensitivity runs. The largest corrosion rate lasted until t = 5 years in the base run, while it lasted until t = 10 years in sensitivity run #1. Sensitivity run #2 assumed that the largest corrosion rate lasted only until t = 2.5 years.
Figure 12 shows the model results for goethite, hematite, and total Fe computed at t = 18 years for the base run and the sensitivity runs. Goethite precipitation is sensitive to the duration of the largest corrosion rate. The longer the duration of the corrosion rate, the larger the goethite precipitation near the liner and the larger the penetration of the precipitation front. Hematite is slightly sensitive to the duration of the large corrosion rate because hematite precipitation is kinetically controlled. The computed total Fe is sensitive to the duration of the phase with the highest corrosion rate, with the effect extending up to 25 mm from the liner. In contrast, the concentrations of sorbed, exchanged, and dissolved Fe are only mildly sensitive to this parameter (not shown in Figure 12).
To better understand the effect of temperature, an additional sensitivity run was performed in which heater 1 continued operating beyond 5 years instead of being shut down. The comparison with the base run indicates that (1) the temperature in the bentonite adjacent to the liner dropped by 20 °C in the base run; (2) overall model results are similar, although some differences arise due to temperature changes; (3) the computed pH in the sensitivity run is 0.5 units lower than in the base run (Figure 13a); (4) goethite precipitation is much smaller in the sensitivity run, suggesting that the large amount observed experimentally may have been induced by the temperature decrease associated with heater 1 shutdown (Figure 13b); and (5) hematite precipitation is much greater in the sensitivity run than in the base run and substantially exceeds the observed values (Figure 13c).

3.6. Discussion

The modeling carried out in this study quantifies corrosion rates that are consistent with the halos observed in bentonite, showing initially high rates under partly aerobic conditions that subsequently declined once anaerobic conditions prevailed. Although corrosion was most intense at the beginning of the test, aerobic corrosion represented only a minor fraction of the total. The results further indicate that goethite was the dominant corrosion product, even under reducing conditions. This behavior can be attributed to kinetic constraints on magnetite and hematite precipitation, as well as to the enhanced stability of goethite associated with pH increases and thermal evolution.
The predicted Eh at the Fe liner–bentonite interface (–0.57 V) does not ensure passivation of the liner. Therefore, corrosion is expected to continue as long as water is available, as is the case in our system. The corrosion rate adopted in the model may thus represent a conservative lower-bound estimate, and actual corrosion rates could be higher under non-passivating conditions. The dynamics of passive film formation and breakdown—strongly influenced by environmental factors such as chloride, sulfide, pH, and temperature—underscore the uncertainty in corrosion behavior (e.g., [47]). In situ studies at Fe–bentonite interfaces have reported corrosion fronts of 5–20 mm, highlighting the importance of redox conditions and corrosion products in evaluating the long-term performance of the liner [48,49].

4. Conclusions

A reactive transport model of steel/bentonite interactions at the FEBEX in situ test has been presented. The model is based on a detailed representation of temperature and unsaturated flow conditions borrowed from Ref. [28]. Given the uncertainties in O2 and redox conditions during the test and the limited data on liner corrosion and gas conditions at the liner–bentonite interface, liner corrosion was modeled by using a calibrated time-dependent corrosion rate. The specific surface areas of hematite and magnetite were also calibrated to prevent magnetite precipitation and to reproduce the measured profiles of goethite, hematite, and total Fe (including dissolved, exchanged, and sorbed forms). The model results show that (1) goethite precipitates in the bentonite, mostly near the liner (d < 10 mm); (2) hematite precipitates in a thick band of 30 mm into the bentonite, and its precipitation is smaller than that for the goethite; (3) the fronts of dissolved, exchanged, and sorbed Fe penetrate 80 mm into the bentonite; (4) pH increases near the liner to a maximum of 8.15 as a result of liner corrosion and decreases to a minimum of 6.3 at a distance of 1 cm from the liner due to goethite and hematite precipitation; and (5) Eh decreases to −0.58 V as a consequence of liner corrosion and the precipitation of corrosion products. The computed values of goethite precipitation near the liner (d < 10 mm) reproduce the observed red zone. However, computed goethite precipitation underestimates the measured data from 20 mm to 50 mm. Computed hematite results fit the amount and the extension of the measured hematite data near the liner (0 < d < 25 mm), and the computed results slightly underestimate the measured data from 35 mm to 50 mm. The pattern of the concentrations of dissolved, exchanged, and sorbed Fe reproduce the measured values. However, the computed total iron is smaller than the measured total Fe in the interval 15 mm < d < 50 mm, coinciding with the red-orange zone observed by Ref. [25]. The computed total Fe matches the measured data well in the blue zone (50 mm < d < 130 mm). Nevertheless, we consider the agreement sufficient for supporting the main conclusions of the study, as the model successfully reproduces the spatial distribution and relative abundance of the key Fe-bearing phases.
A sensitivity analysis was performed to study the sensitivity of the precipitation of corrosion products to changes in the corrosion rate time function. The larger the duration of the phase with a large corrosion rate, the larger the goethite precipitation near the liner and the precipitation front penetration. Hematite is slightly sensitive to the duration of the phase of large corrosion rate. The sensitivity run to the switching off of heater 1 shows that the computed pH in the sensitivity run is 0.5 units lower than in the base run. Goethite precipitation is much smaller in the sensitivity run, suggesting that the large amount observed experimentally may have been induced by the temperature decrease associated with heater 1 shutdown. Hematite precipitation is much greater in the sensitivity run than in the base run and substantially exceeds the observed values.
Although the FEBEX in situ test was not specifically designed to investigate corrosion, the experiment provided unique long-term evidence of steel–bentonite interactions under repository conditions. The results of our reactive transport model provide a mechanistic insight into long-term steel–bentonite interactions, supporting performance assessments of engineered barrier systems in geological disposal facilities.
Future research directions include (1) refining kinetic models of steel corrosion under coupled thermal, hydraulic, mechanical, and chemical conditions, including aerobic/passivation stages, localized and microbially influenced corrosion, and additional Fe mineral phases; (2) incorporating cation transport through the electrical double layer and interlayers; (3) coupling corrosion with microbial activity to account for sulfate reduction, organic matter degradation, Fe/Mn cycling, and biofilm effects; (4) assessing clay mineral transformations (e.g., smectite-to-illite, silica processes) and their impact on sealing capacity, swelling, and buffering; (5) modeling redox front evolution and bentonite feedbacks; (6) including H2 generation and transport and their effects on bentonite integrity; (7) applying uncertainty quantification and sensitivity analyses to identify key controlling processes; (8) extending simulations to repository timescales (104–106 years) and validating with in situ data and natural analogues; (9) exploring machine learning for parameter optimization, calibration, and data analysis; (10) integrating with safety assessment tools to evaluate long-term performance; and (11) enhancing coupling with thermal and mechanical models.

Supplementary Materials

The following supporting information can be downloaded at: https://www.mdpi.com/article/10.3390/min15090940/s1. Figure S1. (a) Spatial evolution of the computed concentration of dissolved Na+ at selected times, (b) spatial evolution of the computed concentration of dissolved K+ at selected times, (c) spatial evolution of the computed concentration of dissolved Mg2+ at selected times, (d) spatial evolution of the computed concentration of dissolved HCO3 at selected times, (e) spatial evolution of the computed concentration of dissolved SO42− at selected times, and (f) spatial evolution of the computed concentration of dissolved H4SiO4 at selected times; Figure S2. Spatial evolution of the computed quartz volume fraction at selected times; Figure S3. Spatial distribution of the computed exchanged Ca2+, Mg2+, K+, and Na+ (left axis) and exchanged Fe2+ (right axis) at t = 18 years; Figure S4. (a) Spatial distribution of the computed sorbed concentration (mol/L) on strong sites (left axis) and sorbed concentration on weak sites (right axis) at t = 18 years, and (b) spatial distribution of the computed sorbed concentration (mol/kg bentonite) on strong sites (left axis) and sorbed concentration on weak sites (right axis) at t = 18 years.

Author Contributions

Conceptualization, J.S., A.M. and L.M.; data curation, A.M. and L.M.; funding acquisition, J.S.; investigation, J.S., A.M. and L.M.; methodology, J.S. and A.M.; project administration, J.S.; resources, J.S.; formal analysis: J.S. and L.M. software, A.M.; validation, L.M.; visualization, A.M.; writing—original draft, A.M. and L.M.; writing—review and editing, J.S., A.M. and L.M. All authors have read and agreed to the published version of the manuscript.

Funding

Funding for this study was provided by ENRESA within the Work Package ACED of EURAD (European Joint Programme on Radioactive Waste Management of the European Union), grant agreement No. 84759, the HERMES Work Package of EURAD-2 (grant agreement No. 101166718), the Spanish Ministry of Science and Innovation (PID2023-153202OB-I00), and the Galician Regional Government (grant ED431C2025/55). The work of the second author was funded by the Spanish Ministry of Science and Innovation (TED2021-130315B-I00).

Data Availability Statement

Data and model results are available upon requests to the authors.

Acknowledgments

We gratefully acknowledge financial support from the European Commission and ENRESA through research contracts of EURAD (European Joint Programme on Radioactive Waste Management of the European Union, grant agreement No. 84759) and EURAD-2 (grant agreement No. 101166718). Additional support was provided by the Spanish Ministry of Science and Innovation ( PID2023-153202OB-I00). We thank Diederik Jacques (SCK·CEN, Belgium) and Sergey Churakov (PSI, Switzerland), coordinators of ACED and HERMES, respectively, for their leadership and motivation in advancing the objectives of these work packages. Finally, we sincerely appreciate the constructive comments and corrections of the three anonymous reviewers of the first version and the five anonymous reviewers of the second version, which significantly improved the manuscript.

Conflicts of Interest

The authors declare no conflicts of interest.

References

  1. King, F.; Kolàř, M.; Briggs, S.; Behazin, M.; Keech, P.; Diomidis, N. Review of the Modelling of Corrosion Processes and Lifetime Prediction for HLW/SF Containers—Part 1: Process Models. Corros. Mater. Degrad. 2024, 5, 124–199. [Google Scholar] [CrossRef]
  2. Lloret, A.; Villar, M.V. Advances on the Knowledge of the Thermo-Hydro-Mechanical Behaviour of Heavily Compacted “FEBEX” Bentonite. Phys. Chem. Earth Parts A/B/C 2007, 32, 701–715. [Google Scholar] [CrossRef]
  3. Villar, M.V.; Lloret, A. Influence of Dry Density and Water Content on the Swelling of a Compacted Bentonite. Appl. Clay Sci. 2008, 39, 38–49. [Google Scholar] [CrossRef]
  4. De Windt, L.; Spycher, N.F. Reactive Transport Modeling: A Key Performance Assessment Tool for the Geologic Disposal of Nuclear Waste. Elements 2019, 15, 99–102. [Google Scholar] [CrossRef]
  5. Claret, F.; Dauzeres, A.; Jacques, D.; Sellin, P.; Cochepin, B.; De Windt, L.; Garibay-Rodriguez, J.; Govaerts, J.; Leupin, O.; Lopez, A.M.; et al. Modelling of the Long-Term Evolution and Performance of Engineered Barrier System. EPJ Nucl. Sci. Technol. 2022, 8, 41. [Google Scholar] [CrossRef]
  6. Bildstein, O.; Claret, F. Stability of Clay Barriers Under Chemical Perturbations. In Developments in Clay Science; Elsevier: Amsterdam, The Netherlands, 2015; Volume 6, pp. 155–188. ISBN 978-0-08-100027-4. [Google Scholar]
  7. Marty, N.C.M.; Fritz, B.; Clément, A.; Michau, N. Modelling the Long Term Alteration of the Engineered Bentonite Barrier in an Underground Radioactive Waste Repository. Appl. Clay Sci. 2010, 47, 82–90. [Google Scholar] [CrossRef]
  8. Savage, D.; Watson, C.; Benbow, S.; Wilson, J. Modelling Iron-Bentonite Interactions. Appl. Clay Sci. 2010, 47, 91–98. [Google Scholar] [CrossRef]
  9. Savage, D. Prospects for Coupled Modelling; Report STUK-TR 13; STUK: Helsinki, Finland, 2012. [Google Scholar]
  10. Samper, J.; Naves, A.; Montenegro, L.; Mon, A. Reactive Transport Modelling of the Long-Term Interactions of Corrosion Products and Compacted Bentonite in a HLW Repository in Granite: Uncertainties and Relevance for Performance Assessment. Appl. Geochem. 2016, 67, 42–51. [Google Scholar] [CrossRef]
  11. Mon, A.; Samper, J.; Montenegro, L.; Naves, A.; Fernández, J. Long-Term Non-Isothermal Reactive Transport Model of Compacted Bentonite, Concrete and Corrosion Products in a HLW Repository in Clay. J. Contam. Hydrol. 2017, 197, 1–16. [Google Scholar] [CrossRef]
  12. Claret, F.; Marty, N.; Tournassat, C. Modeling the Long-Term Stability of Multi-Barrier Systems for Nuclear Waste Disposal in Geological Clay Formations. In Reactive Transport Modeling; John Wiley & Sons: Hoboken, NJ, USA, 2018; pp. 395–451. ISBN 978-1-119-06003-1. [Google Scholar]
  13. Bildstein, O.; Claret, F.; Frugier, P. RTM for Waste Repositories. Rev. Mineral. Geochem. 2019, 85, 419–457. [Google Scholar] [CrossRef]
  14. Mon, A.; Samper, J.; Montenegro, L.; Turrero, M.J.; Torres, E.; Cuevas, J.; Fernández, R.; De Windt, L. Reactive Transport Models of the Geochemical Interactions at the Iron/Bentonite Interface in Laboratory Corrosion Tests. Appl. Clay Sci. 2023, 240, 106981. [Google Scholar] [CrossRef]
  15. Montenegro, L.; Samper, J.; Mon, A.; De Windt, L.; Samper, A.-C.; García, E. A Non-Isothermal Reactive Transport Model of the Long-Term Geochemical Evolution at the Disposal Cell Scale in a HLW Repository in Granite. Appl. Clay Sci. 2023, 242, 107018. [Google Scholar] [CrossRef]
  16. Kiczka, M.; Alt-Epping, P.; Hadi, J.; Wersin, P.; Leupin, O.X.; Diomidis, N. Reactive Transport Modelling of Iron Bentonite Interaction in the FEBEX in Situ Experiment. Appl. Geochem. 2024, 170, 106057. [Google Scholar] [CrossRef]
  17. Wersin, P.; Hadi, J.; Kiczka, M.; Jenni, A.; Grenèche, J.; Diomidis, N.; Leupin, O.X.; Svensson, D.; Sellin, P.; Reddy, B.; et al. Unravelling the Corrosion Processes at Steel/Bentonite Interfaces in in Situ Tests. Mater. Corros. 2023, 74, 1716–1727. [Google Scholar] [CrossRef]
  18. King, F.; Kolàř, M.; Briggs, S.; Behazin, M.; Keech, P.; Diomidis, N. Review of the Modelling of Corrosion Processes and Lifetime Prediction for HLW/SF Containers—Part 2: Performance Assessment Models. Corros. Mater. Degrad. 2024, 5, 289–339. [Google Scholar] [CrossRef]
  19. Wittebroodt, C.; Turrero, M.; Torres, E.; Gómez, P.; Garralón, A.; Notario, B.; Sanmiguel, M.; Cuevas, J.; Mota, C.; Ruiz, A.; et al. Final Technical Report on the Steel/Clay Material Interactions Deliverable D2.7: Final Technical Report on the Steel/Clay Material Interactions; HORIZON 2020 Project EURAD. EC Grant Agreement No. 847593; EURAD: Antwerp, Belgium, 2024. [Google Scholar]
  20. ENRESA Full-Scale Engineered Barriers Experiment for a Deep Geological Repository in Crystalline Host Rock FEBEX Project. EUR 19147 EN, European Commission 2000. Available online: https://cordis.europa.eu/project/id/FIKW-CT-2000-00016/reporting (accessed on 19 July 2025).
  21. ENRESA. Full-Scale Engineered Barriers Experiment: Updated Final Report; PT 05-02/2006; ENRESA Technical Publication: Madrid, Spain, 2006; p. 589. [Google Scholar]
  22. Martín, P.L.; Barcala, J.M. Large Scale Buffer Material Test: Mock-up Experiment at CIEMAT. Eng. Geol. 2005, 81, 298–316. [Google Scholar] [CrossRef]
  23. Wersin, P.; Kober, F. FEBEX-DP—Metal Corrosion and Iron-Bentonite Interaction Studies; Nagra: Wettingen, Switzerland, 2017; Volume NAB 16-16. [Google Scholar]
  24. Wilson, J. FEBEX-DP: Geochemical Modelling of Iron-Bentonite Interactions. Quintessa’s Contribution on Behalf of RWM; Quintessa Report QRS-1713A-R3 v1.3; Quitessa: Henley-on-Thames, UK, 2017. [Google Scholar]
  25. Hadi, J.; Wersin, P.; Serneels, V.; Greneche, J.-M. Eighteen Years of Steel–Bentonite Interaction in the FEBEX in Situ Test at the Grimsel Test Site in Switzerland. Clays Clay Miner. 2019, 67, 111–131. [Google Scholar] [CrossRef]
  26. Samper, J.; Zheng, L.; Montenegro, L.; Fernández, A.M.; Rivas, P. Coupled Thermo-Hydro-Chemical Models of Compacted Bentonite after FEBEX in Situ Test. Appl. Geochem. 2008, 23, 1186–1201. [Google Scholar] [CrossRef]
  27. Zheng, L.; Samper, J.; Montenegro, L. A Coupled THC Model of the FEBEX in Situ Test with Bentonite Swelling and Chemical and Thermal Osmosis. J. Contam. Hydrol. 2011, 126, 45–60. [Google Scholar] [CrossRef] [PubMed]
  28. Samper, J.; Mon, A.; Montenegro, L. A Revisited Thermal, Hydrodynamic, Chemical and Mechanical Model of Compacted Bentonite for the Entire Duration of the FEBEX in Situ Test. Appl. Clay Sci. 2018, 160, 58–70. [Google Scholar] [CrossRef]
  29. Kaufhold, S.; Dohrmann, R.; Ufer, K.; Kober, F. Interactions of Bentonite with Metal and Concrete from the FEBEX Experiment: Mineralogical and Geochemical Investigations of Selected Sampling Sites. Clay Miner. 2018, 53, 745–763. [Google Scholar] [CrossRef]
  30. Lanyon, G.W.; Gaus, I. Main Outcomes and Review of the FEBEX In Situ Test (GTS) and Mock-Up After 15 Years of Operation; NTB 15-04; Nagra: Wettingen, Switzerland, 2016; 127p. [Google Scholar]
  31. Fernández, A.; Sánchez-Ledesma, D.; Melón, A.; Robredo, L.; Rey, J.; Labajo, M.; Clavero, M.; Carretero, S.; González, A. Thermo-Hydro-Geochemical Behaviour of a Spanish Bentonite after of the FEBEX In Situ Test at the Grimsel Test Site; Technical Report CIEMAT/DMA/2G216/03/16. Nagra Arbeitsbereicht NAB16-025; NAGRA: Madrid, Spain, 2018; p. 270. [Google Scholar]
  32. Fernández, A.M. Gas and Water Sampling from the FEBEX In Situ Test; NAGRA Working Report; NAGRA: Wettingen, Switzerland, 2019; p. 211. [Google Scholar]
  33. Bradbury, M.H.; Baeyens, B. A Mechanistic Description of Ni and Zn Sorption on Na-Montmorillonite Part II: Modelling. J. Contam. Hydrol. 1997, 27, 223–248. [Google Scholar] [CrossRef]
  34. Giffaut, E.; Grivé, M.; Blanc, P.; Vieillard, P.; Colàs, E.; Gailhanou, H.; Gaboreau, S.; Marty, N.; Madé, B.; Duro, L. Andra Thermodynamic Database for Performance Assessment: ThermoChimie. Appl. Geochem. 2014, 49, 225–236. [Google Scholar] [CrossRef]
  35. Geochemistry, Groundwater and Pollution C.A.J. Appelo, Dieke Postma. Available online: https://www.taylorfrancis.com/books/mono/10.1201/9781439833544/geochemistry-groundwater-pollution-dieke-postma-appelo (accessed on 19 December 2024).
  36. Bradbury, M.H.; Baeyens, B. Modelling the Sorption of Mn(II), Co(II), Ni(II), Zn(II), Cd(II), Eu(III), Am(III), Sn(IV), Th(IV), Np(V) and U(VI) on Montmorillonite: Linear Free Energy Relationships and Estimates of Surface Binding Constants for Some Selected Heavy Metals and Actinides. Geochim. Cosmochim. Acta 2005, 69, 875–892. [Google Scholar] [CrossRef]
  37. Wolery, T.J. EQ3/6, a Software Package for Geochemical Modeling of Aqueous Systems: Package Overview and Installation Guide (Version 7.0); Lawrence Livermore National Lab.: Livermore, CA, USA, 1992; 70p, UCRL-MA--110662-Pt 1. [Google Scholar]
  38. Fuentes-Cantillana, J.L.; Garcia-Sineriz, J.L. Final Design and Installation of the “In Situ” Test at GRIMSEL; Empresa Nacional de Residuos Radiactivos: Madrid, Spain, 1998; p. 197. [Google Scholar]
  39. Fernández, A.M.; Cuevas, J.; Rivas, P. Pore Water Chemistry of the Febex Bentonite. MRS Proc. 2000, 663, 573. [Google Scholar] [CrossRef]
  40. Fernández, A.M.; Baeyens, B.; Bradbury, M.; Rivas, P. Analysis of the Porewater Chemical Composition of a Spanish Compacted Bentonite Used in an Engineered Barrier. Phys. Chem. Earth Parts A/B/C 2004, 29, 105–118. [Google Scholar] [CrossRef]
  41. Palandri, J.L.; Kharaka, Y.K. A Compilation of Rate Parameters of Water-Mineral Interaction Kinetics for Application to Geochemical Modeling; U.S. Geological Survey: Reston, VA, USA, 2004. [Google Scholar]
  42. Fernández Águila, J. Reactive Transport Models of Low Permeability Structured Porous and Fractured Media. Ph.D. Thesis, Universidade da Coruña, A Coruña, Spain, 2017. [Google Scholar]
  43. Idiart, A.; Laviña, M.; Kosakowski, G.; Cochepin, B.; Meeussen, J.C.L.; Samper, J.; Mon, A.; Montoya, V.; Munier, I.; Poonoosamy, J.; et al. Reactive Transport Modelling of a Low-pH Concrete/Clay Interface. Appl. Geochem. 2020, 115, 104562. [Google Scholar] [CrossRef]
  44. Molinero-Huguet, J.; Samper-Calvete, F.J.; Zhang, G.; Yang, C. Biogeochemical Reactive Transport Model of the Redox Zone Experiment of the Äspö Hard Rock Laboratory in Sweden. Nucl. Technol. 2004, 148, 151–165. [Google Scholar] [CrossRef]
  45. Zhang, G.; Samper, J.; Montenegro, L. Coupled Thermo-Hydro-Bio-Geochemical Reactive Transport Model of CERBERUS Heating and Radiation Experiment in Boom Clay. Appl. Geochem. 2008, 23, 932–949. [Google Scholar] [CrossRef]
  46. Martínez, V.; Abós, H.; García-Siñeriz, J.L. FEBEXe: Final Sensor Data Report (FEBEX ’In Situ’Experiment); NAGRA: Wettingen, Switzerland, 2016; p. 244. [Google Scholar]
  47. Parangusan, H.; Bhadra, J.; Al-Thani, N. A Review of Passivity Breakdown on Metal Surfaces: Influence of Chloride- and Sulfide-Ion Concentrations, Temperature, and pH. Emergent Mater. 2021, 4, 1187–1203. [Google Scholar] [CrossRef]
  48. Wersin, P. The Mont Terri Iron Corrosion in Bentonite Experiment (IC-A): Concept, Design and First Results. Swiss J. Geosci. 2017, 110, 329–344. [Google Scholar]
  49. Wersin, P.; Hadi, J.; Jenni, A.; Svensson, D.; Grenèche, J.-M.; Sellin, P.; Leupin, O.X. Interaction of Corroding Iron with Eight Bentonites in the Alternative Buffer Materials Field Experiment (ABM2). Minerals 2021, 11, 907. [Google Scholar] [CrossRef]
Figure 1. General layout of the FEBEX in situ test during the first (top) and second (bottom) operational periods. The red dashed line indicates section 41 and the grey dashed line marks the instrumented section H. The steel liner is shown by the blue line. The 1D reactive transport model corresponds to section 41 and extends from the liner to the bentonite–granite interface. Notice that section 41 is located between the dummy and heater 2.
Minerals 15 00940 g001
Figure 2. Schematic description of the measured total Fe, goethite, and hematite spatial distribution at the bentonite block BM-B-41-1 (data from Ref. [25]).
Minerals 15 00940 g002
Figure 3. Scheme of the finite element mesh used in the 1D parallel reactive transport model illustrating the radial geometry of the liner (0.44 m < r < 0.45 m) and bentonite (0.45 m < r < 1.14 m) and the granite boundary (right).
Minerals 15 00940 g003
Figure 4. (a) Time functions of the boundary temperatures at r = 0.45 m and r = 1.14 m, and (b) time functions of the boundary water contents at r = 0.45 m and r = 1.14 m, taken from the model of Ref. [28].
Minerals 15 00940 g004
Figure 5. Time function of the corrosion rate considered in the model.
Minerals 15 00940 g005
Figure 6. (a) Time evolution of the computed temperature at r = 0.82 m in section 41 and measured data at Section H located near section 41 (see Figure 1); (b) Time evolution of the computed saturation degree at r = 0.82 m in section 41 and measured data at Section H located near section 41 (Figure 1). Data from Ref. [46].
Minerals 15 00940 g006
Figure 7. (a) Spatial evolution of the computed concentration of dissolved Cl at selected times, (b) spatial evolution of the computed concentration of dissolved Ca2+ at selected times, (c) spatial evolution of the computed concentration of dissolved Fe2+ at selected times, and (d) spatial evolution of the computed concentration of dissolved O2(aq) and H2(aq) at selected times.
Minerals 15 00940 g007
Figure 8. (a) Spatial evolution of the computed pH at selected times and (b) spatial evolution of the computed Eh at selected times.
Minerals 15 00940 g008
Figure 9. (a) Spatial evolution of the computed goethite volume fraction at selected times, (b) spatial evolution of the computed hematite volume fraction at selected times, (c) spatial evolution of the computed magnetite volume fraction at selected times, and (d) spatial evolution of the computed calcite volume fraction at selected times.
Minerals 15 00940 g009
Figure 10. Spatial distribution of the computed (lines) goethite (left axis) and hematite (right axis) and measured data (symbols) at t = 18 years (data from Ref. [25]).
Minerals 15 00940 g010
Figure 11. (a) Spatial distribution of the measured (symbols) and computed (lines) concentrations of total Fe at t = 18 years (data from Ref. [25]). (b) Spatial distribution of the concentrations of iron minerals and dissolved, exchanged, and sorbed iron. Background colors indicate the observed interaction zones: Red corresponds to the highest Fe content, blue to Fe diffusion, and green to the unaltered zone.
Minerals 15 00940 g011
Figure 12. (a) Spatial distribution of the computed goethite (lines) and measured data (symbols) at t = 18 years for the base run and the sensitivity runs to the corrosion time function, (b) spatial distribution of the computed hematite (lines) and measured data (symbols) at t = 18 years for the base run and the sensitivity runs to the corrosion time function, and (c) spatial distribution of the measured (symbols) and computed (lines) concentrations of total iron at t = 18 years for the base run and the sensitivity runs to the corrosion time function (data from Ref. [25]). The background colors indicate the observed interaction zones: Red corresponds to the highest Fe content, blue to Fe diffusion, and green to the unaltered zone.
Minerals 15 00940 g012
Figure 13. (a) Spatial distribution of the computed pH at t = 18 years for the base run and the sensitivity run to the shutting down of heater 1. (b) Spatial distribution of the measured (symbols) and computed (lines) concentrations of total iron at t = 18 years for the base run and the sensitivity run to the shutting down of heater 1 (data from Ref. [25]). The background colors indicate the observed interaction zones: Red corresponds to the highest Fe content, blue to Fe diffusion, and green to the unaltered zone. (c) Spatial distribution of the computed (lines) goethite (left axis) and hematite (right axis) and measured data (symbols) at t = 18 years for the base run and sensitivity run to the shutting down of heater 1 (data from Ref. [25]).
Minerals 15 00940 g013
Table 1. Reactions and equilibrium constants for aqueous speciation, mineral dissolution/precipitation at 25 °C taken from ThermoChimie v10.a [34], surface complexation with the triple-site sorption model of Ref. [36], and cation exchange [21].
Aqueous Complexation ReactionsLog K
(25 °C)
Aqueous Complexation ReactionsLog K
(25 °C)
CaCl+ ⇔ Ca2+ + Cl0.290NaHCO3(aq) ⇔ Na+ + HCO30.250
CaCl2(aq) ⇔ Ca2+ + 2Cl0.640NaSO4 ⇔ Na+ + SO42−−0.940
CaCO3(aq) + H+ ⇔ Ca2+ + HCO37.110NaCl(aq) ⇔ Na+ + Cl0.500
CaHCO3+ ⇔ Ca2+ + HCO3−1.100OH + H+ ⇔ H2O14.000
CaSO4(aq) ⇔ Ca2+ + SO42−−2.310H2(aq) + 0.5O2 ⇔ H2O46.070
Ca(H3SiO4)+ + H+ ⇔ Ca2+ + H4SiO4(aq)8.830Fe3+ + 0.5H2O ⇔ H+ + 0.25O2 + Fe2+−8.485
CO2(aq) + H2O ⇔ H+ + HCO3−6.350FeHCO3+ ⇔ Fe2++ HCO3−1.440
CO32− + H+ ⇔ HCO310.330FeCO3 (aq) + H+ ⇔ Fe2+ + HCO34.640
KSO4 ⇔ K+ + SO42−−0.880FeCl+ ⇔ Fe2++ Cl−0.140
KCl(aq) ⇔ K+ + Cl0.500FeCl2+ + 0.5H2O ⇔ Fe2+ + H+ + Cl + 0.25O2−9.885
K(OH)(aq) + H+ ⇔ K+ + H2O14.460FeOH+ + H+ ⇔ Fe2++ H2O9.500
MgCl+ ⇔ Mg2+ + Cl−0.350Fe(OH)3 + 3H+ ⇔ Fe2+ + 3H2O31.900
MgCO3(aq) + H+ ⇔ Mg2+ + HCO37.350Fe(OH)2(aq) + 2H+ ⇔ Fe2++ 2H2O20.60
MgHCO3+ ⇔ Mg2+ + HCO3−1.040Fe(OH)2+ ⇔ Fe2++ 0.5H2O + 0.25O2−6.295
MgSO4(aq) ⇔ Mg2+ + SO42−−2.230Fe(SO4)2 + 0.5H2O ⇔ Fe2+ + H+ + 0.25O2 + 2SO42−−13.885
Mg(H3SiO4)+ H+ ⇔ Mg2+ + H4SiO4(aq)8.580FeSO4(aq) ⇔ Fe2+ + SO42−−2.200
Na(CO3) + H+ ⇔ Na+ + HCO39.060FeHSO42+ + 0.5H2O ⇔ Fe2+ + 2H+ + 0.25O2 + SO42−−12.955
Mineral Dissolution/Precipitation ReactionsLog K (25 °C)Mineral Dissolution/Precipitation ReactionsLog K (25 °C)
Calcite + H+ ⇔ Ca2+ + HCO31.850Magnetite + 6H+ ⇔ 3Fe2+ + 3H2O + 0.5O2(aq)−6.560
Gypsum ⇔ Ca2+ + SO42− + 2H2O−4.610Hematite + 4H+ ⇔ 2Fe2+ + 2H2O + 0.5O2(aq)−17.990
Quartz + 2H2O ⇔ H4SiO4(aq)−3.740Goethite + 2H+ ⇔ Fe2+ + 1.5H2O + 0.25O2(aq)−8.095
Fe(s) + 2H+ + 0.5O2 (aq) ⇔ Fe2+ + H2O58.85
Cation Exchange ReactionsKNa-cationCation Exchange ReactionsKNa-cation
Na+ + X-K ⇔ K+ + X-Na0.138Na+ + 0.5X2-Mg ⇔ 0.5Mg2+ + X-Na0.288
Na+ + 0.5X2-Ca ⇔ 0.5Ca2+ + X-Na0.294Na+ + 0.5X2-Fe ⇔ 0.5Fe2+ + X-Na0.5
Surface Complexation ReactionsLog KintSurface Complexation ReactionsLog Kint
SSOH2+ SSOH + H+−4.5 SW2O + H+ SW2OH10.5
SSO + H+ ⇔ SSOH7.9 SsOFe+ + H+ SsOH + Fe2+0.6
SW1OH2+ SW1OH + H+−4.5 SsOFeOH + 2H+ SsOH + Fe2+ + H2O10.0
SW1O + H+ SW1OH7.9 SsOFe(OH)2 + 3H+ SsOH + Fe2+ + 2H2O20.0
SW2OH2+ SW2OH + H+−6.0 SW1OFe+ + H+ SW1OH + Fe2+3.3
Table 2. Thermal, hydrodynamic, and transport parameters of the bentonite [28].
ParameterBentonite
Hydraulic conductivity (m/d)4.4 × 10−9
Porosity0.407
Retention curve relating water saturation degree Sw to suction φ (kPa) S w = 1 1 + 5 · 10 5 φ 1.26 0.21
Solid density (kg/m3)2700
Specific heat of the solid (cal/g °C)0.202
Thermal conductivity of the solid (W/m °C)1.15
Effective diffusion coefficient (m2/s)4.07 × 10−12
Table 3. Initial bentonite porewater composition [26,39] and granitic water [26].
BentoniteGranite
pH7.728.35
O2(aq) (mol/L)3.30 × 10−46.0 × 10−13
Na+ (mol/L)1.3 × 10−13.8 × 10−4
K+ (mol/L)1.7 × 10−37.8 × 10−6
Ca2+ (mol/L)2.2 × 10−21.8 × 10−4
Mg2+ (mol/L)2.3 × 10−21.3 × 10−6
Fe2+ (mol/L)8.0 × 10−111.0 × 10⁻¹¹
HCO3 (mol/L)4.1 × 10−43.9 × 10−4
SO42− (mol/L)3.2 × 10−27.9 × 10−5
Cl (mol/L)1.6 × 10−11.3 × 10−5
H4SiO4(aq) (mol/L)1.1 × 10−41.4 × 10−4
Table 4. Mass balance of Fe and O2 between the initial (t = 0) and final (t = 18 years) times. Masses are expressed in mol per meter of liner length.
t = 0
mol/m
t = 18 Years
mol/m
Change
mol/m
Change
in % of Fe(s)
O2(aq)0.0061.47 × 10−4−0.0054−0.28
H2(aq)4.84 × 10−461.5511.55179.5
Fe(s)1.9500.000−1.950100
Goethite0.0330.8880.85543.83
Hematite0.0000.3070.30715.75
Magnetite0.0001.08 × 10−41.08 × 10−40.01
Sorbed Fe1.22 × 10−110.6750.67534.62
Exchanged Fe4.79 × 10−140.1720.1728.80
Dissolved Fe1.35 × 10−90.0070.0070.36
Total Fe1.9832.049−0.066
Error in Fe balance −0.0663.2%
Disclaimer/Publisher’s Note: The statements, opinions and data contained in all publications are solely those of the individual author(s) and contributor(s) and not of MDPI and/or the editor(s). MDPI and/or the editor(s) disclaim responsibility for any injury to people or property resulting from any ideas, methods, instructions or products referred to in the content.