Abstract
The restoration of iron finds is still a particularly complex area within the science of archaeological conservation, as severe signs of corrosion occur from the moment of recovery and the associated radical change in environmental parameters. The results of this study show that it is possible to create three-dimensional models of an iron find using non-invasive µCT examinations to identify the different layers and phases of corrosion based on mineralogical investigations and thus to assess the state of preservation of the iron object. The resulting visibility of the corrosion zones provides an important basis for further treatment of iron artefacts after recovery (packaging, desalination, storage, etc.), since the goal is the long-term preservation of cultural heritage made of iron.
1. Introduction
Archaeological iron artefacts pose significant preservation challenges due to their thermodynamic instability when exposed to Earth’s surface conditions [1]. A primary issue in their conservation and restoration is corrosion, driven by iron’s high reactivity and susceptibility to environmental changes, especially after excavation. While buried, iron artefacts often develop stratified corrosion layers that may provide some protection under specific conditions [2]. However, exposure to atmospheric oxygen and humidity accelerates corrosion, frequently resulting in the formation of akaganéite (β-FeO(OH,Cl)), a chlorine-bearing iron oxyhydroxide known to contribute significantly to post-excavation degradation [1,2,3,4,5,6,7,8,9]. The formation of this phase is dependent on elevated chloride concentrations.
The crystallization of chloride-bearing iron hydroxides, particularly akaganéite and β-Fe2(OH)3Cl, leads to considerable volumetric expansion, causing exfoliation of surface layers and damage to the artefact’s original surface. For example, one mole of akaganéite occupies approximately 25 cm3, compared to around 7 cm3 for one mole of iron, representing nearly a three- to four-fold increase in volume [10].
Akaganéite forms through oxidation of its precursor β-Fe2(OH)3Cl [11]. Under low-oxygen conditions, Fe2+ reacts with chloride to form the β-phase, which, upon exposure to atmospheric oxygen, oxidizes via an intermediate green rust phase (Fe32+Fe3+(OH)8Cl·nH2O) [12]. At lower chloride concentrations (~1.15 mol/L), lepidocrocite (γ-FeOOH) forms, whereas higher concentrations (≥2 mol/L) promote transformation to akaganéite [3,11,13]. This transformation occurs under mildly acidic conditions (pH 4–6) through Fe3+ hydrolysis, with chloride ions stabilizing the mineral’s tunnel structure [13]. Akaganéite’s hygroscopic nature fosters cyclic hydration, accelerating corrosion and structural damage [3,9,12,14,15,16].
A major conservation challenge is the effective removal of chloride ions, which are highly mobile and can penetrate corrosion layers to reach the metallic core, perpetuating deterioration [2,7]. Current methods include mechanical removal of corrosion, chemical desalination (e.g., sodium sulphite treatments), application of protective coatings, and storage under vacuum or inert atmospheres. However, even extended desalination often fails to eliminate all chloride ions, especially those trapped within compact corrosion matrices or adsorbed on residual soils [4]. Additionally, assessing the long-term success of these treatments is complicated by the need for invasive diagnostic methods that risk further artifact damage [6,17]. These limitations underscore the urgent need for detailed, non-destructive analytical techniques to accurately quantify corrosion states and chloride content in archaeological iron artifacts.
Computed tomography (CT) is a fundamental imaging technique extensively utilized in radiological diagnostics and medical applications. Beyond its clinical utility, CT has become a standard tool for three-dimensional evaluation across material science, biology, and earth sciences. The technique involves directing X-ray radiation at an object from multiple angles. The X-ray beam is collimated into a thin fan-shaped beam, selectively attenuated as it passes through materials of varying densities, and subsequently detected by sensors. The resulting attenuation data are processed using reconstruction algorithms to generate greyscale images representing the internal structure of the object. In addition to conventional clinical CT, high-resolution variants such as micro-computed tomography (µCT) and nano-computed tomography (nano-CT) enable detailed imaging at micro- and nano-scale resolutions [18].
In archaeology, CT, particularly µCT, has been widely applied [19,20], encompassing biologically focused disciplines like anthropology and archaeobotany, as well as digital preservation and non-destructive analysis of artifacts [19,21,22]. Moreover, µCT is increasingly employed in material science studies of archaeological materials, including wood, textiles, ceramics, and metals [19,23,24,25]. Consequently, µCT represents a highly suitable, non-destructive method for investigating iron artifacts. Notably, comprehensive studies on the application of µCT to corroded and dechlorinated iron artifacts have been conducted by Bernabale et al. [26] and Jacot-Guillarmond et al. [2].
To deepen the understanding of corrosion processes and to advance conservation methodologies, a variety of analytical techniques were applied to iron nails excavated from a building located in the southwestern corner of the Forum of the Roman settlement Municipium Claudium Aguntum in East Tyrol, Austria [27]. Previous studies have laid the groundwork for detailed three-dimensional characterization of the spatial distribution of corrosion layers and corrosion products [28].
To enable quantitative comparison across these analyses and to complement subsequent destructive mineralogical investigations, micro-computed tomography (µCT) was employed. For this purpose, a series of optimized scanning protocols was developed, including refinement of scanner parameters and adjustments to reconstruction algorithms aimed at maximizing image quality. Additionally, a comprehensive post-processing workflow was established, integrating mineralogical composition analysis, volumetric quantification, and texture characterization. This approach provides a robust and reproducible methodology for assessing and comparing corrosion patterns, and its validity is demonstrated through our results.
2. Materials and Methods
Three Roman iron nails were collected during the 2016/2017 excavations at Municipium Claudium Aguntum in East Tyrol [27], Austria, and subsequently subjected to different packaging and storage protocols (see Table 1, Figure 1).

Table 1.
Selection of three representative samples from the test series dataset, each consisting of two subsamples and the corresponding packaging methods.

Figure 1.
Image of sample FF01_1 before cutting it into several pieces.
To enhance the comparability of the different samples in the test series, it was necessary to select only finds from the same excavation sector and, where possible, from the same stratigraphic layer. The present study focused exclusively on typologically insignificant iron nails, as they occur in large quantities and exhibit relatively uniform material thickness. Following the recovery process and photographic documentation, each nail was axially bisected into two halves using a rock saw with a diamond-coated saw blade without cooling liquids to prevent additional corrosion. The halves were placed in different stasis methods and placed into storage for four years (the different packaging methods are described in Table 1). Subsample 1 (e.g., FF09_1) consistently represents the condition of a freshly excavated find, as it was immediately encapsulated in Araldite 2020 and vacuum-sealed. In contrast, sub-sample 2 (e.g., FF013_2) was subjected to the standard excavation packaging in a zip-bag. For these investigations, cross-section pieces of the samples were embedded in epoxy, and their surface was ground using sandpaper with different grits (600–2500 grit) and subsequently polished using 3 μm and 0.25 μm diamond paste. Given the structural and compositional complexity of the corrosion products, particular emphasis was placed on the application of μCT or X-ray microscopy (XRM) as a non-destructive analytical technique in previous studies [2,26,29]. μCT facilitates three-dimensional visualization of corrosion layers, providing insights into internal structures, porosity, and the spatial distribution of chlorine-rich phases without the need for invasive sample preparation. By combining μCT with complementary chemical and structural analyses, this study aims to characterize 3D corrosion patterns in detail, assess the efficacy of various conservation approaches, and to contribute to the development of improved long-term preservation strategies for archaeological iron artifacts. µCT analysis was performed on all samples, while destructive analytical methods were applied exclusively to sample FF01_1. Since all anticipated corrosion phases were identified in FF01_1, further destructive analyses on the remaining samples were deemed unnecessary.
2.1. Petrography
Reflected light images were taken using a Keyence VHX-6000 (Keyence Corporation, Osaka, Japan) digital microscope at the Institute of Archaeologies. Representative BSE (back-scattered electron) images were obtained from sample FF01_1 using an electron probe microanalyzer (EPMA, Superprobe 8100, JEOL, Freising, Germany) at an acceleration voltage of 15 kV and a beam current of 10 nA. This was conducted to examine the different corrosion micro-domains present in the sample. Phase identification was performed using the integrated energy dispersive spectroscopy (EDS) system.
2.2. µ-XRF
To further characterize and identify chlorine-rich areas, µ-XRF analysis was conducted via qualitative element mapping on an M4 Tornado (Bruker Corporation, Billerica, MA, USA) on sample FF01_1. The mapping was performed under the following conditions: the excitation voltage was set to 50 kV, the anode current to 600 µA, the step size to 25 µm, and the dwell time to 10 ms per pixel. Data analysis was performed using the integrated Bruker M4 software (v1.6.0.636).
2.3. Electron Probe Microanalysis
Electron probe microanalysis (EPMA) was used to determine the chemical composition of the phases from specific micro-domains within the corrosion layers. This technique enables quantitative chemical analysis with much higher spatial resolution and lower detection limits than μ-XRF. The first identification of minerals based on their approximate chemical composition was carried out using the semi-quantitative energy-dispersive system (EDS). The quantitative measurements were then performed using the wavelength-dispersive spectrometry (WDS) system on a JEOL Superprobe 8100 (Jeaol, Akishima, Japan), operated at 15 kV acceleration voltage and a beam current of 10 nA with measurement times of 20 s for the peak and 10 s for the background.
2.4. Micro-Raman Spectroscopy
Micro-Raman spectroscopy was employed to analyse the mineralogical composition of corrosion products at a high spatial resolution. This technique enables the identification of crystalline and amorphous phases, particularly differentiating between iron oxides and hydroxides, which play a crucial role in corrosion processes. Raman measurements were conducted using a Horiba LabRAM HR Evolution system (Horiban, Kyōto, Japan) equipped with a 532 nm excitation laser. Spectra were recorded in the range of 100–2000 cm−1, with an integration time of 10–30 s per spot, depending on the fluorescence response of the sample. The analysis focused on detecting characteristic Raman shifts for goethite, lepidocrocite, magnetite, and akaganéite, confirming their presence and distribution across corrosion layers. Special attention was given to chlorine-bearing phases, as these influence the long-term stability of iron artefacts post-excavation. The data obtained from Raman spectroscopy were correlated with µ-XRF and EPMA results to ensure a comprehensive phase identification.
2.5. µCT Imaging and Postprocessing
The µCT imaging was carried out using a vivaCT40 (Scanco Medical AG, Brüttisellen, Switzerland). The scanning parameters were set to 70 kV voltage, 114 mA current, and a 650 ms integration time with ten averaging iterations per projection. A total of 250 projections were collected, with 2048 samples per projection and a hardware binning factor of two. The data was reconstructed using the filtered back-projection algorithm provided by the manufacturer. To minimize the occurrence of artefacts, the cupping artefact suppression setting was increased by a factor of two, and ring artefact suppression was set to the maximum. To achieve the best possible contrast enhancement, the scaling maximum was doubled compared to the standard hydroxyapatite-based calibration of the vivaCT40 [30]. Furthermore, a nonlinear density-to-greyscale mapping was applied, with an emphasis on increasing contrast in the upper 20% of the density scale. This allowed for better visual distinction of the highest density mineral phases (Figure 2).

Figure 2.
Image greyscale optimization and semi-automated contouring result of a slice of the sample FF01_1. (A) Original image using the standard reconstruction settings of the vivaCT40; (B) optimized greyscale contrast to distinguish the different mineral phases; (C) result of the automated contouring algorithm (contour in green).
A standardized post-processing workflow was employed to correlate mineral phases with image intensity, segmentation, and textural analysis [30]. All image generation and post-processing steps were carried out using the manufacturer’s software suite (µCT 6.1). The initial step involved calculating the outer contour of the scanned nail fragment (Figure 2). The process, which includes dilation, inversion, component labelling, and erosion, was previously described in an earlier study [30].
The subsequent stage of the project involved a comparison of 2D image-based mineralogical identification methods with the 3D dataset obtained from µCT. A direct comparison was made between mineral phases and µCT density contrasts, leading to the identification of five distinct groups, ordered from low to high density: (1) pores, (2) cemented soil with corrosion products (soil + corrosion), (3) low-density corrosion products (iron oxides, hydroxides (Fe-O/OH), (4) high-density corrosion products (Cl-bearing phases + Fe-carbonates (Fe-Cl/CO3), and (5) metallic iron. The segmentation process involved the implementation of a threshold segmentation method, utilizing the filter settings detailed in Table 2, in conjunction with a Gaussian convolution filter. The configuration parameters for this filter were set to sigma = 1.3 and gauss = 2. For the thresholding, a unitless scale from 0 (black = lowest density)–1000 (white = highest density) is applied on the 16 bit original scale.

Table 2.
Thresholds for image segmentation and phase attribution.
After segmentation, textural analysis was performed on each segment individually. The analyzed textural parameters included volume fraction (VF), mean material density, mean particle diameter (MPD), and the standard deviation of the mean particle diameter (MPD_STD). The term particle is used here because, in CT imaging, grains composed of the same material that are aggregated together often cannot be distinctly separated. Consequently, the mean particle diameter represents the short-axis diameter of these grains or clasts, analogous to the average thickness of thin metallic sheets observed in our samples. The algorithm used for these measurements was originally described by Hildebrand et al. and is commonly applied in the analysis of bone morphology [30,31].
3. Results
3.1. BSE Micro-Petrography
Concentric mineralogical zoning consisting of four distinct corrosion domains was identified in the nail cross-section of sample FF01_1 through BSE imaging. The following sequence of corrosion zones is observed from the inner to outer regions, as illustrated in Figure 3A:

Figure 3.
(A) Petrographic overview image (panoramic BSE) with color-coded zones of different mineralogical compositions, showing notable heterogeneities and Cl- and S-rich domains adjacent to the iron core (Zone II is colored yellow). Inset (B) shows a combined μ-XRF element distribution map of Fe, Cl, and S within the entire cross section of FF01_1. The colored green frame highlights the approximate spatial expansion of (A).
- Zone I (iron core): This zone represents the remaining intact iron of the original nail, showing signs of incipient corrosion in various areas within the panoramic image. Elemental distribution maps reveal occasional isolated occurrences of sulphur (S) within cavities. However, further examination of these “sulphur islands” is challenging, and they could not be definitively assigned to any known sulphur phases.
- Zone II (areas with chlorine and finely dispersed sulphur): The highest concentrations of Cl were observed adjacent to the iron core. Phase identification through EDS [28] revealed the presence of β-Fe2(OH)3Cl, which is considered the precursor phase of akaganéite [3,8,12,15]. However, akaganéite itself was not detected in any of the sample areas.
- Zone III (mixture of goethite, lepidocrocite, and iron carbonates): This zone is characterized by the presence of iron carbonate phases, in addition to iron oxide goethite. Using EDS [28], we identified several carbonate phases, including siderite (FeCO3) and chukanovite (Fe2CO3OH2), along with a mixture of these two phases. EPMA measurements also suggested the presence of a possible third phase, which is hypothesized to be green rust [32]. Further analysis of BSE images has revealed that the carbonate phases are predominantly located within smaller cracks. This zone, located in the lower part of the BSE image, predominantly replaces the alternating sequence of magnetite and goethite, occupying a significant area. The original phase sequence reappears only in the lower right corner of the panorama.
- Zone IV (alternating sequence of magnetite and goethite): This zone displays the characteristic alternating sequence of magnetite and goethite. A transition can be observed in the rim areas, where mixing with isolated soil components is evident. According to [28], this zone corresponds to area I with marginal changes toward area II. In the lighter-colored areas, a mixture of magnetite and maghemite is also present.
Similar layering was described by Bernabale et al. [26], who also used BSE images and distinguished only the iron core from a corrosion product layer and the adhering soil. Jacot-Guillarmond et al. [2] applied a combination of CT and neutron tomography, which also revealed an internal layering of the artefacts with corrosion zones containing similar Fe-bearing phases, which we observed in corrosion zone II adjacent to the iron core. On the other hand, both investigations show a slightly simpler corrosion phase assemblage lacking sulphur- and CO3-bearing phases.
3.2. µ-XRF Data Evaluation
Cl shows a spatially distributed pattern within the sample, thus appearing in localized microdomains throughout nearly all sections, particularly in partial areas (see Figure 3). The blue regions indicate that Cl primarily accumulates along the transition zone between the relict iron core and the incipient corrosion area, consistent with findings reported in the literature [2,10,33,34]. However, the distribution of Cl is not homogeneous across the entire iron nail fragment but rather occurs in specific cavities. Furthermore, sulfur (S) is frequently observed to co-localize with Cl in these regions, suggesting an association between these elements. This observation is consistent with the results of backscattered electron (BSE) imaging, which also revealed Cl- and S-rich areas adjacent to the iron nail core. The remaining cross-sectional area of the nail displays slight variations in iron concentrations, with slightly more intense orange regions resembling the core area. These variations are attributed to the layered or isolated occurrence of mineral phases from Zones III and IV, as identified in previous analyses.
3.3. EPMA Data Evaluation
The elemental distributions as shown by µ-XRF were analysed in more detail using the EPMA for sample FF01_1 as a representative example. Since Cl and S concentrations are already evident from the µ-XRF element distribution images of sample FF01_1, the focus of the quantitative measurements was on these two elements. Concerning the extent of Cl contents, two concentration ranges can be identified based on the analytical data (Figure 4, Table 3) since some of the measurements show Cl contents between 1 and 5 wt.%, which correlate relatively well with the typical chlorine contents of 1–9 wt.% of akaganéite from literature [32]. The second range is between 11 and 15 wt.% Cl; this indicates that this is the predecessor phase of akageneite described by various authors [3,12] as β-Fe2(OH)3Cl. According to Réguer et al. [16], this phase has a Cl content of 14–20 wt.%, which is largely consistent with the measured values. For a clear visualization, the Fe and Cl contents can be plotted against each other in a diagram, as shown in Figure 4. Here, three groups can thus be roughly observed:
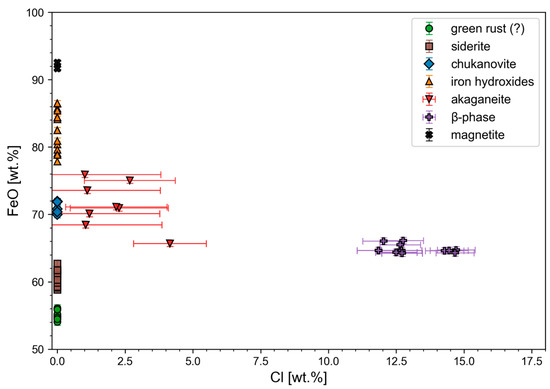
Figure 4.
FeO vs. Cl diagram for chemical discrimination between the Fe-Cl-bearing corrosion phases.

Table 3.
Representative EPMA analyses of corrosion phases from sample FF01_1 (n.d. not detected).
- Iron oxides, hydroxides, and carbonates without significant Cl contents;
- Cl contents between 1 and 5 wt.% (akaganéite);
- Cl contents > 10% by weight (β-Fe2(OH)3Cl).
It is noticeable in Figure 4 that some measuring points are located on the ordinate. This area is characterized by low (sometimes even below the detection limit) to no Cl contents. Furthermore, a subdivision according to different FeO contents can be made, which is shown in Figure 5. Due to the numerous chemical varieties of the green rust corrosion phase, it is difficult to determine the exact variety, but due to the too-low Cl− and SO3 contents at these measuring points, it can at least be assumed that it is most likely CO3-bearing green rust.

Figure 5.
Chemical differentiation of the corrosion phases based on their FeO contents.
Concerning the analyzed S contents, it was observed that at some analysis points significant concentrations of S of up to 5 wt.% were observed (Table 3). However, it should be noted that due to the very fine grain sizes of the minerals the measurement points have very large standard deviations and represent most likely mixtures of minerals, and these data must therefore be treated with caution. Despite this, it turns out that the siderite and chukanovite areas show the highest S contents and, at the same time, the lowest standard errors. The presence of possible iron sulfate compounds, such as schwertmannite Fe16O16(OH)y(SO4)z or jarosite KFe3[(OH)6(SO4)2], could be responsible for this, but the analyses do not allow an unambiguous attribution of these phases.
3.4. Raman Data Evaluation
For sample FF01_1, analyses using Raman spectroscopy initially confirmed the assumption that β-Fe2(OH)3Cl, the precursor phase of akaganéite, is present as a corrosion product (Figure 6). Réguer et al. [16] had already intensively analyzed the band positions of this phase, which quickly revealed that some of the bands showed only minimal shifts in their positions and that they were almost certainly β-Fe2(OH)3Cl. Akaganéite could not be detected in any of the measured positions in this sample, but chemical analysis using EPMA was able to confirm the presence of akaganéite.
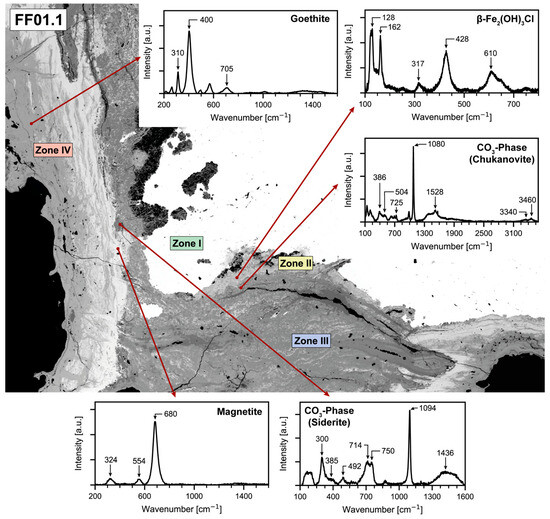
Figure 6.
BSE image of sample FF01_1 showing the different mineralogical zones according to Figure 3 and the locations of the Raman spectroscopy analyses.
The presence of a CO3 phase was also confirmed in some micro-domains. Siderite FeCO3 and chukanovite Fe2(CO3)(OH)2 are mentioned in the literature as typical CO3 phases occurring in corrosion processes [35]. Comparing the band positions in Figure 6, both spectra could be assigned to one of the two phases. In the range between 3300 and 3500 cm−1, two bands were found at 3340 and 3460 cm−1, which can be assigned to the OH stretching vibrations. In the case of both spectra, a strikingly broad band range can be observed from 1300 to 1600 cm−1, which, according to Saheb et al. [32], can be interpreted as a range for the CO stretching vibration. Furthermore, Saheb et al. [32] describe that additional bands can occasionally be detected that cannot be assigned to either siderite or chukanovite, which is probably because laser excitation affects the surrounding areas, and these are also detected as a result.
The areas with increased sulfur contents from the element distribution images of the electron beam microprobe did not provide any usable measurement results, as it was not possible to measure spectra in these areas due to high fluorescence. The outermost areas of the nail cross-section yielded significantly better results, where, in some cases, a low-power alternating sequence of light and dark grey areas occurs. It is clear from the spectra of the light grey areas that this must be magnetite. The band positions for magnetite are 680, 554, and 324 cm−1, which show only a slight deviation from reference spectra [32]. A slight shift to higher wavenumbers can also be observed within the dark grey areas, but the band positions still show relatively good agreement with the magnetite reference positions from Colomban et al. and Bellot-Gurlet et al. [35,36].
3.5. µCT Data Evaluation
By correlating the EPMA data (BSE images and minerals analyses) of sample FF01_1 and the corresponding μCT slices to constrain the density intervals defined in Table 2, we were able to quantitatively analyze the data (Table 4, Figure 7) and generate a 3D spatial distribution map of the corresponding density ranges (Figure 8 and Figure 9). Additionally, the particle size distribution of the different materials was visualized (Figure 10, Figure 11, Figure 12, Figure 13 and Figure 14). This combination of parameters enabled the creation of visual models that provide insights into the spatial distribution of corrosion areas, the overall state of corrosion, and the general condition of preservation.

Table 4.
Quantitative results of the observed density intervals of each sample (VF—volume fraction, MPD—mean particle diameter, MPD_STD—MPD standard deviation).
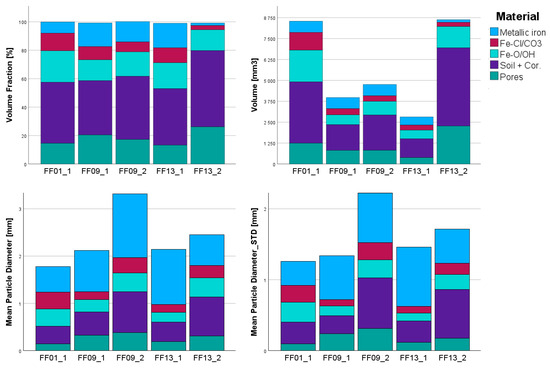
Figure 7.
Diagrams of the volumetric and textural distribution between the different samples and the five groups of materials (metallic iron: Fe; Fe-Cl/CO3 Fe-Cl-bearing phases + Fe-carbonates; Fe-O/OH: iron oxides/hydroxides; soil + cor.: soil with corrosion products; STD—standard deviation).
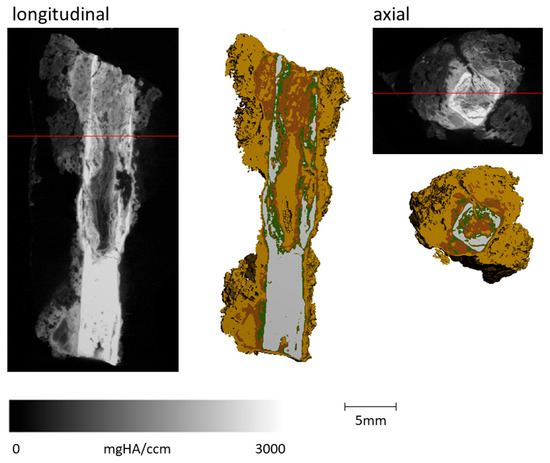
Figure 8.
Sample FF13_1 imaging the longitudinal and axial cut of the greyscale µCT image and the derived composition of the different materials (grey: metallic iron: Fe; green: Fe-Cl/Cl: Fe-Cl-bearing phases + Fe-carbonates; reddish brown: Fe-O/OH: iron oxides/hydroxides; light brown: soil + cor.: soil with corrosion products). A clear, solid metal body is visible in the lower third, whereas the top part shows intense corrosion.
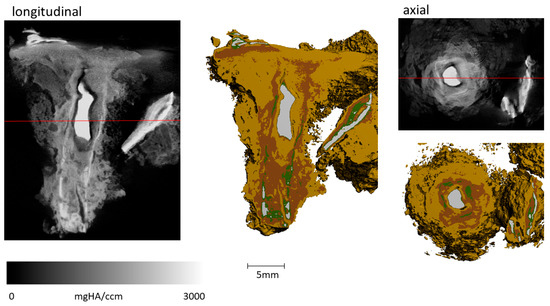
Figure 9.
Sample FF13_2 imaging of longitudinal and axial cut of greyscale µCT image and the derived composition of the different materials (grey: metallic iron: Fe; green: Fe-Cl/Cl: Fe-Cl-bearing phases + Fe-carbonates; reddish brown: Fe-O/OH: iron oxides/hydroxides; light brown: soil + cor.: soil with corrosion products). Only a small metallic body in the center and to the side remains. An increased amount of Fe-O/OH can be observed in comparison to FF13_1 (Figure 8). The amount of Fe-Cl/Cl: Fe-Cl-bearing phases, and Fe-carbonates is about the same.
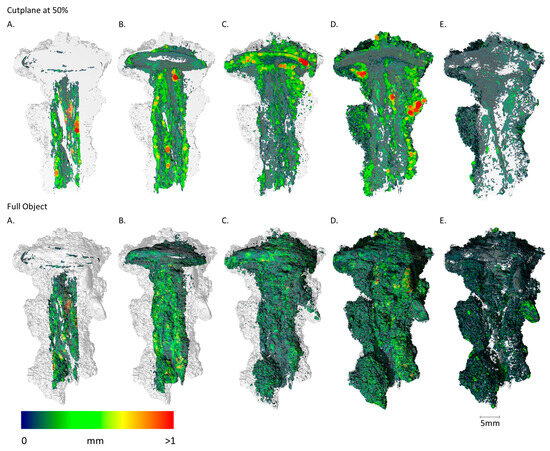
Figure 10.
Sample FF01_1 imaging of the spatial distribution and MPD of the different materials, abbreviated (A–E) ((A): metallic iron; (B): Fe-Cl/CO3; (C): Fe-O/OH; (D): soil + cor.; (E): pores). Upper sequence shows the results of the cut plane at 50% and lower sequence shows the results of the full object. (A): The shaft exhibits a split at the centre of the metallic core. The nail head is fully corroded, with only small metallic relics remaining. (B): Iron chloride- and carbonate-bearing phases are near the remaining metallic regions. (C): Iron oxides and hydroxides demonstrate higher mobility and are therefore found at greater distances from the metallic bodies. The fully corroded nail head is clearly visible, representing the largest volume and thickest corrosion layer. (D,E): Aggregated soil is situated farthest from the metallic core, contributing the greatest volume and exhibiting the highest porosity.

Figure 11.
Sample FF09_1 imaging of the spatial distribution and MPD of the different materials, abbreviated (A–E) ((A): metallic iron; (B): Fe-Cl/CO3; (C): Fe-O/OH; (D): soil + cor.; (E): pores). Upper sequence shows the results of the cut plane at 50% and lower sequence shows the results of the full object. (A) A solid metallic body is visible in the upper quarter of the sample, while the lower section shows a fractured compartment. (B) A thin layer of iron chloride- and carbonate-bearing phases is found near the metallic regions. (C) Iron oxides and hydroxides exhibit higher mobility and are therefore located farther from the metallic bodies. (D,E) Soil filling is present within the fractured area, characterized by high porosity. Additional aggregated soil deposits are observed surrounding the nail, with porosity predominantly concentrated in the outer regions.
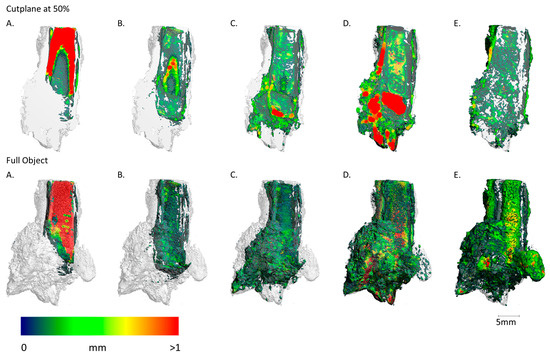
Figure 12.
Sample FF09_2 imaging of the spatial distribution and MPD of the different materials, abbreviated (A–E) ((A): metallic iron; (B): Fe-Cl/CO3; (C): Fe-O/OH; (D): soil + cor.; (E): pores). Upper sequence shows the results of the cut plane at 50% and lower sequence shows the results of the full object. (A) A significant metallic body is visible at the top, exhibiting corrosion that extends inward from the lower part, forming a cone-shaped zone within the metal. (B) Iron chloride- and carbonate-bearing phases are located near the metallic compartments, with a notable cluster observed inside the corrosion cone. (C) Iron oxides and hydroxides display higher mobility and are therefore found at greater distances from the metallic core. The thickest accumulations are observed approximately 8 mm below the base of the corrosion cone. (D,E) Large soil clusters are present beneath the corrosion cone. A notably highly porous area is visible in the lower right quadrant.
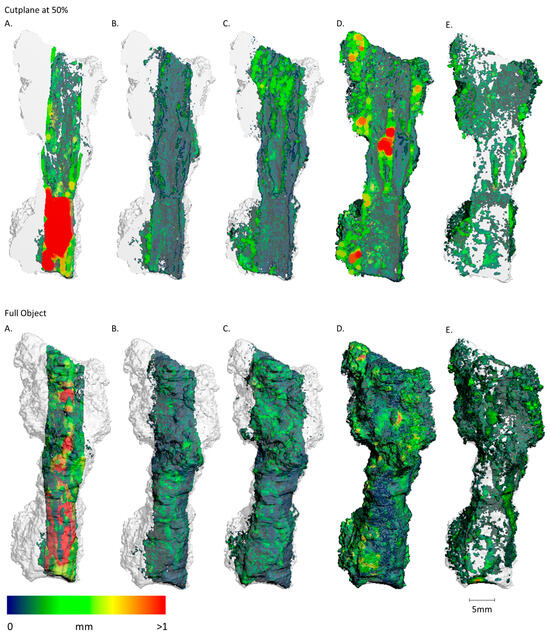
Figure 13.
Sample FF13_1 imaging of the spatial distribution and MPD of the different materials, abbreviated (A–E) ((A): metallic iron; (B): Fe-Cl/CO3; (C): Fe-O/OH; (D): soil + cor.; (E): pores). Upper sequence shows the results of the cut plane at 50% and lower sequence shows the results of the full object. (A) A significative metallic core is visible in the lower third of the sample. Comparable to Figure 13, the rest of the nail is highly corroded. (B) Thin layers of Iron chloride- and carbonate-bearing phases are in direct vicinity to the metallic areas. (C) Iron oxides and hydroxides display higher mobility and are therefore found at greater distances from the metallic body. A big cluster is visible in the top 20% of the sample. (D,E) A big soil filling with a prominent thickness is visible inside the former nail shaft in the center of the sample. The soil is aggregated more to the left side of the object. Again, the pores are more prominent on the outside of the sample.
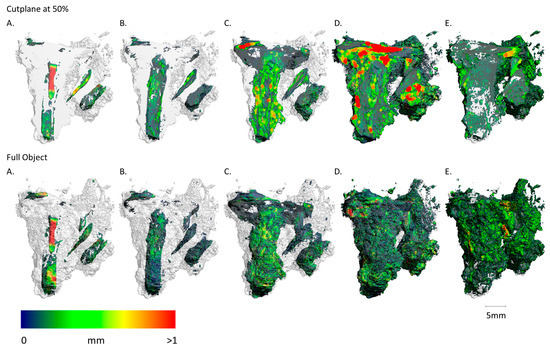
Figure 14.
Sample FF13_2 imaging of the spatial distribution and MPD of the different materials abbreviated (A–E) ((A): metallic iron; (B): Fe-Cl/CO3; (C): Fe-O/OH; (D): soil + cor.; (E): pores). Upper sequence shows the results of the cut plane at 50% and lower sequence shows the results of the full object. (A) As the sample with the highest corrosion, only a relatively small iron body with a higher thickness is visible in the centre of the sample. Parts of an additional iron relic are visible on the right, which could not be seen from the outside. (B) Thin layers of Iron chloride- and carbonate-bearing phases are in direct vicinity to the metallic areas. (C) Most of the corrosion took place after the excavation, and thus the highest iron oxides and hydroxides content is also clearly visible and has the visual effect of looking like the original nail. (D,E) Big volumes with a big diameter of soil are aggregated into the sample. Big pores are visible in the top right quadrant.
One significant challenge in evaluating iron objects with µCT is the issue of iron fluorescence, which leads to overexposure in the outer areas of the nail. This phenomenon complicates the resolution of fine structures near the surface, making it difficult to accurately include them in the density distribution after conventional reconstruction. However, as detailed above, modifications to the greyscale slope and distribution during the reconstruction process resulted in a marked improvement in the differentiation between high-density metallic iron and the various lower-density corrosion products. This adjustment significantly reduced overexposure caused by iron fluorescence, allowing for a more precise resolution of the fine structural details within the nail.
The re-evaluation of the density thresholds, as outlined in Table 2, enabled the division of the core area into distinct regions of relict iron and incipient corrosion. This refinement was critical for accurately representing the spatial distribution of individual density ranges, revealing new features within the nail core that were previously obscured. Regarding the corrosion areas, four distinct zones can now be identified (see Table 5), which correlate with the classifications proposed by [37]:

Table 5.
Refined threshold attribution to the zones of Neff et al. [38].
- Relict iron: This zone consists of remnants of the original nail, which appear as skeletal remains. It is evident that most of the iron in this region has already undergone transformation into other corrosion phases due to ongoing corrosion processes. This area corresponds to the ‘metallic substrate’ identified by [37].
- High-density corrosion products: This area is distinguished by the presence of high-density corrosion phases on the surface of the former nail, which, in some cases, extend beyond it. Due to the elevated density in this region, it is classified as the “dense product layer (DPL).”
- Low-density corrosion products: Within this zone, corrosion products with significantly lower densities are present, often mixed with soil. This area corresponds to the “transformed medium” defined in earlier classifications.
- Adherent soil material: This zone, characterized by the lowest densities, consists primarily of soil particles and fragments. It is evident that certain soil materials exhibit distinguishable characteristics from the adjacent corrosion phases. It is important to note that both the low-density corrosion products and the adherent soil material are classified as part of the “transformed medium”.
In addition to the spatial visualization of corrosion areas, the volumetric proportions of different density intervals were calculated. These volumetric proportions, presented in Table 4, reveal that the dominant fraction is composed of cemented soil material. Among the samples sealed in Araldite and vacuum-packed without surrounding soil (FF01_1, FF09_1, FF13_1), µCT analysis shows a moderate presence of both low- and high-density corrosion products, while a relict iron core is still detectable in most cases except FF01_1 (e.g., [2,26,29]). However, significant differences in corrosion intensity are evident. Notably, FF01_1 and FF09_1 exhibit concentrated high-density zones adjacent to the remaining metallic iron, suggesting already strong corrosion progress in the soil despite the sealed environment.
In contrast, FF09_2, which was vacuum-sealed together with moist in situ soil, shows a more uniform and stable corrosion morphology with comparatively better metal preservation. The retained burial conditions appear to buffer environmental shifts, reducing oxidative and chloride-driven transformations.
The most pronounced degradation is observed in FF13_2, stored in a non-sealed zip bag with low barrier properties. This sample displays a significant increase in low-density corrosion phases and an almost complete loss of metallic iron, confirming the accelerating effect of unregulated post-excavation exposure. As FF01_1 and FF13_2 both contain portions of the nail head, a direct comparison between the samples reveals greater degradation in the head area compared to the shaft. Additionally, a volumetric analysis of the remaining metallic iron content shows a difference of approximately 6% between the two samples, despite their nearly identical total volumes.
4. Discussion
The results of this study demonstrate that µCT is an effective and powerful non-destructive technique for visualizing corrosion structures in three dimensions. The analysis revealed notable density variations within the corroded iron artefacts, which can be attributed to different corrosion phases. The ability to spatially resolve these phases provides valuable insights into the internal structure of the corrosion layers and their evolution over time, particularly when samples remain embedded in surrounding soil during storage. In this context, µCT is not merely a complementary technique, but a robust standalone method for assessing the preservation state of archaeological iron objects prior to intervention. Its non-invasive nature and rapid application make it especially valuable for pre-restoration diagnostics and conservation planning. However, µCT alone cannot unambiguously differentiate corrosion phases with similar radiodensities—such as goethite (α-FeOOH), lepidocrocite (γ-FeOOH), magnetite (Fe3O4), and akaganéite (β-FeO(OH,Cl)), highlighting the importance of complementary chemical and spectroscopic methods for selected samples (SEM-EDS, Raman spectroscopy: [26,29], neutron tomography: [2]). These additional techniques allow for more accurate phase identification and can enhance the interpretation of the µCT data when necessary.
A significant finding of this study is the variability observed in the progression of corrosion across different artefacts. Even within similar burial environments, significant differences in the thickness, composition, and porosity of the corrosion layers were noted. This suggests that corrosion is not only influenced by external environmental factors such as soil chemistry and moisture content but is also affected by intrinsic properties of the metal, including microstructural heterogeneities such as fractures [29], impurities, and pre-existing defects. The identification of chlorine-rich zones within some corrosion layers emphasizes the role of chlorine migration in sustaining and catalyzing corrosion processes. These findings align with previous studies [2,33,37,39,40], which have demonstrated that chlorine ions remain highly mobile within corrosion layers, continuing to drive deterioration even after initial conservation treatments. This behavior aligns with findings that Cl− ions remain mobile and continue to catalyse corrosion post-treatment, penetrating the corrosion matrix [41].
From a conservation standpoint, this study emphasizes the critical importance of appropriate storage conditions immediately following excavation. The evaluation of various packaging and preservation methods revealed that uncontrolled exposure to atmospheric conditions leads to rapid degradation, particularly in artefacts contaminated with chlorine. This was clearly reflected in the µCT-based analysis of sample FF13_2, which had been stored unsealed in a low-barrier plastic bag: here, a marked loss of metallic iron and a dominant presence of low-density iron corrosion products indicated advanced corrosion. In contrast, samples FF09_1 and FF13_1, which were also vacuum-sealed in epoxy resin but shortly after excavation and before significant exposure, exhibited more balanced proportions of high- and low-density corrosion products and retained a clearly defined metallic core (cf. [42]). In contrast, FF01_1, which was sealed with the same method, shows no relic core but appears heavily fractured in the shaft area. Potentially, the nail had some material weaknesses, as a big fracture in the center is clearly visible. The direct comparison between the two nail head-containing samples, FF01_1 and FF13_2, yields a clear difference in iron content and high-density corrosion products, which supports the conclusion that unregulated post-excavation exposure has led to increased degradation in sample FF13_2. The most favourable µCT results were observed in FF09_2, the only sample preserved with moist in-situ soil under vacuum, showing a stable corrosion morphology and comparatively lower transformation of metallic iron. These findings highlight that not only the sealing method but also the inclusion of the burial matrix plays a decisive role in mitigating chloride migration and oxidative corrosion (cf. [43]). Appropriate packaging strategies that preserve micro environmental conditions are therefore crucial for maintaining the structural integrity of archaeological iron following excavation.
While certain conservation strategies, such as low-humidity storage and chlorine extraction treatments, have demonstrated effectiveness in reducing corrosion, their long-term efficacy remains to be fully determined (cf. [44]). Furthermore, the formation of akaganéite appears to be contingent on chlorine concentrations and environmental factors. This suggests that targeted interventions focused on chemical stabilization may be required for objects in a severely deteriorated state. The µCT findings confirm that early, appropriate packaging measures can significantly influence post-excavation corrosion pathways and should be considered a critical component of any conservation strategy [45].
Future research should focus on refining non-destructive imaging techniques (e.g., neutron tomography for small artefacts: [2]) to improve phase resolution and the ability to distinguish between closely related corrosion products. High-resolution nano-CT imaging could offer an even more detailed view of the microstructural evolution of corrosion layers, providing deeper insights into the processes driving deterioration. Furthermore, integrating µCT with synchrotron-based spectroscopic techniques could provide new perspectives on the chemical state of iron corrosion phases at the molecular level. Combining these advanced analytical methods will allow us to develop a more comprehensive framework for diagnosing and addressing corrosion in archaeological iron artefacts. This will ultimately enhance conservation strategies and ensure the long-term preservation of these cultural heritage materials.
5. Conclusions
We show that µCT can assess the state of corrosion of iron findings with nondestructive means inside its congregated soil before alteration methods are performed. Especially, we want to mention that the congregated iron fragments in sample FF13_2 were not visible from the outside.
Furthermore, this investigation underlines the critical importance of effective handling, storage, and packaging methods in preserving archaeological iron objects. The study demonstrates that corrosion products exhibit varying mineralogical and chemical properties, which makes it impossible to apply a universal packaging method (cf. [4]). Therefore, conservation strategies must be tailored to the specific condition of each artefact. The findings indicate that chlorine-bearing phases can form as early as the excavation stage, with improper storage conditions after excavation accelerating their development (cf. [46]). High humidity and exposure to oxygen promote the formation of akaganéite (β-FeO(OH,Cl)), while reducing atmospheric oxygen and moisture can effectively slow corrosion [13].
µCT has proven to be an invaluable tool in visualizing the spatial distribution of corrosion products and assessing their structural impacts (cf. [2,45]). The integration of µCT data into conservation workflows provides essential insights into the extent of degradation and the effectiveness of various conservation approaches.
Following a thorough evaluation of the results, it is recommended that a combined packaging strategy be implemented. This strategy should incorporate both airtight storage and rapid conservation treatments, with the aim of mitigating further corrosion. It is recommended that modern imaging techniques, particularly µCT, be further explored as a standard tool for non-destructive corrosion diagnostics, the assessment of the state of preservation, and the monitoring of conservation efforts [2]. An interdisciplinary approach combining µCT with mineralogical and chemical analyses is crucial for improving the long-term preservation of archaeological iron artefacts (cf. [17]).
Author Contributions
Conceptualization, G.D., S.W., P.T. and U.T.; methodology, G.D., S.W., P.T. and U.T.; validation, G.D., S.W. and P.T.; formal analysis G.D. and S.W.; investigation, G.D. and S.W.; resources, M.A. and U.T.; data curation, G.D. and S.W.; writing—original draft preparation, G.D., S.W. and P.T.; writing—review and editing, G.D., S.W., P.T., U.T. and M.A.; visualization, G.D., S.W. and U.T.; supervision, P.T.; project administration, P.T. and U.T. All authors have read and agreed to the published version of the manuscript.
Funding
This research received no external funding.
Data Availability Statement
Image and analysis data can be shared upon request to either Peter Tropper or Gerald Degenhart.
Acknowledgments
We would like to acknowledge the use of DeepL (DeepL SE, Cologne, Germany, https://www.deepl.com/) and ChatGPT (v.4.5 OpenAI Inc., San Francisco, CA, USA) in the preparation of this manuscript. DeepL was applied for translations and to improve the overall flow of the text, while ChatGPT was used to enhance readability and grammatical accuracy.
Conflicts of Interest
The authors declare no conflicts of interest.
Abbreviations
The following abbreviations are used in this manuscript:
| µCT | Micro-Computed Tomography |
| CT | Computed Tomography |
| nano-CT | Nano-Computed Tomography |
| EPMA | Electron Probe Microanalyzer |
| µ-XRF | Micro X-Ray Fluorescence |
| PXRD | Powder X-Ray Diffraction |
| EDS | Energy Dispersive Spectroscopy |
| WDS | Wavelength Dispersive Spectroscopy |
| MPD | Mean Particle Diameter |
| MPD_STD | Mean Particle Diameter Standard deviation |
| BSE | Back-Scattered Electron |
| Fe-Cl/CO3 | Fe-Cl-bearing phases + Fe-carbonates |
| Fe-O/OH | Iron Oxides/Hydroxides |
| Soil + Cor. | Soil with Corrosion Products |
| DPL | Dense Product Layer |
References
- Selwyn, L. Overview of archaeological iron: The corrosion problem, key factors affecting treatment, and gaps in current knowledge. In Proceedings of the International Conference on Metals Conservation, Canberra, Australia, 4–8 October 2004; pp. 294–306. [Google Scholar]
- Jacot-Guillarmod, M.; Schmidt-Ott, K.; Mannes, D.; Kaestner, A.; Lehmann, E.; Gervais, C. Multi-modal tomography to assess dechlorination treatments of iron-based archaeological artifacts. Herit. Sci. 2019, 7, 29. [Google Scholar] [CrossRef]
- Rémazeilles, C.; Refait, P. Formation, fast oxidation and thermodynamic data of Fe(II) hydroxychlorides. Corros. Sci. 2008, 50, 856–864. [Google Scholar] [CrossRef]
- Watkinson, D.; Lewis, M. Conservation of Iron. In Metal 2004 Proceedings; Ashton, J., Hallam, D., Eds.; National Museum of Australia: Canberra, Australia, 2004; pp. 88–92. [Google Scholar]
- Turgoose, S. The Corrosion of Archaeological Iron during Burial and Treatment. Stud. Conserv. 1985, 30, 13–18. [Google Scholar] [CrossRef]
- Greiff, S.; Bach, D. Eisenkorrosion Und Natriumsulfitentsalzung: Theorie Und Praxis. In Arbeitsblätter Für Restauratoren, Gruppe 1, Eisen (Heft 2); Verl. d. Röm.-German. Zentralmuseums: Mainz, Germany, 2000; pp. 319–339. [Google Scholar]
- Mazzola, C.; Albert, P.; Muskalla, W.; Wittkörper, M. Das KUR-Projekt: Massenfunde in Archäologischen Sammlungen; Archäologische Staatsammlung München, Römisch-Germanisches Museum Mainz: Mainz, Germany, 2009; p. 82. [Google Scholar] [CrossRef]
- Schmutzler, B. Rettung vor dem Rost: Die Weiterentwicklung der Eisenentsalzung nach der Alkali-Sulfit-Methode zur Erhaltung großer Fundmengen. In Internationale Archäologie Naturwissenschaft und Technologie, 1st ed.; VML Vlg Marie Leidorf: Rahden, Germany, 2012; ISBN 978-3-89646-407-1. [Google Scholar]
- North, N.A.; MacLeod, I.D. Corrosion of Metals. In Conservation of Marine Archaeological Objects; Pearson, C., Ed.; Butterworth-Heinemann: London, UK, 1987; pp. 207–252. [Google Scholar]
- Selwyn, L.S.; Sirois, P.I.; Argyropoulos, V. The corrosion of excavated archaeological iron with details on weeping and akaganeite. Stud. Conserv. 1999, 44, 217–232. [Google Scholar] [CrossRef]
- Refait, P.; Abdelmoula, M.; Génin, J.M.R. Mechanisms of Formation and Structure of Green Rust One in Aqueous Corrosion of Iron in the Presence of Chloride Ions. Corros. Sci. 1998, 40, 1547–1560. [Google Scholar] [CrossRef]
- Refait, P.; Génin, J.M.R. The Mechanisms of Oxidation of Ferrous Hydroxychloride β-Fe2(OH)3Cl in Aqueous Solution: The Formation of Akaganeite vs. Goethite. Corros. Sci. 1997, 39, 539–553. [Google Scholar] [CrossRef]
- Ståhl, K.; Andersen, H.J.; Elding-Pontén, E.; Hallberg, L. On the Akaganéite Crystal Structure, Phase Transformations and Possible Role in Post-Excavational Corrosion of Iron Artifacts. Corros. Sci. 2003, 45, 2563–2575. [Google Scholar] [CrossRef]
- Pourbaix, M.; Staehle, R.W. Lectures on Electrochemical Corrosion; Springer: Boston, MA, USA, 1973. [Google Scholar]
- Kergourlay, F.; Réguer, S.; Neff, D.; Foy, E.; Picca, F.E.; Saheb, M.; Hustache, S.; Mirambet, F.; Dillmann, P. Stabilization treatment of cultural heritage artefacts: In situ monitoring of marine iron objects dechlorinated in alkali solution. Corros. Sci. 2018, 132, 21–34. [Google Scholar] [CrossRef]
- Réguer, S.; Neff, D.; Bellot-Gurlet, L.; Dillmann, P. Deterioration of iron archaeological artefacts: Micro-Raman investigation on Cl-containing corrosion products. J. Raman Spectrosc. 2007, 38, 389–397. [Google Scholar] [CrossRef]
- Scott, D.A. Metallography and Microstructure of Ancient and Historic Metals; Getty Publication, Conservation Institute: Marina del Rey, CA, USA, 1991. [Google Scholar]
- Vogl, T.J.; Reith, W.; Rummeny, E.J. Diagnostische und Interventionelle Radiologie; Springer e-books; Springer: Berlin/Heidelberg, Germany, 2011; ISBN 978-3-540-87668-7. [Google Scholar]
- Bernardini, F.; Tuniz, C.; Zanini, F. X-ray computed microtomography for paleoanthropology, archaeology, and cultural heritage. In Nanotechnologies and Nanomaterials for Diagnostic, Conservation and Restoration of Cultural Heritage; Elsevier: Amsterdam, The Netherlands, 2019; pp. 25–45. [Google Scholar]
- Tuniz, C.; Zanini, F. Microcomputerized tomography (MicroCT) in archaeology. In Encyclopedia of Global Archaeology; Springer: Cham, Switzerland, 2018; pp. 1–7. [Google Scholar]
- Franchetti, G.; Viel, G.; Fais, P.; Fichera, G.; Cecchin, D.; Cecchetto, G.; Giraudo, C. Forensic applications of micro-computed tomography: A systematic review. Clin. Transl. Imaging 2022, 10, 597–610. [Google Scholar] [CrossRef]
- Barron, A. Applications of microct imaging to archaeobotanical research. J. Archaeol. Method Theory 2024, 31, 557–592. [Google Scholar] [CrossRef]
- Bozzini, B.; Alemán, B.; Amati, M.; Boniardi, M.; Caramia, V.; Giovannelli, G.; Gregoratti, L.; Abyaneh, M.K. Novel insight into bronze disease gained by synchrotron-based photoelectron spectro-microscopy, in support of electrochemical treatment strategies. Stud. Conserv. 2017, 62, 465–473. [Google Scholar] [CrossRef]
- Lipkin, S.; Karjalainen, V.-P.; Puolakka, H.-L.; Finnilä, M.A.J. Advantages and limitations of micro-computed tomography and computed tomography imaging of archaeological textiles and coffins. Herit. Sci. 2023, 1, 231. [Google Scholar] [CrossRef]
- Stelzner, J.; Ebinger-Rist, N.; Peek, C.; Schillinger, B. The application of 3D computed tomography with X-rays and neutrons to visualize archaeological objects in blocks of soil. Stud. Conserv. 2010, 55, 95–106. [Google Scholar] [CrossRef]
- Bernabale, M.; Cognigni, F.; Nigro, L.; Rossi, M.; de Caro, T.; De Vito, C. A comprehensive strategy for exploring corrosion in iron-based artefacts through advanced Multiscale X-ray Microscopy. Sci. Rep. 2022, 12, 6125. [Google Scholar] [CrossRef]
- Auer, M. Municipium Claudium Aguntum. In Roman Urban Landscape; Groh, S., Strobel, K., Belak, M., Horvat, J., Eds.; ZRC SAZU, Založba ZRC: Ljubljana, Slovenija, 2024; ISBN 978-961-05-0828-1. [Google Scholar]
- Töchterle, U.; Wagner, S.; Heck, P.; Tropper, P.; Degenhart, G. Der Erhaltungszustand von Archäologischen Eisenfunden Nach Der Bergung. In Archäometrie und Denkmalpflege 20; Virtuelle Jahrestagung 17.–19. März 2021; Greiff, S., Ed.; Metalla, Sonderheft; Deutsches Bergbau-Museum Bochum: Bochum, Germany, 2021; pp. 130–132. [Google Scholar]
- Bernabale, M.; Cognigni, F.; Mancini, C.; Proietti, A.; Mura, F.; Montanari, D.; Nigro, L.; Rossi, M.; De Vito, C. 3D fractures analysis and conservation assessment of wrought iron javelin through advanced non-invasive techniques. Sci. Rep. 2023, 13, 10142. [Google Scholar] [CrossRef]
- Cornard, P.H.; Degenhart, G.; Tropper, P.; Moernaut, J.; Strasser, M. Application of micro-CT to Resolve Textural Properties and Assess Primary Sedimentary Structures of Deep-marine Sandstones. Depos. Rec. 2024, 10, 559–580. [Google Scholar] [CrossRef]
- Hildebrand, T.; Rüegsegger, P. A New Method for the Model-independent Assessment of Thickness in Three-dimensional Images. J. Microsc. 1997, 185, 67–75. [Google Scholar] [CrossRef]
- Saheb, M.; Neff, D.; Bellot-Gurlet, L.; Dillmann, P. Raman study of a deuterated iron hydroxycarbonate to assess long-term corrosion mechanisms in anoxic soils. J. Raman Spectrosc. 2011, 42, 1100–1108. [Google Scholar] [CrossRef]
- Rémazeilles, C.; Neff, D.; Kergourlay, F.; Foy, E.; Conforto, E.; Guilminot, E.; Reguer, S.; Refait, P.; Dillmann, P. Mechanisms of Long-Term Anaerobic Corrosion of Iron Archaeological Artefacts in Seawater. Corros. Sci. 2009, 51, 2932–2941. [Google Scholar] [CrossRef]
- Cornell, R.M.; Schwertmann, U. The Iron Oxides: Structure, Properties, Reactions, Occurences and Uses, 1st ed.; John Wiley & Sons: Hoboken, NJ, USA, 2003; ISBN 978-3-527-30274-1. [Google Scholar]
- Colomban, P.; Cherifi, S.; Despert, G. Raman identification of corrosion products on automotive galvanized steel sheets. J. Raman Spectrosc. 2008, 39, 881–886. [Google Scholar] [CrossRef]
- Bellot-Gurlet, L.; Neff, D.; Réguer, S.; Monnier, J.; Saheb, M.; Dillmann, P. Raman studies of corrosion layers formed on archaeological irons in various media. J. Nano Res. 2009, 8, 147–156. [Google Scholar] [CrossRef]
- Xiong, H.; Liao, Y.; Zhou, L.; Xu, Y.; Wang, S. Biosynthesis of nanocrystal akaganéite from FeCl2 solution oxidized by Acidithiobacillus ferrooxidans cells. Environ. Sci. Technol. 2008, 42, 4165–4169. [Google Scholar] [CrossRef] [PubMed]
- Neff, D.; Vega, E.; Dillmann, P.; Descostes, M.; Bellot-Gurlet, L.; Béranger, G. Contribution of Iron Archaeological Artefacts to the Estimation of Average Corrosion Rates and the Long-Term Corrosion Mechanisms of Low-Carbon Steel Buried in Soil. In Corrosion of Metallic Heritage Artefacts; Elsevier: Amsterdam, The Netherlands, 2007; pp. 41–76. ISBN 978-1-84569-239-1. [Google Scholar]
- Selwyn, L.S. Corrosion of Metal Artifacts in Buried Environments. In ASM Handbook Volume 13C. Corrosion: Environments and Industries; ASM: Almere, The Netherlands, 2006; pp. 306–322. ISBN 978-0-87170-709-3. [Google Scholar]
- Réguer, S.; Dillmann, P.; Mirambet, F. Buried Iron Archaeological Artefacts: Corrosion Mechanisms Related to the Presence of Cl-Containing Phases. Corros. Sci. 2007, 49, 2726–2744. [Google Scholar] [CrossRef]
- Pingitore, N.E.; Lytle, F.W.; Rowe, M.W. Structural Characterization of Corrosion Product Layers on Archaeological Iron Artifacts. J. Cult. Herit. 2015, 16, 372–376. [Google Scholar] [CrossRef]
- Turgoose, S. Post-excavation changes in iron antiquities. Stud. Conserv. 1982, 27, 97–101. [Google Scholar] [CrossRef]
- Watkinson, D. Chloride extraction from archaeological iron: Comparative treatment efficiencies. Stud. Conserv. 1996, 41 (Suppl. 1), 208–212. [Google Scholar] [CrossRef]
- Scott, A.C.; Woods, R.A.; Harris, J.F. Accelerated corrosion test methods for evaluating external corrosion resistance of vacuum brazed aluminum heat exchangers. SAE Trans. 1991, 100, 578–586. [Google Scholar] [CrossRef]
- Neff, D.; Dillmann, P.; Bellot-Gurlet, L.; Beranger, G. Corrosion of Iron Archaeological Artefacts in Soil: Characterization of the Corrosion System. Corros. Sci. 2005, 47, 515–535. [Google Scholar] [CrossRef]
- North, N.A.; Pearson, C. Washing Methods for Chloride Removal from Marine Iron. Stud. Conserv. 1978, 23, 174–186. [Google Scholar] [CrossRef]
Disclaimer/Publisher’s Note: The statements, opinions and data contained in all publications are solely those of the individual author(s) and contributor(s) and not of MDPI and/or the editor(s). MDPI and/or the editor(s) disclaim responsibility for any injury to people or property resulting from any ideas, methods, instructions or products referred to in the content. |
© 2025 by the authors. Licensee MDPI, Basel, Switzerland. This article is an open access article distributed under the terms and conditions of the Creative Commons Attribution (CC BY) license (https://creativecommons.org/licenses/by/4.0/).