Article

Mineralogical, Petrological, 3D Modeling Study and Geostatistical Mineral Resources Estimation of the Zone C Gold Prospect, Kofi (Mali)

by
Jean-Jacques Royer
1,* and
Niakalé Camara
2
1
Georessources, CNRS-ENSG, 2 Rue du Doyen Marcel Roubault, 54500 Vandoeuvre-lès-Nancy, France
2
Département Génie des Mines, École Polytechnique de Montréal, C.P. 6079, succ. Centre-ville, Montréal, QC H3C 3A7, Canada
*
Author to whom correspondence should be addressed.
Minerals 2025, 15(8), 843; https://doi.org/10.3390/min15080843
Submission received: 26 May 2025 / Revised: 25 July 2025 / Accepted: 28 July 2025 / Published: 8 August 2025

Abstract

A 3D model integrating mineralogical, petrological, and geostatistical resource estimation was developed for Zone C of the Kofi Birimian gold deposit in Western Mali. Petrographic analysis identified two forms of gold mineralization: (i) native gold or electrum inclusions within pyrite, and (ii) disseminated native gold along pyrite fractures. Four types of hydrothermal alteration–epidotization, chloritization, carbonatization, and albitization were observed microscopically. Statistical analysis of geochemical data classified five lithologies: mafic dyke, felsic dyke, diabase, faulted breccia, and intermediate quartz diorite. Minerals identified petrographically were corroborated by multivariate correlations among elements (Cr, Fe, Ni, Al, Ti, Na, and Ca), as revealed by Principal Component Analysis (PCA). A 3D borehole-based model revealed spatial correlations between hydrothermal alteration zones and associated geochemical anomalies, notably tourmalinization (B) and albitization (Na), with the latter serving as a key indicator for new exploration targets. The spatial associations of anomalous Ag, B, Hg, As, and Na commonly linked to tourmalinization suggest favorable zones for gold and silver mineralization. Geostatistical analysis identified isotropic continuous mineralized structures for most elements, including gold. Spherical isotropic variograms with ranges from 35 to 75 m were fitted for in situ resource estimation (e.g., silver ≈ 40 m; gold ≈ 60 m). The resulting estimated resources (indicated + inferred), based on a 1.0 g/t Au cut-off, are 2.476 Mt at 3.5 g/t Au indicated (0.278 Moz or 8.67 t), and 1.254 Mt at 2.78 g/t Au inferred (0.112 Moz or 3.49 t). This study provides a framework for identifying new mineralized zones, and the multidisciplinary approach demonstrates the connections between mineralogy and the information embedded in geochemical datasets, which are revealed through appropriate tools and an understanding of the underlying processes.

1. Introduction

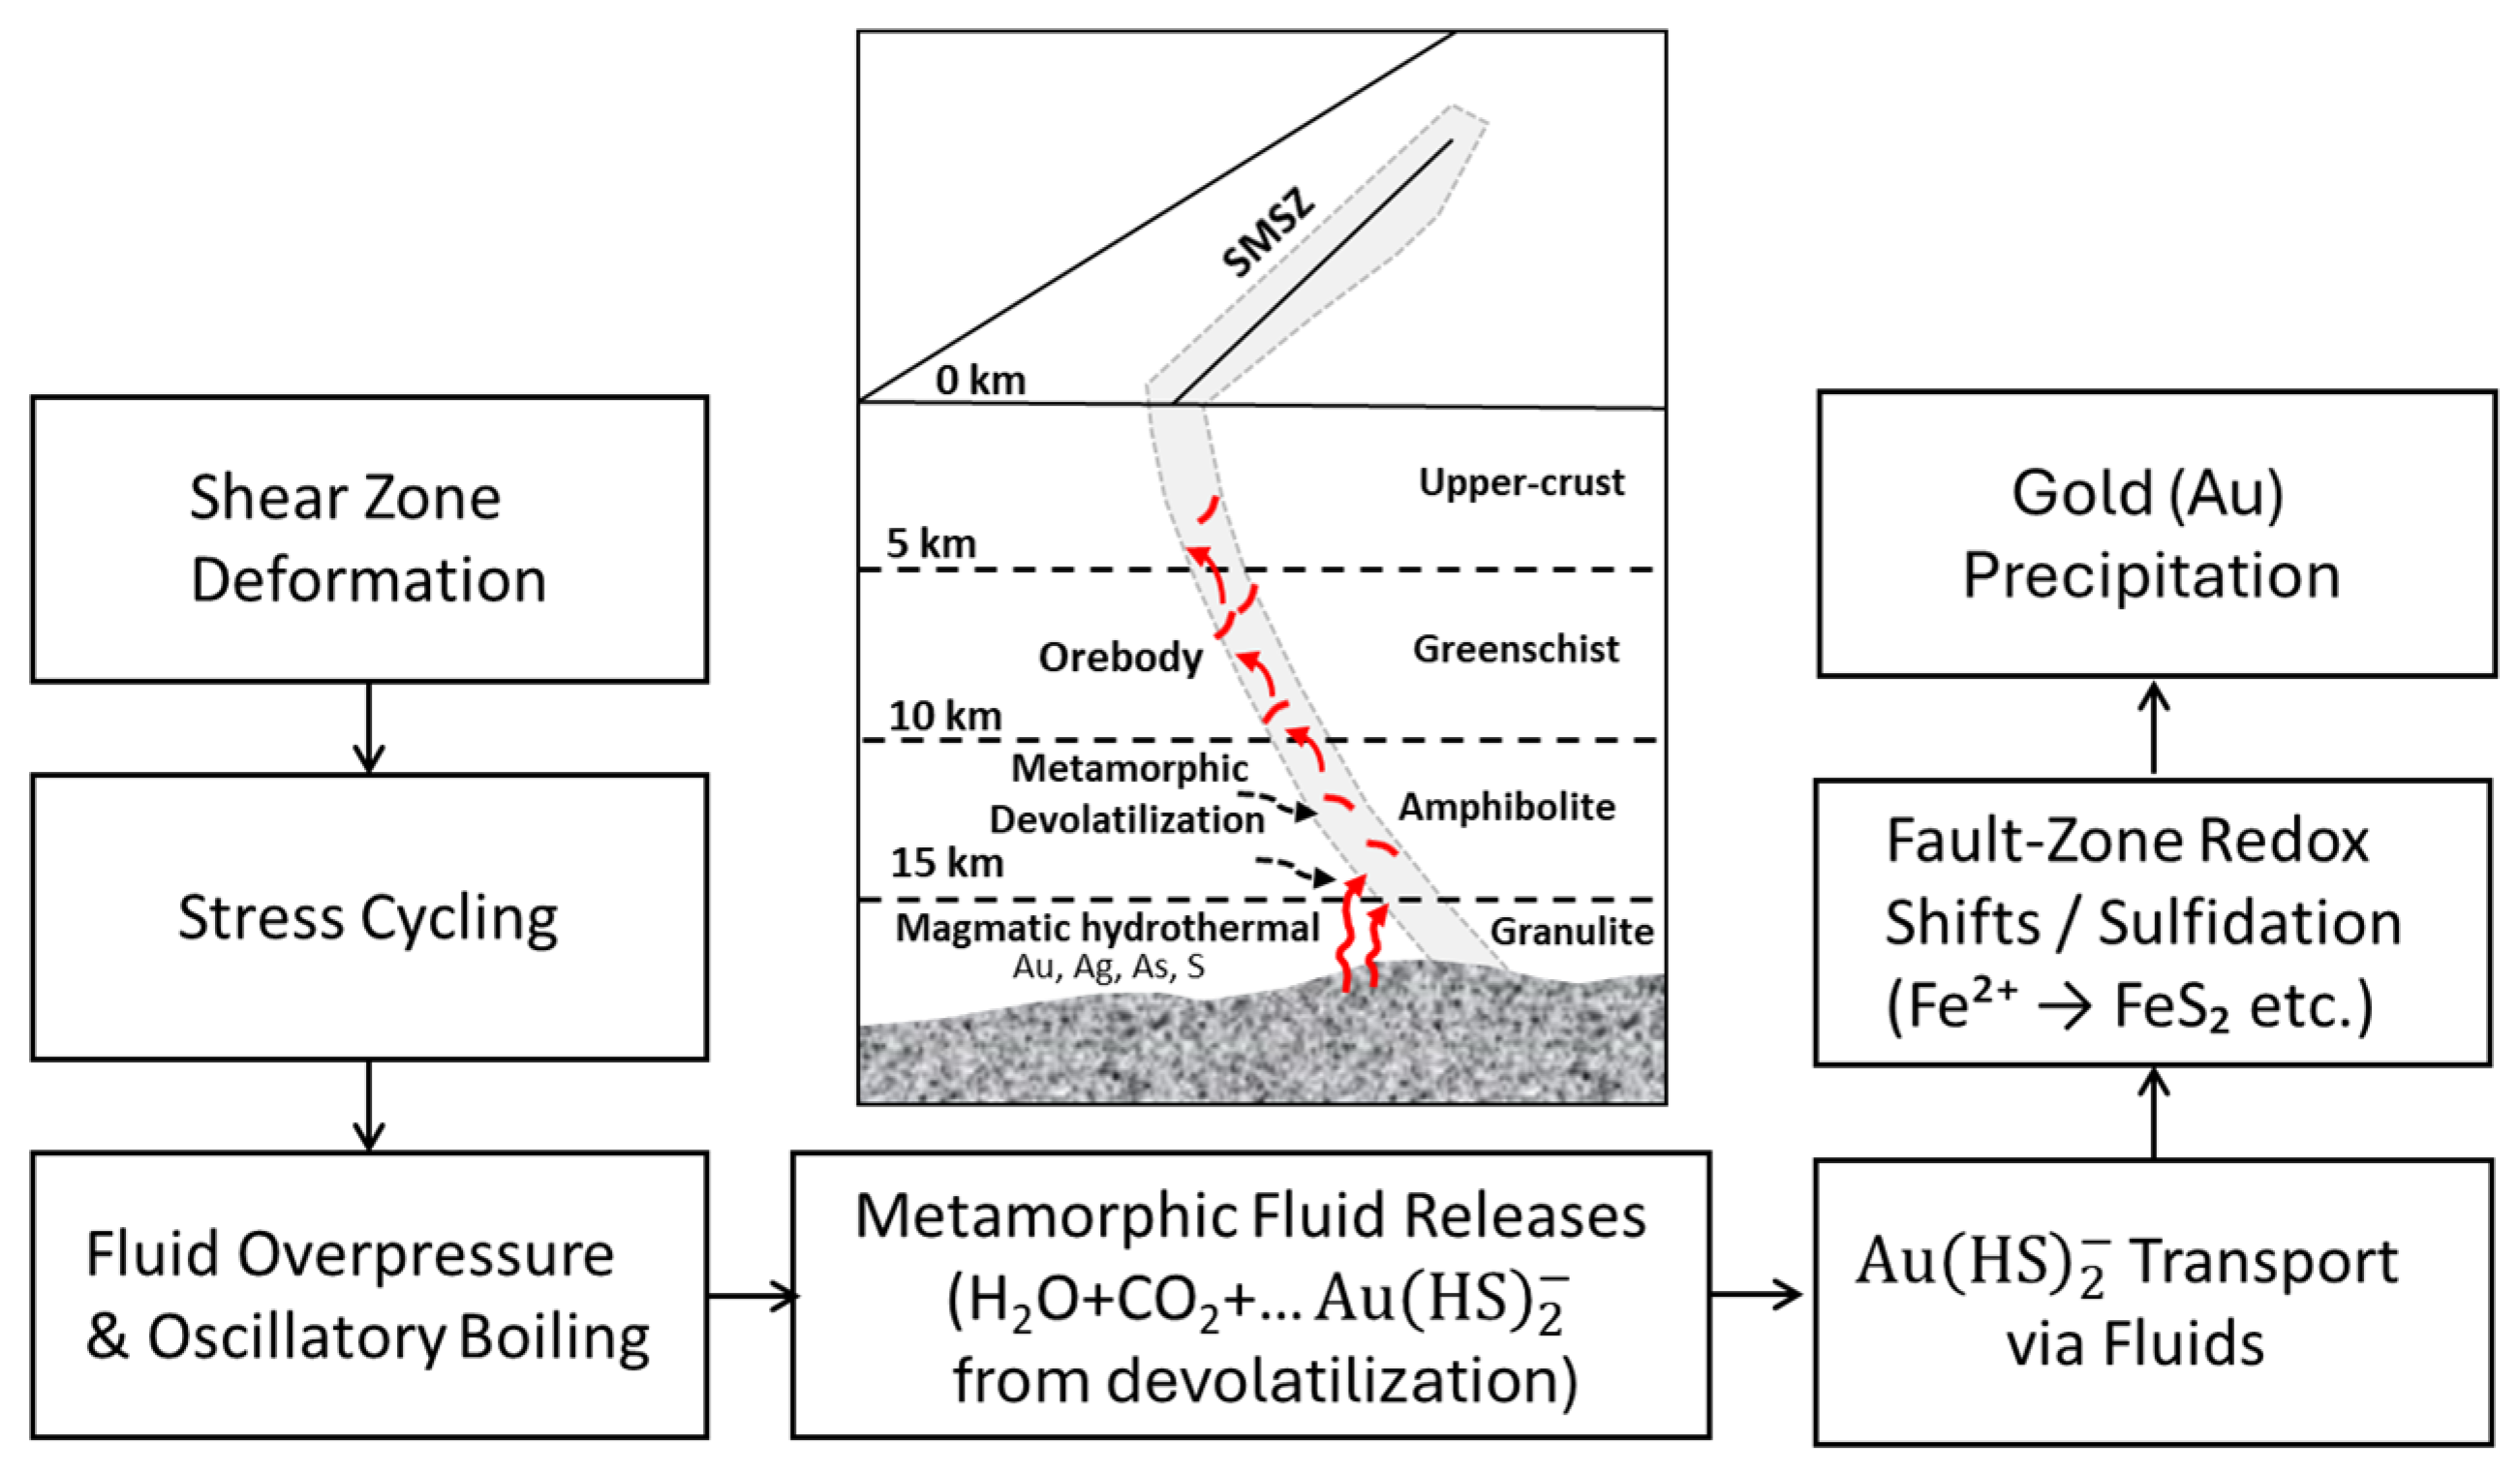
Orogenic gold deposits are hydrothermal in origin and account for over 75% of historical gold production (Figure 1). They formed over a 3 billion year span from the Middle Archean to the Phanerozoic periods [1,2] and are typically found in deformed upper to mid-crustal blocks (5–20 km depth), often localized along major shear zones that channel deep-seated hydrothermal fluids [3]. These deposits commonly occur in metamorphosed fore-arc and back-arc settings. Secondary and tertiary crustal structures further drive fluid flow, often associated with magma cooling, leading to localized gold deposition [2].
Their temporal distribution peaks during the Neoarchean (2.8–2.5 Ga), Paleoproterozoic (2.1–1.8 Ga), and Phanerozoic (500–50 Ma) eras, with a notable gap from 1.8 to 0.8 Ga-the so called boring billion, reflecting supercontinent (Wilson) cycles that control fluid mobilization through tectonic amalgamation and breakup [7,8].
The primary source of mineralizing fluids is the metamorphic devolatilization of supracrustal rocks (e.g., hydrated basalts, sediments), although magmatic fluids may contribute in some cases (e.g., alkaline and sanukitoid associated deposits) [9,10]. These fluids have low-salinity (1–6 wt.% NaCl eq.), CO2-rich metamorphic waters, typically comprising H2O-NaCl ± CH4 ± N2 [11]. Metals such as Au, Ag, As, and Sb are leached from host rocks and associated sulfides (e.g., pyrite, arsenopyrite) during deformation and metamorphism. Mineralization commonly occurs in quartz-carbonate veins, and gold is present as native metal or lattice-bound within sulfides (“invisible gold”). Isotope values δ18O (1.8 to 10.9‰), δD (−99 to −62.9‰), and (δ34S ≈ +5.5 to +13.3‰) indicate metamorphic water and a crustal sulfur source [12].
The Birimian gold deposits of the West African Craton (WAC) exemplify this setting, with major potential found in Burkina Faso, Senegal, Ghana, and Côte d’Ivoire. In Western Mali, in the Kédougou–Kénieba inlier, major deposits located in Sadiola, Yatéla, Loulo, and Tabakoto (Table 1) align along shear zones linked to the Senegal–Mali shear zone. These deposits show diverse geological controls, complex mineralization systems, and variable alteration styles, which all pose notable exploration challenges [13].
This study reinterprets mineralization at the Kofi Zone C project, located southwest of the Loulo deposit and ~400 km west of Bamako, Mali [17] (Figure 2). Borehole geochemical data were reprocessed using a multidisciplinary approach that integrates petrology, mineralogy, 3D geomodeling, and geostatistical methods, including the following:
  (i)
Macroscopic rock descriptions and thin-section analysis using optical microscopy, scanning electron microscopy (SEM), and electron microprobe to establish paragenesis (Interested reader can find details on instrumentation and procedures at https://georessources.univ-lorraine.fr/en/content/equipment accessed on 15 May 2025);
 (ii)
Using univariate and multivariate statistical analyses of geochemical data to characterize element distributions, identify correlations, and assess lithological controls;
(iii)
Three-dimensional grade modeling to delineate anomalous zones. The objectives are to characterize mineralization and geological controls at Zone C and to identify previously overlooked but potentially mineralized areas. Ultimately, this methodology supports exploration in underrecognized prospective zones.
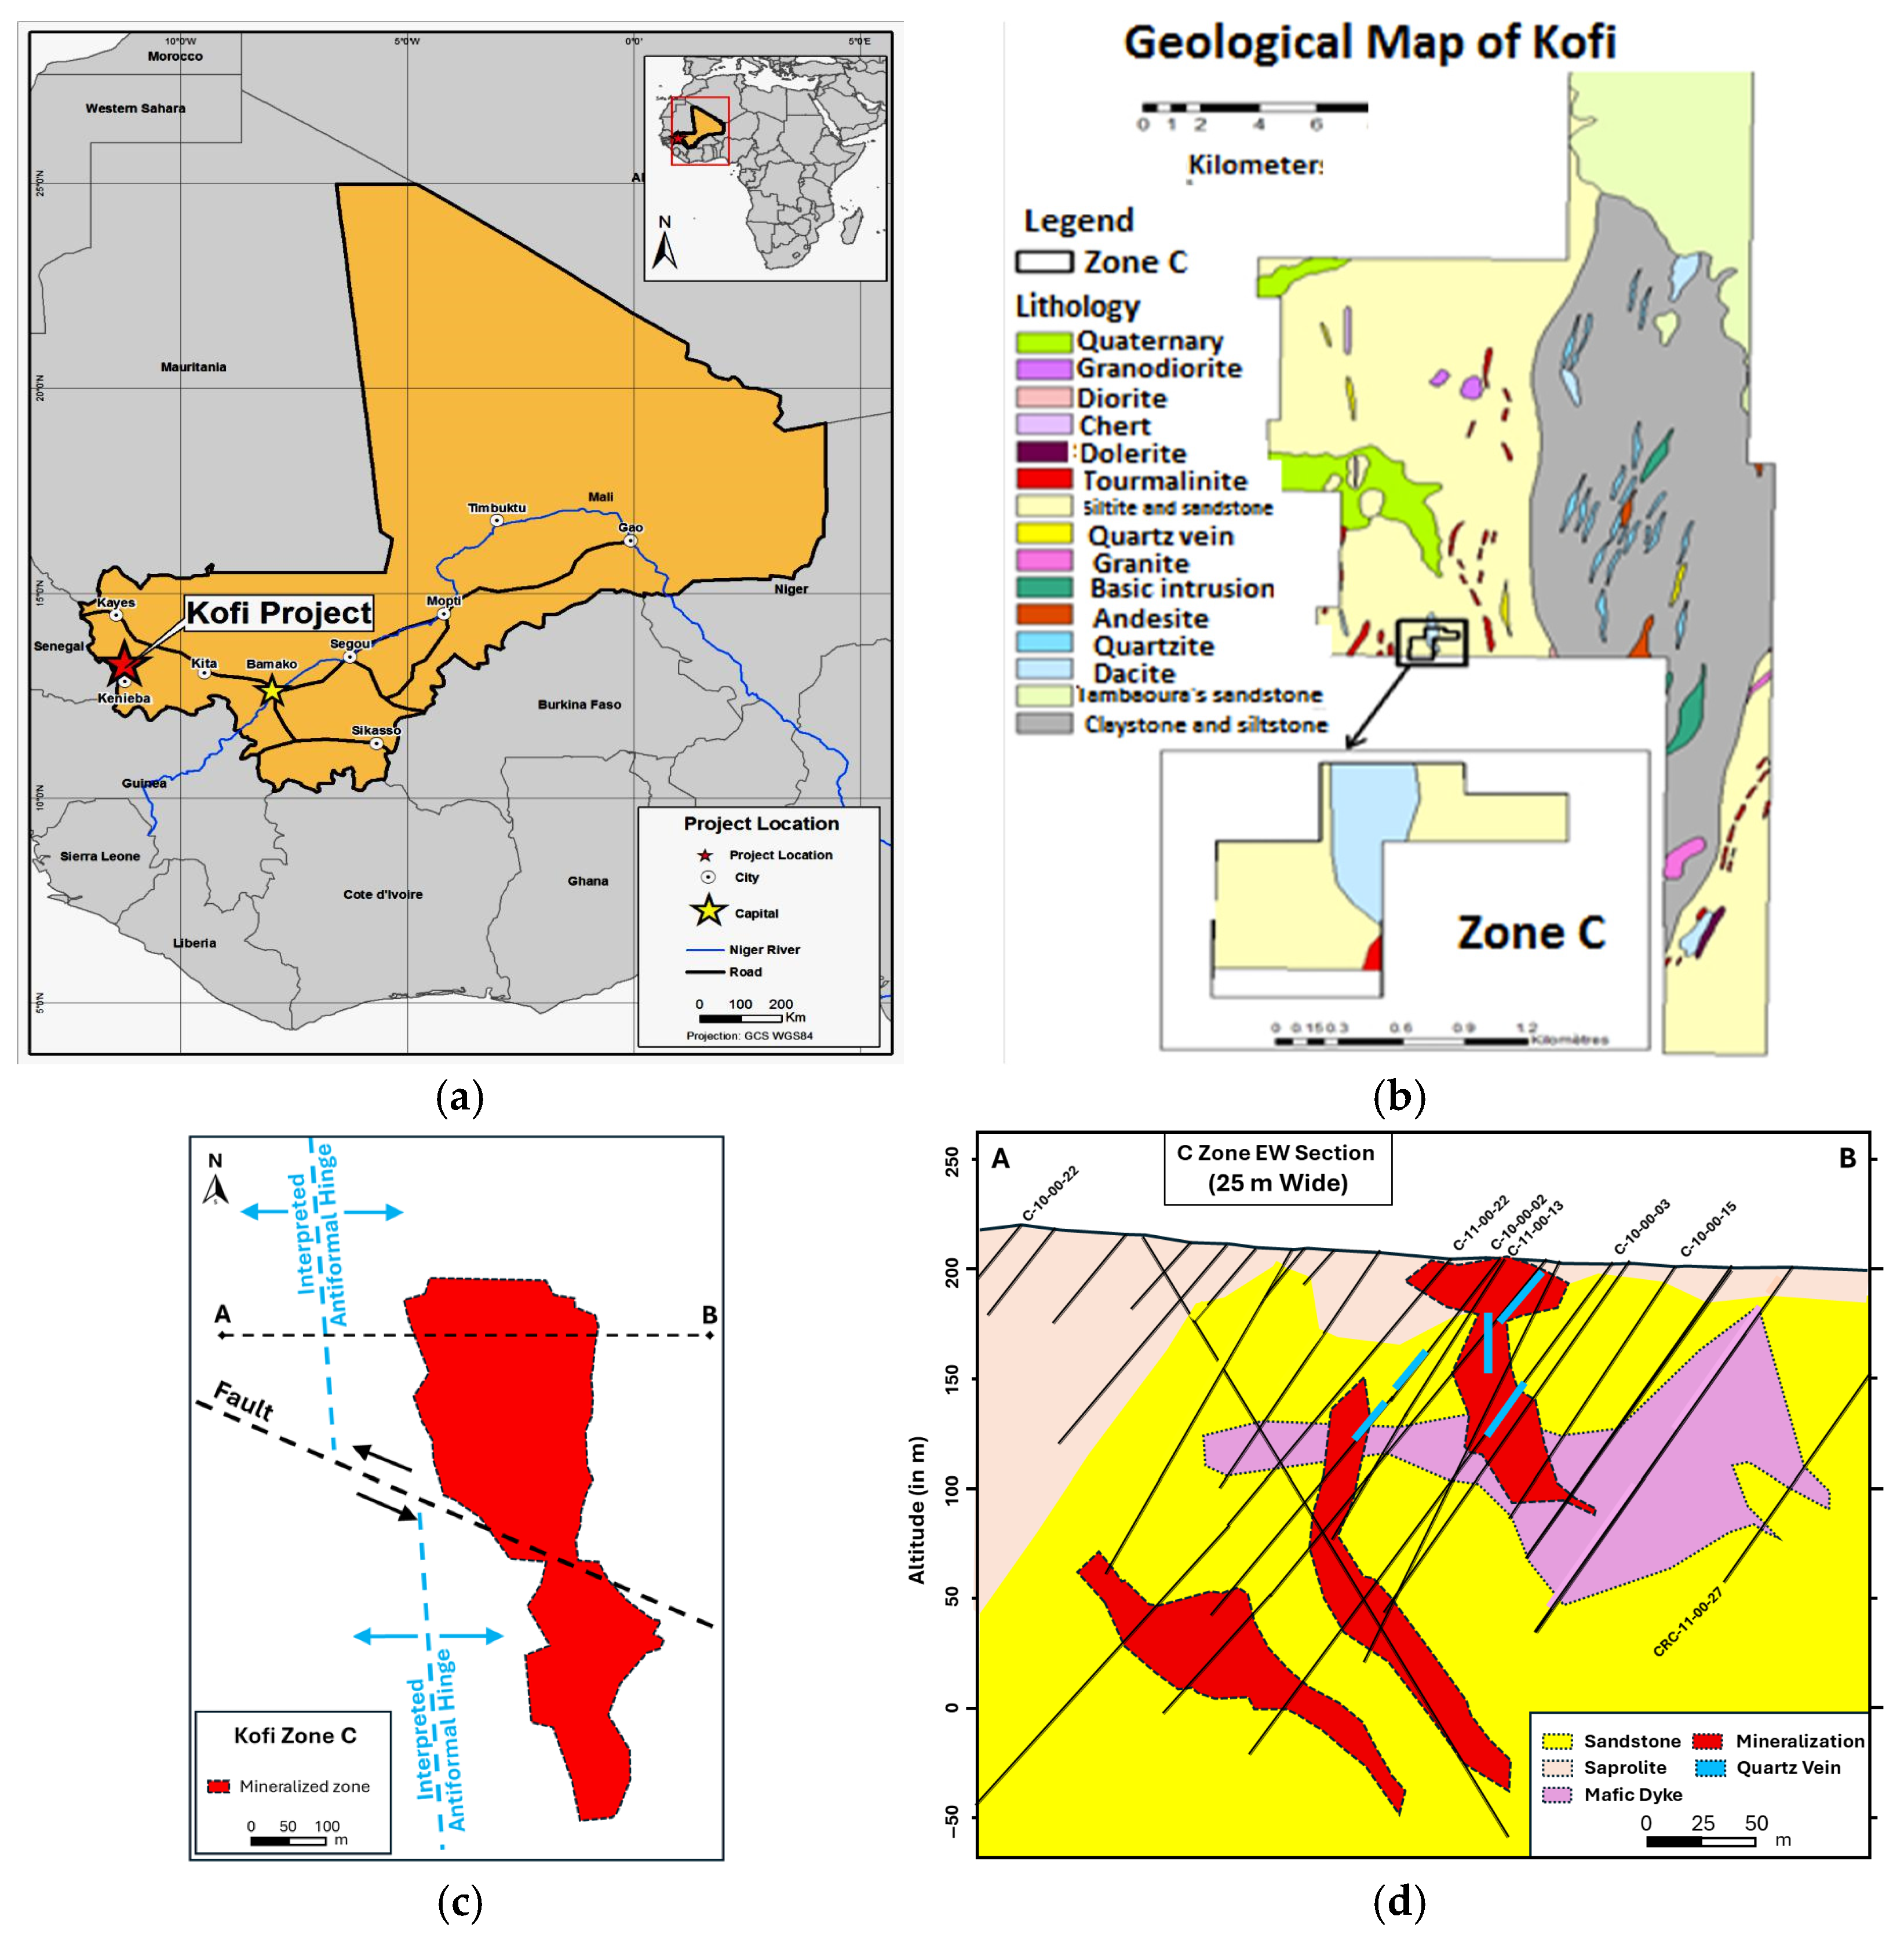
Figure 2. (a,b) Geological maps of the Kofi zone C (rectangle) project. (c) Detailed projection map of the mineralized Kofi. (d) Simplified vertical cross section along line (AB) (modified from [3,17]).
Minerals 15 00843 g002
This multidisciplinary approach highlights the connection between petrology, mineralogy, and geochemistry, revealed through appropriate tools and a solid understanding of the underlying processes. This demonstrates the effectiveness of an integrated strategy for identifying promising exploration targets.

2. Regional Geology of the Kofi Area

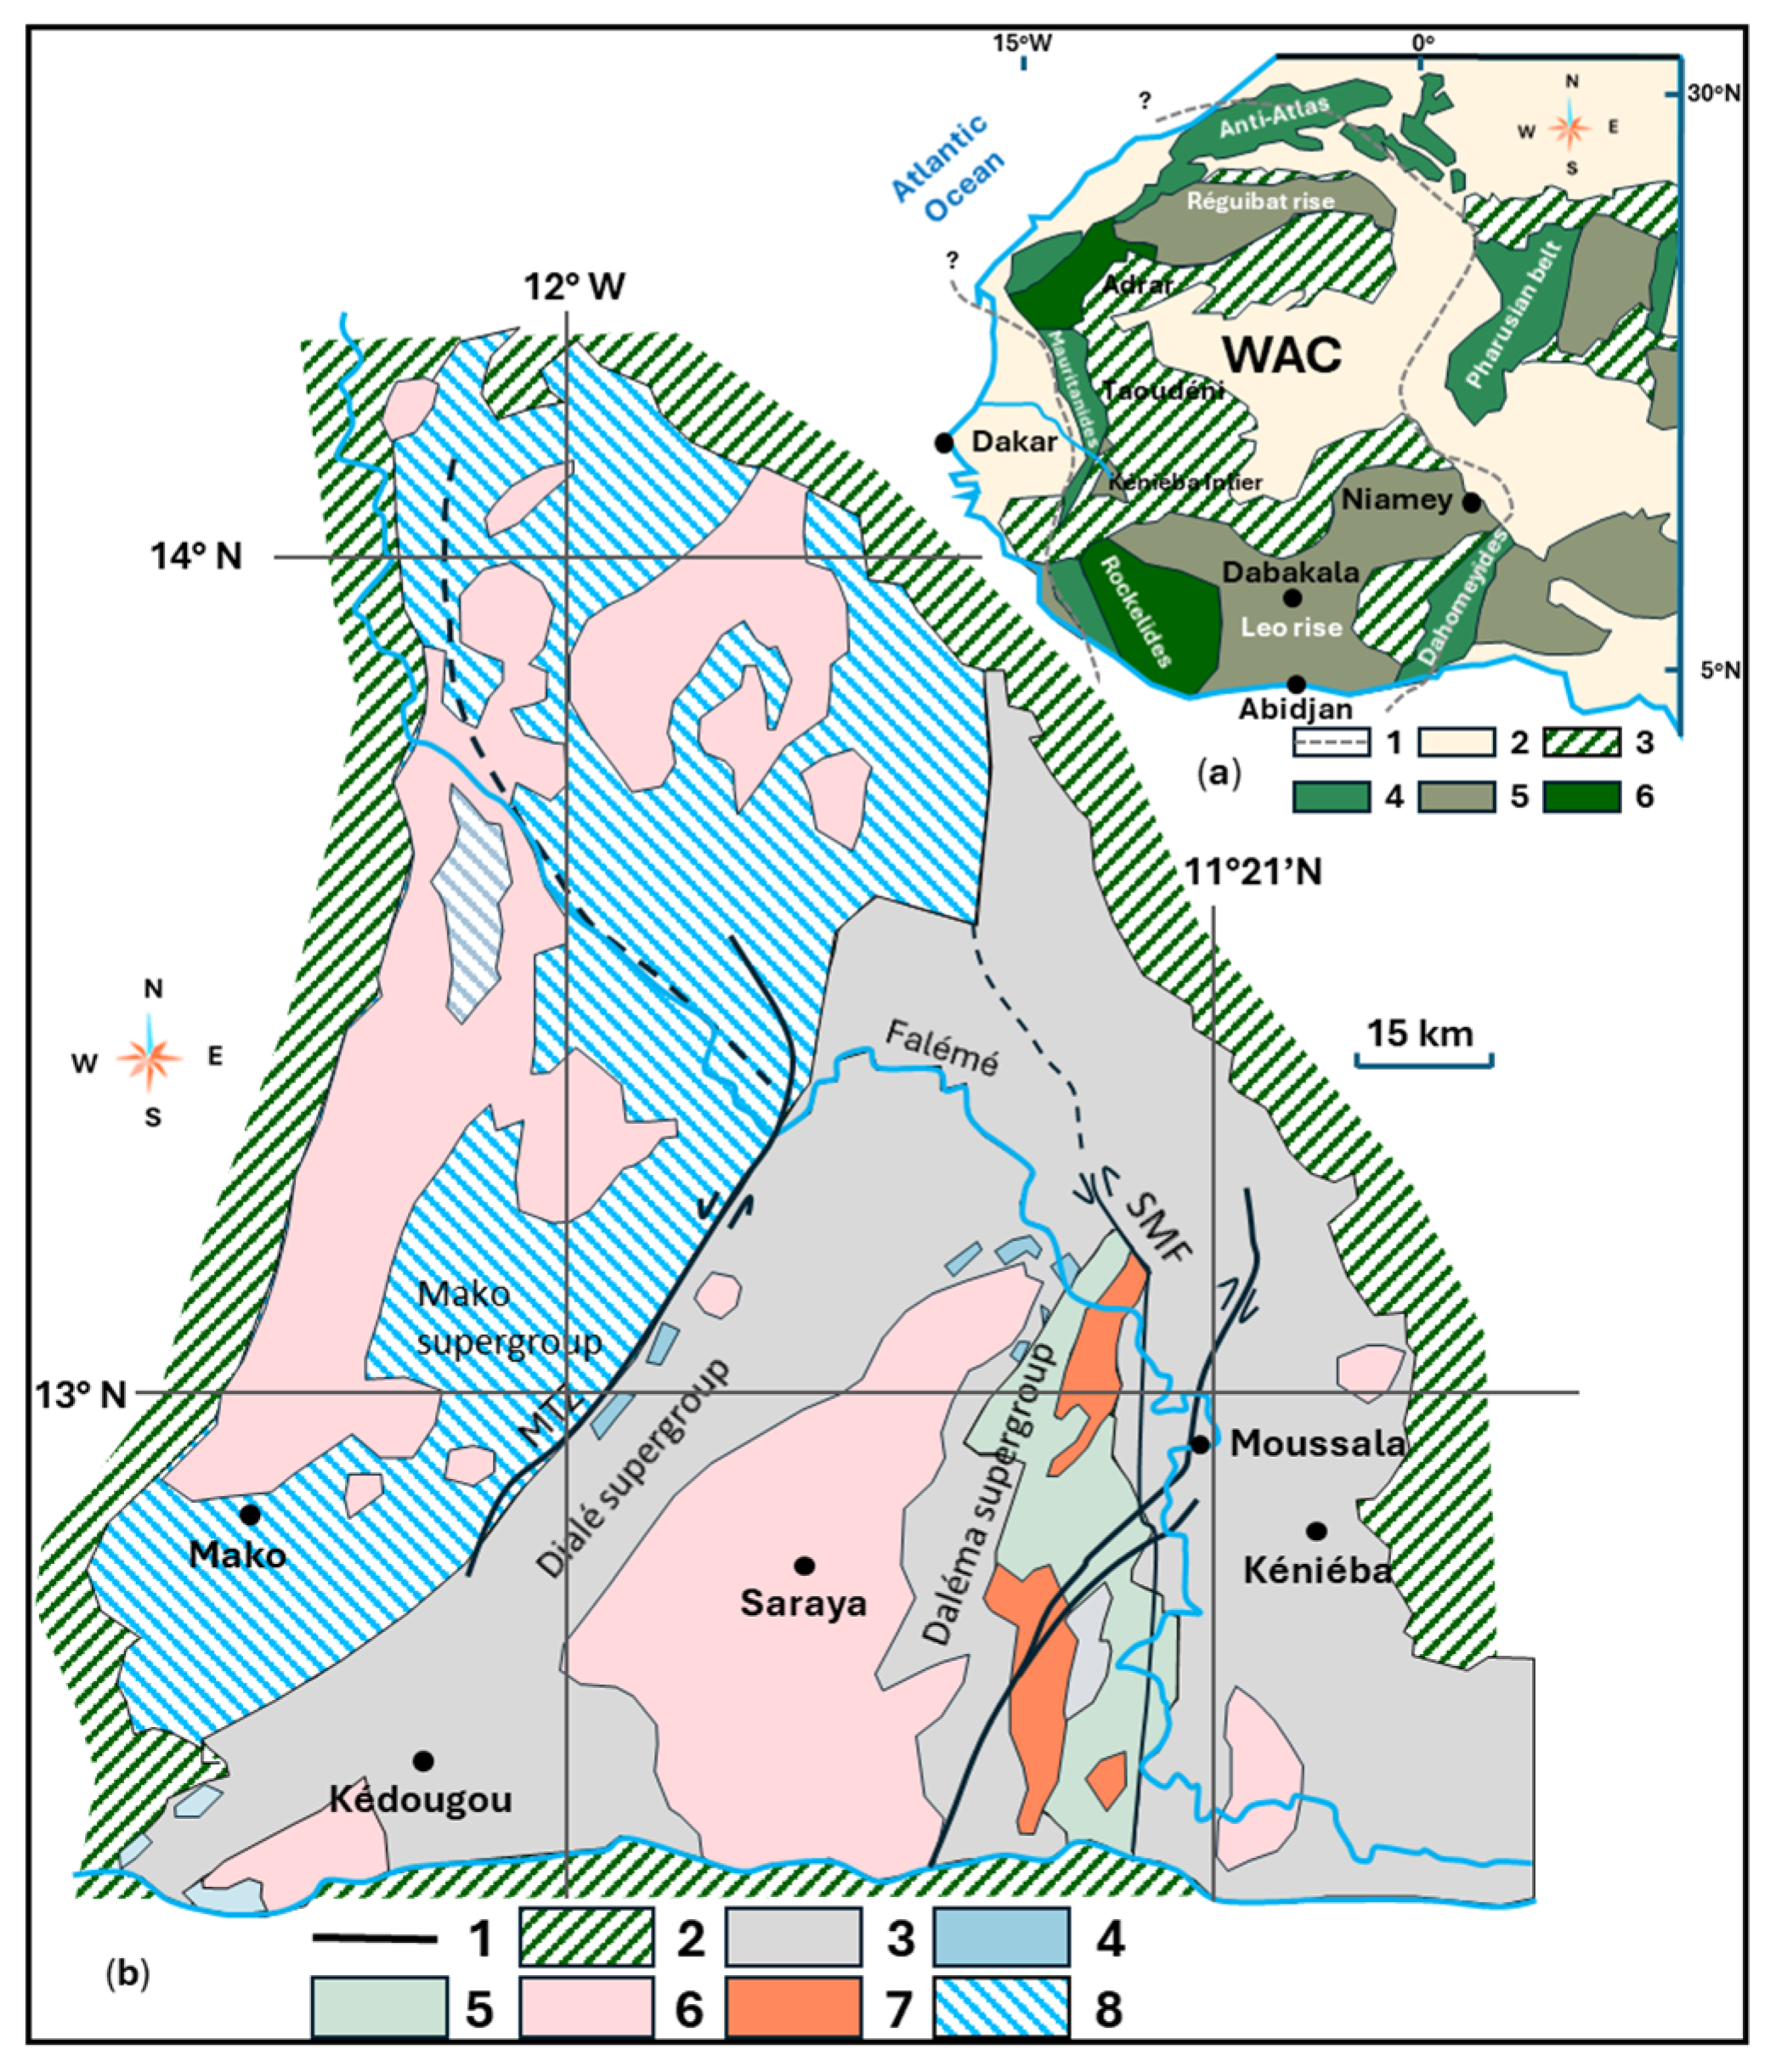
This study focuses on the Archean–Paleoproterozoic (Birimian) Kédougou–Kéniéba inlier of the WAC (A general WAC geological settings is presented in Appendix C), specifically the Kofi area (Figure 2) [18]. This Birimian greenstone belt, which hosts significant precious and base metal deposits, extends across Niger, Burkina Faso, Benin, Togo, Ghana, Côte d’Ivoire, Mali, Guinea, Liberia, and Senegal [19,20]. The Kofi area is characterized by quartzite, sandstone, conglomerate, and associated formations, including limestone encountered during drilling.

2.1. Regional Geological Settings of the Kofi Area

The Kofi area, located within the Kédougou–Kéniéba inlier within the broader Dialé–Daléma Supergroup, comprises both Archean and Paleoproterozoic (Birimian) units [18]. The Archean–Proterozoic basement consists of gneisses and granites, with isoclinal folding within a sedimentary and volcano-sedimentary greenstone belt [19,20,21,22]. Birimian greenstone belts, covering approximately 350,000 km2, are widespread across West Africa, including Niger, Burkina Faso, Benin, Togo, Ghana, Côte d’Ivoire, Mali, Guinea, Liberia, and Senegal.
Stratigraphically, three major lithological units are recognized within the Birimian series [23,24] (Figure 2b): (i) The Saboussiré Formation (Mako), composed mainly of mafic volcanic rocks with minor volcano-sedimentary intercalations, hosts the Sabodala gold deposit in eastern Senegal. (ii) The Kéniébandi Intermediate Formation (Dialé Supergroup) being primarily sedimentary with minor volcanic input, is characterized by flysch-type textures and relatively flat structures. (iii) The Kofi Formation (Daléma Supergroup), the uppermost sedimentary unit, hosts major gold deposits such as Sadiola, Yatéla, Tabakoto, and Loulo. It consists mainly of marine sedimentary rocks overlying sparse volcaniclastic layers and is locally intruded by felsic to mafic plutons [24].
Some authors [18] group the Kofi and Kéniébandi formations into the broader Dialé–Daléma Supergroup. It is traditionally divided into three lithological groups [16]: (i) limestone, found along the western edge of Zone C; (ii) silicate rocks; and (iii) clastic rocks, including sandstones and siltstones (turbidites) hosting tourmalinite, diorite, and quartzite (Figure 2b).
These units form a volcano-sedimentary sequence (quartzite, sandstone, conglomerate, limestone, etc.) intruded by multiple generations of felsic and mafic dikes and sills. The area also includes large magmatic complexes comprising both plutonic rocks (granites and granodiorites) and hypovolcanic rocks (microdiorites, granodiorites, and albitites) [25]. Tourmalinite in the area is of hydrothermal origin, and the associated alteration processes contribute to the high porosity observed in the coarse clastic units [16].

2.2. Mineralization of the Kofi Zone C

Gold mineralization in Kofi Zone C is controlled by structural and geochemical processes associated with the Kédougou–Kénieba Inlier (KKI). Key factors include (i) Structural controls: Mineralization is associated with N-S and NE-SW trending conductive lineaments, which are secondary splays of the Senegal–Malian Shear Zone (SMSZ). These structures facilitated fluid flow and gold deposition during deformation events. Metasedimentary rocks, metamorphosed under greenschist–to amphibolite facies, provided permeable pathways for hydrothermal fluids. (ii) Host rocks and mineralization style: Gold is hosted in sulfide-bearing quartz-albite veins enriched in arsenopyrite, forming stockworks within intensely silicified zones. Mineralized tourmaline sandstones, aligned with NE-SW/N-S structures, are also found in nearby deposits (e.g., Loulo), suggesting similar mineralization processes at Kofi Zone C [24,26]. (iii) Geochemical and geophysical signatures: High-conductivity zones detected by airborne electromagnetic (AEM) surveys often correspond to gold-related structures including shear zones, sulfide- or graphite-rich lithologies, silicified zones with conductive alteration halos (sericite, chlorite, carbonate), and tourmaline-rich sandstones (e.g., Loulo). Fault-slip-driven hydrogen (H2) generation created reducing conditions that destabilized gold-bisulfite complexes, leading to native gold precipitation within sulfide phases (e.g., arsenopyrite) or silicified zones [11,26,27].

2.2.1. Macroscopic Description

Sedimentary features in the Kofi area, including grain size, structures, and facies, along with disseminated sulfides in fine-grained sediments, suggest a low-energy and confined depositional environment. Subsequent tectono-hydrothermal activity led to the formation of crosscutting quartz veins. Petrographic analysis shows host rocks composed of feldspar, carbonate, electrum, and disseminated gold [3]. Strong alteration zones rich in carbonates, silicification, and chlorite reflect hydrothermal processes linked to gold mineralization.
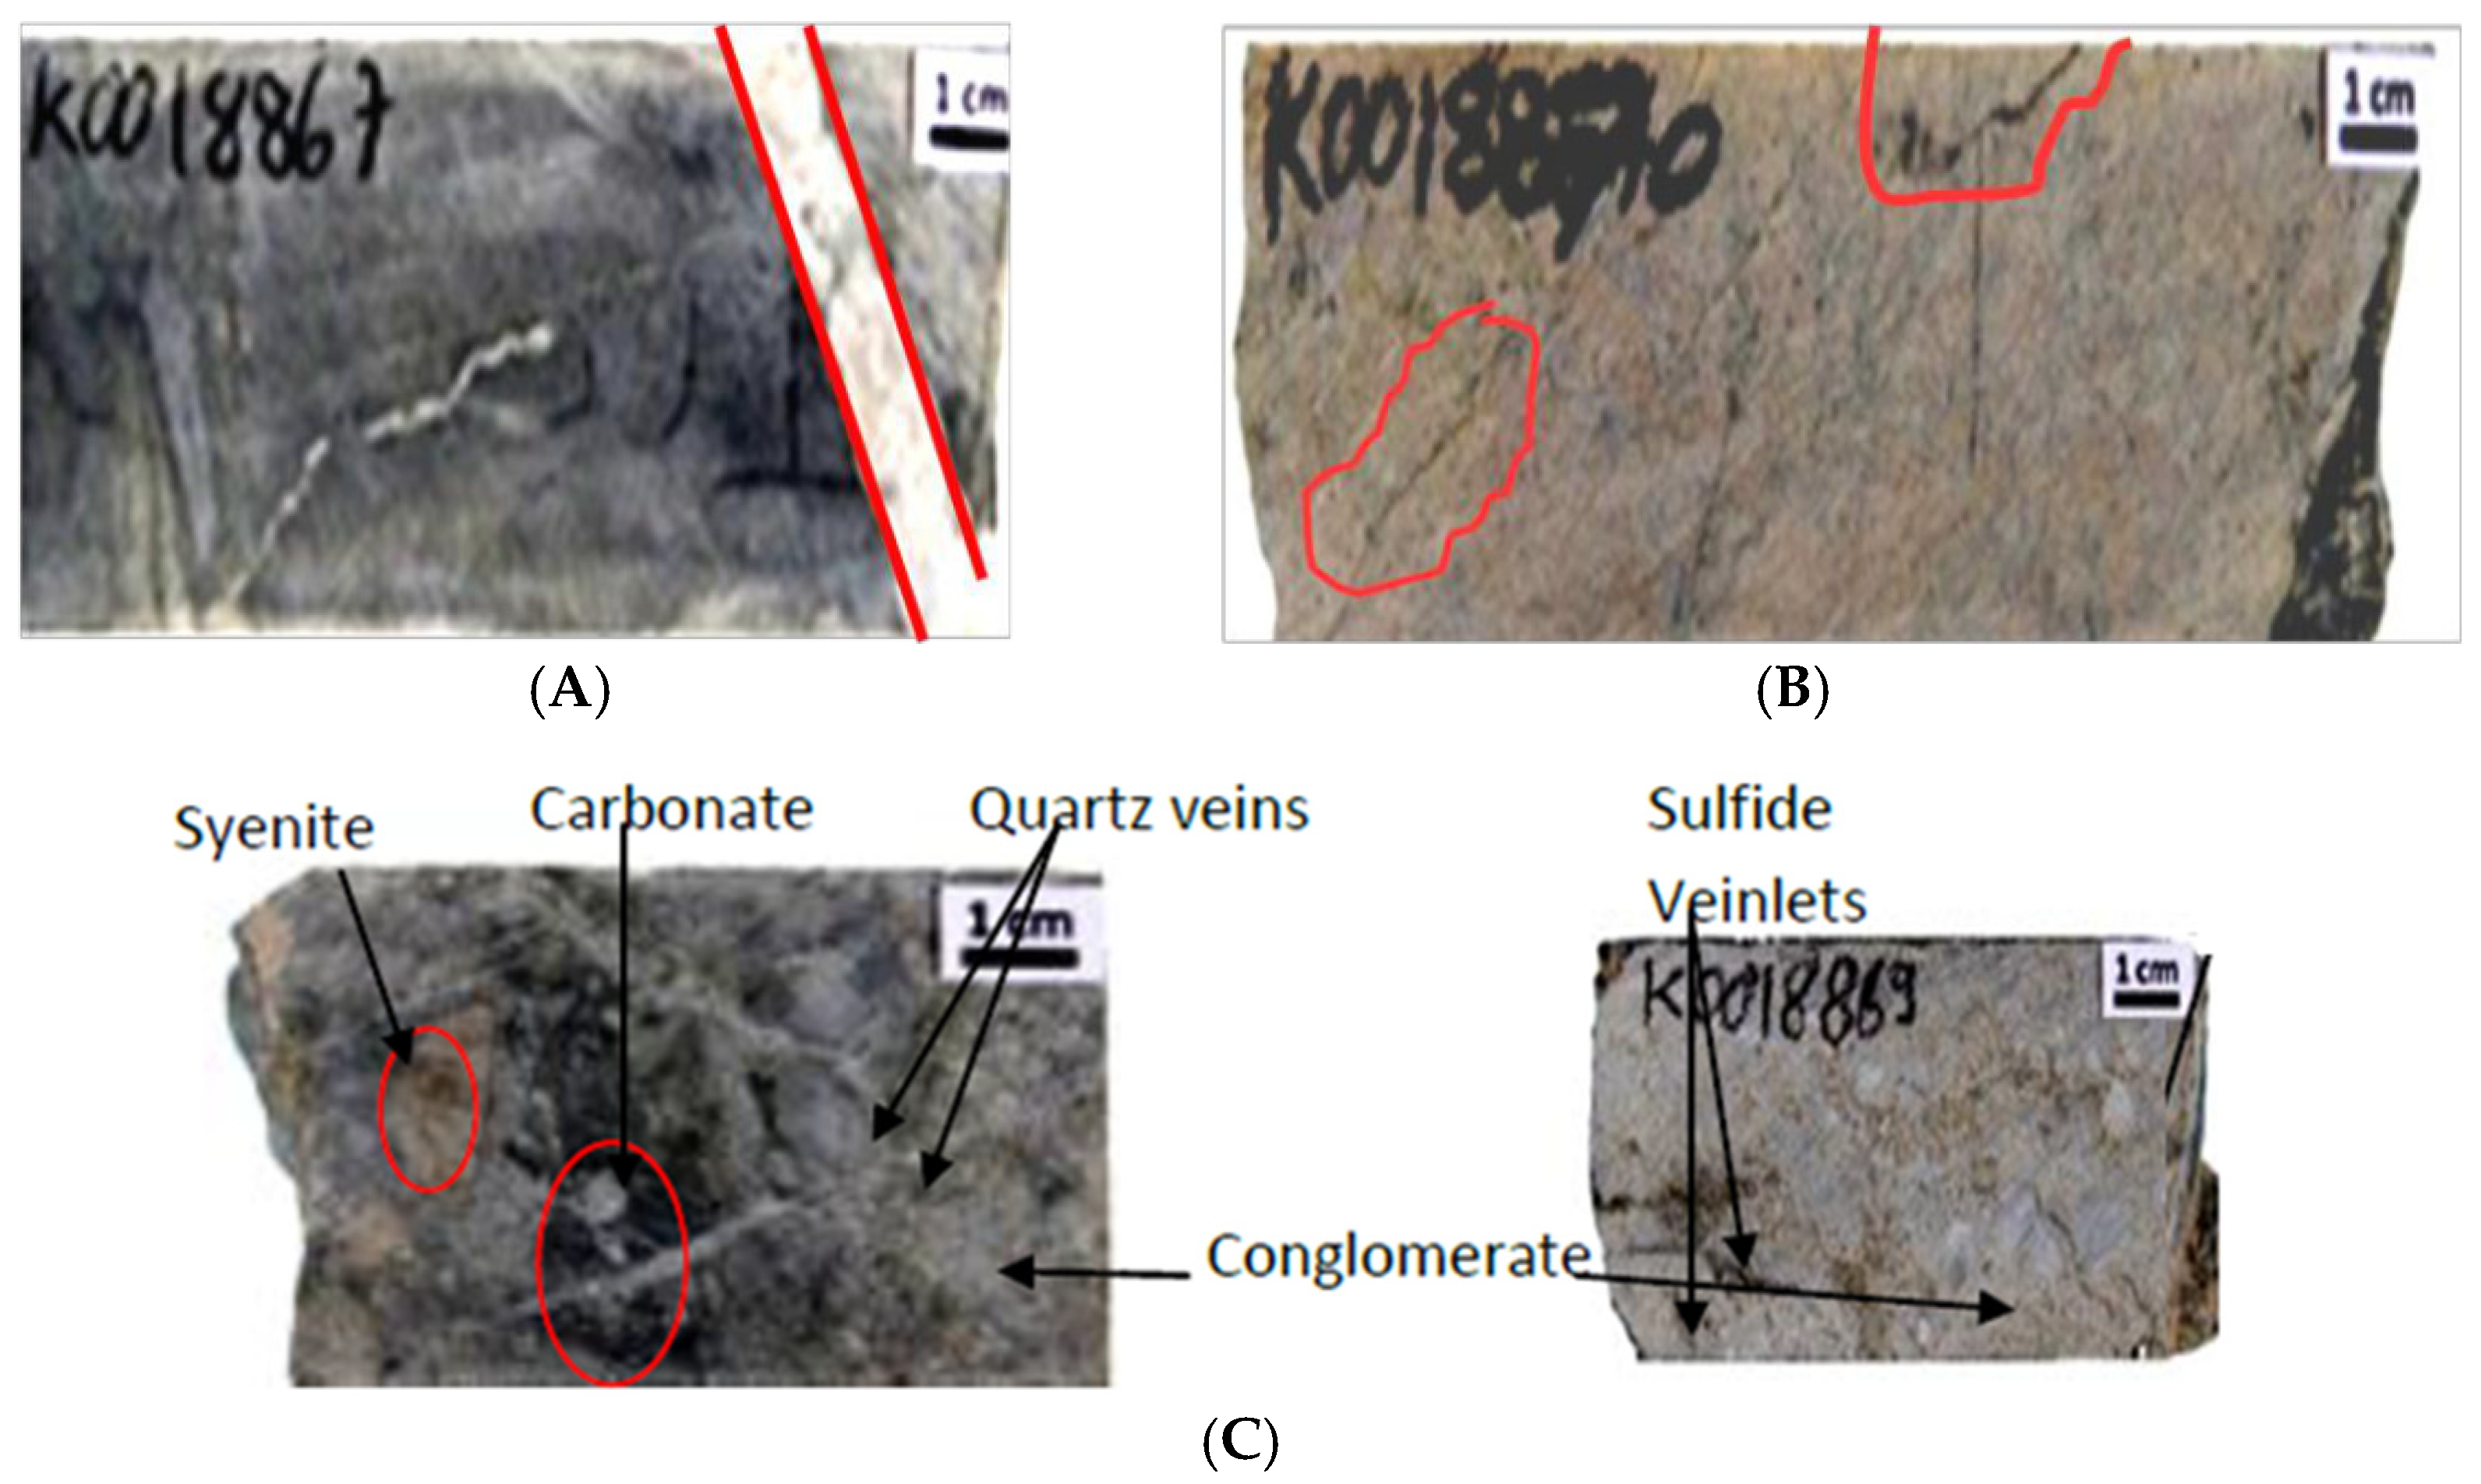
Quartz veins, locally containing iron-carbonate, sericite, and syenite fragments, commonly intrude detrital sedimentary breccias, conglomerates, and dolomite. Most veins exhibit brittle fault breccia textures, indicating proximity to shear zones. These quartz-dominant breccias are often crosscut by pyrite and, less frequently, sphalerite veinlets, typically accompanied by albitization. High-porosity core samples exhibit open-space textures within intensely silicified fault zones, whereas lower-porosity samples display varied vein morphologies. The main alteration types observed microscopically are albitization, chloritization, and epidotization (Figure 3 and Figure 4a,b). Zone C features a distinctive “banded” or “striped” breccia, characterized by rhythmic alternations of whitish and grey layers [28] (Figure 3), resembling mineralized textures typical of Mississippi Valley-type lead–zinc deposits [29]. Microscopically, the primary alteration sequence includes early albitization and chloritization, followed by late-stage epidote (Figure 4).

2.2.2. Microscopic Description

Twelve core samples from various depths, including both mineralized and non-mineralized zones, were selected for thin-section preparation (see Appendix A, Table A1). Thirty polished thin sections from Kofi Zone C were analyzed petrographically and mineralogically. Optical microscopy and SEM (backscattered mode) revealed two main gold-related sulfide events, dominated by pyrite and arsenopyrite (Figure 5). Visible gold and gold associated with silver are commonly observed. Gold occurs as ~40–50 µm grains within pyrite fractures (Figure 5A–C) or ~100 µm inclusions in pyrite (Figure 5D), either as native gold or as electrum. These features indicate two gold mineralization events: firstly, early deposition of native gold and electrum as blebs within pyrite, and secondly, a later phase where pure gold precipitated along pyrite fractures (Figure 5A).
These findings have important implications for optimizing ore-processing methods, particularly for gold-silver separation. Analysis of sample drill C-10-14 (96–207 m depth) revealed gold grades ranging from 2 to 16 ppm (Altered fault breccia zone Qz stockwork), while no detectable gold was found in other core samples or quartz veins that have been analyzed by SEM (Figure 5).
The relative mineral paragenetic sequence, including late-stage mineralization, was determined through thin-section observations and is presented in Figure 6b. Quartz, calcite, chlorite, feldspar, pyrite, arsenopyrite, gold, and electrum occur as inclusions, indicating early precipitation prior to fracturing. In contrast, galena, sphalerite, rutile, monazite, and late-stage gold are found in fractures, suggesting a subsequent mineralization phase.

2.2.3. Chlorite Petrography and Geothermobarometers
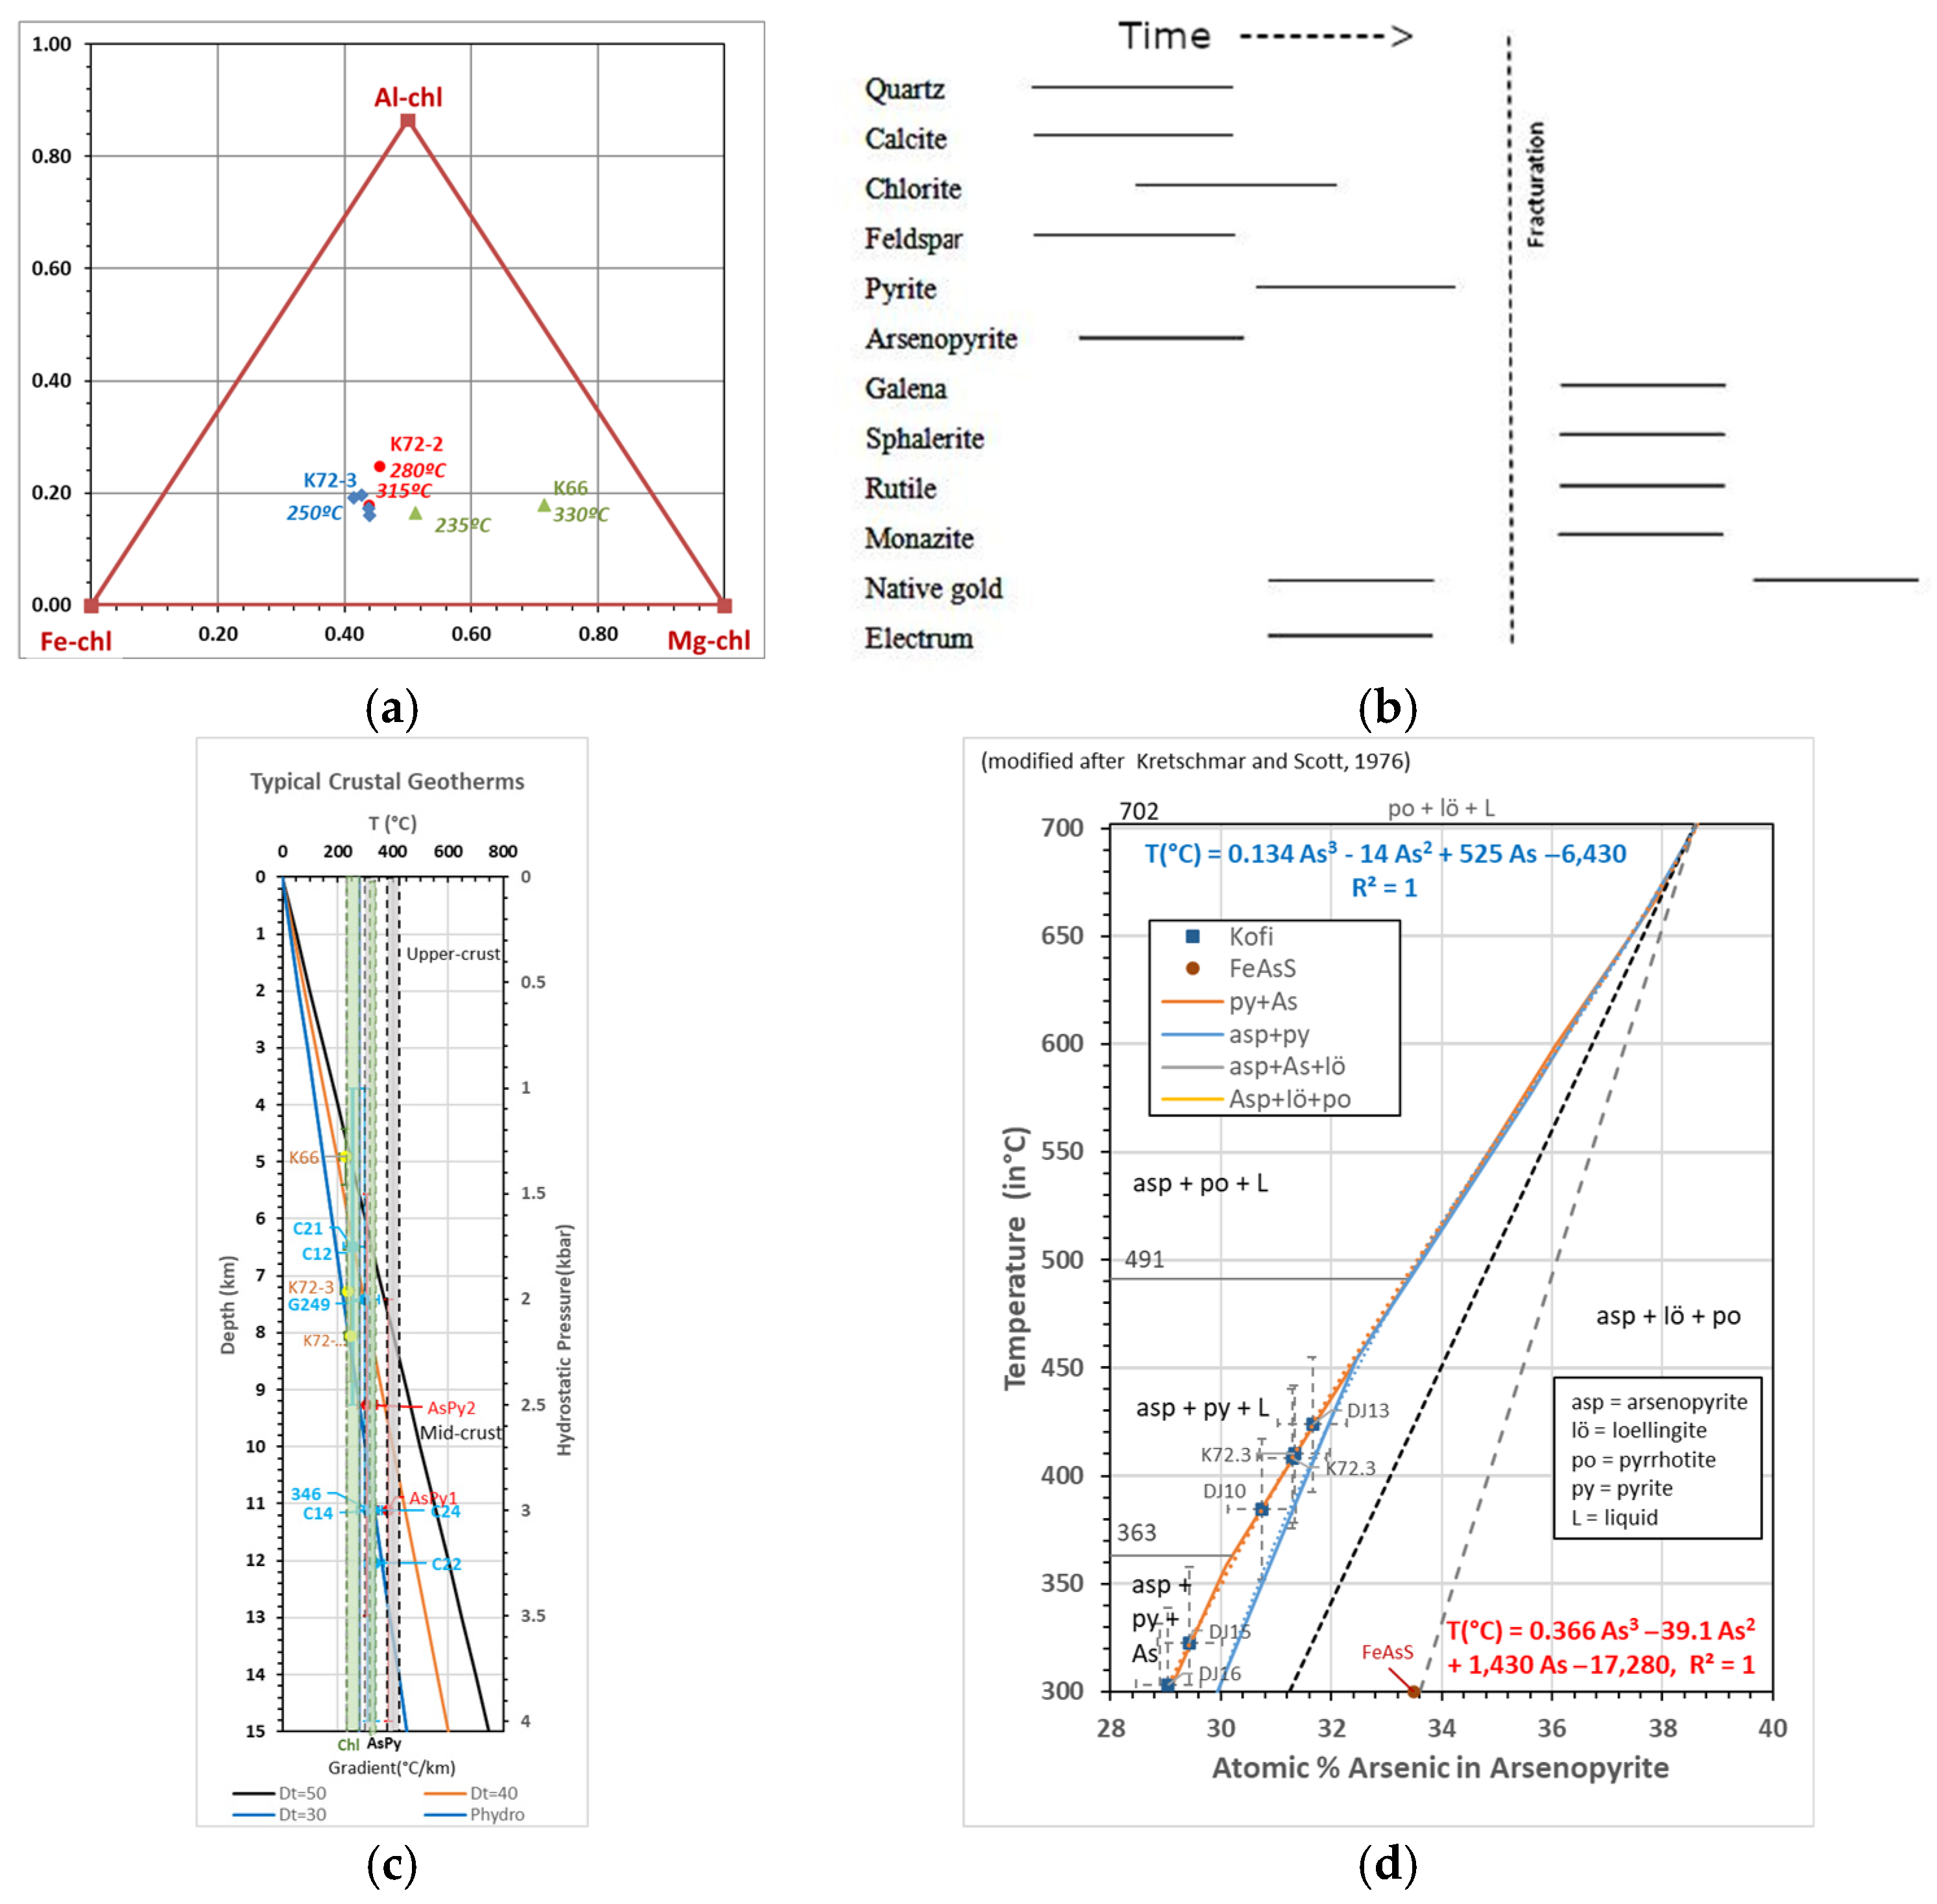
Chlorite compositions were determined using electron microprobe analysis (EPMA) (Table A2), based on a theoretical formula with 14 oxygen atoms per half-cell: [(Fe, Mg, Al)6(Si, Al)4O10(OH)8] and temperature estimates (Table A3 and Figure 6a) showed no clear correlation with chlorite chemistry. Aliv (tetrahedral Al) ranges from 0.90 to 1.22 atoms per formula unit (apfu), and the Fe/(Fe + Mg) ratio varies from 0.48 to 0.61, except for sample K66, which shows a notably low ratio of 0.20. This chemical consistency supports the use of chlorite as a geothermometer for hydrothermal events.
Geothermometry and Barometry: Empirical chlorite geothermometers based on Aliv and Fe/[Fe + Mg] ratios have been proposed in several studies [30,31,32,33,34,35]. Formation temperatures were estimated between 250 °C and 350 °C using Aliv values calibrated with the Cathelineau thermometer (referred to as MC88) [30]. The Jowett thermometer (referred to as WJ91) [31] yielded comparable results (see Table A3 and Table A4), while the MC88 model typically produces values ~10 °C lower than WJ91 due to uncorrected tetrahedral substitutions. Most samples show chlorite formation temperatures of 235–280 °C (WJ91), while samples K66, K72-2, and K72-3 record higher values of 310–335 °C, suggesting two distinct hydrothermal events. These temperatures align with petrographic observations and are consistent with greenschist–facies metamorphism typical of orogenic gold systems.
Pressure estimates derived from Ti-in-chlorite and Alvi-chlorite barometry [36,37] indicate conditions corresponding to shallow to mid-crustal depths (5–9 km). The inferred reduced redox conditions are favorable for gold transport via bisulfide complexes. Variability in XMg reflects heterogeneity in host rocks and/or fluid compositions during deformation. A second, earlier chlorite generation (Table A4) records higher temperatures of 280–370 °C and pressures of 3.9–4.9 kbar, consistent with the greenschist–amphibolite transition and deeper crustal levels (13–16 km). Redox conditions near the fayalite–magnetite–quartz (FMQ) buffer (±1 log unit) further support a mid-crustal metamorphic setting typical of orogenic gold systems.
Arsenopyrite Geothermometer: Arsenopyrite is a reliable geothermometer in hydrothermal systems due to predictable variations in iron and arsenic content, and trace element substitutions linked to temperature. Formation temperatures for selected samples from the Kofi area were estimated by fitting equilibrium curves from T-X diagrams along the pyrite–loellingite join (Figure 6c; [38,39]), using cubic polynomial equations (Table 2; full results in Table A5). Two temperature groups were identified.
Figure 6. (a) Ternary diagram of Al-, Fe-, and Mg-chlorite showing end-member compositions and temperatures (using the Jowett thermometer); (b) Relative paragenetic sequence for Zone C based on thin-section observations; (c) Representative crustal geotherm with temperature and pressure estimates derived from microprobe analyses of arsenopyrite, chlorite, and carbonate, including calculated chlorite and arsenopyrite temperatures; (d) Simplified T-X diagram along the pyrite–loellingite join, showing arsenopyrite composition versus temperature, with selected samples from the Kofi area (after [38,39]). Compositional data are provided in Appendix A, Table A2, Table A3, Table A4, Table A5, Table A6, Table A7, Table A8, Table A9 and Table A10.
Minerals 15 00843 g006
(i) High-T group (~355–425 °C): Samples n° K72-3 DJ-9, DJ-12, and K72-3 reflect conditions consistent with the greenschist–amphibolite transition, likely corresponding to the peak metamorphic stage and the main gold mineralization event, associated with deformation-driven hydrothermal activity.
(ii) Low-T group (~225–325 °C): Samples n° DJ-13, DJ-14, and DJ-15 show cooler conditions, possibly related to retrograde alteration or late-stage fluid pulses during post-orogenic uplift.
Assuming typical depths of ~9–15 km and pressures of 1–3 kbar for orogenic gold systems, high-T arsenopyrite likely formed at deeper crustal levels, while low-T arsenopyrite suggests exhumation-related pressure drops. Arsenopyrite stability necessitates reducing conditions near or below the FMQ buffer.
The As/S ratio in arsenopyrite is a geochemical indicator of oxygen fugacity (fO2) and sulfur activity during mineralization in orogenic gold deposits [40,41]. Higher As/S ratios in high-temperature arsenopyrite (~31% As vs. ~29% in low-T) indicate moderately reduced fO2 and elevated sulfur activity, favoring sulfide precipitation. In contrast, lower As in low-T arsenopyrite may indicate more reducing conditions or dilution of sulfur-bearing fluids during cooling.
High-T fluids were likely CO2-rich and moderately saline metamorphic fluids derived from devolatilization processes, transporting Au as bisulfide complexes (HS/H2S). Trace osmium (Os) concentrations suggest minor mantle or metasomatic fluid interaction and support the use of Re-Os dating of arsenopyrite to constrain mineralization age.
This thermal evolution is consistent with global orogenic gold systems, where early high-temperature fluid activity transitions to lower-temperature retrograde regimes during uplift.
Biotite Geothermobarometers: Compositions of two selected biotite samples are presented in Table A6. Tetrahedral occupancy, defined by Si (~6.5 apfu) and Aliv (~1.4–1.5 apfu), totals ~8 apfu, consistent with the ideal biotite structure. Octahedral sites are dominated by Alvi (~3.4 apfu), Fe2+ (~0.32 apfu), and Mg2+ (~0.27 apfu). The total slightly exceeds the ideal trioctahedral value (~3 apfu), likely due to solid-solution effects common in natural systems. These compositions correspond to biotite from the annite-phlogopite series. High K content (K~1.7–1.76 apfu) confirms interlayer site occupancy, while moderate XMg (~0.45–0.46) reflects Fe2+-Mg2 mixing in octahedral sites. These values constrain late-stage hydrothermal conditions, likely associated with late cross-faulting and observed gold paragenesis.
Using geothermometers [36] and geobarometers [37] based on the Ti and Al occupancy in biotite: Sample 1 (19.267-C2-4): Ti = 0.013 apfu 400–500 °C; Sample 2 (S44 346-C1-2): Ti = 0.045 apfu → 500–550 °C. These temperatures correspond to greenschist–amphibolite facies metamorphism. Total Al content (Aliv + Alvi) correlates positively with pressure: Sample 1: Altotal = 4.83 apfu; Sample 2: Altotal = 4.91 apfu. Empirical calibrations [37] indicate moderate pressures (~5–8 kbar), corresponding to mid-crustal depths (~15–25 km). Although Fe3+/Fe2+ ratios were not measured, the presence of hematite in sample S44 284-C1-3 (with negligible impurities) suggests oxidizing conditions, with fO2 well above the FMQ buffer (∆log fO2 ≥ +2), in line with the hematite stability field typical of oxidized hydrothermal systems at these depths.
Feldspar Geothermobarometry: Feldspar compositions are presented in Table A7 and correspond to sodic, albite-rich plagioclase (Na/(Na + Ca) > 90%) with minor anorthite (An = 0.08%–3.35%) and trace orthoclase (Or = 0.01%–3.93%). This composition reflects interaction with late-stage Na-rich fluids under greenschist–facies metamorphic conditions. Minimal Fe3+ (<0.01 apfu) suggests limited redox-sensitive substitutions. Low Ti content (<0.001 apfu) indicates low to moderate temperatures (~300–450 °C) [36], while pressures (~5–8 kbar) correspond to mid-crustal depths (~15–25 km) typical of orogenic gold systems [37]. As inferred from low Fe+2 and the absence of hematite or magnetite, the redox state is moderately reducing, suggesting fO2 conditions near the FMQ buffer. Retrograde albitization is associated with gold deposition, likely triggered by redox changes or fluid cooling [7], within the context of syntectonic magmatism in collisional belts [42].
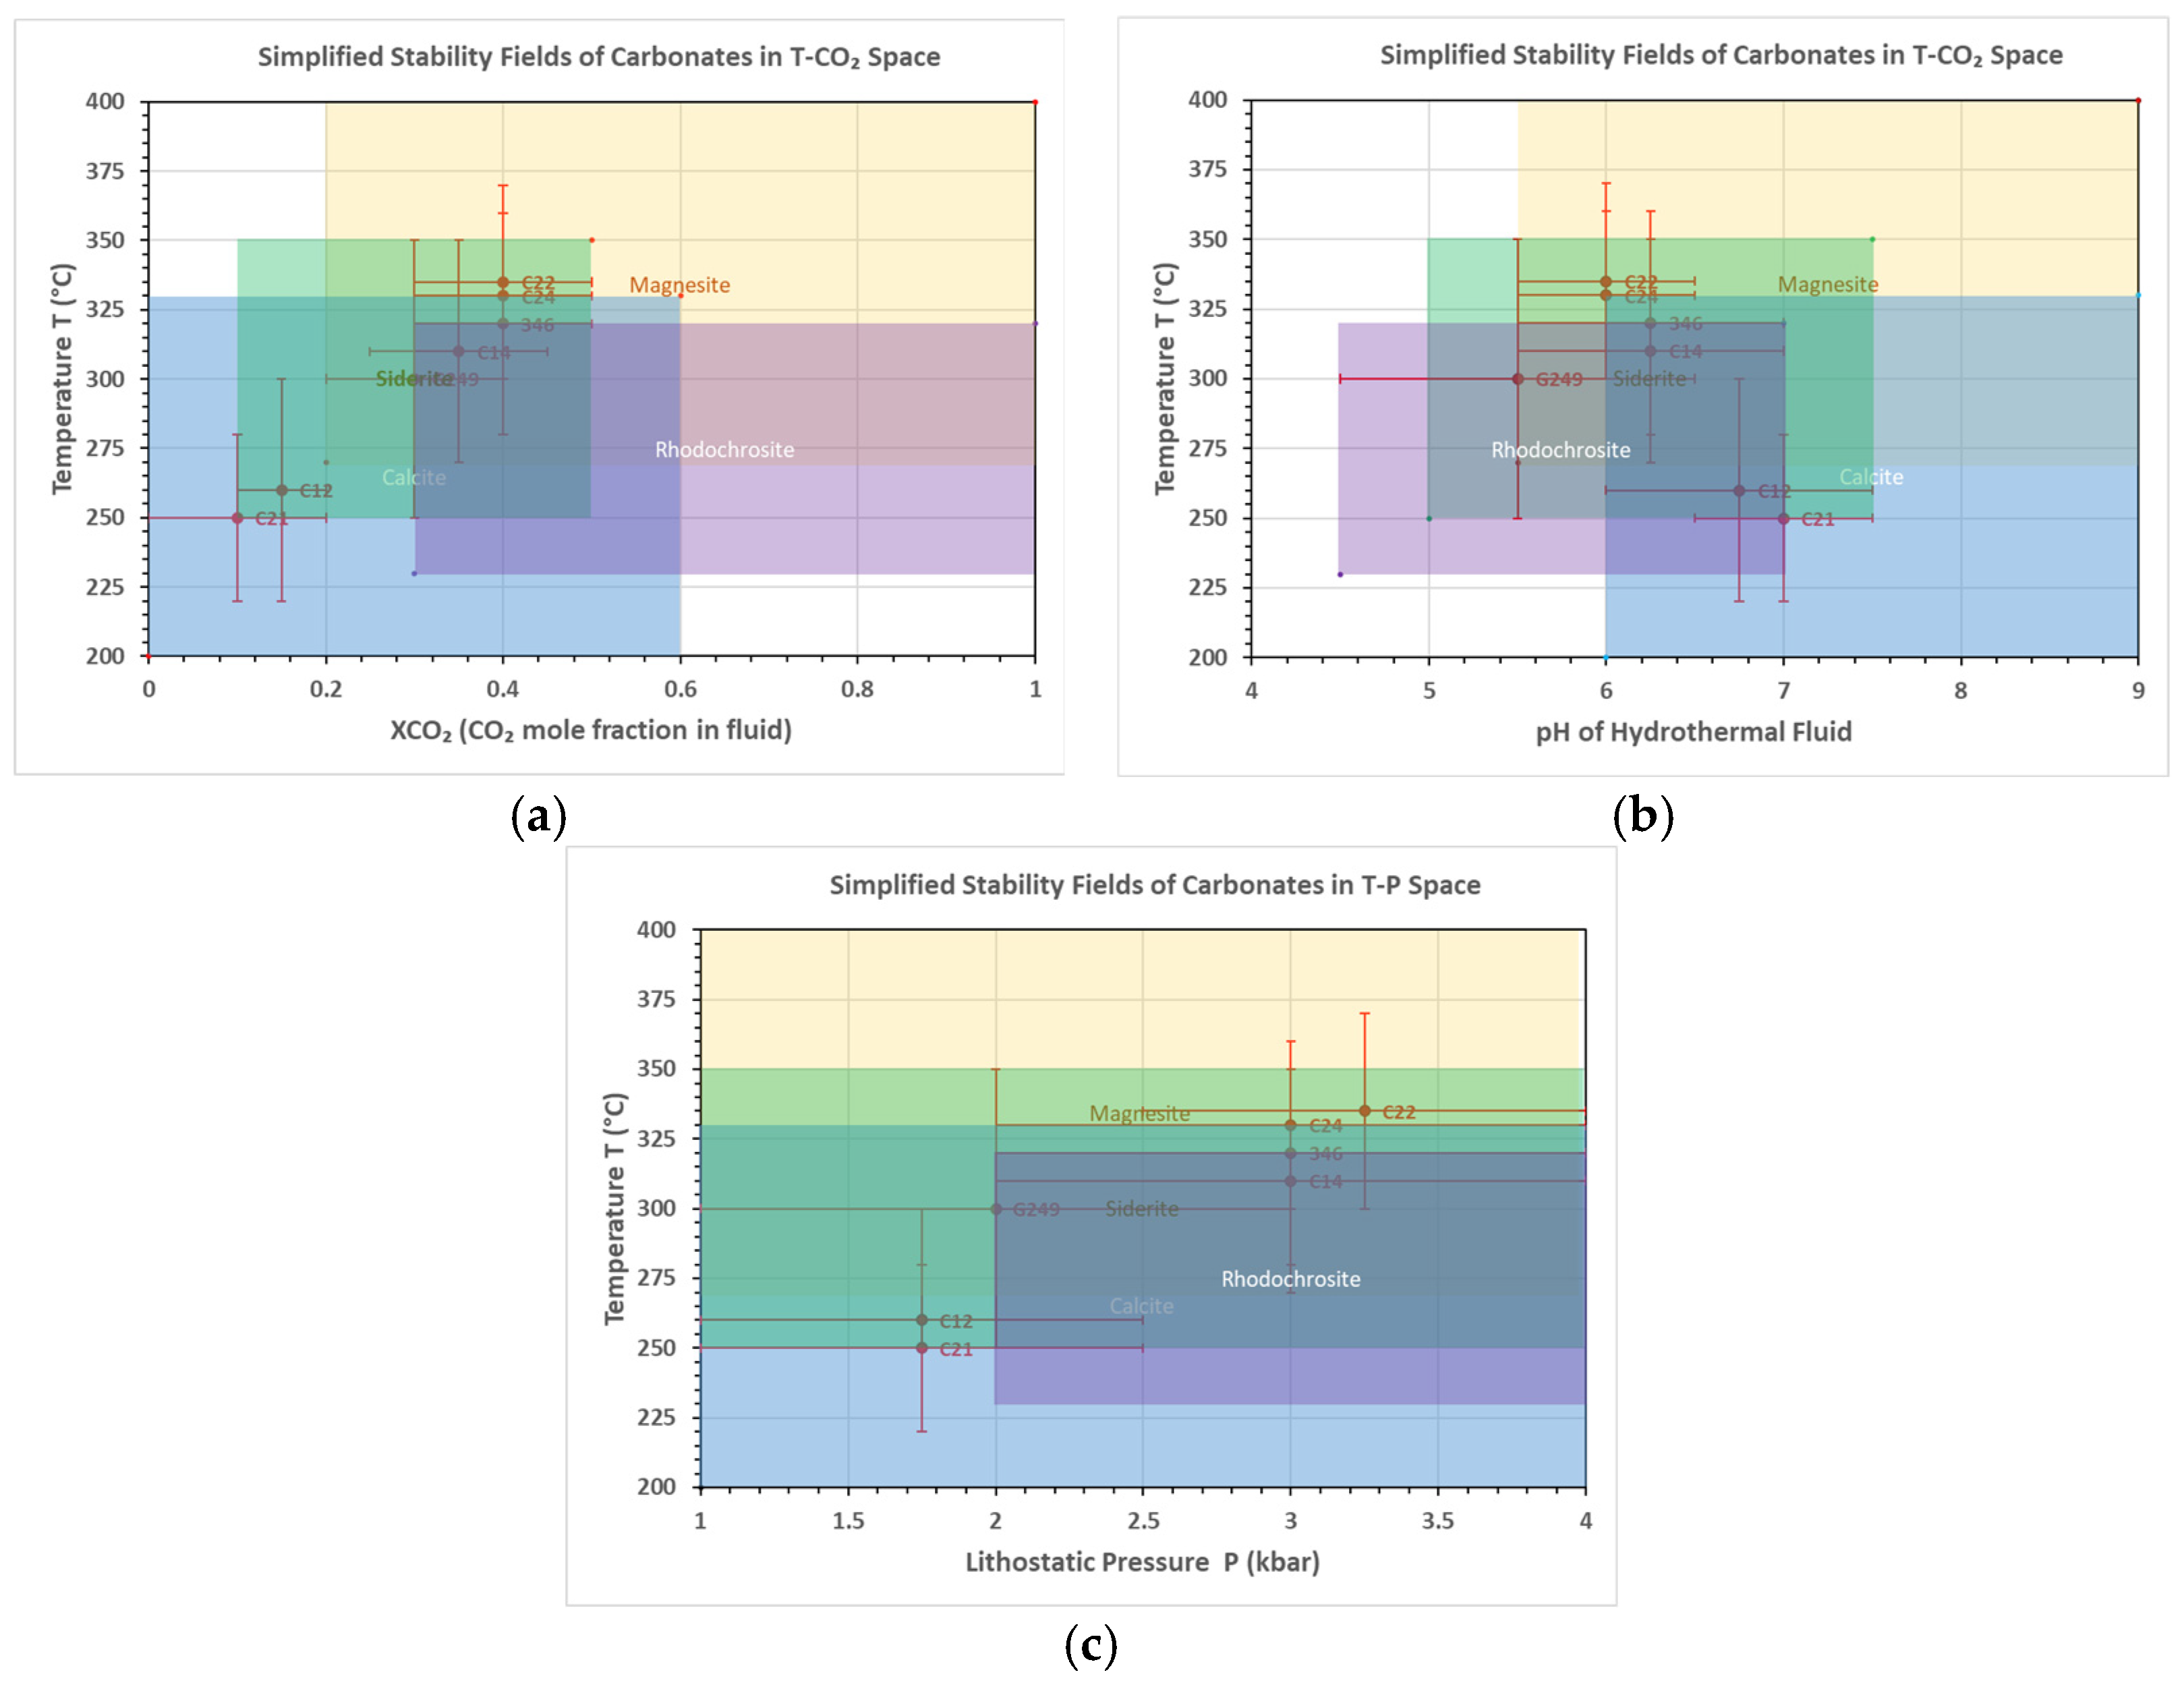
Carbonate Geothermometer: Hydrothermal conditions associated with carbonate mineral assemblages comprising rhodochrosite (MnCO3), magnesite (MgCO3), siderite (FeCO3), and calcite (CaCO3) were evaluated using the methodology described in [10,43,44,45,46,47] (Table A8). Based on the carbonate mineralogical compositions from Kofi, Zone C, temperature, pressure, pH, XCO2, and fO2 conditions were estimated and are presented in Table A9. The data indicate deep, CO2-rich, reducing hydrothermal fluids with neutral to slightly alkaline pH (~6.5–7.5). These fluids suggest interaction with highly reactive ultramafic rocks (e.g., basalts or peridotites), which contributed significant Mg2+ and Fe2+, but limited Mn. Conceptually, deep-sourced fluids ascended through fractures and underwent intense water–rock interaction, stripping large amounts of Mg2+ and some Fe2+ into solution.
The stability fields of carbonates rhodochrosite (Rho), magnesite (Mag), siderite (Sid), and calcite (Cal) were calculated under varying physico-chemical conditions, including CO2 mole fraction in fluids (XCO2), fluid pH, and lithostatic pressure [43,44,45,46,47], and are shown in Figure 7 alongside carbonate assemblages identified by electron microprobe (Table A9). Combined with other geothermometers, this diagram helps constrain the possible pressure–temperature (P-T) conditions of gold mineralization at Kofi.
Comparative Mineralogy and Gold Deposition MechanismsZone C, Kofi Area: This zone shares mineralogical similarities with Djambaye [48], Yaléa Gara [49] (south of Kofi), and Gara and Yaléa in Kofi Nétékéto, all within comparable tectonic settings. However, alteration styles differ across zones: Zone C and Djambaye exhibit pervasive silicification and epidotization with minor tourmaline, whereas Yaléa and Gara are dominated by tourmalinization and lack of epidotization.
Petrographic evidence indicates that gold-bearing fluids in Zone C originated from greenschist–facies metamorphic devolatilization, transporting gold primarily as bisulfide complexes (Au(HS)2) stable under moderate fO2 near the Nickel–Nickel Oxide (NNO) buffer (A redox buffer used in geochemistry and mineralogy to define oxygen fugacity). Additionally, alternative ligands, such as trisulfur (S3), may have also contributed. S3 forms highly stable and soluble Au+ complexes in aqueous fluids at >250 °C and >100 bar, potentially enhancing gold transport and deposition by 10–100 times compared to sulfide or chloride-dominated systems [50].
Early interaction with Fe2+-rich host rocks destabilized bisulfide complexes, precipitating quartz (Qz) and arsenopyrite (AsPy). These hot, reduced, CO2-rich fluids carried significant As and S, precipitating invisible gold within arsenopyrite at ~320–450 °C under reducing conditions. As the system cooled to ~300–350 °C during fault-valve cycling and depressurization, chlorite formed, which produced classic green alteration halos. Simultaneously, CO2 loss and fluid phase separation (boiling) further destabilized bisulfide complexes, triggering free gold precipitation.
Subsequent mixing with oxidized fluids (e.g., hematite-/anhydrite-bearing) induced redox shifts, elevated fO2, and oxidized sulfides. This breakdown of pyrite and arsenopyrite released structurally bound gold as Au, further reducing to native Au0. During the waning late stages (~200–300 °C), continued cooling and degassing under more neutral to alkaline and sulfur-depleted conditions promoted carbonate precipitation (e.g., calcite, ankerite, magnesite, rhodochrosite) within fractures and late-stage overprinting veins. Figure 8 schematically summarizes the gold deposition process.
Pathfinder exploration indicators include the following: (i) chlorite and carbonate minerals, especially those with high Mg/Fe ratios or elevated Sr, marking cooler, distal halos around or above main gold zones; (ii) arsenian pyrite, indicative of proximal, hotter, gold-rich cores typical of orogenic systems [52].

2.2.4. Concluding Overview

Geothermometric and mineralogical analyses at Zone C in Kofi reveal a complex, multi-phase hydrothermal evolution characteristic of orogenic gold systems. Thermobarometry of chlorite, arsenopyrite, biotite, feldspar, and carbonates indicates greenschist to amphibolite facies conditions (250–550 °C, 3–8 kbar), suggesting mid- to deep-crustal fluid sources with variable metamorphic overprints. Early high-temperature, reduced, CO2-rich fluids transported gold as bisulfide complexes, with precipitation driven by cooling, pressure drops, wall–rock interaction, and redox changes. Later-stage alteration, marked by chlorite halos and carbonate veining, reflects progressive fluid evolution and mineral overprinting. Pathfinder indicators such as Mg-rich chlorite and arsenian pyrite provide vectors toward mineralized zones, supporting targeted exploration and deeper resource modeling.

3. Spatial Analysis

Endeavour Mining (Mali) conducted whole-rock geochemical analyses on core samples from 76 boreholes drilled during pit operations. Statistical methods, including univariate (histograms), bivariate (cross-plots), and multivariate analyses like Principal Component Analysis (PCA), were applied to characterize lithologies and support 3D deposit modeling.

3.1. Available Data

Geochemical analyses were performed by SGS (https://www.sgs.com/en-us/industry/mining/mineral-and-metal-commodities, 27 July 2025), a North American laboratory specializing in mining and petroleum exploration. Core samples (SGS C10, C11, C12, and CRC11) were collected at approximately 2 m intervals (Figure 9a), yielding 11,980 samples. Analyses included 10 major elements (Al, Ca, Fe, K, Mg, Mn, Na, P, S, and Ti) and 29 trace elements (Ag, As, B, Be, Bi, Cd, Co, Cr, Cu, Ga, Hg, La, Li, Mo, Nb, Sb, Sc, Se, Sr, Sn, Te, Th, Tl, U, V, W, Y, Zn, and Zr). Values below the detection limits were replaced with half the detection limit. Further details on analytical errors and quality control protocols can be found in [17].
Characterizing Rock Types: Five lithological units were identified, with their vertical distribution shown in Figure 9b. From surface to depth, the sequence includes felsic dykes (0–90 m), mafic dykes (0–100 m), unknown lithologies (0–130 m), and diabase (0–150 m). Diorite quartz appears around 180 m, while fault breccias are scattered throughout the 0–180 m interval.
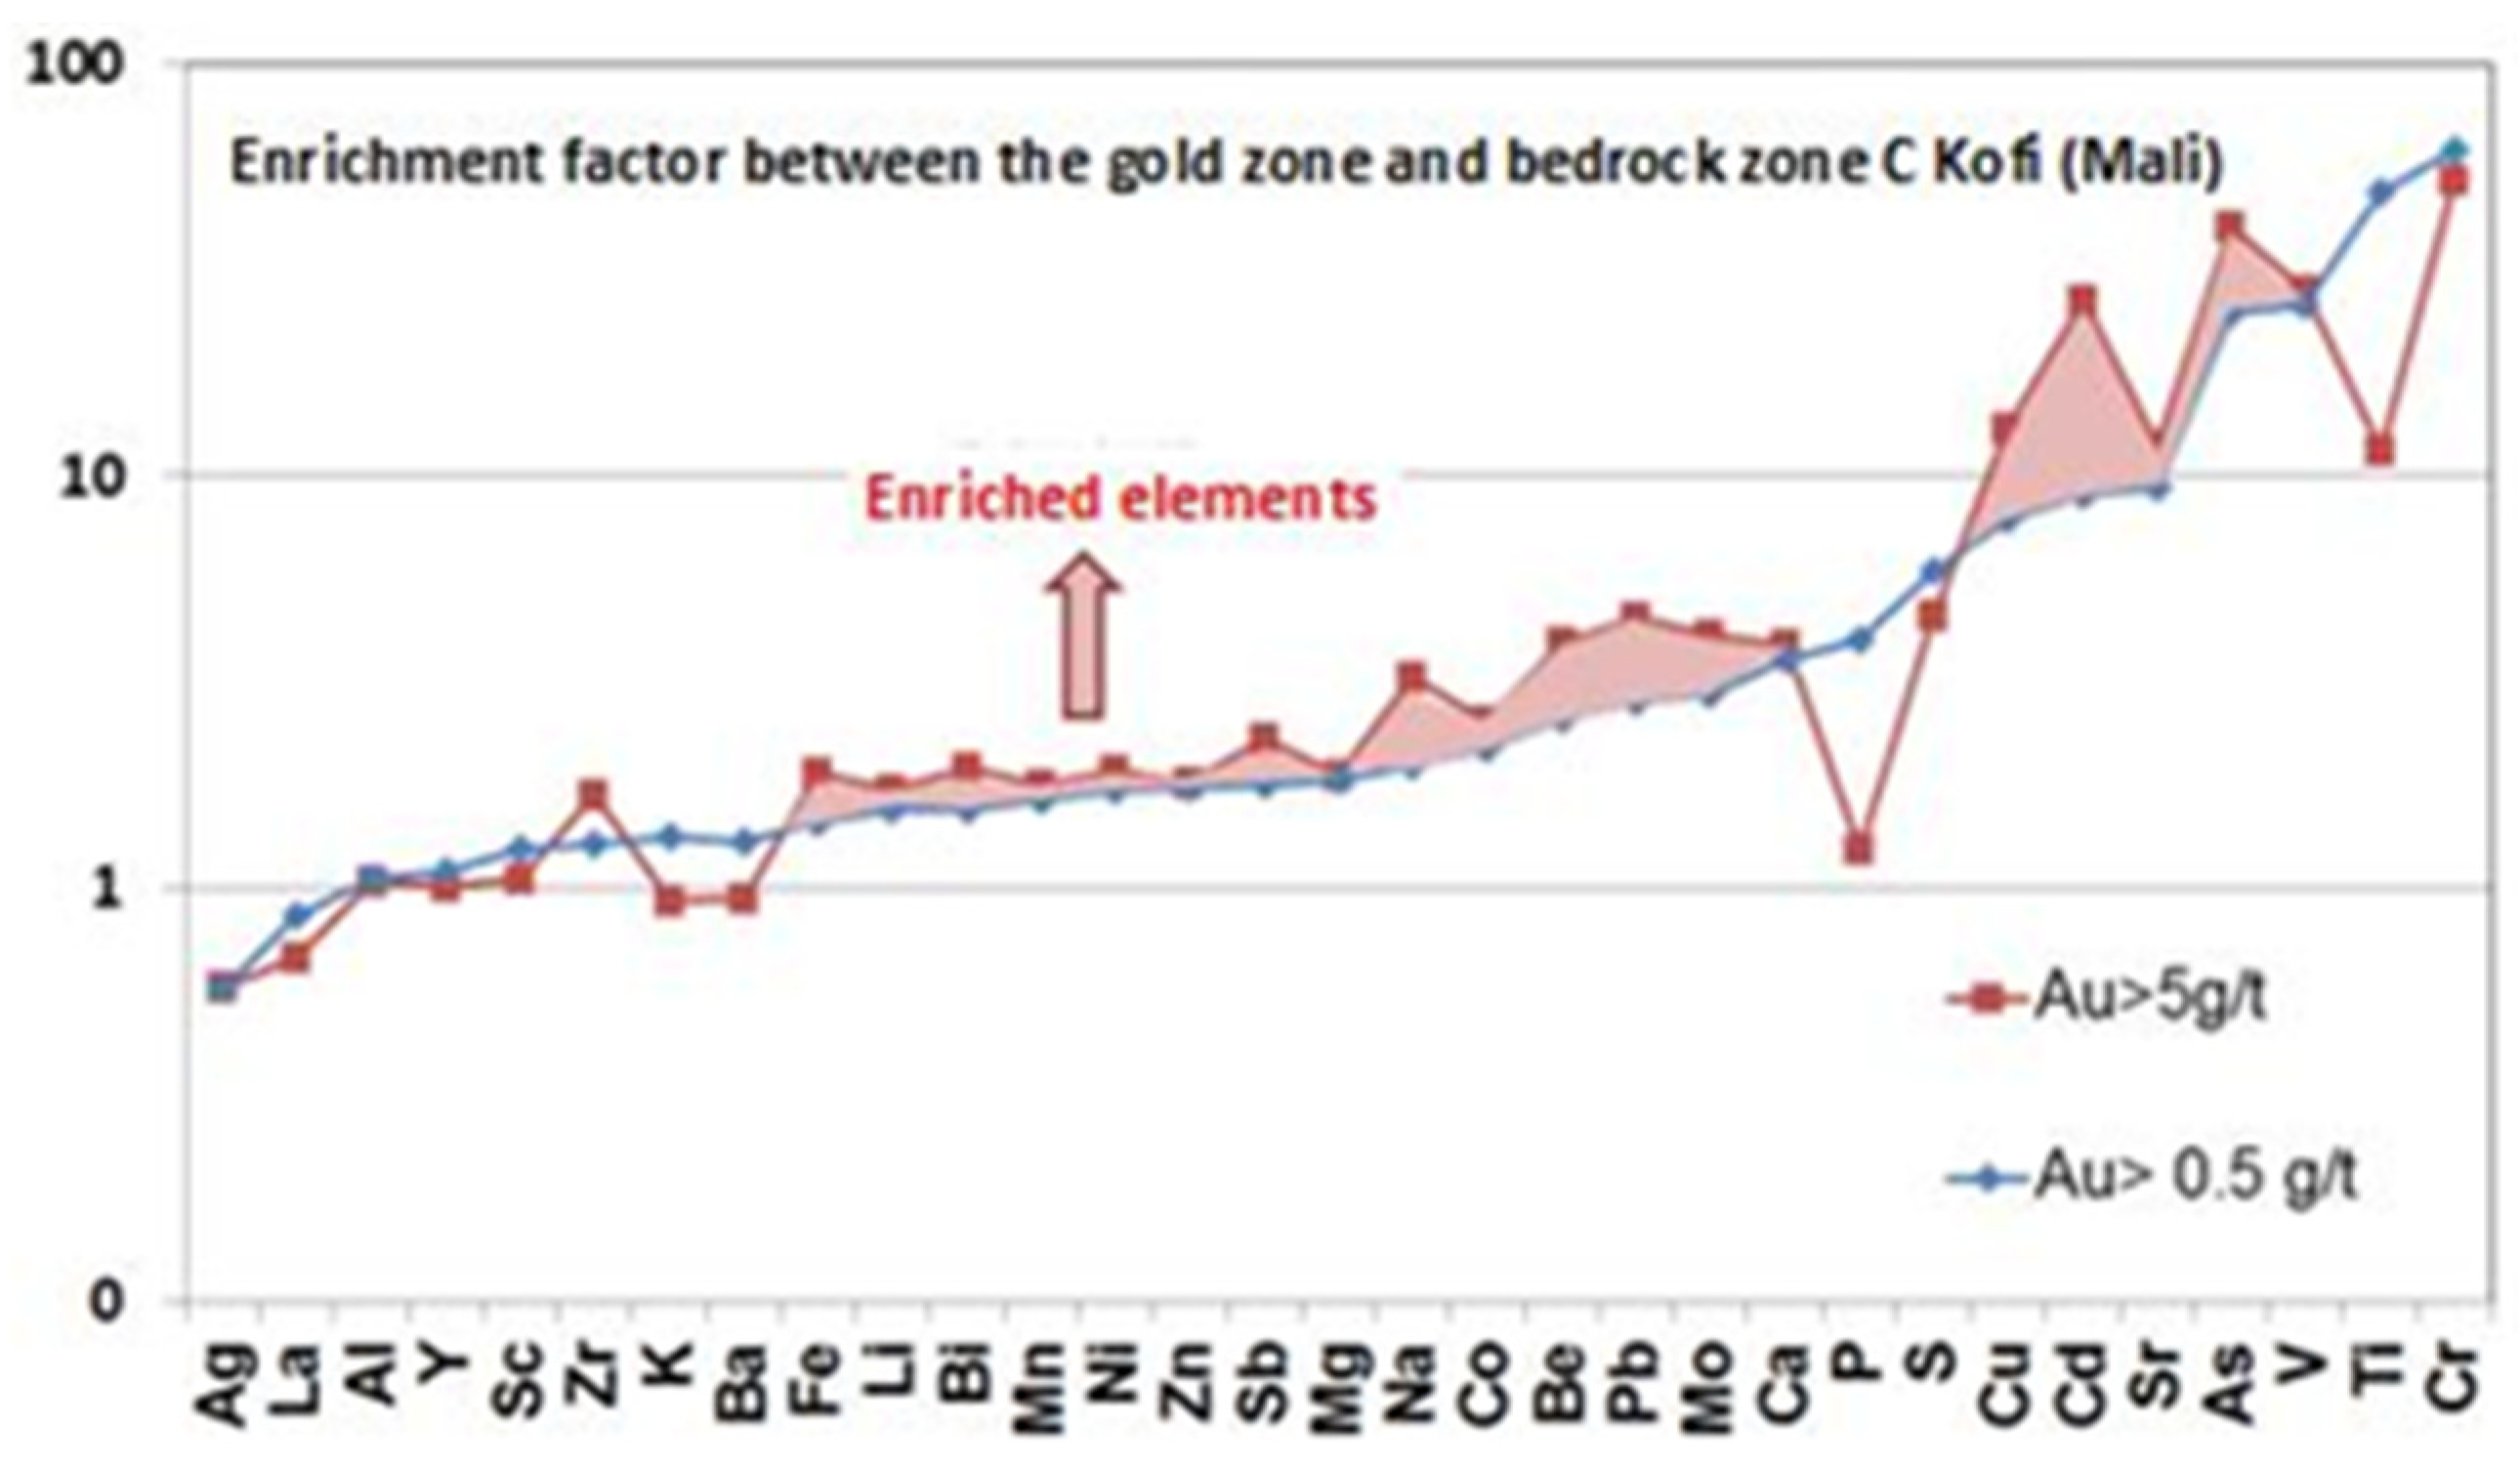
Comparative statistical diagrams show vertical distribution of rock types (Figure 9b) and differentiate barren from mineralized rocks, and also show enrichment in Mn, As, Pb, Cr, V, B, Ca, Mo, Cd, Na, S, P, Ti, and Au (Figure 10 and Figure 11). High-grade gold zones (Au > 5 g/t), relative to low-grade zones (0.5 < Au < 5 g/t), show further enrichment in Zr, Fe, Li, Bi, Mn, Ni, Zn, Sb, Mg, Na, Co, Be, Pb, Mo, Cu, Cd, Sr, and As, and depletion in La, K, Ba, P, and Ti. These trends reflect the influence of sulfur, rutile, and hydrothermal alteration products (e.g., albitization) within mineralized facies.
Such geochemical patterns are consistent with known lithogeochemical haloes, both distal and proximal, such as Au-W-Te-Ag anomalies extending along structural fabrics up to 10 km long and 2 km wide in the Malartic district, Québec [52]. These anomalies serve as effective pathfinders for identifying gold-rich zones and guiding exploration in similar geological settings.

3.2. Univariable and Multivariable Statistical Analysis

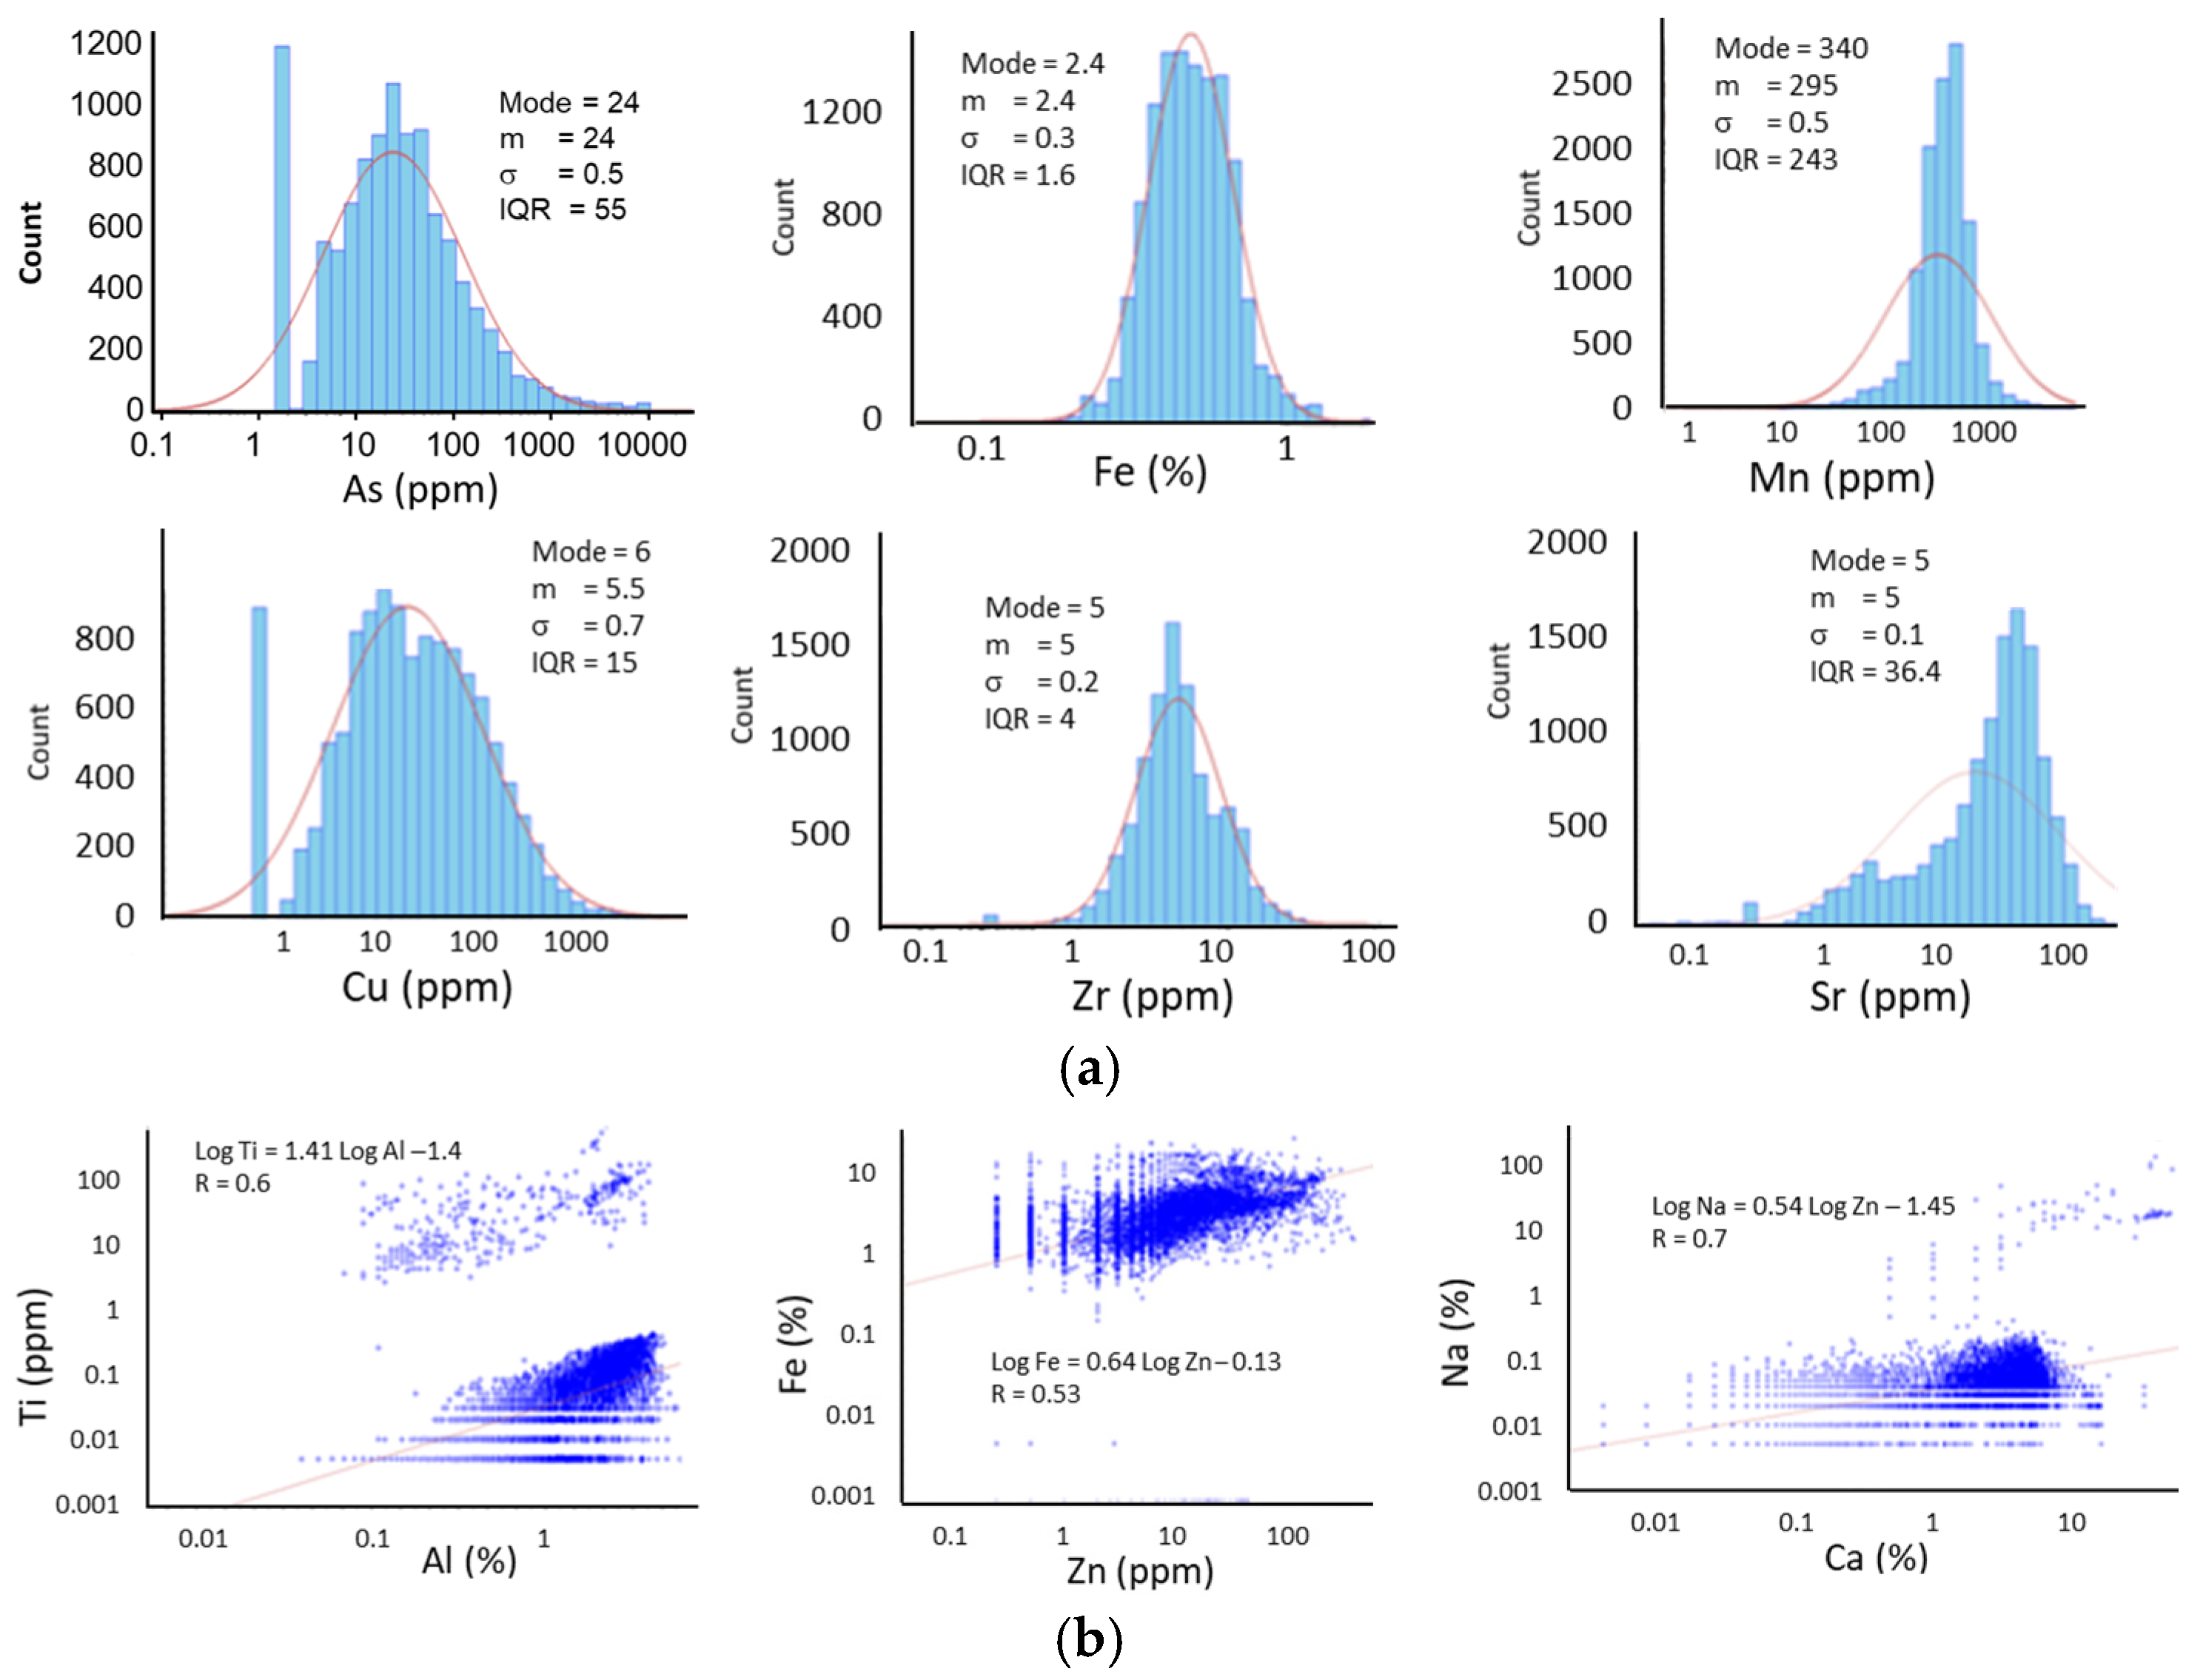
Univariate Statistical Analysis: Histograms (Figure 12a) show that most elements such as Cu, Fe, Zr follow log-normal distributions with a single population (see Q-Q plots in Appendix B), while others like Au, As, and Mn exhibit multimodal distributions with slight right or left tails, or both (Sr), likely reflecting multiple hydrothermal pulses or paragenetic events.
Element concentrations in the Earth’s crust commonly follow the log-normal distribution due to multiplicative processes such as chemical reactions. These reactions are governed by the law of mass action, which states that reaction rates are proportional to the product of reactant activities or concentrations. According to the Van’t Hoff equation, the equilibrium constant K, defined as the ratio of forward to reverse reaction products, is temperature dependent [53]:
ln K = −DrG0/RT
where −DrG0 is the standard Gibbs free energy of reaction, R is the gas constant, and T is the absolute temperature. The effect of pressure P is generally negligible.
Temperature variations induce linear changes in the logarithm of equilibrium constants and, consequently, in the logarithm of element concentration, assuming linear reaction behavior. Thus, normally distributed temperature fluctuations yield log-normal distributions of equilibrium constants and, by extension, of element concentrations. Examples of log-normal distributions are shown in Appendix B.
Since elements often participate in multiple geochemical reactions and transport processes, their concentrations tend to be log-normally distributed. Therefore, it is a standard practice to analyze logarithmic values rather than raw concentrations when constructing log-log plots, performing PCA to identify linear geochemical trends, and when calculating variograms.
Bivariate Analysis: Correlation diagrams (Figure 12b) illustrate elemental relationships and mobility during alteration. Two populations with strong correlations, for example, Al-Ti, where r ≈ 1, and moderate correlations (r ≈ 0.6) suggest common sources or mineral hosts. Sodium (Na) shows a moderate correlation with calcium (Ca) (r = 0.7), indicating the presence of plagioclase (albite). In contrast, low Na levels uncorrelated with Ca may indicate carbonate phases or Na leaching by hydrothermal fluids. Na concentrations > 1% suggest two distinct populations, consistent with albite and other Na-bearing minerals identified in the mineralogical studies, such as jadeite and anorthoclase.
Principal Component Analysis (PCA): PCA is a multivariate statistical method that reduces p initial variables to fp principal components (eigenvectors or factors) derived from the correlation matrix. These components are linear combinations summarizing inter-element relationships [54]. PCA projects samples into an f-dimensional chemical space, approximating n individuals in a lower-dimensional subspace [55], and revealing correlations or anti-correlations among variables.
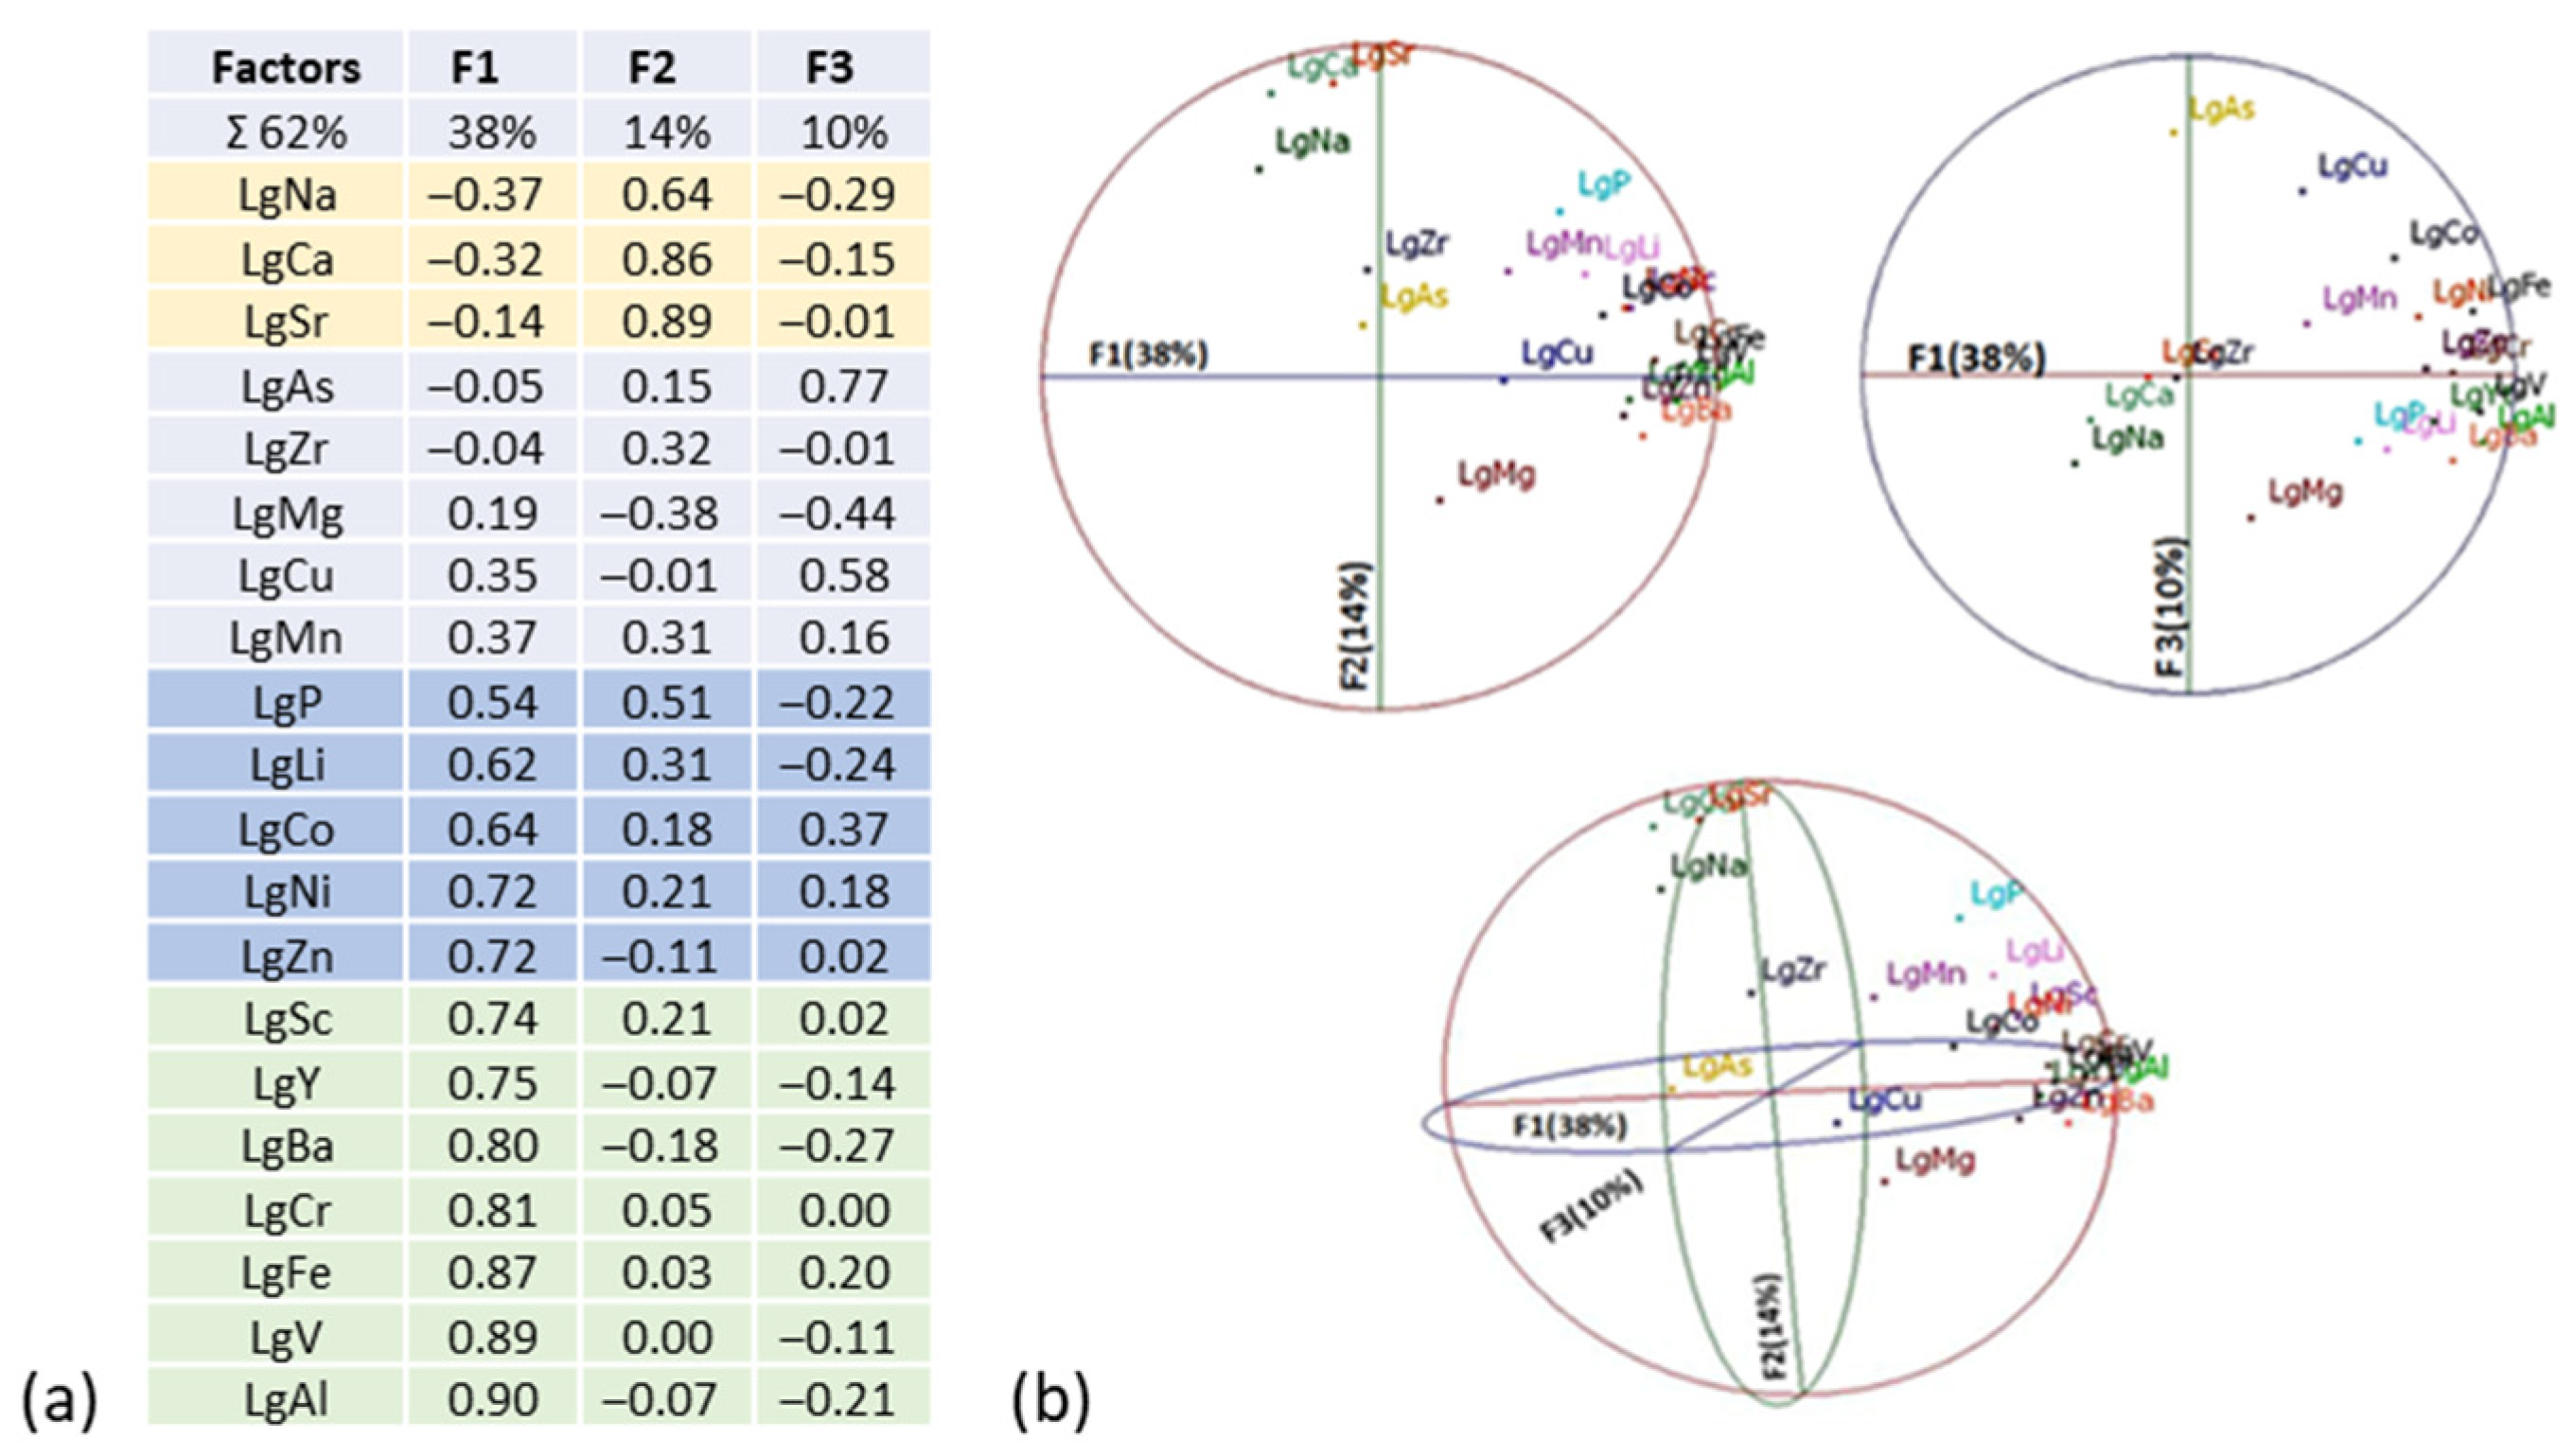
PCA was applied to logarithmic values of 20 elements from the Kofi dataset using the Gocad/SKUA PCA plug-in [56] (Figure 13a,b). Three principal components explain ~62% of total variance, indicating strong inter-variable associations:
Factor 1 (F1, 38%, ~7–8 variables) associated with mafic-ultramafic rocks, strongly correlates with Li, Co, Ni, Zn, Sc, Y, Ba, Cr, Fe, V, and Al; moderately with P.
Factor 2 (F2, 14%, approximately three variables) correlates with Na, Ca, and Sr, likely indicating plagioclase (albite), calcite, and weakly with P. This correlation represents hydrothermal alteration, particularly carbonatization. Sr shows the highest correlation coefficient with F2 (r ≈ 0.9) and will be used to characterize the spatial variation in carbonatization.
Factor 3 (F3, 10%, approximately two variables) linked to mineralization indicators (As, Cu, Zn), representing arsenopyrite, sphalerite, chalcopyrite, and pyrite, minerals commonly associated with gold.

3.3. Variography

Geostatistical analysis identifies spatial structures using statistical tools such as the mean, median, mode, variance, standard deviation, interquartile range, coefficient of variation, and variograms. In mining, these tools support mineral resource and reserve estimation along with their associated uncertainties.
Experimental variograms are fitted to theoretical models to optimize interpolation methods such as kriging [57,58] and are computed in multiple directions to assess isotropy or anisotropy. Three main variogram models are commonly used: (i) models with a sill—spherical, exponential, Gaussian; (ii) models without a sill—linear, logarithmic; (iii) hole-effect models—oscillating variograms around a sill. Variograms are defined by three key parameters. (i) Range (a): the distance beyond which spatial correlation ceases. Anisotropy occurs when the range varies by direction; otherwise, the structure is isotropic. (ii) Sill (C): typically equivalent to the variance (σ2), representing the distance at which the variogram reaches a constant value. (iii) Nugget effect (C0): a discontinuity at the origin, indicating local variability or sampling error.
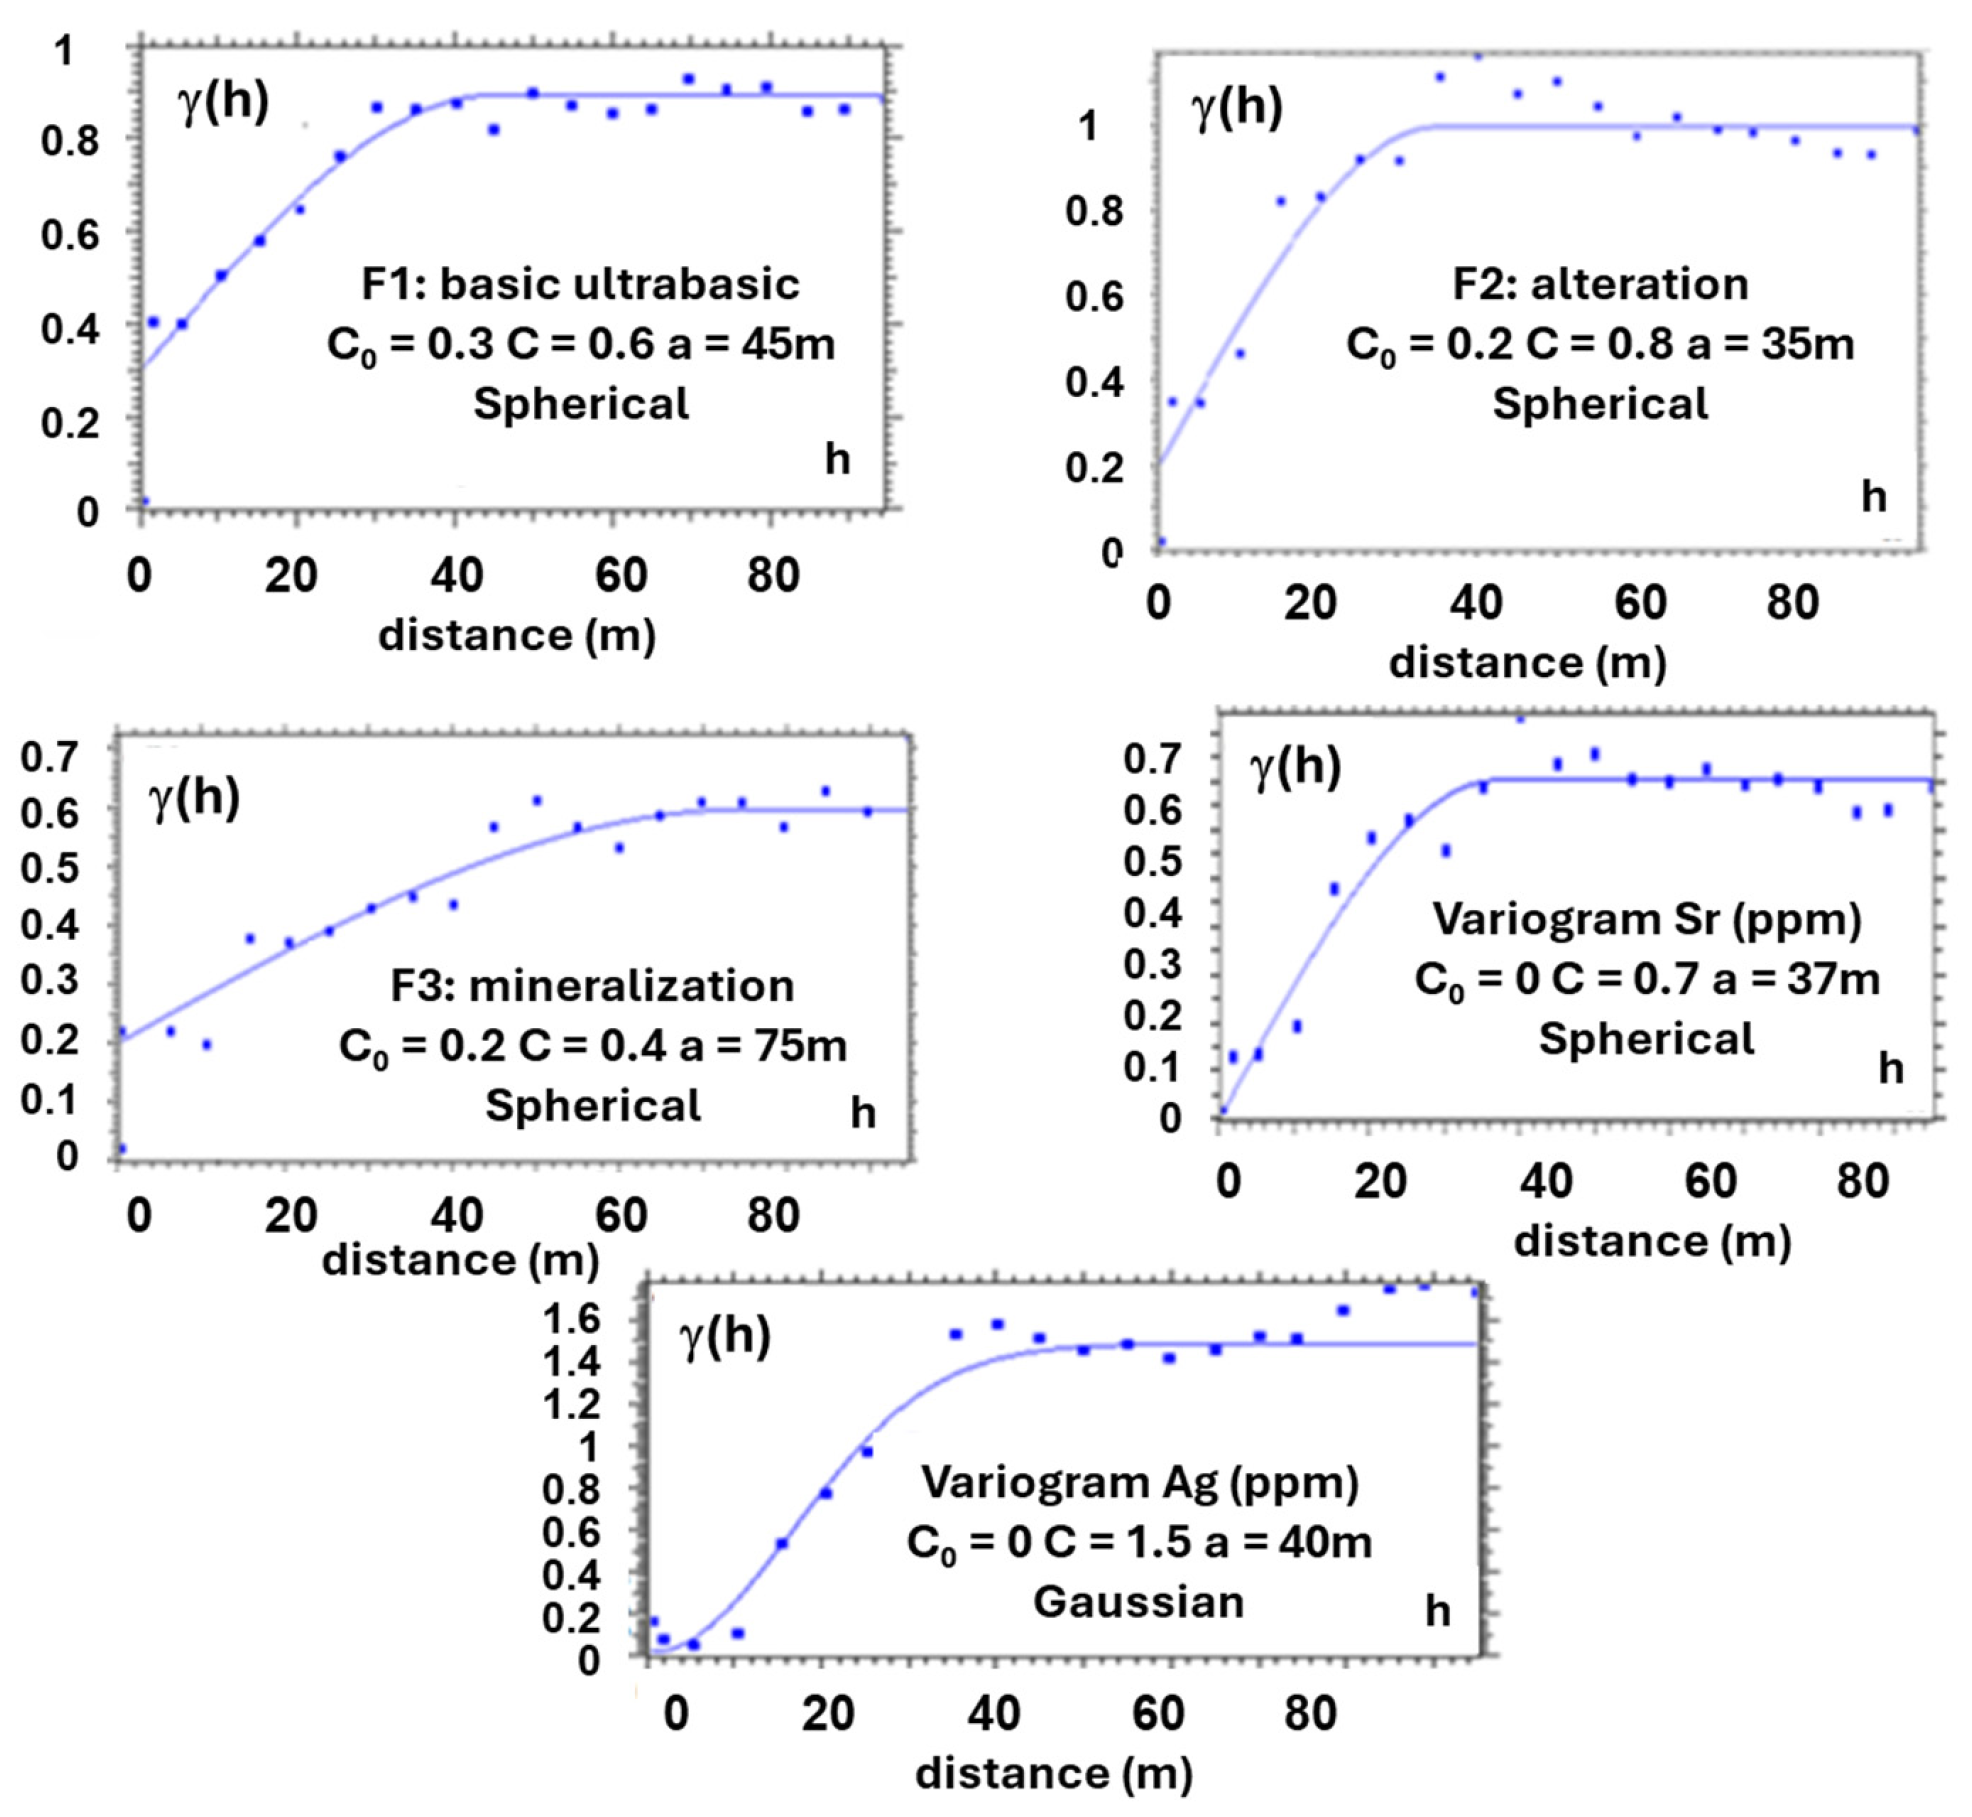
Experimental variograms were computed on all elements using samples from drill holes inclined 55–60° westward. Log-transformed values of Sr, Ag, and PCA-derived factors are shown in Figure 14 to illustrate spatial variability. As SEM analyses reveal electrum in pyrite, the Ag variogram is presented alongside that of Au. The results indicate (i) all variables exhibit stationarity (presence of a sill) and isotropic spherical structures with no significant anisotropy. Therefore, isotropic variograms were computed for each element to improve estimation accuracy. (ii) Some variograms (e.g., F1, F2, F3) show nugget effects accounting for 20%–33% of total variance, indicating significant local variability (Figure 14). (iii) Ranges vary from 35 m (Ag, Sr, F2, F1-linked to mafic/ultramafic rocks and hydrothermal alteration) to 75 m (F3), reflecting the spatial continuity of mineralized zones. The average continuity is estimated at ~75 m.
A log-normal cumulative distribution was fitted to the Au data (Figure 15a). Notably, the gold variogram shows no nugget effect, an unusual feature likely caused by the sampling method, which involved crushing 2 m (or longer) core segments, thereby homogenizing grade fluctuations over a larger volume than point sampling. The variogram follows a spherical model with a 60 m range (Figure 15b), suggesting that gold zones of similar grade typically extend ~60 m, likely due to fault recurrences or thickness variation.
Ranges, sills, and nugget effects (in log scale) derived from element variograms at the Kofi prospects are summarized in circular diagrams (Figure 16). Spatial continuity varies significantly, with ranges nearly doubling from less continuous elements like cobalt (Co, a ≈ 35 m) to more continuous ones like gallium (Ga, a ≈ 80 m). Elements such as Ag, Ti, Cr, Te, and Au exhibit a negligible or no nugget effect, while B and Ga show the lowest, and Cu and F1 the highest local variability.
These fitted variograms were used to construct the 3D grade block model of the Kofi prospect.

3.4. Three-Dimensional Block Model

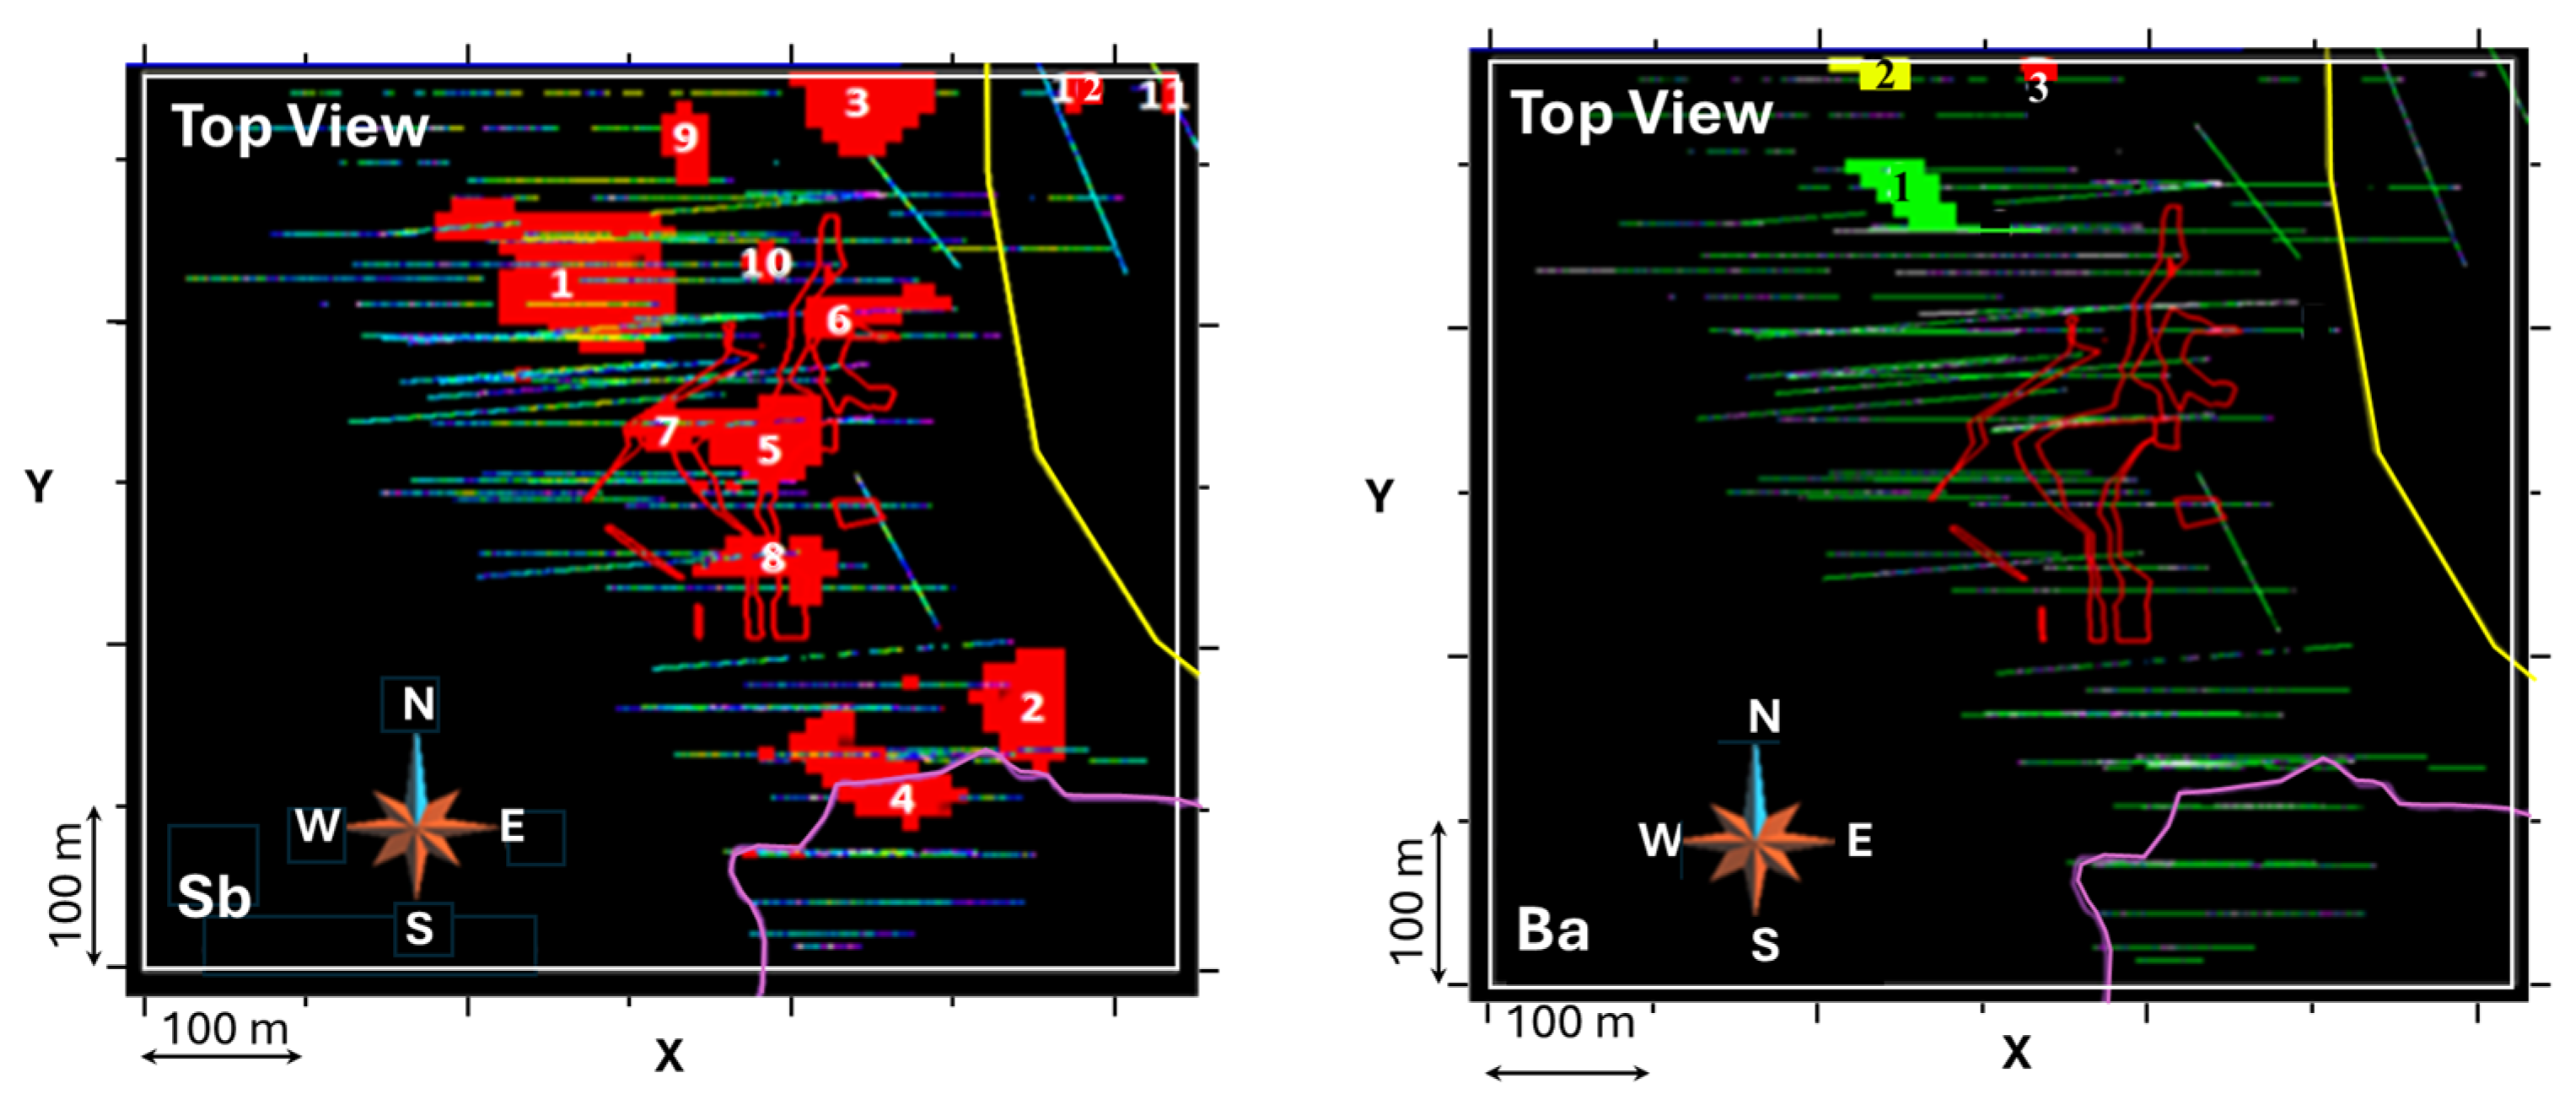
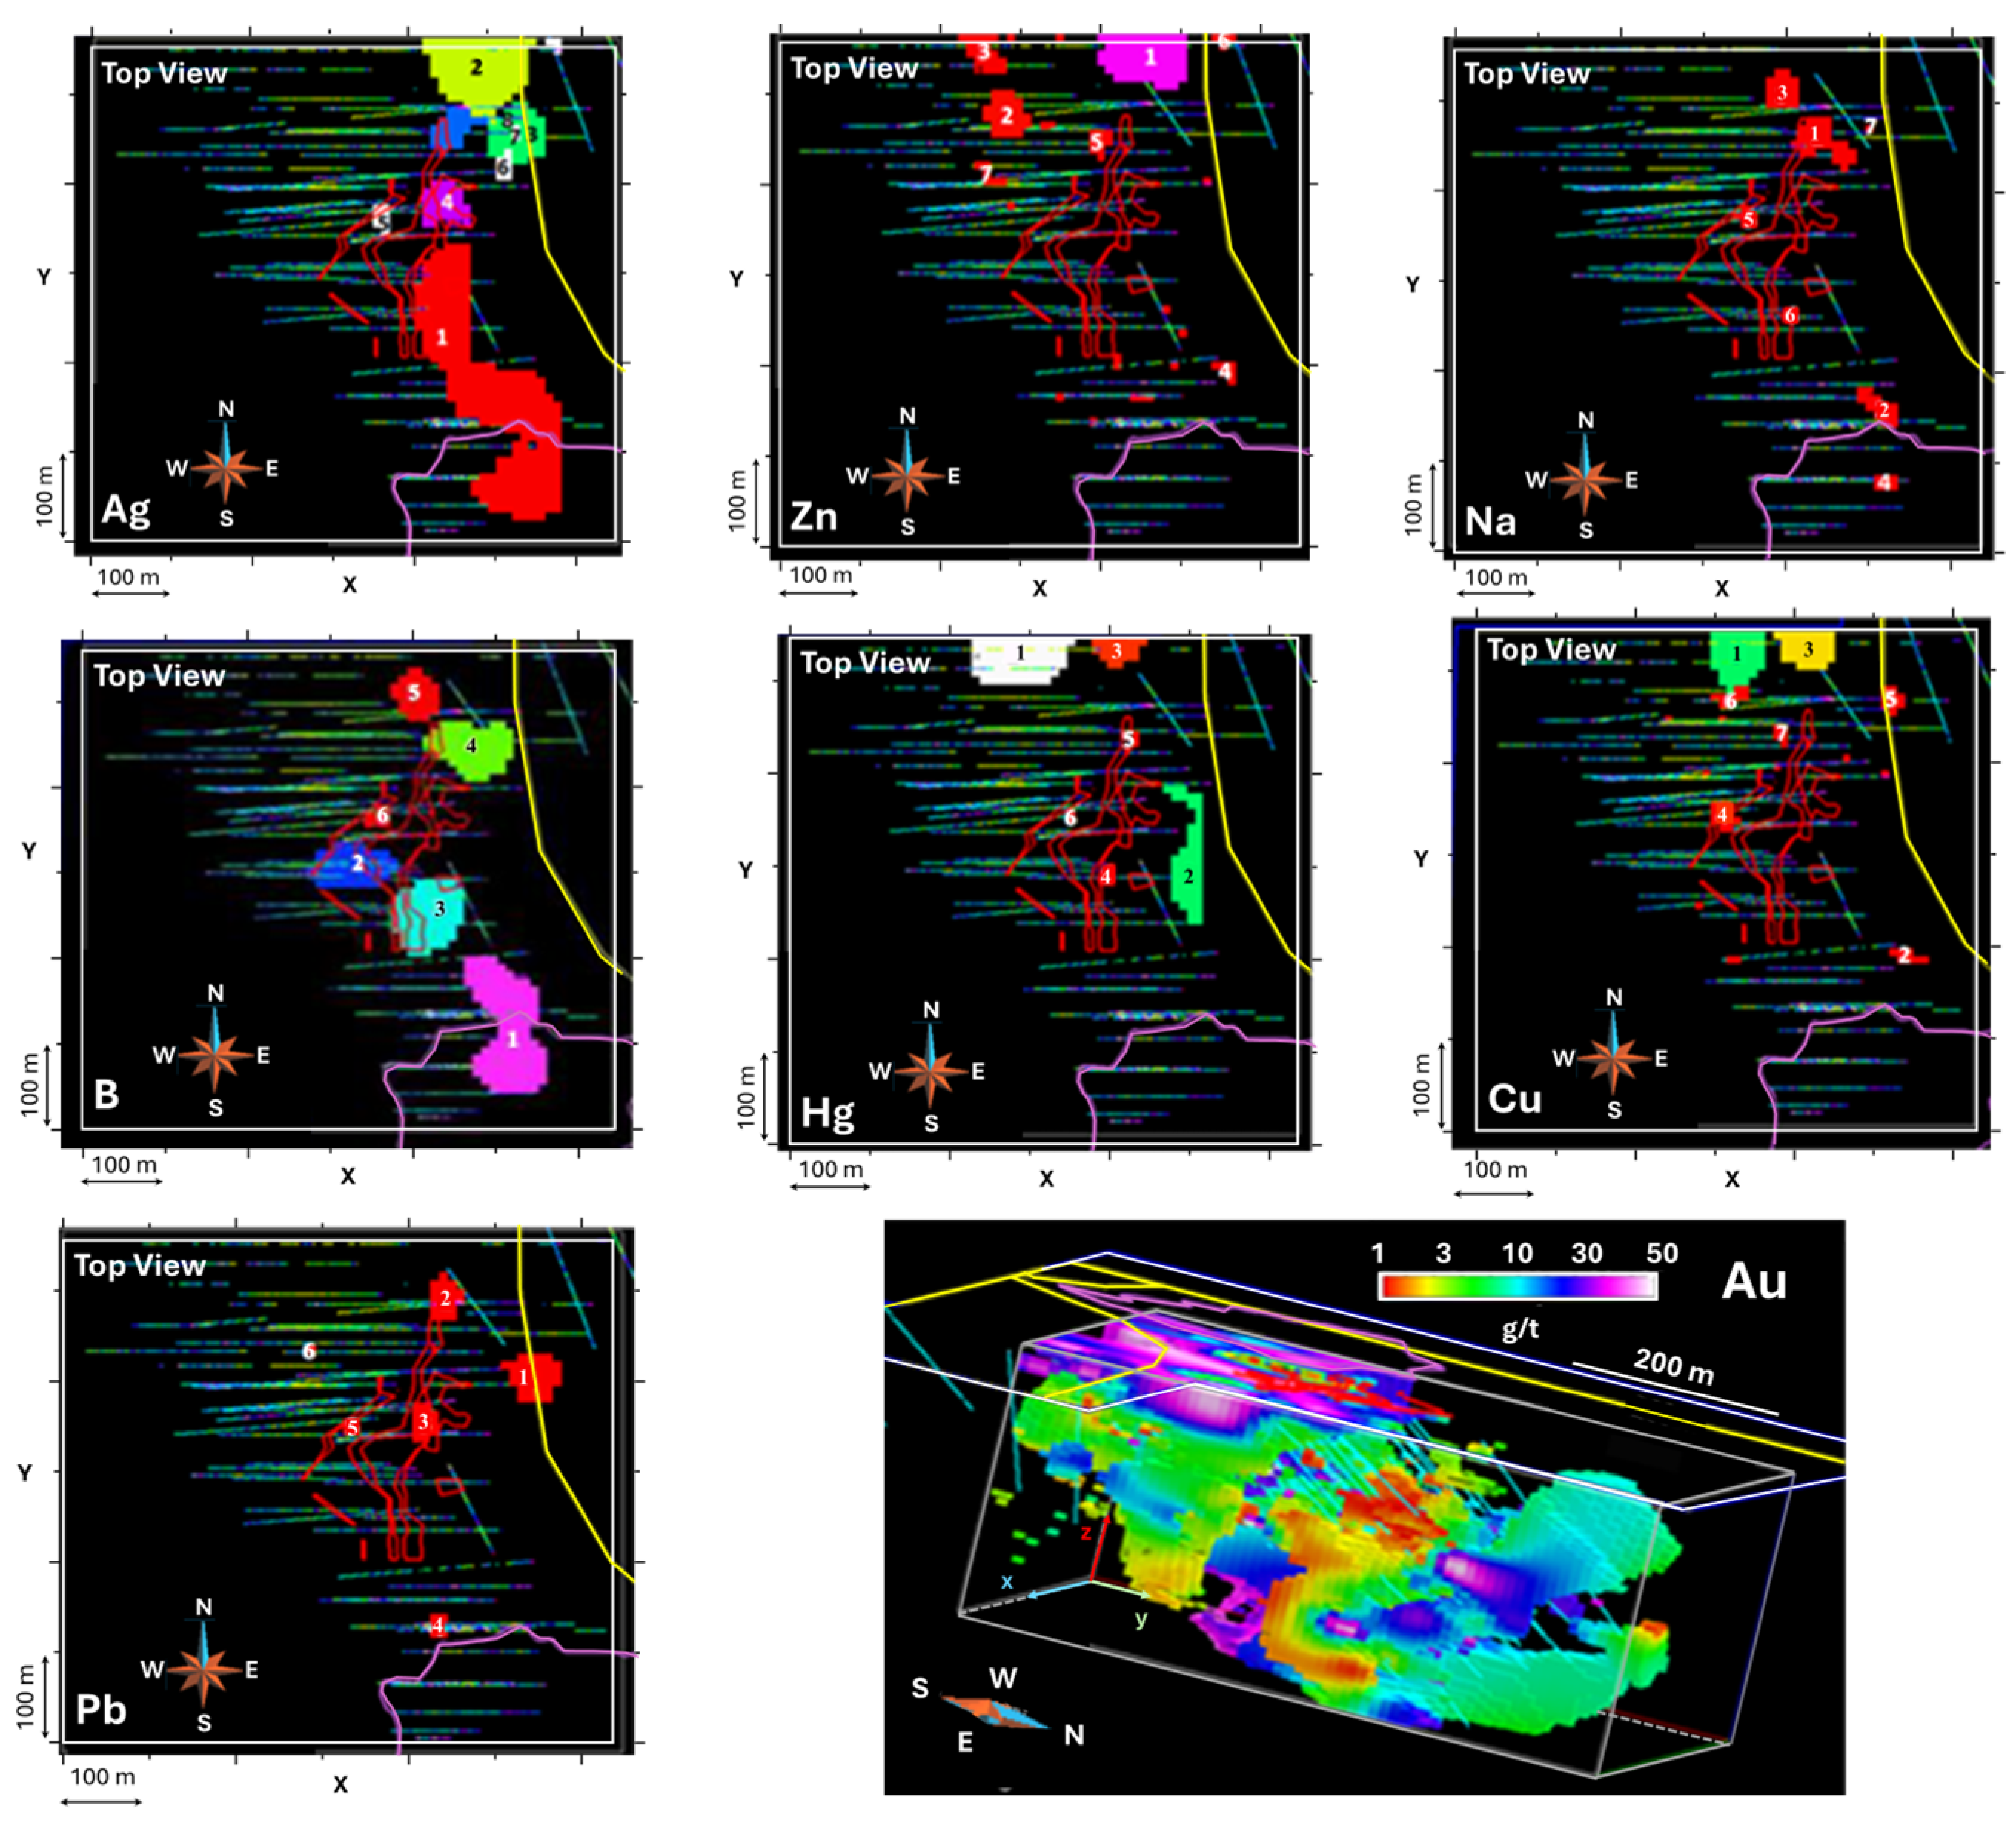
A Gocad regular S-grid (An S-grid (or structured grid) is a regularly spaced, lattice-like grid used in geostatistics and modeling, where cells are aligned along consistent X, Y, and Z deformed axes to better fit geological bodies, forming a 3D matrix) block model was built using SKUA Gocad [59], consisting of 65 × 65 × 54 cells (each 10 × 10 × 5 m), totaling approximately 230,000 blocks. Grades were interpolated at block centers using Discrete Smooth Interpolation (DSI is a spatial interpolator that fits a smooth, continuous estimate through discrete samples while honoring known values and optional inequality constraints. Its minimizes the second derivative (Laplacian or curvature) to enforce smoothness. Unlike kriging, which requires a variogram, DSI is deterministic and supports constraints such as positivity or upper bounds. It is used here as a complementary method to validate the results. Additional details can be found in references [59,60]) (DSI) [60] and ordinary kriging [57] based on fitted variograms. Kriging estimation variances were also calculated. Grade cut-offs were applied for elements such as B, Cu, Na, Hg, Pb, Sb, and Zn (see Table A11) to delineate mineralized zones for resource estimation (Figure 17 and Figure 18). Additional targets were also defined by intersecting anomalous Na-B-Hg zones, highlighting alteration-related associations.
The cutoff values used to define geochemical targets are listed in Table A12. Several samples represent barren rocks for common elements (e.g., Ba, Na) or elements analyzed in low numbers (e.g., B, Hg), making classical statistical techniques (e.g., quantile or mean + 2 s cutoffs) less applicable. Therefore, cut-offs were primarily based on results shown in Figure 10 and geological break points. For Ag, Sb, and Zn, cutoffs were defined using quantiles. For Cu and Pb, they were determined on both geological break points and statistical considerations. The resulting target volumes are visualized in Figure 17, Figure 18 and Figure 19. B and Sb define the largest anomalies, with total volumes of 0.651 and 0.855 Mm3, respectively. B anomalies near Ag mineralization (outlined in red) suggest intense tourmalinization linked to Ag-Au mineralization, as supported by the geological map (Figure 2b) and petrographic analysis.
Smaller anomalies in Pb, Zn, and Na reflect the presence of galena, sphalerite, and secondary phases associated with albitization or tourmalinization. A minor Cu anomaly (~7000 m3), spatially linked to mineralization, may indicate trace amounts of chalcopyrite, bornite, or hydrothermal minerals such as chalcocite and covellite.
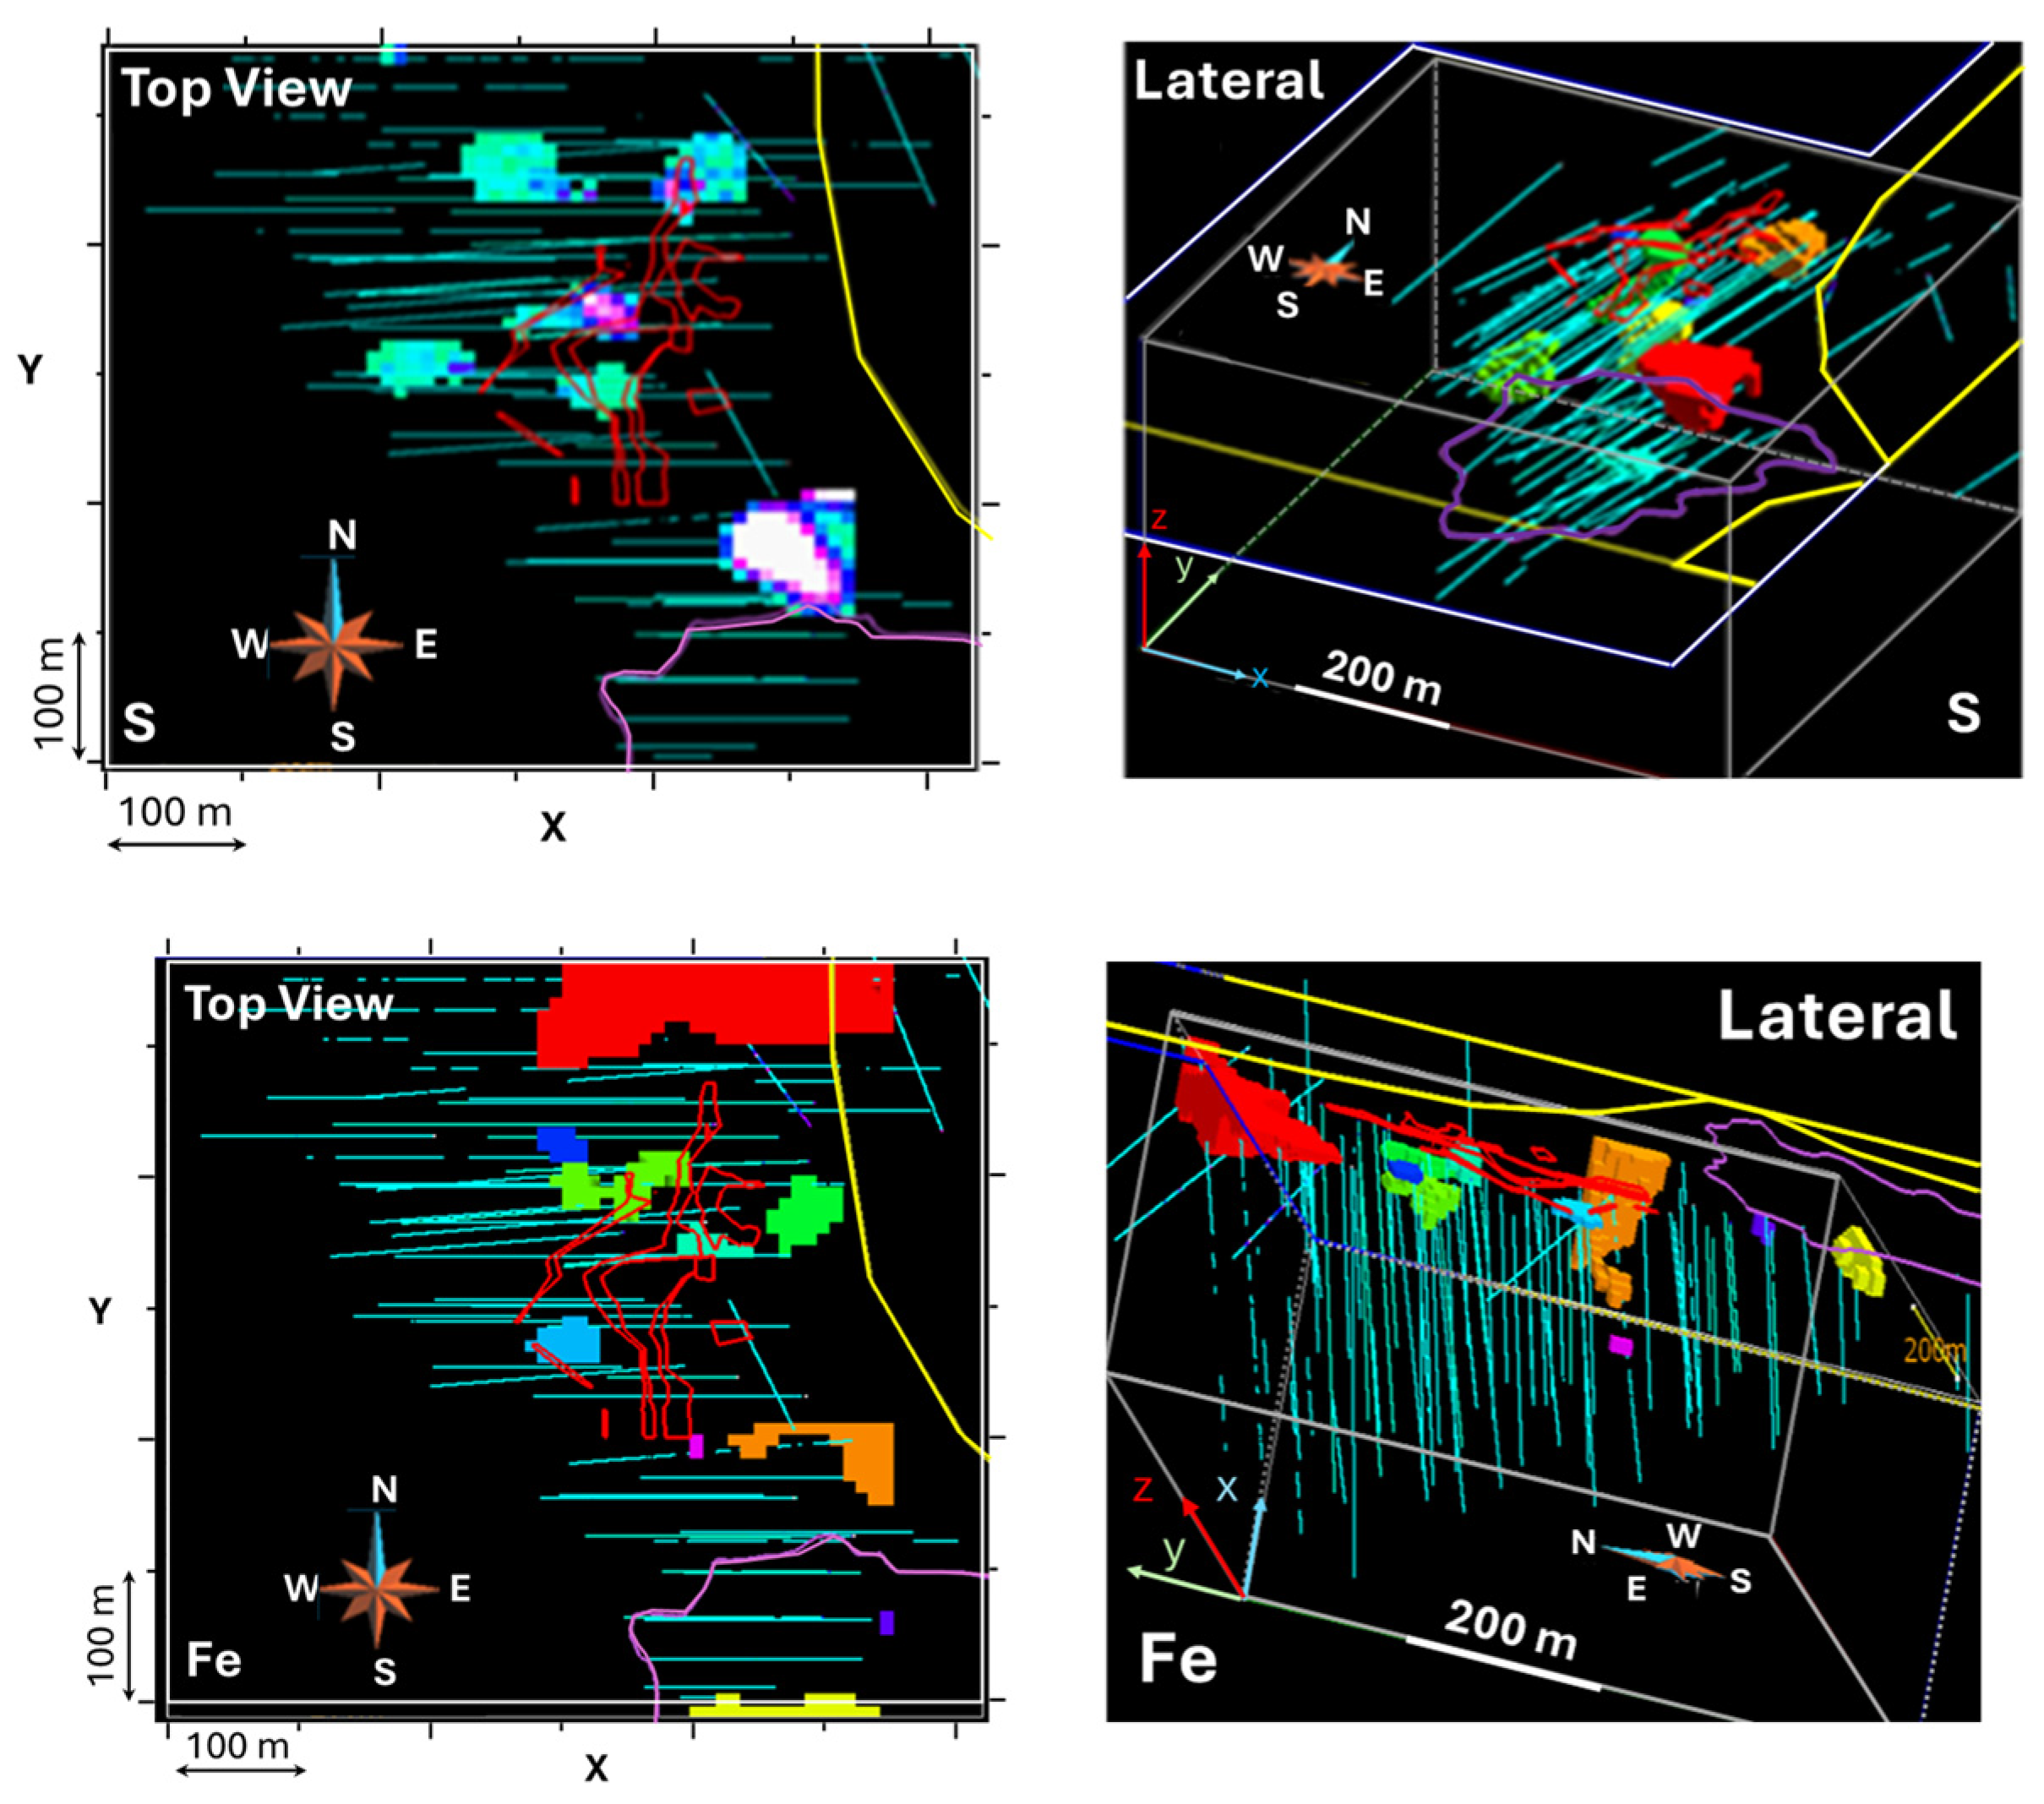
The 3D spatial distributions of sulfur (S) and iron (Fe) are shown in Figure 19. Sulfur anomalies partly coincide with tourmaline zones (B) in the eastern area and with Au mineralization. However, two large anomalies in the west appear unrelated to other mineralization (e.g., Pb, Zn, Cu) and may indicate the presence of pyrite or arsenopyrite.
Discussion: Geostatistical analysis at the Kofi prospect reveals predominantly isotropic, spherical spatial structures with well-defined ranges and low nugget effects for most elements, including gold. Variogram modeling indicates spatial continuity ranging from 35 m (for elements linked to localized alteration) to 80 m (for more uniformly distributed elements), supporting reliable 3D grade block modeling. The absence of the nugget effect in gold further confirms its spatial consistency and enhances confidence in reserve estimation. Spatial variability estimates derived from mineralization and pathfinder element ranges provide valuable guidance for ongoing exploration efforts.

4. Geostatistical Resource Estimation

Silver (Ag) and gold (Au) contents (log-scaled) were estimated at each grid node using Discrete Smooth Interpolation (DSI) [60] and ordinary kriging [57,58] in SKUA Gocad [56], via a mining estimation script [61]. Grades were then back-transformed from log10 values to ppm (g/t). The results in Table 3 indicate an overall estimated kriging standard deviation of approximately 5% in gold reserve calculations, consistent with the Indicated Resources category under the JORC guidelines. This may translate to Probable Mineral Reserves, depending on technical and economic modifying factors (e.g., mining methods, metallurgical recovery, economic viability).
Kriging results for various gold cut-off grades (4–15 g/t) are presented in Table A13. A parallel estimation using a Sequential Gaussian Simulation (SGS) is provided in Table A14 with an ore density of 2.7 g/cm3 assumed.
Conversion factors included the following: 1 oz = 28.349 g; gold price as of 08/03/2022 = USD 1750/oz; production cost (PC) = USD 1369/oz (2018, [62]). Updated values as of 25/04/2025 account for 5% annual inflation, with operating costs at USD 1585/oz and gold priced at USD 3320/oz.
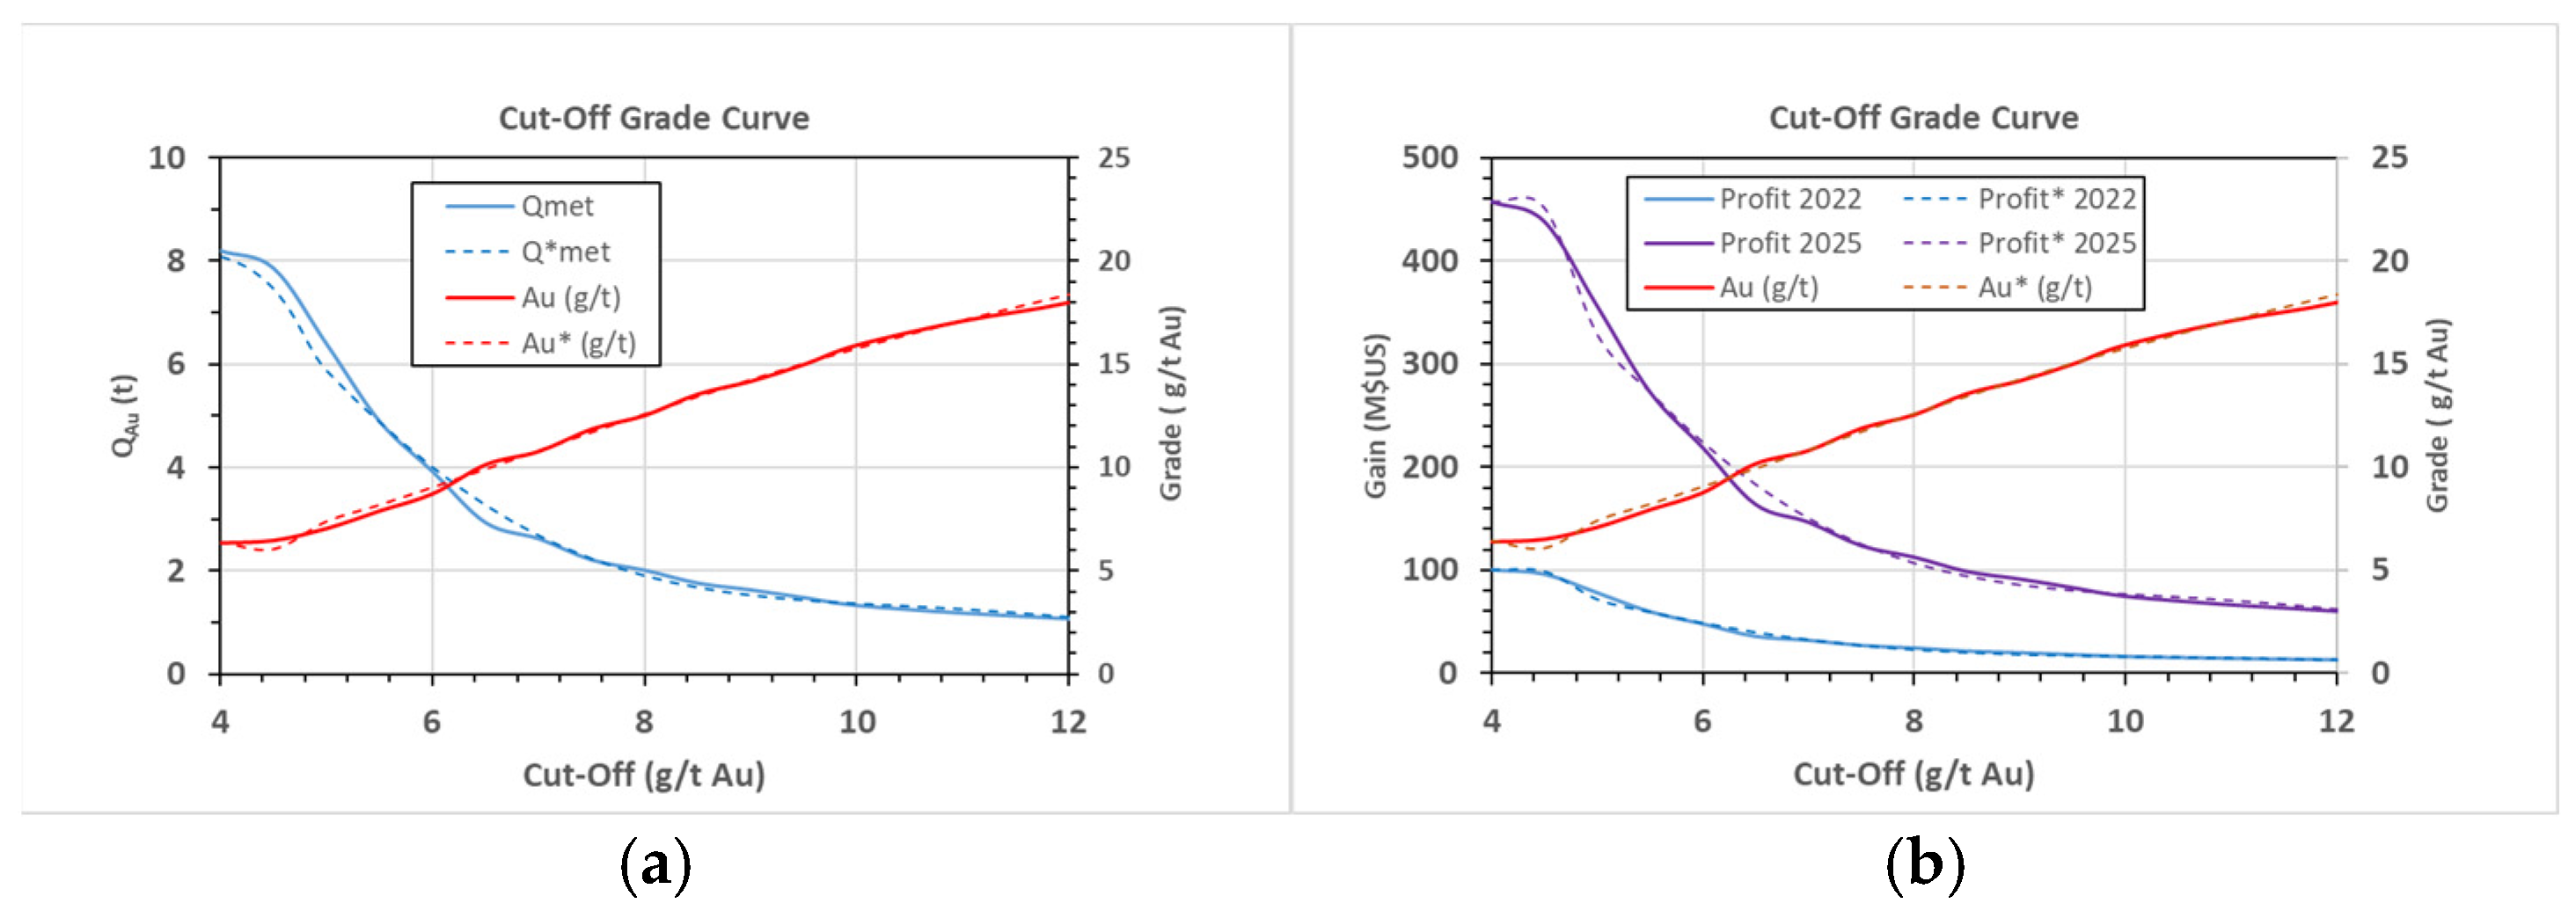
Given the economic context at the time of the study (with gold prices at half their current value) and processing costs related to risk management, a high cut-off grade of 4 g/t Au was chosen. In situ reserves at the Kofi prospect are estimated at 0.289 Moz (~8.2 t Au), with an average grade of 0.22 oz/t (~6.36 g/t), corresponding to 1.29 Mt of ore (Table 3, Table A13, Table A14 and Table A15). Gold grade (g/t) and ore tonnage (t) versus cut-off grade for both methods are shown in Figure 20a, alongside expected gains under 2022 and 2025 scenarios (Figure 20b). A sixth-order polynomial fits the cut-off vs. grade curve:
Q A u t   =   i = 0 6 a i c A u i
where c A u is the cut-off grade, and a i are coefficients listed in Table A16. The relationship shows that increasing the cut-off grade raises average ore grade but reduces total recoverable metal.
In Zone C of the Kofi area, kriging-based in situ reserves are estimated at ~8.2 t Au@ 6.36 g/t, totaling 1.287 Mt of ore. The estimated gold value is approximately USD 506 million, with expected gains of USD ~110 million at 2022 prices, rising to USD 960 million in value and USD 502 million in gains under 2025 assumptions (Table 3 and Table A15). These estimates (indicated and inferred) align closely with figures reported by Avion Gold Corp. (2012, Report No. 235 [17]) for the Kofi C zone:
Indicated: 2.476 Mt @ 3.5 g/t Au, totaling 0.2784 Moz (8.67 t) at a 1.0 g/t cut-off.
Inferred: 1.254 Mt @ 2.78 g/t Au, totaling 0.1122 Moz (3.49 t).
Discussion: The cut-off grade analysis highlights the trade-off between ore grade, tonnage, and economic return-higher cut-offs yield higher-grade ore but lower volumes. While profitability is positive at the 2022 gold price (1750 USD/oz), returns increase significantly under 2025 conditions (3320 USD/oz), illustrating the project‘s strong sensitivity to gold price fluctuations-an uncertainty often greater than resource estimation variance. These results underscore the importance of flexible, market-responsive cut-off strategies, supported by polynomial modeling to enhance long-term planning and project resilience.

5. Conclusions

The main conclusions of the study include the following:
  • Gold Mineralization: Petrographic analysis reveals two phases of gold mineralization: (a) native gold and electrum as inclusions in pyrite (40–50 μm), and (b) disseminated native gold in pyrite-hosted fractures (~100 μm). As pyrite consistently hosts arsenopyrite, the latter is interpreted as the earlier phase. No gold was observed in quartz veins under SEM.
  • Hydrothermal Alteration: Four alteration types were identified: epidotization, chloritization, carbonation, and dominant albitization, often linked with regional tourmalinization. The matrix comprises carbonates and silicates, with variable sulfide mineralization.
  • Thermobarometry: Data from chlorite, arsenopyrite, biotite, feldspar, and carbonates indicate greenschist to amphibolite facies conditions (250–550 °C, 3–8 kbar), suggesting mid- to deep-crustal fluid origins with varying metamorphic overprints.
  • Hydrothermal Evolution: Geothermometric and mineralogical evidence confirms a complex, multi-phase hydrothermal evolution typical of orogenic gold systems. Gold was transported by reduced, CO2-rich fluids and precipitated through cooling, pressure drops, and redox changes. Pathfinder minerals such as Mg-rich chlorite and arsenian pyrite help direct the gold towards mineralized zones.
  • Multivariate Analysis: PCA identified three key factors: F1 lithology (mafic/ultra-mafic rocks and quartz vein breccias), F2 hydrothermal alteration (mainly carbonatization), and F3 mineralization. F2 shows the strongest correlation with gold content.
  • Spatial Modeling: A 3D block model delineated potential mineralized zones. Variogram analysis of log-transformed gold values indicates a stationary, isotropic spatial structure with no nugget effect and a 60 m range.
  • Resource Estimation: In situ gold resources were estimated using ordinary kriging on a regular structured grid. Gold grades follow a log-normal distribution. Mineralization is associated with mafic intrusions and occurs in dolomitized and albitized zones. Despite the presence of electrum, no significant gold-silver correlation was observed across 780 mineralized samples.
  • Structural Controls: Subsurface mineralization aligns with surface structural trends. In situ resource total 1.295 Mt of ore, with an average of 6.36 g/t for Au (at a 4 g/t cut-off), yielding ~8.2 t Au, confirming strong exploration potential in Zone C, Kofi, Mali.
This multidisciplinary approach-integrating petrology, mineralogy, and geochemistry, and 3D geostatistical modeling-provides a robust framework for resource estimation in orogenic gold systems. It demonstrates how combining advanced analytical techniques with solid geological understanding can effectively identify high-potential exploration targets.

Author Contributions

Conceptualization, J.-J.R.; methodology, J.-J.R.; software, J.-J.R. and N.C.; validation, J.-J.R. and N.C.; petrographic analysis, N.C.; investigation, N.C.; resources, J.-J.R. and N.C.; data curation, N.C.; writing—original draft preparation, J.-J.R. and N.C.; writing—review and editing, J.-J.R.; visualization, J.-J.R. and N.C.; supervision, J.-J.R.; funding acquisition, J.-J.R. All authors have read and agreed to the published version of the manuscript.

Funding

This research received no external funding but was partially supported by GeoRessources (UMR 7359), Université de Lorraine (UL), and the Université du Québec à Montréal (UQAM). We thank the gOcad/Ring Consortium for their scientific and software support during the geostatistical study.

Data Availability Statement

Restrictions apply to the availability of this data. The data was obtained from Endeavor Mining Inc. and can be requested with the company’s permission.

Acknowledgments

We thank Endeavour Mining Inc., particularly Damien Lepleux, John Gartner, and Renan Furic, for providing the geochemical database and rock samples for the mineralogical study, and to Zakaria Sanfo for authorizing the publication of the final version of this manuscript. The mineralogical study and SEM analyses were conducted at GeoRessources, with the assistance of Marie-Christine Boiron and Anne-Sylvie André- Mayer. Weare also grateful to Michel Jébrak (Université du Québec, Dpt. Sciences de la Terre et de l’Atmosphère, Montréal) for his constructive comments during the final proofreading. The authors thank the RING Consortium for providing access to the Aspen™ SKUA-GOCAD Suite, which was used to construct the 3D models and perform geostatistical calculations. The authors thank Frédéric Taylor for proofreading the English version of this article.

Conflicts of Interest

The authors declare no conflicts of interest.

Appendix A

Table A1. Sample description with depth and geological context (Py = pyrite, Qz = quartz, Chlr = chlorite).
BoreholeSample IDFrom (m)To (m)Comments
C-11-14K66127.9128Poly conglomerate with disseminated Py
C-11-14K67146.1146.25Dark rock. Few Py + Qz carbonate veins with big Py
C-10-05K7096.7596.9Strongly altered silt with veinlets filled by Chlr and Py
C-10-14K72112.5112.6Strongly altered fault breccia zone Qz stockwork
Table A2. Chemical composition (in %) of chlorites analyzed by electron microprobe.
OxideK72-3aK72-3bK72-3cK72-3dK66aK66bK72-2aK72-2b
Na2O0.040.030.010.070.040.060.050.05
MgO11.5512.7312.4610.9824.215.6111.2712.24
Al2O320.1115.8817.5817.7220.516.321.6218.51
SiO226.0528.6327.5128.2327.3629.5528.3126.28
P2O500.040000.010.020
K2O0.040.010.050.090.020.060.070
CaO0.060.180.20.3200.20.170.08
TiO20.060.0300.020.0700.270.02
MnO00.140.10.0200.0800.07
FeO30.2330.4130.2430.4812.7926.1825.8829.85
Table A3. Structural formulas and estimated formation temperatures of selected chlorite samples.
K72-3K72-3K72-3K72-3K66K66K72-2K72-2
Fe/(Fe + Mg)
Fe/(Fe + Mg)0.590.570.580.610.230.480.560.58
Structural formula (half-cell) 1
S i i v 2.803.082.963.042.783.102.962.86
A l i v 1.200.921.040.961.220.901.041.14
A l v i 1.341.091.181.281.231.111.621.23
F e v i 2.712.732.722.741.092.302.262.72
M g v i 1.852.042.001.763.662.441.751.98
M n v i 0.000.010.010.000.000.010.000.01
Σ v i 5.915.885.905.795.985.865.645.94
End-member proportions
Al-chl0.230.190.200.220.210.190.290.21
Fe-chl0.460.470.460.470.180.390.400.46
Mg-chl0.310.350.340.300.610.420.310.33
Alciv = Aliv + 0.1 [Fe/(Fe + Mg)] 2
Alivc1.260.981.101.021.240.951.101.20
Geothermometers 3
MC88 T (°C)325235275250330230275305
WJ91 T (°C)335245280260330235280315
Geobarometer 4
P (kbar)3.1–3.22.2–2.32.6–2.62.3–2.43.22.1–2.22.6–2.72.9–3
Depth (km)8.3–8.65.7–6.06.9–7.06.1–6.48.45.6–5.76.9–7.07.7–8.0
1 Structural formula calculated assuming 14 oxygen atoms per half-cell, ~88% total anhydrous oxides, and no ferric iron, using chlorite compositions from Table A1. 2 Tetrahedral A l c i v determined using Jowett’s correction [31]. 3 Chlorite formation temperatures estimated using geothermometers from [30] (MC88) and [31] (WJ91), with an error margin of ±5 °C. Calculations assume relative EPMA analytical errors of ~2% using the following equations: MC88: T ° C   =   321.98   A l i v   61.92 (Cathelineau, 1988) [30]. WJ91: T ° C   =   319   A l c i v   69 (with A l c i v = A l i v +   0.1 F e / ( F e   +   M g ) (Jowett, 1991) [31]. 4 Pressure estimated based on an assumed thermal gradient of 35 °C/km and average surface temperatures of ~20–30 °C during the Proterozoic.
Table A4. Chemical composition (in atomic %) of selected chlorites analyzed by electron microprobe 1.
ChloritesSiTiAl/AlIVAlVICrFe2+Mg2+MgCaNaKNiOHSum Cat#XMgAltot apfu
267-C1.46.040.031.962.840.003.300.005.280.010.000.130.011635.590.624.80
267-C2.15.280.002.722.900.014.110.014.880.000.000.000.001635.910.545.62
267-C2.35.290.022.712.790.003.980.005.160.000.000.010.001635.950.575.50
284-C1.15.480.002.532.600.005.770.023.540.010.020.020.001635.980.385.12
346-C3.25.590.032.412.460.004.040.015.380.010.000.000.011635.950.574.87
346-C1.35.560.012.442.780.014.230.004.750.030.000.030.011635.840.535.22
249-C2.15.310.002.692.870.014.750.004.220.030.000.000.021635.900.475.56
249-C2.35.300.012.712.800.024.550.014.480.010.000.000.051635.930.505.51
T (°C) 2P 3
(kbar)
Depth 4
(km)
P 5
(kbar)
(σ = ± 0.1)
Depth 4
(km)
(σ = ± 0.2)
∆log fO2 6
267-C1.4245–2552.25–2.356.0–6.24.211~FMQ
267-C2.1365–3753.55–3.679.4–9.74.813~FMQ−1
267-C2.3365–3753.54–3.669.4–9.74.713~FMQ
284-C1.1335–3453.22–3.348.5–8.84.412~FMQ + 1
346-C3.2315–3253.02–3.138.0–8.34.111~FMQ
346-C1.3320–3303.07–3.188.1–8.44.512~FMQ−0.5
249-C2.3360–3703.49–3.619.3–9.64.813~FMQ
284-C1–3360–3703.51–3.639.3–9.64.713~FMQ
1 Elements below detection limits were excluded. 2 Chlorite formation temperatures estimated using geothermometers from [30] (MC88) and [31] (WJ91), with an error margin of ±5 °C, assuming a relative EPMA analytical error of ~2%. 3 Pressure derived from an assumed thermal gradient of 35 °C/km and average surface temperatures of ~20–30 °C during the Proterozoic. 4 Density is assumed to be 2.7 g/cm3. 5 Pressure is also estimated using the geobarometer equation [37]: P(kbar) = 0.3 × AlVI + 0.7 × Altotal. Discrepancies between this estimate and the thermal gradient-based pressure may reflect an underestimated gradient or limitations of single-mineral thermobarometry. 6 Oxygen fugacity (fO2) assumed near the FMQ buffer due to the absence of Fe3+ data.
Table A5. Chemical composition (in atomic %) of selected arsenopyrites analyzed by electron microprobe 1.
AsPyK72-3-2K72-3-4DJ-9DJ-12DJ-13DJ-14DJ-15
S35.7935.2336.2934.7337.3637.3737.57
Fe32.733.2732.7333.4933.5933.1133.21
As31.2931.3430.7531.6628.929.4429.05
Os0.110.130.160.080.040.030.1
Geothermometers 2
asp + py + As T (°C) 410 ± 30410 ± 30385 ± 30425 ± 30295 ± 35325 ± 35300 ± 35
py + asp T (°C)390 ± 45390 ± 40355 ± 45410 ± 40215 ± 60260 ± 55230 ± 60
1 Element contents below 0.1 at % was excluded. Analytical precision is approximately 2%. 2 Arsenopyrite formation temperatures were estimated using geothermometers based on the asp + py+ As X-T curve [38] and the py + asp equilibrium X-T curve [39].
Table A6. Chemical composition (in atomic %) of selected biotites and hematite analyzed by electron microprobe 1.
BiotitesSiTiAl/AlIVAlVIFe2+MgMgCaNaFOHSum Cat#XMg
267-C2-46.580.011.423.460.326.580.280.191.720.103.9017.950.47
346-C1-26.500.051.503.410.336.500.270.081.770.013.9917.920.46
Hematite
284-C1-3 1.99 2.00
T (°C) 2P (kbar) 3Depth (km)∆log fO2
267-C2-4~400–500~5–10~5–10FMQ Buffer
346-C1-2~500–550
284-C1-3 ≥FMQ + 2
1 Elements below detection limits were excluded. 2 Formation temperatures (T) were estimated based on Ti content (0.013–0.045 apfu) in biotite [36]. 3 Total Al content (Altotal = Aliv + AlVI = 4.83–4.91 apfu) shows a positive correlation with pressure (P) [39].
Table A7. Chemical composition (in atomic %) of selected feldspars analyzed by electron microprobe 1.
FeldsparsSiAl/AlIVCaNaKSum Cat#Ab%An%Or%
267-C1.12.931.080.030.950.045.0392.723.353.93
267-C1.32.990.980.011.030.005.0398.850.970.17
G249-C23.010.980.001.020.005.0199.830.080.10
T (°C) 2P (kbar) 3Depth (km)∆log fO2 4
~300–450~5–8~15–25FMQ Buffer
1 Elements below detection limits were excluded. 2 Formation temperatures (T) were estimated based on low Ti (<0.001 apfu) [36]. 3 Total Al content (Altotal = Aliv + AlVI = 4.83 − 4.91 apfu) shows positive correlation with pressure (P) [39]. 4 Redox-conditions from [7].
Table A8. Chemical composition (in %) of selected carbonates analyzed by electron microprobe.
Carbonate346-G249-284-346-
C2-1C1C1-2C1-4C2-1C2-2C1-4a
Rhodochrosite0.60.11.91.11.11.50.1
Magnesite36.035.90.725.90.621.134.4
Siderite13.015.61.417.91.127.415.2
Calcite50.348.495.454.897.050.050.2
Geothermometers 1
T (°C)320 ± 40300 ± 50260 ± 40310 ± 40250 ± 30335 ± 35330 ± 30
P (kbar)3.0 ± 1.02.0 ± 1.01.75 ± 0.753.0 ± 1.01.75 ± 0.753.25 ± 0.753.0 ± 1.0
pH6.3 ± 0.755.5 ± 1.06.8 ± 0.756.3 ± 0.757.0 ± 0.56.0 ± 0.56.0 ± 0.5
XCO20.4 ± 0.10.3 ± 0.10.2 ± 0.050.4 ± 0.10.1 ± 0.10.4 ± 0.10.4 ± 0.1
1 Carbonate T-P formation conditions were estimated using carbonate-based geothermometers and geobarometers [38] and the py + asp equilibrium X-T curve [39].
Table A9. Carbonate assemblages in the Kofi orogenic gold systems.
Mineral 1
Composition (in %)
T
(°C)
P
(kbar)
pHfO2XCO2Key Observations
Rho.Mag.Sid.Cal.
C10.135.915.648.4280–3402–45.5–7PMB 20.2–0.4High Mg and Fe content; late stage calcite formation under reducing conditions
C1.41.125.917.954.8270–3502–45.5–67reducing0.25–0.45High Mg and Fe content; late-stage calcite formation under reducing conditions with H2O-CO2 dominant fluids.
C1.4a0.134.415.250.2300–3602–45.5–6.5PPMB 30.3–0.5High magnesite and siderite content, indicating Fe-Mg-rich fluid interaction with CO2.
C2.21.521.127.450.0300–3702.5–45.5–6.5PPMB0.3–0.5Siderite and magnesite suggest Mg-Fe-rich fluids under moderate to high CO2 activity.
C2.10.636.013.050.3280–3602–45.5–7QFMB 40.3–0.5High magnesite and siderite content, indicating interaction with CO2 rich, Fe-Mg-bearing fluids.
C1.21.90.751.495.4220–3001–2.56–7.5PMB0.1–0.2Calcite-dominated assemblage suggests fluid cooling; high CO2 activity is required for siderite and magnetite formation.
C2.11.10.61.197.0220–2801–2.56.5–7.5mildly reducing0.1–0.2Predominantly calcite with trace Fe and Mn carbonates, indicating late-stage fluid neutralization.
1 Abbrev.: Rho. = Rhodochrosite; Mag. = Magnesite; Sid. = Siderite; Cal. = Calcite. 2 PMB = near the pyrite-magnetite buffer, indicating moderately reducing conditions. 3 PPMB = near the pyrite-pyrrhotite-magnetite buffer, indicating reducing conditions. 4 QFMB = near the quartz–fayalite–magnetite buffer, representing mildly reduced conditions that promote stable transport of gold as bisulfide complexes (AuHS0) and sulfur, creating favorable conditions for gold deposition during interaction with Fe-bearing rocks.
Table A10. Carbonate and sulfide assemblages in the Kofi orogenic gold systems.
Carbonate 1 (in %)AsPy 2Alteration MineralsDominant FeaturesT
(°C)
Gold
Association
Interpretation
Rod.
(MnCO3)
Mag.
(MgCO3)
Sid.
(FeCO3)
Cal.
(CaCO3)
C10.135.915.648.4Arsenopyrite presentChlorite + minor sericiteFe-Mg dominant280–350Mid-stage/GoldStrong interaction with ultramafic/mafic rocks
C1.41.925.917.954.8Common pyriteModerate chloriteMg-Fe rich250–340Mid-stageModerate fluid-rock interaction in a proximal zone
C1.4a0.134.415.250.2Pyrite + arsenopyriteStrong chloriteMg-Fe rich260–350Mid-stageMafic host interaction in a proximal setting
C2.21.521.127.450.0Pyrite + arsenopyriteChlorite-dominantMg-Fe rich300–370Mid-stageFluid-rock interaction in a proximal zone
C2.10.636.013.050.3Abundant arsenopyriteChlorite-dominantMg-Fe dominant280–360Likely coevalShear-hosted proximal alteration with gold potential
C1.21.90.751.495.4Trace sulfidesWeak sericiteCa-dominant200–280Late/PostWeak fluid-rock interaction in a distal zone
C2.11.10.61.197.0Trace sulfidesNone to weakCa-dominant180–260Late/PostDistal alteration halo with minimal Mg-Fe input
1 Abbrev.: Rho. = Rhodochrosite, Mag. = Magnesite, Sid. = Siderite, Cal. = Calcite. 2 AsPy = arsenopyrite. Notes: Assemblages with >30% magnesite + siderite indicate significant Mg-Fe mobility and proximal alteration. Rhodochrosite remains low in all samples, indicating Mn-poor systems or limited late-stage Mn availability. Sulfide presence correlates with Fe-Mg carbonate abundance and proximity to gold mineralization. Chlorite and sericite alteration trends reflect fluid temperature and wall–rock chemistry. Late-stage, calcite-dominant samples likely represent distal or post-mineralization fluids. This extended table integrates carbonate mineralogy with sulfide and alteration phases, providing a more comprehensive paragenetic framework for orogenic gold systems.
Table A11. Descriptive statistics of geochemical elements.
ElementsUnitsnmedmσIQRσ225th75th
LgAgppm961211.070.200.0311
LgAl%11,83510.70.500.211
LgAsppm11,96524240.7550.5863
LgBppm202101.40.600.41010
LgBappm11,96828260.7980.57105
LgBeppm11,96810.30.400.211
LgBippm11,9682.520.40.50.122.5
LgCa%11,916310.930.714
LgCdppm11,96810.60.300.0811
LgCoppm11,96819110.5170.2623
LgCrppm11,968421.60.7980.413111
LgCuppm11,83565.50.7150.4217
LgFe%11,8412.42.40.31.60.0723.6
LgGappm202100.2101.61010
LgHgppm756010.580.2−90.6101
LgK%11,96810.090.900.811
LgLippm11,96876.420.6140.3317
LgMg%11,9682.21.250.71.60.51.43
LgMnppm11,9663492950.52430.3235478
LgMoppm11,838110.400.211
LgNa%11,96810.040.500.211
LgNbppm568104.90.300.091010
LgNippm11,96830270.5320.31951
LgP%11,88410.040.500.211
LgPbppm11,968220.500.611
LgS%938610.070.8−0.50.632.5
LgSbppm11,8352.530.37.70.062.510.2
LgScppm11,9686.46.40.35.70.14.310
LgSeppm202105.50.200.11010
LgSnppm11,83527.5170.700.0155
LgSrppm11,835550.136.40.19.646
LgTeppm2021041.701.81010
LgTi%11,83510.020.800.811
LgTlppm2021040.800.61010
LgUppm133107.50.300.11010
LgVppm11,968321.50.5700.31080
LgWppm11,968560.200.0655
LgYppm11,965550.23.40.0647.4
LgZnppm11,835660.6120.3315
LgZrppm11,598550.240.0837
n = number of samples, med = median; m = mean; σ = standard deviation; 25th = 1er quartile; 75th = 3eme quartile; nb = sample numbers; σ2 = variance.
Table A12. Volumes of geochemical anomalies identified at the Kofi prospect.
Volume (in m3)
Elements 1Cut-Off1234567891011Comments
B>0.003220,500171,000139,50092,00024,0004500 Tourmalinization
Cu>100121,50012,00066,50070004500400025002000 Cu Anomaly
Na(%)>0.3%35,50024,00012,500650055003500 Albitization
Hg>5403,000121,00042,00025002500 Sulfides
Pb>3521,00017,000800060002000 Galena
Sb>10415,500120,000109,50078,00058,00023,00018,00016,500700050005000Antimony
Zn>25214,50037,00034,00095004500400030002000 Sphalerite
Ag>2938,000125,00051,00021,00014,50012,50012,50012,50095009000 Silver zone
Ba>50031,00017,0002000 Barium
1 Cut-off in g/t, excepted for Na in %.
Table A13. In situ gold (Au) reserves estimated by kriging at varying cut-off grades.
NbVolQoreQmetQmetGradeGrade
(g/t)blocs(Mm3)(Mt)(t)(Moz)(Au g/t)(Au oz/t)
49560.481.298.200.2896.360.22
4.58970.451.217.860.2776.490.23
56700.340.906.390.2257.070.25
5.54570.230.624.890.1727.920.28
63320.170.453.920.1388.750.31
6.52140.110.292.930.10310.160.36
71800.090.242.620.09210.800.38
7.51380.070.192.210.07811.880.42
81190.060.162.010.07112.540.44
8.5960.050.131.760.06213.570.48
9850.040.111.630.05714.190.50
9.5730.040.101.480.05215.000.53
10620.030.081.330.04715.940.56
11510.030.071.180.04217.110.60
12440.020.061.070.03818.000.63
13350.020.050.920.03219.390.68
14260.010.040.750.02621.410.76
15230.010.030.690.02422.340.79
Table A14. In situ gold (Au) reserves estimated by Sequential Gaussian Simulation (SGS).
Cut-OffNbVolQoreQmetQmetGradeGrade
(g/t)blocs(Mm3)(Mt)(t)(Moz)(Au g/t)(Au oz)
45260.260.715.240.1857.380.26
4.55070.250.685.130.1817.500.26
54060.200.554.480.1588.160.29
5.53720.190.504.240.1508.440.30
63530.180.484.090.1448.590.30
6.51730.090.232.600.09211.130.39
71710.090.232.580.09111.180.39
7.51490.070.202.360.08311.740.41
81340.070.182.210.07812.210.43
8.5750.040.101.550.05515.280.54
9610.030.081.380.04916.750.59
9.5240.010.030.920.03228.431.00
10220.010.030.890.03130.131.06
11120.010.020.750.02646.461.64
12110.010.010.740.02649.601.75
13110.010.010.740.02649.601.75
14110.010.010.740.02649.601.75
15110.010.010.740.02649.601.75
Table A15. In situ gold (Au) reserves estimated by Kriging.
Orebody N°123456789Total
Vol (m3)266,00071,50044,50026,00024,50022,000900070002500473,000
Qmet (t)2.8730.7720.4810.2810.2650.2380.0970.0760.0275.110
Qmet (oz)101,34427,23216,96799129348839534222681952180,253
Qore (t)718,200193,050120,15070,20066,15059,40024,30018,90067501,277,100
2022Vmet (MUSD)177.35247.65629.69217.34616.35914.6925.9884.6921.519315.296
PC (MUSD)138.74037.28123.22813.57012.79711.4934.6843.6701.304246.767
Gain (MUSD)38.61210.3756.4643.7773.5623.1991.3041.0210.21568.529
2025Vmet (MUSD)336.41390.39756.32332.90431.03027.86911.3588.8993.162598.354
PC (MUSD)160.60943.15726.88915.70914.81413.3055.4234.2491.509285.663
Gain (MUSD)175.80547.24029.43317.19516.21614.5645.9364.6511.652312.691
Rock density: d = 2.7 g/cm3; Conversion: 1 oz = 28.1349 g; 2022: Gold price 1: 1750 USD/oz; Operational costs (PC) = 1369 USD/oz; 2025: Gold price 2: 3320 USD/oz; Operational costs (PC) = 1585 USD/oz; Cut-off = 4 g/t; Vmet = Metal value; Vol = Volume (m3); Qore = Ore quantity (t); Qmet = Metal quantity. 1 Price as of August 2022. 2 Price as of April 2025.
Table A16. Sixth-order polynomial coefficients fitting reserves, grade, and gains curves as a function of cut-off estimated by kriging.
a i , i = 0123456 R 2
QAu (t)−0.00020.0142−0.3374.065−26.03981.476−88.4260.996
Au (g/t)0.0026−0.10021.333−5.66713.188--0.998
Gain 2022 (MUSD)−0.00350.2048−4.87759.36−384.761229−14040.995
Gain 2025 (MUSD)−0.01580.9326−22.206270.3−17525594−63920.995

Appendix B

Figure A1. Cumulative and Q-Q plots of selected geochemical elements (blue dotted line) are fitted to their theoretical lognormal distributions (red solid line) with confidence bands (red dashed line). Some elements (e.g., Cu, Fe, Zr) show a near lognormal distribution, while others display a slight right tail (Au, As), a left tail (Mn), or both (Sr), suggesting mixed processes.
Minerals 15 00843 g0a1

Appendix C

Appendix C.1. Regional Geological Settings

The West African Craton (WAC) consists of three main geological units [63]: (i) Archean (3.0–2.7 Ga) and Paleoproterozoic (2.0 Ga) terranes of the Reguibat Shield; (ii) the Kénéna–Man Archean domain and Birimian Paleoproterozoic formations of the Léo–Man Shield (named after the Birim River); and (iii) the Birimian Kédougou–Kéniéba inlier. The Precambrian Léo–Man and Reguibat Shields are separated by the Phanerozoic Taoudeni Basin [24]. In both shields, Archean terranes lie to the west and Paleoproterozoic terranes to the east [64].

Appendix C.1.1. Paleoproterozoic Domains

The WAC in the eastern Man Shield is composed of Paleoproterozoic Birimian formations [63,65,66]. This crust developed in two main geological periods [67] (Figure A2): (i) the lower Birimian (2.2–2.15 Ga), marked by the formation of greenstone belts and tonalite–trondhjemite–granodiorite (TTG) granitoids; and (ii) the Upper Birimian (2.15–1.9 Ga), characterized by the development of volcano-sedimentary basins and the emplacement of leucogranites. Previous studies [68,69,70,71] identified key features of these Paleoproterozoic domains. These features are: (i) juvenile crust with no Archean basement; (ii) pluton emplacement under relatively low water content, with foliation resulting from detachment; (iii) limited crustal thickening, as indicated by the lack of high-grade metamorphic rock exhumation; (iv) regional metamorphism ranging from greenschist to amphibolite facies linked to intrusive events; and (v) an absence of migmatites, except in the far southwest of West Africa. Similar features are observed in other Paleoproterozoic complexes, such as the Guyana Craton [72,73].
Figure A2. Map of the West African Craton with a synthetic cross-section (after [67]).
Minerals 15 00843 g0a2

Appendix C.1.2. Geodynamic Context

The eastern Baoulé-Mossi domain, Reguibat Ridge, and the Kédougou–Kéniéba/Kayes inliers in Mali are primarily of Birimian age [63] (Figure A3 and Figure A4). The Archean and Birimian terranes of West Africa were shaped by the Eburnean orogeny (2.13–1.98 Ga), which produced north–south oriented fault systems. Over 550 Ma ago, an intra-continental rift (the Rockelide Belt) cut across the Guyana and West African cratons, followed by a collision involving the eastern Guyana Craton, resulting in the overthrusting of Rockelide units onto the West African Craton [74]. Paleomagnetic evidence suggests the West African and Guyana cratons formed a single block around 2.02 Ga, later separating during the opening of the Atlantic Ocean [75].
The Birimian tectonic evolution involved three deformation phases: (i) D1—a major collisional phase with west-northwest-directed thrusting and regional shortening, also observed in Guyana [68,72,73], along the margins of the Archean Man Block. D1 reflects the progressive accretion of Paleoproterozoic rocks onto Archean crust, supported by paleomagnetic data [69]; (ii) D2—characterized by sinistral shearing, folding, and granitic pluton emplacement. This phase shaped the structural framework of the Tarkwaian Basin [70]; (iii) D3—a dextral shearing phase reflecting a shift to NE-SW convergence. D2 and D3 are often grouped [68,70]. D2 also facilitated hydrothermal fluid circulation, resulting in stratiform gold mineralization [68,76,77]).
Figure A3. Location map of the Kédougou–Kéniéba Inlier within the West African Craton (upper right corner) (a) Schematic representation of major Precambrian inliers (simplified from [78]): (1) Boundaries of the West African Craton. (2) Post-Paleozoic cover. (3) Neoproterozoic and Paleozoic units. (4) Pan-African and Hercynian belts. (5) Lower Proterozoic. (6) Archean. (b) Simplified geological map of the West African Craton (modified from [23]). (main map) (1) Major D2 shear zones. (2) Neoproterozoic and Paleozoic units. (3) Dialé and Daléma Supergroups. (4) Carbonate formations. (5) Calc-alkaline volcanic rocks. (6) Saraya and Badon-Kakadian batholiths. (7) Boboti clinopyroxene-bearing granitoid. (8) Mako Supergroup.
Minerals 15 00843 g0a3
Two major orogenic events shaped the Precambrian West African Craton (WAC) [24]: (i) the Liberian orogeny (2.6–2.9 Ga), which affected Archean terranes in the Reguibat and Leo (Kenéma–Man) ridges, and (ii) the Eburnean orogeny (2.2–1.6 Ga), which reactivated Birimian terranes across the Baoulé-Mossi domain including Guinea; southern Mali; Côte d’Ivoire; Ghana; Burkina Faso; Niger; and northern Togo. It also affected the Kayes and Kédougou–Kéniéba inliers and the eastern Reguibat Ridge (Yetti–Eglab domain).

Appendix C.1.3. Lithostratigraphy

From bottom to top, the Birimian sequence comprises metavolcanic rocks and metasediments deposited synchronously [19,79,80,81]. Sm/Nd geochronology suggests the metasediments formed from the pene-contemporaneous erosion of the metavolcanic rocks [19]. Two dating methods yielded consistent ages for the metasediments: 2152 ± 6 Ma (U-Pb zircon dating) and 2155 ± 9 Ma (Sm/Nd zircon dating) [82]. Similar ages have been reported in the Kumasi Basin, northwest of the Ashanti Belt in Ghana [83].
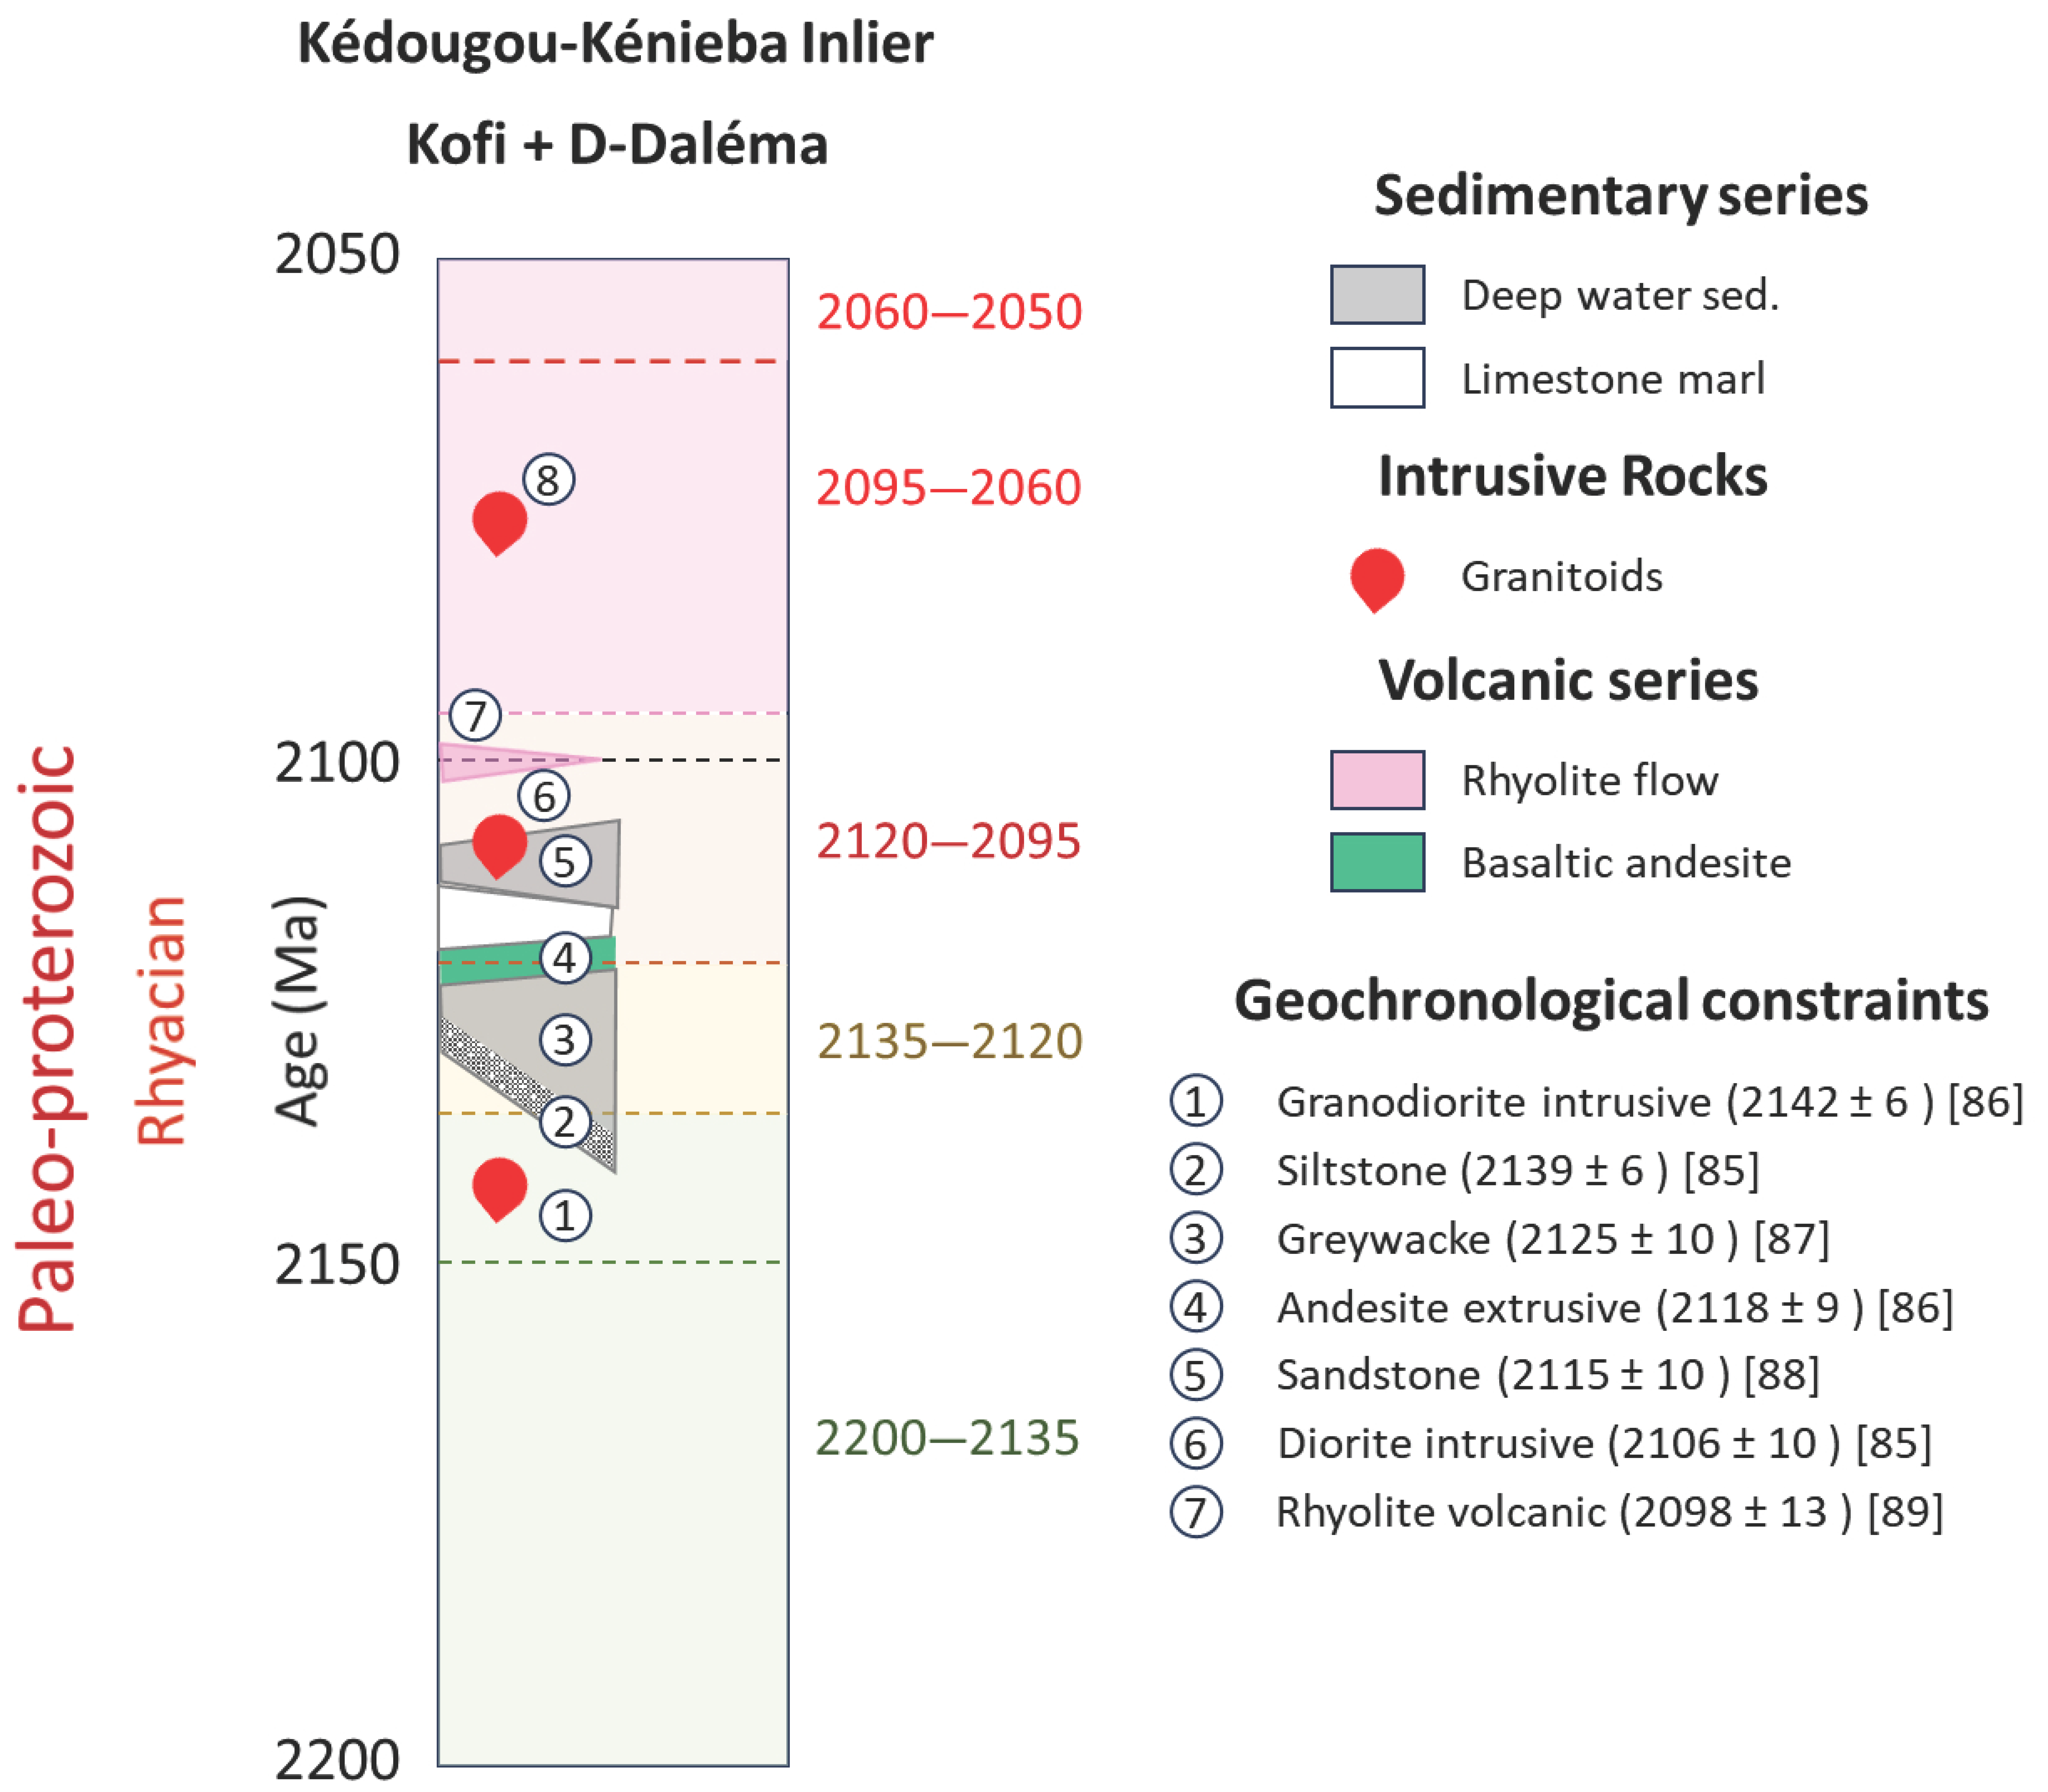
Figure A4. Schematic stratigraphic evolution (modified from [84,85,86,87,88,89]) of the Kédougou–Kénieba Inlier at Kofi (Mali) and the Dialé–Daléma Series (Senegal), illustrating geosynclinal development. The sequence begins with volcanic intrusions, followed by clastic sedimentation interbedded with volcaniclastic rocks, overlain by limestone and sandstone, and locally capped by fluvio-deltaic deposits. It ends with diorite and rhyolite intrusions [87]. Background colors represent a time-slice stratigraphic framework for Paleoproterozoic units, with age intervals shown to the right of the column.
Minerals 15 00843 g0a4
According to Adadey et al. [90], the Birimian is subdivided into two groups: (i) the Sefwi Group (2195–2170 Ma), composed of mica schists (mainly quartz-muscovite-biotite, with rare garnet) and metavolcanic rocks; and (ii) the Kumasi Group, deposited after 2150 Ma, consisting of metasediments interbedded with andesitic layers dated at 2142 ± 24 Ma (U-Pb zircon dating) and intruded by the Suhuma granodiorites, dated at 2136 ± 19 Ma (U-Pb zircon dating) [90]. The Kumasi Group also includes metasediments, volcanic rocks, and locally graphite-rich phyllites. The formation of the Gondwana supercontinent began with the Eburnean convergence of the Guyana and West African Cratons, marking the onset of the Birimian tectonic evolution of the West African Craton.
The initial geosynclinal evolution model proposed for the Birimian formations of the WAC, particularly in Senegal [91,92] and Mali, suggested an early emplacement of volcanic rocks followed by the deposition of clastic sediments. This interpretation was primarily based on structural evidence. Milési et al. [65] and Ledru et al. [66] identified a lower Birimian flysch-type unit (B1), the Kofi and Dialé–Daléma series, affected by three main Eburnean tectono-metamorphic phases (D1 to D3), overlain by an upper volcanic unit (B2) with intercalated fluvio-deltaic deposits, affected only by the latter two phases (D2-D3) [91].
However, recent geochronological data have challenged this model. U-Pb dating of detrital zircon grains from the Kofi metasedimentary series constrains the maximum depositional age to between 2115 and 2098 Ma [65,88,91] (Figure A2). In Senegal, new U-Pb ages [89], combined with magnetic and gravimetric analyses, suggest that the volcanic Mako Belt predates the Dialé–Daléma metasedimentary series, which records D1 and D3 structures [93,94,95], contradicting the model proposed by Ledru et al. [66].

Appendix C.1.4. Gold Mineralization of the West African Craton

The majority of gold deposits in West Africa are located within greenstone belts [64], which are regionally metamorphosed to greenschist and amphibolite facies around granitoid intrusions [96].
The host rocks of gold deposits vary by location and are generally classified into three main lithological series: Mako, Kéniébandi, and Kofi [97]. These series have the following characteristics: (i) The Dialé–Daléma Series (Paleoproterozoic) consists of folded sandstones, metagraywackes, siltstones (metapelites), and metacarbonates intercalated with calc-alkaline volcanic units [97,98]. They are considered the youngest series. (ii) The Mako Series comprises siliciclastic rocks containing detrital zircons [21,98]. (iii) The Falémé Series, bounded to the east by the Kédougou–Kéniéba Inlier, includes rare sedimentary rocks, basalts, and minor andesites and rhyolites [13,24,97,99].
Gold mineralization broadly coincides with major magmatic and tectonic events [13,68,69,70]. Goldfarb et al. [1] identified seven global peaks in gold deposit formation in the following eras: (i) Mesoarchean (15 Moz), (ii) Neorchaean (740 Moz), (iii) Paleoproterozoic (300 Moz), (iv) Meso-/Neoproterozoic (140 Moz), (v) Paleozoic (470 Moz), (vi) Mesozoic (460 Moz), and (vii) Cenozoic (380 Moz). In West Africa, most gold deposits are Paleoproterozoic in age.
Mineralization Related to Magmatic Accretion
Mineralization associated with magmatic accretion is observed at the Loulo deposit (Mali) and is attributed to the Eburnean orogeny, likely around 2072 ± 7 Ma (207Pb/206Pb zircon age from crosscutting dolerite dikes [65]) and 2098 ± 11 Ma (minimum detrital U-Pb zircon age from tourmalinized sandstones [22]). According to previous works [13,69,99], this mineralization developed during tectonic extension of sedimentary basins, driven by hydrothermal fluid circulation through fractures and surrounding rocks. A syngenetic tourmaline-gold event likely occurred during this period.
Mineralization Related to Tectonic Accretion
Tectonic accretion-related mineralization, dated between 1945 and 2080 Ma [70], represents the most economically significant gold phase in West Africa. These gold occurrences are discordant and linked to brittle deformation during the late D2 and D3 orogenic phases [77]. Hydrothermal events, driven by plutonism (~2105 Ma) and metamorphism, facilitated fluid migration along faults and fractures, concentrating minerals in structural traps [64,76]. The resulting disseminated arsenopyrite-rich gold mineralization is often crosscut by quartz veins containing native gold. In the lower Birimian (B1), quartz and carbonate-hosted mineralization is also found at the Syama mine in Mali [100], typically associated with tholeiitic volcanic rocks.

Appendix C.1.5. Classification of Gold Deposits in West Africa

Numerous studies have investigated the characterization of West African gold deposits. Milési et al. [79] classified them into three types: (i) Type 1—Pre-orogenic deposits: stratiform types associated with extensional settings [65]; (ii) Type 2—Syn-orogenic deposits (combining former Types 2 and 3 of Milési et al. [65]): including disseminated gold-sulfide mineralization in metavolcanics and metadiorites, as well as paleo-placer gold in the Tarkwaian conglomerates, formed during extensional phases; (iii) Type 3—Post-orogenic deposits: discordant mesothermal gold mineralization, representing the most economically significant type.
This classification was later simplified in the context of Ghana into two main types [76,80]: (i) Type 1: disseminated sulfide or gold-sulfide ores; (ii) Type 2: gold-bearing quartz veins. Type 2 deposits, characterized by quartz veining, generally offer better economic prospects than Type 1 due to (i) structurally controlled hydrothermal mineralization contemporaneous with the Eburnean tectono-thermal event (~2.0 Ga) [64,76], and (ii) the potential coexistence of both types in the same field, as observed at Loulo (Mali) and Inata (Burkina Faso).

References

  1. Goldfarb, R.J.; Groves, D.I.; Gardoll, S. Orogenic gold and geologic time: A global synthesis. Ore Geol. Rev. 2001, 18, 1–75. [Google Scholar] [CrossRef]
  2. Kohanpour, F.; Lindsay, M.D.; Occhipinti, S.; Gorczyk, W. Structural controls on Proterozoic nickel and gold mineral systems identified from geodynamic modelling and geophysical interpretation, east Kimberley, Western Australia. Ore Geol. Rev. 2018, 95, 552–568. [Google Scholar] [CrossRef]
  3. Camara, N.; Royer, J.J. 3D Modeling and Mineral Resources Estimation of the Kofi Birimian Gold deposit, Zone C, Mali. In Proceedings of the 13th Biennial SGA Meeting, Nancy, France, 24–27 August 2015; pp. 1–4. [Google Scholar]
  4. Hervé, M.; Moyen, J.F. Secular changes in TTG composition as markers of the progressive cooling of the Earth. Geology 2002, 30, 319–322. [Google Scholar]
  5. Condie, T.C.; Des Marais, D.J.; Abbott, D. Precambrian superplumes and super-continents: A record black shales, carbon isotopes and paleoclimates. Precambrian Res. 2001, 106, 239–260. [Google Scholar] [CrossRef]
  6. Peck, W.H.; Valley, J.W. Archean environment. In Encyclopedia of Paleoclimatology and Ancient Environments; Gornitz, V., Ed.; Encyclopedia of Earth Sciences Series; Springer: Dordrecht, The Netherlands, 2009; pp. 34–38. [Google Scholar] [CrossRef]
  7. Groves, D.I.; Condie, K.C.; Goldfarb, R.J.; Hronsky, J.M.M.; Vielreicher, R.M. Secular changes in gold tectonic processes and their influence on the temporal distribution of gold-bearing mineral deposits. Econ. Geol. 2005, 100, 203–224. [Google Scholar] [CrossRef]
  8. Prokofiev, V.Y.; Naumov, V.B. Physicochemical parameters and geochemical features of ore-forming fluids for orogenic gold deposits throughout geological time. Minerals 2020, 10, 50. [Google Scholar] [CrossRef]
  9. Evans, K.A.; Tomkins, A.G. Metamorphic fluids in orogenic settings. Elements 2020, 16, 381–388. [Google Scholar] [CrossRef]
  10. Goldfarb, R.J.; Pitcairn, I. Orogenic gold: Is a genetic association with magmatism realistic? Miner. Depos. 2023, 58, 5–35. [Google Scholar] [CrossRef]
  11. Hrstka, T.; Dubessy, J.; Zachariáš, J. Bicarbonate-rich fluid inclusions and hydrogen diffusion in quartz from the Libčice orogenic gold deposit, Bohemian Massif. Chem. Geol. 2011, 281, 317–332. [Google Scholar] [CrossRef]
  12. Cepedal, A.; Fuertes-Fuente, M.; Martin-Izard, A.; Aragon, D.; Martinez, N.; Arias, D. Constrains on gold metallogeny in NW Iberia: Insights from LA-ICP-MS analysis of trace elements, fluid inclusions, and stable isotopes in the unexplored Portas del Sil gold deposit. Ore Depos. Rev. 2024, 169, 106077. [Google Scholar] [CrossRef]
  13. Lawrence, D.M.; Treloar, P.J.; Rankin, A.H.; Harbidge, P.; Holliday, J. The geology and mineralogy of the Loulo Mining District, Mali, West Africa: Evidence for two distinct styles of orogenic gold mineralization. Econ. Geol. 2013, 108, 199–227. [Google Scholar] [CrossRef]
  14. IAMGOLD. 2012. Available online: https://www.iamgold.com/French/exploitations/previsions/default.aspx (accessed on 27 July 2025).
  15. Loulo Gold Mine. 2012. Available online: https://www.barrick.com/English/home/default.aspx (accessed on 27 July 2025).
  16. Endeavour Mining. 2012. Available online: https://www.endeavourmining.com/ (accessed on 27 July 2025).
  17. Avion Gold. Inc. Technical Report and Updated Resource Estimate on the Kofi Project, Mali, Africa for Avion Gold Corp. Technical Report Kayes; PM Report; Avion Gold: Toronto, ON, Canada, 2012; p. 155. [Google Scholar]
  18. Dabo, M.; Aïfa, T. Structural styles and tectonic evolution of the Kolia-Boboti sedimentary basin, Kédougou-Kéniéba inlier, eastern Senegal. Comptes Rendus Geosci. 2010, 342, 796–805. [Google Scholar] [CrossRef]
  19. Taylor, P.N.; Moorbath, S.; Leube, A.; Hirdes, W. Early Proterozoic crustal evolution in the Birimian of Ghana: Constraints from geochronology and isotope geochemistry. Precambrian Res. 1992, 56, 97–111. [Google Scholar] [CrossRef]
  20. Hirdes, W.; Davis, D.W.; Lüdtke, G.; Konan, G. Two generations of Birimian (Paleoproterozoic) volcanic belts in northeastern Côte d’Ivoire (West Africa): Consequences for the Birimian controversy. Precambrian Res. 1996, 80, 173–191. [Google Scholar] [CrossRef]
  21. Abouchami, W.; Boher, M.; Michard, A.; Albarède, F. A major 2.1 Ga old event of mafic magmatic in West Africa: An early stage of crustal accretion. J. Geophys. Res. 1990, 95, 17605–17629. [Google Scholar] [CrossRef]
  22. Boher, M.; Abouchami, W.; Michard, A.; Albarède, F.; Arndt, N.T. Crustal growth in West Africa at 2.1 Ga. J. Geophys. Res. 1992, 97, 345–369. [Google Scholar] [CrossRef]
  23. Bassot, J.P. Etude géologique du Sénégal oriental et de ses confins guinéo-maliens. Mémoires BRGM 1966, 40, 332. (In French) [Google Scholar]
  24. Dammanget, A.; Diallo, L.; Guilloux, L.; Milési, J.P. Le Gisement de Loulo (Mali): Un Exemple de Concentration Aurifère Stratiforme Dans des Grès à Tourmaline du Birrimien de l’Afrique de l’Ouest; CIFEG Publication: Orleans, France, 1986; pp. 13–130. (In French) [Google Scholar]
  25. N’diaye, P.M.; Dia, A.; Vialette, Y.; Diallo, D.P.; Ngom, P.M.; Sylla, M.; Wade, S.; Dioh, E. Données topographiques, géochimiques et géochronologiques nouvelles sur les granitoïdes du Paléoprotérozoïque du Supergroupe de Dialé–Daléma (Sénégal Oriental): Implications pétro-génétiques et géodynamiques. J. Afr. Earth Sci. 1997, 25, 193–208. (In French) [Google Scholar] [CrossRef]
  26. Koné, A.Y.; Nasr, I.H.; Traoré, B.; Amiri, A.; Inoubli, M.H.; Sangaré, S.; Qaysi, S. Geophysical contributions to gold exploration in Western Mali according to airborne electromagnetic data interpretations. Minerals 2021, 11, 126. [Google Scholar] [CrossRef]
  27. Lefeuvre, N.; Truche, L.; Donzé, F.-V.; Vandenborre, J.; Gaucher, E.C.; Magnin, V. The contribution of mechanoradical reactions to crustal hydrogen generation. Earth Planet. Sci. Lett. 2025, 660, 119363. [Google Scholar] [CrossRef]
  28. Dejonghe, L.; Demaiffre, D.; Gorzawski, H. Géochimie isotopique (C, O, Sr) des dolomies frasniennes du Massif de Philippeville (Synclinorium de Dinant, Belgique). Ann. Soc. Géol. Belg. 1989, 112, 87–102. (In French). Available online: https://popups.uliege.be/0037-9395/index.php?id=990 (accessed on 27 July 2025).
  29. Fontboté, L.; Amstutz, G.C.; Cardozo, M.; Cedillo, E.; Frutos, J. (Eds.) Stratabound ore deposits in the Andes. In Special Publication of the Society for Geology Applied to Mineral Deposits; Springer: Berlin/Heidelberg, Germany, 1990; Volume 8, 815p, Available online: https://link.springer.com/book/10.1007/978-3-642-88282-1 (accessed on 27 July 2025).
  30. Cathelineau, M. Cation site occupancy in chlorites and illites as a function of temperature. Clay Miner. 1988, 23, 471–485. [Google Scholar] [CrossRef]
  31. Jowett, E.C. Fitting Iron and Magnesium Into the Hydrothermal Chlorite Geothermometer. In Proceedings of the Geological Association of Canada + MAC + SEG Joint Annual Meeting, Toronto, ON, USA, 1991; Volume Program with Abstracts 16. p. A62. [Google Scholar]
  32. De Caritat, P.; Hutcheon, I.; Walshe, J. Chlorite geochemistry: A review. Clays Clay Miner. 1993, 41, 219–239. [Google Scholar] [CrossRef]
  33. Klein, E.L.; Koppe, J.C. Chlorite geothermometry and physicochemical conditions of gold mineralization in the Paleoproterozoic Caxias Deposit, São Luȋs Craton, Northern Brazil. Geochim. Bras. 2000, 14, 219–232. [Google Scholar]
  34. Vidal, O.; Parra, T.; Trotet, F. A thermodynamic model for Fe-Mg aluminous chlorite using data from phase equilibrium experiments and natural pelitic assemblages in the 100° to 600 °C, 1 to 25 kb Range. Am. J. Sci. 2001, 301, 557–592. [Google Scholar] [CrossRef]
  35. Bourdelle, F.; Parra, T.; Christian Chopin, C.; Beyssac, O. A new chlorite geothermometer for diagenetic to low-grade metamorphic conditions. Contrib. Mineral. Petrol. 2013, 165, 723–735. [Google Scholar] [CrossRef]
  36. Henry, D.J.; Guidotti, C.V.; Thomson, J.A. The Ti-saturation surface for low-to-medium pressure metapelitic biotites: Implications for geothermometry and Ti-substitution mechanisms. Am. Mineral. 2005, 90, 316–328. [Google Scholar] [CrossRef]
  37. Massonne, H.J.; Schreyer, W. Phengite geobarometry based on the limiting assemblage with K-feldspar, phlogopite, and quartz. Contrib. Mineral. Petrol. 1987, 96, 212–224. [Google Scholar] [CrossRef]
  38. Kretschmar, U.; Scott, S.D. Phase relations involving arsenopyrite in the system Fe-As-S and their application. Can. Mineral. 1976, 14, 364–386. [Google Scholar]
  39. Nayak, B.; Sindern, S.; Wagner, T. Formation of late-stage hydrothermal mineralization in the Mesoarchean Boula-Nuasahi ultramafic complex, Odisha, India: Constraints from arsenopyrite geothermometry and trace element data. Ore Geol. Rev. 2021, 139, 104482. [Google Scholar] [CrossRef]
  40. Fridovsky, V.Y.; Polufuntikova, L.I.; Kudrin, M.V. Origin of Disseminated Gold-Sulfide Mineralization from Proximal Alteration in Orogenic Gold Deposits in the Central Sector of the Yana–Kolyma Metallogenic Belt, NE Russia. Minerals 2023, 13, 394. [Google Scholar] [CrossRef]
  41. Ai Zamruddin, N.N.S.; Zainal Abidin, N.S.; Endut, Z.; Makoundi, C.; Lok, L.K.; Ismail, M.S. Trace Element Analysis of Pyrite and Arsenopyrite Using the LA-ICPMS Technique in Pulai, Central Belt of Peninsular Malaysia. Minerals 2023, 13, 1026. [Google Scholar] [CrossRef]
  42. Wilkinson, B.H.; Kesler, S.E. Tectonic-diffusion estimate of orogenic gold resources. Econ. Geol. 2010, 105, 1321–1334. [Google Scholar] [CrossRef]
  43. Reeder, R.J. Carbonates: Mineralogy and chemistry: Short course notes. In Reviews in Mineralogy; Mineralogical Society of America: Chantilly, VA, USA, 1983; Volume 11, 400p, ISBN 0-939950-15-4. [Google Scholar]
  44. Murzin, V.; Chudnenko, K.; Palyanova, G.; Kissin, A.; Varlamov, D. Physicochemical model of formation of gold-bearing magnetite-chlorite-carbonate rocks at the Karabash Ultramafic Massif (Southern Urals, Russia). Minerals 2018, 8, 306. [Google Scholar] [CrossRef]
  45. Dick, J.M. CHNOSZ: Thermodynamic Calculations and diagrams for geochemistry. Front. Earth Sci. 2019, 7, 180. [Google Scholar] [CrossRef]
  46. Lawrence, D.M.; Lambert-Smith, J.S.; Treloar, P.J. A review of gold mineralization in Mali. In Mineral Deposits of North Africa; Bouabdellah, M., Slack, J., Eds.; Mineral Resource Reviews; Springer: Berlin/Heidelberg, Germany, 2016; pp. 327–351. [Google Scholar] [CrossRef]
  47. Groves, D.I.; Santosh, M.; Zhang, L. A scale-integrated exploration model for orogenic gold deposits based on a mineral system approach. Geosci. Front. 2020, 11, 719–738. [Google Scholar] [CrossRef]
  48. Camara, N.; Jébrak, M. Etude Minéralogique de l’or Dans le Birimien de Kofi. Master’s Thesis, University of Lorraine, Nancy, France, 2013; 53p. (In French). [Google Scholar]
  49. Lawrence, D.M.; Treloar, P.J.; Rankin, A.H.; Boyce, A.; Hardbidge, P. A fluid inclusion and stable isotope study at the Loulo Mining District, Mali, West Africa: Implications for multi-fluid sources in the generation of orogenic gold deposits. Econ. Geol. 2011, 108, 229–257. [Google Scholar] [CrossRef]
  50. Pokrovski, S.; Kokh, M.A.; Guillaume, D.; Borisova, A.Y.; Gisquet, P.; Hazemann, J.L.; Lahera, E.; Del Net, W.; Proux, O.; Testemale, D.; et al. Sulfur radical species form gold deposits on Earth. Proc. Natl. Acad. Sci. USA 2015, 112, 13484–13489. [Google Scholar] [CrossRef]
  51. Yu, H.D.; Fu, Y.Z.; Liu, W.Y.; Said, N.; Cao, H.W.; Liu, C.M.; Fang, W.X.; Liu, J.J.; Zou, H. The gold mineral, systems of the West Qinling orogen, central China: New insight from the Baguamiao gold deposit. Ore Geol. Rev. 2023, 162, 105705. [Google Scholar] [CrossRef]
  52. Gaillard, N.; Williams-Jones, A.E.; Clark, J.R.; Salvi, S.; Perrouty, S.; Linnen, R.L.; Olivo, G.R. The use of lithogeochemistry in delineating hydrothermal fluid pathways. Ore Geol. Rev. 2020, 120, 103351. [Google Scholar] [CrossRef]
  53. Atkins, P.; Jones, L.; Laverman, L. Chemical Principles, 7th ed.; Freeman: London, UK, 2016; pp. 399–461. ISBN 978-1-4641-8395-9. [Google Scholar]
  54. Bellehumeur, C. Application des Techniques Géostatistiques et D’analyse Multivariable à L’interprétation des Relevés Géochimiques Régionaux. Ph.D Thesis, Thèse Université du Québec à Montréal, Chicoutimi, QC, Canada, 1992; 441p. (In French). [Google Scholar]
  55. Saporta, G. Probabilités, Analyse des Données et Statistique Multivariable; Dunod: Malakoff, France, 2006; Volume 2, p. 656. (In French) [Google Scholar]
  56. Paradigm, Reservoir Characterization Petrophysics, Paradigm Training Program. 2022. Available online: https://fr.scribd.com/document/374908678/Reservoir-Characterization-Petrophysics (accessed on 27 July 2025).
  57. Matheron, G. Principles of geostatistics. Econ. Geol. 1963, 58, 1246–1266. [Google Scholar] [CrossRef]
  58. Journel, A.G.; Huijbregts, C.J. Mining Geostatistics. Academic Press: London, UK; New York, NY, USA, 1978; 600p. [Google Scholar]
  59. Mallet, J.L. Geomodeling. In Applied Geostatistics; Oxford University Press: New York, NY, USA, 2002; 624p. [Google Scholar]
  60. Mallet, J.L. Discrete modeling for natural objects. Math. Geol. 1997, 29, 199–219. [Google Scholar] [CrossRef]
  61. Royer, J.J. Cours de Géostatistique Minière; Cours ENSG; University of Lorraine: Nancy, France, 2013; t 1 & 2. (In French) [Google Scholar]
  62. 2022. Available online: https://miningdataonline.com/property/182/Tabakoto-Mine.aspx (accessed on 27 July 2025).
  63. Bessoles, B. Géologie de Afrique: Le craton Ouest-Africain. Mémoires BRGM 1977, 88, 402. (In French) [Google Scholar]
  64. Béziat, D.; Dubois, M.; Debat, P.; Nikiéma, S.; Salvi, S.; Tollon, F. Gold metallogeny in the Birimian craton of Burkina Faso (West Africa). J. Afr. Earth Sci. 2008, 50, 215–233. [Google Scholar] [CrossRef]
  65. Milési, J.P.; Ledru, P.; Dommanget, M.; Johan, V.; Diallo, M. Lower Proterozoic Succession in Senegal and Mali (West Africa): Position of Sediment Hosted Ag and Fe Deposits of Loulo Area and Significance in Terms of Crustal Evolution; Centre International pour la Formation et les Echanges en Géosciences (CIFEG): Orleans, France, 1989; p. 135. [Google Scholar]
  66. Ledru, P.; Pons, J.; Milesi, J.P.; Feybesse, J.L.; Johan, V.B. Transcurrent tectonics and polycyclic evolution in the Lower Proterozoic of Senegal-Mali. Precambrian Res. 1991, 50, 337–354. [Google Scholar] [CrossRef]
  67. Vidal, M.; Gumiaux, C.; Cagnard, F.; Pouclet, A.; Ouattara, G.; Pichon, M. Evolution of a Paleoproterozoic “weak type” orogeny in the west Africa Craton (Ivory Coast). Tectonophysics 2009, 477, 145–159. [Google Scholar] [CrossRef]
  68. Milési, J.P. Vers la Mesure de Potentialités Métallifères, Habilitation à Diriger des Recherches; Claude Bernard University Lyon I: Villeurbanne, France; BRGM: Orléans, France, 2001; 204p. (In French) [Google Scholar]
  69. Feybesse, J.L.; Milési, J.P. The Archaean/Proterozoic contact zone in West Africa: A mountain belt of décollement thrusting and folding on a continental margin related to 2.1 Ga convergence of Archaean cratons? Precambrian Res. 1994, 69, 199–227. [Google Scholar] [CrossRef]
  70. Feybesse, J.L.; Billa, M.; Guerrot, C.; Duguey, E.; Lescuyer, J.L.; Milési, J.P.; Bouchot, V. The Paleoproterozoic Ghanaian province: Geodynamic model and ore controls, including regional stress modeling. Precambrian Res. 2006, 149, 149–196. [Google Scholar] [CrossRef]
  71. Lompo, M. Paleoproterozoic structural evolution of the Man-Leo Shield (West-Africa). Key structures for vertical to transcurrent tectonics. J. Afr. Earth Sci. 2010, 58, 19–36. [Google Scholar] [CrossRef]
  72. Vanderhaeghe, O.; Ledru, P.; Tiéblemont, D.; Egal, E.; Cocherie, A.; Tegyey, M.; Milési, J.P. Contrasting mechanism of crustal growth: Geodynamic evolution of the Paleoproterozoic granite greenstone belts of French Guiana. Precambrian Res. 1998, 92, 165–193. [Google Scholar] [CrossRef]
  73. Théveniaut, H.; Delor, C. Le paléomagnétisme du Bouclier des Guyanes: État des connaissances et analyse critique des données. Géologie Fr. 2003, 2-3-4, 59–82. (In French). Available online: https://geolfrance.brgm.fr/sites/default/files/upload/documents/gf2-2-2003.pdf (accessed on 27 July 2025).
  74. Villeneuve, M.; Cornée, J.J. Structure, evolution and paleogeography of the West African craton and bordering belts during the Neoproterozoic. Precambrian Res. 1994, 69, 307–326. [Google Scholar] [CrossRef]
  75. Nomade, S.; Chen, Y.; Pouclet, A.; Féraud, G.; Théveniaut, H.; Daouda, B.Y.; Vidal, M.; Rigolet, C. The Guiana and the West African shield Paleoproterozoic grouping: New palaeomagnetic data for French Guiana and the Ivory Coast. Geophys. J. Int. 2003, 154, 677–694. [Google Scholar] [CrossRef]
  76. Oberthür, T.; Vetter, U.; Davis, D.W.; Amanor, J.A. Age constraints on gold mineralization and Paleoproterozoic crustal evolution in the Ashanti belt of southern Ghana. Precambrian Res. 1998, 89, 129–143. [Google Scholar] [CrossRef]
  77. Jébrak, M.; Marcoux, E. Géologie des Ressources Minérales; Ressources naturelles et Faune: Québec, QC, Canada, 2008; 667p. (In French) [Google Scholar]
  78. Gueye, M.; Ngom, P.M.; Diène, M.; Thiam, Y.; Siegesmund, S.; Wemmer, K.; Pawlig, S. Intrusive rocks and tectono-metamorphic evolution of the Mako Paleoproterozoic belt (Eastern Senegal, West Africa). J. Afr. Earth Sci. 2008, 50, 88–110. [Google Scholar] [CrossRef]
  79. Milési, J.P.; Ledru, P.; Feybesse, J.L.; Dommanget, A.; Marcoux, E. Early Proterozoic ore deposits and tectonics of Birimian orogenic belt, West Africa. Precambrian Res. 1992, 58, 305–344. [Google Scholar] [CrossRef]
  80. Leube, A.; Hirdes, W.; Mauer, R.; Kesse, G.O. The Early Proterozoic Birimian Supergroup of Ghana and some aspects of its associated gold mineralization. Precambrian Res. 1990, 46, 139–165. [Google Scholar] [CrossRef]
  81. Eisenlohr, B.N.; Hirdes, W. The structural development of the early Proterozoic Birimian and Tarkwaian rocks of southwest Ghana, West Africa. J. Afr. Earth Sci. 1992, 14, 313–325. [Google Scholar] [CrossRef]
  82. Loh, G.; Hirdes, W.; Anani, C.; Davis, D.W.; Vetter, U. Explanatory Notes for the Geological Map of Southwest Ghana 1:100,000, Sekondi (0402A) and Axim (0403B) Sheets; Geological Yearbook, Series B Heft 93; E. Schweizerbart: Stuttgart, Germany, 1999; 150p. [Google Scholar]
  83. Davis, D.W.; Hirdes, W.; Schaltegger, U.; Nunoo, E.A. U-Pb age constraints on deposition and provenance of Birimian and gold-bearing Tarkwaian sediments in Ghana, West Africa. Precambrian Res. 1994, 67, 89–107. [Google Scholar] [CrossRef]
  84. Perret, J.; Jessell, M.W.; Masurel, Q.; Hayman, P.C.; Thébaud, N.; Baratoux, L.; Kouamélan, A.; Eglinger, A.; André-Mayer, A.S.; Koffi, A.Y.; et al. Review of Paleoproterozoic tectonics in the southern West African Craton: Insights from multi-disciplinary data integration. 50th Anniversary. Precambrian Res. 2025, 422, 107707. [Google Scholar] [CrossRef]
  85. Hein, K.A.A.; Matsheka, I.R.; Bruguier, O.; Masurel, Q.; Bosch, D.; Caby, R.; Monié, P. The Yatela gold deposit: 2 billion years in the making. J. Afr. Earth Sci. 2015, 112, 548–569. [Google Scholar] [CrossRef]
  86. Masurel, Q.; Thébaud, N.; Miller, J.; Ulrich, S. The tectono-magmatic framework to gold mineralization in the Sadiola-Yatela gold camp and implications for the paleotectonic setting of the Kédougou-Kénieba inlier, West Africa. Precambrian Res. 2017, 292, 35–56. [Google Scholar] [CrossRef]
  87. Koné, J. Structure et Métamorphisme de la Ceinture Eburnéenne au Sénégal Oriental: Signification en Termes du Contexte Tectonique et de L’évolution Thermomécanique de la Croûte Eburnéenne. Ph.D Thesis, Université de Toulouse III Paul Sabatier, Toulouse, France, Université Cheikh Anta Diop de Dakar, Dakar, Senegal, 2020; 167p. (In French). [Google Scholar]
  88. Allibone, A.H.; Lawrence, D.; Scott, J.; Fanning, M.; Lambert-Smith, J.; Stenhouse, P.; Harbidge, R.; Vargas, C.; Turnbull, R.; Holliday, J. Chapter 7: Paleoproterozoic gold deposits of the Loulo District, western Mali. In Geology of the World’s Major Gold Deposits and Provinces; Society of Economic Geologists: Littleton, CO, USA, 2020; pp. 141–162. [Google Scholar] [CrossRef]
  89. Théveniaut, H.; Ndiaye, P.M.; Buscail, F.; Couëffé, R.; Delor, C.; Fullgraf, T.; Goujou, J.-C. Notice Explicative de la Carte Géologique du Sénégal Oriental à 1/500 000; Ministère des Mines, de l’Industrie, de l’Agro-Industrie et des PME, Direction des Mines et de la Géologie: Dakar, Senegal, 2010. (In French)
  90. Adadey, K.; Clarke, B.; Théveniaut, H.; Urien, P.; Delor, C.; Roig, J.Y.; Feybesse, J.L. Geological Map Explanation—Map Sheet 0503 B (1:100 000); No. MSSP/2005/GSD/5a; Geological Survey Department of Ghana (GSD): Accra, Ghana, 2009. [Google Scholar]
  91. Koné, J.; Vanderhaeghe, O.; Diatta, F.; Baratoux, L.; Thebaud, N.; Bruguier, O.; Ndiaye, P.M.; Duchene, S.; Pitra, P.; Ganne, J. Source and deposition age of the Dialé-Daléma metasedimentary series (Kédougou-Kéniéba Inlier, Senegal) constrained by U–Pb geochronology on detrital zircon grains. J. Afr. Earth Sci. 2020, 165, 103801. [Google Scholar] [CrossRef]
  92. Bassot, J.P. Le complexe volcano-plutonique calco-alcalin de la rivière Daléma (Est Sénégal): Discussion de sa signification géodynamique dans le cadre de l’orogénie éburnéenne (Protérozoïque inferieur). J. Afr. Earth Sci. 1987, 6, 505–519. (In French) [Google Scholar] [CrossRef]
  93. Diallo, M.; Baratoux, L.; Dufréchou, G.; Jessell, M.W.; Vanderhaeghe, O.; Ly, S.; Baratoux, D. Structure of the Paleoproterozoic Kédougou-Kéniéba Inlier (Senegal-Mali) deduced from gravity and aeromagnetic data. J. Afr. Earth Sci. 2020, 162, 103732. [Google Scholar] [CrossRef]
  94. Diatta, F.; Ndiaye, P.M.; Diene, M.; Amponsah, P.O.; Ganne, J. The structural evolution of the Diale-Dalema basin, Kédougou-Kénieba Inlier, eastern Senegal. J. Afr. Earth Sci. 2017, 129, 923–933. [Google Scholar] [CrossRef]
  95. Diallo, M.; Salvi, S.; Baratoux, L.; Béziat, D.; Vanderhaeghe, O.; Labou, I.; Baratoux, D.; Ly, S. Geology of the Tabakoto gold deposit, Kédougou-Kéniéba Inlier, West African Craton, Mali. Bull. Société Géologique Fr. 2024, 195, 24. [Google Scholar] [CrossRef]
  96. Debat, P.; Nikiéma, S.; Mercier, A.; Lompo, M.; Béziat, D.; Bourges, F.; Roddaz, M.; Salvi, S.; Tollon, F.; Wenmenga, U. A new metamorphic constraint for the Eburnean orogeny from Paleoproterozoic formations of the Man shield (Aribinda and Tampelga countries, Burkina Faso). Precambrian Res. 2003, 123, 47–65. [Google Scholar] [CrossRef]
  97. Hirdes, W.; Davis, D.W. U–Pb geochronology of Paleoproterozoic rocks in the southern part of the Kedougou-Kéniéba inlier, Sénégal, West Africa: Evidence for diachronous accretionary development of the Eburnean Province. Precambrian Res. 2002, 118, 83–99. [Google Scholar] [CrossRef]
  98. Bassot, J.P.; Dia, A.; Rocci, G. Lithostratigraphie des Complexes magmatiques de Sandikounda Laminia (Senegal oriental): Données Nouvelles sur le Protérozoïque Inférieur de la Fenêtre de Kédougou. In Proceedings of the 14th Colloquium of African Geology, Berlin, Germany, 18–22 August 1987; p. 46. (In French). [Google Scholar]
  99. Lambert-Smith, J.S.; Lawrence, D.M.; Müller, W.; Treloar, J.P. Paleotectonic setting of the south-eastern Kédougou-Kéniéba Inlier, West Africa: New insights from igneous trace element geochemistry and U-Pb zircon ages. Precambrian Res. 2015, 274, 110–135. [Google Scholar] [CrossRef]
  100. Le Mignot, E.; Reisberg, L.; André-Mayer, A.S.; Bourassa, Y.; Fontaine, A.; Miller, J. Re-Os Geochronological evidence for multiple Paleoproterozoic gold events at the scale of the West African Craton. Econ. Geol. 2017, 112, 145–168. [Google Scholar] [CrossRef]
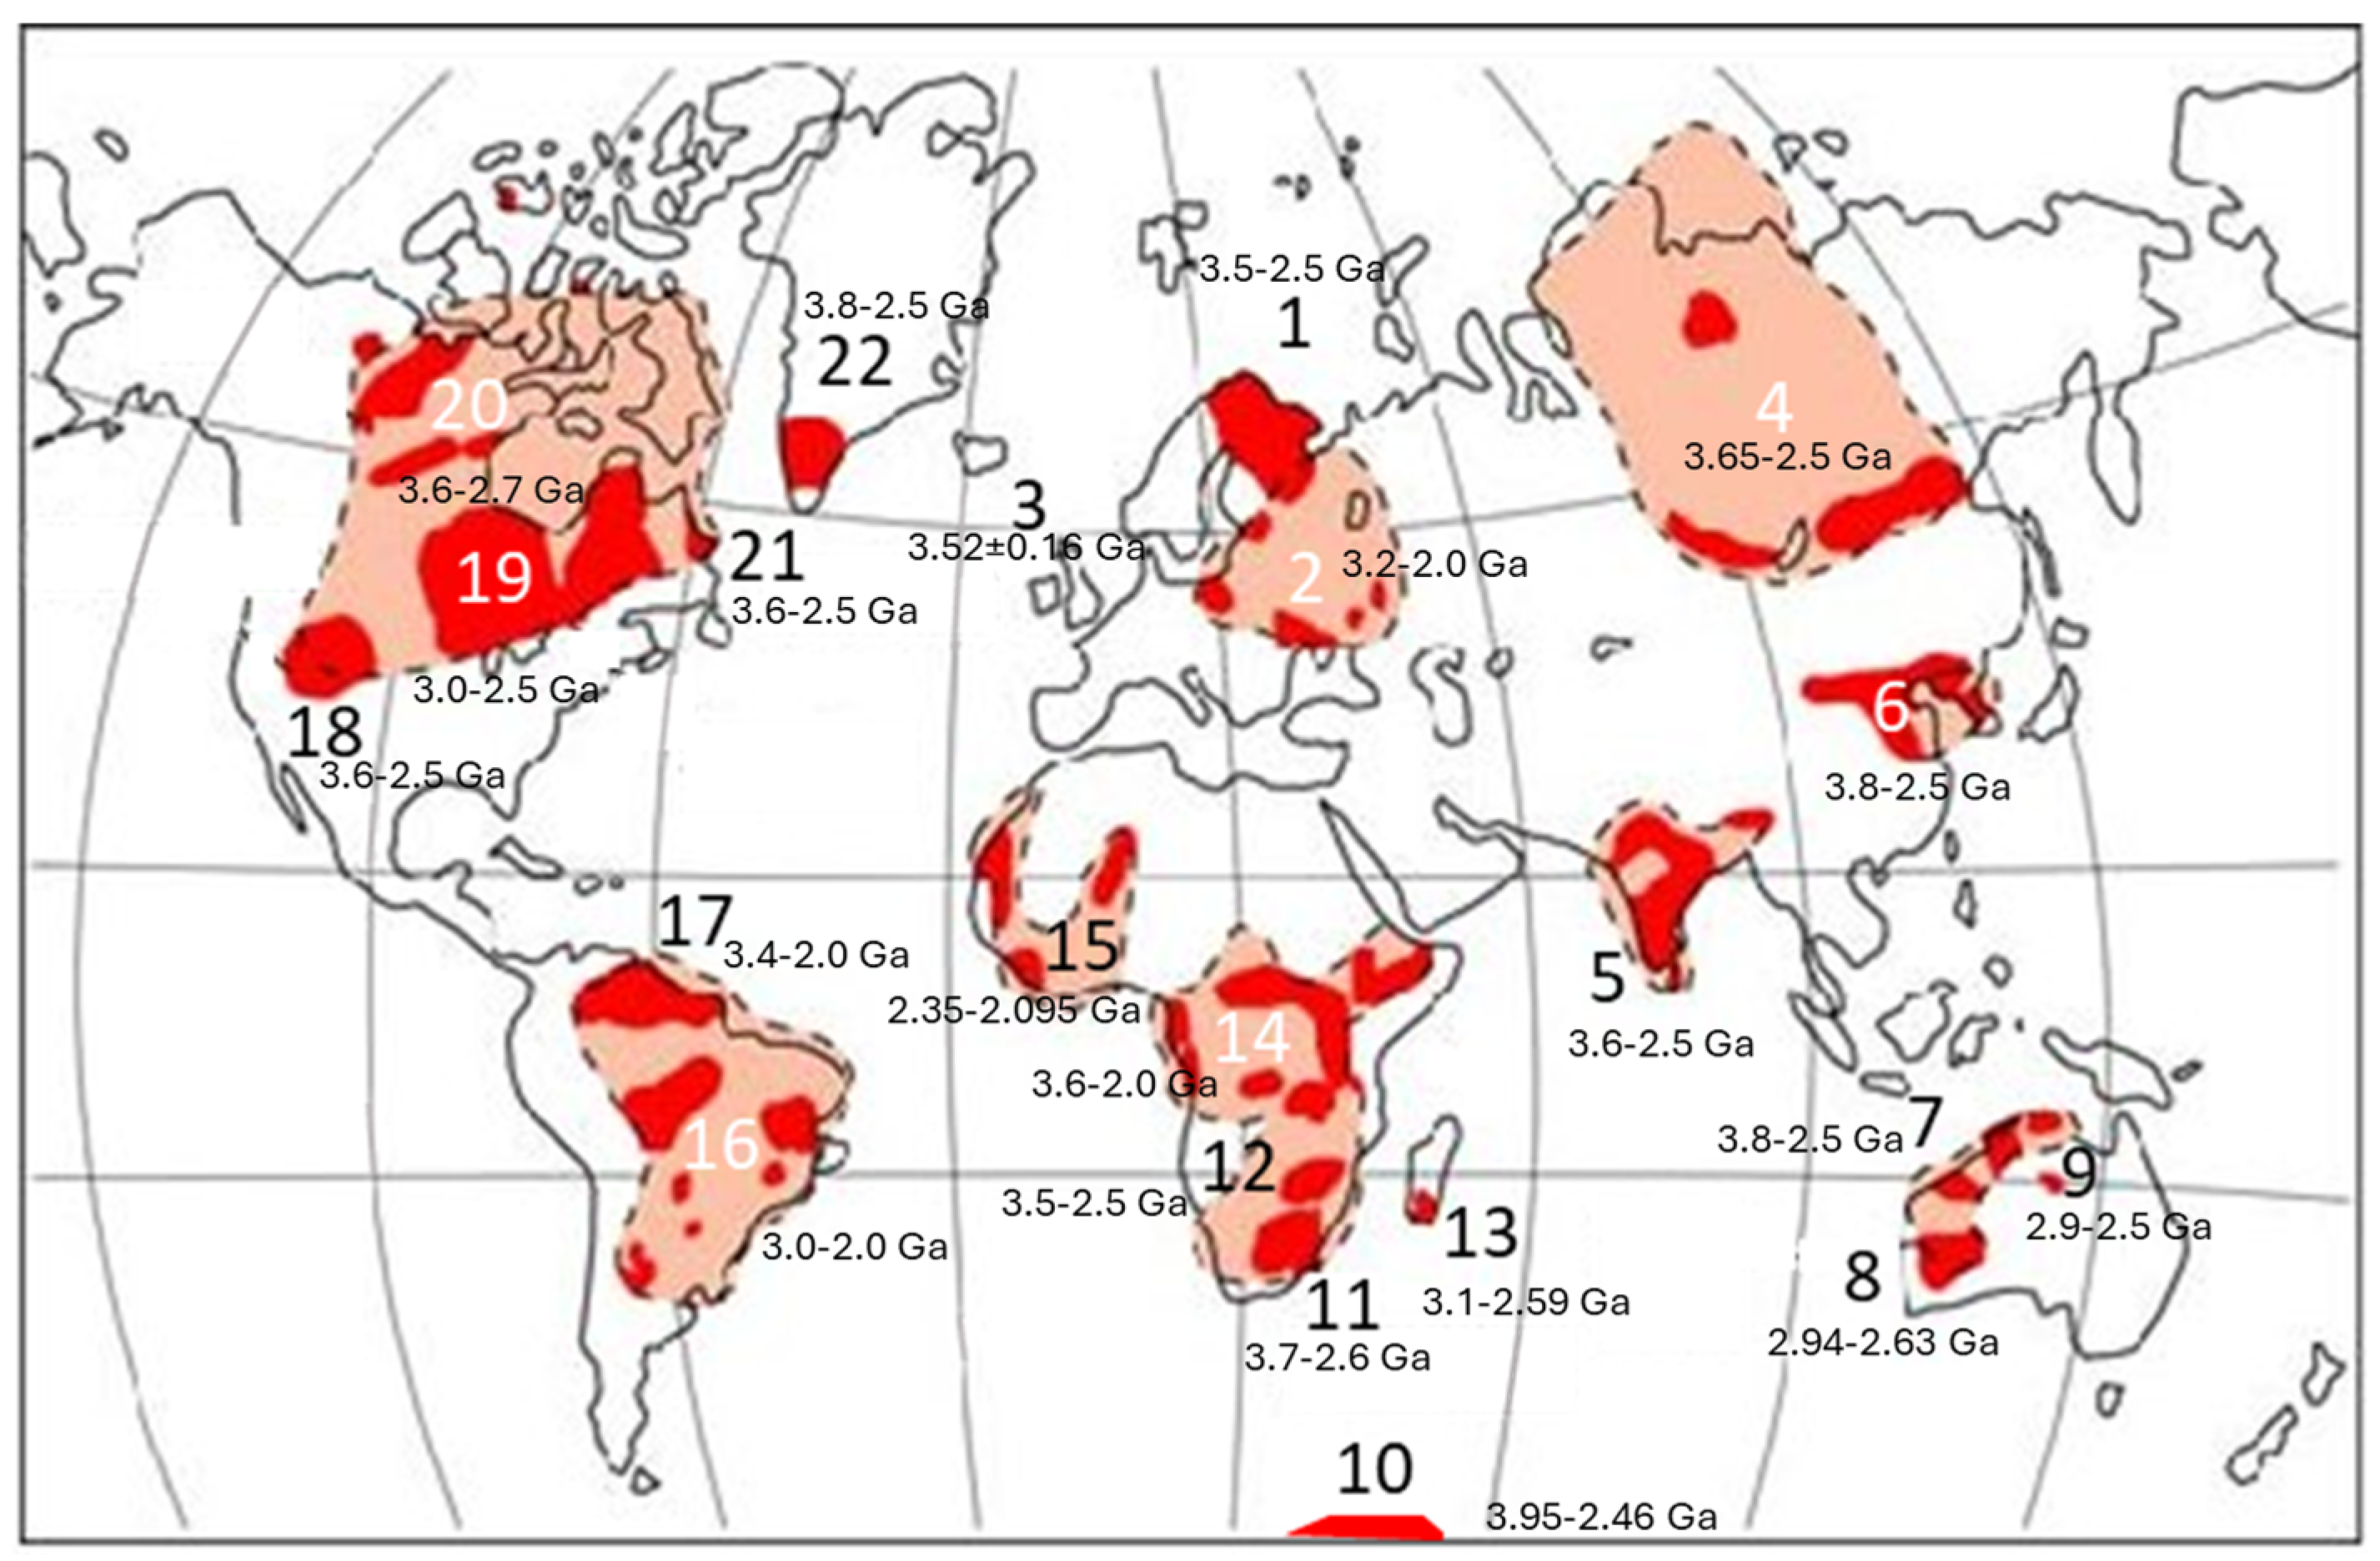
Figure 1. World distribution of major Precambrian provinces and their ages (after [4,5,6]), showing outcropping Archean formations (in red), covered by sedimentary formations (in orange). (1) Baltic Shield; (2) Ukrainian Shield; (3) Scottish Shield; (4) Siberian Shield; (5) Indian Shield; (6) Sino-Korean Shield; (7) Pilbara Craton; (8) Yilgarn Craton; (9) Northern Australia Block; (10) Napier Complex; (11) Kaapalvaal Craton; (12) Zimbabwe Craton; (13) Madagascar Craton; (14) Central Africa Craton; (15) West Africa Shield; (16) Sao Francisco Craton; (17) Guyana Shield; (18) Wyoming Province; (19) Superior Province; (20) Slave Province; (21) Labrador Shield; (22) North Atlantic Craton and Greenland Shield.
Minerals 15 00843 g001
Figure 3. Petrological samples (e.g., K66-70) showing alteration zones (after [3]). Sample depth and geological context are detailed in Appendix A, Table A1. (A): n° K67 Metamorphic rock intruded by a quartz vein (red lines) (146 m depth). (B): n° K70 Various alterations cross-cut by veinlets of sulfides (red circle) (96.8 m depth). (C): n° K66 core sample exhibits (left) conglomerate cut by quartz veins and syenite dykes, (right) with sulfide veinlets (128 m depth).
Minerals 15 00843 g003
Figure 4. n° K72-1 thin sections; reflected light (a) shows deformed and scattered pyrite grains; transmitted light (b) highlights pyrite along fractures (112.5 m depth). Abbreviations: Py: pyrite (after [3]).
Minerals 15 00843 g004
Figure 5. Gold occurrences in thin-section n° K72-3: (A) Disseminated gold in pyrite fractures. (B) Disseminated gold within pyrite. (C) Gold inclusions in pyrite. (D) Gold in electrum. Abbreviations: Au, gold; Py, pyrite; AsPy, arsenopyrite (after [3]). n° K72-3 thin section (SEM analyses) (112.5 m depth).
Minerals 15 00843 g005
Figure 7. Simplified stability field diagrams showing conditions under which calcite, magnesite, siderite, and rhodochrosite are likely to precipitate or remain stable in hydrothermal environments typical of gold-bearing systems. (a) T-XCO2 space: illustrates how temperature and CO2 content control carbonate deposition. (b) T-pH space: calcite dominates at higher pH and lower temperatures; siderite and magnesite are stable at moderate pH and elevated temperatures; rhodochrosite favors near-neutral to slightly acidic pH at intermediate temperatures. (c) T-P space: pressure has minimal influence on most carbonates, except rhodochrosite, whose solubility at ~220 °C and 2 kbar is moderate; cooling, pressure drops, or shifts in CO2 or pH promote its precipitation.
Minerals 15 00843 g007
Figure 8. Scheme for gold deposition (picture modified after [51]).
Minerals 15 00843 g008
Figure 9. (a) Geological map of the study area. (b) Lithologies distribution with depth.
Minerals 15 00843 g009
Figure 10. Log-scale plots comparing average element concentrations in the full dataset (11,980 samples) and in mineralized gold zones (780 samples).
Minerals 15 00843 g010
Figure 11. Log-scale plots comparing average element concentrations for the entire prospect and mineralized zones at two gold cut-offs (0.5 g/t and 5 g/t Au), showing enrichment in Fe, Li, Bi, Mn, Ni, Sb, Mg, Na, Co, Be, Pb, Mo, Ca, Cu, Cd, Sr, As, and V (780 samples).
Minerals 15 00843 g011
Figure 12. (a) Histogram: As, Fe, and Mn follow log-normal distributions with a single population; Cu, Zr, and Sr exhibit bimodal distributions. (b) Correlation diagrams of selected elements.
Minerals 15 00843 g012
Figure 13. (a) Linear correlations between principal components and original variables. (b) PCA correlation diagrams. Top: 2D circular; bottom: 3D spherical, where variables are correlated when close, anti-correlated when opposite about the center, and uncorrelated when orthogonal.
Minerals 15 00843 g013
Figure 14. Variograms calculated on the log10 scale for Sr, Ag, and PCA-derived factors. Sr, Ag, and F2 (alteration) show isotropic spatial ranges of approximately a ≈ 40 m; F1 (lithology), a ≈ 45 m; and F3 (mineralization) a ≈ 75 m. F1, F2, and F3 variograms exhibit a nugget effect at the origin.
Minerals 15 00843 g014
Figure 15. (a) Log-normal cumulative distribution (red) was fitted to Au data (blue). (b) Spherical variogram of Log10-transformed gold (Au). Gold mineralization is isotropic, with a range of approximately a ≈ 60 m and no nugget effect at the origin.
Minerals 15 00843 g015
Figure 16. Left to right: Circular diagrams comparing ranges (in meters), sills (C), and nugget effects (C0) in log scale for geochemical variograms at the Kofi prospect.
Minerals 15 00843 g016
Figure 17. (Left): 3D block model (top view) for antimony (Sb). Numbers indicate target in descending order. Bluish-green horizontal lines represent drillholes; red contours indicate outcropping mineralization. (Right): Same representation for barium (Ba).
Minerals 15 00843 g017
Figure 18. Three-dimensional block model for Ag, Zn, Na, B, Hg, Cu, Pb, and Au. Numbers indicate target volumes in descending order. Bluish-green horizontal lines represent boreholes; red contours indicate surface mineralization. Bottom-right view shows gold mineralization from a southern perspective.
Minerals 15 00843 g018
Figure 19. Top view (1st column) and 3D block model (2nd column) for sulfur (S) and iron (Fe) indicating the presence of pyrite or arsenopyrite; bluish-greenish horizontal lines represent drillholes; red contours indicate surface mineralization.
Minerals 15 00843 g019
Figure 20. Gold cut-off grade diagrams: (a) Average production grade (g/t, red) and in situ gold tonnage (t, blue) vs. cut-off grade; (b) Expected gains (blue) at gold prices of 1750 USD/oz (08/03/2022) and 3320 USD/oz (04/28/2025). Dotted lines represent sixth-order polynomial fits to the cut-off grade and cut-off metal curves (see coefficients in Appendix A, Table A16).
Minerals 15 00843 g020
Table 1. Tonnage and grade of some major gold deposits in Mali [3].
DepositsTonnage (Mt)Grade (g/t)SourceComments
Sadiola22.303.30[14]AngloGold Ashanti Mali
Yatéla7.601.40[14]Proven and probable resources
Loulo39.974.93[15]Proven and probable resources
Tabakoto4.404.60[16]Proven and probable resources
Table 2. Arsenopyrite geothermometers fitted using cubic polynomials: T ° C   =   i = 0 3 a i A s i .
Equilibrium
Curve
a0a1a2a3R2
asp + py + As−6430525−14.00.13411
±e 126622387.00.0695
asp + py−17,2801430−39.10.36610.999
±e27702457.20.0700
1 fitted error on coefficients.
Table 3. Reserves inferred using various estimation methods, where Qore and Qmet are the ore and metal quantities, σes is the kriging-estimated standard deviation, SGS denotes Sequential Gaussian Simulation, and Avon refers to company-reported reserves.
MethodQoreQmetQmetGradeGradeGain 1
(Mt)(t)(Moz)(g/t)(oz/t)20222025
Kriging1.298.200.2896.360.22110.2501.8
±σes0.060.410.010.320.015.525.1
SGS0.715.240.1687.380.2670.4320.7
Avon2.478.60.3033.500.12
1 In MUSD, calculated as in situ metal value minus operational costs for a cut-off Au at 4 g/t.
Disclaimer/Publisher’s Note: The statements, opinions and data contained in all publications are solely those of the individual author(s) and contributor(s) and not of MDPI and/or the editor(s). MDPI and/or the editor(s) disclaim responsibility for any injury to people or property resulting from any ideas, methods, instructions or products referred to in the content.