Abstract
Gravity exploration, an Earth science method leveraging gravitational field variations due to density differences in geological structures, is a pivotal tool for subterranean investigation due to its cost-effectiveness and efficient data acquisition. This study focuses on potash, a vital agricultural resource, which forms low-density geological deposits manifesting gravitational anomalies. The research delineates favorable regions for potash enrichment within an exploration zone in Laos, utilizing gravity data, geological information, drilling records, and insights into mineralization mechanisms. The study employed analytic continuation, residual anomaly calculation, and vertical derivative analysis to interpret anomalies and identify low-density potash targets. Apparent density calculations revealed significant variations at different depths. Fault identification using integrated methods identified 16 fault lines, predominantly north–south and northeast oriented. Primary potash targets are in the northeastern and northwestern parts, with secondary targets in the central-western and southeast regions. The study acknowledges limitations such as potential field ambiguity, restricted resolution, and scarce geological data. It recommends integrating other geophysical methods, denser exploration grids, and prompt drilling for verification to refine interpretations and improve understanding, laying a solid foundation for future exploration.
1. Introduction
Gravity exploration is an Earth science method rooted in the variation in the gravitational field caused by disparities in the density of geological structures at different depths [1,2]. Evolving since the early 20th century, gravity exploration has progressively emerged as a pivotal instrument for understanding and probing the Earth. This is primarily attributed to its proficiency in obtaining subterranean information, its cost-effectiveness, and the seamless efficiency of data acquisition. With the widespread adoption and advancement of computer technology, methods for processing and interpreting gravity data continue to improve. These factors have rendered gravity exploration applicable in various domains, such as oil and gas prospecting, solid mineral resource exploration, regional and deep-seated structural research, geological hazard assessment, and environmental and engineering surveys, among others [3,4,5]. Given the characteristic attribute of gravity fields to transcend through media, gravity exploration exhibits superimposition properties, encompassing both shallow and deep geological structures within its scope [6,7,8,9]. Consequently, the meticulous and efficient processing and interpretation of gravity data bear significant research significance.
Potash, a vital industrial and agricultural resource, finds approximately 95% of its utility in the realm of agricultural fertilizers. It comes in two distinct forms: solid potash and liquid potash. Solid potash, often characterized by its high-grade potassium chloride content, is categorized as a rich ore, while liquid potash typically bears a lower potassium chloride content. The global extraction of potash primarily revolves around solid deposits, mainly focusing on potash salts such as potassium chloride (KCl), with limited attention to carnallite (KCl·MgCl2·6H2O) and liquid potash. Potash deposits, being low-density geological formations, manifest gravitational anomalies within a certain range once their thickness attains a specific scale. Therefore, the study of potash deposits through gravity exploration techniques holds tangible significance, and the processing and interpretation of gravity data concerning potash deposits aid in demarcating regions rich in potash resources [10,11,12,13,14,15,16,17,18].
Laos, strategically situated at the heart of the Greater Mekong Subregion (GMS), boasts a wealth of mineral resources including gold, silver, copper, iron, tin, aluminum, lead, zinc, manganese, coal, salt, and gemstones. The study area is located in the Vientiane Basin of Laos. As a typical representative of the Mesozoic salt-bearing basin group in Southeast Asia, this basin is characterized by thick Mesozoic evaporite strata, providing excellent geological conditions for the formation of potash deposits. Tectonically, the Vientiane Basin is situated in the northwestern part of the Indochina Block, and its complex regional structural features, such as faults and salt anticlines, exert significant control over the occurrence and distribution of potash ore bodies. The potash ore bodies in the study area primarily exist as solid potash with high-grade potassium chloride. The significant density contrast between these potash deposits and their surrounding rocks makes gravity exploration an effective geophysical method for identifying and delineating potash enrichment zones, typically manifesting as local negative gravity anomalies [19,20].
For a long time, China has had a huge demand for potash resources, but its self-sufficiency rate remains low. Therefore, China has actively participated in exploration and cooperation with potash-rich countries like Laos. In the Vientiane area of Laos, despite a series of potash exploration efforts, including preliminary geological surveys and limited drilling verification that confirmed the region’s potash potential, a detailed understanding of the precise spatial distribution characteristics and enrichment patterns of potash ore bodies is still lacking. Previous exploration methods may not have fully utilized the advantages of high-resolution geophysical data for precise delineation of ore bodies in complex geological settings, leading to limited knowledge of specific favorable mineralization zones and affecting the accuracy of subsequent drilling [21].
This study employs gravity data from the potash exploration area and its associated processing and interpretation results to delineate favorable regions for potash enrichment within the exploration zone and speculate on the spatial distribution of the ore body. To address the existing research gaps, this study employs a series of advanced gravity data processing and interpretation techniques. These include potential field separation, anomaly boundary identification, and rapid source imaging, through which favorable potash mineralization zones are predicted. Simultaneously, integrating geological data, drilling records, and insights into the mineralization mechanisms of nearby potash deposits aids in refining gravity data processing and interpretation, reducing ambiguity, and enhancing credibility. It is our hope that the experience gained from this study using gravity exploration techniques for potash discovery will lay a solid foundation for future exploration endeavors.
2. Geological Setting
2.1. Tectonic Location
The study area is situated in the northeastern part of the Vientiane Basin in Laos. The Vientiane Basin itself lies within a triangular region at the northwestern boundary of the Sakon Nakhon Basin, delimited by the Mekong River. In the context of tectonics, the Sakon Nakhon Basin is considered a secondary basin within the Khorat Basin. The Khorat Basin extends across northeastern Thailand and the central region of Laos, with its primary expanse located in Thai territory, while Laos occupies only a smaller portion. In terms of geological positioning, it belongs to the Indochina Plate’s eastern segment [22]. The Indosinian orogeny led to subsidence within the Indochina block, resulting in the Mesozoic rifting that shaped the precursor of the Khorat Basin, known as the Laotian–Thai Mesozoic rift. Subsequently, the central part of the basin was separated by the northwesterly Pampean uplift (an underwater uplift), giving rise to two relatively independent secondary basins: the Ubon Basin in the south and the Sakon Nakhon Basin in the north (refer to Figure 1).
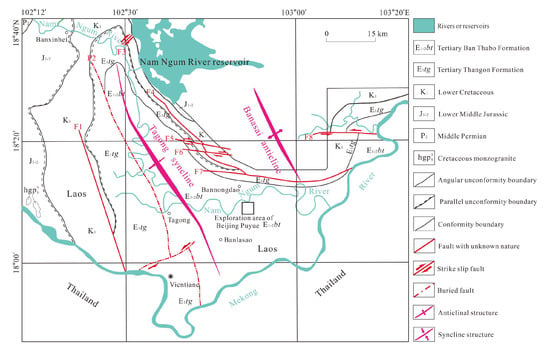
Figure 1.
Regional tectonic sketch and the geographical location of the broader study area [23].
2.2. Regional Tectonics
The Vientiane Basin is situated in the central region of Laos, within the secondary basin of the Sakon Nakhon Basin, demarcated by the Mekong River, covering a total area of approximately 5500 square kilometers (refer to Figure 2). It belongs to the Vientiane-Bachase Microplate within the larger Indochina block and is considered a relatively stable crustal region [24]. The area exhibits well-developed geological strata with no conspicuous signs of magmatic activity or metamorphic processes, rendering its geological structure relatively straightforward. In the Vientiane Sag area, the Triassic strata are primarily composed of a volcanic-clastic rock association (andesite, tuff), marine limestone/dolomite, and evaporite layers. These formed in a back-arc rift and restricted marine basin environment under the Paleo-Tethys oceanic subduction background. The Jurassic strata transition to post-collision stable sedimentation, predominantly characterized by terrestrial clastic rocks (sandstone, mudstone), interbedded with minor bioclastic limestone, reflecting shallow marine or fluvial-lacustrine depositional characteristics. The initial formation of the Vientiane Basin traces back to the later stages of the Yanshan Movement. Subsequently, due to tectonic actions associated with the Papan submarine swell, the basin gradually took on a west-high to east-low gentle sloping configuration. Furthermore, the basin has experienced horizontal stress, resulting in the predominant development of north-northwest-oriented folds, faults, and salt structures.
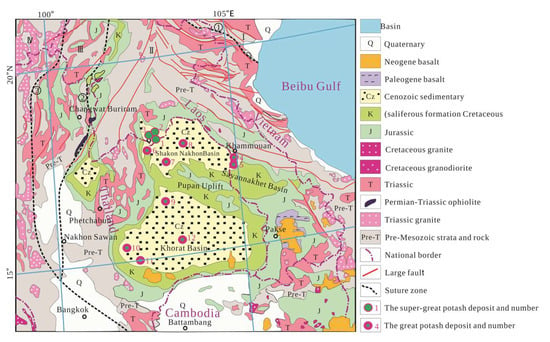
Figure 2.
Geological map of the study area [25].
2.3. Formation Mechanisms of Potash Deposits
The investigation into the formation mechanisms of potash deposits is of paramount importance for comprehending the evolution of salt basins, ancient geography, and paleoclimates, as well as the exploration and exploitation of mineral deposits [26]. Building upon the geophysical, geological, and drilling data obtained during potash exploration in the Vientiane Basin, previous researchers have delved into the salt-forming mechanisms in this region, which holds valuable lessons for exploration activities within this mineral-rich area. In comparison to other types of salt deposits, the formation conditions for potash deposits are considerably demanding, requiring specific geological structural conditions, paleogeographic settings, paleoclimatic conditions, and source material parameters [27]. The Vientiane Basin, where the mining area is situated, lies within the Sakon Nakhon Basin to the north of the Khorat Basin. The southern boundary of the Khorat Basin is delineated by the Phanom Rung Mountains, and it is separated from the alluvial plains formed by the Mekong River’s discharge into the South China Sea and the Mun River’s flow into the Gulf of Thailand. It can be inferred that during the Mesozoic era, the southern part of the Khorat Basin was connected to the sea, allowing seawater to enter from the south [28]. However, the Papan Uplift isolated the Sakon Nakhon Basin from seawater, restricting oceanic circulation and creating favorable conditions for potash deposition in this closed environment.
The study of the potash deposit formation mechanisms provides several key insights:
- (1).
- Gravity exploration’s effectiveness in potash exploration in the Vientiane region of Laos is not solely due to the lower density (2.0–2.2 g/cm3) of potash layers. It also results from the combined effects of the potash’s low density and the local gravity low generated by salt diapirs. If the region had horizontal sedimentary layers without subsequent geological alterations, even with low-density materials, there would be no lateral density variation, and gravity exploration results would be ineffective. It is the formation of salt diapirs that causes localized thickening and thinning of potash deposits, creating lateral density variations and making low-gravity anomalies more pronounced.
- (2).
- Within salt diapirs, potash deposits tend to accumulate locally and maintain a nearly vertical contact with rock salt. The density contrast between potash minerals (primarily carnallite and rock salt mixtures) and rock salt is relatively small. Therefore, in the subsequent processing of gravity data, when separating local anomalies from regional anomalies, if not conducted layer by layer, rock salt and potash rock should be considered as a whole. In other words, the low-value anomalies within local anomalies represent the composite response of low-density materials (rock salt and potash layers).
- (3).
- Due to the formation of salt diapirs, low-density potash deposits tend to accumulate locally, and the regional geological composition is relatively simple, mainly comprising high-density mudstone and sandstone, along with low-density rock salt and potash deposits. Consequently, it can be concluded that within the local gravity anomalies, after removing the influence of deep-seated structures, low-gravity anomalies are primarily caused by low-density rock salt and potash deposits, indicating shallow burial and significant thickness, while high-gravity anomalies represent deeper and thinner salt deposits.
3. Data Acquisition
The gravity data utilized in this study was acquired through self-conducted field measurements within the research area. For the gravity survey field work, three Canadian-made CG-5 high-precision quartz spring gravimeters were utilized. The normal gravity exploration survey grid was meticulously designed at a 1:50,000 scale, employing a 500 m × 500 m square pattern. The point distribution is shown in Figure 3.
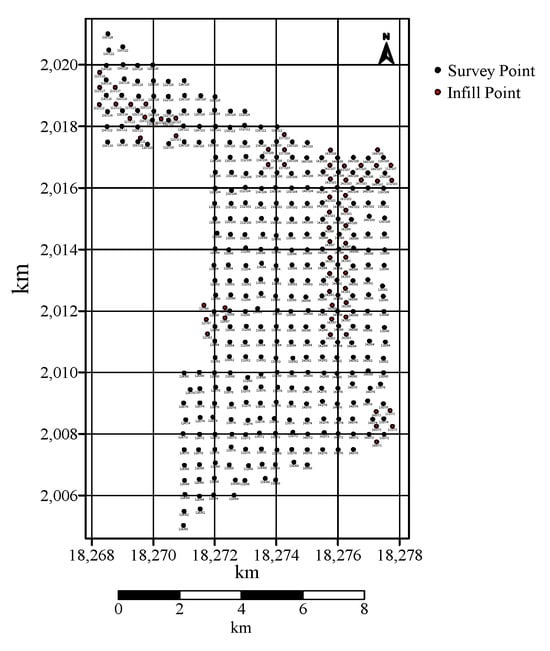
Figure 3.
Distribution map of measuring points in the study area.
During the setup of measurement points, efforts were consistently made to select locations with flat terrain and minimal near-zone topographic influence. Each measurement point was marked with red cloth strips and assigned a unique number for easy identification and subsequent verification. Gravity observations at the measurement points were conducted using the single-pass observation method. To ensure the high quality and consistency of the acquired data, observations were systematically carried out on the base point in a sequence of base point → auxiliary point → base point at the beginning of each day’s field work. The closure time for these daily observations ranged from 6.8508 to 12.8258 h, yielding corresponding closure errors between 0.0010 and 0.2230 × 10⁻⁵ m/s. Furthermore, rigorous accuracy assessments revealed that the connection error for gravity base points was 0.026346 × 10⁻⁵ m/s2, and the overall measurement point error was 0.0342 × 10⁻⁵ m/s2.
4. Gravity Data Interpretation
The processing of raw gravity data into Bouguer gravity anomalies involved several critical steps to account for various geophysical effects. Firstly, instrumental drift correction was applied based on repeated observations at base stations throughout the survey period. For the normal gravity calculation (latitude correction), the theoretical gravity at each station was precisely determined using the 1980 Geodetic Reference System (GRS80) normal gravity formula, as recommended by the International Association of Geodesy (IAG). This formula is consistent with the WGS-84 ellipsoid used for coordinate system definition. Subsequently, free-air correction was applied to compensate for the elevation differences between the observation points and the reference datum. A crucial step was the Bouguer correction, which accounts for the gravitational attraction of the rock mass between the station and the reference datum. For this correction, an intermediate layer density of 2.2 g/cm3 was adopted. This density value was reliably estimated using the least squares method, applied to gravity data from selected sections within the survey area exhibiting significant topographic variations. Finally, terrain corrections were performed to eliminate the gravitational influence of irregular topography surrounding each measurement point. The topographic correction adopted the square domain method, which was systematically divided into three distinct zones based on distance from the observation point. Near Zone (0–20 m): For this immediate vicinity, we employed an oblique-top triangular prism model to enhance accuracy. Operators manually estimated height differences relative to the observation point within a 20 m radius in various directions. Middle Zone (20–2000 m): Corrections for this zone were computed using a square prism formula. The high-resolution elevation data was primarily sourced from global remote sensing imagery and the SRTM (Shuttle Radar Topography Mission) DEM (available at http://srtm.csi.cgiar.org/). This data, originally with a 90 m × 90 m grid, was subsequently gridded to a 20 m × 20 m resolution for calculation to ensure seamless integration with the near-zone boundary. Far Zone (2000–20,000 m): similar to the middle zone, the far zone corrections utilized the same high-resolution elevation data and the same calculation formula. For computation, the elevation data was gridded to a 100 m × 100 m resolution to ensure consistency with the middle zone’s boundary. These rigorous and systematically applied processing steps ensured the conversion of raw gravity measurements into accurate Bouguer gravity anomalies, providing a robust dataset for subsequent interpretation.
The Bouguer gravity anomaly (Figure 4) in the study area ranges from −33.576 to −19.559 mGal, with an average value of −26.483 mGal and a variation of 14.017 mGal.
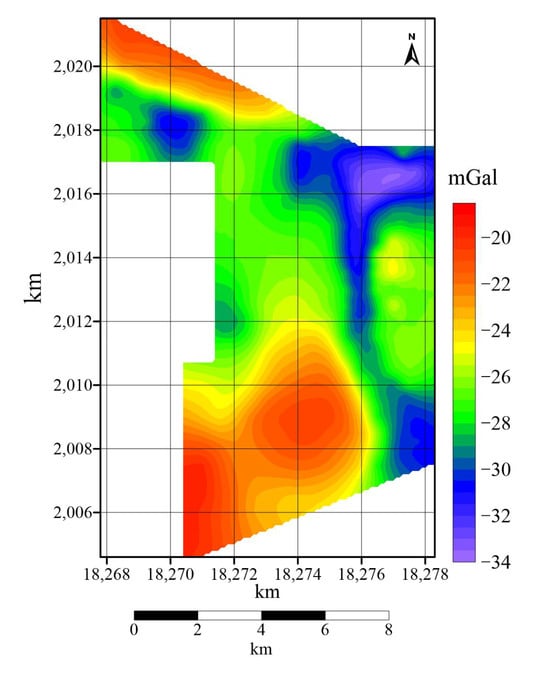
Figure 4.
Contour map of bouguer gravity anomaly.
In the study area, gravity lows are predominantly characterized, with only high-gravity closures existing in the northwest and southwest corners.
In the central-southern part, there is a relatively large nearly axisymmetric high-value closure, with a gravity high of −20.6 mGal. In the southwestern corner, there is an even larger unclosed high-value anomaly extending to the southwest, with a gravity high of −19.6 mGal, reaching beyond the surveyed area. In the mountainous terrain of the northwest corner, there is a high-gravity gradient zone with a gravity high of −20.6 mGal, not entirely closed, extending to the north beyond the surveyed region.
The eastern part features the largest low-gravity closure, with an elliptical shape spreading in a northeast–southeast direction. The gravity low reaches −33.4 milli-Gals (accompanied by another crater-like low-gravity closure in the western part with a gravity low of −30.8 mGal). This is the area with the lowest Bouguer gravity anomalies in the study region, extending southward through the surveyed area and connecting with the crater-like low-gravity closure in the southeast corner, with a gravity low of −30.6 mGal. In the northern part of the western area, there is a relatively distinct nearly axisymmetric low-gravity closure, with a gravity low of −30.8 mGal. At the boundary of the central-western part, there is a northwest-oriented elliptical low-gravity feature extending beyond the surveyed region, not entirely closed, with a gravity low of −28.8 mGal.
4.1. Analytic Continuation and Preliminary Interpretation
According to the measured anomalies on a certain observation plane, the anomalies in spatial positions other than the conversion field source are called analytical continuation [29]. The conversion plane is located above the measured plane, which is called upward continuation, and the conversion plane is located below the measured plane, which is called downward continuation. According to this definition, the difference between the field of the calculation plane and the field of the measured plane is only the difference in their distance from the field source. According to the characteristics of the gravity and magnetic anomaly wavenumber spectrum, it can be seen that the anomaly wavenumber spectra on these two planes are also different only in their depth factors. Suppose the burial depth of the anomaly body relative to the measured plane is h, and its anomaly wavenumber spectrum is and that the burial depth of the extended plane from the anomaly body is H, and its anomaly wavenumber spectrum is . Then, the ratio of the anomaly wavenumber spectra on these two planes is equal to the ratio of their respective depth factors, , where is the continuation height, is the upward continuation, and is the downward continuation. The above formula shows that as long as the wavenumber spectrum of the measured anomaly is multiplied by , the analytical continuation can be completed. From the perspective of filtering, is the wavenumber response of the analytical continuation. The upward extension is equivalent to a low-pass filter, which suppresses shallow local anomalies dominated by high-frequency components and relatively highlights the deep regional field. The downward extension is equivalent to a high-pass filter, which suppresses deep regional anomalies dominated by low-frequency components and relatively highlights the shallow local field.
As observed in Figure 5a, the gravity anomaly field exhibits complex patterns, revealing distinct local and regional features. A prominent, elongated negative anomaly, generally oriented in a north–south direction, is observed in the eastern part of the study area. A significant negative anomaly closure is also present in the northwestern part.
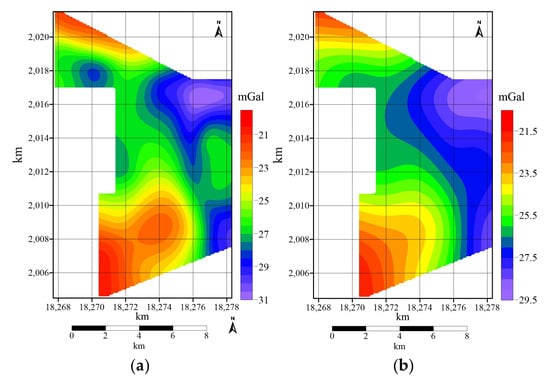
Figure 5.
Upward continuation gravity anomaly map. (a) Upward continuation 500 m. (b) Upward continuation 1500 m.
Upon further upward continuation to 1500 m (Figure 5b), the overall anomaly intensity gradually diminishes, and shallow, localized features are significantly attenuated, thereby highlighting deeper, regional structures. The prominent north–south oriented negative anomaly in the eastern part persists but appears broader and smoother. Similarly, the negative anomaly in the northwestern part also remains, albeit as a more subdued and broadened feature. The persistence of these major negative anomalies to a considerable upward continuation height, coupled with observations from subsequent layered apparent density inversion results, which show strong continuity and consistent distribution characteristics of low-density bodies with increasing depth, collectively suggested that their causative sources may be deeply buried.
In gravity field regional–residual anomaly separation, selecting the optimal upward continuation height is crucial. This study employs a method proposed by Zeng et al. [30] to estimate the optimal continuation height, which is based on the cross-correlation curve of gravity anomalies continued to two successive heights. As the upward continuation height increases, shallow, high-frequency anomalies are progressively smoothed out, while deeper, long-wavelength (regional) anomalies are preserved. The point of discontinuity of the gradient (often appearing as an inflection point) on this cross-correlation curve indicates the optimal continuation height. At this point, the deep regional field has been optimally separated, and further upward continuation beyond this height will yield diminishing returns in improving the regional–residual separation, potentially even smoothing the regional field itself or amplifying long-wavelength noise. Therefore, this inflection point represents the optimal continuation interface that effectively suppresses shallow interferences while maximally preserving the characteristics of the deep regional anomaly.
As can be seen from Figure 6, the optimal extension height is 600 m.
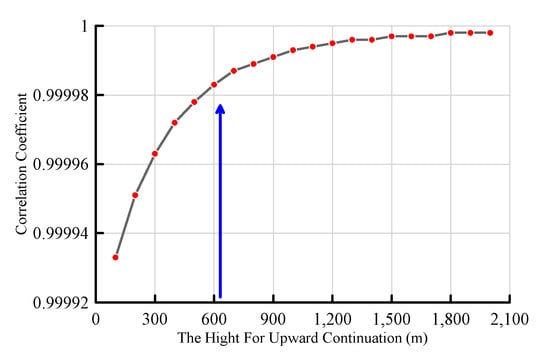
Figure 6.
Curve of cross-correlation coefficient vs. upward continuation height (The blue arrow points to the maximum inflection point).
In the study area, the regional gravity anomalies were separated using an upward extension of 600 m, as shown in Figure 7a. By removing the regional gravity anomalies from the Bouguer gravity anomalies, the residual gravity anomalies were obtained, as depicted in Figure 7b.
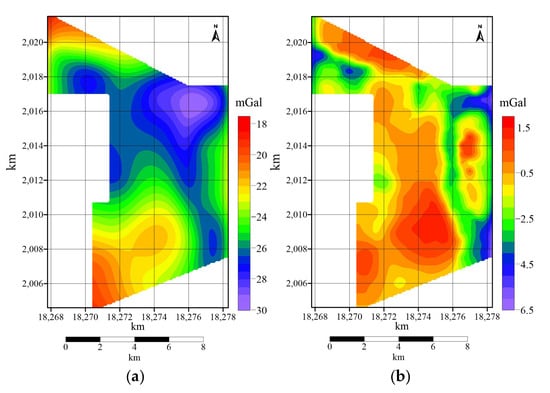
Figure 7.
Anomaly decomposition map with upward continuation of 600 m. (a) Regional anomaly. (b) Residual anomaly.
From Figure 7, a clearer view of the location, extent, and intensity of the residual negative anomalies is obtained. The primary centers of negative anomalies in the study area are primarily in the northeastern and northwestern parts of the working area, with secondary negative anomaly centers in the central-western region and the southeast corner.
To gain a better understanding of the near-surface geological features in this area, the observed gravity anomalies were downward continued to two different depths, 50 m and 100 m, with the results presented in Figure 8. From Figure 8, it is evident that the previously discussed gravity low-closure anomalies persist and are significantly enhanced and focused at these shallower continuation depths, thus suggesting their near-surface characteristics. While downward continuation inherently amplifies both shallow signals and existing noise, the stability and strong focusing of these anomalies within the 50 m to 100 m continuation range infer that the tops of their causative sources are located at shallow depths, likely within or slightly below this interval. The onset of significant oscillations or instability (if continued to much greater depths beyond the target source) would typically indicate approaching the source or excessive downward continuation. Additionally, Figure 8b reveals the appearance of several new gravity low closures in the northwest corner of the study area. These newly resolved closures exhibit relatively weak anomaly intensity but are also inferred to be buried at shallower depths, making them suitable as secondary exploration targets for further investigation.
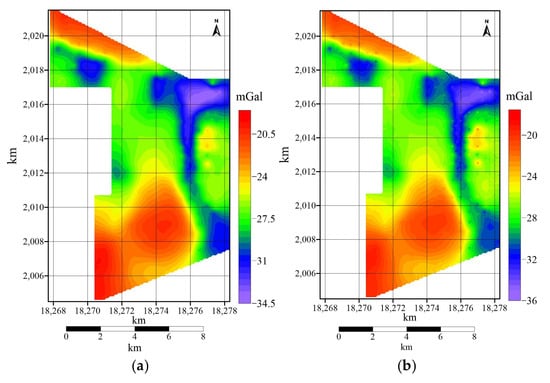
Figure 8.
Downward continuation gravity anomaly map. (a) Downward continuation 50 m. (b) Downward continuation 100 m.
4.2. Residual Anomaly Calculation and Sedimentary Basin Inference
4.2.1. Inferring the Location and Extent of Potash Sedimentary Basins Using Residual Gravity Anomalies
In order to determine the location and extent of the potash sedimentary basin in this area, two methods were employed for cross-verification to enhance the credibility of the interpretation: the residual gravity anomalies and the second-order vertical gravity derivatives.
To infer the location and extent of the potash sedimentary basin using the residual gravity anomalies, a comparison was made between the regional anomalies and residual anomalies obtained through various methods, such as trend analysis [31,32,33,34], finite element [35,36], wavelet packet [37], differencing [38], and upward extension, and with consideration of the geological context of the study area. It was then determined that the regional anomalies separated using the fifth-order wavelet packet method closely resemble the basement conditions of the study area. For the wavelet decomposition, the Coiflet 5th order (coif5) wavelet was selected as the mother wavelet. This specific choice was made based on a comprehensive experimental comparison. Results from these comparisons demonstrated that the Coiflet 5th order wavelet exhibited superior performance in several critical aspects: effectively separating regional and local fields, significantly reducing noise, and optimally preserving the characteristic features of the anomalies. This rigorous selection process ensures that the decomposition accurately extracts meaningful geological signals while minimizing artifacts and maintaining the integrity of the anomaly patterns. Therefore, the residual anomalies separated using the fifth-order wavelet packet method have been chosen as the foundational data for determining the location of the sedimentary basin, as shown in Figure 9.
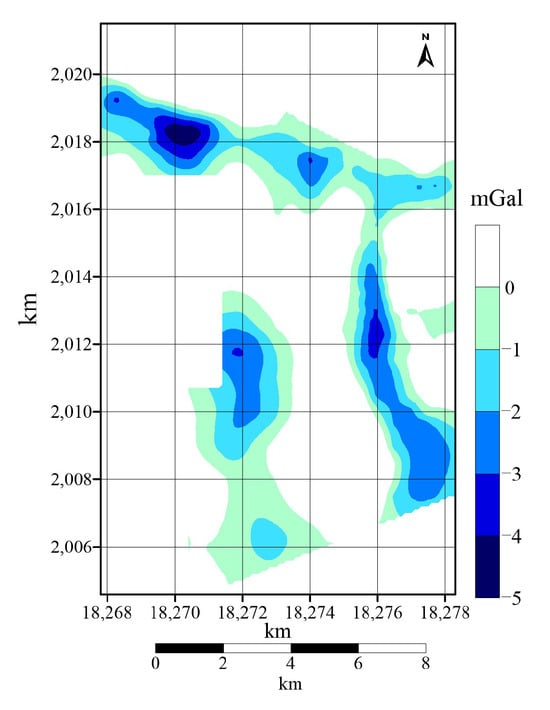
Figure 9.
Delineation of low-density potash target areas predicted by residual gravity anomalies.
From this figure, it is evident that in the northwest corner of the study area, there is a significant northwest-oriented band-shaped negative anomaly. To its east, a prominent north–south-oriented elongated negative anomaly is observed. To its west, a smaller, more localized negative anomaly is present.
4.2.2. Inferring the Location and Extent of Potash Sedimentary Basins Using Gravity Vertical Derivative Anomalies
In theory, the zero contour of the second vertical derivative of gravity anomalies can roughly reflect the structural boundaries of geological bodies. Therefore, in order to locate the boundaries of the sedimentary basin within the study area, Bouguer gravity anomalies and their second vertical derivative were calculated for the area, and the zero contours of these derivatives were plotted for upward extensions of 100 m, 300 m, and 600 m. These zero contour closures are shown in Figure 10, and the blue area is used to highlight regions where the second vertical derivative of the gravity anomaly is less than zero.
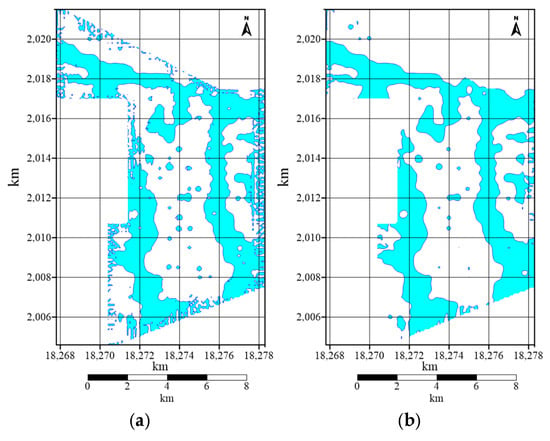
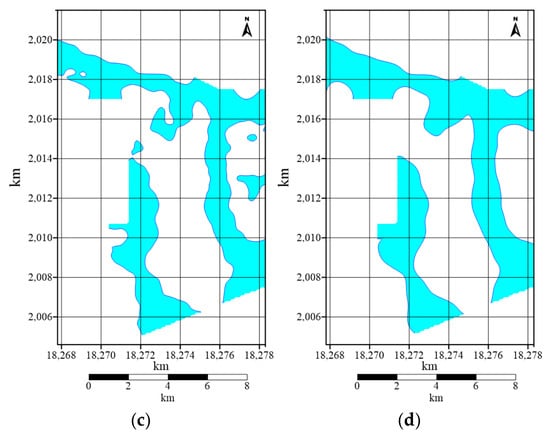
Figure 10.
Zero-value lines of the second vertical derivative of Bouguer gravity anomaly. (a) Original anomaly. (b) Upward continuation 100 m. (c) Upward continuation 300 m. (d) Upward continuation 600 m.
Analyzing and comparing the zero contours of the second vertical derivatives at different extension heights in Figure 10, it becomes apparent that the shallow sedimentary basin within the study area is not extensive and appears somewhat fragmented. The primary low-density bodies are distributed mainly at depths exceeding 300 m and are generally located in the northern part (with a northeast orientation) and on both the eastern and western sides (trending from near north–south to northwest).
4.3. Apparent Density Calculation and Its 3D Distribution Characteristics
In this study, the apparent density is calculated based on modeling the observed gravity field as a superposition of gravity contributions from numerous equivalent vertical prisms with varying densities, approximating the lateral density variations within the subsurface. The calculation proceeds in the frequency domain through a series of steps.
Firstly, the measured gravity field is transformed into the frequency domain. Secondly, to derive the apparent density for each prism, the spectrum is divided by specific “size factors” and “depth factors” (Hi (u,v)), which effectively perform a size correction and a downward continuation to the top surface of the prisms. Subsequently, the vertical first derivative of this continued field is computed. Finally, an inverse Fourier transform yields the apparent density i for each small prism, which represents the density at its top surface. This process allows for the determination of the lateral distribution map of the geological body’s density.
The technical justification for the apparent density’s correspondence to depth is inherent in this methodology. The inclusion of the depth factor (Hi (u,v)) in the frequency-domain processing, coupled with the downward continuation step, ensures that the calculated apparent density values directly reflect the density distribution at specific depths (i.e., the top surfaces of the modeled prisms) within the subsurface. This allows for the effective mapping of lateral density variations at defined depth horizons, thereby correlating the apparent density results with the actual depth of the causative geological bodies. Furthermore, inversion results consistently show that the derived apparent density anomalies align well with known model locations, exhibiting high resolution and independence from model geometry, with maximum errors less than 15%. To understand the uneven density distribution at different depths, the study area was divided into four depth ranges below the surface, spanning from 200 to 300 m, 400 to 500 m, 600 to 700 m, 800 to 900 m. Interpolated cuts were performed at each depth range to separate the local gravity anomalies. Subsequently, the gravity anomalies from each depth range were used to infer the apparent density for that particular depth. The distribution of anomalies at each depth level, as well as the regional anomalies, can be seen in Figure 11.
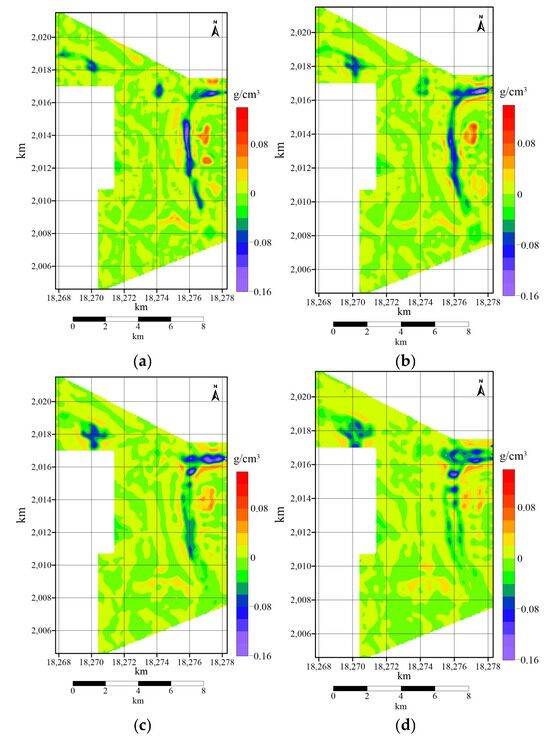
Figure 11.
Contour maps of apparent density distribution at different levels in the study area. (a) 200–300 m. (b) 400–500 m. (c) 600–700 m. (d) 800–900 m.
Comparing the various figures in Figure 9, the following observations can be made.
The apparent density distribution between 200 and 400 m depth gradually becomes relatively smoother. Between 400 and 600 m depth, the apparent density distribution becomes even smoother, although localized low-density closures are still apparent, indicating that these anomalies extend to greater depths and can be considered target areas for deep potash exploration. The apparent density variation between 600 and 800 m depth is quite smooth.
➀ In the northeast corner, a nearly east–west oriented low-density body shows significant density differences at buried depths of 200–700 m, which then weaken, only disappearing after reaching 1000 m. This may represent the deepest and largest part of the low-density bodies in the area.
➁ In the eastern part, a nearly north–south oriented low-density body exhibits the largest density difference at buried depths of 100–200 m, gradually disappearing after reaching 800 m.
➂ In the northern corner, a roughly equi-axial low-density body appears as multiple fragmented distributions at buried depths of 0–300 m. From 300 to 600 m depth, these fragments coalesce into a cohesive body with a northwest orientation.
➃ In the central-northern part, a low-density body near the coordinates Y = 18,274 km, X = 2016.5 km shows gradually increasing density differences at buried depths of 0–400 m, then gradually disappearing after reaching 400 m.
To understand the uneven distribution of apparent density across various profiles, eight east–west profiles were meticulously selected at the study area’s Y-coordinates, favoring those situated near promising drilling sites or possessing the potential to yield valuable insights. These profiles are arranged in a north-to-south sequence, specifically at 2019 km, 2016.5 km, 2015 km, 2014 km, 2013 km, 2011.9 km, 2010.1 km, and 2006.4 km.
The three-dimensional positions of the aforementioned eight profiles are presented in Figure 12, which is intentionally tilted to provide a better three-dimensional visualization of the subsurface structures. The deep blue hues on the density profiles illustrate the location and depth of low-density structures, thus furnishing a more precise target zone for potash exploration. The actual well locations and drilling depths on each profile are denoted by red markers within the figure.
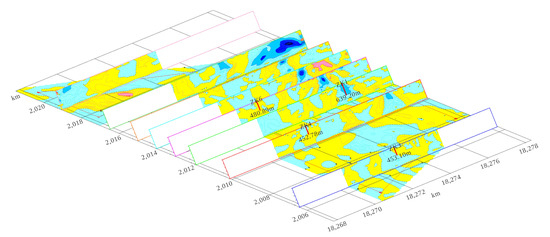
Figure 12.
Partial section stereoscopic position and apparent density distribution map.
4.4. Fault Identification Results Using Integrated Methods
The identification of faults and structural lineaments is a critical aspect of the gravity data interpretation, relying on a systematic integrated analytical approach that combines various geophysical processing and interpretation techniques. Specifically, derivative methods (both vertical and horizontal derivatives) were employed to enhance the edges and boundaries of subsurface density contrasts, thereby sharpening the expression of fault zones and other linear structural discontinuities. Wavelet packet analysis played a crucial role in decomposing the Bouguer gravity anomalies into different frequency components, enabling the isolation and extraction of anomalies corresponding to structures at varying depths and dimensions. Apparent density inversion, as detailed in Section 4.3, provided a 3D volumetric representation of subsurface density variations, allowing for the mapping of anomalous density zones and their boundaries directly linked to structural features. Additionally, analytical continuation and trend analysis were utilized for effective field separation, further refining the identification of structural indicators by isolating regional and residual anomaly components. The ‘integrated analytical approach’ refers to the systematic combination and cross-validation of the results obtained from these diverse methods; by meticulously analyzing and overlaying the anomaly maps derived from each technique, we were able to robustly identify and confirm the presence of multiple faults and structural lineaments within the study area, significantly enhancing the reliability and accuracy of our structural interpretations and providing a solid basis for pinpointing favorable target areas for potash exploration. Considering the content above comprehensively, and referencing the geological map, topographic map, and Bouguer anomaly map, multiple faults or structural lines extending in different directions have been preliminarily identified, as shown in Figure 13.
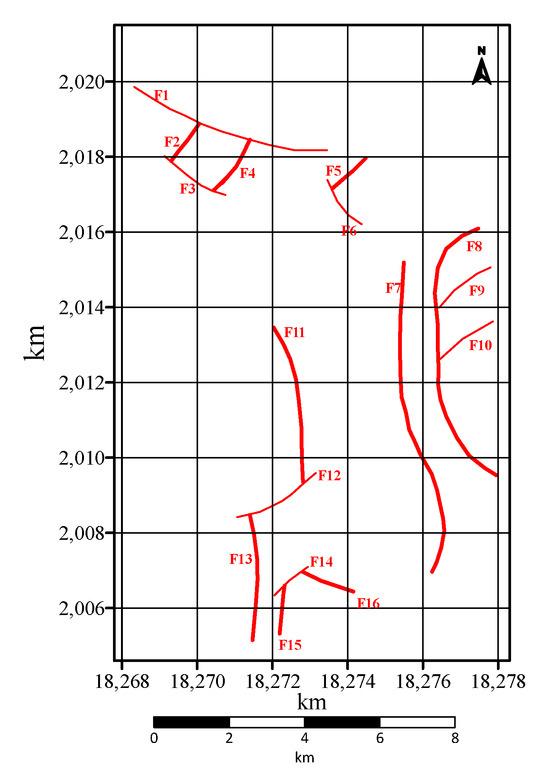
Figure 13.
Integrated identification of faults or structural lines.
From the process of identification and analysis, it is evident that within the northern sector of the study area, we have preliminarily identified 16 fault lines (F1 to F16), as depicted in Figure 13. The primary orientation of these faults in this region predominantly follows a north–south direction and a northeast orientation. Notably, the larger north–south-oriented faults are primarily concentrated in the eastern and central areas of the region, while the northeast-oriented faults are relatively smaller in scale.
5. Conclusions and Discussion
This study comprehensively investigated the subsurface geological structures and potash exploration targets in the Vientiane region, Laos, utilizing gravity data processing and interpretation techniques. Through an integrated analytical approach, we successfully delineated key low-density geological bodies and structural features critical for potash mineralization.
Our gravity analysis and extensions, including both upward and downward continuations, provided crucial insights into the vertical distribution of low-density bodies. The preliminary interpretation reveals that the top of these bodies generally lies at depths of 50 to 100 m, with their base typically found within the range of 300 to 500 m. Notably, the persistence of the gravity low closure in the northeast corner even after a 1500 m upward extension, with its center shifting eastward, indicates a profound burial depth for this low-density body. Similarly, the prominent strip-like gravity lows in the eastern region and the dome-shaped low in the northwest show moderately to slightly deeper burial depths based on their diminishing responses after 800 m and 1000 m upward extensions, respectively. The primary structure of the deep-seated basement consistently trends northwest, forming a saddle-shaped slope.
For the inference of sedimentary basins, a comparative analysis of various field separation techniques, including trend surface analysis, finite element analysis, wavelet/wavelet packet analysis, interpolation cutting, nonlinear filtering, and upward continuation, was performed. The fifth-order Coiflet wavelet packet method yielded the most favorable results, with its separated regional anomalies closely resembling the basement conditions. Consequently, the residual anomalies obtained from this method, particularly gravity lows with values below zero, were chosen as the fundamental data for delineating prospective low-density potassium salt target areas (as illustrated in Figure 7). These areas are prominently characterized by band-like negative anomalies, particularly in the northern part of the research area with a northwestern orientation, complemented by two north–south-oriented negative anomalies on the western and eastern sides, suggesting significant exploration potential. Furthermore, the analysis of zero-value lines from the vertical second-order derivatives approximately outlined geological body boundaries, indicating that primary low-density bodies are predominantly distributed in layers above 300 m, mainly in the north and along the eastern and western sides.
The detailed analysis of the three-dimensional density distribution, derived from our density measurements and inversion (as elaborated in Section 4.4), further refined our understanding of the low-density bodies’ spatial and depth characteristics. Low-density bodies in the northeastern corner, trending east–west, show the most pronounced density differences at burial depths of 200 to 700 m, gradually fading beyond 1000 m, potentially representing the deepest and most substantial concealed entities. In the eastern part, north–south-trending low-density bodies peak at 100 to 200 m depths, gradually waning by 800 m. The northern sector reveals ellipsoid-like low-density bodies scattered at shallow depths (0–300 m) that coalesce into a contiguous northwest-oriented formation between 300 and 600 m, dissipating beyond 900 m. Interestingly, in the central-northern region, density disparities intensify at shallow depths (0–400 m) but recede beyond approximately 400 m.
Utilizing various processing methods, including horizontal derivatives at different extrapolation heights, three-directional subdomain filtering, and differential field normalization, we successfully inferred the presence of 16 fault lines or structural boundaries within the research area (as depicted in Figure 13). These faults are primarily oriented in a north–south and northeast direction, with the larger north–south faults concentrated in the eastern and central regions. These structural features are crucial for understanding the tectonic framework and its control over potash mineralization.
In summary, by integrating comprehensive gravity analysis, multi-scale wavelet packet decomposition, 3D apparent density inversion, and advanced structural identification techniques, this study has effectively delineated the distribution characteristics of low-density bodies and associated fault systems. Based on the synthesized results from upward extrapolation, five-level wavelet packet analysis, second-order surface trend analysis, second-order finite element method, interpolation slicing, nonlinear filtering, and six other separation field methods, and integrating depth profiles from various density images and geological maps and topography [39], two primary and three secondary potash exploration target areas have been tentatively identified, illustrated in Figure 14 (the base map in the figure is Figure 9, the red line is the fault inferred from Figure 13, T represents the predicted potash target area, and the black box is the target area range) and detailed in Table 1. These findings significantly reduce the exploratory uncertainty and provide a robust geophysical basis for future targeted potash exploration efforts in the Vientiane region.
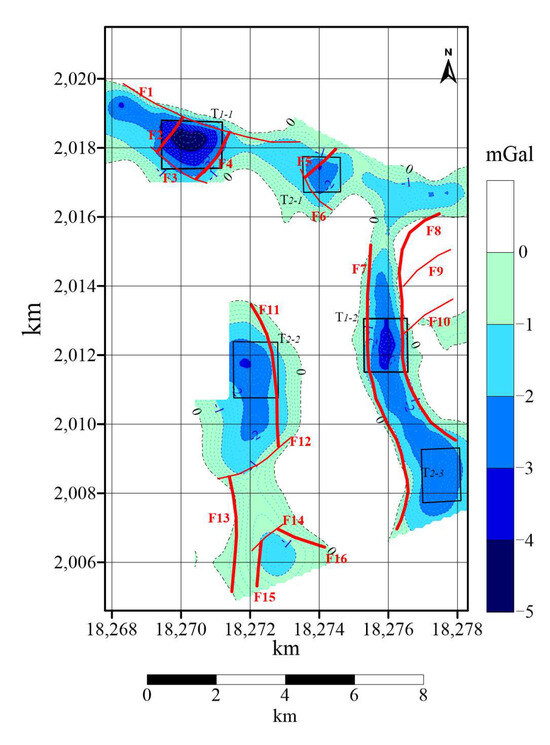
Figure 14.
Inferred prospecting target areas.

Table 1.
Characteristics of inferred target areas.
Author Contributions
Conceptualization, J.L.; methodology, T.G.; software, T.X.; validation, T.X. and T.G.; formal analysis, J.L.; investigation, J.L.; resources, W.D. and T.G.; data curation, W.D.; writing—original draft preparation, W.D. and J.L.; writing—review and editing, W.D.; visualization, D.G.; funding acquisition, W.D. All authors have read and agreed to the published version of the manuscript.
Funding
This research was funded by Yunnan Province Basic Research Project, grant number 202501AT070237 and 202301AT070163.
Data Availability Statement
The data from this study are available from the authors upon request.
Acknowledgments
We are grateful to Wu for sharing the gravity data essential to this research.
Conflicts of Interest
The authors declare no conflicts of interest.
References
- Xu, M.; Yang, Y.; Wu, Y. A Fully Automatic DEXP Method for Gravity Data and Its Application on a Potash Salt Deposit. Appl. Sci. 2023, 13, 10821. [Google Scholar] [CrossRef]
- Essa, K.S. Gravity data interpretation using the s-curves method. J. Geophys. Eng. 2007, 4, 204–213. [Google Scholar] [CrossRef]
- Yue, H.; Guo, P.; Zhang, T.; Huang, X.; Pi, J.; Xu, H.; Zhang, F. Integrated geophysical exploration of favorable potassium salt mineralization on the northeastern margin of Qaidam Basin, China. J. Geophys. Eng. 2025, 22, 889–900. [Google Scholar] [CrossRef]
- Karaiskos, D.; Apostolopoulos, G.; Orfanos, C. Gravity Survey for Mineral Exploration in Gerolekas Bauxite Mining Site in Greece. Mining 2025, 5, 3. [Google Scholar] [CrossRef]
- Wang, G.; Lv, X. Research on Integrated Analysis of Geological and Geophysical Data and 3D Mineralization Prediction Based on Machine Learning. In Proceedings of the EGU General Assembly 2025, Vienna, Austria, 27 April–2 May 2025. [Google Scholar]
- Sadraeifar, B.; Abedi, M. 3D inversion of gravity data using mixed Lp–Lq norm regularization, a case study for potash targeting at the Ghare-Aghaj deposit in Iran. Carbonates Evaporites 2024, 39, 66. [Google Scholar] [CrossRef]
- Fairhead, J.D.; Odegard, M.E. Advances in gravity survey resolution. Lead. Edge 2002, 21, 36–37. [Google Scholar] [CrossRef]
- Gad El-Mula, A.H.; Muhammed, H. CHAPTER: Gravitational Field Data Modeling and Interpretation. ResearchSquare, 2023; preprints. [Google Scholar] [CrossRef]
- Daniels, J.J.; Scott, J.H.; Hite, R.J. Analysis of borehole geophysical data in an evaporite sequence at Salt Valley, Utah. In Proceedings of the SPWLA Twentieth Annual Logging Symposium, Tulsa, OK, USA, 3–6 June 1979; p. 3. [Google Scholar]
- Shen, L.; Siritongkham, N. The characteristics, formation and exploration progress of the potash deposits on the Khorat Plateau, Thailand and Laos, Southeast Asia. China Geol. 2020, 3, 67–82. [Google Scholar] [CrossRef]
- Nabighian, M.N.; Ander, M.E.; Grauch, V.J.S.; Hansen, R.O.; LaFehr, T.R.; Li, Y.; Pearson, W.C.; Peirce, J.W.; Phillips, J.D.; Ruder, M.E. Historical development of the gravity method in exploration. Geophysics 2005, 70, 63ND–89ND. [Google Scholar] [CrossRef]
- Yoshida, N. An Overview on Geophysics of the Shallow Subsurface. J. Geol. Geophys. 2023, 13, 1138. [Google Scholar]
- Wei, C.; Guan, Y.; Li, X.; Sun, M.; Wu, Y. Exploration of Shallow Geothermal Resources Based on Gravity and Magnetic 3D Inversion in the Wudalianchi–Laoheishan Volcano and Surrounding Areas. Energies 2025, 18, 2011. [Google Scholar] [CrossRef]
- Liu, C.-L. Characteristics and formation of potash deposits in continental rift basins: A review. Acta Geosci. Sin. 2013, 34, 515–528. [Google Scholar]
- Montgomery-Brown, E.K.; Anderson, K.R.; Johanson, I.A.; Poland, M.P.; Flinders, A.F. Ground Deformation and Gravity for Volcano Monitoring; USGS: Reston, VA, USA, 2024. [Google Scholar]
- Khattach, D.; El Gout, R.; Ziani, S.; Nouayti, A.; Nouayti, N.; Bouazza, M. Enhancing subsurface geological imaging of Angad Basin (northeastern Morocco) through the integration of gravity and electrical data: New insights into the Jurassic deep aquifer for groundwater exploration and development. Geophys. J. Int. 2025, 241, 1186–1203. [Google Scholar] [CrossRef]
- Hinze, W.J.; von Frese, R.R.B.; Saad, A.H. Gravity and Magnetic Exploration: Principles, Practices, and Applications; Cambridge University Press: Cambridge, UK, 2013. [Google Scholar]
- Wang, K.; Zhang, Y.; Han, J.; Ma, L.; Zheng, M.; Wu, Y.; Yang, B. Distribution and Genesis of Potassium-Bearing Minerals in Lop Nor Playa, Xinjiang, China. Minerals 2023, 13, 560. [Google Scholar] [CrossRef]
- Guo, Y.; Wu, J.; Zhu, Y. Geology of Vientiane Potash in Laos; Yunnan Science and Technology Press: Kunming, China, 2005. [Google Scholar]
- Zhu, Y.; Wu, J.; Hu, J. Introduction to Geology and Mineral Resources of Laos; Yunnan Science and Technology Press: Kunming, China, 2009. [Google Scholar]
- Wang, C.; Liu, C.; Wang, L.; Zhang, L. Reviews on Potash Deposit Metallogenic Conditions. Adv. Earth Sci. 2013, 28, 976–987. [Google Scholar]
- Zhu, Y. The potash deposits in Vientiane plain, Laos. Geol. Resour. 2008, 17, 45–49. [Google Scholar] [CrossRef]
- Zhang, M.; Zhang, X.; Pan, L. Sylvine Ledge Characteristics and the Exploration Significance of Bugan District, Laos. Geol. Chem. Miner. 2015, 37, 72–76+84. [Google Scholar]
- Liu, X. Important legal issues of investing Laos mining sector. China Min. Mag. 2021, 30, 54–57. [Google Scholar] [CrossRef]
- Liang, G.; Xu, X. Potash Deformation and Enrichment Modes in Vientiane Sag, Laos. Earth Sci. 2022, 47, 136–148. [Google Scholar] [CrossRef]
- Zhu, Y.; Wu, J.; Yan, C. Actuality of and approaches to Laos’s potash resources. Resour. Ind. 2016, 18, 44–47. [Google Scholar]
- Yan, C.; Zhu, Y.; Wu, J.; Feng, M. The main advances in the fundamental geological investigation of Vientiane area, Laos. Acta Geosci. Sin. 2006, 1, 81–84. [Google Scholar] [CrossRef]
- Wang, S.; Du, J. Study on the controlling structure of salt deposit in Vientiane plain, Laos. J. Geomech. 2012, 18, 52–61. [Google Scholar]
- Dean, W.C. Frequency analysis for gravity and magnetic interpretation. Geophysics 1958, 23, 97–127. [Google Scholar] [CrossRef]
- Zeng, H.; Xu, D. Estimation of optimum upward continuation height. Geosci. Front. 2002, 9, 499–504. [Google Scholar]
- Agocs, W.B. Least-squares residual anomaly determination. Geophysics 1951, 16, 686–696. [Google Scholar] [CrossRef]
- Simpson, S.M., Jr. Least squares polynomial fitting to gravitational data and density plotting by digital computers. Geophysics 1954, 19, 255–269. [Google Scholar] [CrossRef]
- Skeels, D.C. What is residual gravity. Geophysics 1967, 32, 872–876. [Google Scholar] [CrossRef]
- Abdelrahman, E.M.; Bayoumi, A.I.; El-Araby, H.M. A least-squares minimization approach to invert gravity data. Geophysics 1991, 56, 115–118. [Google Scholar] [CrossRef]
- Coggon, J. Electromagnetic and electrical modeling by the finite element method. Geophysics 1971, 36, 132–155. [Google Scholar] [CrossRef]
- Mallick, K.; Sharma, K.K. A finite element method for computation of the regional gravity anomaly. Geophysics 1999, 64, 461–469. [Google Scholar] [CrossRef]
- Yan, P. Research on the Application of Wavelet Transform Method in Potential Field Data Processing. Ph.D. Thesis, Jilin University, Changchun, China, 2012. [Google Scholar]
- Wen, B.H.; Cheng, F.D. A new method for separating magnetic anomalies: Difference cut method. J. Cent. South Inst. Min. Metall. 1990, 21, 229–235. [Google Scholar]
- Zhao, G. Gravity Data Processing and Interpretation of Potash Salt Mine in Vientiane Area, Laos. Master’s Thesis, Jilin University, Changchun, China, 2017. [Google Scholar]
Disclaimer/Publisher’s Note: The statements, opinions and data contained in all publications are solely those of the individual author(s) and contributor(s) and not of MDPI and/or the editor(s). MDPI and/or the editor(s) disclaim responsibility for any injury to people or property resulting from any ideas, methods, instructions or products referred to in the content. |
© 2025 by the authors. Licensee MDPI, Basel, Switzerland. This article is an open access article distributed under the terms and conditions of the Creative Commons Attribution (CC BY) license (https://creativecommons.org/licenses/by/4.0/).