Article

Occurrence State and Controlling Factors of Methane in Deep Marine Shale: A Case Study from Silurian Longmaxi Formation in Sichuan Basin, SW China

1
Chongqing Shale Gas Exploration and Development Co., Ltd., Chongqing 401147, China
2
Geology Exploration and Development Research Institute, CNPC Chuanqing Drilling Engineering Co., Ltd., Chengdu 610051, China
3
Sichuan Jinuoen Oil and Gas Engineering Technology Service Co., Ltd., Chengdu 610051, China
4
Petro China Southwest Oil and Gas Field Company, Chengdu 610050, China
*
Author to whom correspondence should be addressed.
Minerals 2025, 15(8), 820; https://doi.org/10.3390/min15080820
Submission received: 1 July 2025 / Revised: 22 July 2025 / Accepted: 23 July 2025 / Published: 1 August 2025
(This article belongs to the Special Issue Element Enrichment and Gas Accumulation in Black Rock Series)

Abstract

Deep marine shale is the primary carrier of shale gas resources in Southwestern China. Because the occurrence and gas content of methane vary with burial conditions, understanding the microscopic mechanism of methane occurrence in deep marine shale is critical for effective shale gas exploitation. The temperature and pressure conditions in deep shale exceed the operating limits of experimental equipment; thus, few studies have discussed the microscopic occurrence mechanism of shale gas in deep marine shale. This study applies molecular simulation technology to reveal the methane’s microscopic occurrence mechanism, particularly the main controlling factor of adsorbed methane in deep marine shale. Two types of simulation models are also proposed. The Grand Canonical Monte Carlo (GCMC) method is used to simulate the adsorption behavior of methane molecules in these two models. The results indicate that the isosteric adsorption heat of methane in both models is below 42 kJ/mol, suggesting that methane adsorption in deep shale is physical adsorption. Adsorbed methane concentrates on the pore wall surface and forms a double-layer adsorption. Furthermore, adsorbed methane can transition to single-layer adsorption if the pore size is less than 1.6 nm. The total adsorption capacity increases with rising pressure, although the growth rate decreases. Excess adsorption capacity is highly sensitive to pressure and can become negative at high pressures. Methane adsorption capacity is determined by pore size and adsorption potential, while accommodation space and adsorption potential are influenced by pore size and mineral type. Under deep marine shale reservoir burial conditions, with burial depth deepening, the effect of temperature on shale gas occurrence is weaker than pressure. Higher temperatures inhibit shale gas occurrence, and high pressure enhances shale gas preservation. Smaller pores facilitate the occurrence of adsorbed methane, and larger pores have larger total methane adsorption capacity. Deep marine shale with high formation pressure and high clay mineral content is conducive to the microscopic accumulation of shale gas in deep marine shale reservoirs. This study discusses the microscopic occurrence state of deep marine shale gas and provides a reference for the exploration and development of deep shale gas.

1. Introduction

In recent years, the proportion of unconventional hydrocarbon resources in total hydrocarbon reserves has been rising, and their production has also increased [1,2]. Marine shale in China is characterized by great thickness and wide distribution, with substantial shale gas resource potential [3,4]. A total of 2.96 × 10²¹ m3 of geological shale gas reserves has been confirmed, with annual gas production maintained at 250 × 108 m3/a in marine shale, demonstrating a promising outlook for exploration and development [5]. High-quality marine shale reservoirs at depths up to 3500 m are widely reported. Deep marine shale, which is deeper than 3500 m, contains considerable shale gas reserves, but few studies have been conducted on them [5,6]. With the L203 shale gas well at 3800 m reaching a test production of 138 × 104 m3/d, deep shale gas exploration and development have become a research hotspot [7].
Currently, research on deep shale mainly focuses on pore structure, reservoir physical properties, reservoir space evolution, etc. [3,8,9,10]. However, few studies have examined the microscopic occurrence mechanisms and controlling factors of shale gas in deep marine shale [11]. Many methods have been proposed to measure the adsorption capacity of methane, including field analysis, nuclear magnetic resonance (NMR) experiments, methane isothermal adsorption, and molecular simulation [12,13]. Due to the limitations of experimental equipment and technical conditions, methods like methane isothermal adsorption cannot account for geological conditions, raising concerns about the reliability and validity of the methane occurrence mechanisms derived from experimental results [14]. In recent years, molecular simulation has been widely used in shale research. It can analyze the occurrence mechanisms at the molecular level and allows for free adjustments of temperature and pressure, unconstrained by equipment’s testing range [15,16]. Grand Canonical Monte Carlo (GCMC) and molecular dynamics simulations are commonly used in molecular simulations. Based on the simulation results, methane adsorption behavior is investigated through excess adsorption curves, density distribution curves, and adsorption isosteric heat curves [17,18,19]. The occurrence of methane in marine shale varies among different components [19]. Nanopores in shale are the primary reservoir space for methane, and methane’s adsorption capacity is affected by pore size, morphology, and other factors [11,20]. The temperature and pressure conditions for the microscopic occurrence mechanisms of methane are currently low and do not align with those in deep marine shale. In this study, two simulation models based on the main components of the Longmaxi Formation in the Luzhou area of the Southern Sichuan Basin are proposed, and their reliability is verified. Using the GCMC method, the effects of temperature, pressure, pore size, and mineral composition on methane adsorption are examined, providing a reference for deep marine shale exploration and reserve prediction.

2. Geological Setting

The study area is situated in the southern part of the Sichuan Basin (Figure 1a). During the Early Silurian, the southern and eastern parts of the Sichuan Basin were dominated by a deep water shelf environment (Figure 1a). Under this sedimentary background, the organic-rich shale of the Longmaxi Formation is deposited, which is the main target interval for shale gas exploitation in South China. Affected by various tectonic processes [21], heterogeneity in the burial depths of Longmaxi organic-rich shale has been documented in the three areas of Zhaotong (<2000 m), Weiyuan (2000–3500 m), and Luzhou (>3500 m) (Figure 1b). The core samples collected for this study are obtained from drilling wells in the Weiyuan and Luzhou areas. Drilling data shows that the core samples are extracted from the organic-rich shale of the Longmaxi Formation, which is buried at a depth of over 3500 m. Affected by various tectonic processes [21], heterogeneity in the burial depths of the Longmaxi organic-rich shale has been documented in three areas: Zhaotong (<2000 m), Weiyuan (2000–3500 m), and Luzhou (>3500 m) (Figure 1b). The core samples collected for this study were obtained from drilling wells in the Weiyuan and Luzhou areas. Drilling data show that the core samples were extracted from the organic-rich shale of the Longmaxi Formation, buried at a depth of over 3500 m.

3. Models and Methods

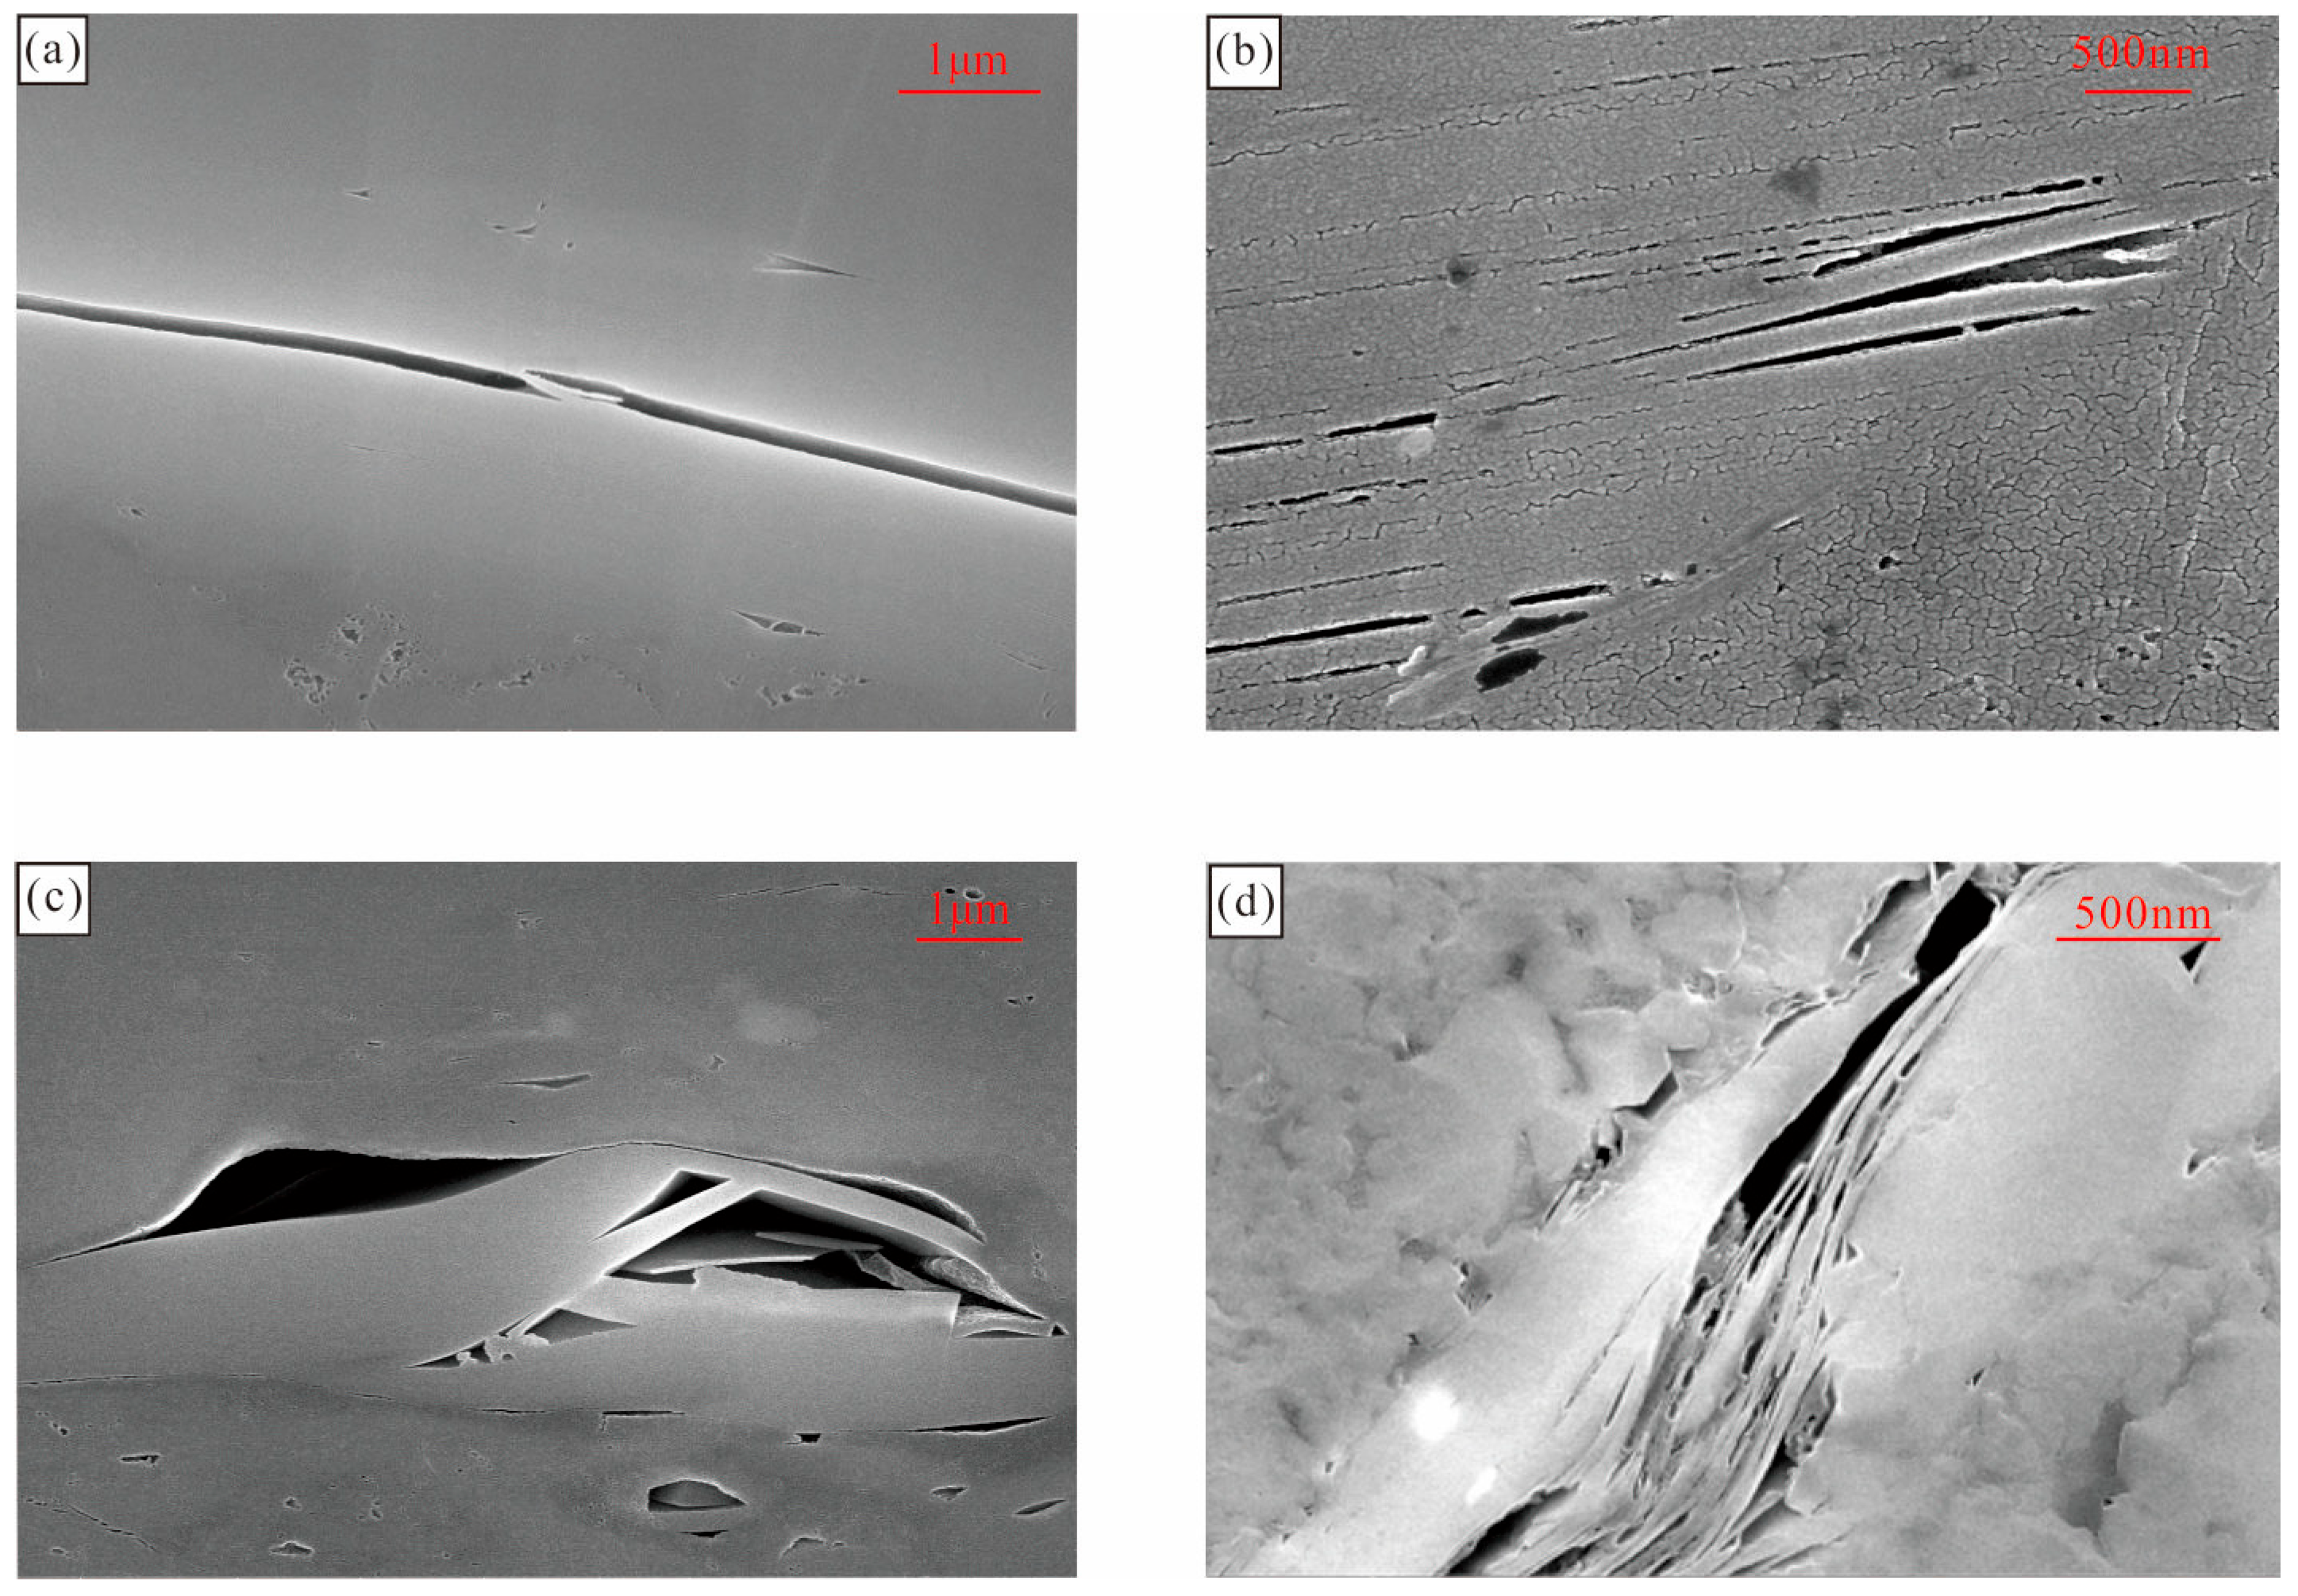
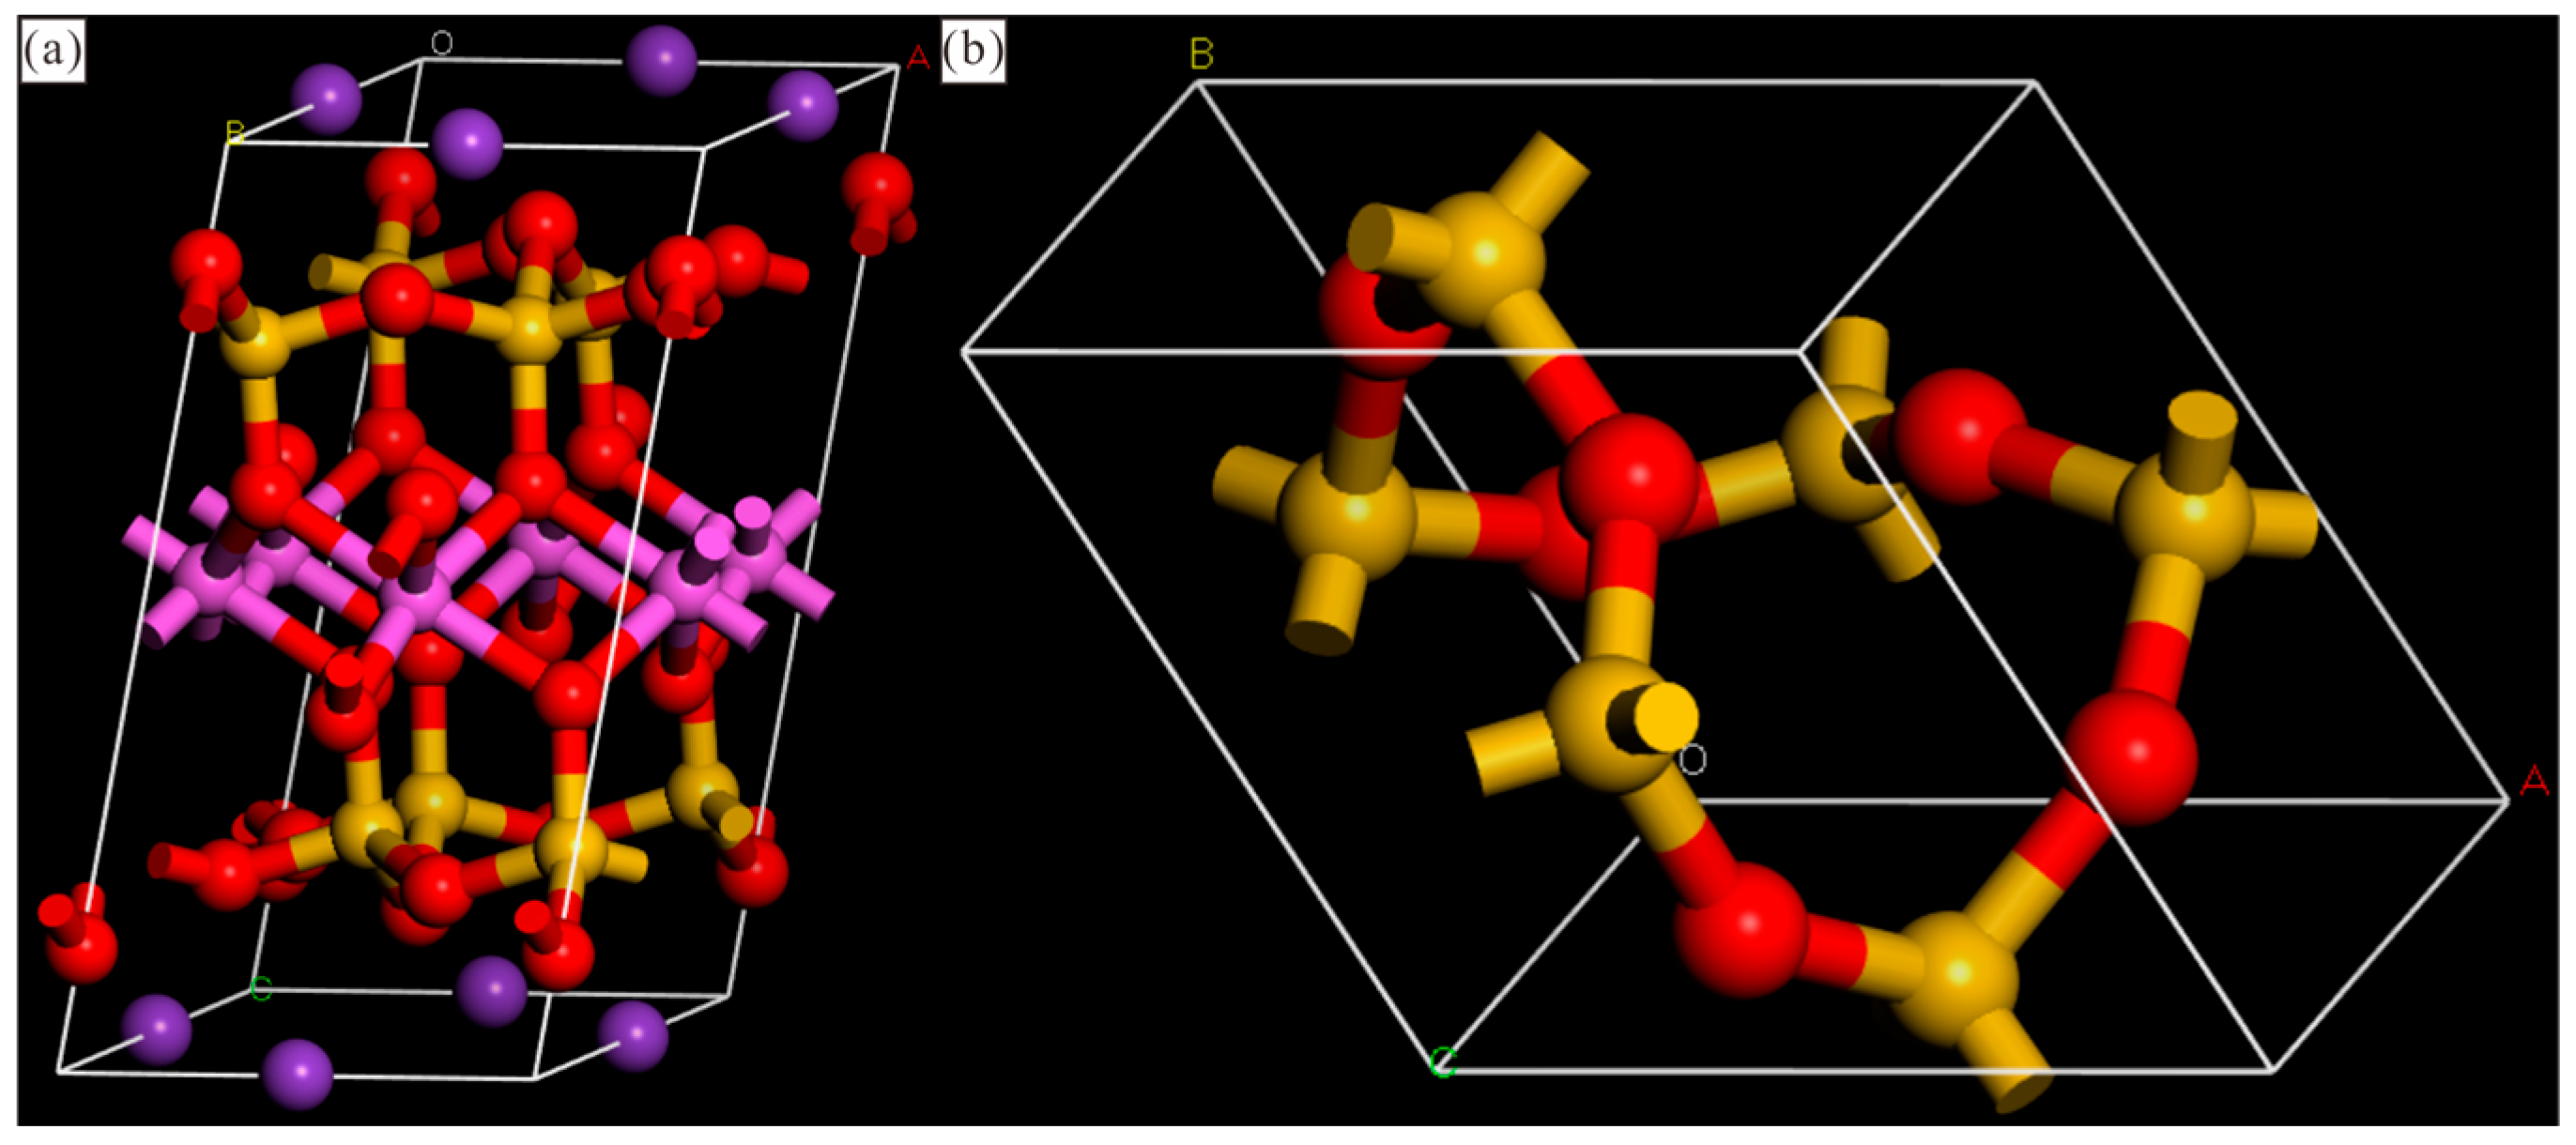
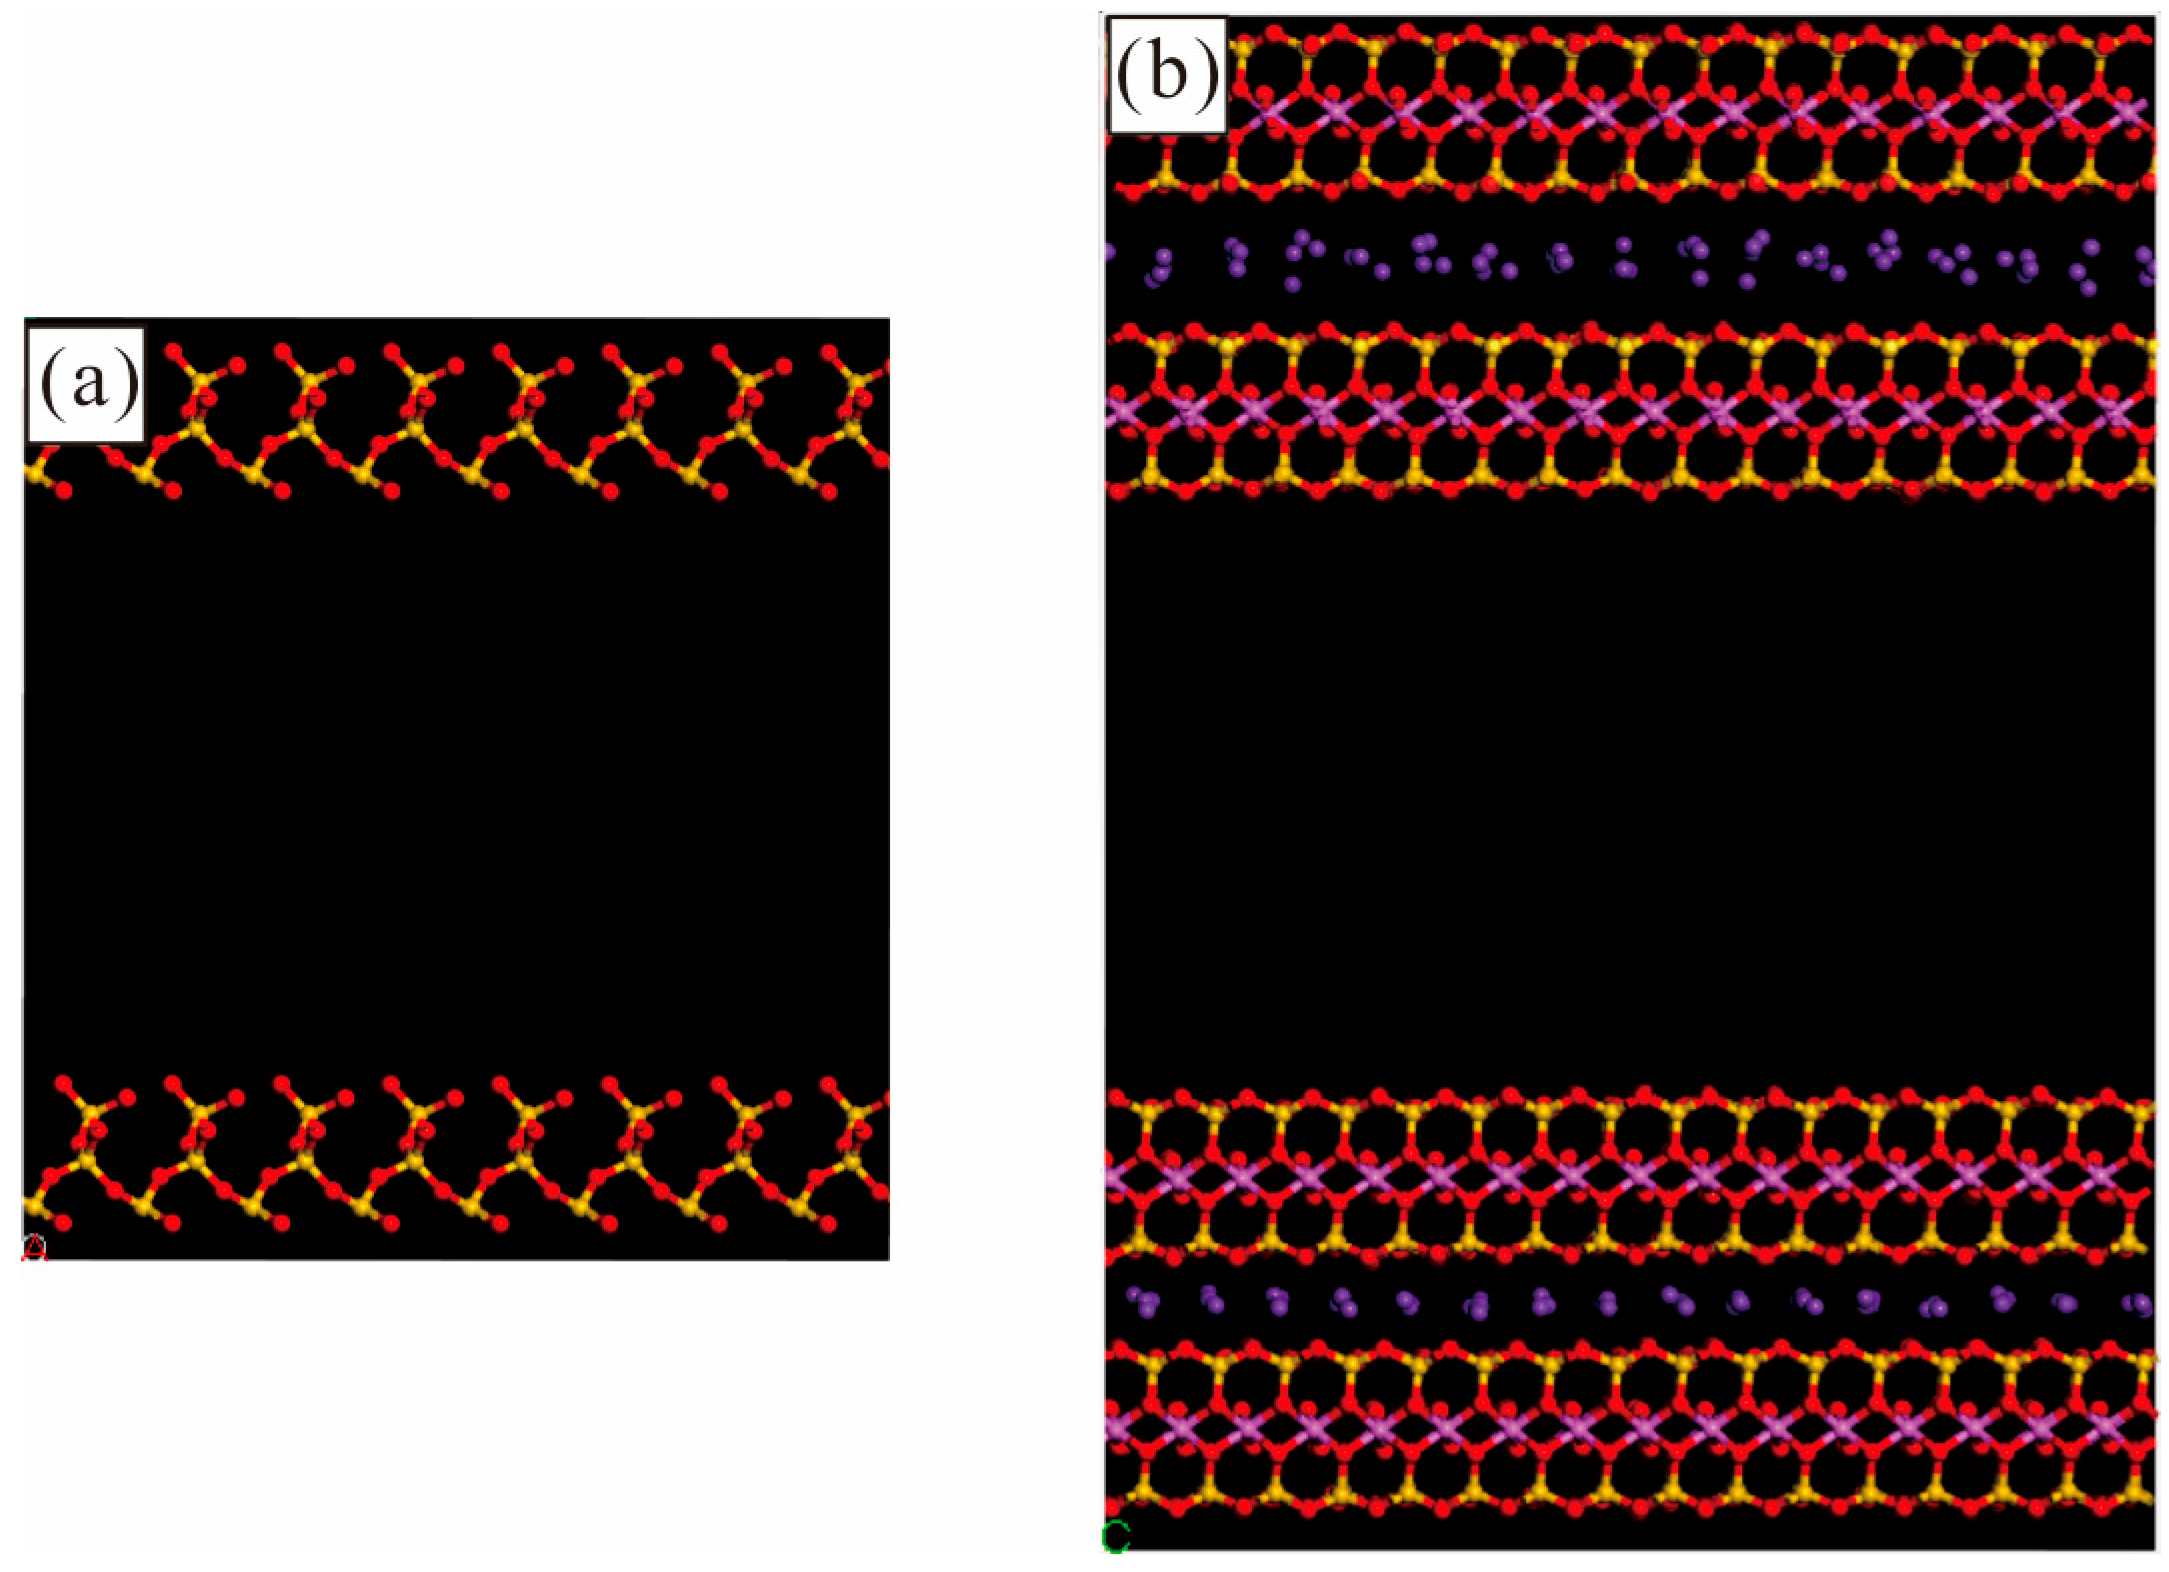
3.1. Shale Composition and Pore Morphology

Multiple deep marine shale samples from the Longmaxi Formation in the Sichuan Basin, Southwest China, were collected for an analysis of mineral composition and pore structure. The samples in this study were subjected to X-ray diffraction (XRD) and argon ion polishing scanning electron microscopy (SEM) experiments. The XRD testing was conducted using an X-ray diffractometer (Panaco Aeris, Malvern Panalytical Ltd., Worcestershire, UK), with sample sizes smaller than 200 mesh and dried for 24 h at 70 °C in a heating oven to remove moisture from the sample. Then, the dried powder samples are coated on the glass slides for XRD testing. The relative mineral content of shale samples was directly calculated by the SwiftMin software (version 1.4.66) using XRD spectra. The SEM testing was performed using the FIB/SEM Helios NanoLab 660 dual-beam scanning electron microscope (Helios NanoLab 660, produced by FEI company, Hillsboro, OR, USA).
The corresponding burial depth ranges from 3500 to 4500 m, with formation pressure exceeding 70 MPa [25] and formation temperature above 393.15 K [26]. The lithology of the samples is organic-rich black shale. The XRD results, shown in Figure 2, indicate that clay minerals and quartz are the main inorganic components in the Longmaxi Formation, with illite being the predominant clay mineral. Therefore, illite and quartz were selected as the inorganic mineral components for modeling, with methane chosen as the adsorbate for the adsorption simulation. As shown by the SEM results (Figure 3), elongated and slit-like inorganic pores are well developed in the clay minerals. Thus, the illite and quartz slit-like pores were constructed as the simulation model in this study.

3.2. Simulation Details

As mentioned above, quartz and illite were selected as the modeling minerals in this study. The illite crystal model, proposed by Gualtieri et al. [27] (Figure 4a), was selected to build the illite simulation model, which is widely used in shale gas adsorption simulation, with the general unit cell formula Al2.34Ca0.02Fe0.02H4K0.78Mg0.34Na0.02O12Si3.35, and the lattice parameters of a = 0.523 nm, b = 0.906 nm, and c = 1.25 nm. The crystal structure of the quartz simulation model was based on the α-quartz crystal model provided by the Material Studio (MS) software (version 20.1.0.2728) (Figure 4b). α-quartz is the most stable form of quartz and is widely distributed in nature. The α-quartz general unit cell formula is Si3O6, with lattice parameters of a = 0.491 nm, b = 0.491 nm, and c = 0.541 nm. The methane model was also based on the molecular model provided by the MS software. After constructing the single mineral crystal model, the supercell function was used to expand the quartz and illite unit cells into 8 × 8 × 1 and 8 × 4 × 1 supercells, respectively. These supercells were then cleaved along the (010) and (001) directions. The cleaved surfaces were neutralized by hydroxylating the surface oxygen atoms. The thickness of the processed illite supercell was 1.012 nm, and the thickness of the processed quartz supercell was 0.56 nm. These supercells were then used to construct simulation models of 1 nm, 2 nm, 4 nm, and 6 nm, each consisting of two supercells.
After constructing the simulation models, the Anneal and Geometry Optimization functions in MS software were used to optimize the illite, quartz, and methane simulation models to reach their most stable states. The ClayFF force field was applied to optimize the illite simulation model, the Universal force field was applied to optimize the quartz simulation model, and the COMPASS force field was applied to optimize the methane simulation model. The optimized models are shown in Figure 5.
Subsequently, the methane adsorption simulation process was performed using these optimized models. The Fixed Pressure module within the Sorption function of MS software was selected for the adsorption simulation. The ClayFF force field was employed to describe the interactions within the illite simulation model, and the Universal force field was applied to describe the interactions within the quartz model. The Ewald method was used to describe intermolecular interactions, the Atom-Based method was chosen to model intermolecular van der Waals forces, and the Nose thermostat method was selected to control the temperature within the model. The NVT ensemble was selected for the simulation. During the simulation, the equilibrium and production steps were set to 1 × 10⁶ and 1 × 10⁷, respectively, with a cutoff radius of 0.5 nm and a calculation accuracy of 1 × 10⁻⁵ kcal/mol. The simulation temperatures were set to 393.15 K, 403.15 K, and 413.15 K, approximately corresponding to a buried depth of 4000 m, 4400 m, and 4800 m, respectively. The 5 MPa pressure gradient and 90 MPa maximum pressure were set, and the maximum pressure approximately corresponded to a buried depth of 4800 m. It should be noted that in the MS software, pressure is represented by fugacity; therefore, it is necessary to convert pressure to fugacity to avoid bias in the simulation results.

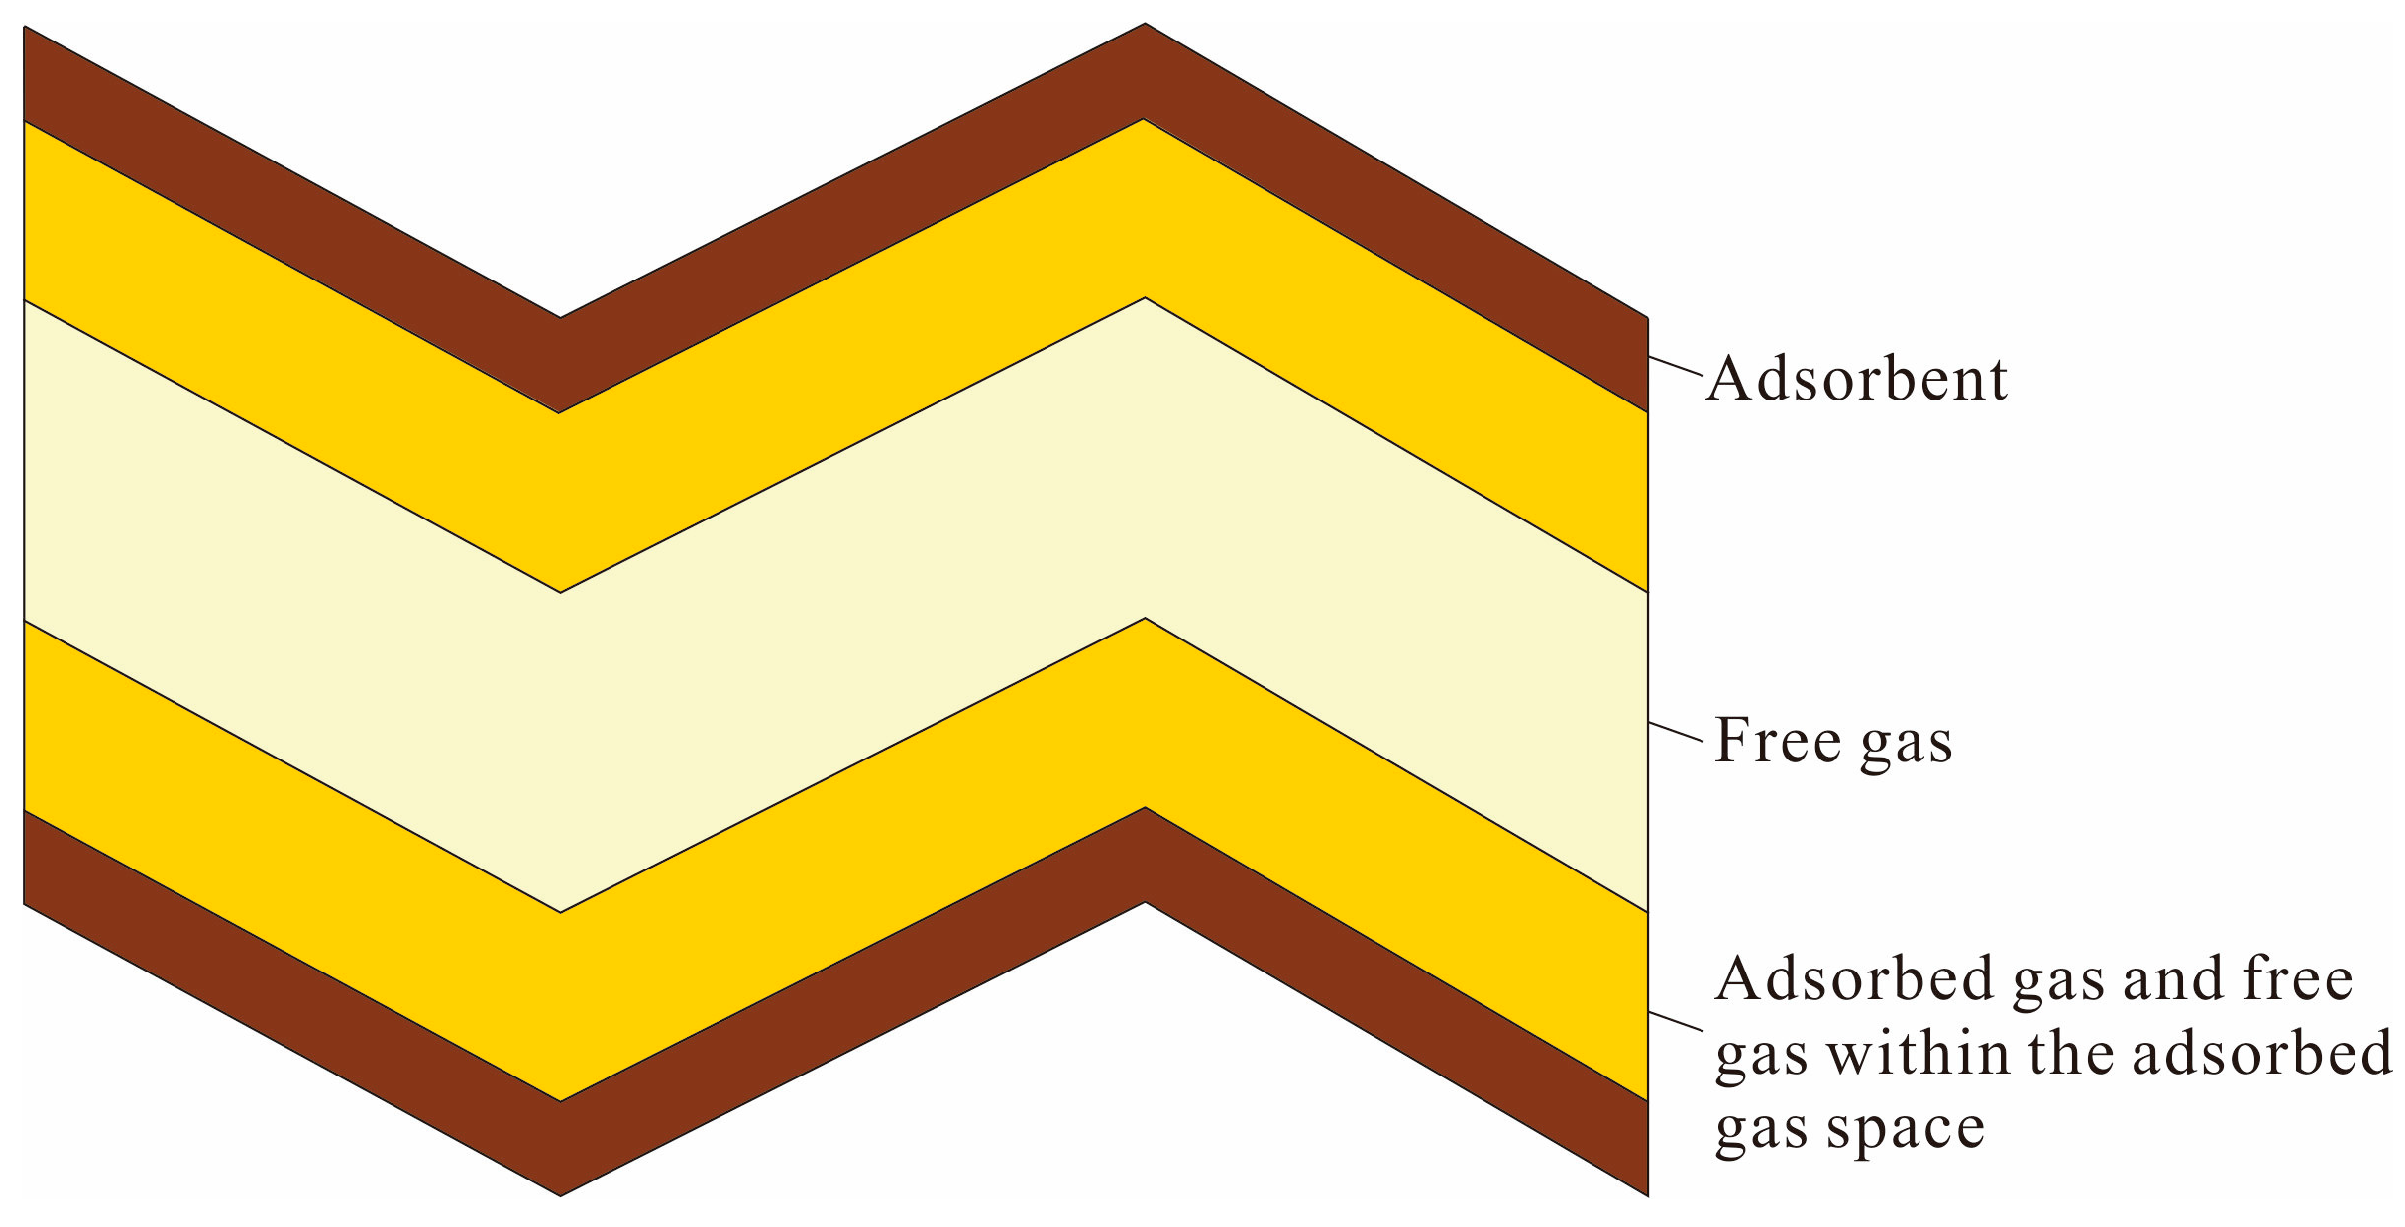
3.3. Excess Adsorption Calculation

The formation temperature of the Wufeng–Longmaxi deep marine shale in the Sichuan Basin significantly exceeds the critical temperature of methane, so methane is present in a supercritical state within the shale reservoir [11]. Gibbs proposed that in supercritical adsorption, not all adsorbate molecules near the surface of the adsorbent should be regarded as contributing to the adsorption capacity [28]. Adsorbate molecules near the surface of the adsorbent can be categorized into two types: one is the adsorbed molecules, which are influenced by intermolecular van der Waals forces, and the other is the free molecules, which are not affected by intermolecular van der Waals forces [29]. Based on the above understanding, Gibbs proposed the calculation formula for excess adsorption, as shown in Equation (1):
nex = nab − ρg × Va
where nex represents the excess adsorption capacity, mol/g; nab represents the adsolute adsorption capacity, mol/g; ρg represents the free gas density, g/cm3; and Va represents the adsorbed gas volume, cm3.
Under supercritical conditions, when the temperature is constant, the difference between the absolute adsorption capacity and the excess adsorption capacity increases as pressure rises. This is because as pressure increases, the density of the free-phase gas increases, and the difference between the free-phase gas density and the adsorbed-phase gas density decreases, causing the difference between excess adsorption and absolute adsorption to become larger. When the pressure is sufficiently high, the density of free methane exceeds that of adsorbed methane, and the excess adsorption can become negative [30,31]. The molecular simulation result is the total gas capacity, which includes both adsorbed gas capacity and free gas capacity within the pore space. Moreover, the MS software is unable to obtain the adsorbed gas volume, so the excess adsorption capacity cannot be calculated using Equation (1), and it should be modified. The schematic diagram of gas distribution in shale pores under supercritical conditions is shown in Figure 6. The gas within the pores is divided into three parts: adsorbed gas, free gas, and free gas within the adsorbed gas space. The molecular simulation results correspond to the total of these three parts. Free gas is extensively distributed in the shale pore space, so excess gas adsorption can be represented as the difference between the total gas capacity in the shale and the free gas capacity. The pore space in the simulation model corresponds to the free volume in the model, so Equation (1) can be revised and expressed in Equation (2).
nex = n − ρg × (Va + Vg) = n − ρg × VP
where n represents the total gas capacity, mol/g; VP represents the free volume in the simulation model, cm3.
The methane bulk phase density in different temperature and pressure conditions was calculated by the Peng–Robinson EOS equation [33], and is shown in Table 1.

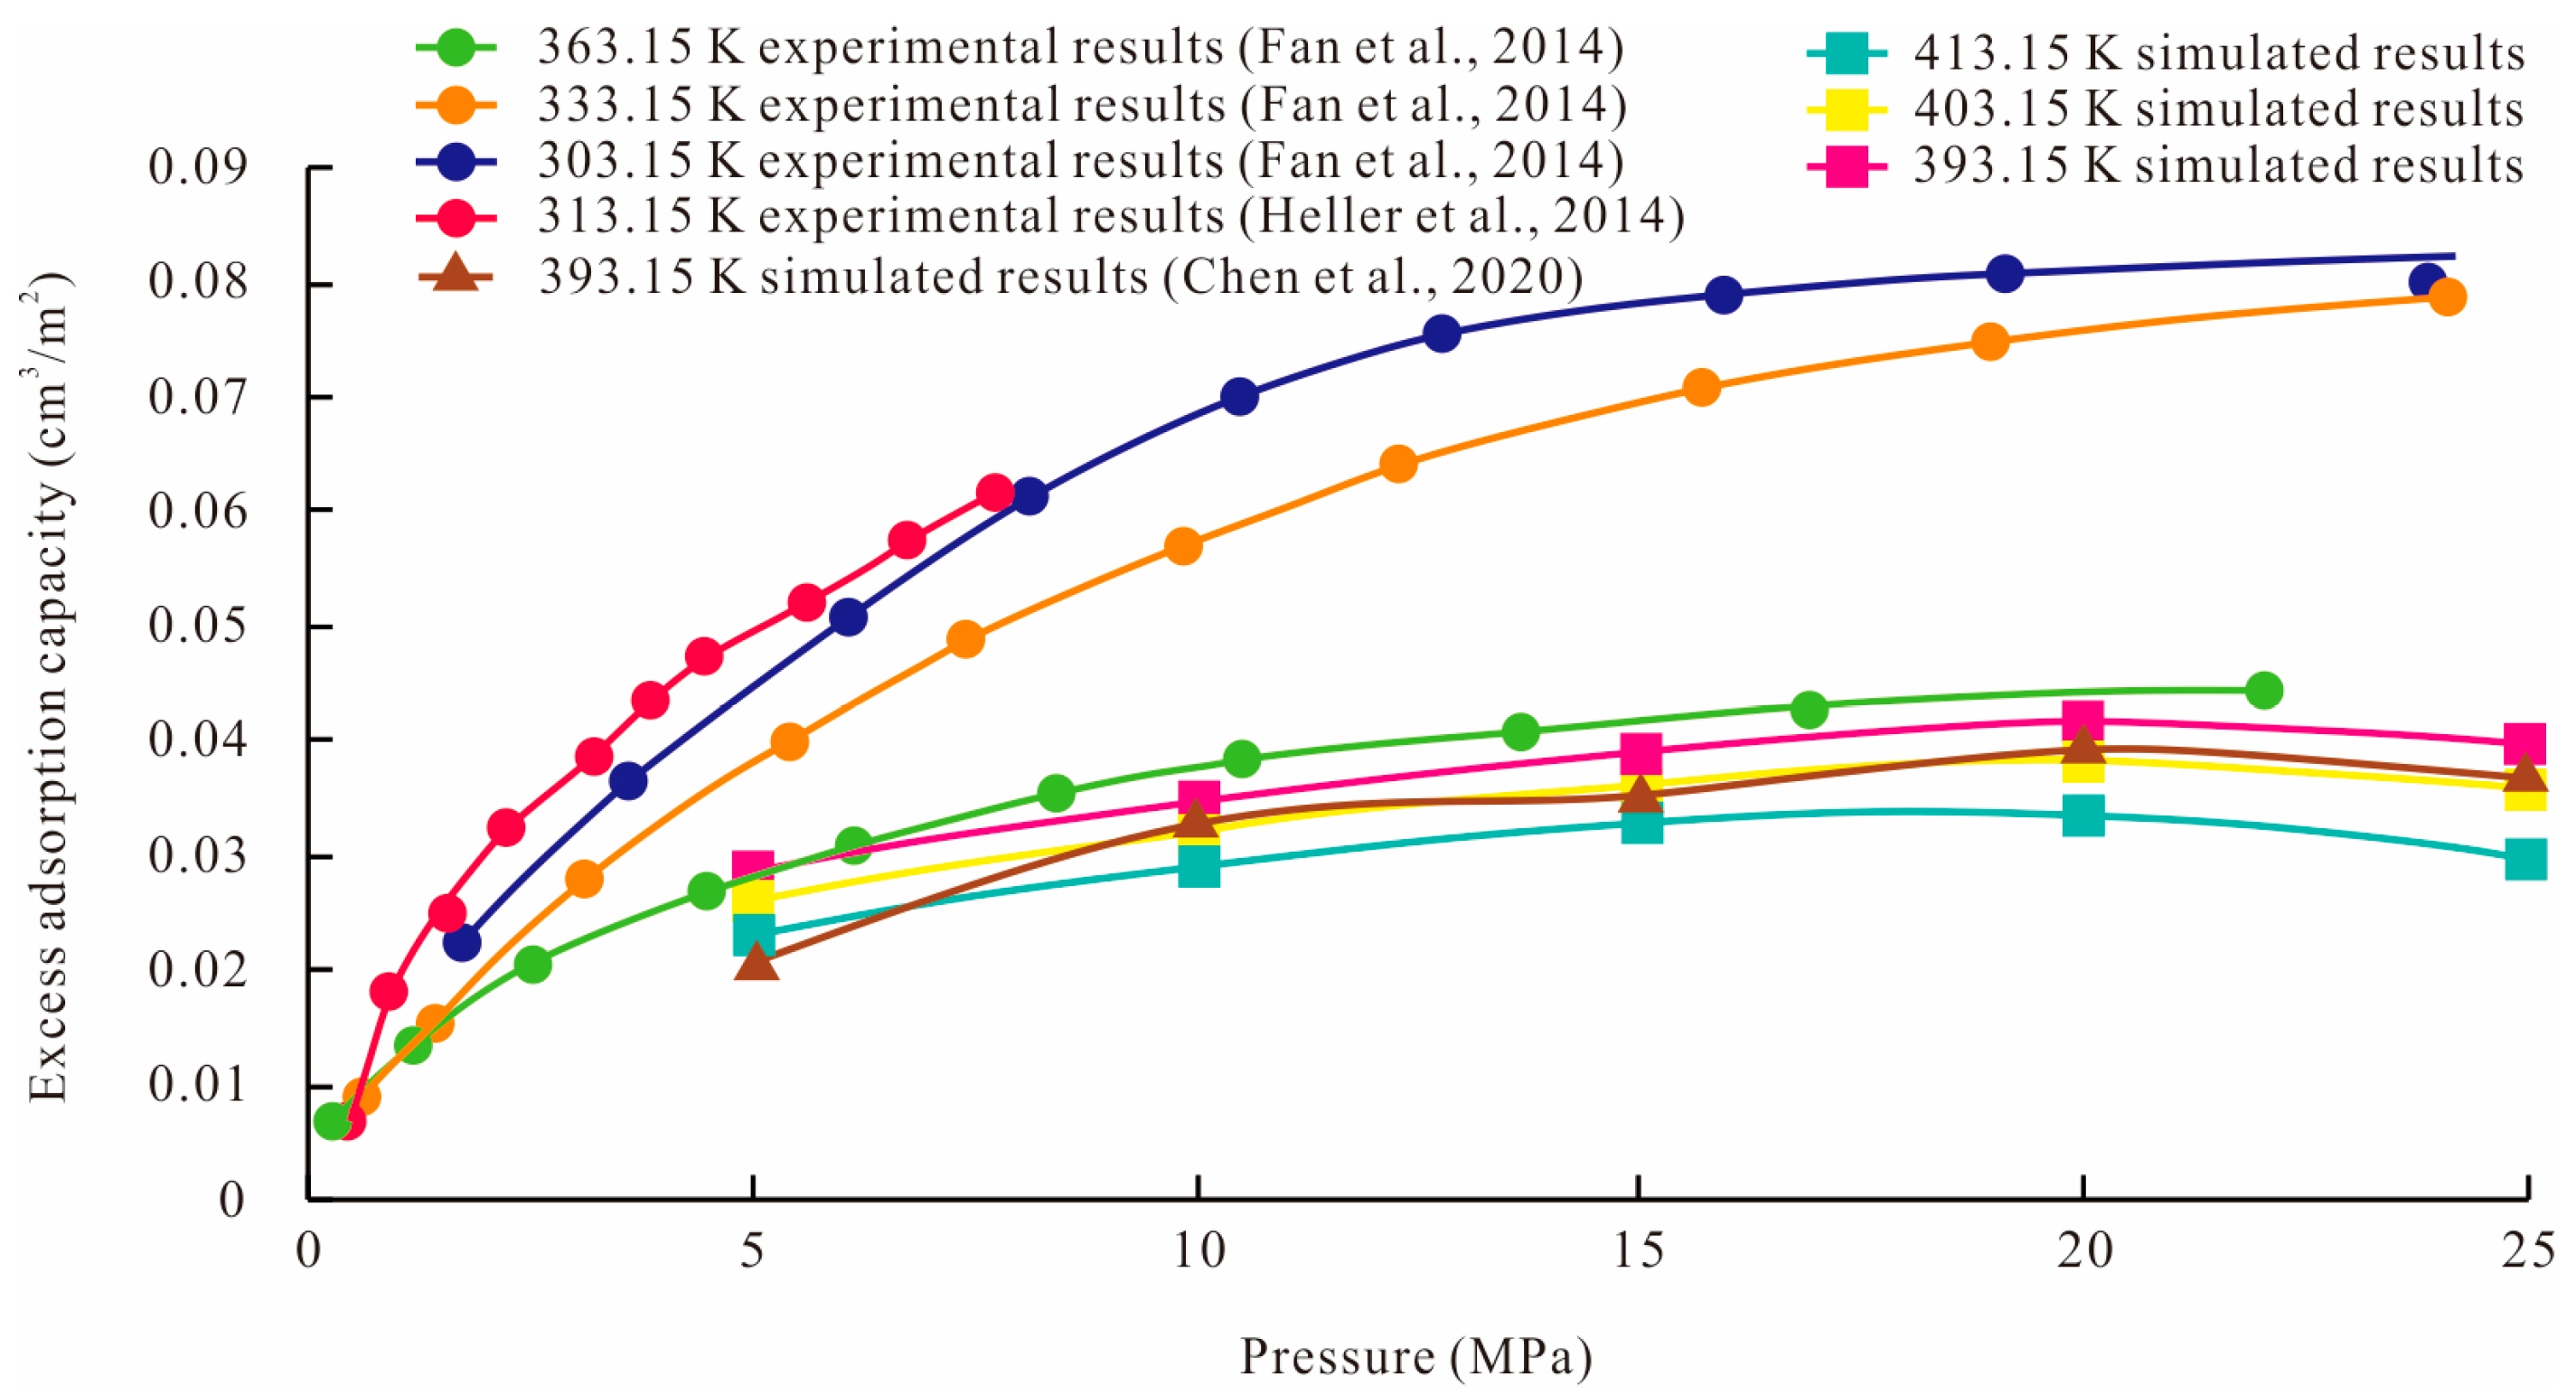
3.4. Validity of Simulation Results

The results of molecular simulations are influenced by factors such as the crystal structure of the simulation model, the chosen force field type, and the force field parameters. Therefore, comparison with methane isothermal adsorption experimental data is necessary to validate the model and parameter rationality. However, the simulation model has uniform pore sizes, a simple pore structure, and a specific surface area much higher than that of natural minerals, so the simulated results are much higher than the experimental results, making direct comparison impossible [17,34]. Previous studies have indicated that the adsorption capacity of adsorbent is mainly influenced by the surface area, so the simulation results can be converted to adsorption amounts per unit surface area of the adsorbent [17]. The comparison of the converted simulated and experimental excess adsorption capacity is shown in Figure 7. While there is some discrepancy between the experimental and simulation results, they fall within the same order of magnitude, and the trends are similar. The reasons for the differences may be as follows: (1) The MS software determines the free volume within the simulation model using He atoms. Since the atomic diameter of He is smaller than that of methane molecules, the free volume calculated is larger than it should be [35]. (2) Differences in temperature and pressure conditions between the experiments and simulations result in discrepancies between them. (3) The simulation model uses ideal mineral crystals, while natural mineral samples in actual experiments contain impurities, and their crystal structures are not ideal, with lattice defects and isomorphous substitution. (4) The pore structure in the simulation model is relatively simple, consisting of slit-like pores, while the pore structure in actual minerals is much more complex, and the pore morphology can influence the adsorption capacity. In general, the simulation results are of the same order of magnitude as the experimental results, confirming the validity of the model and parameter selection (Figure 7).

4. Results and Discussion

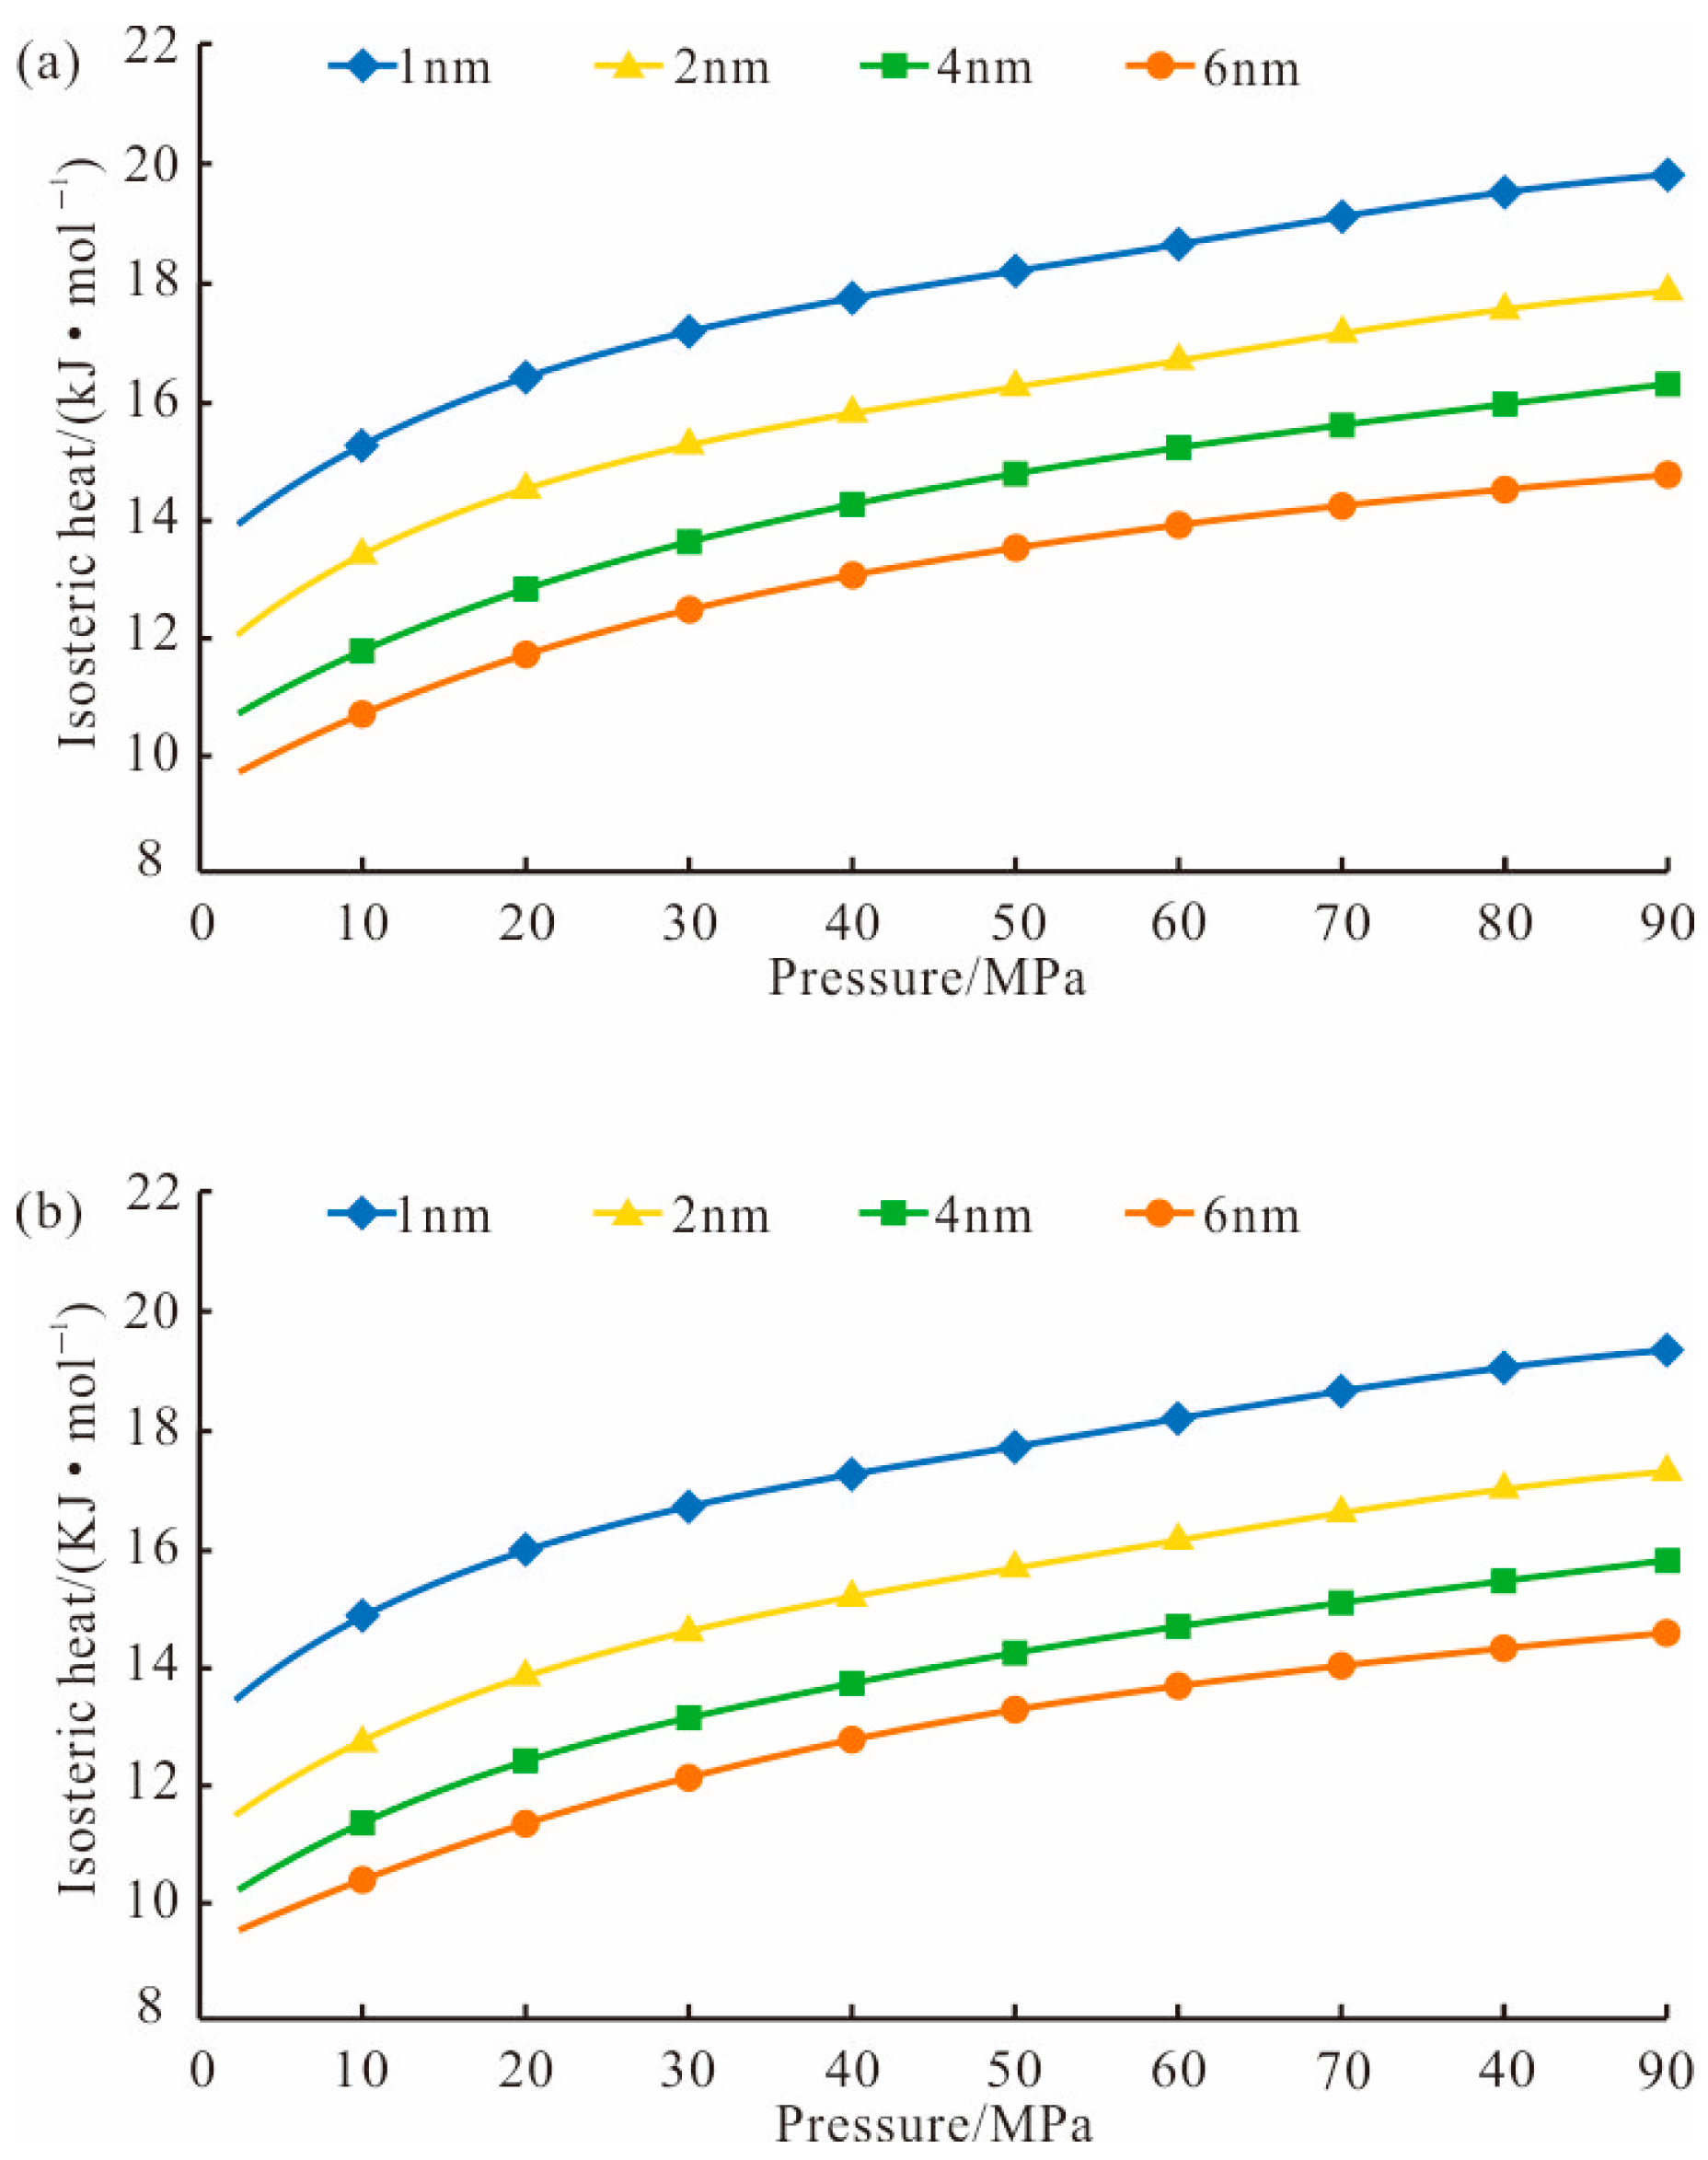
4.1. Methane Isosteric Adsorption Heat

The methane isosteric adsorption heat is a key parameter for characterizing the adsorption capacity of shale, representing the comprehensive result of reaction energy changes in the adsorption process [39]. Additionally, isosteric adsorption heat varies with the absolute adsorption capacity of methane [40]. In this study, the isosteric heat of adsorption for illite simulation models of 1 nm, 2 nm, 4 nm, and 6 nm under varying temperature and pressure conditions was calculated based on the simulation results. Figure 8 demonstrates that the isosteric adsorption heat for the methane adsorption process in the illite and quartz simulation models under various temperature and pressure conditions was below 42 kJ/mol, indicating that the adsorption of methane in illite belongs to physical adsorption [41]. The isosteric adsorption heat of illite and quartz, in descending order, is illite > quartz, indicating that illite has a stronger methane adsorption capacity than quartz. Additionally, the adsorption heat gradually increases with rising pressure. This phenomenon suggests that the adsorbed methane capacity in the slit increases with rising pressure, resulting in the release of more heat. Additionally, isosteric adsorption heat increases with decreasing pore size; this can be explained by the adsorption potential theory. In the simulation model, the pore walls with smaller pore sizes are closer together, and the adsorption potential overlaps between the pore walls, exerting a stronger force on methane molecules than in wider pore sizes. This leads to greater isosteric adsorption heat.

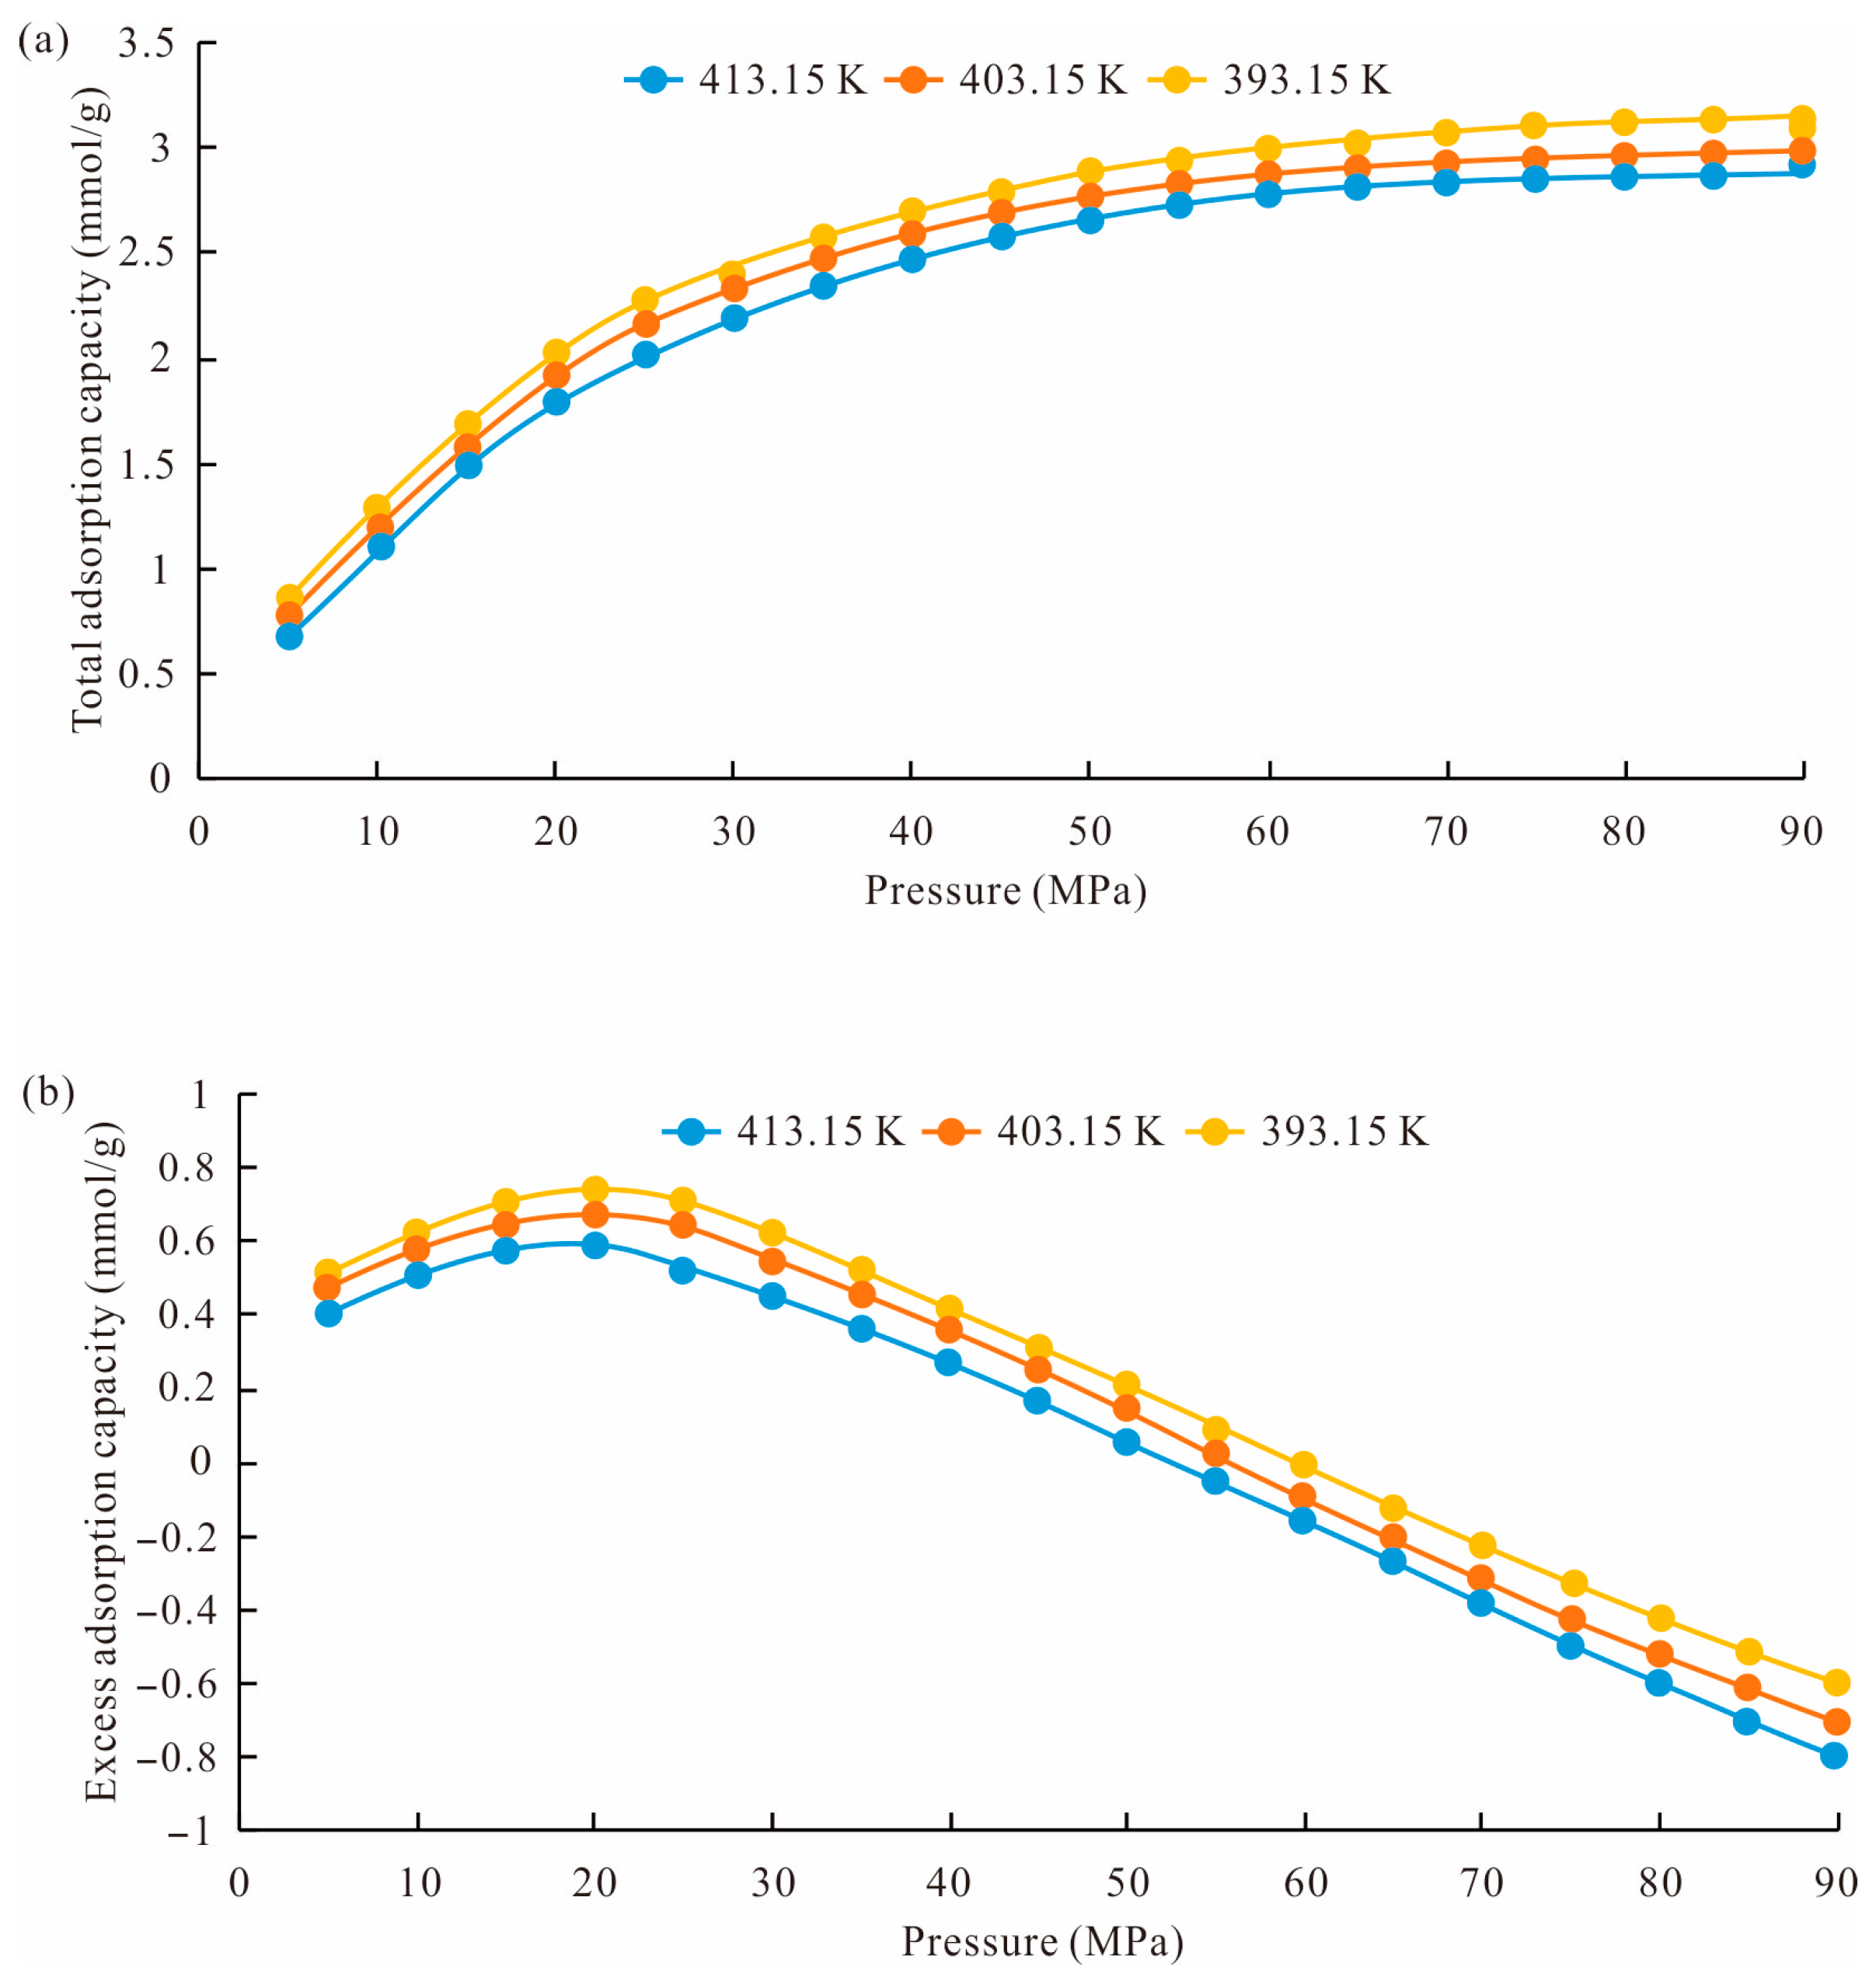
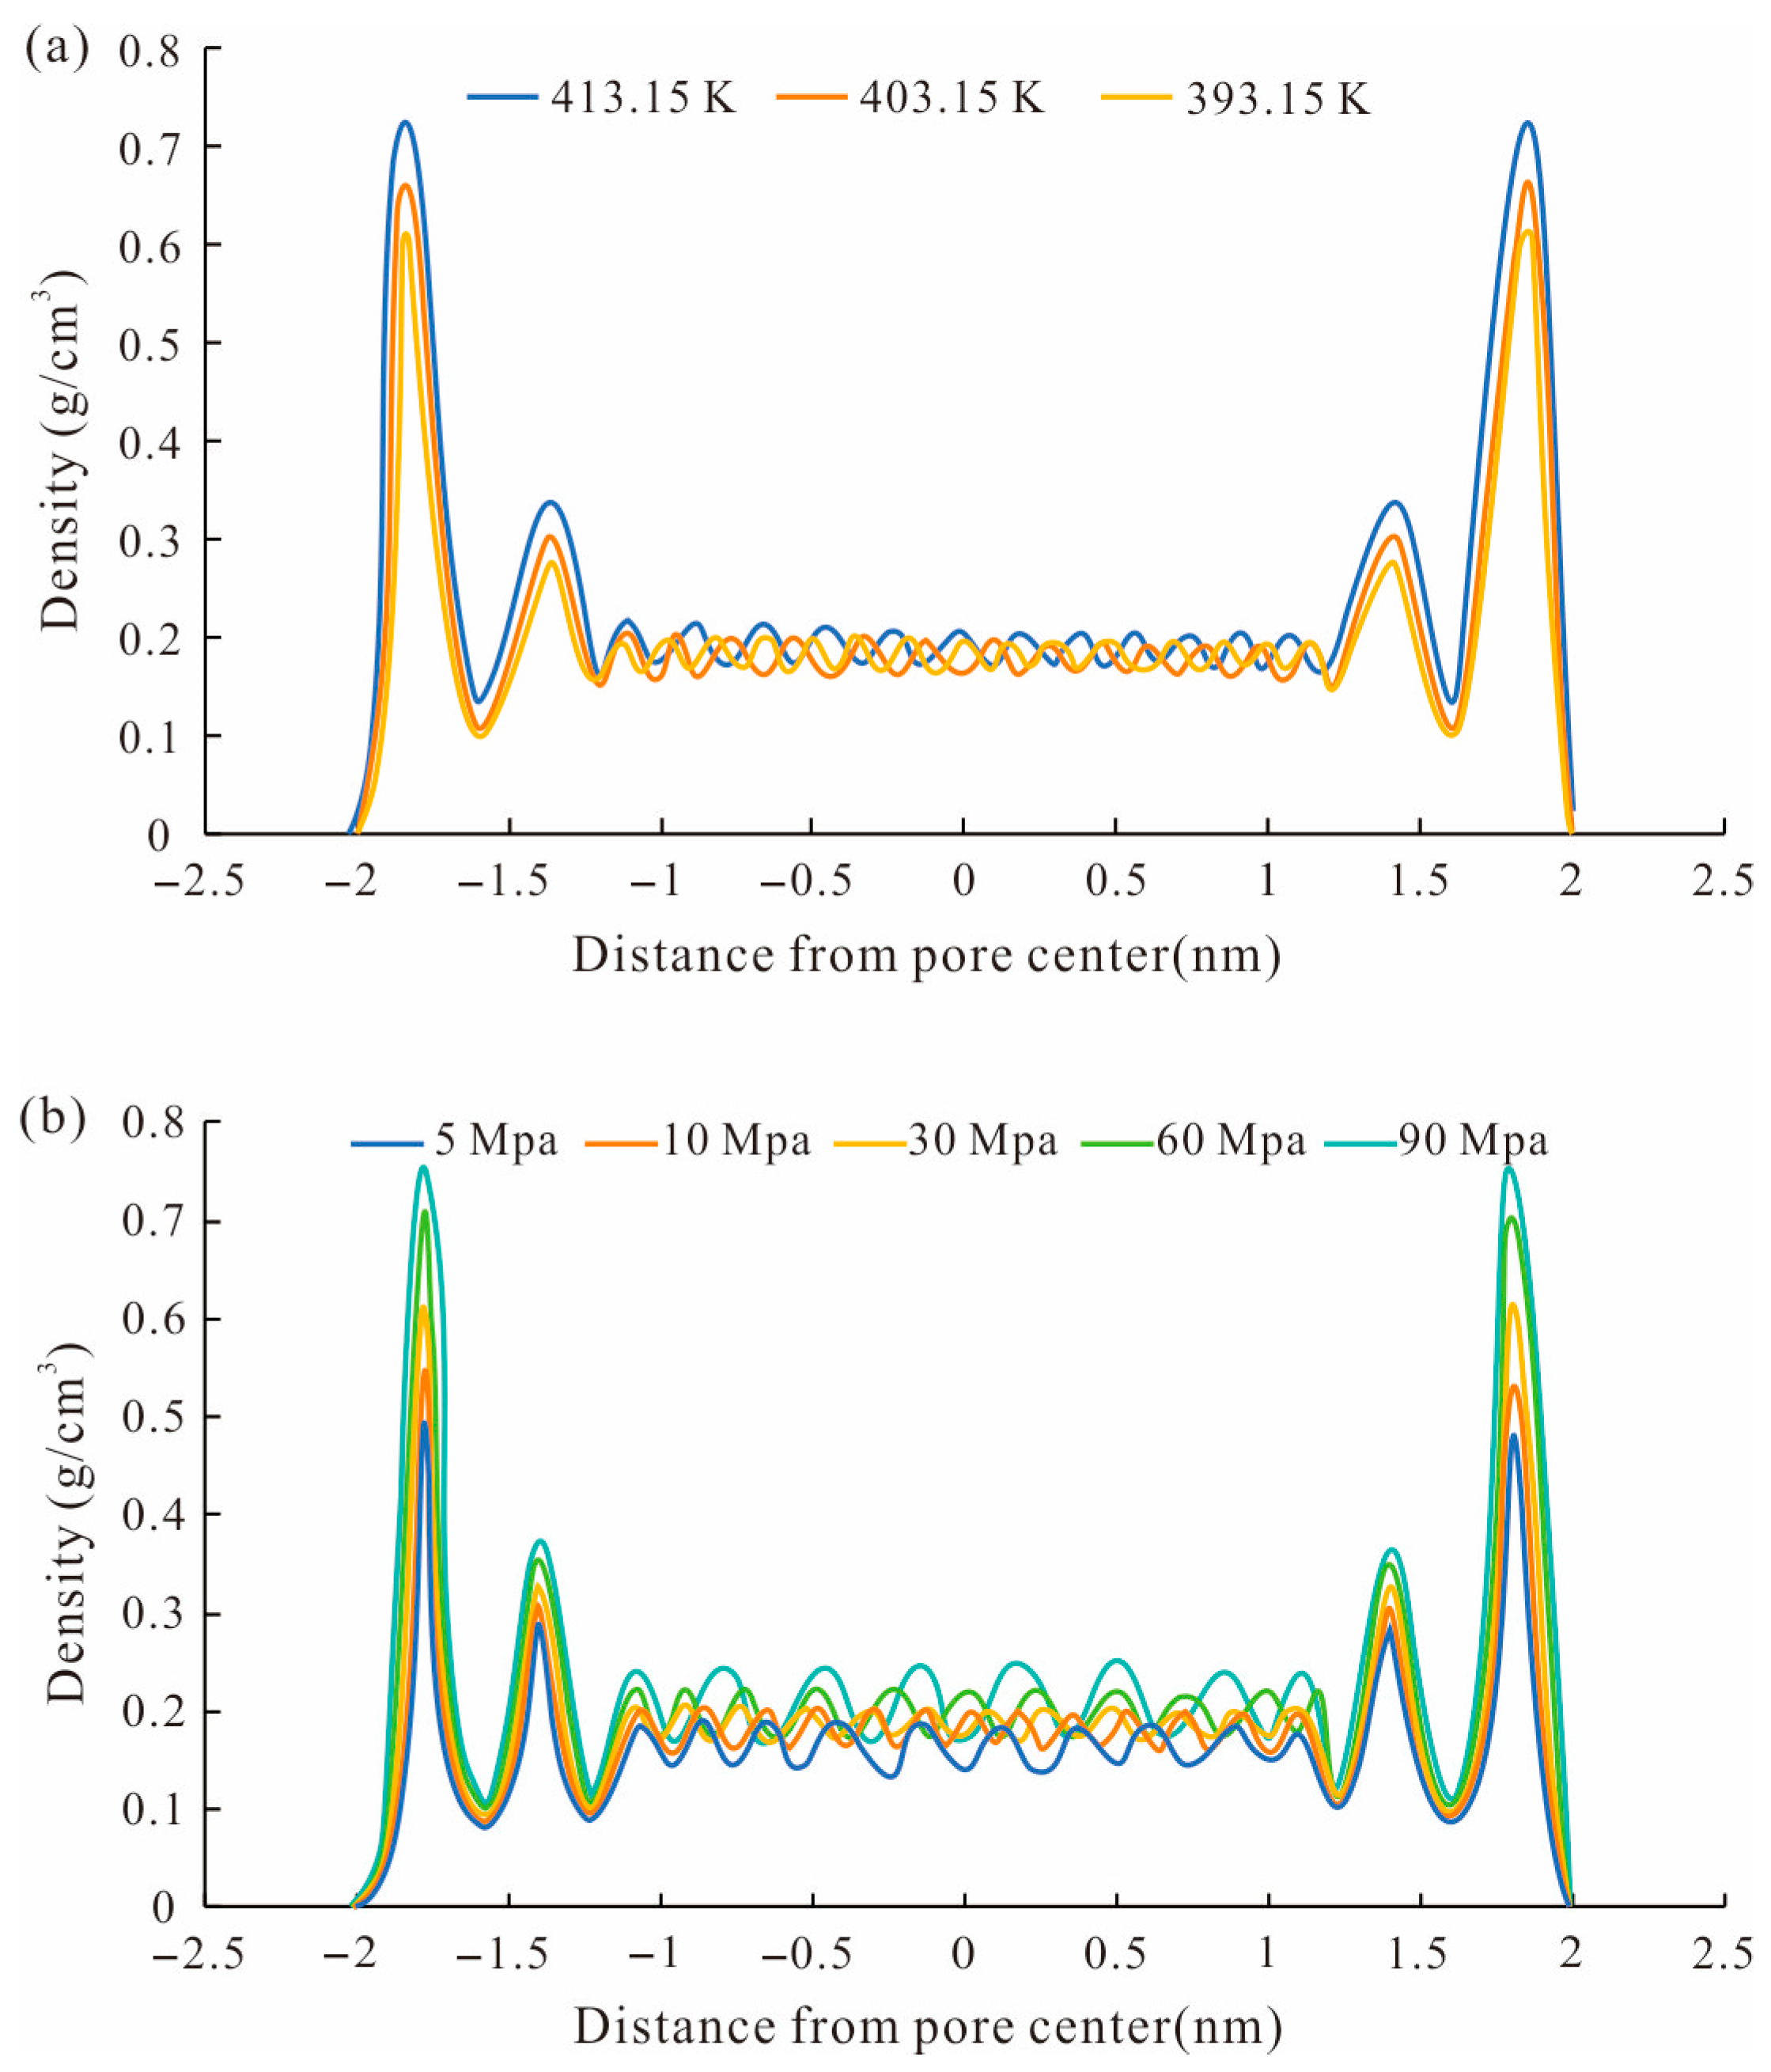
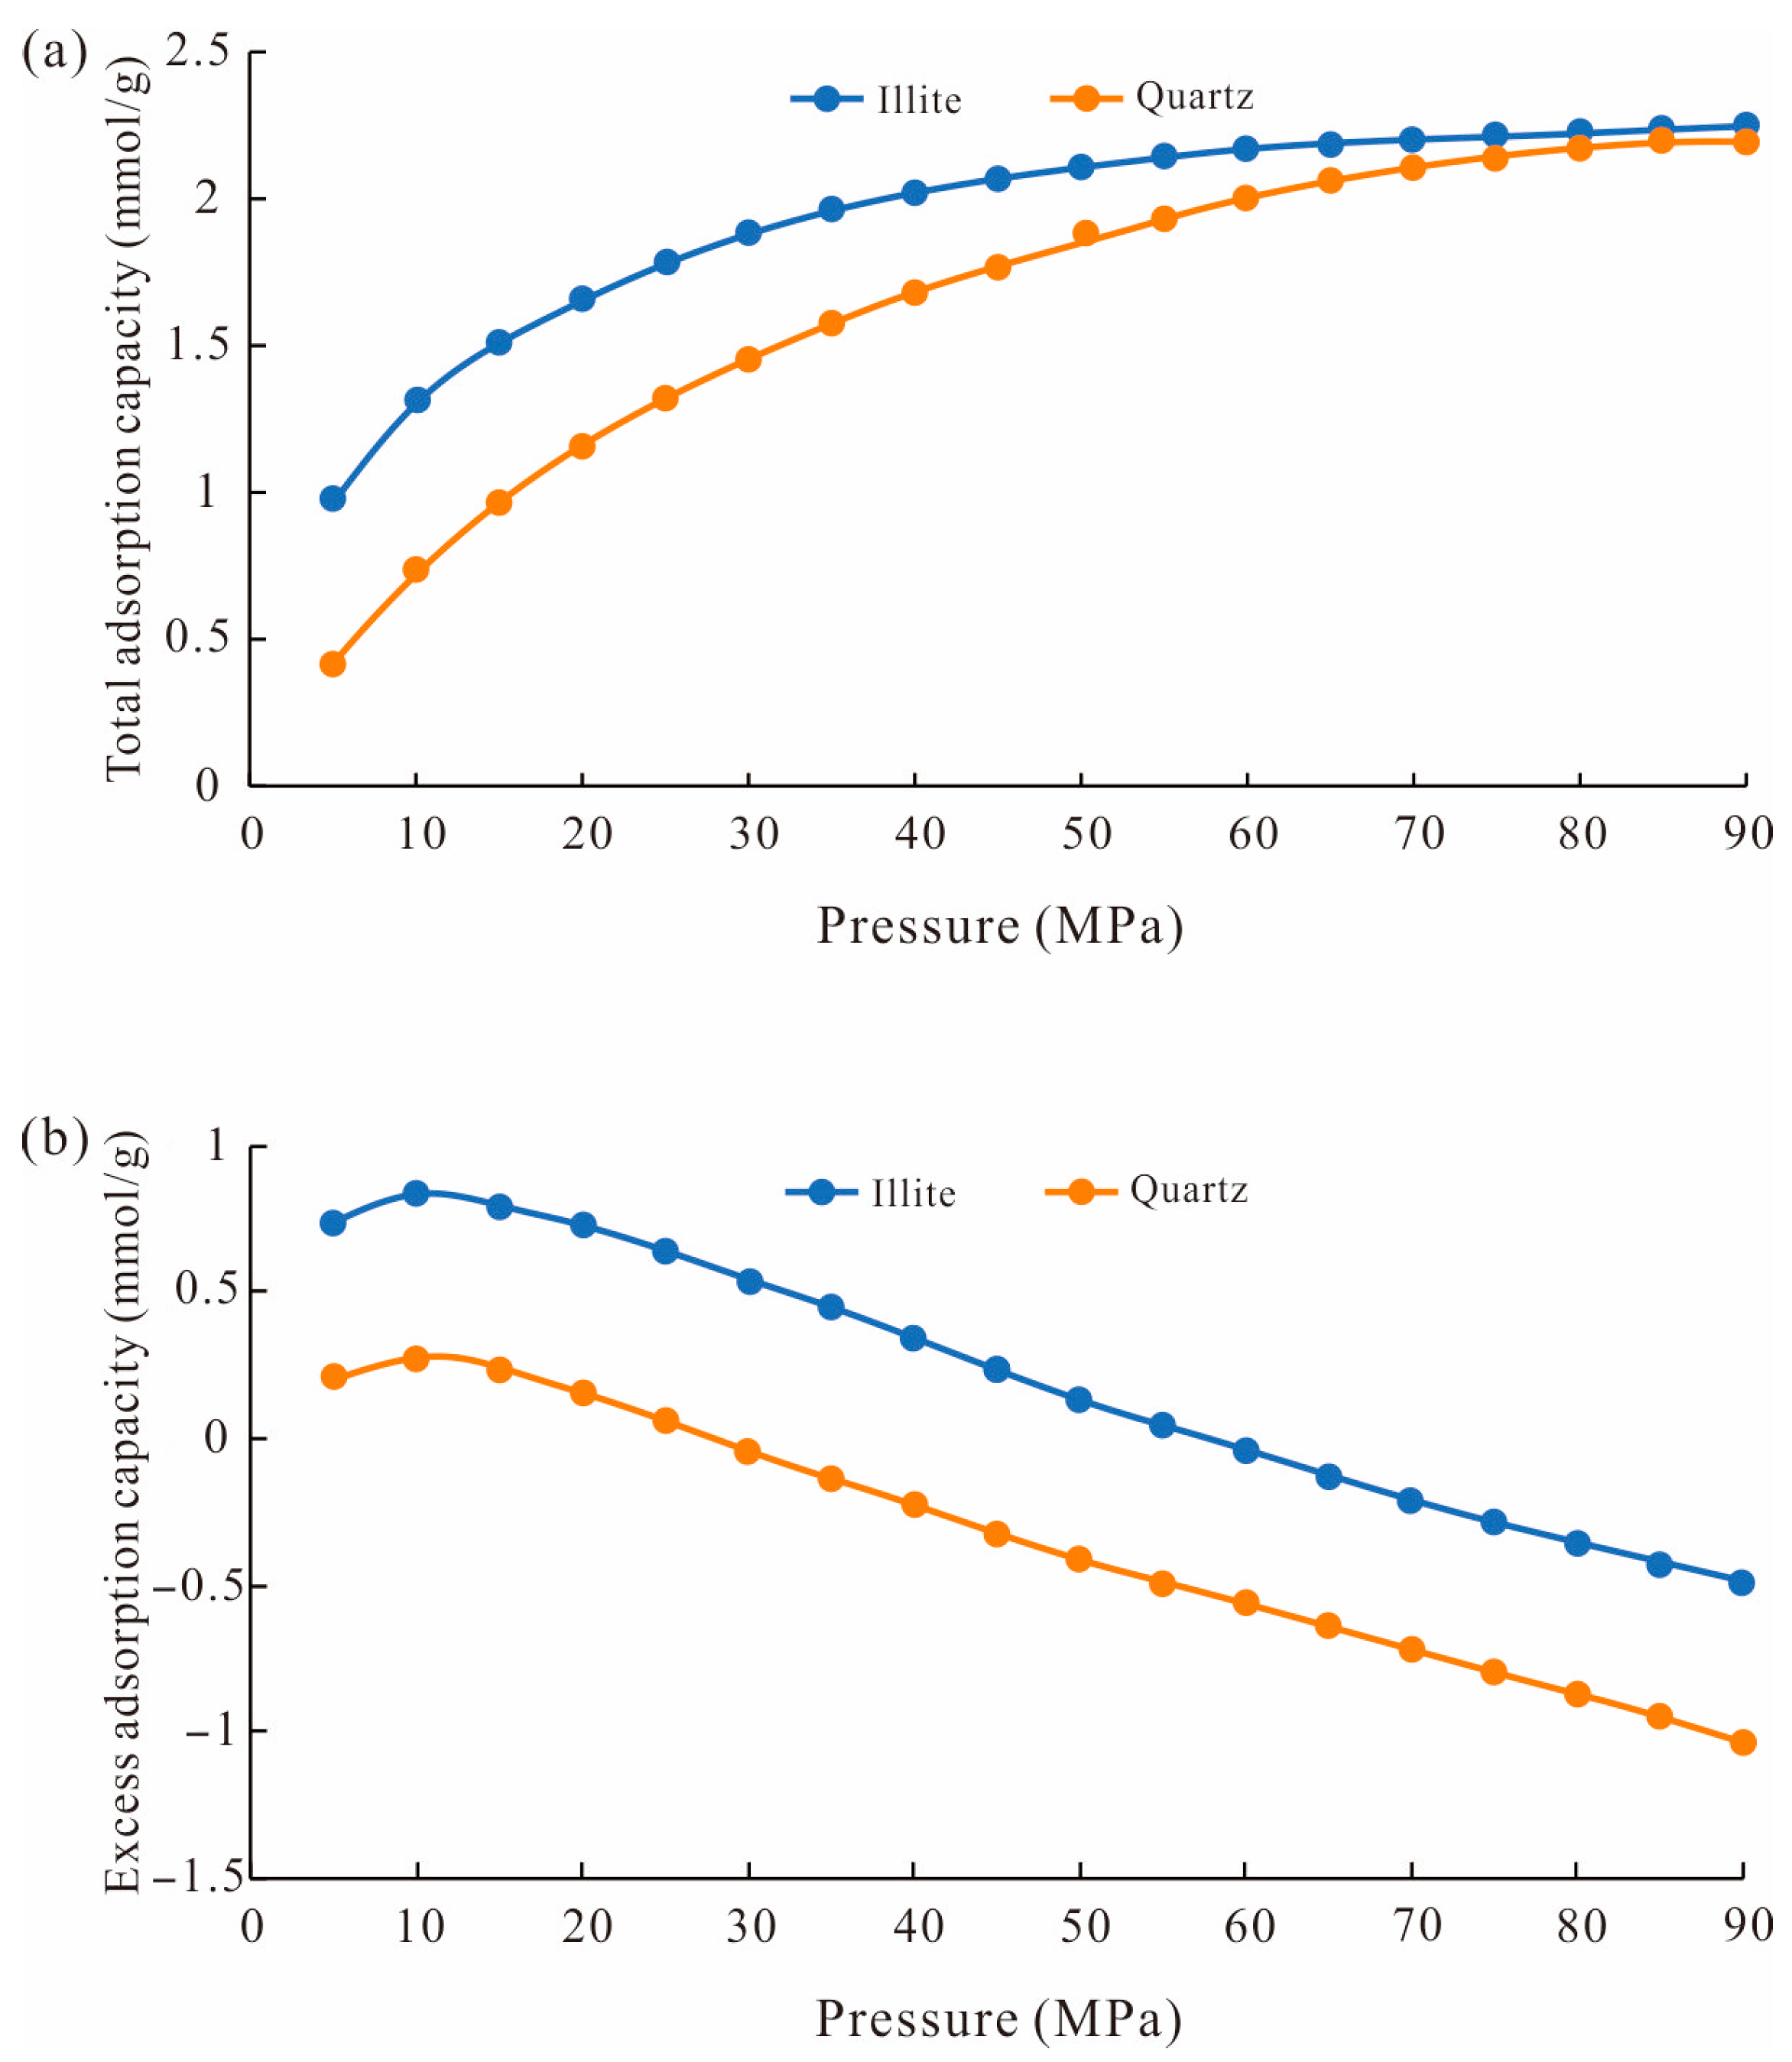
4.2. The Effect of Temperature and Pressure on the Shale Adsorption Capacity

To explore the influence of temperature and pressure on the adsorption capacity of deep marine shale, three temperatures (393.15 K, 403.15 K, and 413.15 K) were set to simulate the methane adsorption process in the illite simulation models. Figure 9a–c presents the results for the 4 nm illite simulation model at 393.15 K, 403.15 K, and 413.15 K under a pressure of 40 MPa. The adsorbed methane concentrates mainly on both sides of the pore walls, where it exhibits a high density, and the movement of molecules is limited. In the center of the slit, the distance between methane molecules increases, resulting in a relatively lower density. The number of methane molecules in the illite simulation model increases with rising pressure. At lower pressure, the number of methane molecules initially increases rapidly, while as pressure continues to rise, the increasing rate slows until it reaches a constant value.
The methane adsorption results directly reflect the distribution of methane in the simulation models; however, they do not accurately represent the methane adsorption capacity. Based on the methane adsorption simulation results, methane adsorption curves for the two simulation models at different temperatures were plotted in this study. As shown in Figure 10, with increasing temperature, both the total methane adsorption capacity and the excess adsorption capacity in illite decrease. When the pressure reaches 50 MPa, the total adsorption capacity of the illite simulation model is 5.252 mmol/g at 393.15 K, 5.150 mmol/g at 403.15 K, and 4.982 mmol/g at 413.15 K. Therefore, methane adsorption is an exothermic process. The kinetic energy and the ability of methane molecules to move freely increase with rising temperature, allowing more adsorbed methane molecules to overcome the pore wall adsorption potential and transition into the free phase [12,42]. The morphology of the total methane adsorption curve at different temperatures remains largely consistent, and the effect of temperature on the total adsorption capacity is slightly stronger at higher pressures than at lower ones. This suggests that the number of methane molecules in the simulation model under high pressure exceeds that under lower pressure, and more methane molecules are affected by higher temperatures. Additionally, there are differences among the total methane adsorption curves at different temperatures, with the curve at higher temperatures showing a lower value than that at lower temperatures. This indicates that the effect of temperature on methane adsorption capacity decreases at higher temperatures.
As pressure increases, the total methane adsorption capacity increases rapidly at first, then more slowly. When pressure exceeds 60 MPa, the growth rate of methane adsorption capacity slows down and tends to stabilize. The total methane adsorption capacity is 3.07 mmol/g at 80 MPa, 393.15 K; 3.08 mmol/g at 85 MPa, 393.15 K; and 3.09 mmol/g at 90 MPa, 393.15 K. Additionally, the excess adsorption curve first increases, then decreases as pressure increases, with methane excess adsorption capacity reaching its maximum at 20 MPa. This phenomenon is explained by the definition of excess adsorption, which is the difference between the density of adsorbed methane and that of free methane within the pore. As pressure increases, the adsorption sites in the adsorbent are gradually occupied by methane molecules, and the density of adsorbed methane approaches a constant value. At the same time, free methane in the slit center is in a supercritical state and cannot be liquefied [8]. Therefore, the difference between adsorbed and free methane first increases, then decreases as pressure rises. The excess adsorption capacity becomes negative when pressure exceeds 60 MPa, and this conclusion is consistent with the findings of Huang et al. [31].
To investigate the density distribution of methane molecules in illite slits under different temperatures and pressures, methane density distribution curves at 5, 10, 30, 60, and 90 MPa at 403.15 K, and at 393.15 K, 403.15 K, and 413.15 K at 40 MPa are plotted based on the 4 nm illite slit simulation results. Figure 11 demonstrates that the methane density distribution curve is approximately symmetrically distributed along the simulation model, and maximum values appear on both sides of the curve, corresponding to the main adsorbed methane layers shown in Figure 9. Additionally, a secondary adsorbed methane layer appears in the methane density distribution curve. The free methane molecules are affected by superimposed adsorption potential between the main adsorbed layer and the illite pore wall, which restricts their movement and leads to the formation of a secondary methane adsorbed layer. It can also be attributed to the chosen simulation parameters [33]. The density of the secondary adsorbed layer is significantly lower than that of the main adsorbed layer, but higher than the free methane density in the slit center. Therefore, we believe that double-layer adsorption is a characteristic of methane adsorption in deep marine shale. As temperature increases, the density of the adsorbed methane layer decreases, measuring 0.714 g/cm3 at 393.15 K, 0.694 g/cm3 at 403.15 K, and 0.644 g/cm3 at 413.15 K, while the density of free methane increases slightly. Furthermore, the methane density in the slit increases with pressure, and the methane growth rate is faster at lower pressures. At lower pressures, the methane adsorption capacity in the slit is small, and intermolecular repulsion is weak. As pressure rises, the total methane adsorption capacity increases rapidly, and intermolecular repulsion correspondingly increases. Thus, the total methane capacity tends to stabilize at high pressure. In summary, high temperatures are unfavorable for methane adsorption in shale, while high pressure benefits the total adsorption capacity.

4.3. Effect of Pore Size

The pore structure in deep marine shale is complex, with significant variations in pore size and strong microheterogeneity [43]. Clarifying the influence of pore size in deep marine shale on methane adsorption is beneficial for the exploration of deep marine shale gas. Therefore, 1, 2, 4, and 6 nm illite and quartz simulation models were used in this study.
The simulation results shown in Figure 12 indicate that as pore size increases, the reservoir space in the simulation model also increases, leading to a corresponding rise in free methane capacity, while the amount of adsorbed methane remains relatively constant. However, the simulation results cannot quantitatively describe the distribution of adsorbed methane. Therefore, the total methane adsorption capacity, which increases with pore size, was plotted. As shown in Figure 13, the total methane adsorption capacity increases with pore size. Additionally, the larger the pore size, the faster the rate of increase in total methane adsorption capacity. Larger pores provide more space for accommodation. As pressure increases, more methane molecules are required to fill the reservoir space, thus offsetting the simulated pressure. In addition, the methane excess adsorption capacity is also influenced by pressure. The pressure at which excess methane adsorption capacity is maximized increases as pore size increases. In the 1 nm and 2 nm slits, it is 10 MPa, while it reaches 20 MPa in the 4 nm and 6 nm slits. Meanwhile, the maximum excess adsorption capacity decreases with increasing pore size, which is explained by the adsorption potential theory. Narrower slits have smaller pore sizes and stronger superimposed adsorption potential, which affects the adsorbed methane density. Therefore, the density of adsorbed methane is higher in narrower pores, and the adsorption heat results also support this (Figure 8).
The methane density distribution curve in illite slits with different pore sizes at 403.15 K and 30 MPa is shown in Figure 14. This suggests that as the pore size increases, the adsorbed methane density decreases. The adsorbed methane layer density in the 1 nm slit is 0.828 g/cm3, in the 2 nm slit is 0.752 g/cm3, in the 4 nm slit is 0.603 g/cm3, in the 6 nm slit is 0.439 g/cm3, while the free methane density remains essentially unchanged. The thickness of the adsorbed layer is approximately 0.4 nm, which is close to the methane molecular diameter (0.38 nm). Therefore, the primary adsorbed methane layer consists of a single-layer adsorption. Additionally, the thickness of the adsorbed methane layer is about 0.8 nm (Figure 14). When the pore size is smaller than 1.6 nm, the reservoir space is insufficient to form a secondary adsorbed methane layer. In contrast, when the pore size exceeds 1.6 nm, the reservoir space is capable of forming a secondary adsorbed methane layer, consistent with the findings of Li et al. [8]. In summary, adsorbed methane primarily occurs in smaller pores, while larger pores have a higher total adsorption capacity.

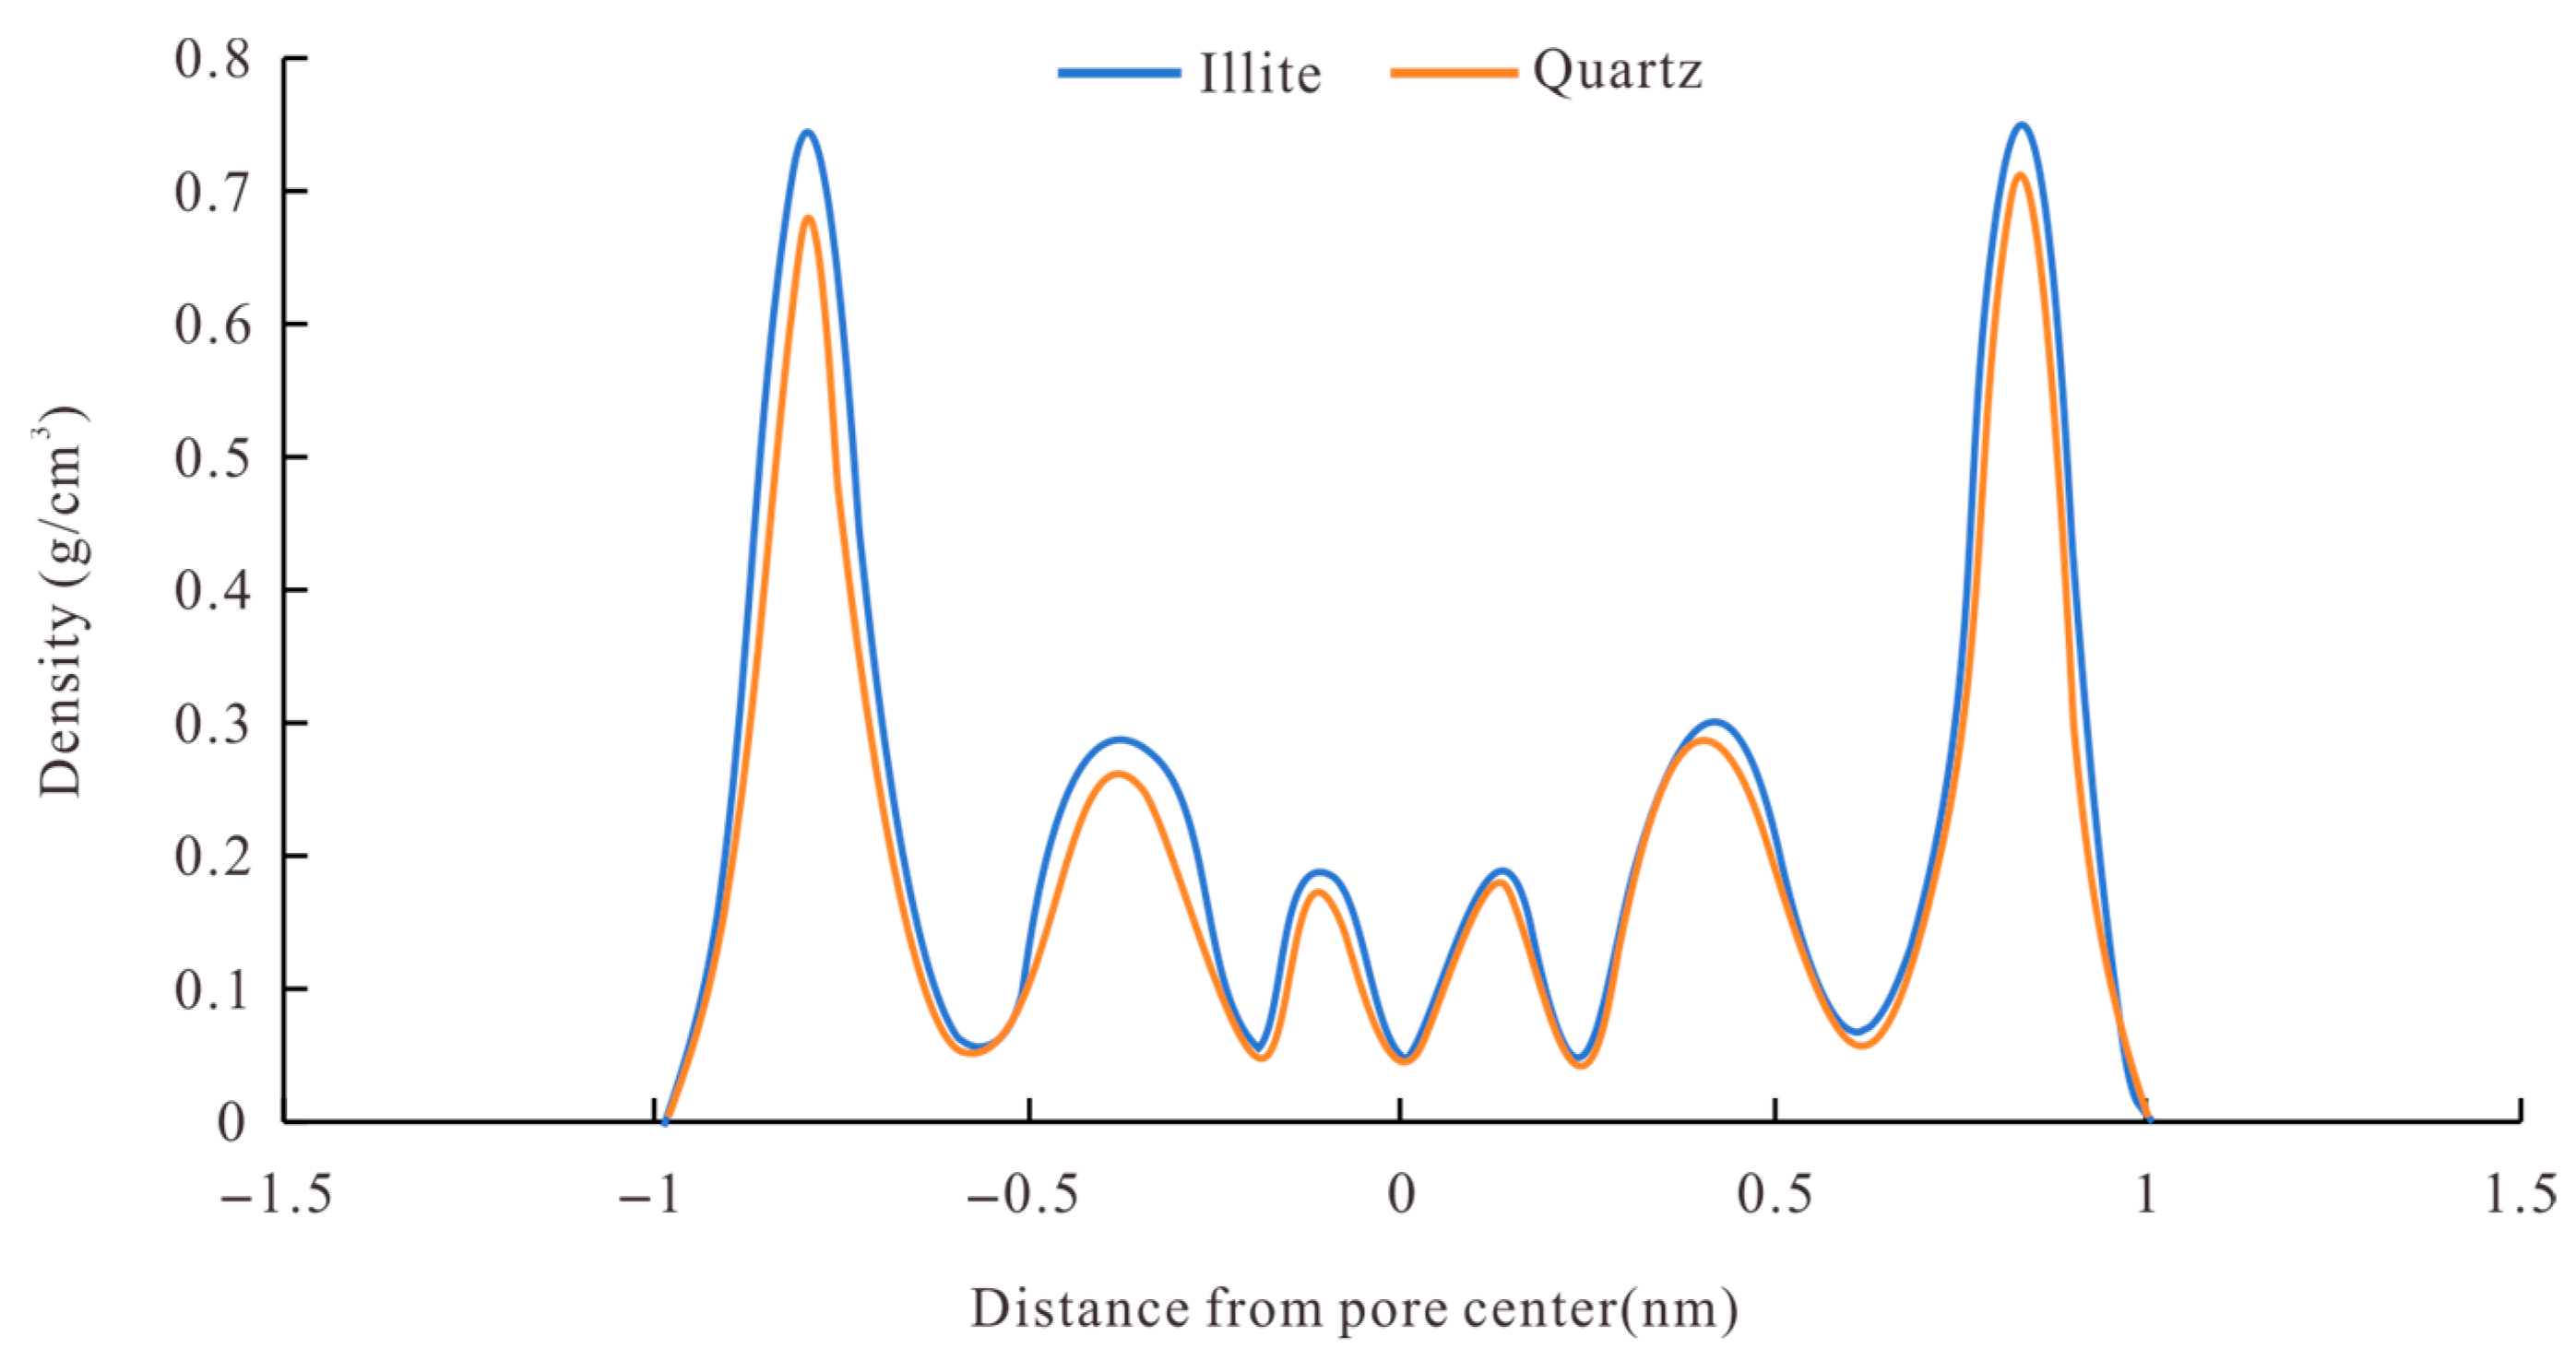
4.4. Effect of Mineral Type

To investigate the influence of mineral type on methane adsorption capacity, methane adsorption curves for the 2 nm quartz and illite simulation models are generated based on the simulation results. As shown in Figure 15, there are differences between the adsorption capacities of quartz and illite: the adsorption capacity of quartz is lower than that of illite. Large differences in the total methane adsorption capacity are observed under low-pressure conditions. The total adsorption capacity of illite at 10 MPa is 1.297 mmol/g, while that of quartz is 0.775 mmol/g. As pressure increases, the difference in total adsorption capacity between illite and quartz decreases and eventually becomes consistent. The total adsorption capacity of illite is 2.25 mmol/g at 90 MPa, and that of quartz is 2.23 mmol/g. Additionally, the excess adsorption capacity of illite is greater than that of quartz. Both reached their maximum at 10 MPa: illite is 0.813 mmol/g, and quartz is 0.302 mmol/g, which is consistent with Chen et al. [38]. The excess adsorption curves of quartz and illite are basically parallel, with the quartz excess adsorption capacity becoming negative at 30 MPa, and illite at 60 MPa. This indicates that the density of the adsorbed methane layer in illite is higher than that in quartz. This phenomenon is related to the mineral properties of shale.
Figure 16 shows the methane density distribution curve for the illite and quartz simulation models. The adsorbed and free methane densities in illite slits are higher than those in quartz. Moreover, the methane isosteric heat in the illite simulation model is higher than that in quartz under the same conditions. This phenomenon proves that the adsorption capacity of illite is greater than that of quartz. This can be explained by the fact that the adsorption potential of silicon atoms is weaker than that of oxygen atoms [44]. Quartz contains more silicon atoms, which results in a weaker adsorption potential than that of illite, leading to a lower adsorbed methane density in quartz compared to illite.

5. Conclusions

  • Based on XRD and another method, the pore simulation units of the Longmaxi Formation in the Luzhou area were established, the reliability of each unit was verified, and the methane adsorption simulation of the Longmaxi Formation under in situ conditions was carried out. The isosteric adsorption heat of quartz and illite was less than 42 KJ/mol, which proved that the methane adsorption in the Longmaxi Formation was physical adsorption.
  • The methane total adsorption capacity and excess adsorption capacity decreased with the temperature increase. The excess adsorption capacity increased first and then decreased with the increase in pressure. When the pressure reached a high level, the excess adsorption capacity could be negative. And the total methane adsorption capacity was controlled by accommodation space and increased with pore size, while the excess adsorption capacity was affected by the adsorption potential and decreased with the pore size.
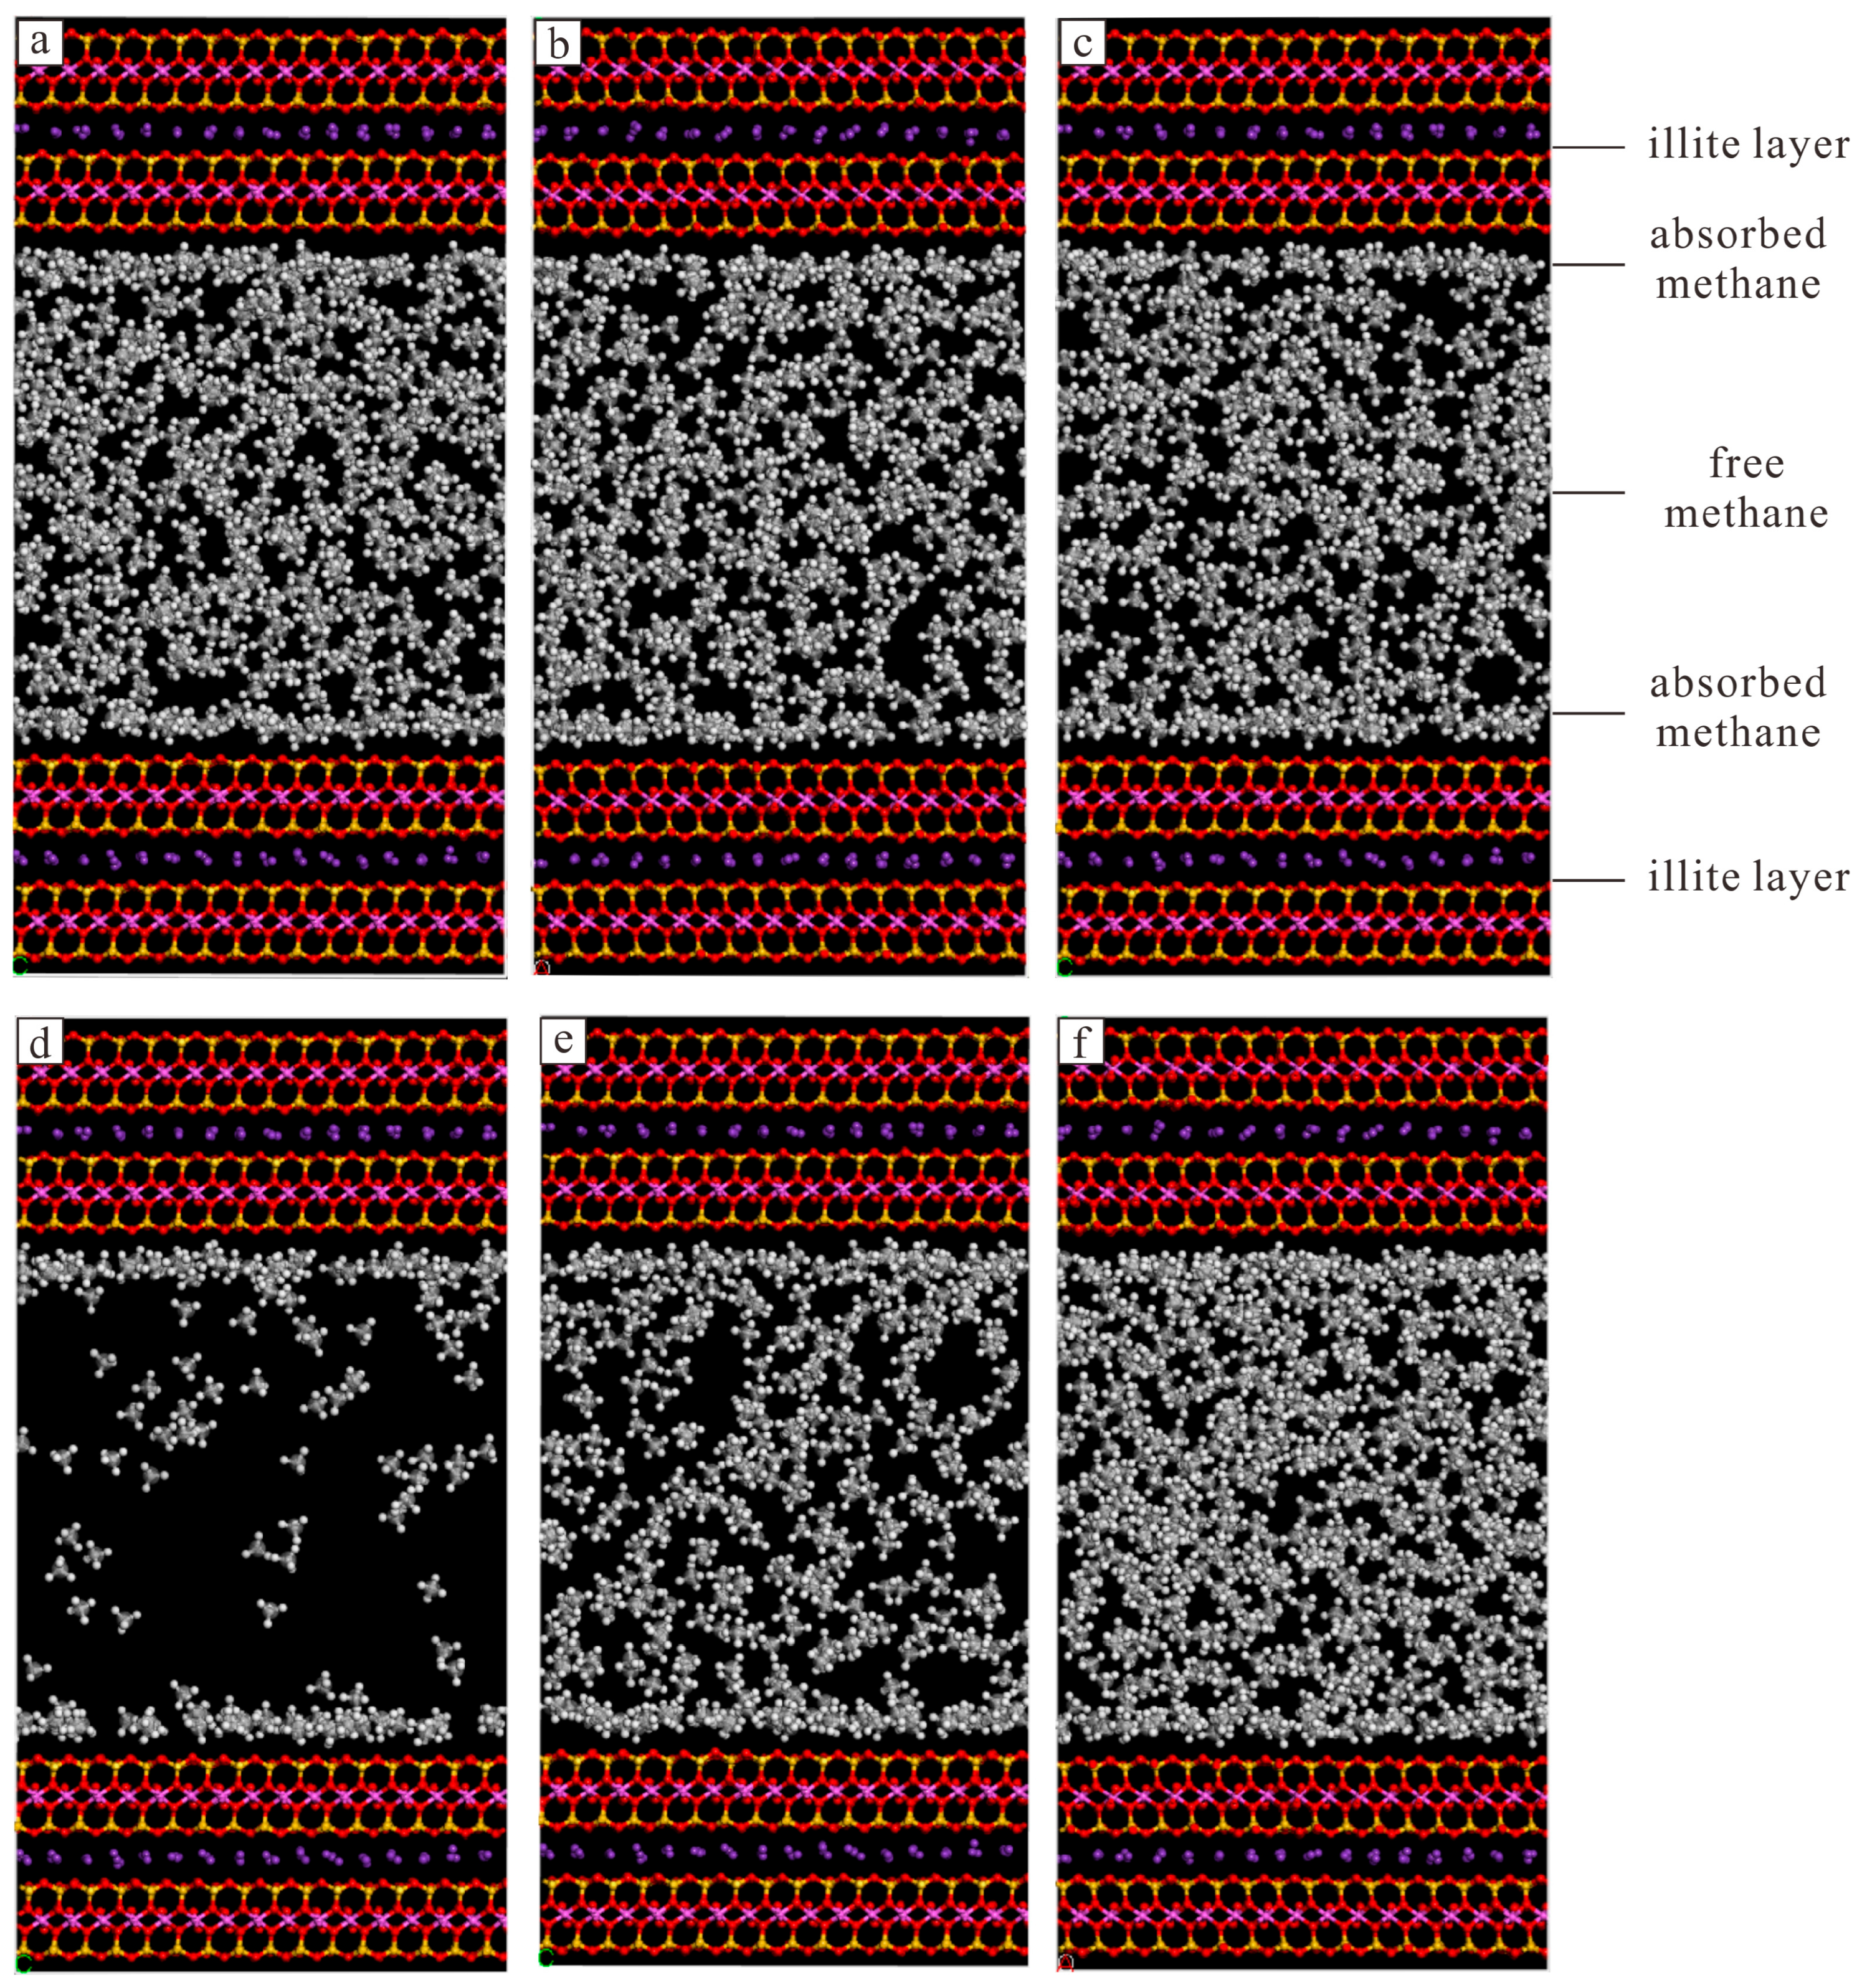
  • The adsorbed methane mainly occurred near the pore wall, which was double-layer adsorption, and in thinner pores, there was single-layer adsorption. Methane density distribution in the simulation unit was affected by the mineral types, temperature, and pressure.
  • Deep marine shale with high formation pressure and high clay mineral content is conducive to the microscopic accumulation of shale gas in deep marine shale reservoirs

Author Contributions

Conceptualization, J.P. and T.L.; methodology, Y.L.; validation, H.J.; formal analysis, J.P.; investigation, T.L. and J.P.; data curation, L.Q.; writing—original draft preparation, J.P. and L.Q.; writing—review and editing, T.L. and J.P.; visualization, Y.L. and H.J.; supervision, Y.L.; project administration, T.L. and H.J. All authors have read and agreed to the published version of the manuscript.

Funding

This research is supported by the National Natural Science Foundation of China (Grant Nos. 42272171 and 42302166).

Institutional Review Board Statement

Not applicable.

Informed Consent Statement

Not applicable.

Data Availability Statement

Data is contained within the article.

Conflicts of Interest

Author Junwei Pu was employed by the company Chongqing Shale Gas Exploration and Development Co., Ltd. Authors Tongtong Luo and Lin Qi were employed by the company CNPC Chuanqing Drilling Engineering Co., Ltd. Author Yalan Li was employed by the company Sichuan Jinuoen Oil and Gas Engineering Technology Service Co., Ltd. Author Hongwei Jiang was employed by the company Petro China Southwest Oil and Gas Field Company.

References

  1. Jia, C.Z. Breakthrough and significance of unconventional oil and gas to classical petroleum geology theory. Pet. Explor. Dev. 2017, 44, 1–10. [Google Scholar] [CrossRef]
  2. Zou, C.; Yang, Z.; Zhang, G.; Zhu, R.; Tao, S.; Yuan, X.; Hou, L.; Dong, D.; Guo, Q.; Song, Y.; et al. Theory, Technology and Practice of Unconventional Petroleum Geology. J. Earth Sci. 2023, 34, 951–965. [Google Scholar] [CrossRef]
  3. Nie, H.; Li, P.; Dang, W.; Ding, J.; Sun, C.; Liu, M.; Wang, J.; Du, W.; Zhang, P.; Li, D.; et al. Enrichment characteristics and exploration directions of deep shale gas of OrdovicianSilurian in the Sichuan Basin and its surrounding areas, China. Pet. Explor. Dev. 2022, 49, 744–757. [Google Scholar] [CrossRef]
  4. Li, J.; Li, H.; Jiang, W.; Cai, M.; He, J.; Wang, Q.; Li, D. Shale pore characteristics and their impact on the gas-bearing properties of the Longmaxi Formation. Sci. Rep. 2024, 14, 16896. [Google Scholar] [CrossRef]
  5. Ma, X. A golden era for natural gas development in the Sichuan Basin. Nat. Gas Ind. 2017, 4, 163–173. [Google Scholar] [CrossRef]
  6. Nie, H.; Jin, Z.; Li, P.; Katz, B.J.; Dang, W.; Liu, Q.; Ding, J.; Jiang, S.; Li, D. Deep shale gas in the Ordovician-Silurian Wufeng–Longmaxi formations of the Sichuan Basin, SW China: Insights from reservoir characteristics, preservation conditions and development strategies. J. Asian Earth Sci. 2023, 244, 105521. [Google Scholar] [CrossRef]
  7. Ma, X.; Xie, J.; Yong, R.; Zhu, Y. Geological characteristics and high production control factors of shale gas reservoirs in Silurian Longmaxi Formation, southern Sichuan Basin, SW China. Pet. Explor. Dev. 2020, 47, 901–915. [Google Scholar] [CrossRef]
  8. Li, Y.; Hu, Z.; Duan, X.; Wang, X.; Shi, J.; Zhan, H. The general form of transport diffusivity of shale gas in organic-rich nanoslits—A molecular simulation study using Darken approximation. Fuel 2019, 249, 457–471. [Google Scholar] [CrossRef]
  9. Shiga, M.; Morishita, T.; Aichi, M.; Sorai, M. Effect of Surface Coverage of Water Molecules on Methane Adsorption on Muscovite and Pyrophyllite: Molecular Dynamics Study. Energy Fuels 2021, 35, 19986–19999. [Google Scholar] [CrossRef]
  10. Sun, C.; Nie, H.; Su, H.; DU, W.; Lu, T.; Chen, Y.; Liu, M.; Li, J. Porosity, permeability and rock mechanics of Lower Silurian Longmaxi Formation deep shale under temperature-pressure coupling in the Sichuan Basin, SW China. Pet. Explor. Dev. 2023, 50, 95–98. [Google Scholar] [CrossRef]
  11. Sun, C.; Nie, H.; Dang, W.; Chen, Q.; Zhang, G.; Li, W.; Lu, Z. Shale Gas Exploration and Development in China: Current Status, Geological Challenges, and Future Directions. Energy Fuels 2021, 35, 6359–6379. [Google Scholar] [CrossRef]
  12. Onawole, A.T.; Nasser, M.S.; Hussein, I.A.; Al-Marri, M.J.; Aparicio, S. Theoretical studies of methane adsorption on Silica-Kaolinite interface for shale reservoir application. Appl. Surf. Sci. 2021, 546, 149164. [Google Scholar] [CrossRef]
  13. Zhou, W.; Wang, H.; Yang, X.; Liu, X.; Yan, Y. Confinement Effects and CO2/CH4 Competitive Adsorption in Realistic Shale Kerogen Nanopores. Ind. Eng. Chem. Res. 2020, 59, 6696–6706. [Google Scholar] [CrossRef]
  14. Gasparik, M.; Rexer, T.F.T.; Aplin, A.C.; Billemont, P.; De Weireld, G.; Gensterblum, Y.; Henry, M.; Krooss, B.M.; Liu, S.; Ma, X.; et al. First international inter-laboratory comparison of high-pressure CH4, CO2 and C2H6 sorption isotherms on carbonaceous shales. Int. J. Coal Geol. 2014, 132, 131–146. [Google Scholar] [CrossRef]
  15. Xiong, J.; Liu, X.; Liang, L.; Zeng, Q. Adsorption of methane in organic-rich shale nanopores: An experimental and molecular simulation study. Fuel 2017, 200, 299–315. [Google Scholar] [CrossRef]
  16. Wang, T.; Tian, S.; Li, G.; Zhang, L.; Sheng, M.; Ren, W. Molecular simulation of gas adsorption in shale nanopores: A critical review. Renew. Sustain. Energy Rev. 2021, 149, 111391. [Google Scholar] [CrossRef]
  17. Lu, S.; Shen, B.; Xu, C.; Chen, G.; Liu, L.; Xue, Q.; Fang, Z.; He, X. Study on Adsorption Behavior and Mechanism of Shale Gas by Using GCMC Molecular Simulation. Earth Sci. 2018, 43, 1783–1791. [Google Scholar] [CrossRef]
  18. Grinev, I.V.; Zubkov, V.V.; Samsonov, V.M. Calculation of isosteric heats of molecular gas and vapor adsorption on graphite using density functional theory. Colloid J. 2016, 78, 37–46. [Google Scholar] [CrossRef]
  19. Wu, J.; Zhao, S.; Li, B.; Liu, Y.; Huang, S.; He, Y.; Wan, S.; Liu, S.; Long, H.; Wang, G.; et al. Occurrence law of pore water in shale matrix: A case study of the Silurian Longmaxi Formation in southern Sichuan Basin. Nat. Gas Ind. 2023, 43, 44–54. [Google Scholar] [CrossRef]
  20. Sneha, R.; Eswaean, P.; Prusty, B.K. Review of gas adsorption in shales for enhanced methane recovery and CO2 storage. J. Pet. Sci. Eng. 2019, 175, 634–643. [Google Scholar] [CrossRef]
  21. Li, Z.; Jiang, Z.; Liang, Z.; Yu, H.; Yang, Y. Pore-structure characterisation of tectonically deformed shales: A case study of Wufeng-Longmaxi Formation in western Hunan Province, southern China. Aust. J. Earth Sci. 2019, 66, 1075–1084. [Google Scholar] [CrossRef]
  22. Zou, C.; Dong, D.; Wang, Y.; Li, X.; Huang, J.; Wang, S.; Guan, Q.; Zhang, C.; Wang, H.; Liu, H.; et al. Shale gas in China: Characteristics, challenges and prospects (II). Pet. Explor. Dev. 2016, 43, 182–196. [Google Scholar] [CrossRef]
  23. Zhu, B.; Meng, J.; Song, C.; Pan, R.; Zhu, Z.; Jin, J. Complexity and Heterogeneity Evaluation of Pore Structures in the Deep Marine Shale Reservoirs of the Longmaxi Formation, China. J. Mar. Sci. Eng. 2023, 11, 1613. [Google Scholar] [CrossRef]
  24. Tang, L.; Song, Y.; Zhao, Z.; Jiang, Z.; Jiang, S.; Chen, X.; Li, Z.; Li, Q. Origin and evolution of overpressure in shale gas reservoirs of the Upper Ordovician Wufeng Formation-Lower Silurian Longmaxi Formation in the Sichuan Basin. Nat. Gas Ind. 2022, 42, 37–53. [Google Scholar] [CrossRef]
  25. Li, J.; Li, H.; Yang, C.; Wu, Y.; Gao, Z.; Jiang, S. Geological Characteristics and Controlling Factors of Deep Shale Gas Enrichment of the Wufeng-Longmaxi Formation in the Southern Sichuan Basin, China. Lithosphere 2022, 2022, 4737801. [Google Scholar] [CrossRef]
  26. Wang, Q.; Mu, Y.; Chen, X.; Song, Z.; Ma, Z.; Qiu, Q. Characteristics of methane isothermal adsorption of deep shale from lower Silurian Longmaxi Formation in southeastern Sichuan Basin and its geological significance. Pet. Geol. Exp. 2022, 44, 180–187. [Google Scholar] [CrossRef]
  27. Gouenis, D.; Lapps, A.; Karakassides, M.A.; Tobbens, D.; Moukarika, A. A neutron diffraction study of alkali cation migration in montmorillonites. Phys. Chem. Miner. 2008, 35, 49–58. [Google Scholar] [CrossRef]
  28. Chong, L.; Myshakin, E.M. Molecular simulations of competitive adsorption of carbon dioxide-methane mixture on illitic clay surfaces. Fluid Phase Equilibria 2018, 472, 185–195. [Google Scholar] [CrossRef]
  29. Zhou, L.; Li, M.; Zhou, Y.P. Experimental and Modeling Study of the Adsorption of Supercritical Methane on a High Surface Activated Carbon. Sci. China Ser. B 2000, 30, 49–56. [Google Scholar] [CrossRef]
  30. Huang, L.; Ning, Z.; Wang, Q.; Qi, R.; Zeng, Y.; Qin, H.; Ye, H.; Zhang, W. Molecular simulation of adsorption behaviors of methane, carbon dioxide and their mixtures on kerogen: Effect of kerogen maturity and moisture content. Fuel 2018, 211, 159–172. [Google Scholar] [CrossRef]
  31. Huang, L.; Chen, Q.; Wu, J.; Yang, Q.; Zhang, J.; Huang, S.; Zhou, W.; Zou, J. Molecular simulation of methane adsorption characteristics in illite nanopores of deep shale reservoirs. J. Cent. South Univ. Sci. Technol. 2022, 53, 3522–3531. [Google Scholar] [CrossRef]
  32. Wang, H.; Qu, Z.; Yin, Y.; Bai, J.; Yu, B. Review of Molecular Simulation Method for Gas Adsorption/desorption and Diffusion in Shale Matrix. J. Therm. Sci. 2019, 28, 1–16. [Google Scholar] [CrossRef]
  33. Peng, D.Y.; Robinson, D.B. A new two-constant equation of state. Industrial and engineering chemistry fundamentals. Ind. Eng. Chem. Fundam. 1976, 15, 3069–3078. [Google Scholar] [CrossRef]
  34. Chen, G.; Lu, S.; Liu, K.; Han, T.; Xu, C.; Xue, Q.; Shen, B.; Guo, Z. GCMC simulations on the adsorption mechanisms of CH4 and CO2 in K-illite and their implications for shale gas exploration and development. Fuel 2018, 224, 521–528. [Google Scholar] [CrossRef]
  35. Song, W.; Yao, J.; Zhang, K. Study on gas adsorption and transport behavior in shale organic nanopore. Chin. J. Theor. Appl. Mech. 2021, 53, 2179–2192. [Google Scholar] [CrossRef]
  36. Fan, E.; Tang, S.; Zhang, C.; Guo, Q.; Sun, C. Methane sorption capacity of organics and clays inhigh-over matured shale-gas systems. Energy Explor. Exploit. 2014, 32, 927–942. [Google Scholar] [CrossRef]
  37. Heller, R.; Zoback, M. Adsorption of methane and carbon dioxide on gas shale and pure mineral samples. J. Unconv. Oil Gas Resour. 2014, 8, 14–24. [Google Scholar] [CrossRef]
  38. Chen, G.; Lu, S.; Liu, K.; Xu, C.; Xue, Q.; Tian, S.; Li, J.; Lu, S.; Zhang, Y. Occurrence state and micro mechanisms of shale gas on pore walls. Earth Sci. 2020, 45, 1782–1790. [Google Scholar] [CrossRef]
  39. Chen, L.; Zuo, L.; Jiang, Z.; Jiang, S.; Liu, K.; Tan, J.; Zhang, L. Mechanisms of shale gas adsorption: Evidence from thermodynamics and kinetics study of methane adsorption on shale. Chem. Eng. J. 2019, 361, 559–570. [Google Scholar] [CrossRef]
  40. Tian, H.; Li, T.; Zhang, T.; Xiao, X. Characterization of methane adsorption on overmature Lower Silurian-Upper Ordovician shales in Sichuan Basin, southwest China: Experimental results and geological implications. Int. J. Coal Geol. 2016, 156, 36–49. [Google Scholar] [CrossRef]
  41. Amam, N. Sorption and desorption of gases (CH4, CO2). on hard coal and active carbon at elevated pressures. Fuel 1998, 77, 1243–1246. [Google Scholar] [CrossRef]
  42. Zhou, X.; Yi, H.; Tang, X.; Deng, H.; Liu, H. Thermodynamics for the adsorption of SO2, NO and CO2 from flue gas on activated carbon fiber. Chem. Eng. J. 2012, 200, 399–404. [Google Scholar] [CrossRef]
  43. Ge, S.; Tan, W.; Li, H.; Wang, Y.; Niu, P.; Qin, Q. Mineralogical and Lithofacies Controls on Gas Storage Mechanisms in Organic-Rich Marine Shales. Energy Fuels 2025, 39, 3846–3858. [Google Scholar] [CrossRef]
  44. Yang, X.; Chen, Z.; Liu, X.; Xue, Z.; Yue, F.; Wen, J.; Li, M.; Xue, Y. Correction of gas adsorption capacity in quartz nanoslit and its application in recovering shale gas resources by CO2 injection: A molecular simulation. Energy 2022, 240, 122789. [Google Scholar] [CrossRef]
Figure 1. (a) The location and sedimentary environment of the study area during Early Silurian [22,23]. (b) Distribution characteristics of burial depth and pressure coefficient of shale formations in the Longmaxi Formation [24].
Minerals 15 00820 g001
Figure 2. Mineral composition in deep marine shale in Longmaxi Formation of Well Z208.
Minerals 15 00820 g002
Figure 3. Scanning electron microscope photographs of deep marine shale in the Longmaxi Formation. (a) silt-like intercrystalline pore in illite, Well W204, 3525.81 m. (b) silt-like intercrystalline pore in I/S mixed layer, Well W204, 3523.73 m. (c) silt-like and wedge intercrystalline pore in illite, Well W204, 3521.55 m. (d) silt-like intercrystalline pore in illite, Well L204, 3520.47 m.
Minerals 15 00820 g003
Figure 4. (a) Illite crustal model. (b) Quartz crustal model.
Minerals 15 00820 g004
Figure 5. (a) Optimized 2 nm quartz simulation model. (b) Optimized 2 nm illite simulation model.
Minerals 15 00820 g005
Figure 6. The schematic diagram of gas distribution in shale pores under supercritical conditions [32].
Minerals 15 00820 g006
Figure 7. Comparison between the simulated and experimental results of methane isotherm adsorption on illite [36,37,38].
Minerals 15 00820 g007
Figure 8. (a) Methane isosteric adsorption heat in illite simulation model under 403.15 K. (b) Methane isosteric adsorption heat in quartz simulation model under 403.15 K.
Minerals 15 00820 g008
Figure 9. (a) Methane simulation results of 4 nm illite simulation model under 393.15 K, 40 Mpa. (b) Methane simulation results of 4 nm illite simulation model under 403.15 K, 40 Mpa. (c) Methane simulation results of 4 nm illite simulation model under 413.15 K, 40 Mpa. (d) Methane simulation results of 4 nm illite simulation model under 403.15 K, 10 Mpa. (e) Methane simulation results of 4 nm illite simulation model under 403.15 K, 30 Mpa. (f) Methane simulation results of 4 nm illite simulation model under 403.15 K, 90 Mpa.
Minerals 15 00820 g009
Figure 10. (a) Methane total adsorption curve in 4 nm illite slit under different temperatures. (b) Methane excess adsorption curve in 4 nm illite slit under different temperatures.
Minerals 15 00820 g010
Figure 11. (a) Methane density distribution curve of 4 nm illite simulation model under different temperatures. (b) Methane density distribution curve of 4 nm illite simulation model under different pressures.
Minerals 15 00820 g011
Figure 12. (a) Simulation results of 1 nm illite simulation model under 403.15 K, 30 MPa. (b) Simulation results of 2 nm illite simulation model under 403.15 K, 30 MPa. (c) Simulation results of 4 nm illite simulation model under 403.15 K, 30 MPa. (d) Simulation results of 6 nm illite simulation model under 403.15 K, 30 MPa. (e) Simulation results of 1 nm quartz simulation model under 403.15 K, 30 MPa. (f) Simulation results of 2 nm quartz simulation model under 403.15 K, 30 MPa. (g) Simulation results of 4 nm quartz simulation model under 403.15 K, 30 MPa. (h) Simulation results of 6 nm quartz simulation model under 403.15 K, 30 MPa.
Minerals 15 00820 g012
Figure 13. (a) Methane total adsorption curve with different pore size illite simulation models under 403.15 K. (b) Methane excess adsorption curve with different pore size illite simulation models under 403.15 K.
Minerals 15 00820 g013
Figure 14. Methane density distribution curves at different pore size illite slits under 403.15 K and 30 MPa.
Minerals 15 00820 g014
Figure 15. (a) Methane total adsorption curve of 2 nm illite and quartz simulation models under 403.15 K. (b) Methane excess adsorption curve of 2 nm illite and quartz simulation models under 403.15 K.
Minerals 15 00820 g015
Figure 16. Illite and quartz methane density distribution curves in 2 nm slit under 403.15 K and 30 MPa.
Minerals 15 00820 g016
Table 1. Methane bulk phase density under different temperature and pressure conditions (kg/m3).
Pressure/MPa51015202530354045505560657075808590
Temperature/K
393.1525.3651.6977.92103.13126.74148.49168.36186.44202.91217.93231.67244.30255.92266.66276.64285.91294.58302.69
403.1524.6350.0675.3499.66122.52143.68163.11180.88197.13212.01225.67238.25249.87260.63270.63279.96288.68296.86
413.1523.9548.5572.9596.45118.61139.20158.20 175.65191.67206.40 219.97232.50244.08254.85264.87274.23283.00 291.22
Disclaimer/Publisher’s Note: The statements, opinions and data contained in all publications are solely those of the individual author(s) and contributor(s) and not of MDPI and/or the editor(s). MDPI and/or the editor(s) disclaim responsibility for any injury to people or property resulting from any ideas, methods, instructions or products referred to in the content.

