Article

Mechanical Loading of Barite Rocks: A Nanoscale Perspective

by
Hassan Abubakar Adamu
1,2,3,4,5,6,*,
Seun Isaiah Olajuyi
1,3,4,5,
Abdulhakeem Bello
7,
Peter Azikiwe Onwualu
1,8,
Olumide Samuel Oluwaseun Ogunmodimu
9 and
David Oluwasegun Afolayan
1,3,5,6,9,10,*
1
Department of Material Science and Engineering, African University of Science and Technology, Abuja 900107, Nigeria
2
Advanced Manufacturing Technology Development Institute AMTDI Jalingo, National Agency for Science and Engineering Infrastructure NASENI, Abuja 900107, Nigeria
3
Department of Mechanical Engineering, African University of Science and Technology, Abuja 900107, Nigeria
4
DAF Materials and Mineral Research Group, African University of Science and Technology, Abuja 900107, Nigeria
5
AUST Baryte Research Group, African University of Science and Technology, Abuja 900107, Nigeria
6
Department of Mechanical Engineering, Taraba State University, Jalingo 660213, Nigeria
7
Department of Theoretical and Applied Physics, African University of Science and Technology, Abuja 900107, Nigeria
8
Office of the President, African University of Science and Technology, Abuja 900107, Nigeria
9
John and Willie Leone Family Department of Energy and Mineral Engineering, The Pennsylvania State University, University Park, PA 16802, USA
10
Department of Civil, Environmental and Architectural Engineering, Worcester Polytechnic Institute (WPI), Worcester, MA 01609, USA
*
Authors to whom correspondence should be addressed.
Minerals 2025, 15(8), 779; https://doi.org/10.3390/min15080779
Submission received: 19 May 2025 / Revised: 3 July 2025 / Accepted: 3 July 2025 / Published: 24 July 2025

Abstract

Barite, a mineral composed of barium sulphate, holds global significance due to its wide range of industrial applications. It plays a crucial role as a weighting agent in drilling fluids for the oil and gas industry, in radiation shielding, and as a filler in paints and plastics. Although there are significant deposits of the mineral in commercial quantities in Nigeria, the use of barite of Nigerian origin has been low in the industry due to challenges that require further research and development. This research employed nanoindentation experiments using a model Ti950 Tribo indenter instrument equipped with a diamond Berkovich tip. Using scanning electron microscopy (SEM) and energy-dispersive X-ray spectroscopy (EDX), we gained information about the structure and elements in the samples. The load–displacement curves were examined to determine the hardness and reduced elastic modulus of the barite samples. The SEM images showed that barite grains have a typical grainy shape, with clear splitting lines and sizes. XRD and EDX analysis confirmed that the main components are chlorite, albite, barium, and oxygen, along with small impurities like silicon and calcium from quartz and calcite. The average hardness of the IB3 and IB4 samples was 1.88 GPa and 1.18 GPa, respectively, meaning that the IB3 sample will need more energy to crush because its hardness is within the usual barite hardness range of 1.7 GPa to 2.0 GPa. The findings suggest further beneficiation processes to enhance the material’s suitability for drilling and other applications.

1. Introduction

Nestled in the Gulf of Guinea in West Africa, Nigeria boasts an extensive array of more than forty-four precious solid minerals strategically spread across different regions within the nation [1]. These mineral reserves carry significant prospects for fostering economic development and affluence. Despite the mining sector falling short of its considerable potential to significantly contribute to Nigeria’s gross domestic product (GDP), recent years have witnessed observable growth in this domain [2]. Barite is an important industrial mineral widely used in various applications due to its high density, low solubility, and chemical inertness. One of the primary uses of barite is as a weighting agent in drilling fluids for the oil and gas industry. It is added to the drilling mud to increase its density, which helps prevent blowouts and maintains hydrostatic pressure during drilling operations [3]. Barite is also used to produce heavy concrete and radiation-shielding materials, and as a filler in paints, plastics, and rubber compounds.
Barite, a naturally occurring barium sulphate (BaSO4), is important in the mineral industry due to its various applications [4]. Barite is widely distributed globally and found in various geological settings, including sedimentary, hydrothermal, and metamorphic deposits. Major barite producers include China, India, Morocco, Mexico, and the United States [5,6]. However, the quality and purity of barite deposits can vary significantly, affecting their suitability for different applications. In 2004, the Federal Ministry of Solid Minerals Development identified only two states with barite mineralization. However, over time, additional states with barite deposits have been discovered. Nigeria has significant barite resources, with deposits in various states, including Taraba, Cross River, Benue, and Plateau [7]. The Ibi Local Government Area (LGA) in Taraba State is known for its barite deposits. The initial documentation of barite mineralization in Nigeria dates back to 1959 when the Nigerian Geological Survey Agency (NGSA) included it in its memorandum report [4]. Despite this early recognition, there was limited interest in exploring barite then. It was not until the period between 1975 and 1980 that the Nigerian Mining Corporation conducted exploratory activities on barite deposits in Azara, Nasarawa State, situated in North-Central Nigeria, estimating reserves of approximately 730,000 tonnes [8].
The Nigerian Geological Survey Agency has identified the occurrence and deposits of barite in several states, including Nasarawa, Adamawa, Ebonyi, Benue, Cross River, Plateau, Gombe, Taraba, and Zamfara [9,10]. This distribution indicates that the current mineralization of barite in Nigeria follows a north–south axis. Specifically, barite deposits in Nigeria are concentrated along the Benue Trough, encompassing states like Benue, Taraba, and Adamawa in the northeast [4]. Moving towards the north, deposits are found in Nasarawa, Plateau, and Gombe states, extending to the southern fringe of Cross River. Additionally, barite deposits are present in Zamfara and Katsina in the northwest region of Nigeria. The diverse geographic distribution highlights the widespread occurrence of barite resources across various country regions. However, these natural resources have not been adequately exploited for local industrial applications.
Despite the availability of barite resources, the country still imports a substantial amount of barite to meet the demand from the oil and gas industry [11]. Barite is typically mined from underground or surface deposits and transported to processing facilities [4]. Artisanal miners mostly conduct barite mining in Nigeria, affecting the production output and exposure to uncontrolled risk, erosion, pollution, and environmental degradation. With the resurgence of the boom in mining activities in Nigeria, there are many illegal barite miners in the barite-rich states of Nigeria. As a result, barite mining is done informally at production levels that may be as high as eighty per cent [4]. Furthermore, the research on barite in Nigeria is mostly about specific gravity and comparative analysis. There is a need for research on the mechanical properties of barite surfaces at the atomic level to understand the anisotropic behaviour and liberation size concerning other associated minerals for sustainable development.
Barite mineral deposits exist in grades, and their quality varies across depths. Research has shown that the lowest grades are at the top and densely associated with impurities (non-barite minerals). Further studies on some barite deposits indicate medium- to high-quality grades of barite at locations below a 15 m depth [12]. However, due to its shallow mining depth, low-grade barite characterises the Nigerian barite market. Typically, barite mining in Nigeria is dominated by artisanal and small-scale operations, with most of the ores extracted from different locations within 2–5 m below the earth. These deposits have a high quantity of non-barite minerals which must be separated and recovered from barite mineral to improve their quality and boost their potential for different industrial applications. Mechanised or large-scale mining, on the other hand, exerts a higher mechanical load on barite rocks than artisanal and small-scale mining. Minerals in the rocks are pressure-compacted and are liberated when loads are applied by force or mechanical contact that results in deformation. The understanding of the impact of the mechanical loading of rocks containing barite mineral is essential for a controlled deformation of rocks to guarantee efficient liberation and separation and the recovery of several minerals of interest aided by mineral surface modification [13].
Crushing and grinding are fundamental steps in barite processing. Crushing reduces the mineral to a manageable size, while grinding further reduces it to fine particles. These processes are crucial for the liberation of barite from gangue minerals [14]. After crushing and grinding, barite undergoes gravity or magnetic separation to separate it from impurities such as quartz and calcite. The efficiency of this process is highly dependent on the particle size distribution achieved through crushing and grinding [15]. Flotation is another method used in barite processing to separate it from gangue minerals. The quality of the feed material, influenced by the crushing and grinding processes, affects flotation efficiency [16]. The final step involves additional purification and refining to meet specific industry requirements. This phase may include processes to reduce impurities and improve barite quality [3]. Barite is known for its high density, typically ranging from 4.1 to 4.5 g/cm3. This property affects its behaviour during grinding and processing, as it influences the settling rate and separation efficiency in gravity-based separation processes [17]. Barite is relatively soft compared to many other minerals, with a Mohs hardness of 3–3.5 and 1.7 Gpa–2.0 GPa. This characteristic means it is easily crushable and gradable, which is essential in determining the energy required for crushing and grinding.
Barite is a brittle mineral. Its brittleness impacts its fracture behaviour, as it tends to break along cleavage planes or exhibit conchoidal fractures when subjected to mechanical stress. The study by [18] explored the influence of barite fillers on the mechanical properties of composites, including fracture behaviour. Similarly, it is observed that barite rock samples are brittle and deform plastically under stress. The elastic properties can affect how it responds to mechanical forces during crushing and grinding [4]. Smaller, irregularly shaped particles may deform differently than larger, well-defined crystals [19]. This evidence indicates that the size and shape of barite particles also impact their deformation and fracture behaviour. Deformation refers to the change in shape or size of a mineral under the influence of mechanical stress. In mineral processing, deformation can occur during crushing, grinding, and other mechanical processes [20]. Deformation processes involve elastic and plastic failure. While elastic deformation is reversible, plastic deformation results in permanent changes to the mineral’s shape or structure [21]. Research by [18] explored the mechanical properties and fracture behaviour of geomaterials. Although the study is not specific to barite research, it shows the need to understand minerals’ mechanical behaviour in various applications, which applies to barite too.
Various crushing and grinding techniques are employed in barite processing, which include jaw crushing, cone crushing, roll crushing, hammer milling, and ball milling. The choice of equipment depends on factors such as the desired particle size, efficiency, and production capacity. Similarly, the required particle size for the end-use application is a crucial factor. In one preferred embodiment, the sized barite weighting agent has a particle diameter between 4 μm and 15 μm. In another preferred embodiment, the additive has a D50 (by weight) of approximately 1 μm to 6 μm, and D90 (by weight) of approximately 4 μm to 8 μm [22]. The additive may be used in any wellbore fluid, such as drilling, cementing, completion, packing, work-over (repairing), stimulation, well killing, and spacer fluid [22]. The efficiency of the crushing and grinding equipment in terms of energy consumption, throughput, and product quality is essential for cost-effective operations [23,24]. Production capacity dictates the size and number of crushing and grinding units needed in the processing plant [25]. However, the hardness, abrasiveness, and friability of the barite ore influence the selection of appropriate crushing and grinding equipment to ensure efficient size reduction and minimize wear and tear [24]. While factors such as dust generation, noise levels, and environmental regulations influence the choice of crushing and grinding equipment [25], understanding the impact of the mechanical loading of barite rocks at macro- and nanoscale and applying the knowledge is critical for efficient rock fragmentation.
The particle size range of ores is critical for efficient mineral separation and recovery. This size range is a product of intrinsic material properties and the mechanical loading of the rock samples and the constituent minerals. Barite is used in different applications and must meet specific particle size requirements. Similarly, the mode of mechanical loading affects the mineral surface roughness and other mineral surface properties [25]. These surface properties are important for attachments/interactions and as sites for fine particles with high surface area/unit volume, and hence, high surface energies. This situation shows that it is important to thoroughly study and evaluate local barite deposits to determine if they can be used for different purposes and possibly lessen the need for imports. The deformation behaviour of materials plays a crucial role in determining their mechanical properties and performance under various loading conditions. Understanding the mechanical properties and deformation behaviour of barite from specific deposits is crucial for ensuring its effective utilization and identifying potential applications.
Nanoindentation is a powerful technique used to investigate the mechanical properties of materials at the nanoscale [26]. It involves indenting the material’s surface with a rigid indenter tip and measuring the load–displacement response. Nanoindentation offers several benefits compared to regular mechanical testing. It can measure the properties of materials at small indentation depths [27]. This technique has been explored and is used for the nano-mechanical loading of metals, polymers, and other materials that exhibit significant plasticity. The nanoindentation of synthetic barite films and barite fillers is well-reported. Also, the reviews on the dislocation of minerals confirm the significant plasticity of rocks containing minerals.
Despite numerous reports focusing on identifying, analysing, and studying the brittleness and density of barite, the comprehensive understanding of the impact of minor defects, stress from impurities, and heat on the mechanical properties of barite mineral and rocks is scanty. Additionally, the lack of research on barite’s plasticity under extreme pressure and temperature conditions restricts its optimisation for industrial uses, such as drilling fluids, construction materials, and advanced composites for specialised defence systems such as walls and concretes. With the recent developments in technology, the use of in situ high-resolution electron microscopy to track changes in the mechanical properties at extreme temperatures, pressures, and stress is well reported in the literature [28]. This particular feature or approach is essential when materials are exposed to high temperatures and sustained mechanical pressures [28,29]. A nanoindentation study of rocks containing minerals such as muscovite, rectorite, biotite, orthoclase, plagioclase, and quartz revealed that loading and loading conditions affect the mechanical response of rocks. Increasing loading and loading at extreme conditions increase radial cracks in muscovite and interlayer delamination in rectorite. These observations are also caused by the defects inherent in the materials. Similarly, large loads or higher loading rates increase indentation depth and lead to varying mechanical responses under extreme loading conditions. However, a few minerals with a unique 3D structure, such as biotite, present a unique response to mechanical loading. Comparing load–displacement curves for these minerals indicates that the nanoindentation method can accurately represent the mechanical properties of the minerals. This showed that a contact mechanics approach can be used to calculate the mechanical parameters of these geo-minerals at extreme temperatures [30,31,32]. It is anticipated that the relevant knowledge gained on the variation in responses of rocks will be practical in modelling cyclic mechanical loading during the crushing and grinding of rocks prior to mineral processing.
The aim of this study is to investigate the mechanical behaviour and deformation characteristics of barite rock samples. It analyses and presents fundamental insight into the plasticity of barite under varying stress conditions, focusing on factors that influence the crushing and grinding processes. The paper examines the mechanism of materials’ response to stress by evaluating load–displacement curves and other parameters from nanoindentation, which aids in determining properties such as hardness, reduced elastic modulus, and the materials' shape changes. This information can enhance the utilization of local barite resources and support the development of local industries. The variation in the hardness of the rock samples will also offer insights into the energy demand during comminution and other process conditions for the effective extraction and application of barite deposits.

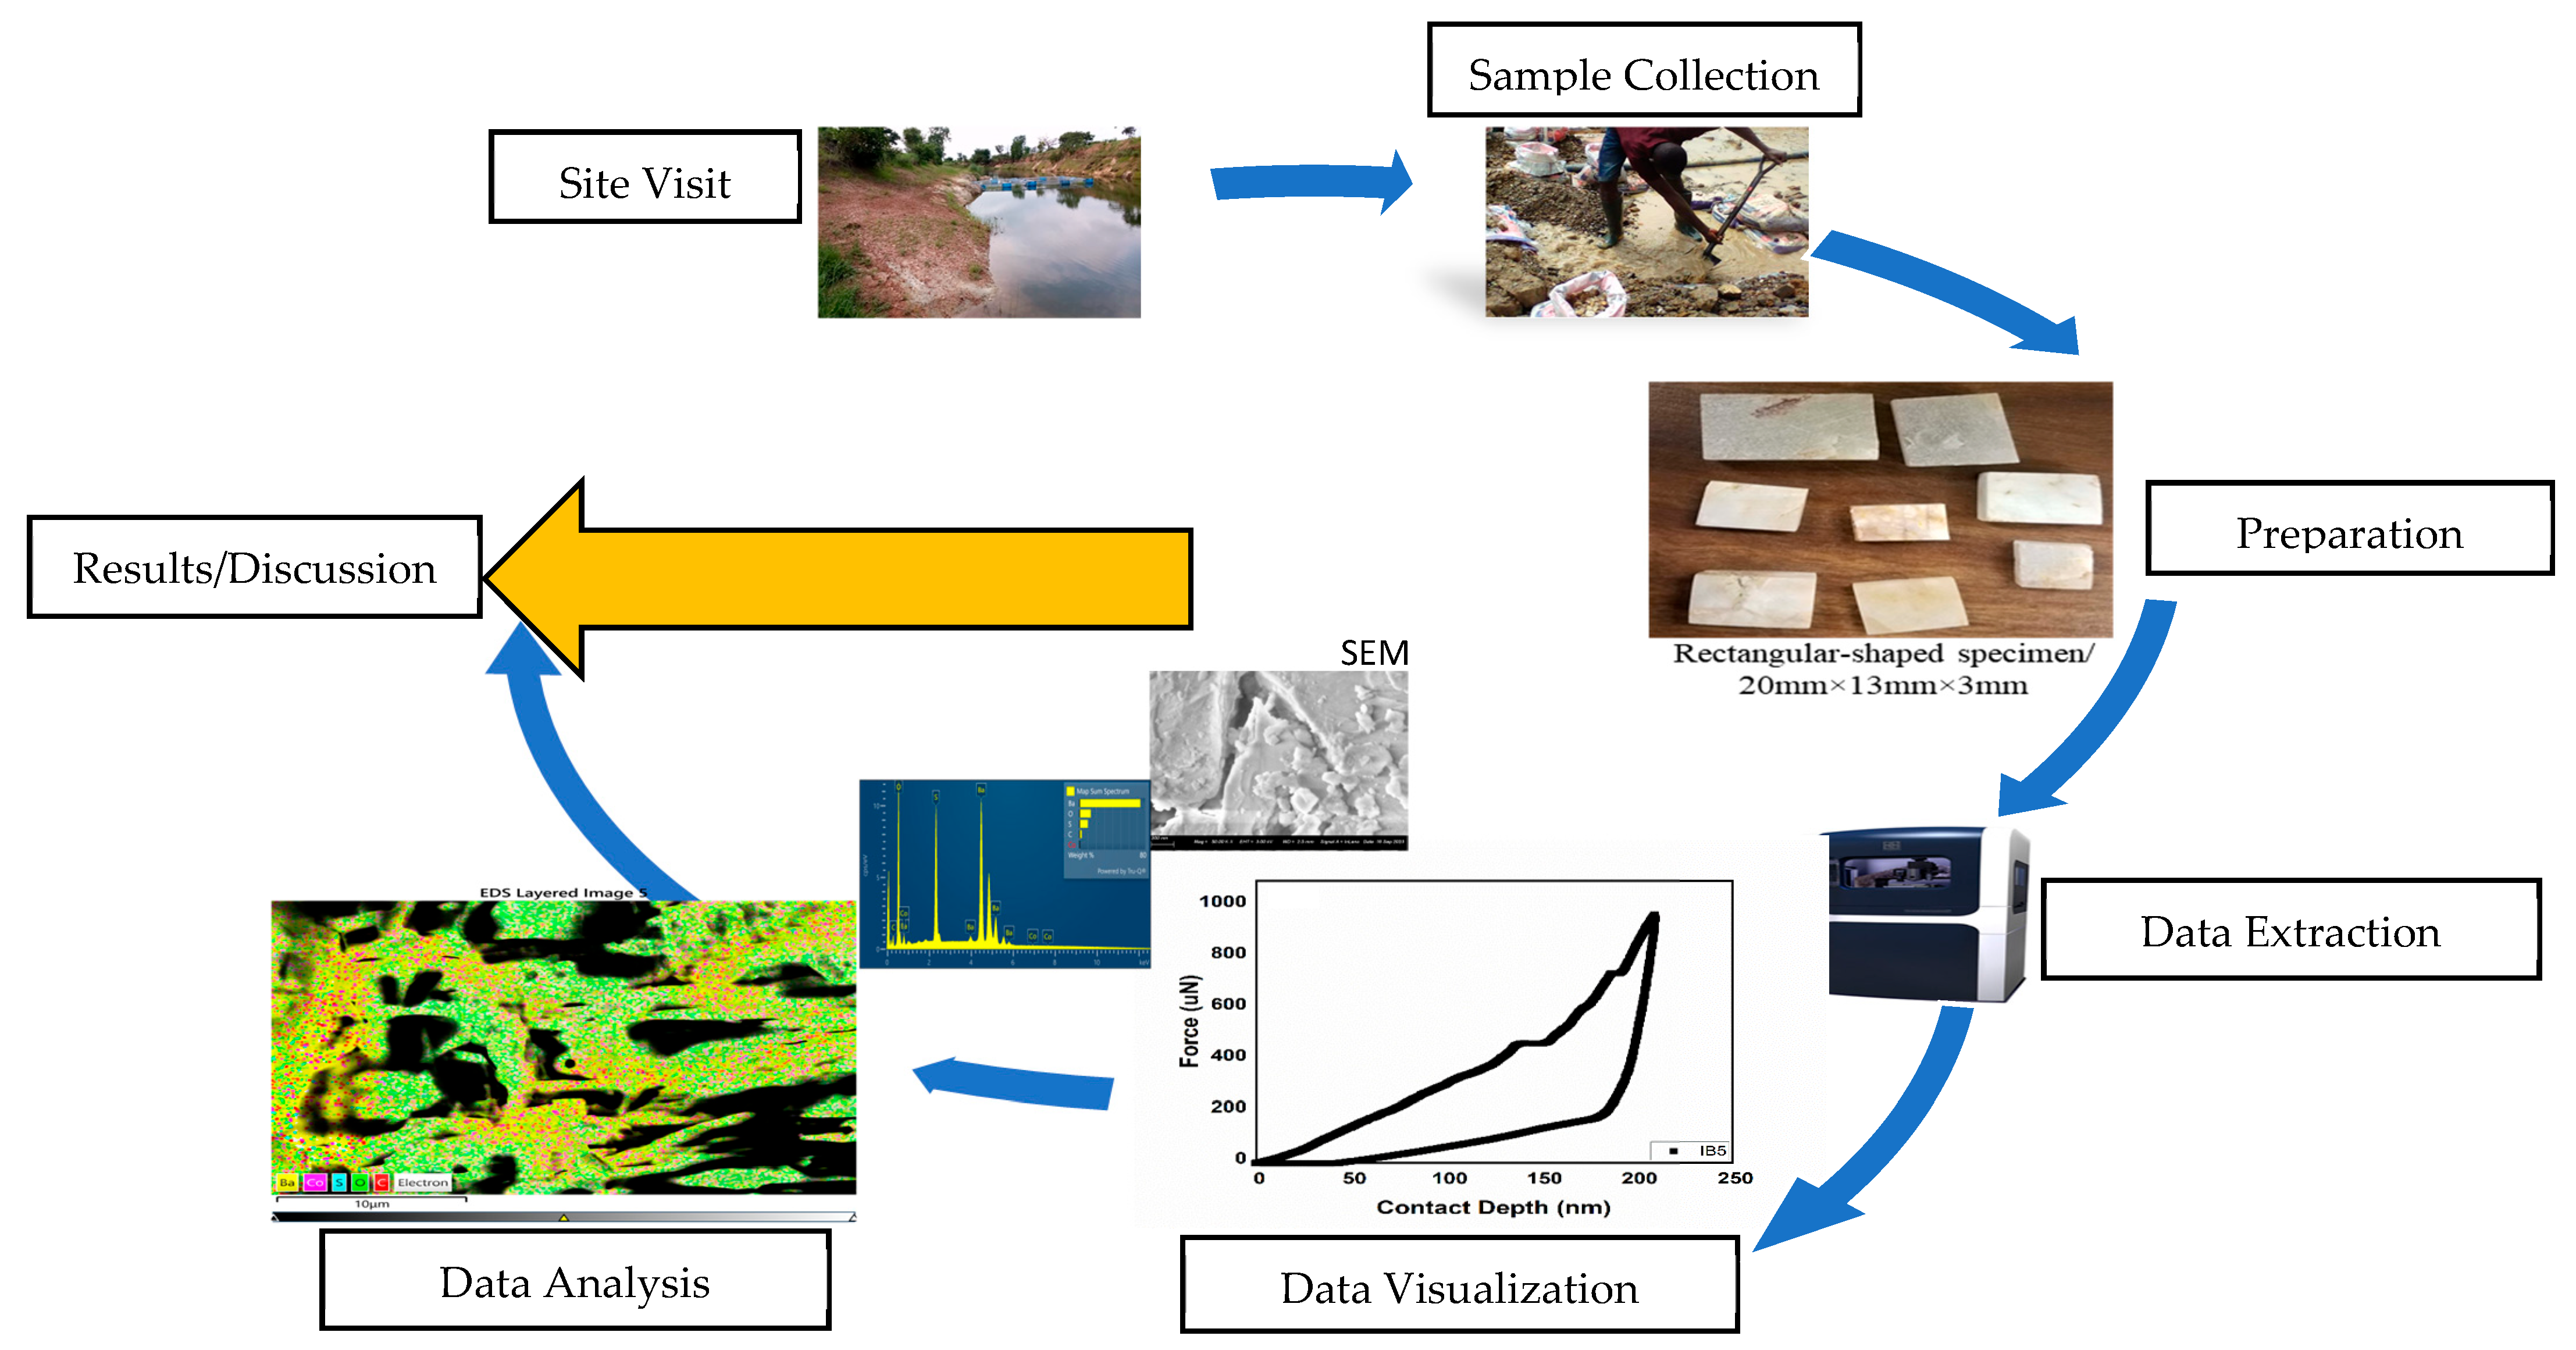
2. Materials and Methods

Figure 1 presents the graphic flow of the steps used in conducting the research, from sampling to data analysis. This process followed a systematic review of existing literature to identify gaps in knowledge.

2.1. Materials

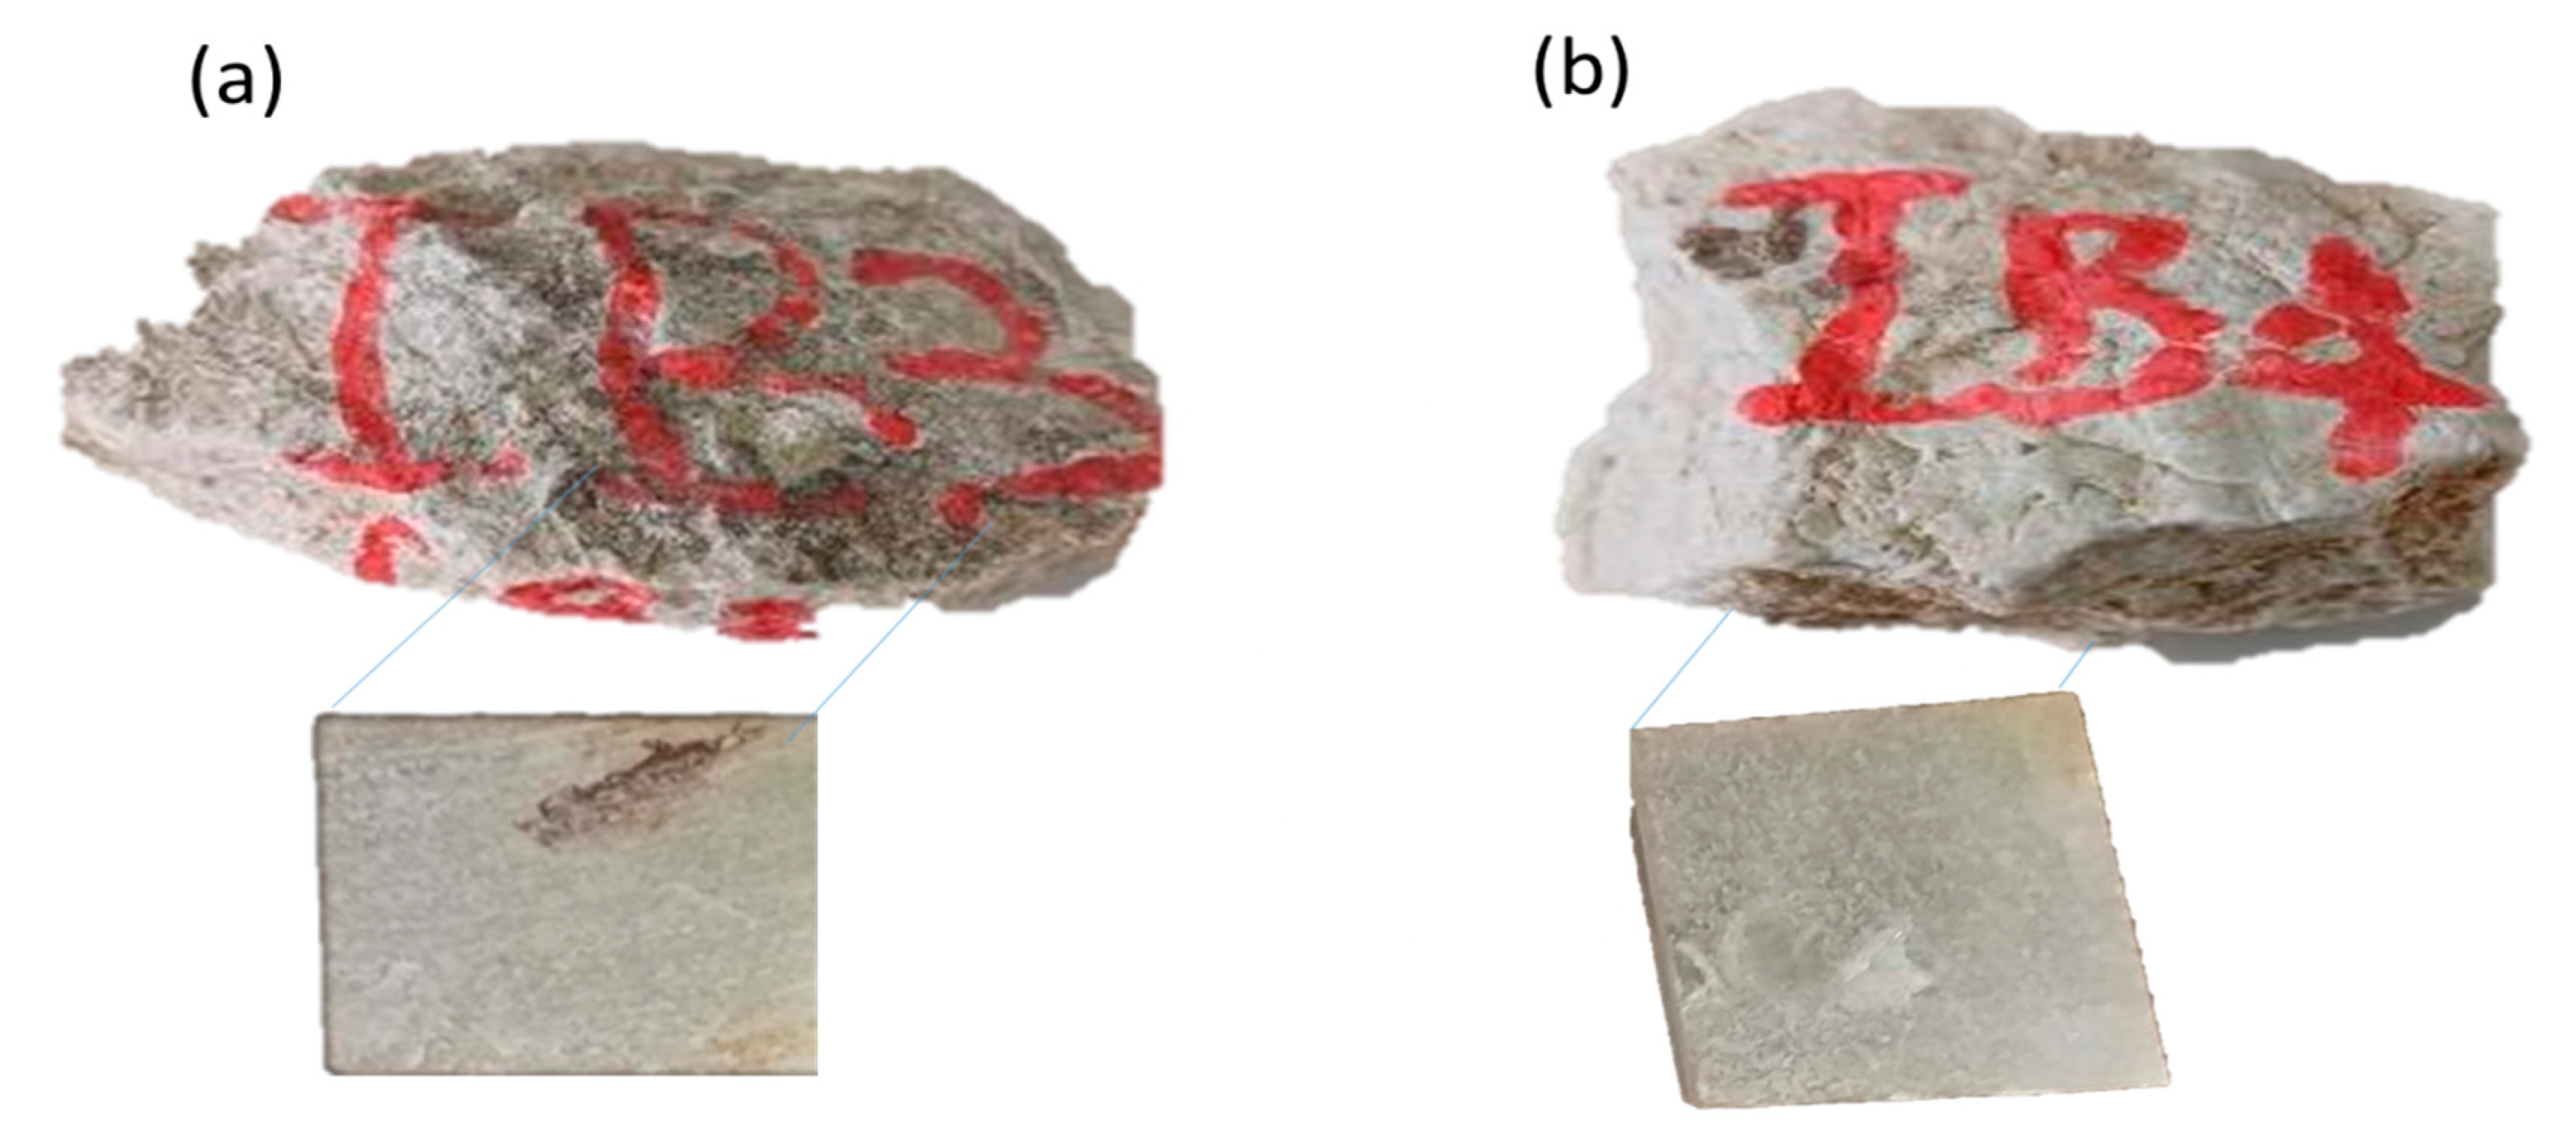
2.1.1. Barite Samples

The barite samples investigated in this study were obtained from certain deposits located in the Ibi Local Government Area (LGA) of Taraba State, Nigeria. The deposits are situated at coordinates of 8°09′30″ N and 9°78′28″ E for IB4, and 8°75′96″ N and 9°47′41″ E for IB3, with an elevation of approximately 176 m above sea level. The samples were extracted from varying depths ranging between 2 and 5 m below the surface, as received from artisanal miners in the Ibi local government area. The raw barite rock samples collected are shown in Figure 2.
After extraction, the barite rock samples underwent preliminary preparation steps to ensure their suitability for nanoindentation testing. First, the samples were cut into smaller cuboids using a low-speed diamond saw to create flat surfaces for indentation. Subsequently, the cut samples were subjected to a series of grinding and polishing processes to achieve a mirror-like surface finish. The grinding process was done using silicon carbide (SiC) abrasive papers of sizes between 240 grit and 1200 grit [33]. Further grinding and polishing of the surfaces with 1800, 2400, and 4000 grit paper produces better surfaces. This step was essential for removing surface irregularities and ensuring a smooth and shiny surface for subsequent stages of nanoindentation experimentation, as shown in Figure 2a,b.

2.1.2. Nanoindentation Equipment

The nanoindentation experiments were performed using a Tribo indenter, model Ti950, Bruker Instrument (Minneapolis, MN, USA), at the African University of Science and Technology (AUST), Abuja, Nigeria. This instrument is capable of delivering precise load and displacement control functions. The indenter tip used in this study was a diamond Berkovich tip, which features a three-sided pyramidal shape widely employed for nanoindentation testing. The Berkovich tip geometry is preferred due to its accurate determination of mechanical properties over a wide range of indentation depths [34]. Grid indentation was used to examine the sample; therefore, a 10 × 10 (μm2) grid with a 7 μm indent spacing was implemented. Based on the application of continuum theories [35], the grid indentation was designed to reflect the mechanical phases of the material independently of its bulk properties. To meet this requirement, the maximum indentation depth (h) was kept below one-tenth of the average particle diameter (D), ensuring h/D < 0.1 [36]. A peak load of 1000 μN was applied, resulting in indentation depths ranging from 110 nm to 155 nm across the samples, respectively. Additionally, to minimize the influence of surface roughness, the indentation depth was maintained at more than three times the root-mean-squared surface roughness (Rq), i.e., h > 3 × Rq [36]. The failure mechanism of rock containing multiple defects is similar to that of rock with a single defect, but the failure process is complex and diverse, especially in the rock bridge of the rock with non-penetrating defects [37]. Due to the heterogeneous nature of the samples and to ensure data reliability and reproducibility, at least 100 indentations were performed on each mapped sample surface. These grid-based measurements were used to assess the surface topography, microstructure, and mechanical properties of the materials.
Various techniques are employed to evaluate indentation data corresponding to material deformation. A widely accepted and extensively used approach is the Oliver–Pharr method [38,39,40,41,42,43] which has been integrated into many commercial indentation systems. This methodology is accepted for the analysis of the indentation data by the ISO/FDIS 14577-1 standard [44]. The Oliver–Pharr method consists in a series of loading cycles to avoid thermal drift and plastic reversion. This enables researchers to assess the elastic–plastic characteristics of materials ranging from the early stages of the nucleation starvation region down to both discrete and continuum deformation regions. By applying a power-law model to the unloading segment of the load–displacement data [45], the adjustment and removal of load becomes possible and the stiffness of the rock samples is easily determined. In this particular study, the software embedded in the indentation instrument is calibrated to take care of the offset between the tip, the optics, and the tip shape following the standard transducer 283 and automatic optic-probe tip offset calibration techniques. This method automatically derives the reduced modulus (ER or E) and hardness (Hc) of the barite rock samples using specific mathematical formulas as presented in the following equations
E R = S π 2 A c
Modifying Equation (1), we obtain
1 E R = 1 ϑ s 2 E s + 1 ϑ f 2 E i
In this context, S denotes the stiffness, and Ac refers to the contact area. The Young’s modulus (Ei) and Poisson’s ratio (ϑi) of the indenter are estimated at 1140 GPa and 0.07, respectively. Similarly, Es and ϑs represent the Young’s modulus and Poisson’s ratio of the sample’s indented region [37]. For the barite rock, the Poisson’s ratio (ϑs) is estimated to be around 0.33 using computational analysis. The contact hardness (Hc) is determined based on established equations [36,37].
H c = P m a x / A c
A c = 24.5 h 2 f
where Pmax is the indentation load, and A c is contact area given by A c = 24.5 h2f.

2.1.3. Sample Mounting

The polished barite samples were carefully mounted in a sample holder designed for the instrument to ensure accurate and reliable nanoindentation measurements. The mounting process involved embedding the samples on a magnetic sample stage, which provided firm support and prevented movement during indentation [46].

2.2. Characterization Techniques

In addition to nanoindentation testing, other helpful methods were used to understand the structure and chemical properties of the barite rock samples. Scanning electron microscopy (SEM) was utilized to study the microstructural features of the barite rock samples. SEM equipment from Umar Musa Yaradua University, Katsina, was used for micrographs. The SEM micrographs provided valuable information about grain topography, porosity, and the presence of impurities [47]. Energy-dispersive X-ray spectroscopy (EDS) was used along with SEM to find out what elements are present and how they are spread out in the barite samples.

2.3. Data Generation

The nanoindentation experiments were conducted under load-controlled conditions, with a maximum indentation load of 1000 μN. The loading and unloading rates were set to 200 μN/second, and a dwell time of 2 s was maintained at the maximum load. The raw data from the nanoindentation tests, which included load–displacement curves, were processed and analysed using the MATLAB 2023b software package (The Mathworks Inc., Natick, MA, USA). Data correction and calibration procedures were implemented using the default function in the nanoindenter to ensure the accuracy of the nanoindentation results. Similarly, the area function of the Berkovich indenter was calibrated using a fused silica standard with known mechanical properties [48].
Furthermore, the machine’s flexibility was measured and considered during data analysis to avoid mistakes caused by the nanoindentation instrument’s flexibility. Therefore, the indenter was calibrated to correct errors associated with thermal drift and operated in accordance with the manufacturer’s guidelines and safety protocols. Electrical safety measures, such as proper grounding and the use of insulated cables, were observed to prevent potential electrical hazards.

2.4. Average Hardness of the Barite Rock Samples

The average hardness of the samples is obtained from the data extracted during the nanoindentation of the materials. They are calculated as presented in Equations (5) and (6) for IB3 and IB4, respectively.
Average   hardness   for   IB3 sample:   = Σ H n = 1.88   GPa
Average   hardness   for   IB4 sample:   = Σ H n = 1.18   GPa
The hardness data are fundamental in the assessment of the deformation of the material. Similarly, the reduced elastic modulus of the barite samples was extracted from the nanoindentation experiment. According to [49], these values are converted to Young’s modulus using some consultative equations in modelling the abrasion and wear resistance of two dissimilar materials reported by [49]. For materials exhibiting plastic behaviour like barite rocks, the resistance to deformation relative to yielding, H/E; transition on mechanical contact, i.e., elastic to plastic (H/E)2; modulus of resilience H2/2E; and resistance to the plastic indentation, H/Er2 or H3/E2, can be extracted from the relationship of the hardness and reduced elastic modulus as reported by [30,49,50,51,52,53]. This study employs the relationship of H/Er2 to account for the resistance to the plastic indentation of the rock samples.
For samples IB3 and IB4, the resistance to the plastic indentation is thus calculated using H/Er2, where H is the hardness of the material and Er is the reduced elastic modulus of the materials.
Taking ξ as the resistance to plastic indentation, we obtain the following:
ξ = H/Er2

3. Results and Discussion

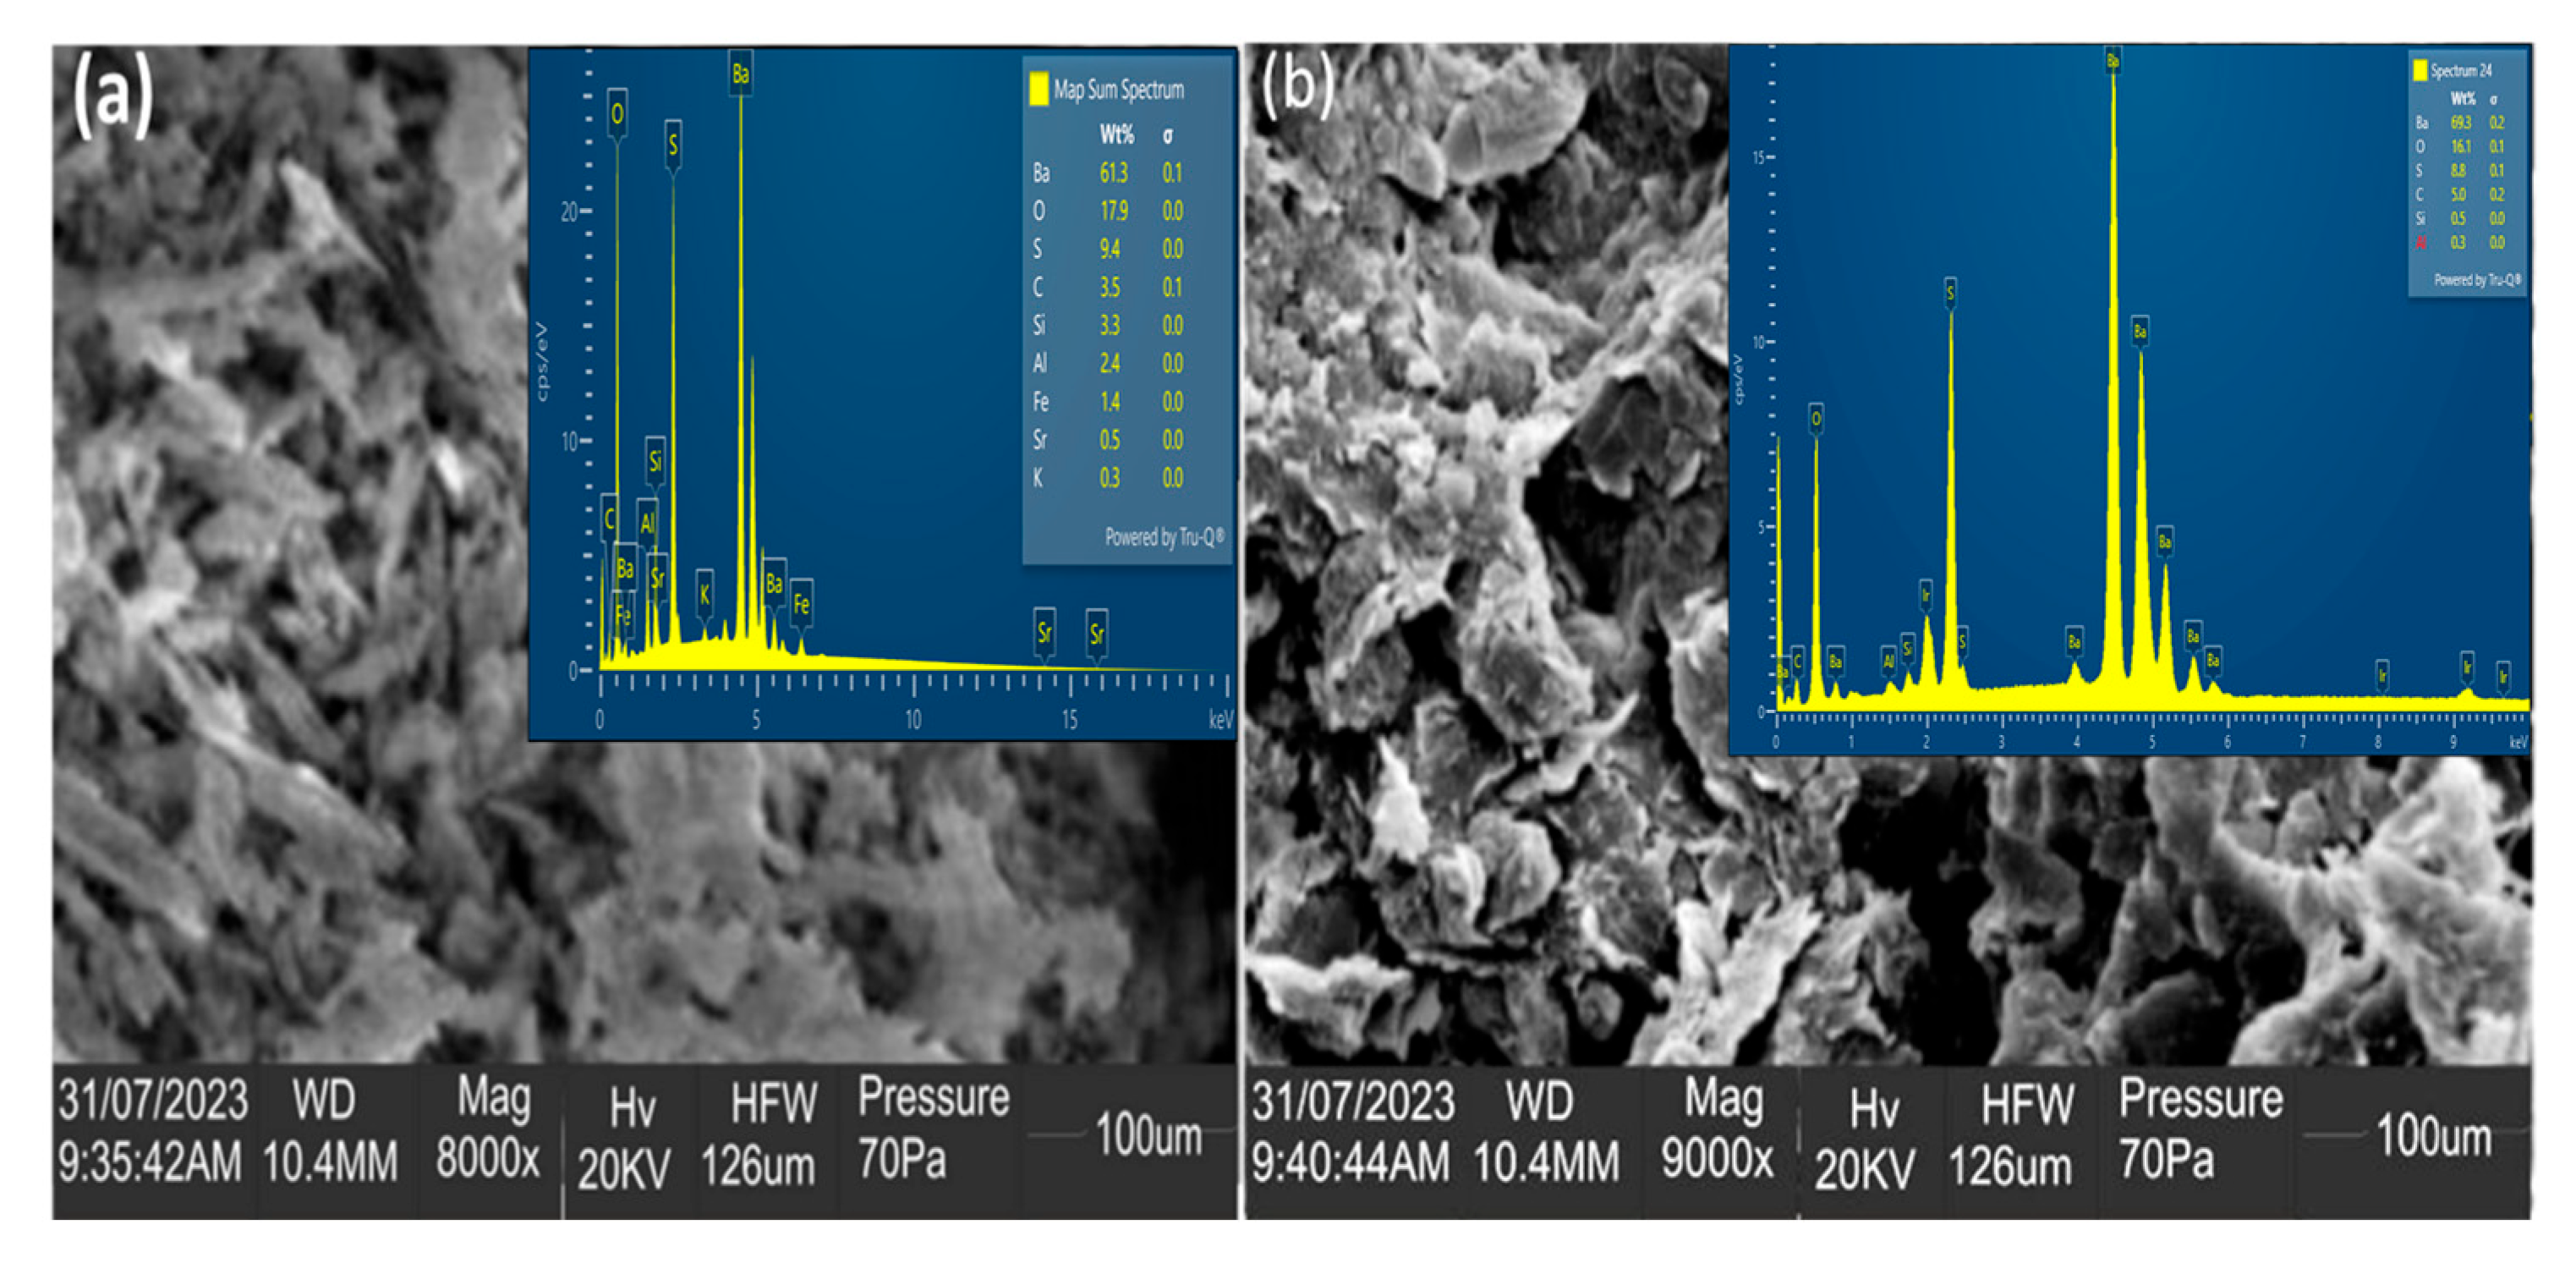
3.1. Morphology and Elemental Composition of the Indented Barite Rock Sample Surfaces

Figure 3a,b reveal the typical granular topography of barite grains, with varying sizes ranging from a few micrometres to tens of micrometres. The grains had clear edges and specific flat surfaces, which are features of the orthorhombic crystal system of barite. Furthermore, the figure presents the EDS mapping of the elemental constituents of the two samples, i.e., IB3 and IB4. Overall, multiple EDX peaks indicate the presence of several elements existing in the barite rock samples. Iron, aluminium, and silica, in trace amounts, are connected to the high hardness obtained within some regions of sample IB3. On the other hand, the silica and aluminium present in sample IB4 increase the hardness to a value lower than that of IB3.
In addition to hard minerals in barite rock samples, defects such as pores, fissures, and cracks are responsible for high average hardness values. Pores observed as dark regions in the micrographs can potentially influence the mechanical properties and deformation behaviour of the material. These surfaces are suitable for attachments/interactions and as sites for fine particles, high surface area/unit volume, and hence high surface energies. The attributes may encourage mineral–water impurities and mineral–mineral interactions. The EDS analysis shown in Figure 3a,b agrees with the SEM images and provides detailed information about the elements in the barite samples. Also, the EDS elemental composition of barite samples shows the average atomic percentages of the detected elements. The analysis indicated that barium (Ba) and sulphur (S) are the main parts of barite (BaSO4). Minor amounts of silicon (Si), calcium (Ca), and more oxygen (O) were also detected. This discovery shows that barium sulphate, silicon dioxide (SiO2), and carbonate-based (CO3) impurities or non-barite minerals are common, which changes how these materials respond mechanically. Studies from [11,27,54] also confirmed the presence of this trace element in the barite rocks.

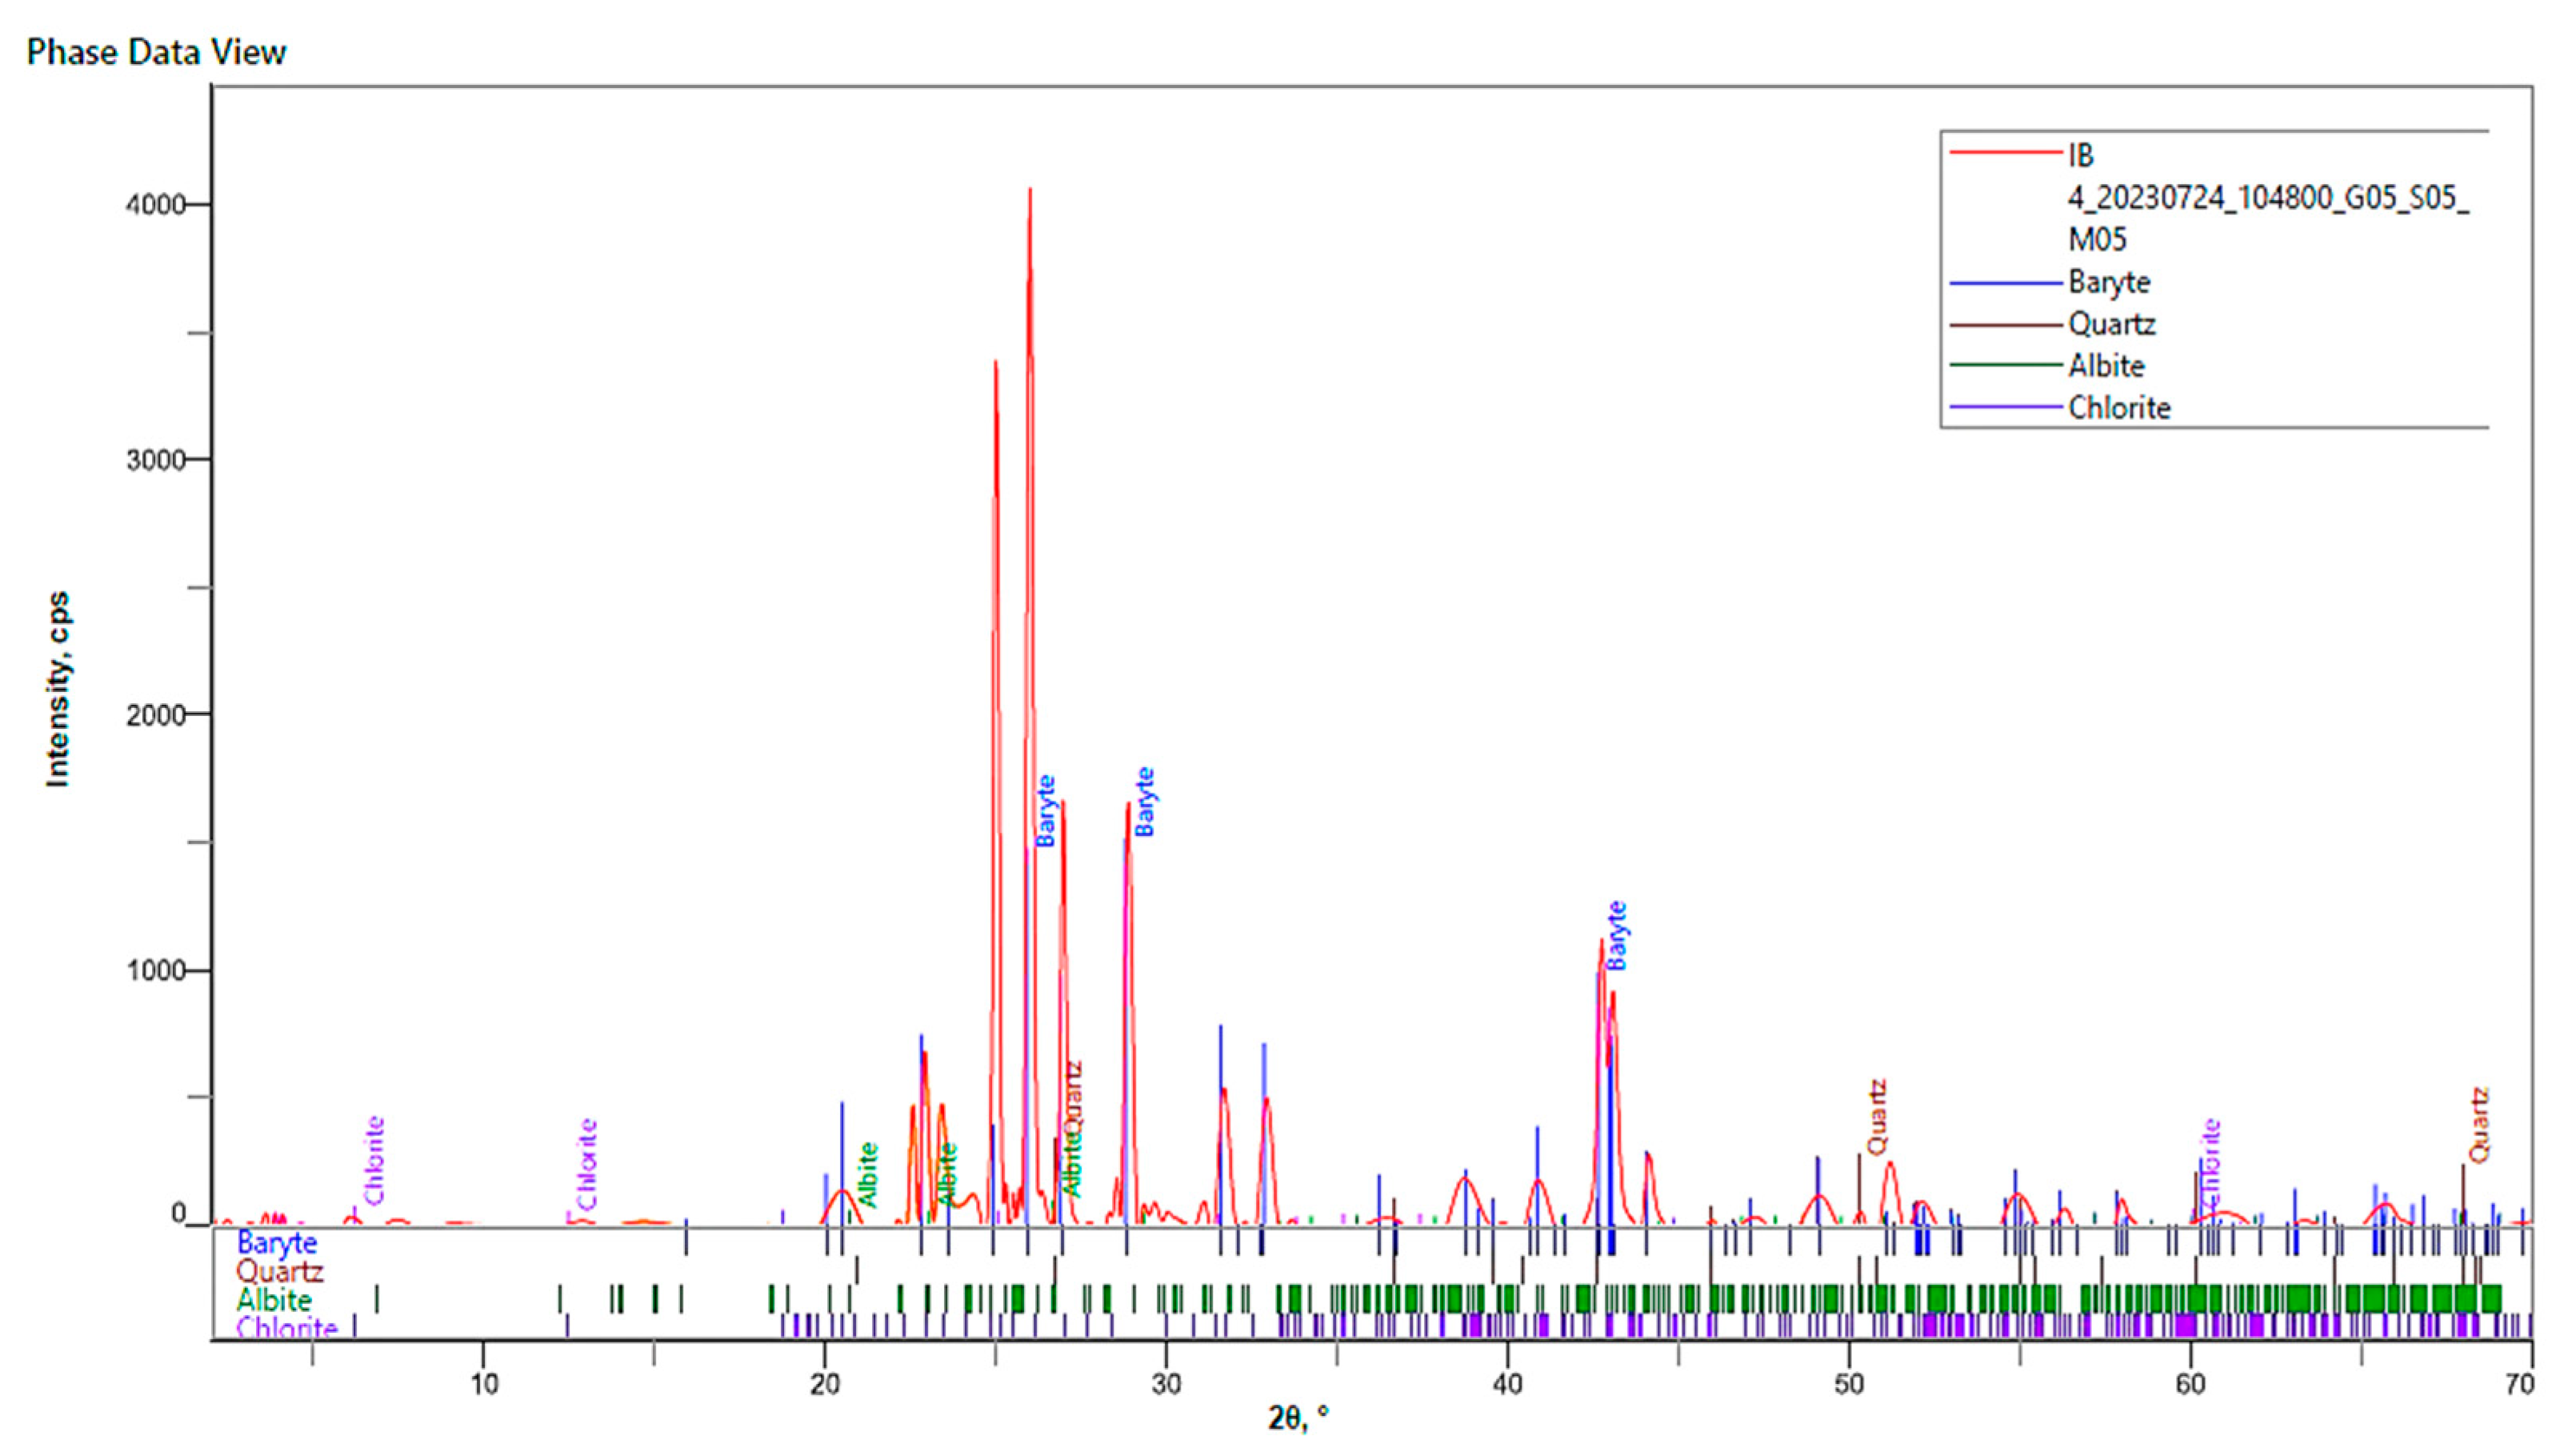
3.2. XRD Results for Barite Rock Samples

The XRD analysis results are shown in Figure 4 and Figure 5.
Figure 4 and Figure 5 confirm the mineral phases in the barite rock samples as depicted by the deconvoluted peaks in the XRD data. The results revealed four different phases, and the main peak at 2 θ for IB3 is 26.14° with a d-spacing of 3.41 Å and a plane of (210) barite. Within almost the same sample, a 2 θ angle of 27.14° with a d-spacing of 3.28 Å and plane 102 barite was depicted. For sample IB4, a 2 θ angle of 25.96° is the main barite peak with a d-spacing of 3.43 Å at the plane (210) barite. It was also observed in the sample that there was a peak at a 2 θ angle of 24.98° with a d-spacing of 3.43 Å, which also corresponds to the (210) barite plane. At 2 θ = 26.92°, a d-spacing of 3.31 Å shows a plane of barite (102), as observed. The XRD revealed no slight differences in the structure formation of the BaSO4, affirming (210) and (102) as the predominant crystallographic planes. This finding can be confirmed in Figure 3a,b (IB3 and IB4). The trend in the appearance of the samples’ peaks agrees with the work of [11,54]. However, there is a slight shift in the peak positions due to traces of some elements in the two different works from different locations. It has been confirmed that the rock samples studied are barite containing minerals, which contains barite/baryte, silica, albite, and chlorite minerals associated with the mining areas under study. This information is critical to investors in the mineral processing industry. An understanding of the structural and surface properties of barite is useful in designing processes for crushing barite rocks and processing crushed barite ores. The hardness and reduced modulus values of the samples are established and critical in designing crushers and mills for barytes in the mineral processing industries. These values can help design and analyse various parts of the crushers, including the force needed for the jaw teeth design and the amount of barite loaded during grinding.

3.3. Nanoindentation Results

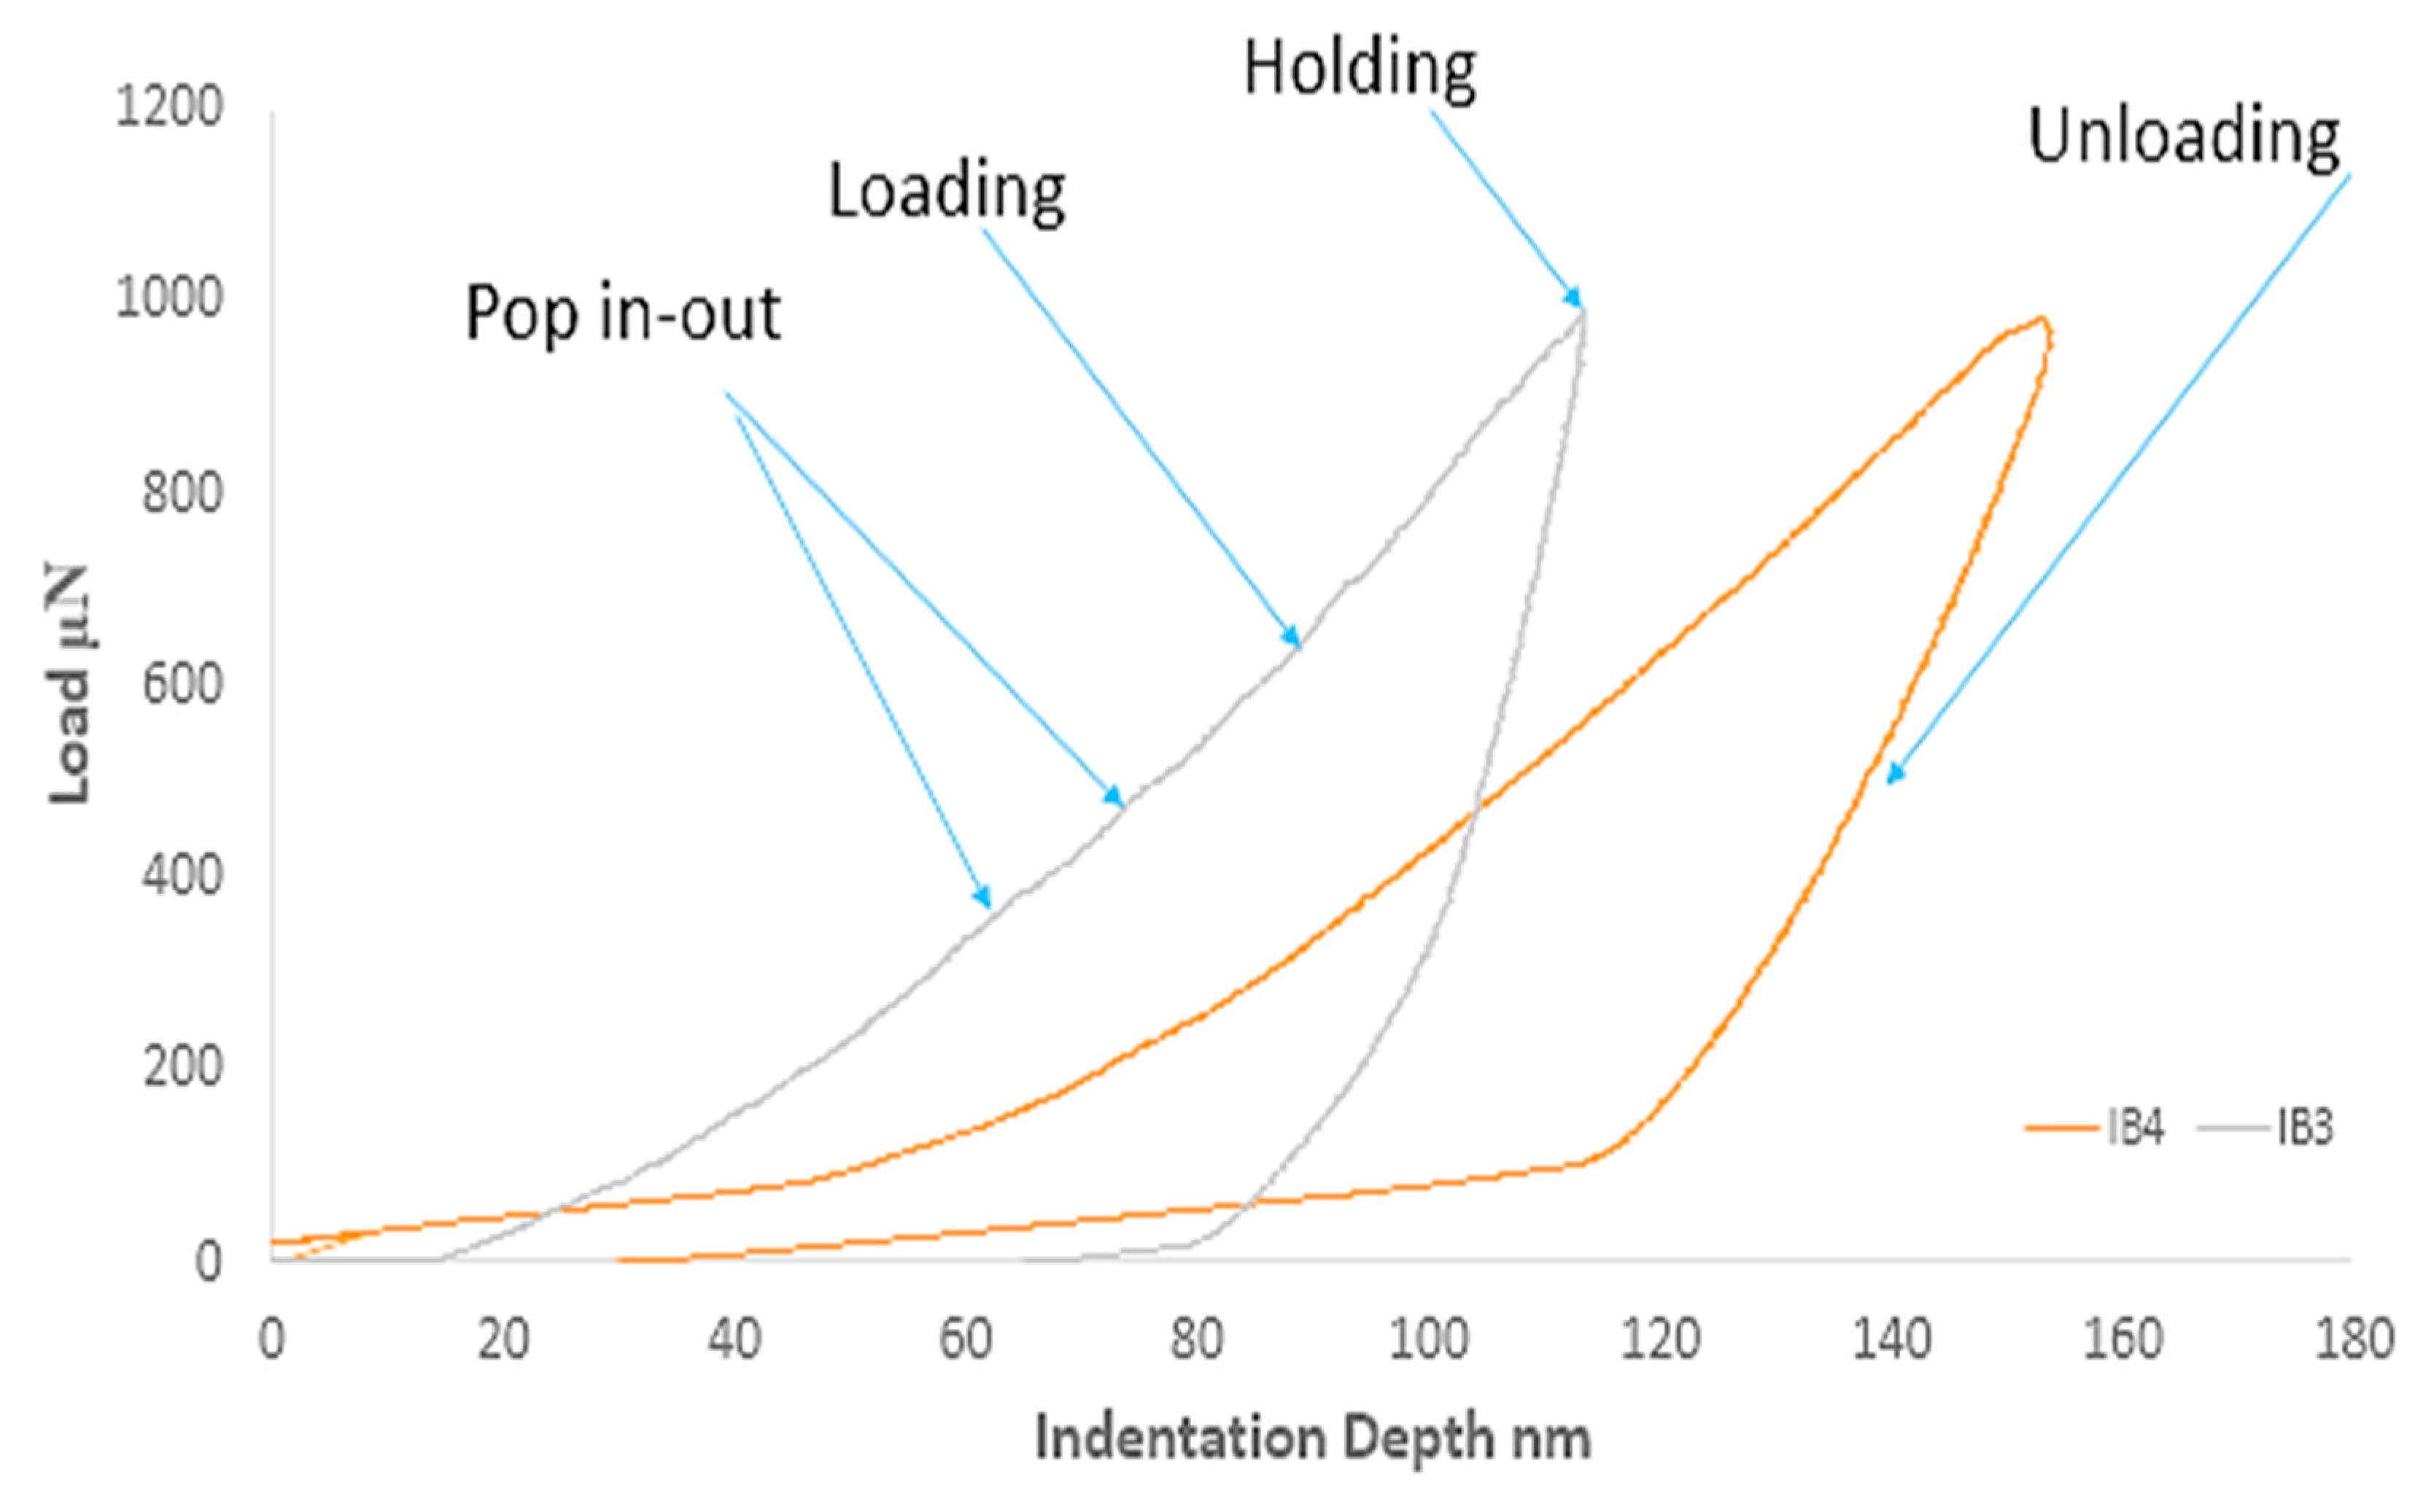
3.3.1. Load–Displacement Curves

The nanoindentation experiments on the barite samples from the deposits yielded a series of load–displacement curves, which provide valuable information about the mechanical response of the barite material, as presented in Figure 6.
Figure 6 shows a typical load–displacement curve for samples IB3 and IB4 obtained during the tests. The curve displays a loading segment, where the indentation depth increases as the applied load increases, and a holding segment at the maximum load, which considers any potential creep effects on resistance. Here, 2 s were applied during the holding time. The unloading segment represents the withdrawal of the indenter after attaining the maximum load assigned during the experiment on the material. The shape and features of the load–displacement curves provide information about how the barite samples deform and behave in both elastic and plastic ways. This shape also shows the nature of the material’s plasticity. The distance or gap between the loading and unloading segments, from minimum to maximum depth, indicates the hardness of the materials. The larger the distance, the lower the hardness, as observed in this case and other samples studied.

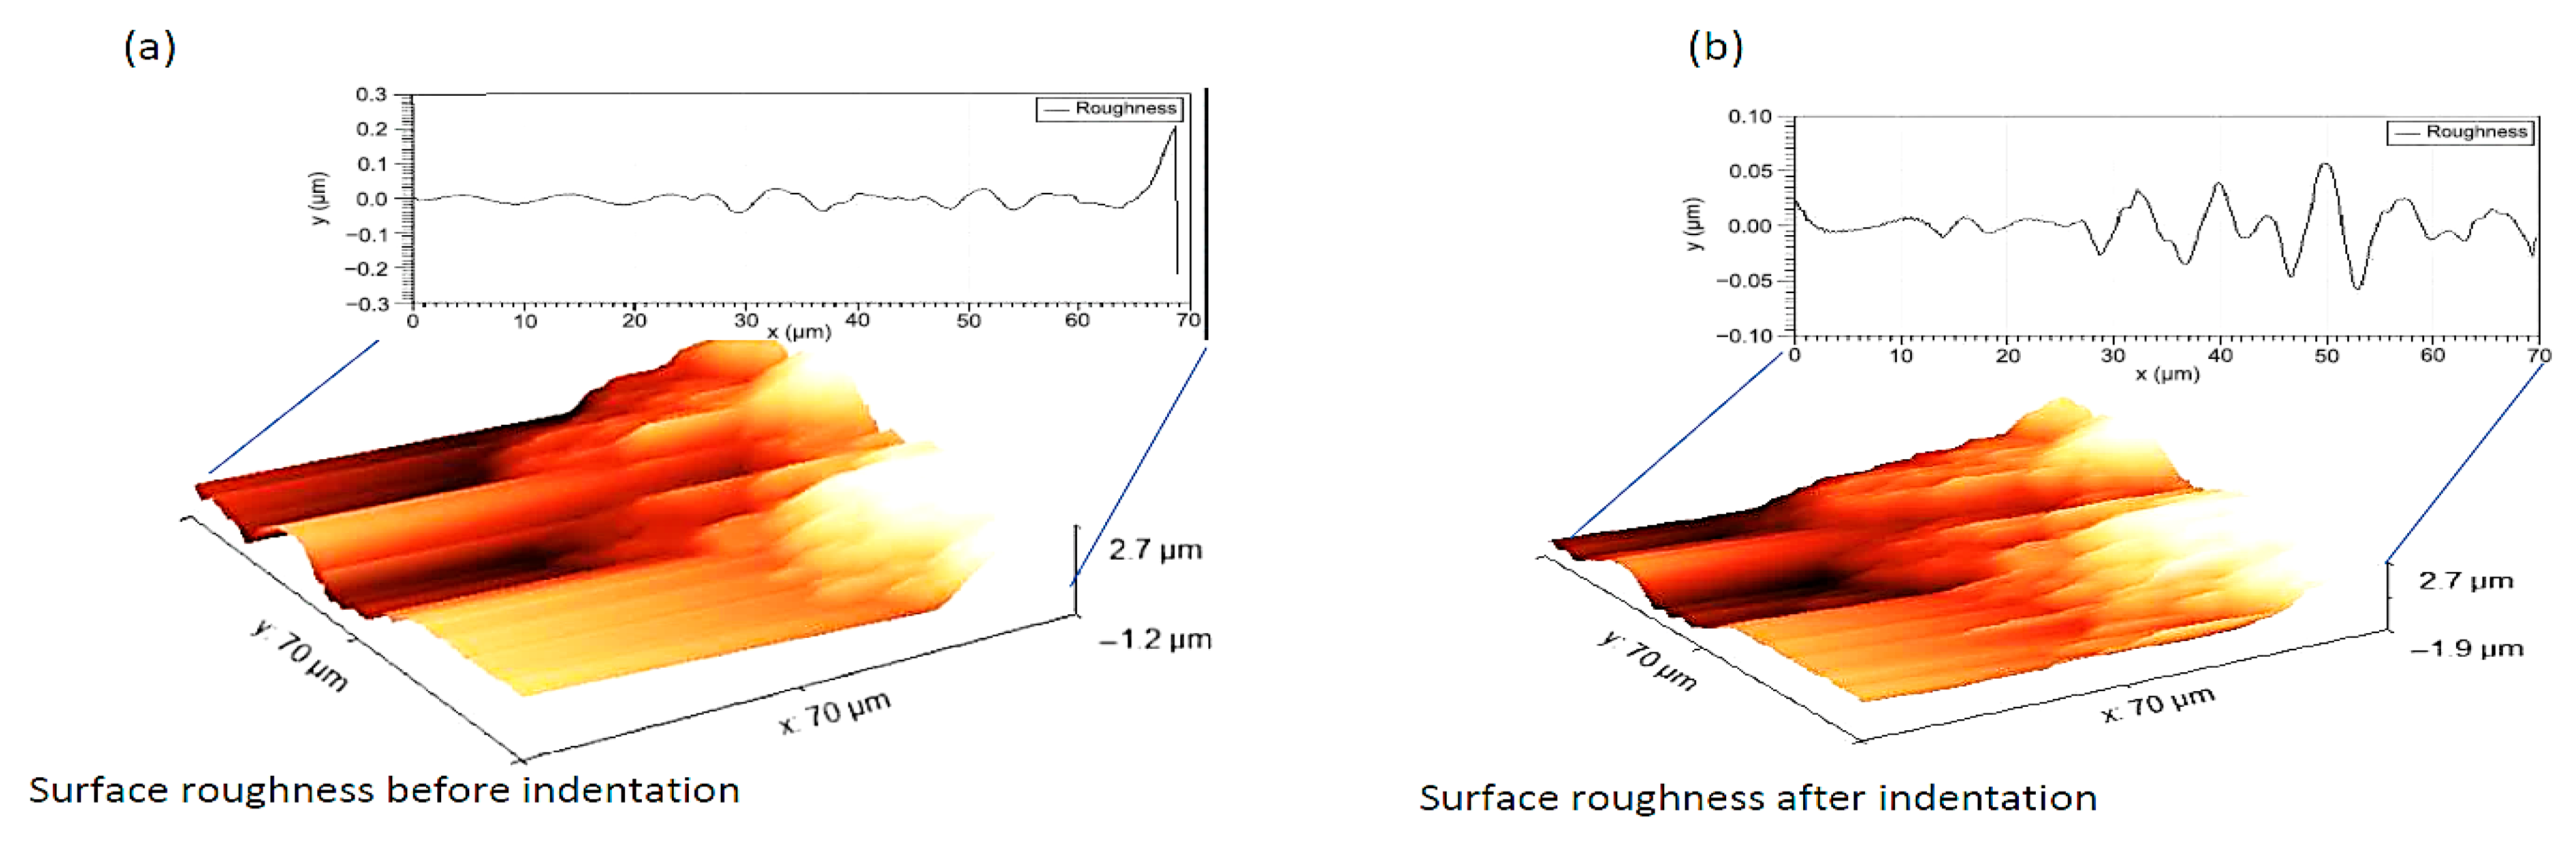
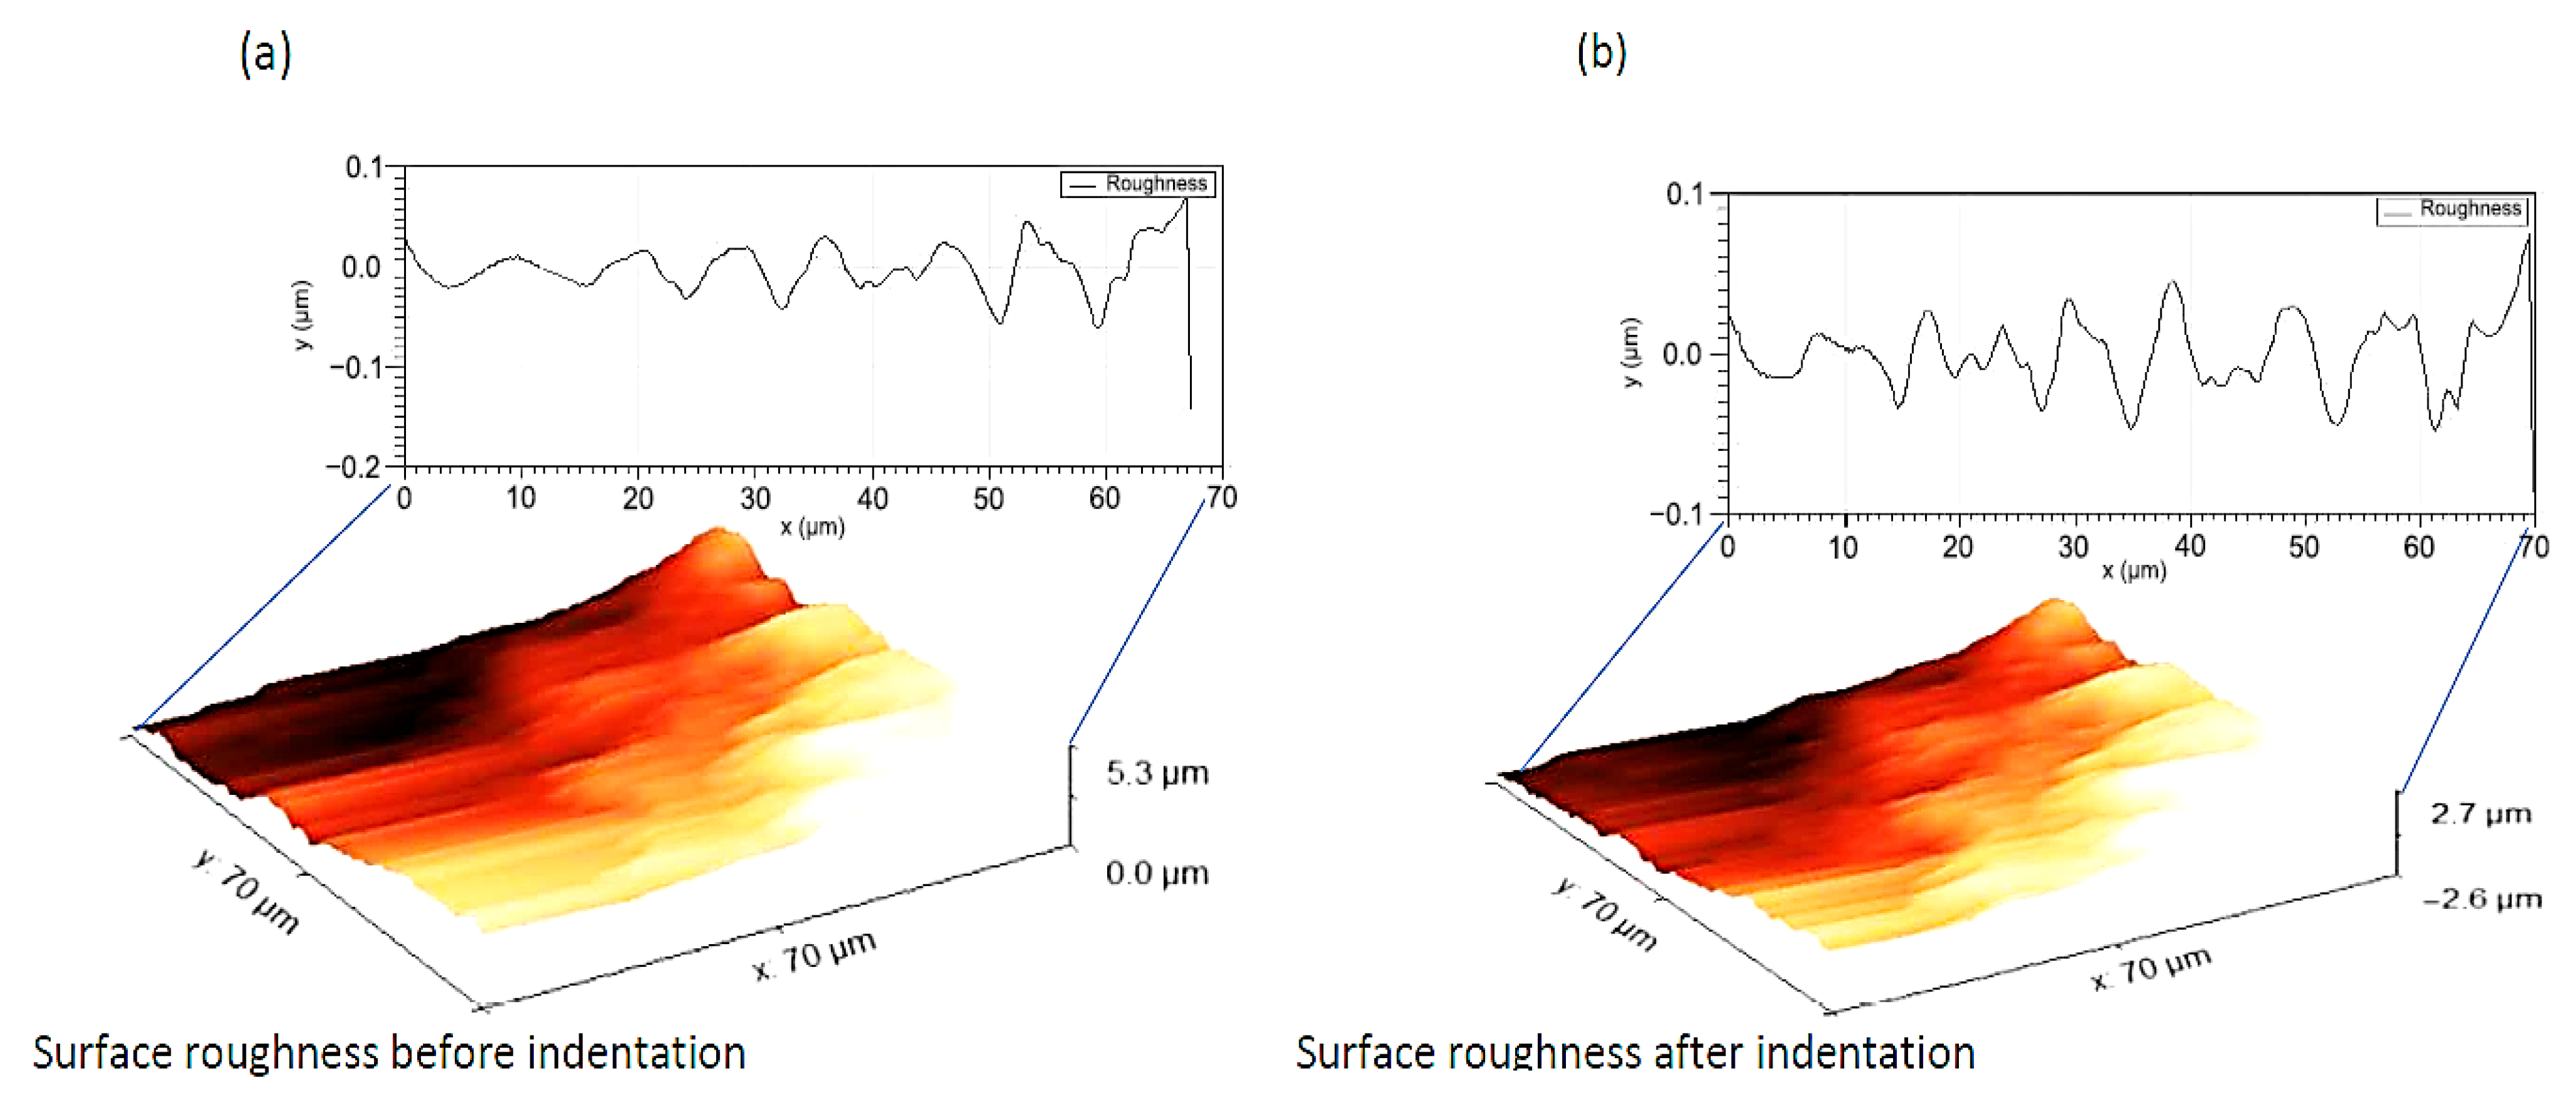
3.3.2. Atomic Force Microscopy (AFM) Images and Surface Roughness

The AFM images were obtained from data extracted in Section 2.3, while the surface roughness was calculated with Gwydion 2023. The images are presented in Figure 7 and Figure 8.
Figure 7 and Figure 8 present the AFM images showing the surface roughness of the barite rock samples. The results also describe the surface topology before and after indentation. As observed for IB3, the surface roughness decreased from 17.34 nm to 12.70 nm, indicating that the indentation process smoothens the surfaces by filling up the microcracks with debris, as shown by the figures. Ultimately, this structural adjustment indicates possible contact deformation and earlier-stage plastic deformation due to materials flow at the surface to fill up the rough features, resulting in a smoother surface. However, the surface roughness for IB4 decreases slightly from 19.00 nm to 17.96 nm upon surface indentation. This marginal change suggests that the nanoindentation process had minimal impact on the surface roughness in the case of sample IB4, as observed in this study. The material response to indentation reflects the mechanical behaviour of the rock samples under stress. Similarly, this understanding relates the contribution of each mineral phase present in the samples and the implications of the variation in the materials’ properties across the indented positions during contact deformation and subsequent plastic deformation prior to failure. Overall, the result indicates that IB3 is harder than IB4, illustrating barite's response to nanoindentation measurements. These observations highlight the varying responses of different materials to the same mechanical process, reflecting their intrinsic mechanical properties and surface and mechanical behaviours.

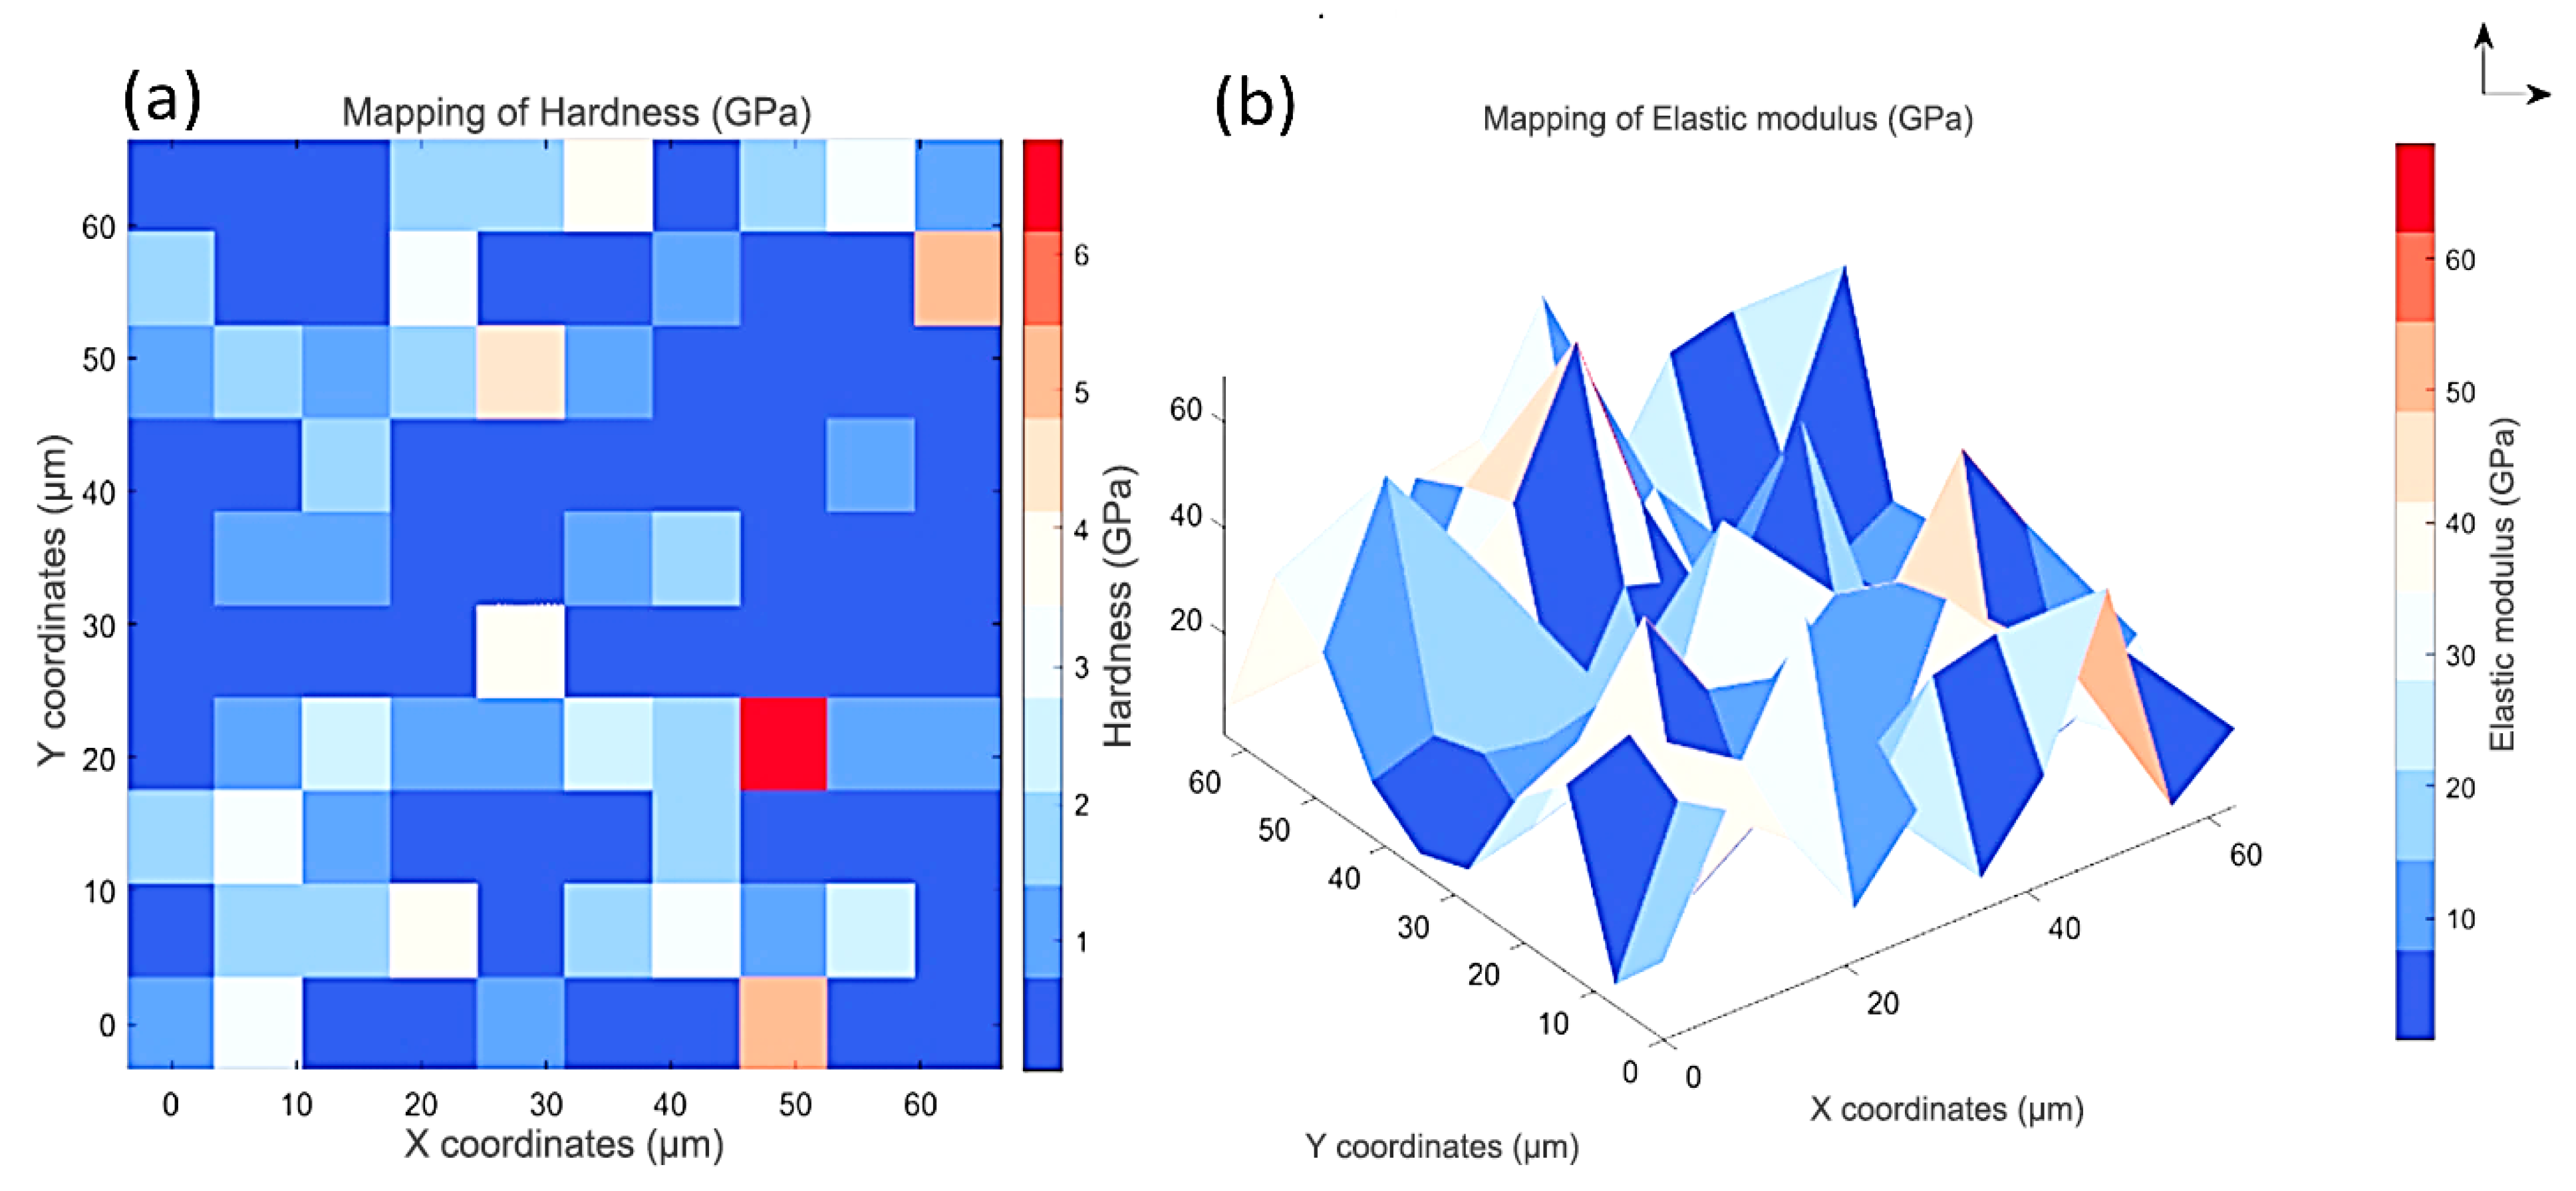
3.4. Hardness and Reduced Elastic Modulus of the Barite Rock Samples

Figure 9a and Figure 10a show the average hardness values obtained from the load–displacement curves. These values were automatically extracted as an average of 100 indented points using the Oliver–Pharr method. Similarly, the hardness and elastic modulus of the barite samples based on these values are automatically extracted using the same method. The hardness values for IB3 and IB4 are 1.88 GPa and 1.18 GPa. These values are true of barite rock samples reported in the literature and are consistent with the range typically reported for barite rock in the literature [4]. The results indicate that IB3 is harder and requires higher energy to be crushed than IB4. This is anticipated and can be traced to the high silica and other hardcore minerals in both samples, as earlier indicated by the XRD results.
Figure 6 describes the indentation size effect on the barite rock samples based on pop-ins, which correspond to displacement bursts of at least 2–8 nm in IB3 and IB4, respectively. Cumulatively, they contribute to 10% of the total indentation depth during the loading segment. This contribution from the pop-ins can affect the apparent size effect and the length-scale dependency on hardness. These variations are linked to the inclusions and defects associated with the intrinsic properties of the barite rock samples.

3.5. Elastic Modulus of the Barite Rock Samples

The reduced elastic modulus of the barite rock samples are presented in Figure 9b and Figure 10b. The elastic modulus, representing the material’s resistance to elastic deformation, was within 35.89 GPa to 46.75 GPa for IB3 and IB4. While the elastic modulus for several indented points is within the range, the elastic modulus for a few is below the minimum value or above the maximum, as shown on the heat maps in Figure 9b and Figure 10b generated from MATLAB. This indicates that the barite rock samples contain several non-barite minerals with an elastic modulus different from the barite mineral. The variation in the elastic modulus agrees with the hardness mentioned earlier. This variation in material properties translates into a non-predictive response of the barite samples to varying response compression, impact, and shear during comminution.

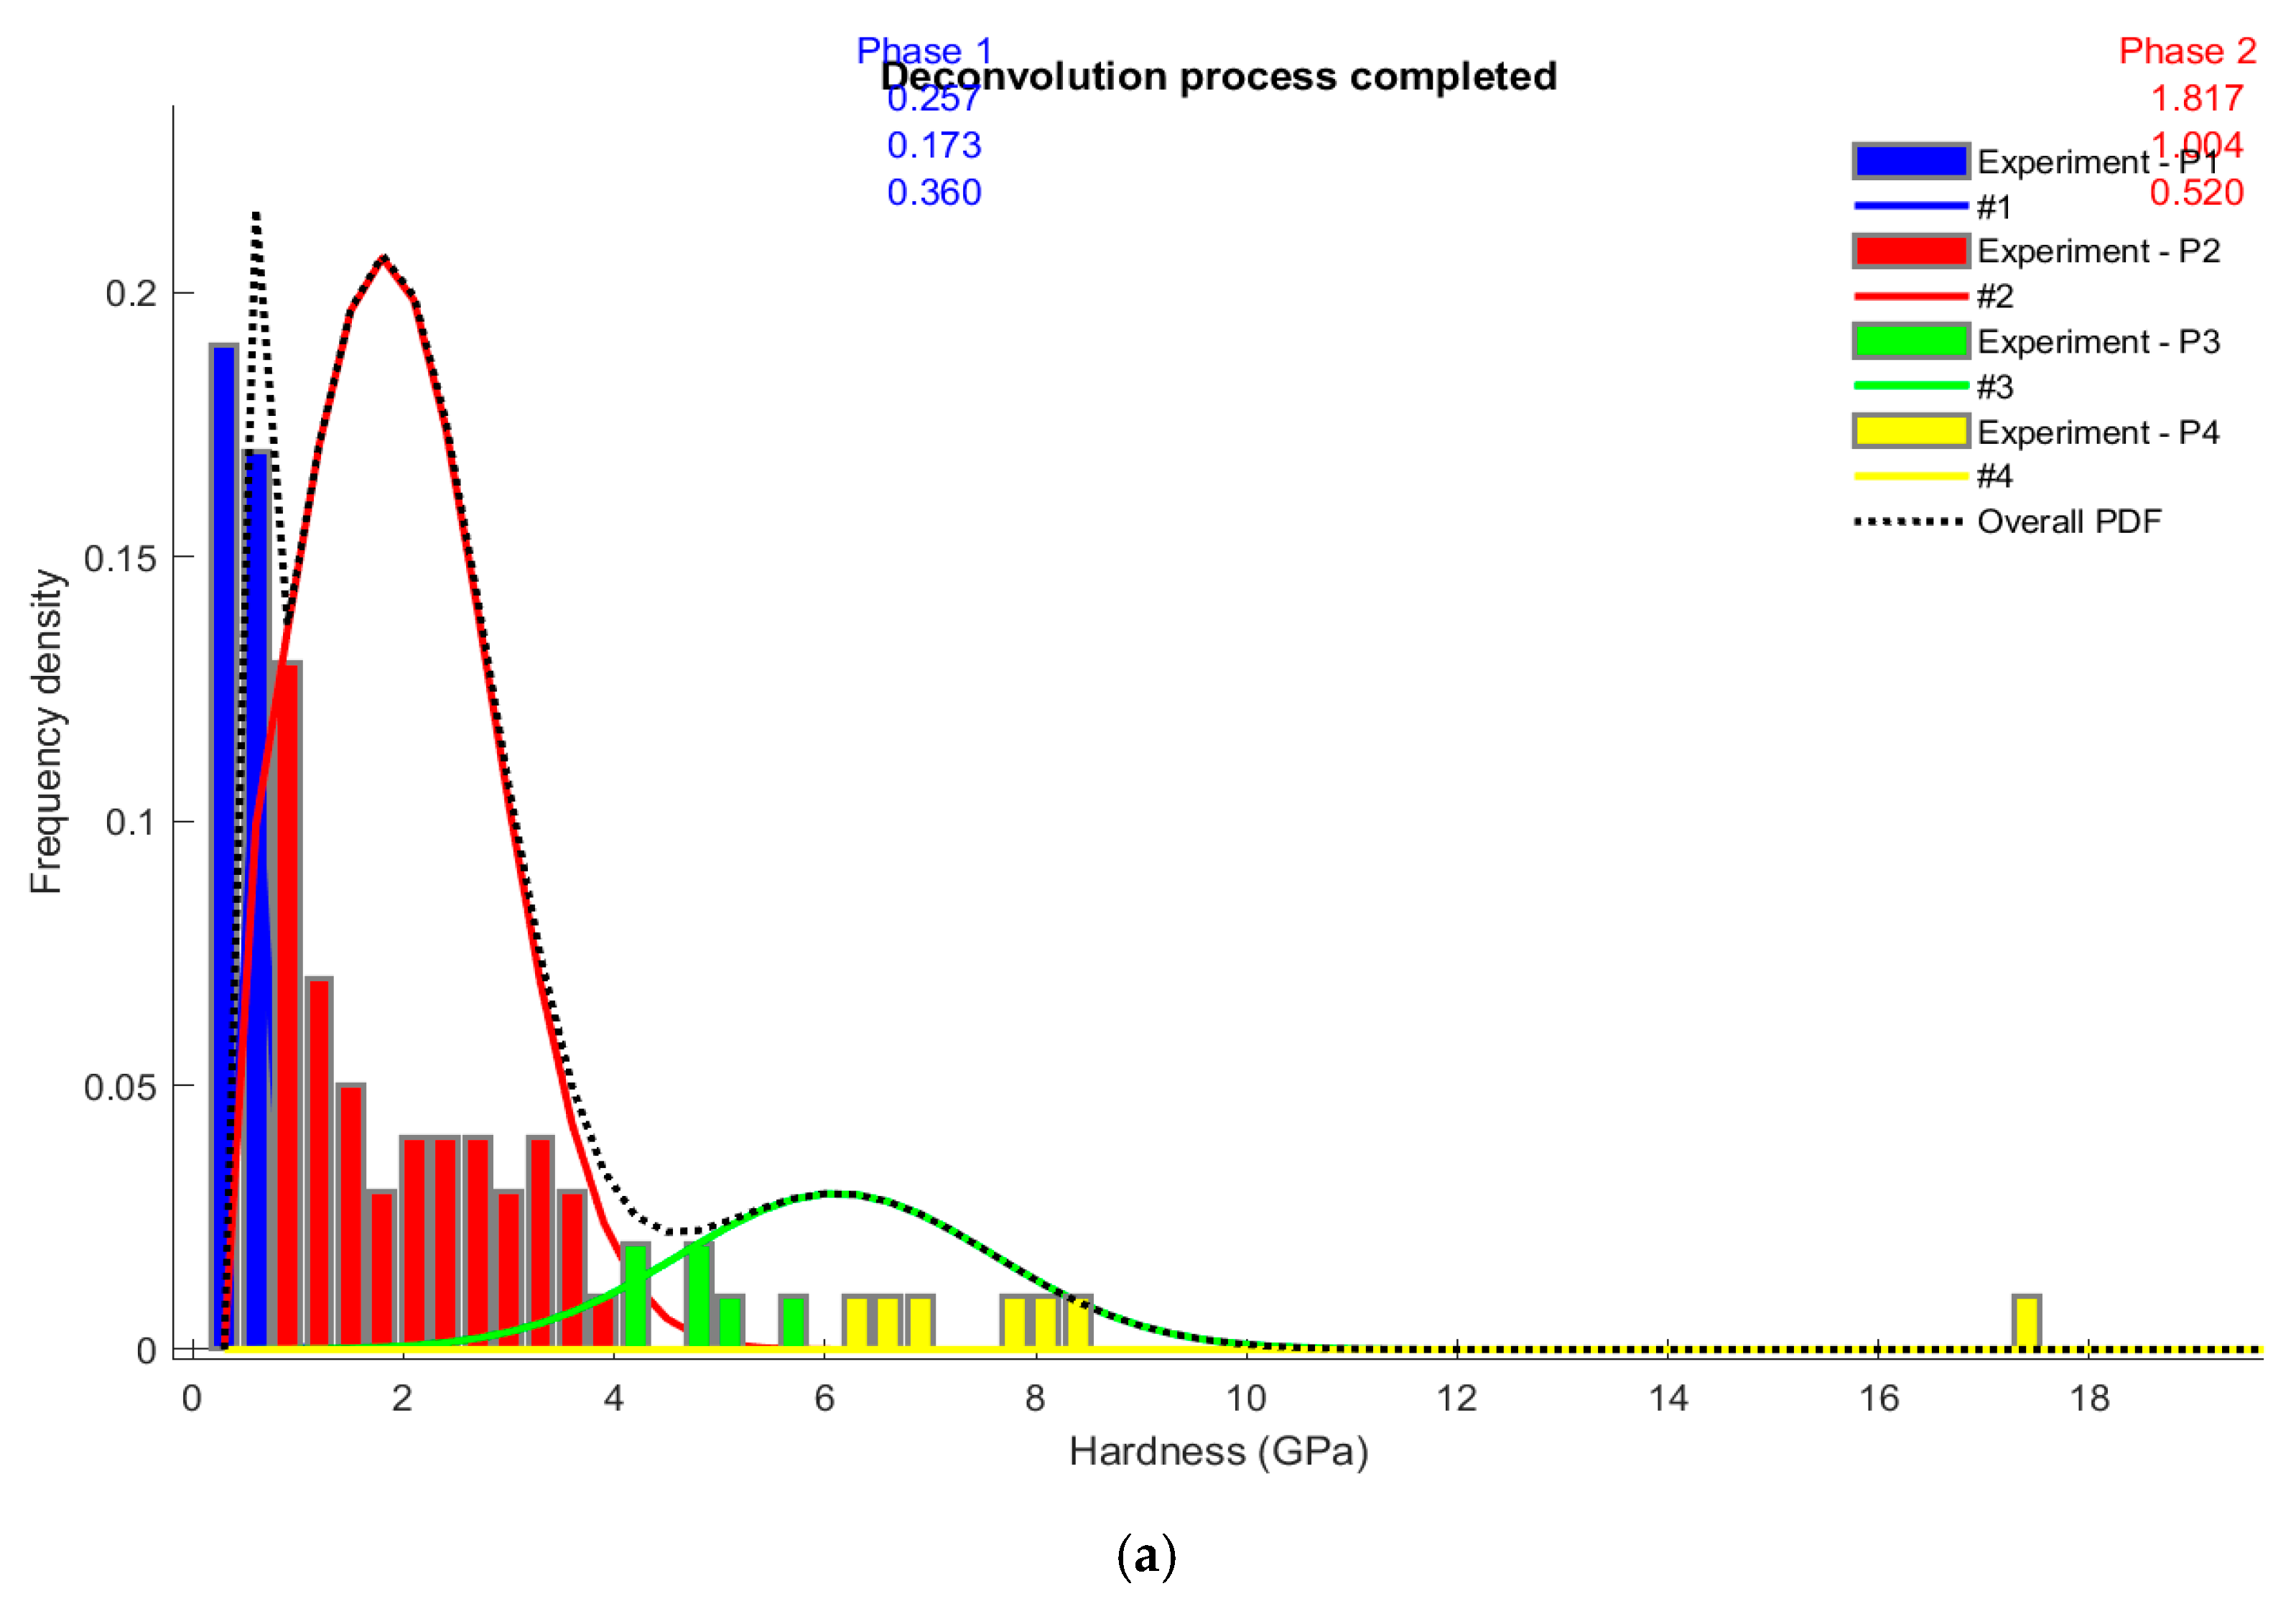
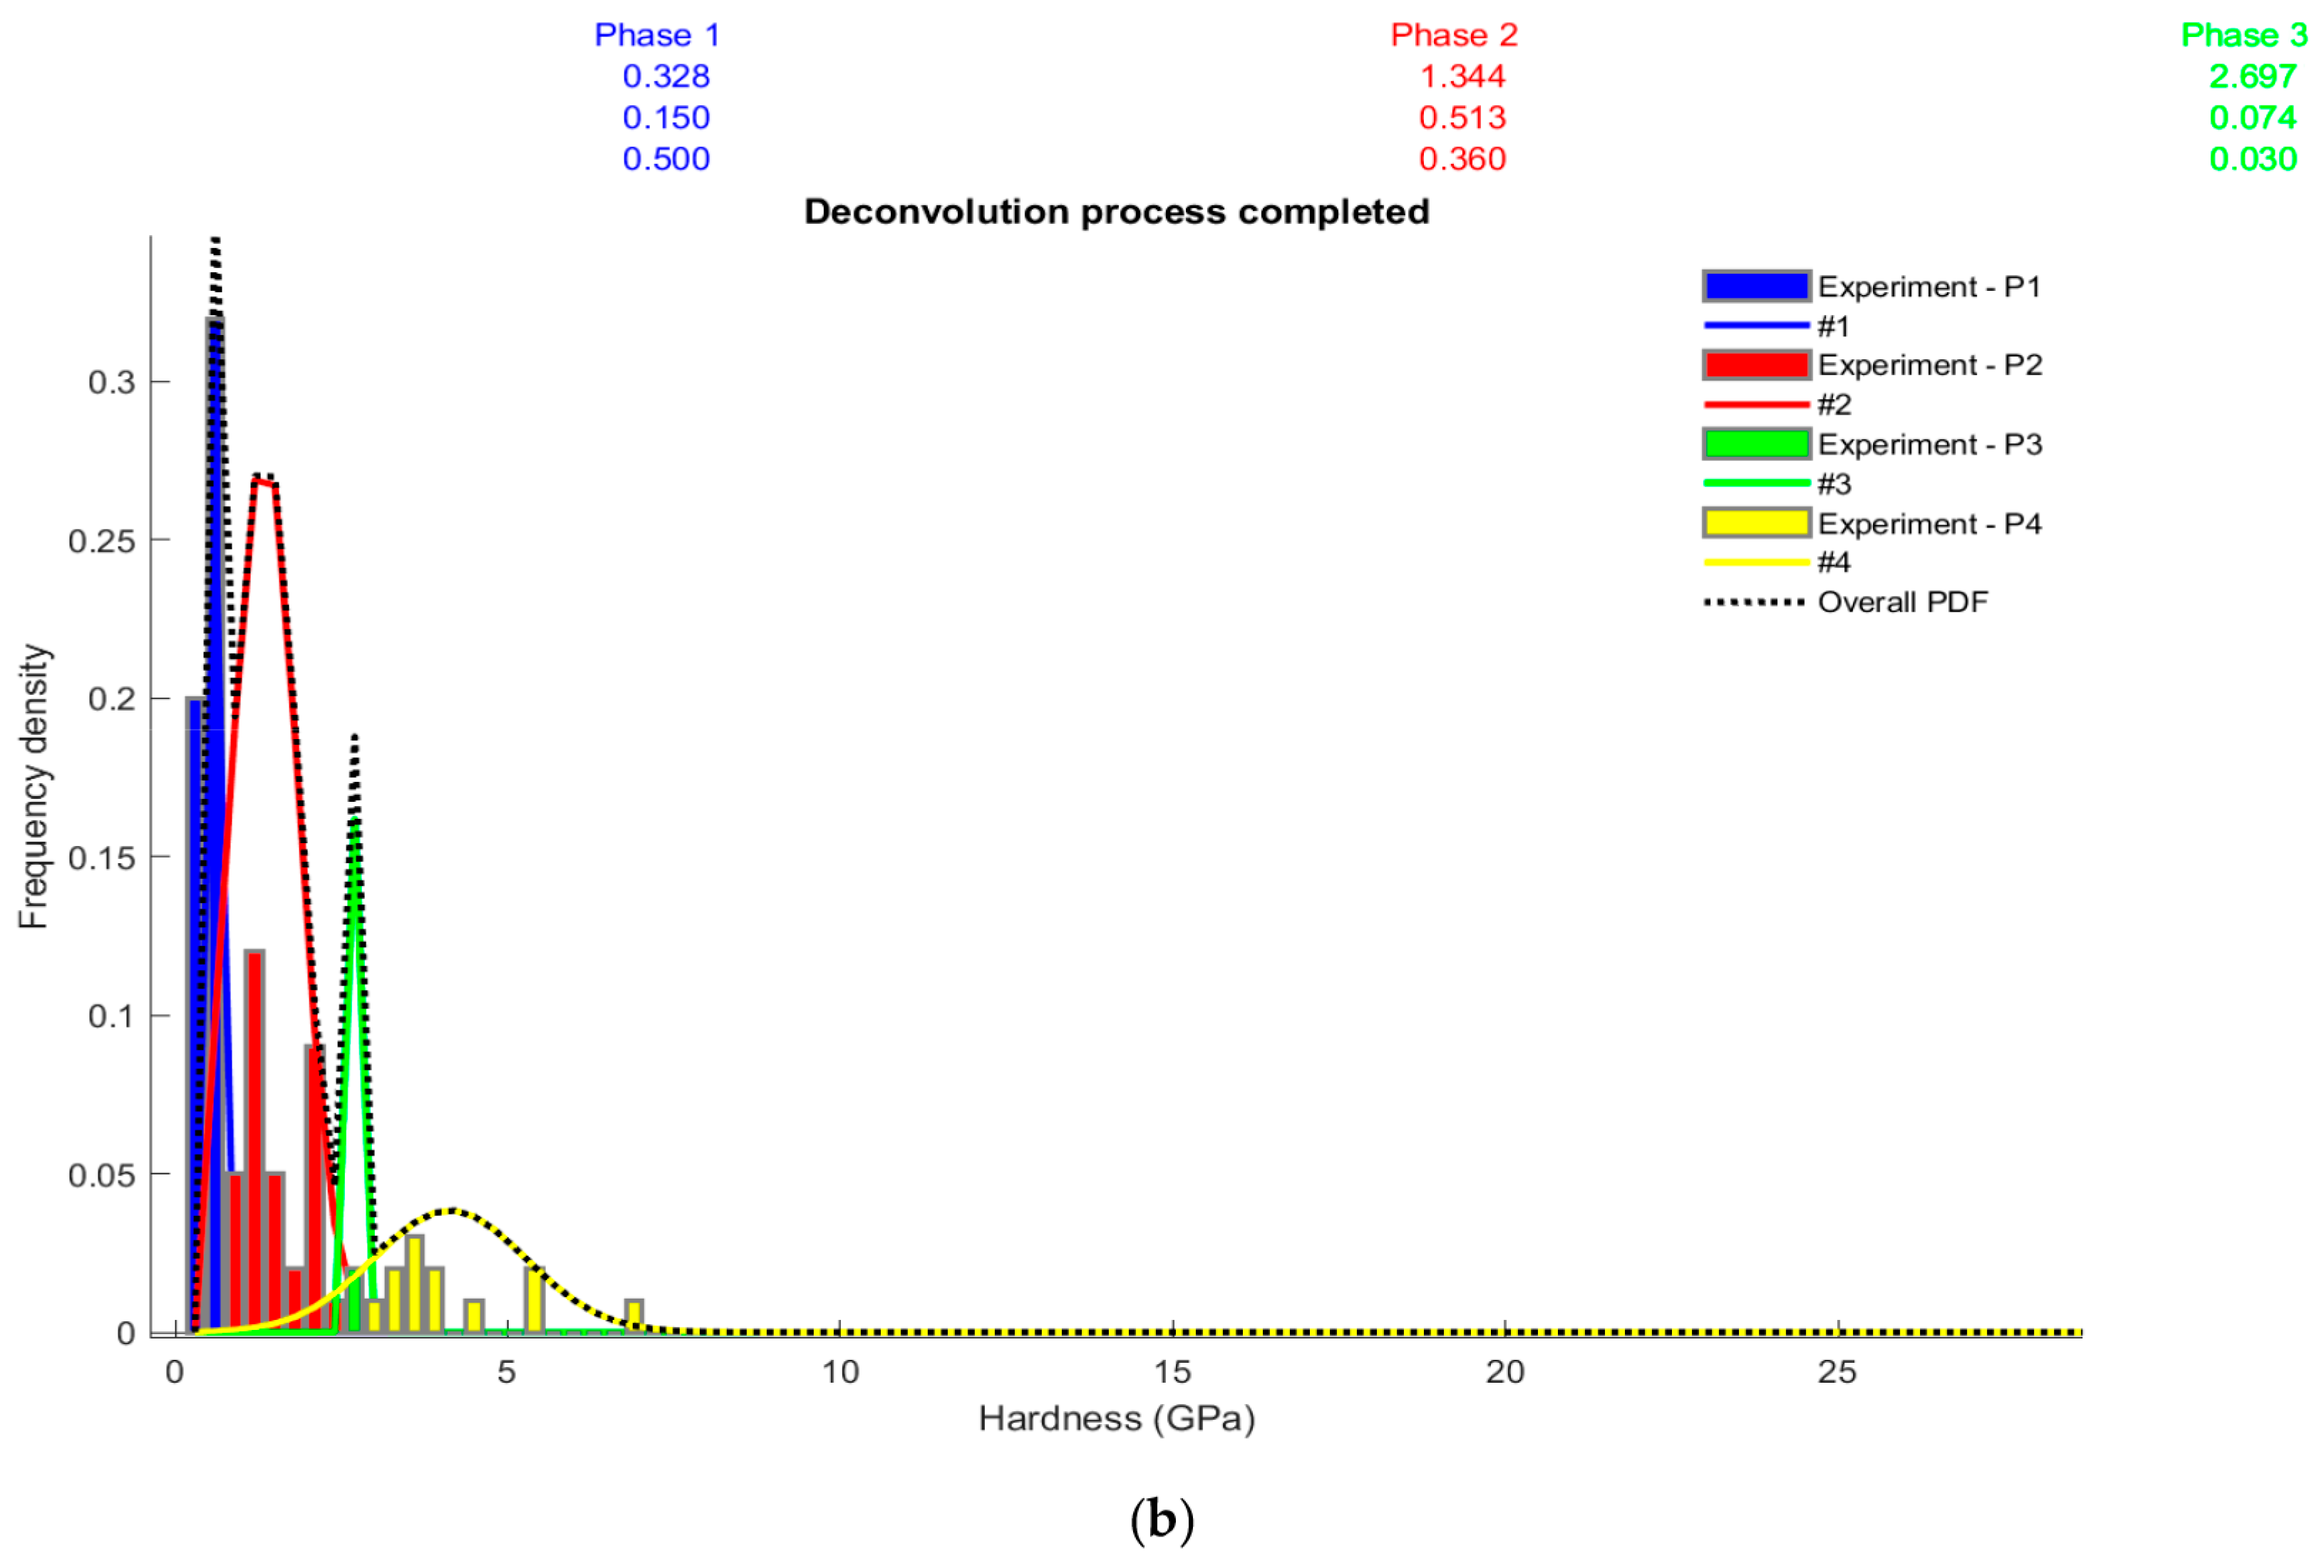
3.6. Statistical Variations in the Mechanical Hardness of Constituents of Barite Rock Samples

Figure 11a,b present the statistical ranges for hardness for the rock samples. The results indicate that the rock samples contain four phases and are entirely heterogeneous. Similarly, each phase extends across long and short ranges of hardness. This implies that each phase contains minerals of different hardness. The results corroborate XRD and EDS analysis outcomes and the 2D maps for hardness and elastic modulus. Understanding the phases present in the rock samples and their properties is important and should be considered when developing the comminution and mineral processing flowsheets. This will ensure optimal performance, minimise energy usage, and prolong the lifespan of machinery by reducing unnecessary stress and wear. Overall, the results emphasise the importance of material characterization in achieving efficient, cost-effective, and reliable mineral processing operations.

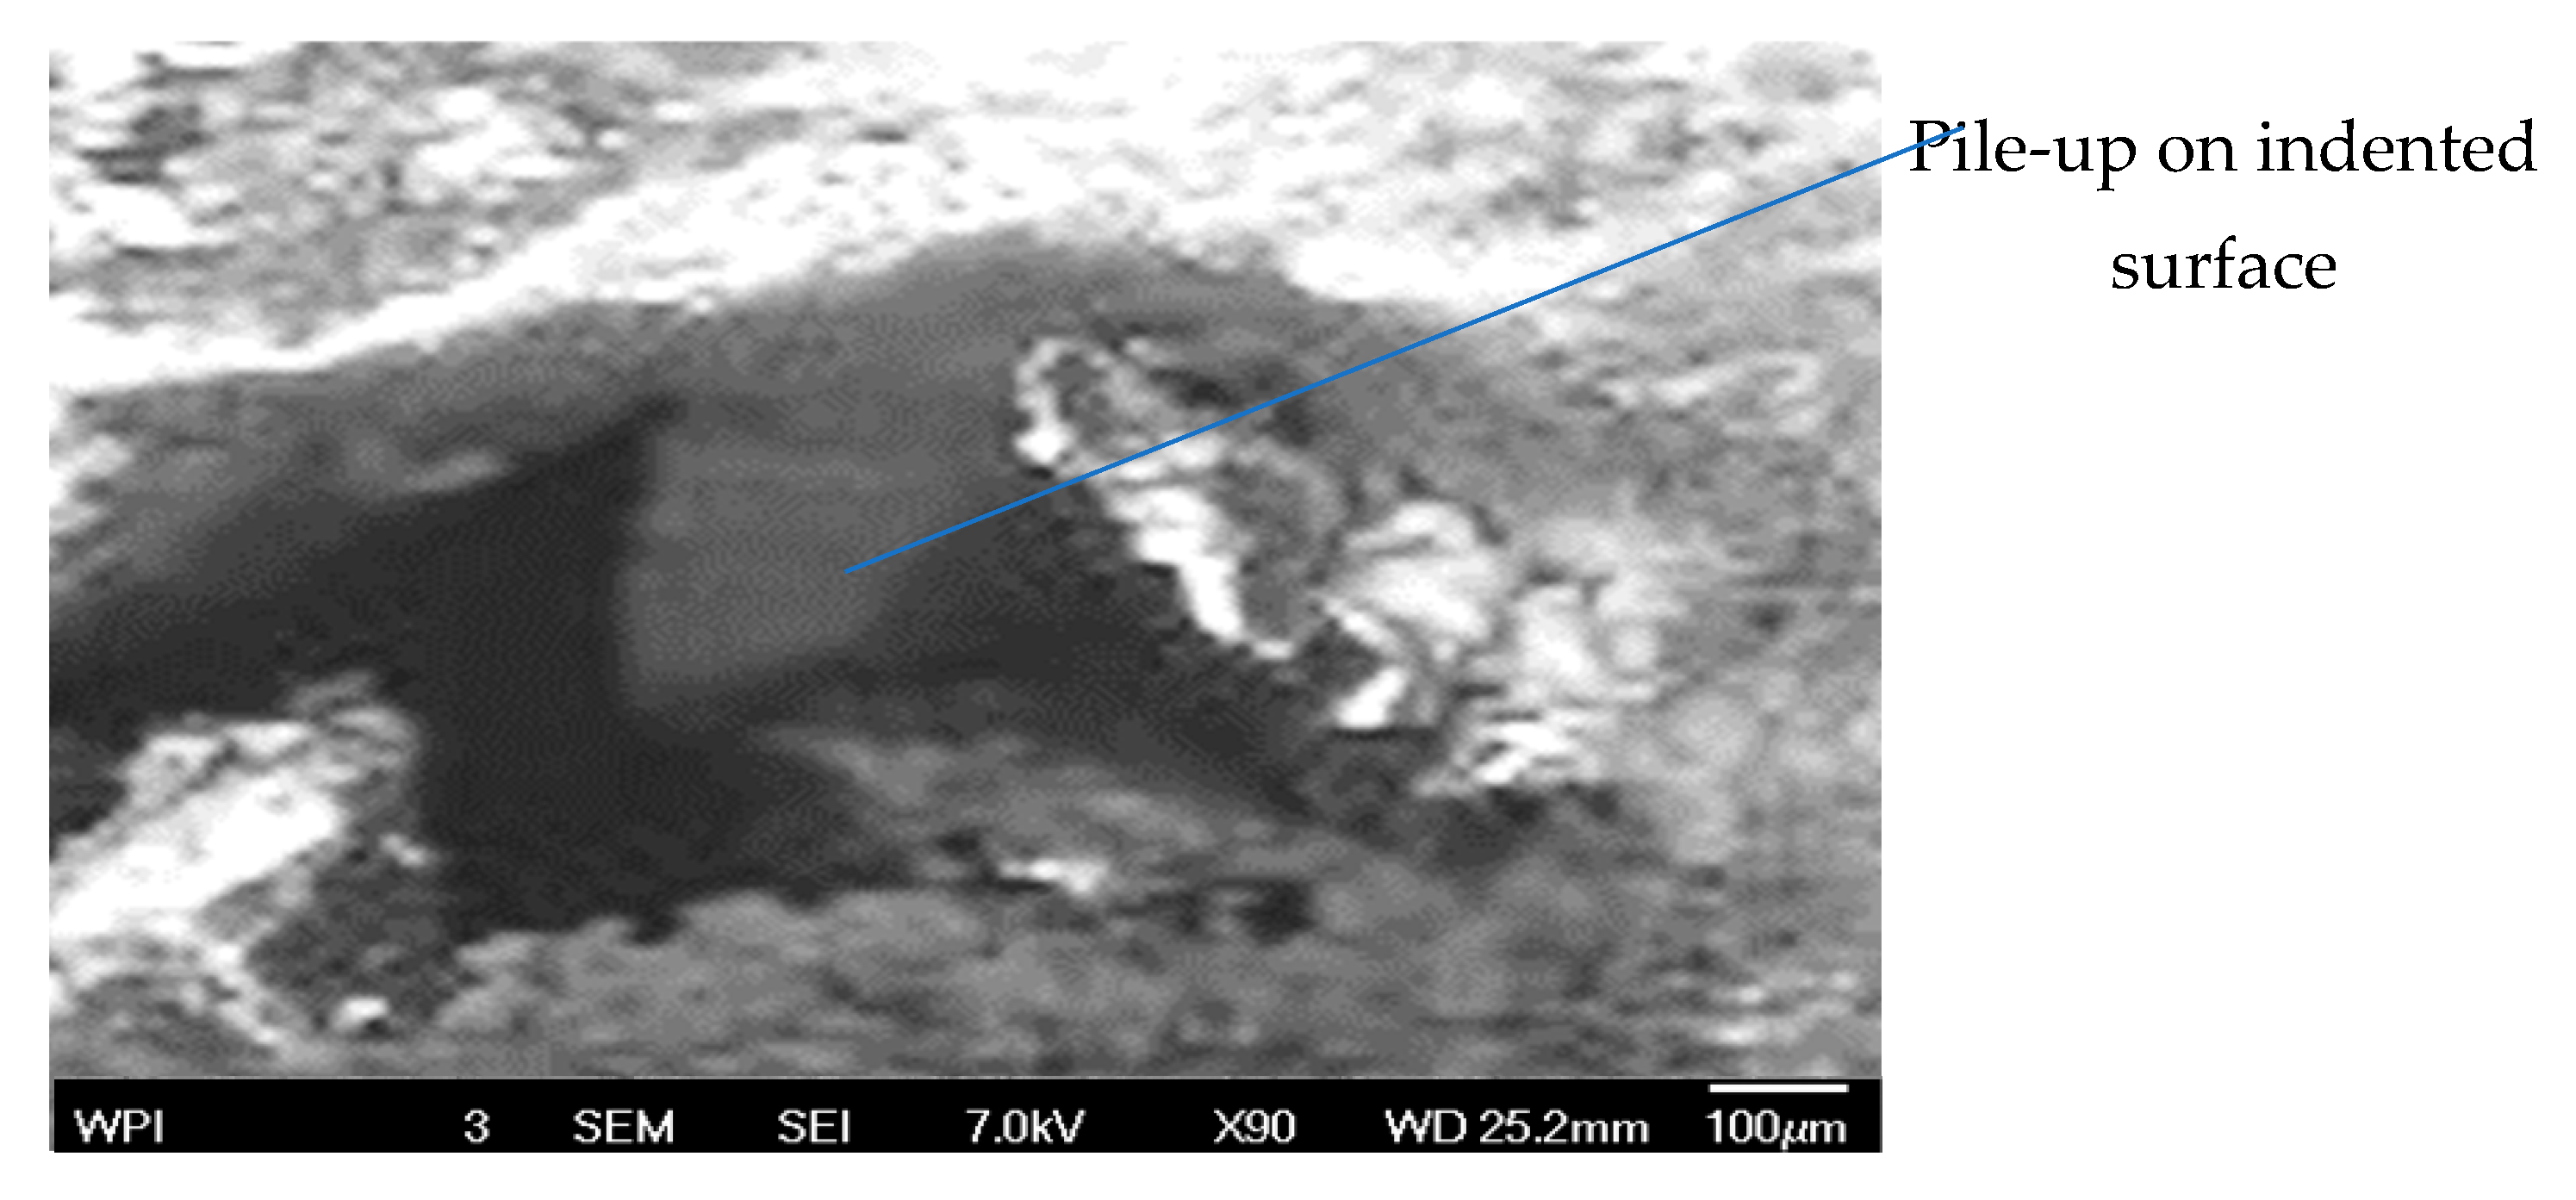
3.7. SEM Image of Indented Barite Rock Surface

Figure 12 presents the SEM micrograph. The figure shows an extensive fractured zone with a dark central zone bordered by numerous lighter, linear features extending radially outward in all directions, indicating what appears to be mineral surface pileup. Previous studies have reported that the lateral dimensions of an indentation are typically about seven times the maximum penetration depth [53] in this work (e.g., for a 155 nm depth, the expected indentation surface penetration depth size should be ~1.1 μm). However, we were able to scan the indented surface at a 100 μm SEM image resolution after the indentation process was completed. This is the capability obtained during the work. Future studies will systematically explore a broader range of indentation depths, applying the established penetration-to-lateral-dimension ratio to improve the visibility and characterization of the indented surfaces via SEM. Furthermore, from the central zone on the indented imaged surface, the central zone appears as an indentation point, indicating the impact point resulting from mechanical load. The contrasted boundary of the zone indicates brittle fracture behaviour common in minerals subjected to real stress. Based on the observed characteristics, the radial cracks resulted from a high concentration of stresses along the indentation point. Moreover, the radial cracks emanating outward from the central zone of damage exhibit the typical radial patterns of cracking in brittle materials subjected to indentation or point-pressure loading. Different residual indention microfracture morphologies can be analysed to reveal the indentations at various positions [55]. The SEM image of the indented surface exhibits a regular diamond shape, which is consistent with the typical Berkovich indenter geometry. Hence, the barite rock samples suffered from mechanical failure in a brittle mode in the nanoindentation experiment.

3.8. Discussion on Elastic and Plastic Deformation of Barite Rocks

The load–displacement curves, hardness, and reduced elastic modulus of the barite rock samples described their behaviour under mechanical loading using the nanoindentation method. The material exhibited elastic deformation at the indentation stages, as shown by the linear portion of the loading curve segment. As the applied load increases, the material experiences plastic and permanent deformation. This plastic deformation involves the creation and movement of dislocations, along with the development of slip bands and twinning in the crystal structure of barite rocks. Similarly, the impact of loading on the sample surfaces is described by atomic force microscopy (AFM) [56]. The AFM study of nanoindented surfaces shows that sudden changes in the penetration curves are linked to the formation of lasting dips on the rock sample surfaces and the sideways movement of specific dislocations, creating steps near the indents.
The SEM imaging of the barite rock samples confirmed pop-ins, which are associated with the micro-cracks and line defects inherent in this material. The indentation created rows of defects aligned along well-defined directions [57]. The successive defects, which are about 0.25 nm high, appear at distances between 40 and 60 nm, as reported by [57]. The impact of these defects is also observed on the load–displacement curves. The first section in the load–displacement curve, which is the loading section, corresponds to the elastic stage of the surface mechanical test. However, the material can regain its properties at this stage if the elastic strength is not exceeded. The extent of plastic deformation observed in the barite rock samples suggests that they possess a certain degree of creep despite being a generally brittle mineral. This behaviour is attributed to the intrinsic nature of barite rock formations and the type of loading applied to them.
Two seconds afterwards (to accommodate the brittle nature of the samples), a low significance change in the curves was observed upon unloading the samples. This change was attributed to minerals or phases with a different hardness value or sliding along the grain boundaries. Similarly, the radial cracks observed in SEM images affirm the contact deformation of the rock samples. These cracks are associated with inherent stresses induced during the mining process, rock blasting, and crack propagation along the cleavage planes and other weak planes within the barite crystal structure [56]. Other defects, such as the dislocation lines, which are considered edge dislocations and lateral cracks or inclusions, are observed. The distinct responses of the rock samples to mechanical loading established the underlying difference in the mechanical properties.
The load–displacement curves describe the relationship between the microstructure–elemental composition and the mechanical/surface properties of the barite rock samples. The distinct load–displacement behaviours of IB3 and IB4 reflect underlying differences in mechanical properties. IB3 exhibited higher hardness and pop-in events, suggesting localized plastic deformation likely caused by microstructural heterogeneities or defects. This aligns with the SEM image of IB3, which revealed a more fragmented and irregular morphology. The EDS spectrum confirmed compositional purity but did not rule out microstructural flaws. Concurrently, although IB4 showed a smooth indentation curve at greater indentation depth, indicating low average hardness, more disrupted heterogeneous phases are evident, as observed in Figure 3b. These relationships are anticipated considering that, within each of the statistical distributions, distinct distributions are identified for each of the phases of barite rocks. Similarly, the heterogeneous nature of the rocks is consistent with the ranges of hardness values observed in Figure 11.
The rock samples (IB3 and IB4) have well-represented phases within the intermediate hardness ranges. While these variations are relatively moderate, they are likely to affect the deformation and cracking of the rocks. While hardness is not an intrinsic material property, the local variations of its values are significant and are traceable to the presence of the oxides of non-barite minerals in the rock [4,44,54]. As discussed, the rock contains four major minerals (XRD spectra in Figure 4), and the results agree with the EDX analysis (Figure 3a,b). Similarly, the statistical deconvolution of the rock samples presents four major phases of varying hardness at different indentation depths (Figure 11a,b). The composition of the barite samples directly contributes to the local variation in hardness.
The high hardness value of IB3 does not translate into a high elastic modulus. In practice, the hardness value is the resistance the barite rock samples pose to localised plastic dislocation, while the elastic modulus or Young’s modulus is the resistance to elastic deformation. The higher hardness of IB3 can be traced to the presence of surface or core material defects and strong atomic bonds between the phases or minerals of the rock samples. However, the high brittleness of the rock can reduce the elastic modulus of the sample, resulting in a lower elastic modulus, as observed in this study. These properties are crucial for structural applications with critical rigidity and dimensional stability. However, a higher modulus combined with lower hardness typically implies that the material is less capable of resisting plastic deformation when subjected to sharp or high-pressure contact.
The hardness ratio to modulus (H/Er2) calculated using Equation (7) provides insight into the material’s resistance to plastic indentation and overall wear performance. Sample IB3 has a significantly higher H/Er ratio (0.0015) than sample IB4 (0.00054), indicating that it resists plastic deformation better and exhibits improved elastic recovery. This makes sample IB3 more suitable for applications involving repeated mechanical contact, cyclic loading, or sliding wear. In contrast, sample IB4, with its higher stiffness but lower H/Er ratio, may be more appropriate where structural integrity is prioritized over surface durability. The results of the measurements, especially for sample IB3, indicate relatively high hardness and a good hardness-to-modulus ratio (0.0015), which reflects good anti-plastic deformation properties. This indicates that the barite rock sample would sustain the integrity of its particles during mixing and circulation, minimizing particle size reduction, generating excessive fines and supporting stable mud characteristics. Nonetheless, the average elastic modulus of the barite (35.89 and 46.75 GPa) for IB3 and IB4 and its inherently brittle character may become drawbacks at high mechanical loading.
The elastic and plastic deformation combination in the barite samples shows that their shape changes in a complex way, influenced by their crystal structure, impurities, and tiny structural features. This study confirmed that the resistance of barite rock samples to elastic and plastic deformation reflects their mechanical properties that are critical for assessment under cyclic mechanical loading, in specialized applications such as in oil and gas exploration, and in designing equipment for breaking down barite rocks. The hardness is particularly relevant to understanding how design considerations for machinery for barite crushing can be developed, considering the mechanical properties for applications in the oil and gas industries and mineral processing.

4. Conclusions

This research utilized a detailed approach that involved nanoindentation testing and additional methods such as scanning electron microscopy (SEM), energy-dispersive X-ray spectroscopy (EDS), and numerical analysis by MATLAB Software. The structural analysis revealed the typical grainy shape of barite crystals and distinct splitting surfaces. EDS analysis confirmed that the primary components were barium, oxygen, and sulphur, with trace amounts of impurities like silicon and calcium, likely originating from quartz and calcite. The nanoindentation results indicated that the barite samples demonstrated elastic and plastic deformation patterns. Based on the findings of this study, the following conclusions are drawn:
  • Barite rock samples exhibited both elastic and plastic changes when tested with nanoindentation, indicating they can behave in an elastic–plastic manner, even though they are typically brittle.
  • The hardness values of the barite samples are within the expected range of 1.7 to 2.0 GPa. The hardness of sample IB3 is slightly higher than that of IB4 but is within the range reported for barite in the literature. However, the materials (rock samples) still contain non-barite minerals that must be removed to improve their potential use in industrial applications such as in drilling fluids for the oil and gas industry, where it is important to resist wear and tear on the oil well walls and drilling rig surfaces.
  • The defects observed on the barite rock surfaces revealed the brittle and porous nature of the barite samples. However, the range of dislocations in the sample can be examined using analytical methods complemented by experimental techniques such as transmission electron microscopy (TEM).
  • The analysis of the structure and composition provided crucial information relevant to the design of processes and devices required for the efficient extraction of barite mineral and other non-barite minerals of interest.
Based on the findings and conclusions of this study, the following are proposed and are currently being investigated as part of future studies:
  • Based on the new understanding reported in this work, crush, grind, and process these barite samples to evaluate their effectiveness for specific applications, such as in drilling fluids, radiation protection, or filler materials. This process may involve simulating application-specific conditions and assessing the material’s behaviour under relevant environmental and operational scenarios.
  • Future research is recommended to examine the impact of the composition and structure of non-barite minerals on their resistance to plastic, elastic, and lateral deformation. This will involve studying the effects of varying impurity levels or grain sizes on the mechanical properties and fracture-toughening mechanisms.
  • New methods should be developed to improve the processing methods and enhance the mechanical properties and flow characteristics of the barite samples.
  • Conduct transmission electron microscopy (TEM) or X-topography to examine mineral dislocations and calculate the material’s dislocation at different length scales. This will provide a complete overview of the plasticity of the rock samples.

Author Contributions

H.A.A.: Conceptualization, methodology, data curation, formal analysis, investigation, writing—original draft, and visualization. D.O.A.: Conceptualization, methodology, data curation, formal analysis, investigation, writing—original draft, writing—review and editing, visualization, resource, project administration, supervision, and funding. O.S.O.O.: Conceptualization, validation, resource, writing—review and editing, supervision. A.B.: Data curation, writing—review and editing, S.I.O.: Writing. P.A.O.: Formal analysis, writing—review and editing, and supervision. All authors have read and agreed to the published version of the manuscript.

Funding

This research was funded by the Regional Scholarship and Innovation Fund (Rsif-PASET) through the Junior Investigative Research Award (Rsif/AUST/JIRA 005 Grant) awarded to Dr. David Oluwasegun Afolayan (Principal Investigator) at the African University of Science and Technology (AUST), Abuja, Federal Capital Territory, Nigeria.

Data Availability Statement

The original contributions presented in this study are included in the article. Further inquiries can be directed to the corresponding authors.

Acknowledgments

Appreciation is extended to the Pennsylvania State University for supporting S.O.O. and D.O.A.

Conflicts of Interest

The authors declare no conflicts of interest.

Abbreviations

The following abbreviations are used in this manuscript:
IB3Ibi barite sample number 3
IB4Ibi barite sample number 4
AFMAtomic force microscopy

References

  1. Olade, M.; Olade, M.A. Solid Mineral Deposits and Mining in Nigeria: A Sector in Transitional Change. Achiev. J. Sci. Res. 2019, 2, 1–16. [Google Scholar] [CrossRef]
  2. Ericsson, M.; Löf, O. Mining’s contribution to national economies between 1996 and 2016. Gorn. Promyshlennost 2019, 2019, 84–93. [Google Scholar] [CrossRef]
  3. Caenn, R.; Darley, H.C.H.; Gray, G.R. Drilling Problems Related to Drilling Fluids. In Composition and Properties of Drilling and Completion Fluids; Elsevier: Amsterdam, The Netherlands, 2017. [Google Scholar] [CrossRef]
  4. Abraham, E.I.; Bayode, B.L.; Olubambi, P.A.; Adetunji, A.R.; Onwualu, A.P. Characterization of barite ores from selected locations in Nigeria for drilling fluid formulation. Sci. Afr. 2021, 14, e01057. [Google Scholar] [CrossRef]
  5. National Minerals Information Center. Mineral commodity summaries 2024. In Mineral Commodity Summaries; USGS: Reston, VA, USA, 2024; Volume 703, pp. 64–65. Available online: https://pubs.usgs.gov/periodicals/mcs2024/mcs2024-molybdenum.pdf (accessed on 3 April 2025).
  6. U.S. Geological Survey. Mineral Commodity Summaries 2023: Barite. 2023. Available online: https://pubs.usgs.gov/periodicals/mcs2023/mcs2023-barite.pdf (accessed on 17 May 2025).
  7. Akinmosin, A.; Bankole, S.I.; Eyogwe, S.O. Reservoir geology and effects on exploitation of natural bitumen deposits (Nigerian deposits as a case study). J. Pet. Explor. Prod. Technol. 2018, 9, 191–205. [Google Scholar] [CrossRef]
  8. Olanrewaju, I.H. Evaluation of Some Characteristics of the Barite Deposits in Ribi, Nassarawa State for Industrial Application. Master’s Thesis, AUST, Galadima, Nigeria, 2019. [Google Scholar]
  9. Auwalu, D. Occurrence and Origin of Baryte Mineralization in the Benue Trough, Nigeria: A Review. Bima J. Sci. Technol. 2022, 4, 389–402. [Google Scholar]
  10. Eze, C.K. Feasibility Analysis of Commercial Barite Production in Nassarawa State Nigeria. Ph.D. Thesis, AUST, Galadima, Nigeria, 2019. [Google Scholar]
  11. Otoijamun, I.; Kigozi, M.; Adetunji, A.R.; Onwualu, P.A. Characterization and suitability of nigerian barites for different industrial applications. Minerals 2021, 11, 360. [Google Scholar] [CrossRef]
  12. Afolayan David, O. Assessment of Beneficiation Process of a Nigerian Barite. Master’s Thesis, African University of Science and Technology, Galadima, Nigeria, 2017. [Google Scholar]
  13. Xie, L.; Peng, J.W.X.; Lu, Q.; Peng, Q.; Hu, W.; Wang, T.; Yang, D.; Sun, W.; Liu, Q.; Qiao, C.; et al. Surface interaction mechanisms in mineral flotation: Fundamentals, measurements, and perspectives. Adv. Colloid Interface Sci. 2021, 295, 102491. [Google Scholar]
  14. Molaei, N.; Razavi, H.; Chelgani, S.C. Experimental modeling for upgrading of brown barite ore by different processing methods. Model. Earth Syst. Environ. 2018, 4, 89–96. [Google Scholar] [CrossRef]
  15. Ighoro, A.; Afolabi, Y.; Ogolo, O.; Rasak, A.; Peter, A. Heliyon Barite as an industrial mineral in Nigeria: Occurrence, utilization, challenges and future prospects. Heliyon 2021, 7, e07365. [Google Scholar] [CrossRef]
  16. Surendra, G. Froth flotation of barite. In Froth Flotation: A Century of Innovation; Society for Mining, Metallurgy & Exploration: Littleton, CO, USA, 2020; pp. 917–936. [Google Scholar]
  17. Nayak, A.; Jena, M.S.; Mandre, N.R. Application of Enhanced Gravity Separators for Fine Particle Processing: An Overview. J. Sustain. Metall. 2021, 7, 315–339. [Google Scholar] [CrossRef]
  18. Benin, S.R.; Selvakumar, G.; Sumathi, M.; Bright, R.J. Influence of barite particulate filler on the mechanical behaviour of carbon fiber reinforced LY556 epoxy matrix composites. Proc. Inst. Mech. Eng. Part C J. Mech. Eng. Sci. 2022, 236, 412–423. [Google Scholar] [CrossRef]
  19. Ulusoy, U. A Review of Particle Shape Effects on Material Properties for Various Engineering Applications: From Macro to Nanoscale. Minerals 2023, 13, 91. [Google Scholar] [CrossRef]
  20. Pourghahramani, P. Effects of Grinding Variables on Structural Changes and Energy Conversion During Mechanical Activation Using Line Profile Analysis (LPA). Ph.D. Thesis, Lulea University of Technology, Lulea, Sweden, 2006; p. 163. [Google Scholar]
  21. Liang, C. Understanding Plastic Deformation: Principles, Mechanisms and Applications. Adv. Mater. Sci. Res. 2024, 152324, 229–230. [Google Scholar] [CrossRef]
  22. Massam, J.; Browne, N.; Kapilla, M. The Use of Sized Barite as a Weighting Agent for Drilling Fluids. PCT/US2005/019626 International, 22 May 2007. [Google Scholar]
  23. Workman, L.; Eloranta, J. The effects of blasting on crushing and grinding efficiency and energy consumption. In Proceedings of the Annual Conference on Explosives and Blasting Technique, I, Orlando, FL, USA, 22–23 January 1992; International Society of Explosives Engineers: Warrensville Heights, OH, USA, 2003; pp. 131–140. [Google Scholar]
  24. Gupta, A.; Yan, D.S.; Gupta, A.; Yan, D. Introduction to Mineral Processing Design and Operation PREFACE; Elsevier: Amsterdam, The Netherlands, 2006; pp. 1–704. [Google Scholar]
  25. Napier-munn, T. Is progress in energy-efficient comminution doomed? Miner. Eng. 2014, 73, 1–6. [Google Scholar] [CrossRef]
  26. Oyen, M.L. Nanoindentation of biological and biomimetic materials. Exp. Tech. 2013, 37, 73–87. [Google Scholar] [CrossRef]
  27. Mahmoud, Z.H.; AL-Salman, H.N.K.; Kianfar, E. Nanoindentation: Introduction and applications of a non-destructive analysis. Nano TransMed. 2024, 3, 100057. [Google Scholar] [CrossRef]
  28. Zheng, M.; Gu, Z.; Dong, H.; Ma, T.; Wu, Y. Nanoindentation-Based Characterization of Mesoscale Mechanical Behavior in Dolomite Crystals. Processes 2025, 13, 1203. [Google Scholar] [CrossRef]
  29. Schreiber, D.K.; Schwaiger, R.; Heilmaier, M.; McCormack, S.J. Materials properties characterization in the most extreme environments. MRS Bull. 2022, 47, 1128–1142. [Google Scholar] [CrossRef]
  30. Zhang, G.; Wei, Z.; Ferrell, R.E. Elastic modulus and hardness of muscovite and rectorite determined by nanoindentation. Appl. Clay Sci. 2009, 43, 271–281. [Google Scholar]
  31. Huang, C.; Zhu, C.; Ma, Y. Investigating Mechanical Characteristics of Rocks Under Freeze–Thaw Cycles Using Grain-Based Model. Rock Mech. Rock Eng. 2025, 58, 603–622. [Google Scholar] [CrossRef]
  32. Dong, L.; Zhang, Y.; Wang, L.; Wang, L.; Zhang, S. Temperature dependence of mechanical properties and damage evolution of hot dry rocks under rapid cooling. J. Rock Mech. Geotech. Eng. 2024, 16, 645–660. [Google Scholar] [CrossRef]
  33. Lim, Y.Y.; Munawar Chaudhri, M. Indentation of elastic solids with a rigid Vickers pyramidal indenter. Mech. Mater. 2006, 38, 1213–1228. [Google Scholar] [CrossRef]
  34. Fischer-Cripps, A.C. Factors Affecting Nanoindentation Test Data. In Nanoindentation; Springer: Berlin/Heidelberg, Germany, 2004. [Google Scholar] [CrossRef]
  35. Singh, B.; Saxena, K.K.; Dagwa, I.M.; Singhal, P.; Malik, V. Optimization of Machining Characteristics of Titanium-Based Biomaterials: Approach to Optimize Surface Integrity for Implants Applications. Surf. Rev. Lett. 2023, 32, 2340008. [Google Scholar]
  36. Ezenwafor, T.; Anye, V.; Madukwe, J.; Amin, S.; Obayemi, J.; Odusanya, O.; Soboyejo, W. Nanoindentation study of the viscoelastic properties of human triple negative breast cancer tissues: Implications for mechanical biomarkers. Acta Biomater. 2023, 158, 374–392. [Google Scholar]
  37. Zhao, F.; Shi, Z.; Yu, S.; Zheng, H. A review of fracture mechanic behaviors of rocks containing various defects. Undergr. Space 2023, 12, 102–115. [Google Scholar]
  38. Oliver, W.C.; Pharr, G.M. Improved technique for determining hardness and elastic modulus using load and displacement sensing indentation experiments. J. Mater. Res. 1992, 7, 1564–1583. [Google Scholar]
  39. Tsvirkun, D.; Revilloud, J.; Giannetti, A.; Verdier, C. The intriguing role of collagen on the rheology of cancer cell spheroids. J. Biomech. 2022, 141, 111229. [Google Scholar]
  40. Menčík, J.; He, L.H.; Němeček, J. Characterization of viscoelastic-plastic properties of solid polymers by instrumented indentation. Polym. Test. 2011, 30, 101–109. [Google Scholar] [CrossRef]
  41. Rao, X.; Zhang, F.; Luo, X.; Ding, F. Characterization of hardness, elastic modulus and fracture toughness of RB-SiC ceramics at elevated temperature by Vickers test. Mater. Sci. Eng. A 2019, 744, 426–435. [Google Scholar] [CrossRef]
  42. Li, X.; Wang, M.; Xu, L.; Xu, T.; Wu, W.; Pan, S.; Wang, C.; Zhang, W.; Cai, X. Progress in indentation test for material characterization: A systematic review. Results Surf. Interfaces 2024, 17, 100358. [Google Scholar] [CrossRef]
  43. Constantinides, G.; Chandran, K.S.R.; Ulm, F.J.; Van Vliet, K.J. Grid indentation analysis of composite microstructure and mechanics: Principles and validation. Mater. Sci. Eng. A 2006, 430, 189–202. [Google Scholar]
  44. ISO/FDIS 14577-1; Metallic Materials—Instrumented Indentation Test for Hardness and Material Parameter, Part 1: Test Method. ISO—International Organization for Standardization: Geneve, Switzerland, 2002.
  45. Oyen, M.L.; Cook, R.F. A practical guide for analysis of nanoindentation data. J. Mech. Behav. Biomed Mater. 2009, 2, 396–407. [Google Scholar]
  46. Hay, J.C.; Pharr, G.M. Critical issues in measuring the mechanical properties of hard films on soft substrates by nanoindentation techniques. MRS Proc. 1997, 505, 65–70. [Google Scholar] [CrossRef]
  47. Ali, A.; Zhang, N.; Santos, R.M. Mineral Characterization Using Scanning Electron Microscopy (SEM): A Review of the Fundamentals, Advancements, and Research Directions. Appl. Sci. 2023, 13, 12600. [Google Scholar] [CrossRef]
  48. Jamal, M.; Morgan, M.N. Materials characterization part I: Contact area of the Berkovich indenter for nanoindentation tests. Int. J. Adv. Manuf. Technol. 2017, 92, 361–370. [Google Scholar] [CrossRef]
  49. Joslin, D.L.; Oliver, W.C. A New Method for Analyzing Data from Continuous Depth Sensing Microindentation Tests. J. Mater. Res. 1990, 5, 123–126. [Google Scholar]
  50. Tsui, T.Y.; Pharr, G.M.; Oliver, W.C.; Bhatia, C.S.; White, R.L.; Anders, A.; Brown, I.G. Nanoindentation and Nanoscratching of Hard Carbon Coatings for Magnetic Disks. MRS Proc. 1994, 356, 767. [Google Scholar]
  51. Finkin, E.F. Examination of abrasion Resistance Criteria for Some Ductile Metals. J. Lubr. Technol. 1974, 96, 210–214. [Google Scholar]
  52. Kuksenko, V.; Roberts, S. The hardness and modulus of polycrystalline beryllium from nano-indentation. Int. J. Plast. 2019, 116, 62–80. [Google Scholar] [CrossRef]
  53. Li, M.; Liang, Y.; Deng, B.; Chen, B. Evolution of mesomechanical properties of granite minerals after high-temperature exposure. Phys. Fluids 2025, 37, 057111. [Google Scholar] [CrossRef]
  54. Afolayan, D.O.; Adetunji, A.R.; Peter, A.; Oghenerume, O.; Amankwah, R.K. Characterization of barite reserves in Nigeria for use as weighting agent in drilling fluid. J. Pet. Explor. Prod. 2021, 11, 2157–2178. [Google Scholar] [CrossRef]
  55. Pintaude, G. Introduction of the Ratio of the Hardness to the Reduced Elastic Modulus for Abrasion. In Tribology—Fundamentals and Advancements; InTech: Rijeka, Croatia, 2013. [Google Scholar] [CrossRef]
  56. Phakey, P.P.; Aly, A.M. Direct observation of dislocations in natural barite (BaSO4). Philos. Mag. 1970, 22, 1217–1225. [Google Scholar] [CrossRef]
  57. Asenjo, A.; Rojo, J.M. Dislocation generation and motion at the incipient stages of surface plasticity in barite. Philos. Mag. 2007, 87, 3959–3966. [Google Scholar] [CrossRef]
Figure 1. Steps in the research process.
Minerals 15 00779 g001
Figure 2. Raw barite ores: (a) IB3 and (b) IB4.
Minerals 15 00779 g002
Figure 3. SEM micrograph and EDX of barite samples (a) IB3 and (b) IB4. These are the images of the barite surfaces obtained from the scanning electron microscopy and energy-dispersive X-ray spectroscopy analyses.
Minerals 15 00779 g003
Figure 4. XRD spectra for sample IB3.
Minerals 15 00779 g004
Figure 5. XRD spectra for samples IB4.
Minerals 15 00779 g005
Figure 6. Load–displacement curves for IB3 and IB4 from nanoindentation experiment.
Minerals 15 00779 g006
Figure 7. Surface roughness results (a) before and (b) after indentation for IB3.
Minerals 15 00779 g007
Figure 8. Surface roughness results (a) before and (b) after indentation for IB4.
Minerals 15 00779 g008
Figure 9. (a) Two-dimensional mapping of IB3 hardness. (b) Three-dimensional reduced elastic modulus of IB3.
Minerals 15 00779 g009
Figure 10. (a) Two-dimensional heat map of IB4 hardness. (b) Three-dimensional reduced elastic modulus of IB4.
Minerals 15 00779 g010
Figure 11. (a) Statistical ranges of hardness and statistical deconvolution of barite rock samples (IB3). The figure shows the variation in hardness for each phase or constituent of the rock samples. (b) Statistical ranges of hardness and statistical deconvolution of barite rock samples (IB4). The figure shows the variation in hardness for each phase or constituent of the rock samples.
Minerals 15 00779 g011aMinerals 15 00779 g011b
Figure 12. SEM image of indented surface crack indicating brittle failure in the rock sample.
Minerals 15 00779 g012
Disclaimer/Publisher’s Note: The statements, opinions and data contained in all publications are solely those of the individual author(s) and contributor(s) and not of MDPI and/or the editor(s). MDPI and/or the editor(s) disclaim responsibility for any injury to people or property resulting from any ideas, methods, instructions or products referred to in the content.

