Article

Genetic Mineralogical Characteristics of Pyrite and Quartz from the Qiubudong Silver Deposit, Central North China Craton: Implications for Ore Genesis and Exploration

1
Chinese Academy of Geological Sciences, Beijing 100037, China
2
Development and Research Center, China Geological Survey, Beijing 100037, China
3
Mudanjiang Natural Resources Survey Center, China Geological Survey, Changchun 130102, China
4
China Metallurgical Geology Bureau, Beijing 100025, China
5
Xinjiang Geological Survey Institute, China Chemical Geology and Mine Bureau, Urumqi 830000, China
6
School of Earth Sciences and Resources, China University of Geosciences, Beijing 100083, China
*
Authors to whom correspondence should be addressed.
Minerals 2025, 15(8), 769; https://doi.org/10.3390/min15080769
Submission received: 21 May 2025 / Revised: 30 June 2025 / Accepted: 14 July 2025 / Published: 22 July 2025
(This article belongs to the Special Issue Using Mineral Chemistry to Characterize Ore-Forming Processes)

Abstract

The Qiubudong silver deposit on the western margin of the Fuping ore cluster in the central North China Craton is a representative breccia-type deposit characterized by relatively high-grade ores, thick mineralized zones, and extensive alteration, indicating considerable potential for economic resource development and further exploration. Previous studies on this deposit have not addressed its genetic mineralogical characteristics. This study focuses on pyrite and quartz to investigate their typomorphic features, such as crystal morphology, trace element composition, thermoelectric properties, and luminescence characteristics, and their implications for ore-forming processes. Pyrite crystals are predominantly cubic in early stages, while pentagonal dodecahedral and cubic–dodecahedral combinations peak during the main mineralization stage. The pyrite is sulfur-deficient and iron-rich, enriched in Au, and relatively high in Ag, Cu, Pb, and Bi contents during the main ore-forming stage. Rare earth element (REE) concentrations are low, with weak LREE-HREE fractionation and a strong negative Eu anomaly. The thermoelectric coefficient of pyrite ranges from −328.9 to +335.6 μV/°C, with a mean of +197.63 μV/°C; P-type conduction dominates, with an occurrence rate of 58%–100% and an average of 88.78%. A weak–low temperature and a strong–high temperature peak characterize quartz thermoluminescence during the main mineralization stage. Fluid inclusions in quartz include liquid-rich, vapor-rich, and two-phase types, with salinities ranging from 10.11% to 12.62% NaCl equiv. (average 11.16%) and densities from 0.91 to 0.95 g/cm3 (average 0.90 g/cm3). The ore-forming fluids are interpreted as F-rich, low-salinity, low-density hydrothermal fluids of volcanic origin at medium–low temperatures. The abundance of pentagonal dodecahedral pyrite, low Co/Ni ratios, high Cu contents, and complex quartz thermoluminescence signatures are key mineralogical indicators for deep prospecting. Combined with thermoelectric data and morphological analysis, the depth interval around 800 m between drill holes ZK3204 and ZK3201 has high mineralization potential. This study fills a research gap on the genetic mineralogy of the Qiubudong deposit and provides a scientific basis for deep exploration.

1. Introduction

Genetic mineralogy is a discipline that investigates the origins of minerals and their applications. As a branch of mineralogy, it focuses on the study of minerals as products of their natural environments. Minerals preserve critical information about their formation processes and exploration potential, and unraveling this information constitutes the central objective of genetic mineralogy. Genetic mineralogy was initiated by Soviet geologists in the 20th century, and was introduced to China in the 1950s by Guangyuan Chen [1,2]. Since then, significant progress has been made, especially in the genetic study of minerals such as amphibole, biotite, quartz, and pyrite.
The establishment of the mineral typomorphism theory represents one of the most significant achievements in 20th-century mineralogical development. Mineral typomorphism refers to mineralogical phenomena that reflect specific formation conditions, encompassing three aspects: typomorphic mineral assemblages, typomorphic mineral species, and typomorphic mineral characteristics [2]. This study primarily focuses on typomorphic mineral characteristics, which denote the distinguishable variations in properties exhibited by the same mineral species formed under different geological periods, geological processes, and geological bodies. These variations serve as diagnostic indicators for determining their formation conditions. Typomorphic characteristics include morphological typomorphism, compositional typomorphism, structural typomorphism, physical property typomorphism, and spectroscopic typomorphism. These characteristics collectively provide critical genetic information for reconstructing mineral-forming environments and guiding exploration strategies [3,4,5,6].
In recent years, the development of in situ microanalytical techniques (e.g., EPMA, LA-ICP-MS, SIMS) has further propelled genetic mineralogy into a new phase, allowing detailed analysis of trace elements and revealing the physicochemical evolution of ore-forming fluids [7]. Among ore minerals, pyrite is abundant in hydrothermal systems and highly sensitive to variations in ore fluid conditions. Its typomorphic features, such as crystal morphology, trace element signatures, Co/Ni ratios, thermoelectric properties, and rare earth element (REE) patterns, can provide critical insights into ore-forming processes and metal enrichment mechanisms [8]. Notably, arsenic enrichment in pyrite is often linked to its gold-bearing potential [9,10,11,12,13]. Quartz, the dominant gangue mineral in most hydrothermal deposits, can also record thermal and fluid evolution through its thermoluminescence response and fluid inclusion characteristics [14,15,16].
The Fuping ore cluster, located in the central segment of the Taihang Mountains, is one of the most significant metallogenic belts in the central North China Craton (Figure 1). It hosts dozens of gold, silver, molybdenum, and lead–zinc deposits and occurrences. The Qiubudong silver deposit, situated on the western margin of the cluster, is a breccia-type deposit with an estimated silver resource of approximately 800 tonnes, indicating medium to large-scale potential [17]. Previous investigations at Qiubudong have addressed multiple aspects of its geological framework: the characteristics of ore-bearing breccias [18], the division of mineralization stages [19], fluid inclusion and isotopic geochemistry [19,20], geochronology [20], and the geophysical signatures of ore-hosting rocks [21]. However, despite these efforts, no systematic study has been conducted on the genetic mineralogical characteristics of pyrite and quartz, the two most critical minerals associated with mineralization at the deposit.
The lack of genetic mineralogical data from the Qiubudong deposit has limited the understanding of its ore-forming mechanisms and the ability to establish mineralogical indicators for deep prospecting. In this study, we investigate the genetic mineralogical characteristics of pyrite and quartz based on their crystal morphology, trace and rare earth element compositions, thermoelectric properties, thermoluminescence behavior, and fluid inclusion features. The integrated mineralogical and geochemical data aim to elucidate the evolution of ore-forming fluids and redox conditions and identify reliable typomorphic indicators that can guide deep exploration. By filling this knowledge gap, the study contributes to a better genetic understanding of breccia-type Ag deposits in the Taihang region and provides a framework for applying mineralogical indicators in similar metallogenic settings.

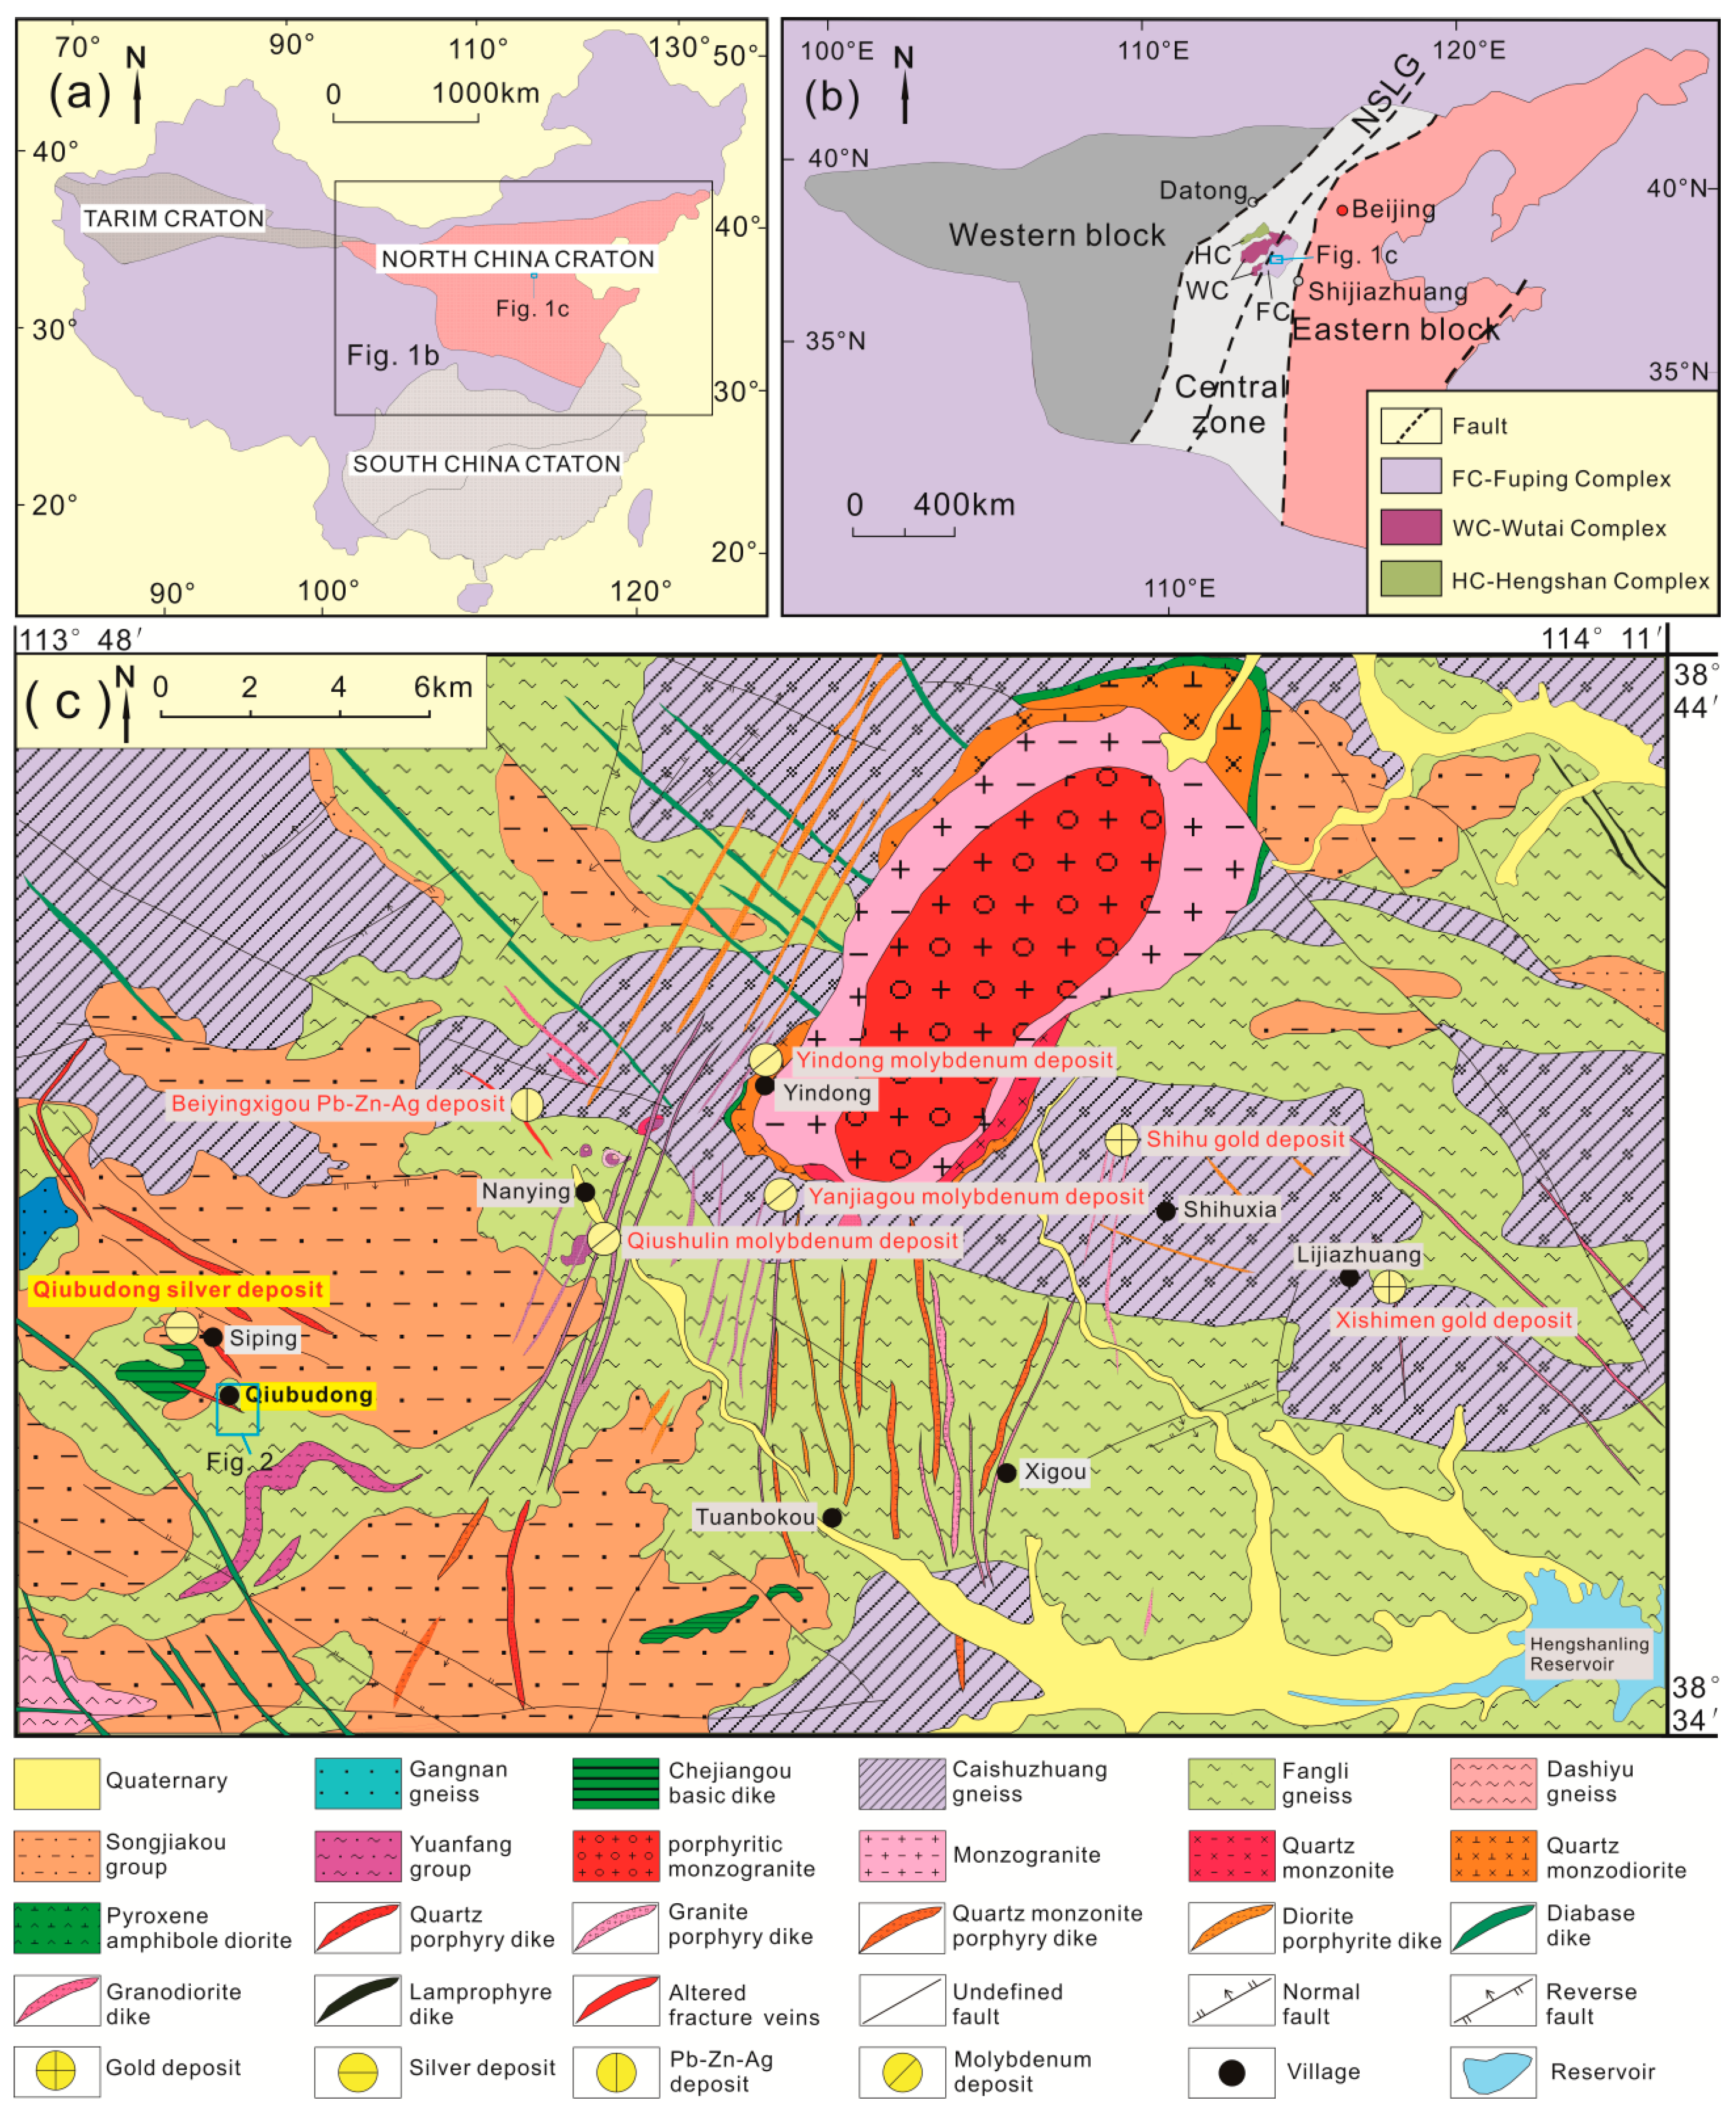
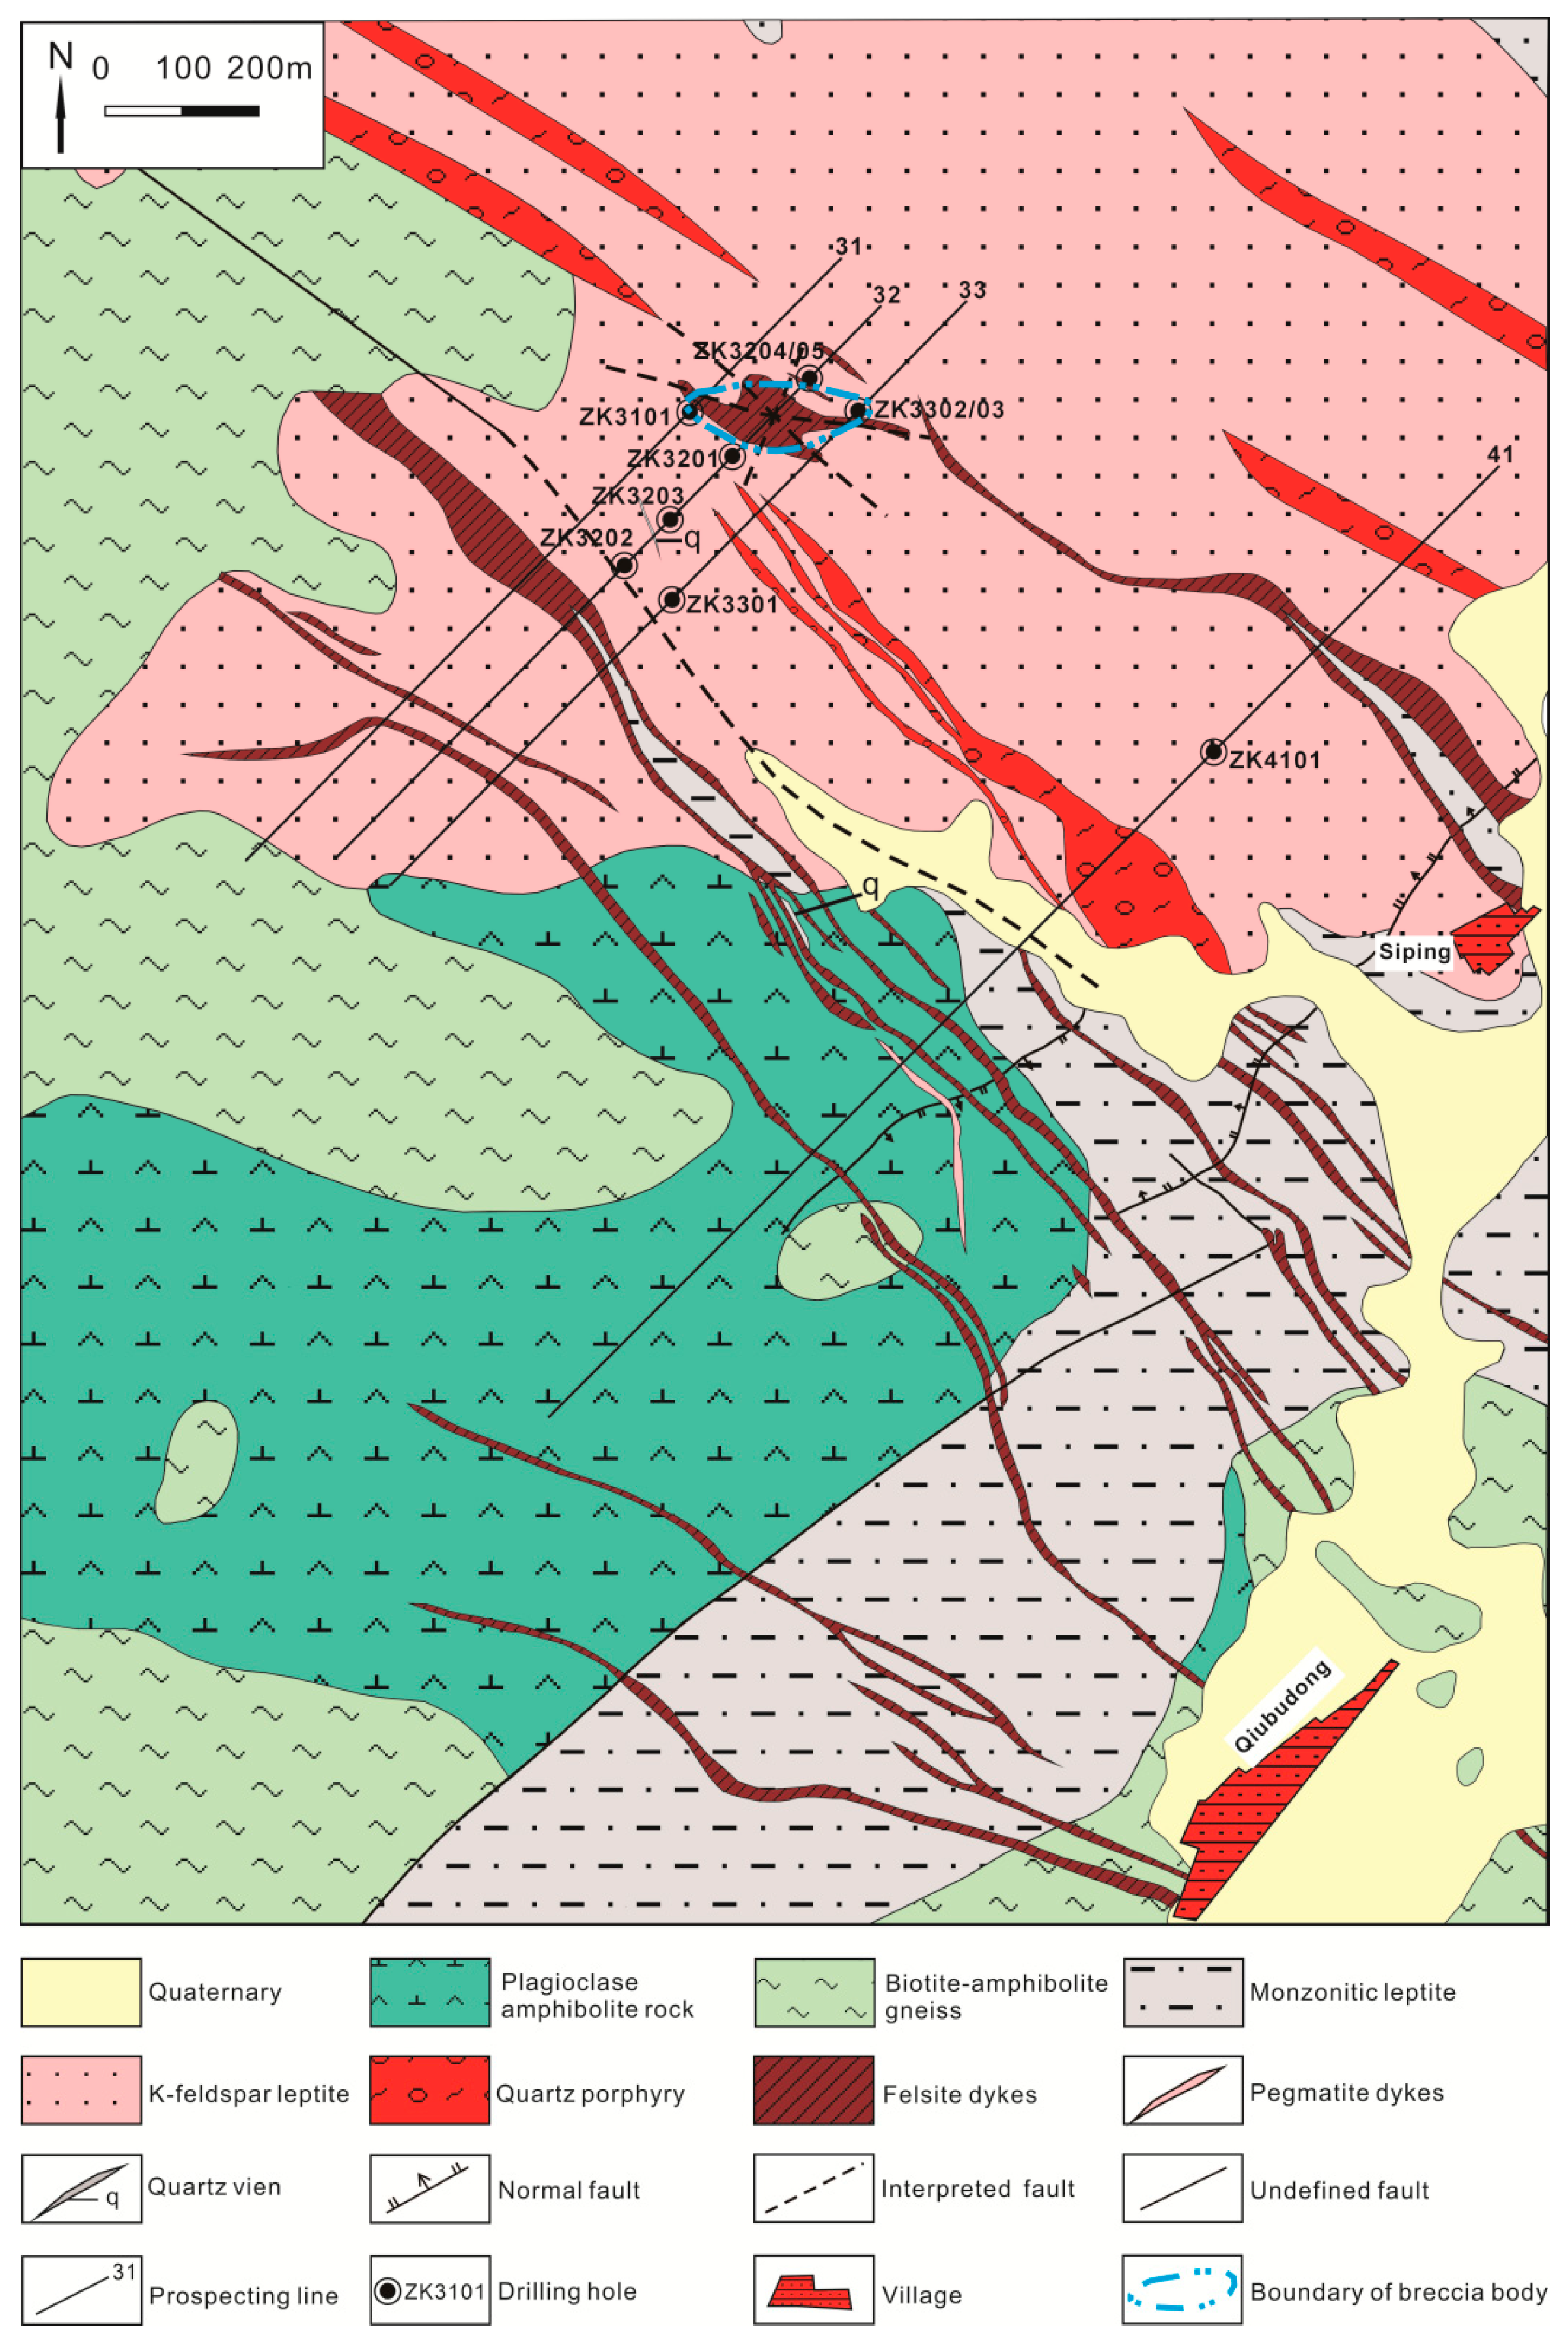
2. Geological Setting

The Qiubudong silver deposit is located in the central segment of the Taihang Mountains. The exposed strata primarily belong to the Archean Songjiakou Group of the Fuping Complex, comprising potassium feldspar granitic gneiss, plagioclase amphibolite, and syenogranitic rocks (Figure 2). Quaternary unconsolidated sediments are limited in distribution, mainly along valleys and streambeds. Intrusive rocks are categorized into two main groups: early-stage metamorphosed plutonic rocks, mainly amphibole-biotite plagioclase gneiss, and late-stage Yanshanian intermediate-acidic dikes, including quartz porphyry, aplite, quartz vein rocks, and pegmatite. These dikes intrude the basement gneisses and overlying units [17,18].
Structurally, the deposit lies on the northern limb of the Junchagou–Shangpansong dome and forms part of the Xifujian–Chenbugou composite anticline. Two major fault systems intersect near the deposit: NW-trending faults, which dominate in orientation and control the spatial distribution of ore bodies, and NE-trending faults, which locally offset or terminate the NW-striking structures. The interaction between these fault sets creates a structural dilation environment that facilitated the migration and emplacement of hydrothermal fluids, thereby enhancing ore deposition at their intersections. These faults were later filled by post-mineral quartz porphyry and pegmatite dikes [17]. The structural framework is consistent with the NE–SW compressional regime of the Taihang orogenic belt, a major metallogenic zone in the central North China Craton that hosts numerous polymetallic deposits [22,23].
Two types of orebodies are recognized: breccia-type (dominant) (Figure 3) and altered-rock type (Figure 4). The breccia-type ores display semi-euhedral granular and brecciated textures with angular clasts and a matrix cemented by fine-grained hydrothermal minerals. Ore minerals such as pyrite, native silver, electrum, argentite, and stromeyerite are mainly distributed within the matrix and along open spaces between clasts, indicating mineralization postdates brecciation. Additionally, localized mineral grains are observed within the clasts themselves, suggesting multiphase fluid activity. In contrast, the altered-rock type ores show porphyritic and cryptocrystalline groundmass textures, characterized by fine vein-disseminated and cataclastic structures. Ore minerals in this type are dispersed along microfractures and replacement zones. Associated sulfides include sphalerite, chalcopyrite, galena, and limonite. Gangue minerals are dominated by quartz and feldspar, with subordinate kaolinite, sericite, chlorite, and calcite [17]. These mineralogical and textural relationships collectively imply a complex metallogenic history involving repeated brecciation, fluid percolation, and metal precipitation.
The mineralization process is divided into four stages (Figure 5): (1) sericitic alteration stage (Ser–W), (2) quartz–pyrite stage (Q–Py), (3) polymetallic sulfide stage (Sul), and (4) quartz–carbonate stage (Cc). Stages (2) and (3) are the principal ore-forming episodes. These hydrothermal stages are characterized by variable fluid temperatures and redox states, resulting in successive sulfide and carbonate mineral precipitation.
A paragenetic sequence based on petrographic observations reveals the relative timing and association of gangue and ore minerals:
In Stage 1 (Ser–W), sericitization and weak pyritization occur, typically with disseminated fine-grained pyrite and sericite in altered wall rocks.
Stage 2 (Q–Py) is marked by the deposition of early euhedral quartz and massive to euhedral pyrite, often with pentagonal dodecahedral morphology.
In Stage 3 (Sul), intensive mineralization occurs with abundant galena, sphalerite, chalcopyrite, and late-stage coarse pyrite, intergrown with quartz.
Stage 4 (Cc) is characterized by crosscutting quartz–calcite veinlets with minor sulfide remnants and local supergene alteration.
The wall rocks in the Qiubudong deposit primarily consist of Mesoproterozoic metamorphic rocks, including gneisses and schists, which have undergone extensive hydrothermal alteration. The alteration assemblages comprise K-feldspar alteration, silicification, epidotization, sericitization, phyllic alteration, chloritization, pyritization, and kaolinization. These alteration zones occur as halos surrounding ore bodies and vary in intensity and width depending on the stage of mineralization. Their spatial distribution provides valuable indicators for ore targeting and delineating mineralized structures.

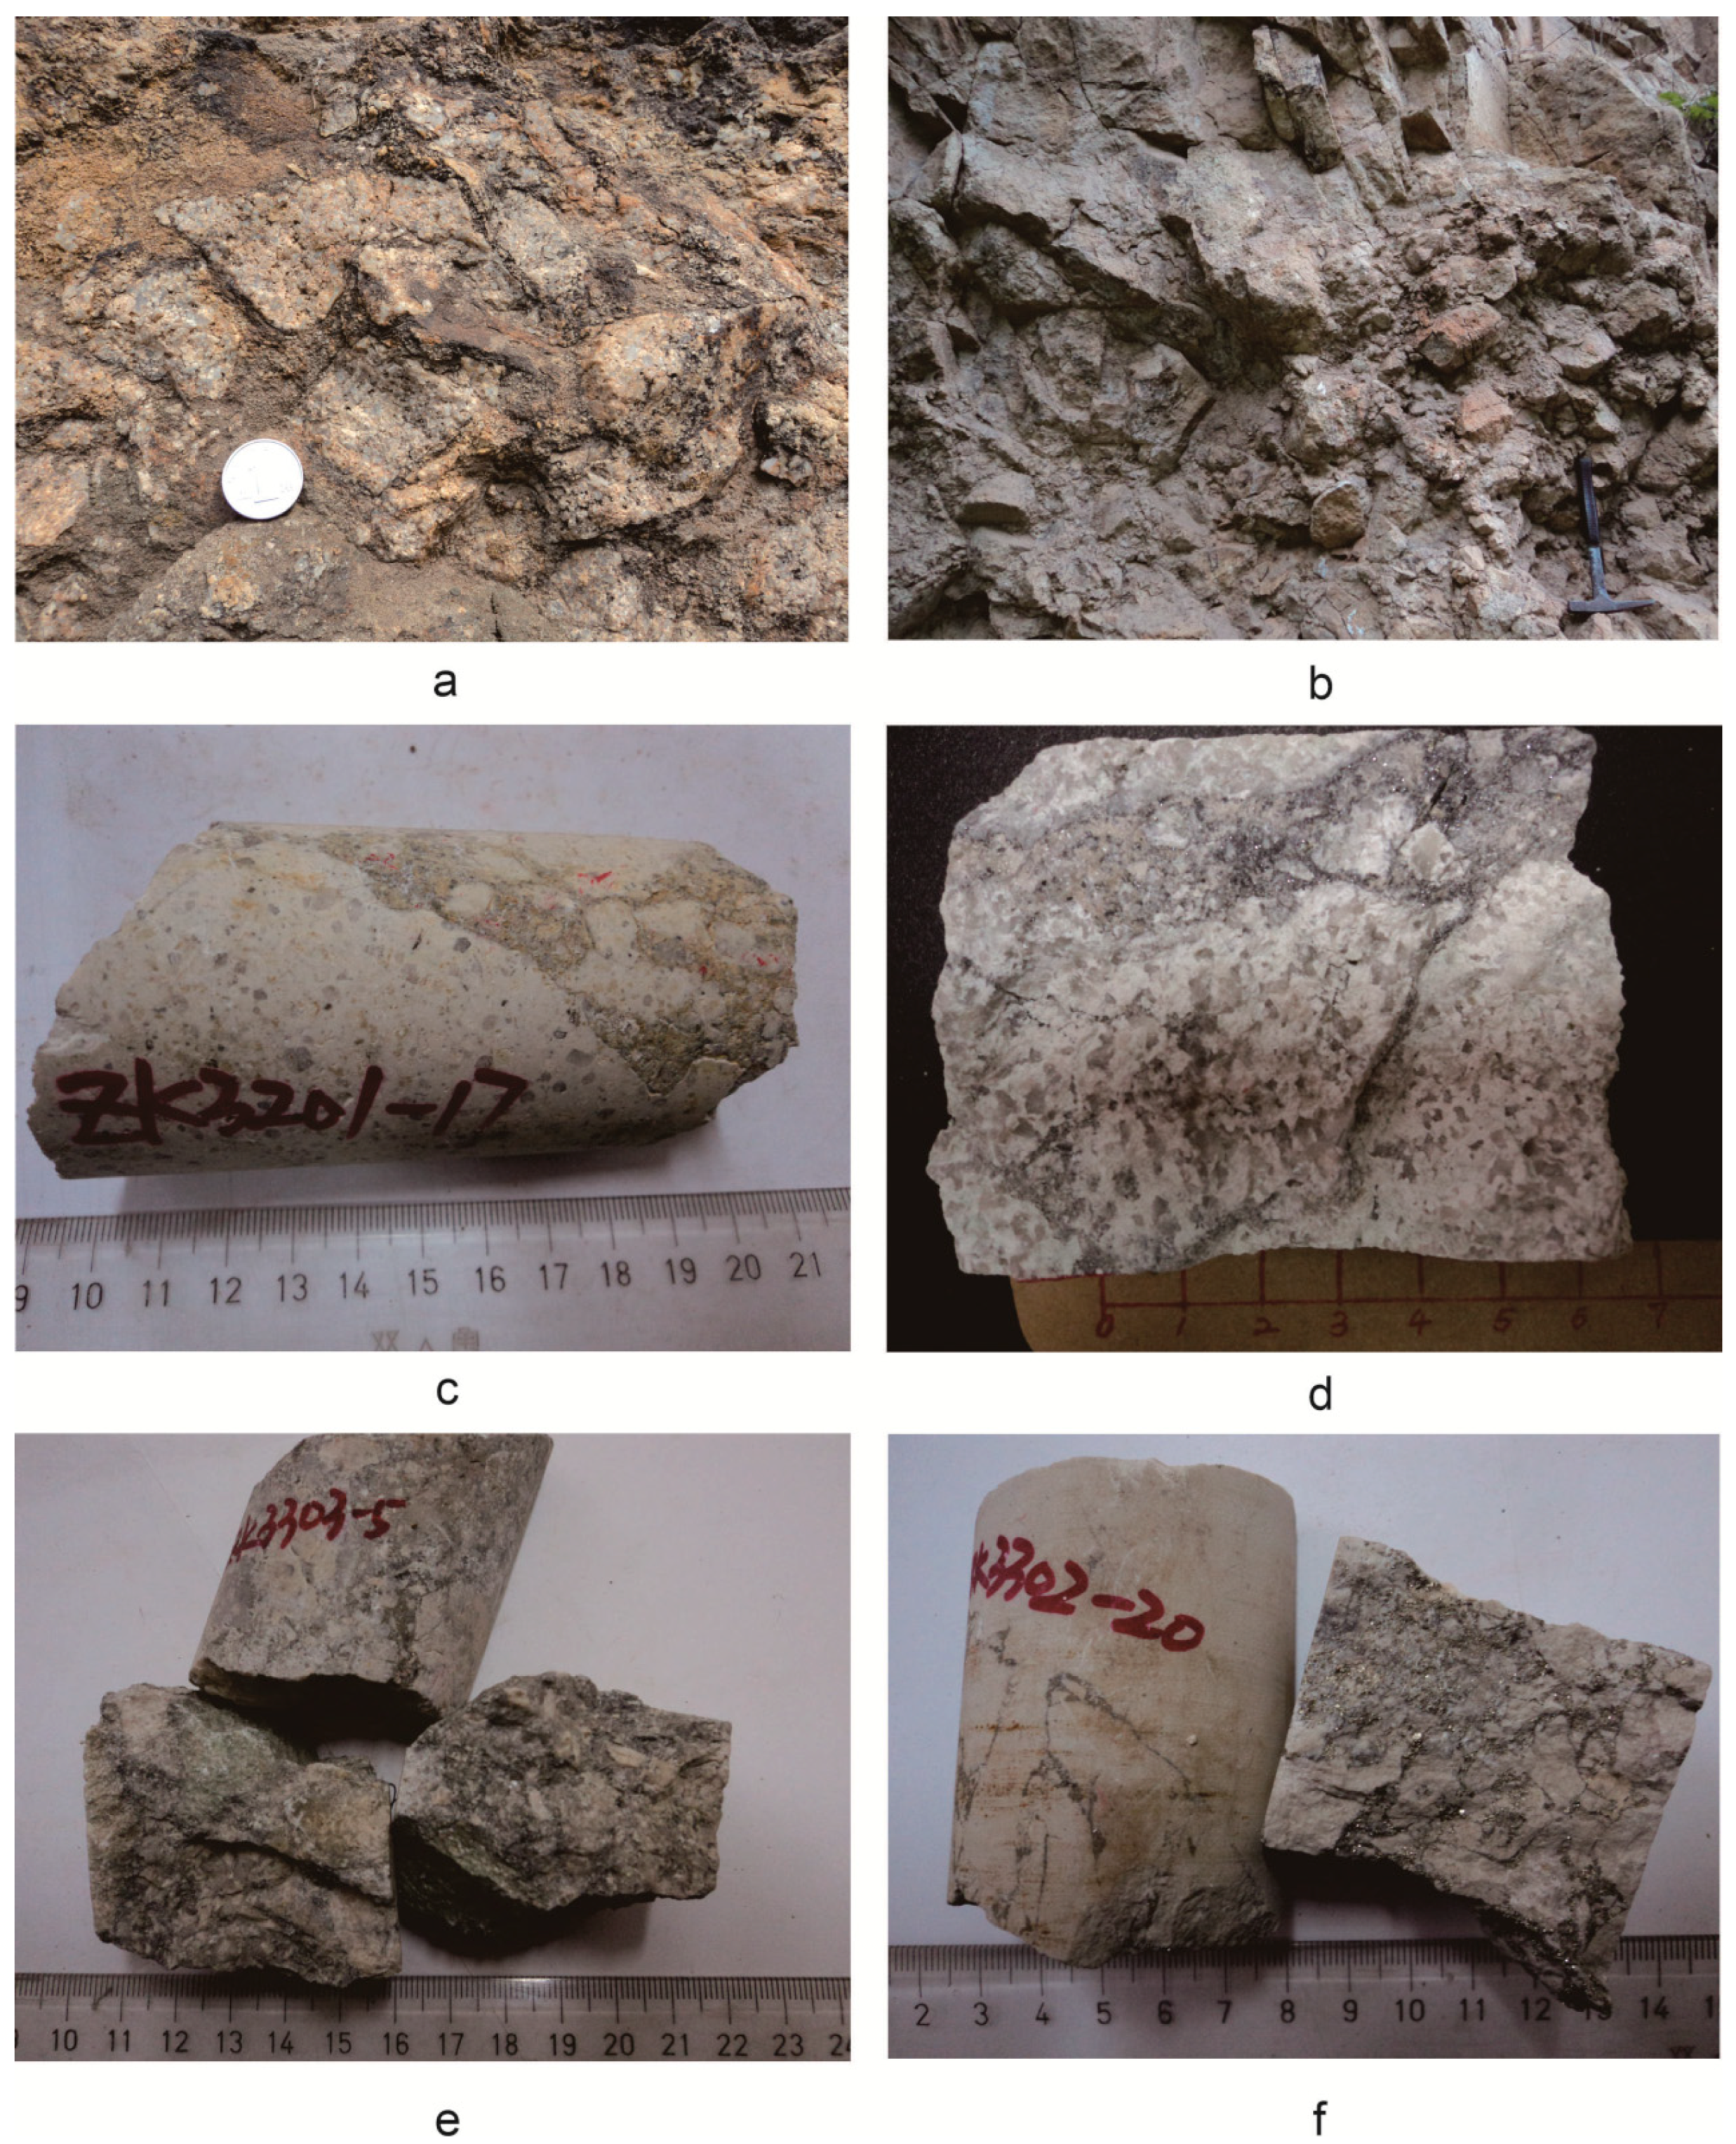
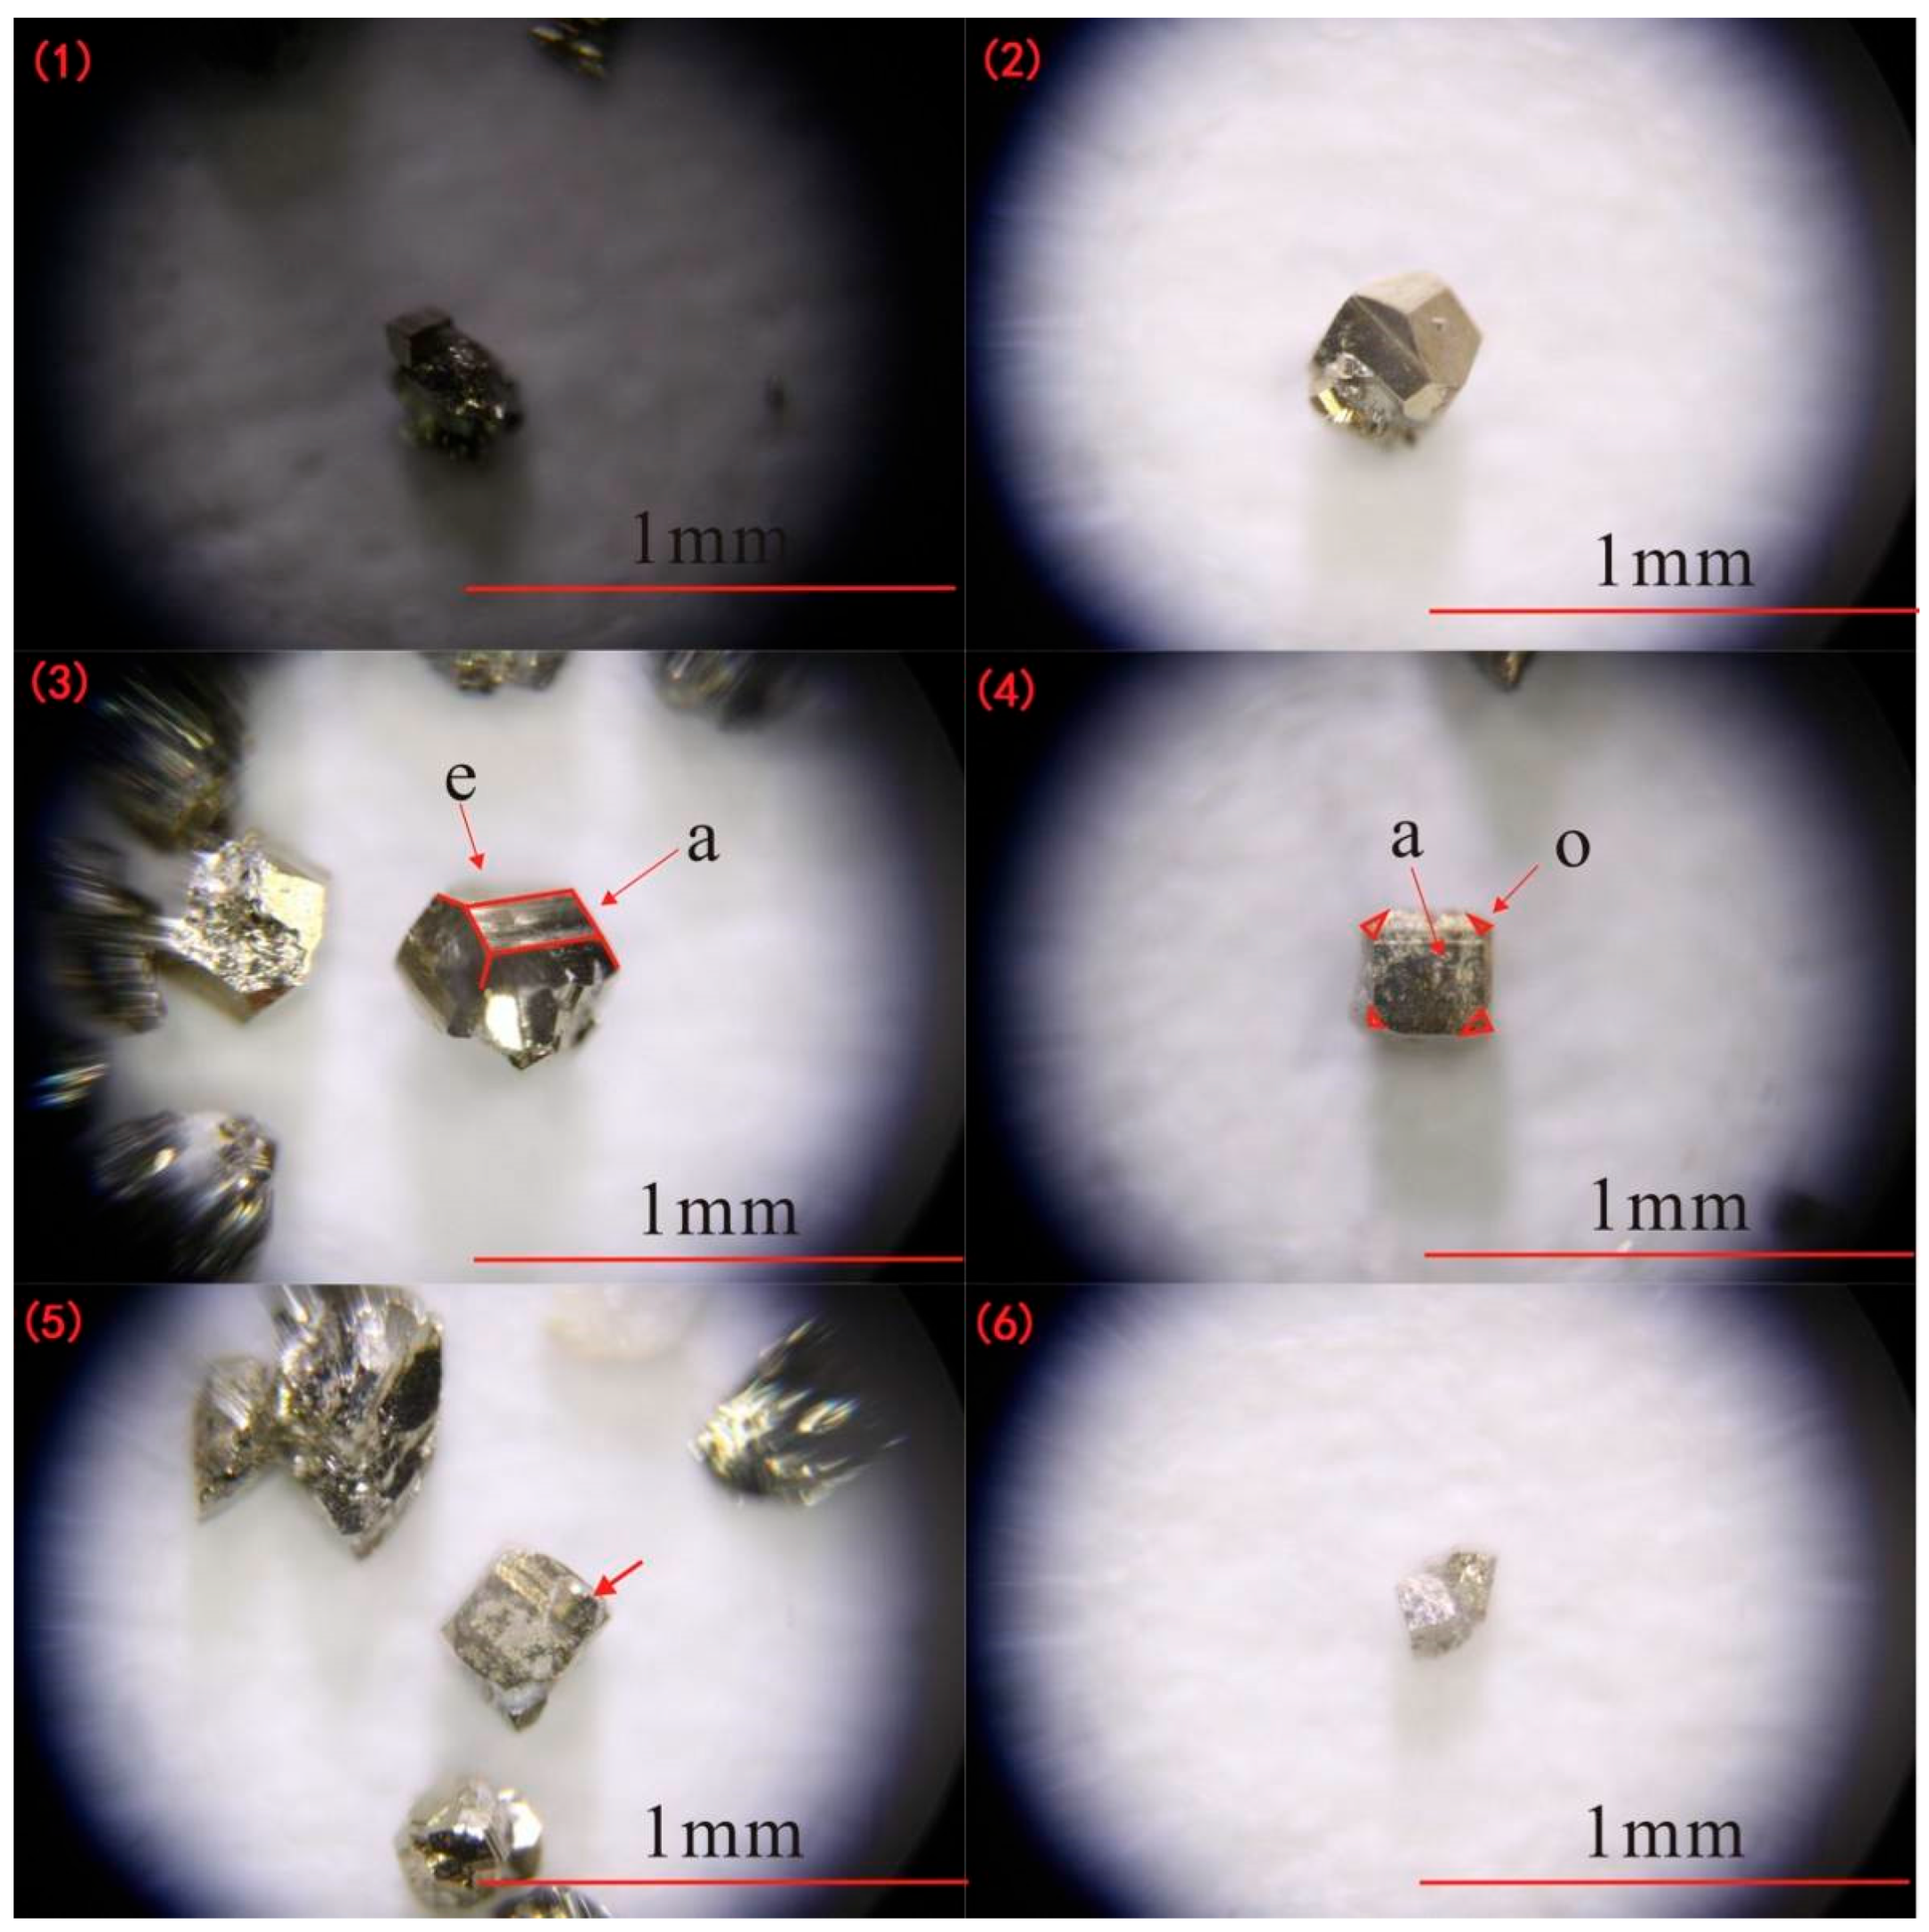
3. Occurrence Characteristics of Pyrite and Quartz

Pyrite is the most critical gold-bearing mineral in the Qiubudong silver deposit and occurs throughout all stages of mineralization. As hydrothermal activity evolved, the crystal morphology, color, grain size, and occurrence of pyrite changed systematically, reflecting distinct paragenetic stages. Specifically, in the sericitic alteration stage (Stage 1), pyrite is typically fine-grained and disseminated within altered wall rocks. During the quartz–pyrite stage (Stage 2), it occurs as euhedral to subhedral crystals with pentagonal dodecahedral forms, often coexisting with early quartz. In the polymetallic sulfide stage (Stage 3), pyrite becomes coarser and intergrows with sphalerite, galena, and chalcopyrite, indicating peak ore precipitation. Finally, in the quartz–carbonate stage (Stage 4), only minor residual pyrite is found, often reworked or rimmed by carbonates. These textural and compositional variations are consistent with the mineralization zoning shown in Figure 4 and support the stage-wise evolution of the hydrothermal system.
In the early sericitic alteration stage, pyrite is mainly hosted in shallow intrusive rocks, quartz porphyry, and aplite. It appears as euhedral to subhedral cubic grains, with a light brassy color and grain size of 0.5–2 mm, typically occurring as disseminations or local aggregates. During the quartz–pyrite stage, pyrite becomes more abundant (50%–95%), appearing as bright yellow subhedral to euhedral grains (0.05–1 mm), and occurs mainly in fine veinlets and stockwork zones. This stage marks the main ore precipitation phase and is characterized by intimate pyrite–quartz associations.
In the polymetallic sulfide stage, pyrite shows subhedral to anhedral forms with pale brassy color and finer grain sizes (0.03–0.25 mm). It may enclose sphalerite or be partially replaced by galena, often acting as cement in breccia zones composed of quartz porphyry or shallow granitic fragments. Similar textures have been documented in other hydrothermal systems ([9,11]). In the final quartz–carbonate stage, pyrite becomes irregular in shape (0.01–3 mm), with a light coppery color, and occurs in net-like veinlets (10%–40% abundance), commonly intergrown with calcite and quartz [24].
Quartz, the dominant gangue mineral, occurs throughout mineralization and records key information about thermal and fluid evolution. In the sericitic alteration stage, quartz is gray-white, medium to coarse-grained, and massive in texture, often associated with sericite, indicating intense silicification. In the quartz–pyrite stage, quartz appears gray to smoky gray and occurs mainly as fine veinlets (20%–65%), coexisting with pyrite, marking the peak of ore-forming activity. In the polymetallic sulfide stage, quartz becomes dark gray and is commonly intergrown with pyrite, sphalerite, galena, and chalcopyrite in veins or breccia cements. In the quartz–carbonate stage, quartz is typically distributed along the margins of carbonate veins and often displays comb-like textures, reflecting waning hydrothermal activity and decreasing fluid temperatures [15].

4. Samples and Analytical Methods

Pyrite and quartz samples used in this study were collected from multiple mineralization stages intersected by drill holes ZK3101, ZK3201, ZK3202, ZK3204, and ZK3302 at the Qiubudong silver deposit. The sampling strategy was designed to represent the complete paragenetic sequence of the deposit.

4.1. Major and Trace Element Analysis of Pyrite

Major and trace elements of single pyrite grains were analyzed at the Electron Microprobe Laboratory, Institute of Geology, Chinese Academy of Geological Sciences. Analyses were performed using a JEOL JXA-8230 electron probe microanalyzer (EPMA) (JEOL, Akishima, Tokyo, Japan) at an accelerating voltage of 20 kV, beam current of 2 × 10⁻⁸ A, and a beam diameter of 5 μm. Counting time was set to 20 s for peak positions and 10 s for background. Standards used included pyrite (Fe, S), cobalt metal (Co), and nickel metal (Ni). Data were corrected using the ZAF method and calibrated against SPI reference materials [25]). The relative analytical uncertainty was within 2%–5% for major elements and within 5%–10% for trace elements above detection limits.
Rare earth elements (REEs) in pyrite were analyzed at the Beijing Research Institute of Uranium Geology using an Element I inductively coupled plasma mass spectrometer (ICP-MS) (Finnigan MAT, Bremen, Germany). The instrument was operated at a resolution of 300 and a radio frequency (RF) power of 1.25 kW. The analysis was performed under laboratory conditions at 20 °C and 30% relative humidity, following standard ICP-MS protocols [26,27].

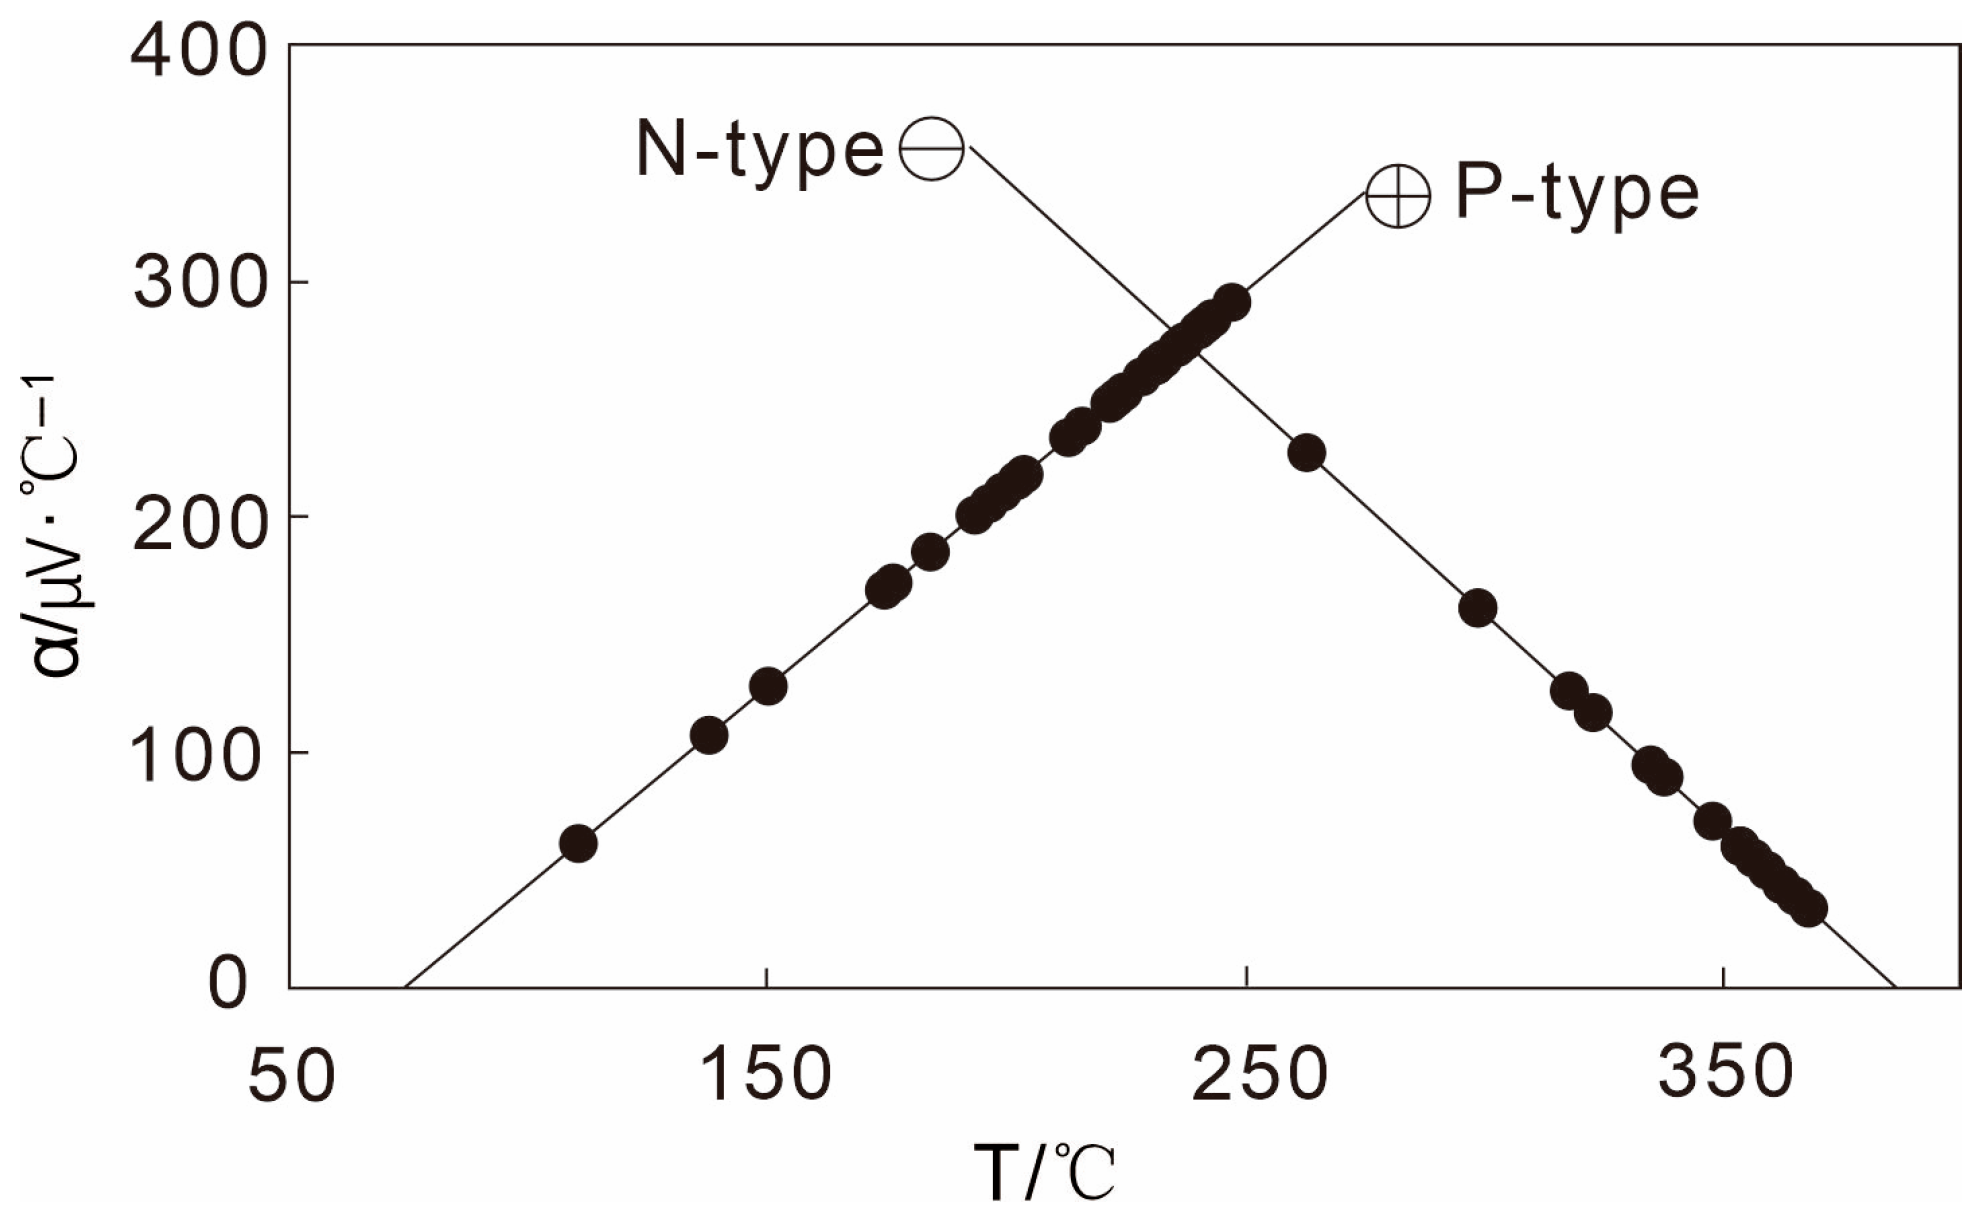
4.2. Thermoelectric Measurements of Pyrite

Thermoelectric properties of pyrite were measured at the Genetic Mineralogy Laboratory, China University of Geosciences (Beijing), using a BHTE-06 thermoelectric coefficient analyzer (Beihang University, Beijing, China). The active temperature difference (ΔT) was maintained at 60 ± 3 °C. Sample preparation included the following steps: (1) crushing and sieving the sample to a particle size of 40–60 mesh; (2) hand-picking pure pyrite grains; (3) cleaning surfaces by ultrasonic washing in ethanol; and (4) conducting thermoelectric coefficient measurements. Each sample was measured three times to ensure reproducibility, and the average value was used. The instrument resolution was 0.1 μV/°C, and tests were conducted at a relative humidity (RH) below 85%, with ambient temperature maintained at 25 ± 1 °C. The polarity and magnitude of the thermoelectric coefficient (Q value) were used to distinguish between p-type (positive conduction) and n-type (negative conduction) conductivity of pyrite, which reflects the redox state of ore-forming fluids [8].

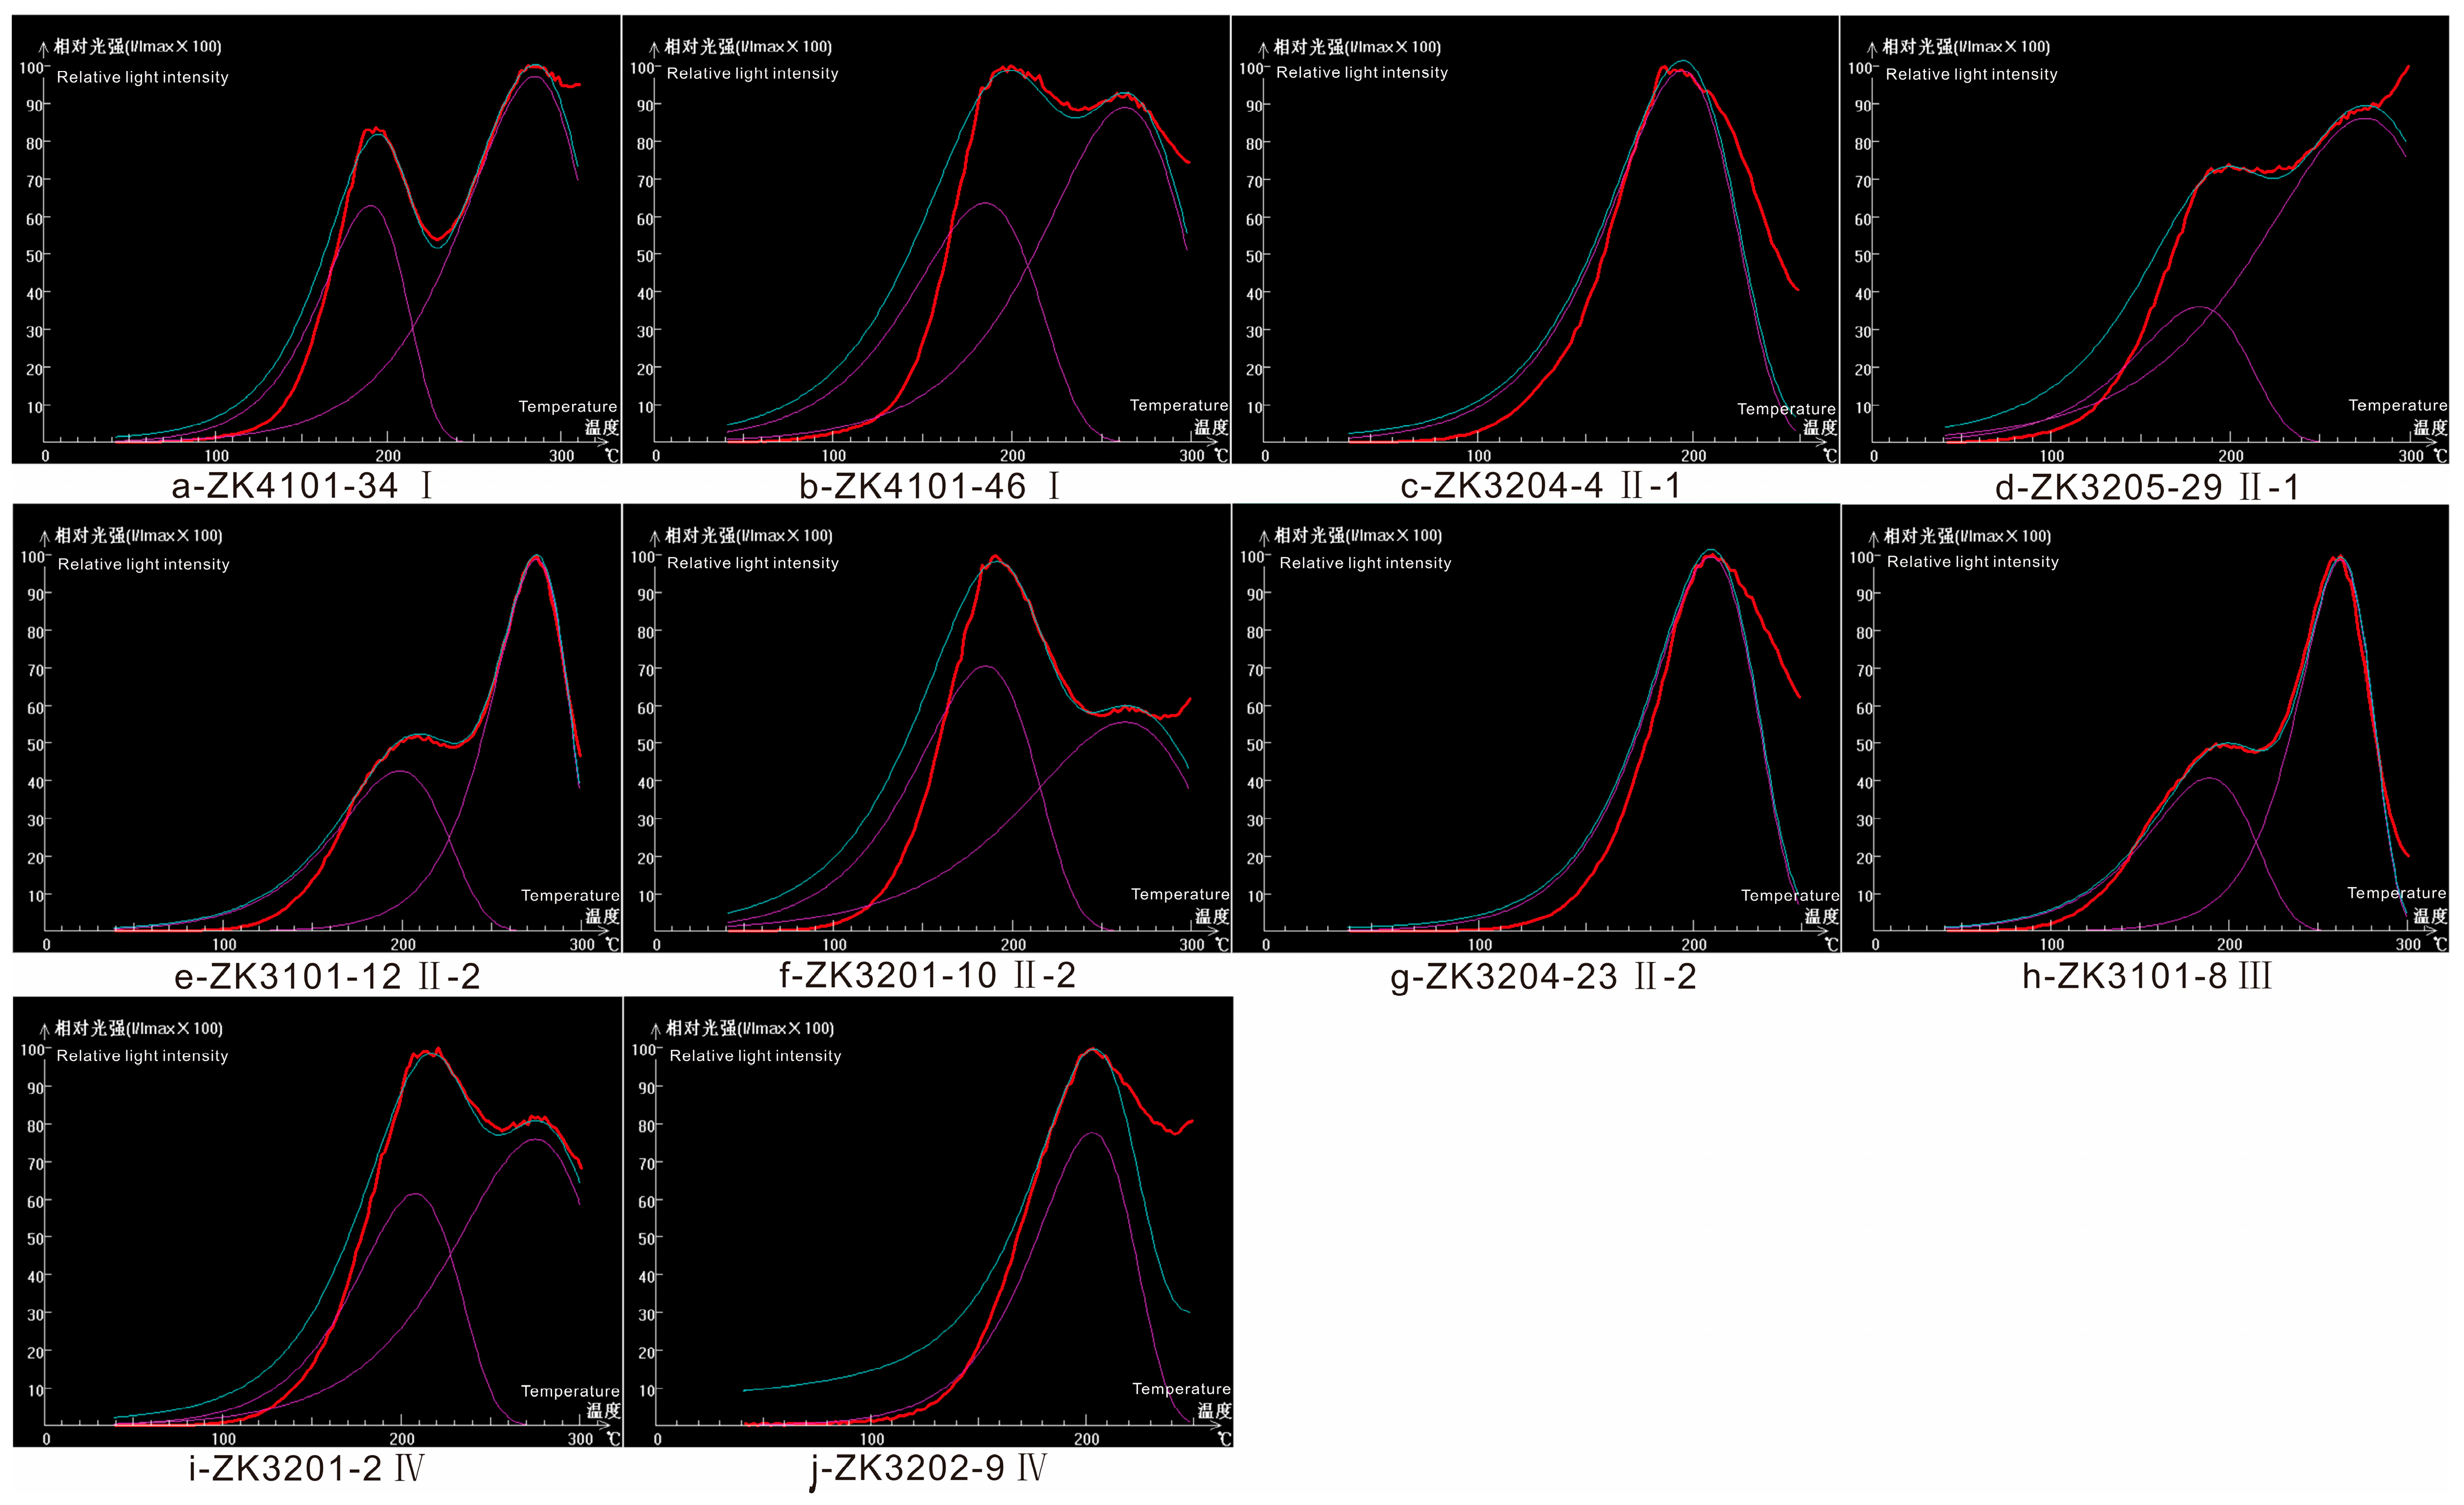
4.3. Thermoluminescence Measurements of Quartz

Quartz thermoluminescence was also measured at the Genetic Mineralogy Laboratory, China University of Geosciences (Beijing), using an FJ427-A1 computer-controlled thermoluminescence dosimeter (Beijing Nuclear Instrument Factory, Beijing, China). Quartz grains with >95% purity were selected after crushing and sieving to 40–60 mesh. Approximately 50 mg of sample was weighed with a precision of 0.0001 g and evenly spread on the heating tray. The heating program included: an initial temperature of 40 °C, maximum heating temperature of 420 °C, a ramp rate of 2 °C/s, preheating time of 5 s, total measurement duration of 210 s, and an annealing time of 20 s [14,15].

4.4. Microthermometry of Fluid Inclusions in Quartz

Microthermometric measurements of fluid inclusions in quartz were performed using a Linkam THMSG600 heating–cooling stage (Renishaw, London, UK) at the Genetic Mineralogy Laboratory, China University of Geosciences (Beijing). The operating temperature range was −196 to 600 °C. The precision was ±1 °C from 0 to 600 °C and ±0.1 °C from −196 to 0 °C. The reproducibility error for homogenization temperature was <2 °C and <0.2 °C for freezing point measurements. Heating rates during observation were 5–10 °C/min, and were reduced to 1 °C/min near phase transition temperatures to ensure accurate determination of phase changes [28,29].

5. Results

Pyrite exhibits distinct crystal morphology variations across the mineralization stages at the Qiubudong silver deposit. Eight hundred ninety-eight pyrite grains were observed and classified (Table 1; Figure 6). The dominant crystal forms are cubic (49.22%) and pentagonal dodecahedral (19.71%), followed by cubic + pentagonal dodecahedral intergrowths (12.92%) and cubic + octahedral intergrowths (10.58%). Other morphologies, such as octahedral + pentagonal dodecahedral (1.45%) and combined cubic + octahedral + pentagonal dodecahedral forms (3.23%), are less common (Figure 7). The abundance of cubic pyrite decreases progressively from the sericitic alteration stage to the quartz–carbonate stage, with the most significant drop occurring during the quartz–pyrite stage. In contrast, the proportion of pentagonal dodecahedra and their intergrowths with cubic forms sharply increases during the quartz–pyrite and polymetallic sulfide stages, suggesting more dynamic fluid conditions during these stages. The cubic + octahedral type becomes more prominent in the late quartz–carbonate stage. These systematic morphological variations (Figure 8) imply a strong link between pyrite crystallization environments and hydrothermal evolution [7,24].
Electron microprobe and ICP-MS analyses (Table 2) indicate that the pyrite from all stages is compositionally characterized by Fe enrichment and S deficiency relative to stoichiometric FeS2 (ideal Fe = 46.55 wt%, S = 53.45 wt%). In this study, Fe ranges from 46.74 to 48.21 wt% (avg. 47.42 wt%) and S from 50.76 to 52.94 wt% (avg. 51.94 wt%), indicating a sulfur-deficient type of pyrite, consistent with previous observations in other hydrothermal systems [30]. Gold contents are relatively high (103.35–458.31 ppm), suggesting that pyrite is a major gold carrier. Ag, Cu, Pb, and Bi concentrations are elevated in the polymetallic sulfide and quartz–carbonate stages. Zn and Ni show relative enrichment during the quartz–pyrite and polymetallic sulfide stages. Arsenic is widespread (72.22–10,528.66 ppm), consistent with its known affinity for gold in arsenian pyrite [9]. Total REE contents are low (0.83–131.12 ppm), with LREE generally enriched over HREE and weak overall fractionation [(La/Yb)N = 0.71–26.35]. Chondrite-normalized REE patterns show slightly right-leaning to flat curves, with pronounced negative Eu anomalies (δEu = 0.11–1.80) and weak Ce anomalies (δCe ≈ 0.94–1.18), reflecting moderate fluid evolution and possible feldspar interaction [31] (Table 3, Figure 9).
A total of 1210 pyrite grains from 29 samples were analyzed for thermoelectric properties (Table 4, Figure 10). The thermoelectric coefficient (TEC) ranges from −328.9 to +335.6 μV/°C, with a mean of +197.63 μV/°C. P-type conductivity dominates across all stages, with an average frequency of 88.78%. In the sericitic alteration and quartz–pyrite stages, P-type pyrite occurs at 98% and 97.31%, respectively, with only rare N-type occurrences. During the polymetallic sulfide stage, P-type frequency decreases to 81.84%, and N-type pyrite increases (18.16%), suggesting fluid evolution and redox fluctuations. In the quartz–carbonate stage, P- and N-type pyrite appear nearly balanced (P: 58%, N: 42%), indicative of a more heterogeneous fluid regime in the late mineralization phase. These changes in thermoelectric polarity and magnitude are consistent with variations in crystal morphology and trace element composition, and reflect progressive fluid evolution and redox dynamics during pyrite formation [8,11].
Quartz thermoluminescence (TL) properties vary significantly across different mineralization stages in the Qiubudong silver deposit (Table 5, Figure 11). In general, TL glow curves exhibit a characteristic bimodal shape, with the high-temperature peak consistently more intense than the low-temperature peak. In the sericitic alteration stage, TL analyses of two samples show complex bimodal patterns with sharp peaks: low-temperature peaks appear at 185–190 °C, high-temperature peaks at 263–285 °C. The full width at half maximum (FWHM) ranges from 60 to 95 °C, peak intensities from 550 to 1080 cps, and total luminescence from 46,667 to 102,001 cps. During the quartz–pyrite stage, five samples were analyzed, showing both unimodal and bimodal curves. Low-temperature peaks are blunt and occur at 183–199 °C, while high-temperature peaks remain sharp at 263–275 °C. The peak intensity spans 360–2900 cps and total TL emission ranges from 31,200 to 167,558 cps, indicating enhanced hydrothermal activity. One sample from the polymetallic sulfide stage displays a strong bimodal pattern with high-temperature peaks dominating, yielding the highest total TL intensity (up to 222,226 cps). In the quartz–carbonate stage, both unimodal and bimodal curves occur; the single peak is centered at 203 °C with relatively low intensity (~77 cps), while bimodal curves present peaks at 208 °C and 275 °C. Overall, TL curve evolution follows a systematic sequence: bimodal mixed bimodal mixed, with the main ore-forming stage showing the strongest and sharpest TL responses, reflecting high thermal gradients and robust fluid activity [14,15].
Fluid inclusions (FIs) in quartz exhibit distinct physical and thermal behaviors that correspond to different mineralization stages (Table 6, Figure 12 and Figure 13). Three main types of FIs were observed based on phase states at room temperature and their microthermometric behavior: liquid-rich, vapor-rich, and two-phase (liquid + vapor) inclusions. During freezing and heating experiments, two-phase inclusions typically showed vapor bubble disappearance upon heating (indicating homogenization to the liquid phase), whereas vapor-rich inclusions homogenized to vapor, and liquid-rich inclusions rarely developed vapor bubbles until close to homogenization. These phase behaviors were used to distinguish the fluid inclusion types during thermal analysis.
In the quartz–pyrite stage (FIA-1), inclusions range from 5 to 25 μm in diameter and are dominated by two-phase types (85%), with homogenization temperatures (Th) ranging from 170.2 to 359.8 °C (average 254.5 °C), and freezing points from −13 to −1.6 °C, indicating low to moderate salinity. In the polymetallic sulfide stage (FIA-2), inclusions are 4–18 μm in size, again dominated by two-phase types (90%), with Th values of 240.3–330.6 °C (average 271.2 °C), and freezing points from −11.3 to −4.9 °C. In the quartz–carbonate stage (FIA-3), smaller inclusions (2–9 μm) are observed, with Th values of 146.7–258.4 °C (average 204.7 °C), and freezing points from −9.6 to −6.5 °C.
Overall, the FI data indicate that ore formation at Qiubudong occurred under fluctuating thermal and chemical regimes. The transition from moderate- to high-temperature, low-salinity fluids to lower-temperature, denser, confined systems is consistent with waning magmatic input and increased fluid–rock interaction. This interpretation is further supported by quartz thermoluminescence patterns and pyrite typomorphism across mineralization stages.
Salinities of ore-forming fluids were calculated based on the relationship between freezing point depression and NaCl equivalent [32], ranging from 2.74 to 16.89 wt.% NaCl eq., with most values clustering between 10.11 and 12.62 wt.% (average 11.16 wt.%). Specifically, salinities are 10.22 wt.% (quartz–pyrite stage), 11.80 wt.% (polymetallic sulfide stage), and 11.47 wt.% (quartz–carbonate stage), all corresponding to low-salinity fluids (typically <26.3 wt.%). Fluid densities range from 0.73 to 0.99 g/cm3, mainly between 0.91 and 0.95 g/cm3 (average 0.90 g/cm3). From early to late stages, the average fluid density increases from 0.86 to 0.95 g/cm3, coupled with a decline in homogenization temperatures from ~254.5 °C to ~204.7 °C. This trend reflects a gradual cooling of the hydrothermal system and increasing fluid confinement during the waning stages of mineralization. The minor increase in salinity from early to middle stages, followed by stabilization in late fluids, may indicate limited mixing with residual evolved fluids or restricted input from external low-salinity sources such as meteoric water. These thermal and compositional evolutions, in conjunction with complex thermoluminescence responses and decreasing inclusion size and abundance, collectively suggest progressive cooling, minor fluid mixing, and partial confinement in the late mineralization stage.
Such fluid behavior is consistent with volcanic–hydrothermal systems where ore precipitation is governed by episodic fluid injection, structural compartmentalization, and cooling-driven solubility changes [29,33,34].

6. Discussion

6.1. Characteristics of Ore-Forming Hydrothermal Fluids

The mineralization at the Qiubudong silver deposit is primarily controlled by a medium- to low-temperature hydrothermal system dominated by volcanic-derived fluids, with minor meteoric water input. Pyrite geochemistry shows high Co (499.15–1861.56 ppm) and low Ni (15.96–546.71 ppm), with Co/Ni ratios mostly greater than 5, indicating a volcanic origin. These results are consistent with Co–Ni classification diagrams (Figure 14 [35,36,37,38,39,40]). Sulfur isotope data (δ34S = 0.5–3.4‰, avg. 1.6‰), lead isotopes (206Pb/204Pb = 15.799–16.049), and quartz δ18O (8.6–12‰) and δD (−95.2 to −83.2‰) further support a dominantly magmatic fluid source with limited meteoric mixing [20].
Volatile and trace elements also provide insights into the hydrothermal environment. Pyrite Se/Te ratios (0–2.083, avg. 0.668) and S/Se ratios (2440.6–10,3011.5) indicate a low- to mid-temperature hydrothermal system. Pyrite thermoelectric coefficients (Figure 15) suggest crystallization temperatures of 110.3–369.0 °C, aligning with quartz fluid inclusion homogenization temperatures: 170.2–359.8 °C in the quartz–pyrite stage, 240.3–330.6 °C in the polymetallic sulfide stage, and 146.7–258.4 °C in the quartz–carbonate stage. The evolution of pyrite REE patterns from near-parallel to weakly LREE-enriched curves suggests increasing F content in late-stage fluids, with minor Cl enrichment [43,44]. Fluid inclusion salinities (10.11–12.62 wt.% NaCl eq.) and densities (0.91–0.95 g/cm3) indicate that the ore-forming fluids were low-salinity and low-density throughout mineralization.
Comparison with other breccia-type Ag deposits in the Taihang orogenic belt (e.g., Zhaobao) reveals common F-enriched, low-salinity hydrothermal signatures. However, the widespread development of pentagonal dodecahedral pyrite and its relation to thermoelectric polarity in Qiubudong offers a novel perspective on fluid evolution and ore-forming mechanisms.

6.2. Ore Prospecting Indicators

Distinct mineralogical and geochemical signatures provide effective criteria for ore prospecting. The predominance of cubic and pentagonal dodecahedral pyrite morphologies, especially the high abundance of pentagonal dodecahedral and their intergrowth forms during the main mineralization stage, correlates with high ore-forming potential. Additionally, pyrite trace element characteristics, such as strong Au–Cu positive correlation and Au–Co/Ni negative correlation (Figure 16), support their use in mineralization targeting. These element associations suggest that high Cu content and low Co/Ni ratios can be used as geochemical pathfinders for silver–gold mineralization.
Thermoluminescence (TL) characteristics of quartz further serve as useful indicators. The main ore-forming stage is characterized by strong, complex bimodal TL glow curves with sharp high-temperature peaks and broad low-temperature peaks. These features are consistent with robust hydrothermal conditions and can aid in identifying mineralization stages during exploration.

6.3. Prediction of Mineralization Potential

The prediction of deep mineralization potential is based on the integrated analysis of pyrite typomorphism and thermoelectric properties [46]. Pentagonal dodecahedral pyrite, typically associated with gold enrichment, is considered a reliable typomorphic marker of mineralized zones. In deeper parts of the orebody, pyrite shows higher Co, Ni, and Se contents and displays N-type thermoelectric behavior, which is commonly linked to higher temperature, reducing ore-forming environments where magmatic–hydrothermal fluids predominate [8,11]. Conversely, pyrite from shallow and marginal zones is often enriched in As and S and exhibits P-type thermoelectricity, which may reflect lower temperature, oxidizing conditions influenced by meteoric water ingress or supergene modification [7]. These patterns provide useful indicators for evaluating vertical zoning and preservation state of mineralization.
Exploration modeling along section line 32 (Figure 17) shows that below the 800 m elevation level, particularly between drill holes ZK3204 and ZK3201, pyrite aggregates and pentagonal dodecahedral forms become dominant. Between 850 and 900 m elevation, these morphologies form the core of the mineralized zone. P-type thermoelectricity dominates overall, reflecting a stable mineralizing environment. However, in ZK3201 below 800 m, a marked increase in N-type pyrite suggests changes in physico-chemical conditions, possibly related to magmatic fluid input. These observations point to significant concealed ore potential in the deep zone between ZK3204 and ZK3201, meriting further exploration.
In this study, we adopted an indicator-based visualization approach to illustrate the spatial distribution of individual proxies (pyrite morphology, thermoelectric properties, trace elements, and TL characteristics) along section line 32. While a composite predictive model, such as a weighted sum of proxies in spatial grids, could further enhance prospectivity mapping, its implementation was limited by the current data density and irregular drillhole spacing. The present drill grid does not yet support uniform 10 m × 10 m block modeling with consistent proxy coverage across all intervals. However, such an integrated modeling approach will be prioritized in future work, as additional data from ongoing exploration campaigns become available.

7. Conclusions

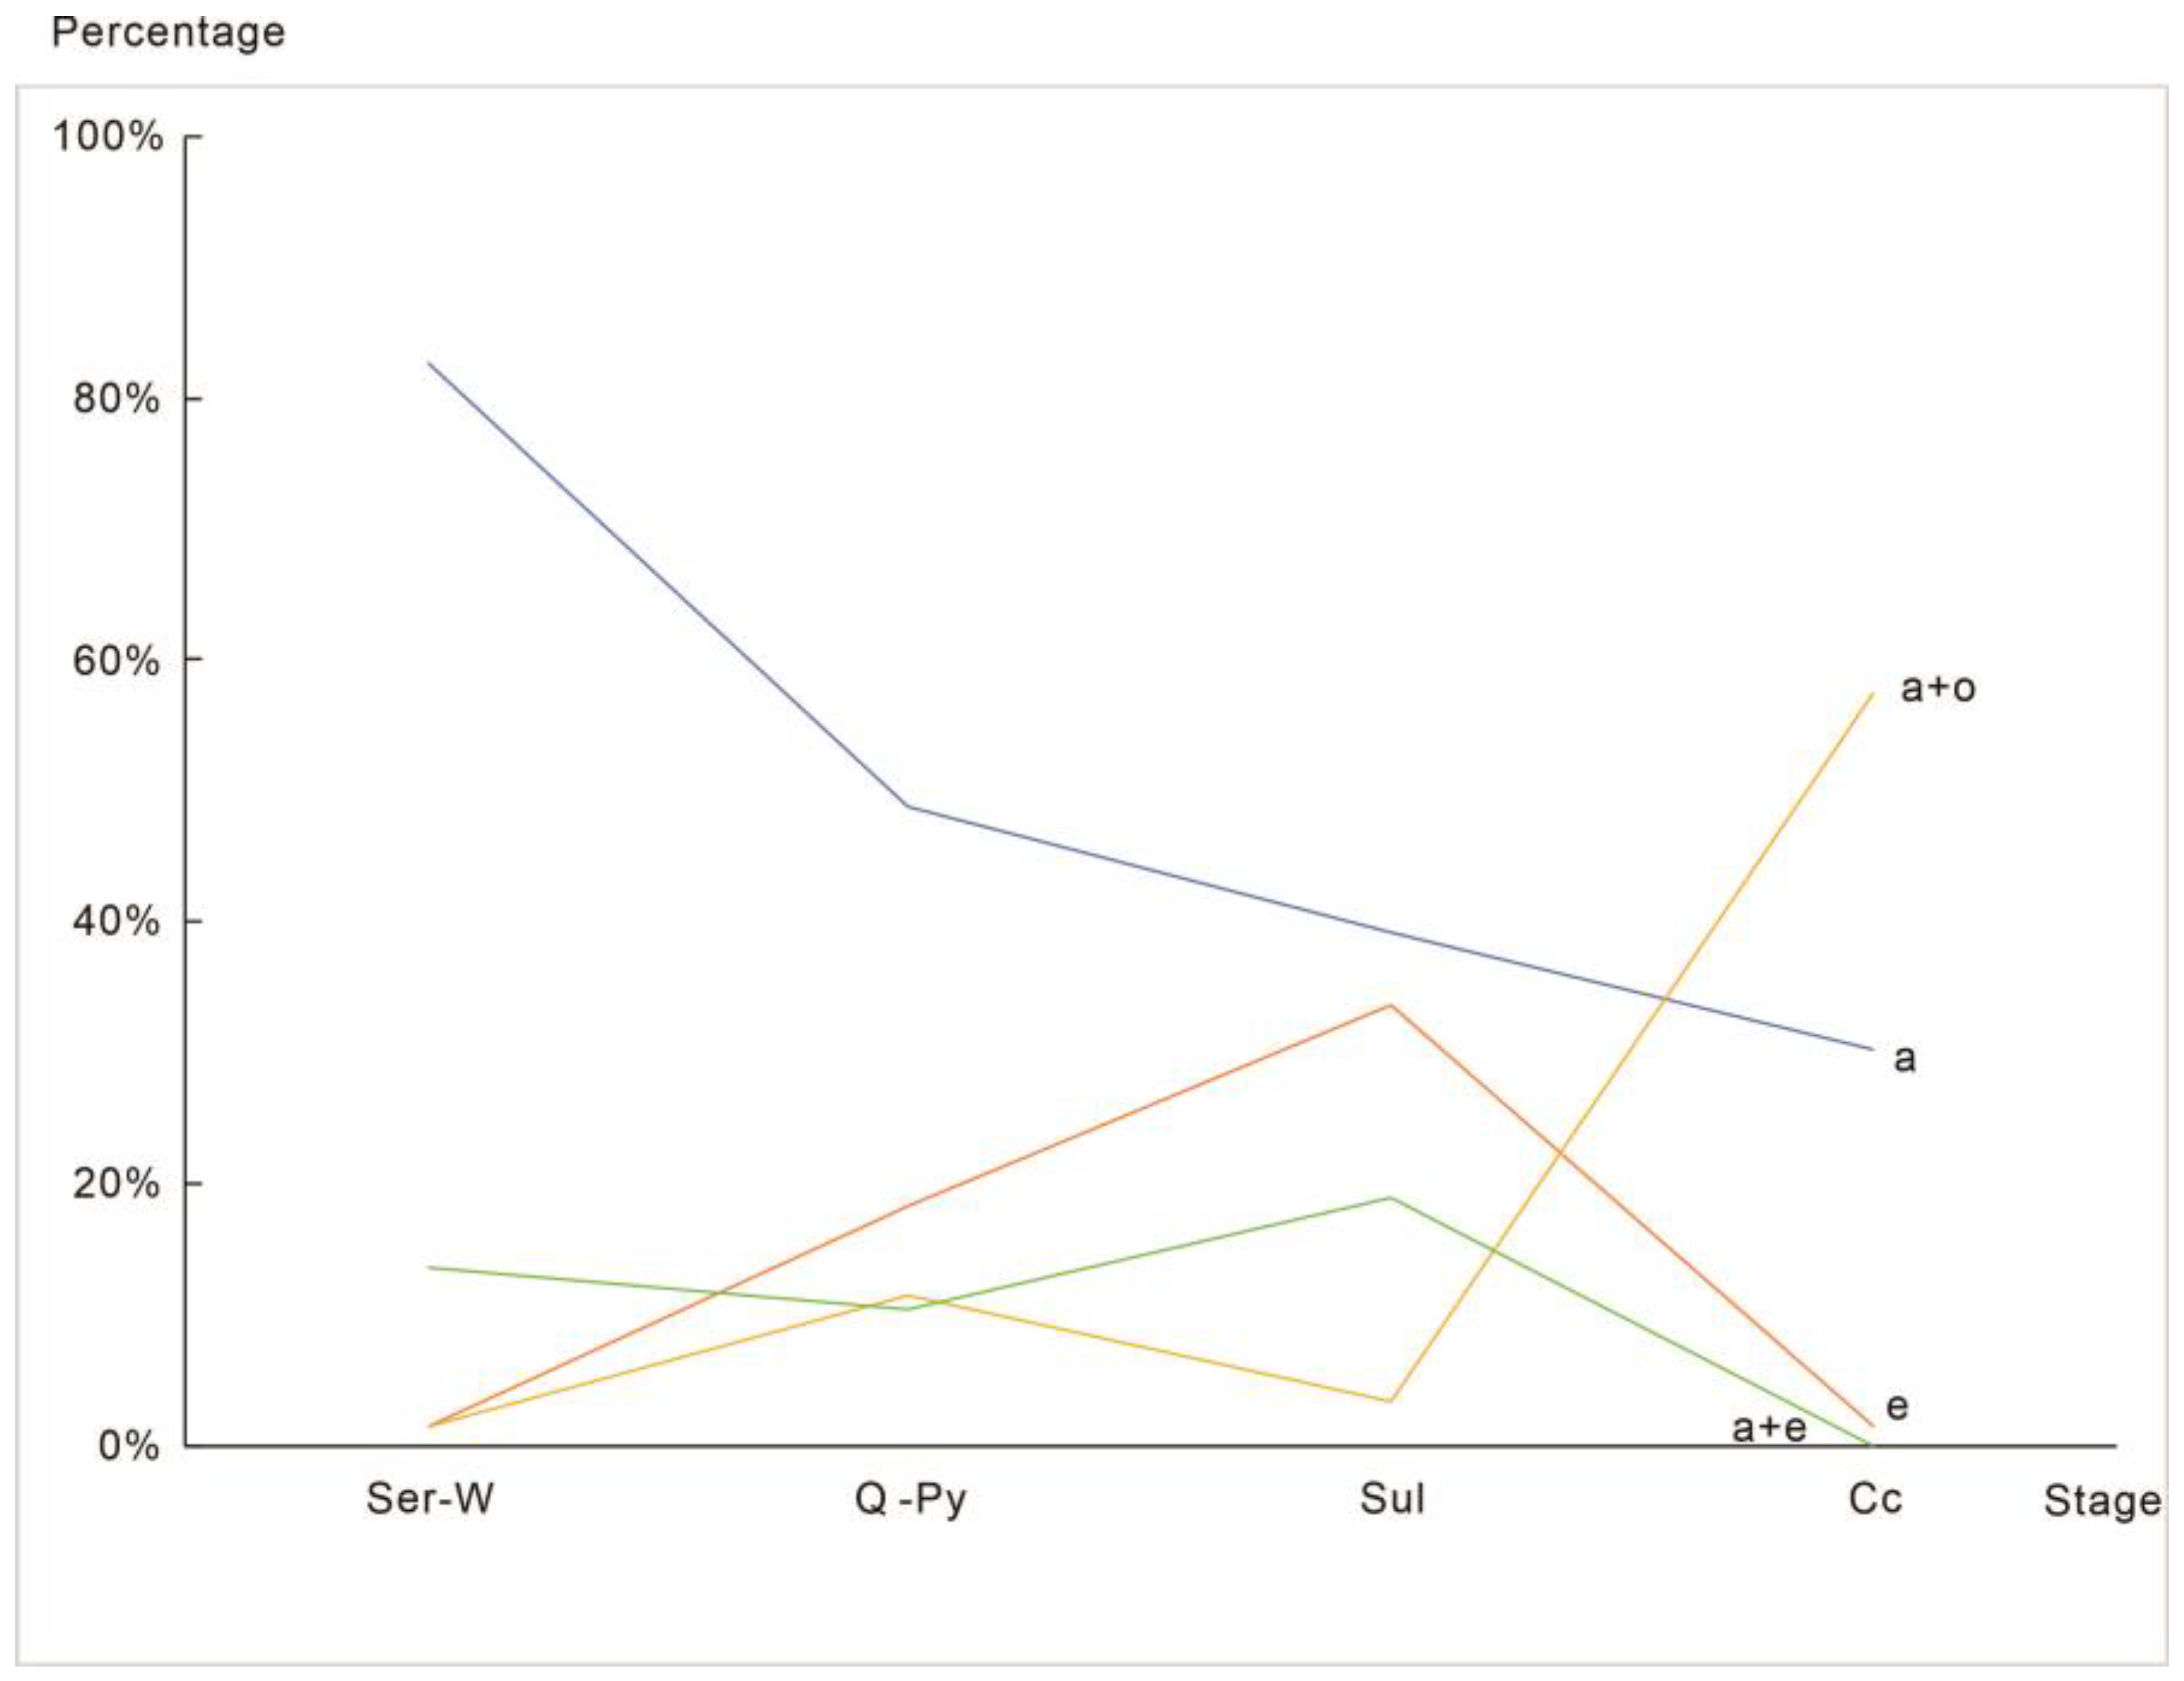
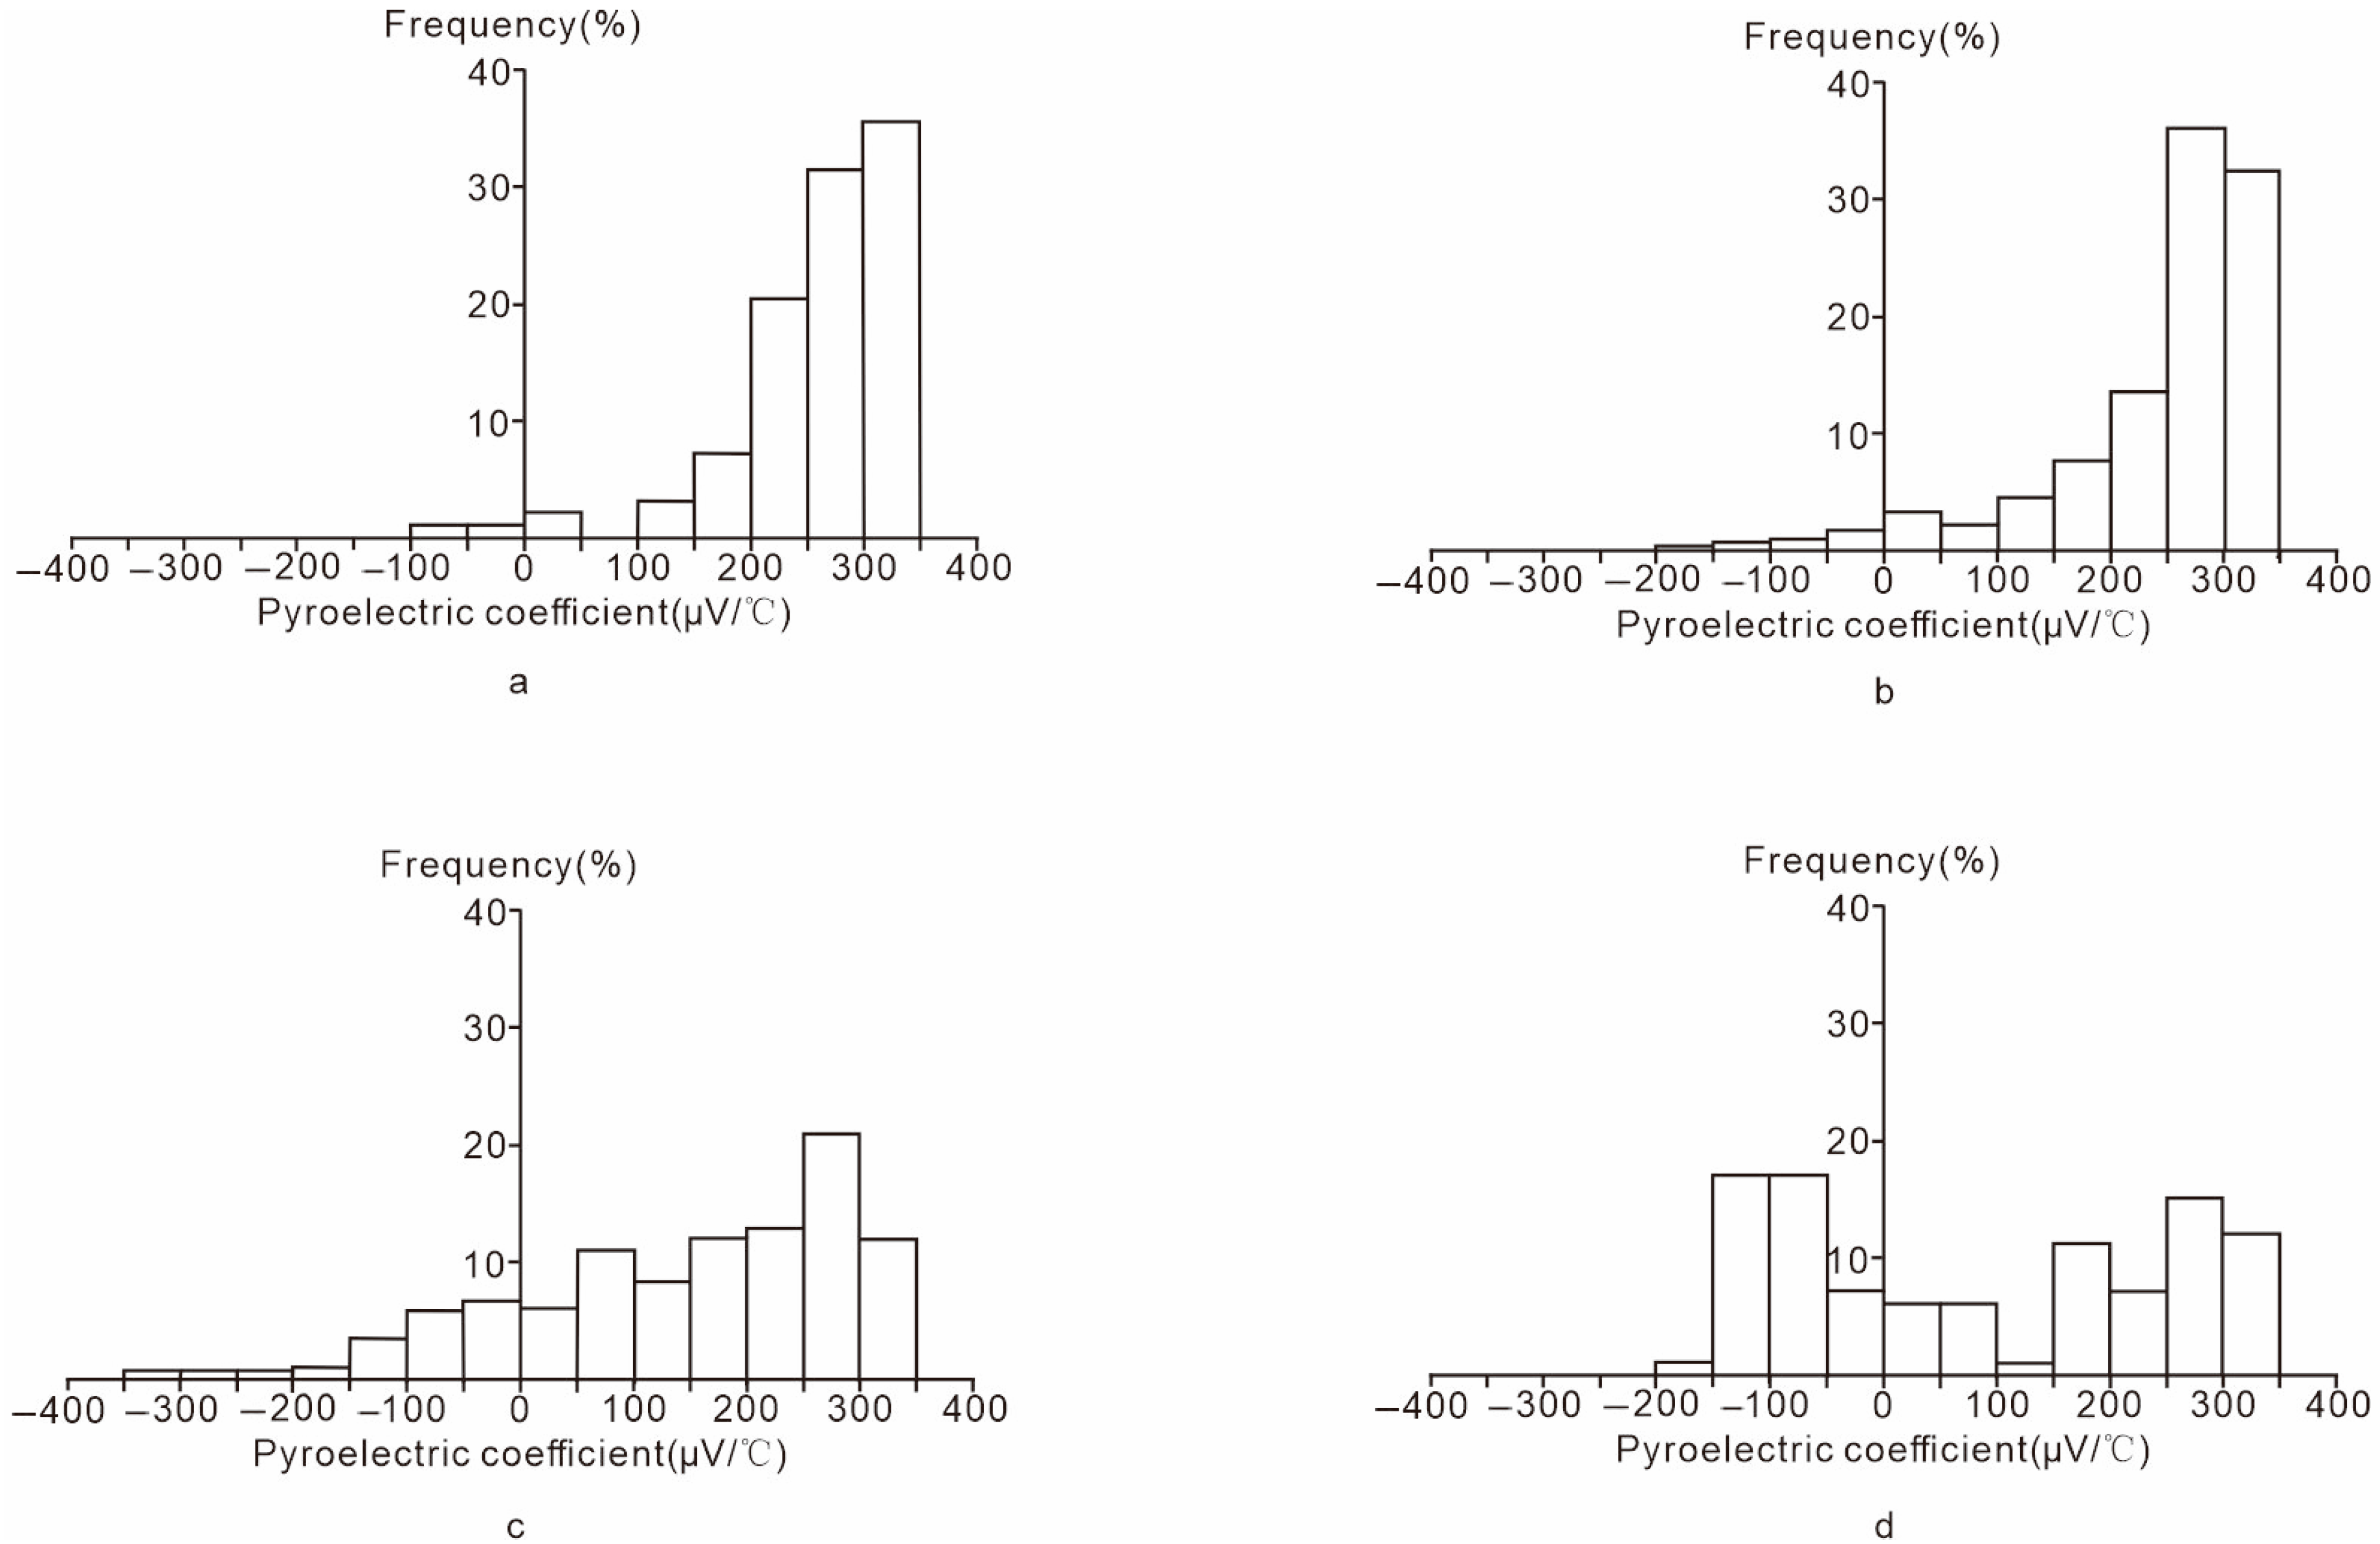
  • Pyrite from the Qiubudong silver deposit exhibits systematic variations in crystal morphology (cubic, pentagonal dodecahedral, and intergrowths), chemical composition (Fe-enrichment, S-deficiency, Au-rich), and thermoelectric behavior (predominantly P-type with stage-specific transitions). These features collectively reflect dynamic hydrothermal evolution under a low-salinity, F-rich, structurally controlled environment at medium–low temperatures. The pentagonal dodecahedral habit, in particular, is strongly linked to main-stage mineralization and Au enrichment, offering a robust mineralogical indicator.
  • Quartz thermoluminescence and fluid inclusion analyses reveal a progression from hotter, two-phase F-rich fluids in early stages to cooler, more confined low-density systems in late stages. The TL glow curves show characteristic bimodal patterns in ore-forming stages, while fluid inclusion data demonstrate consistent low salinities (10–12 wt.% NaCl eq.) and increasing fluid density over time. These thermal and compositional trends support a magmatic-hydrothermal system undergoing gradual cooling and partial fluid confinement.
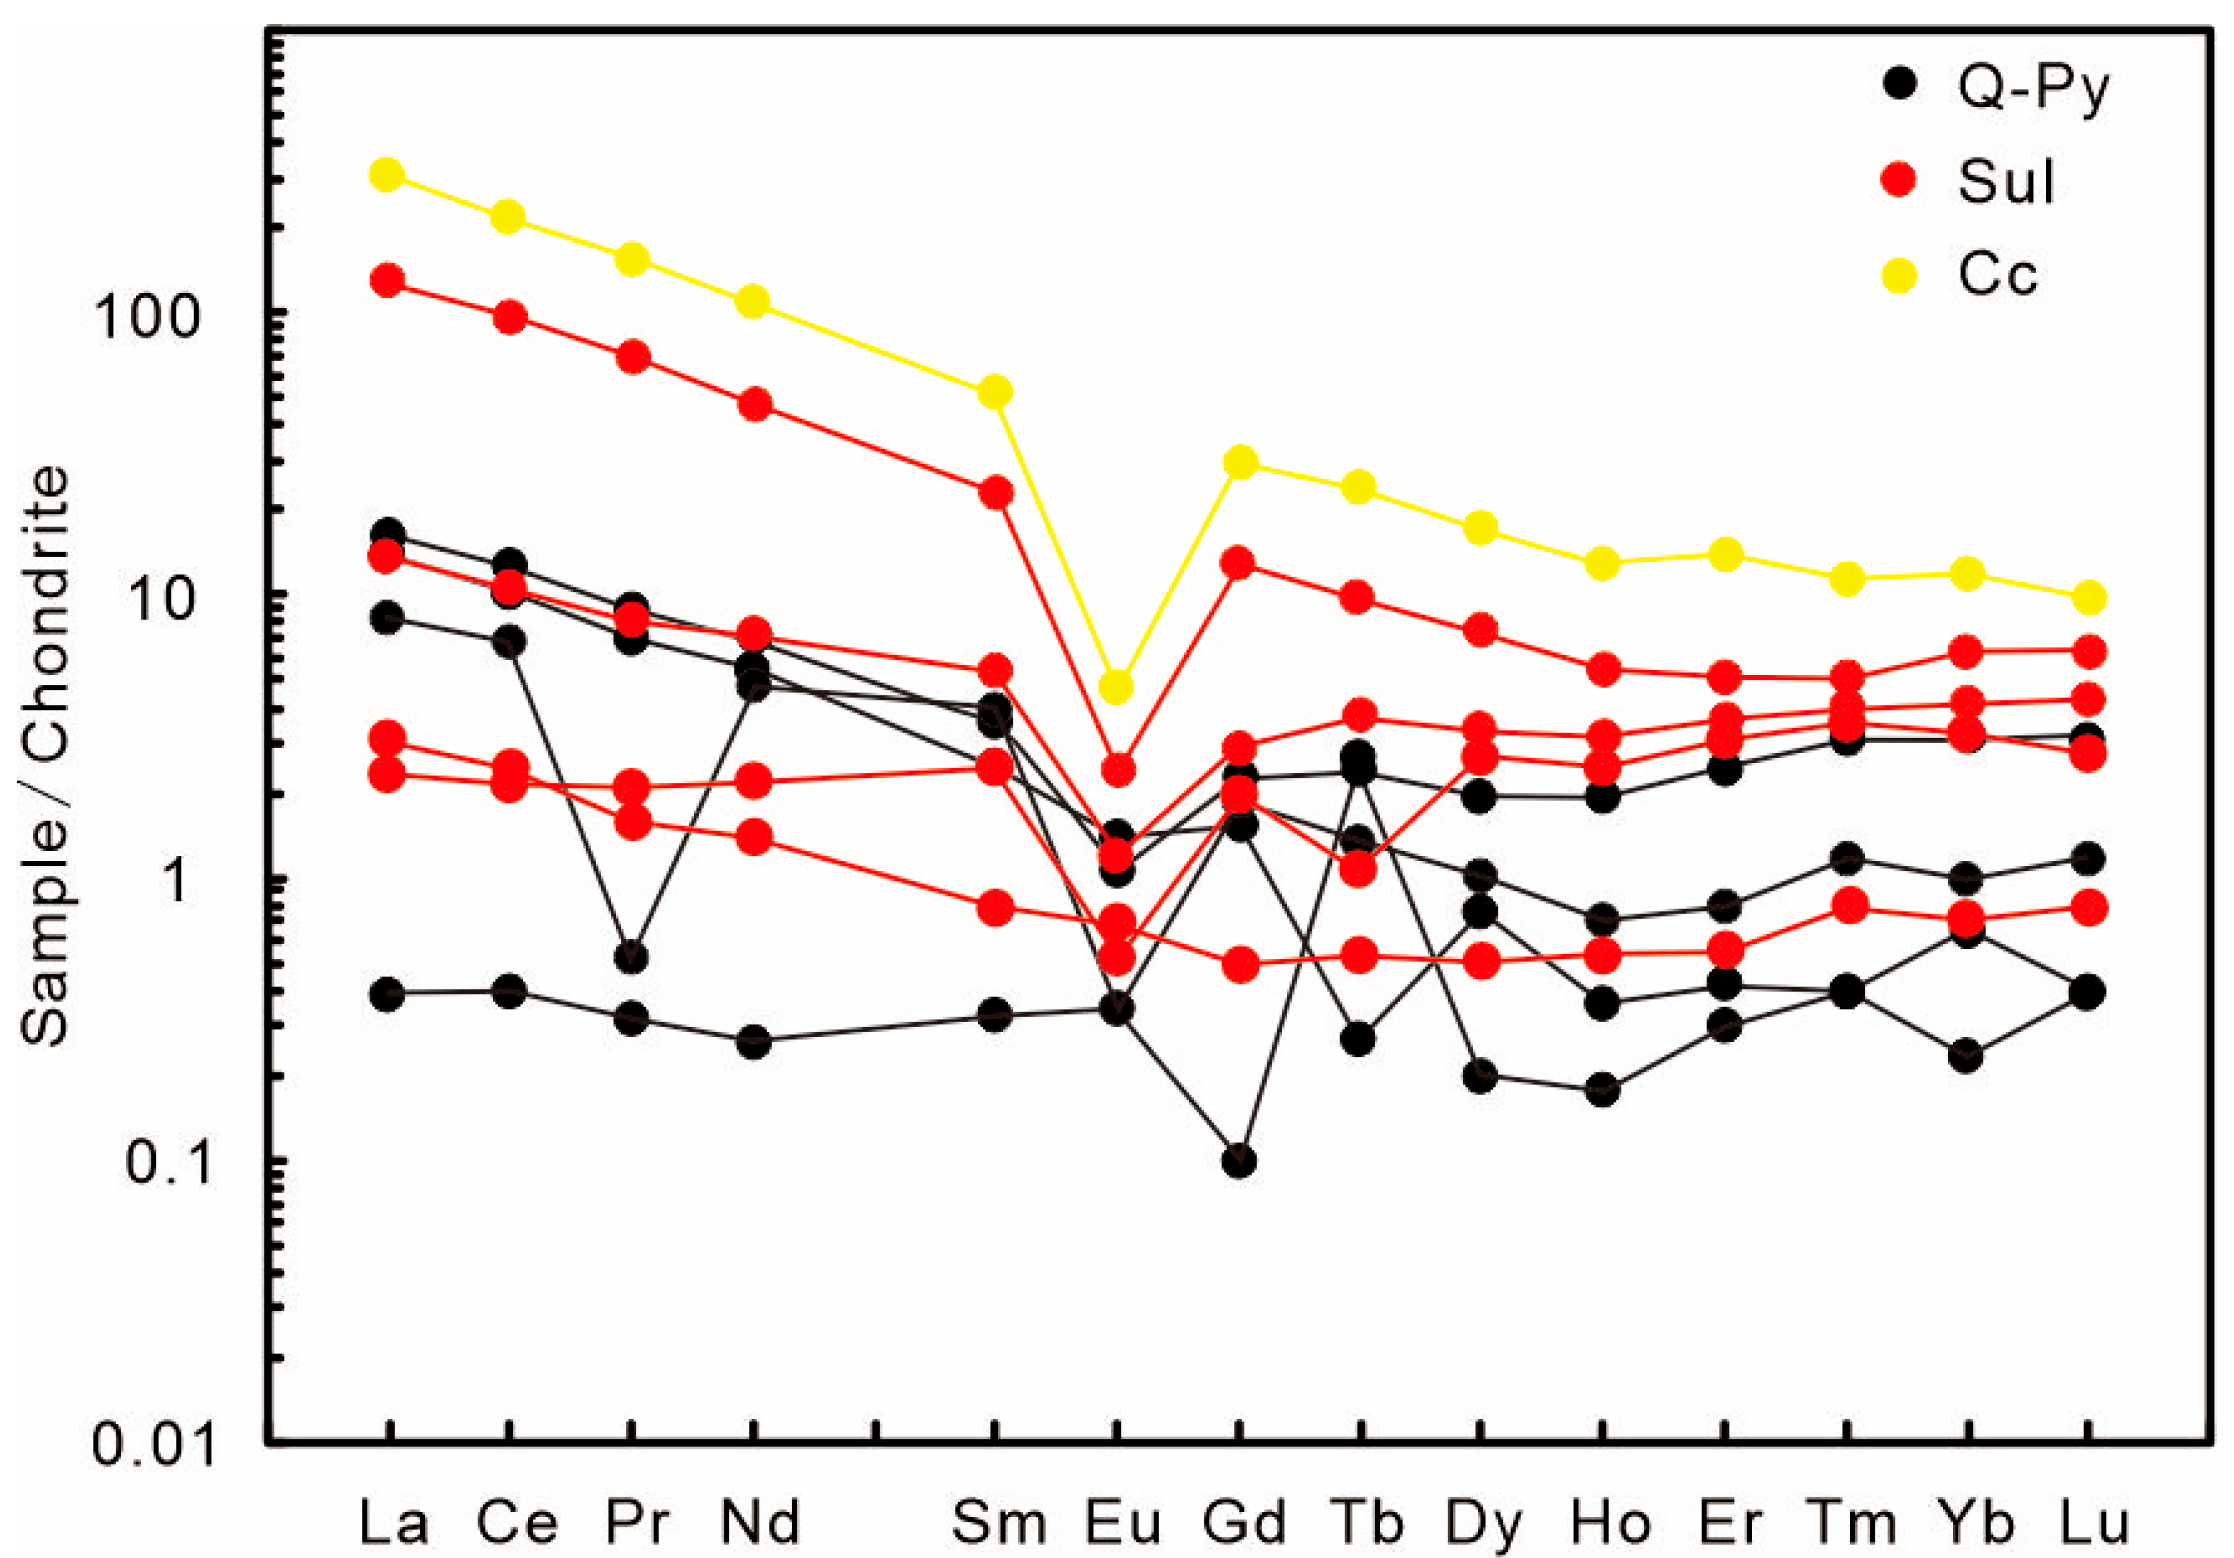
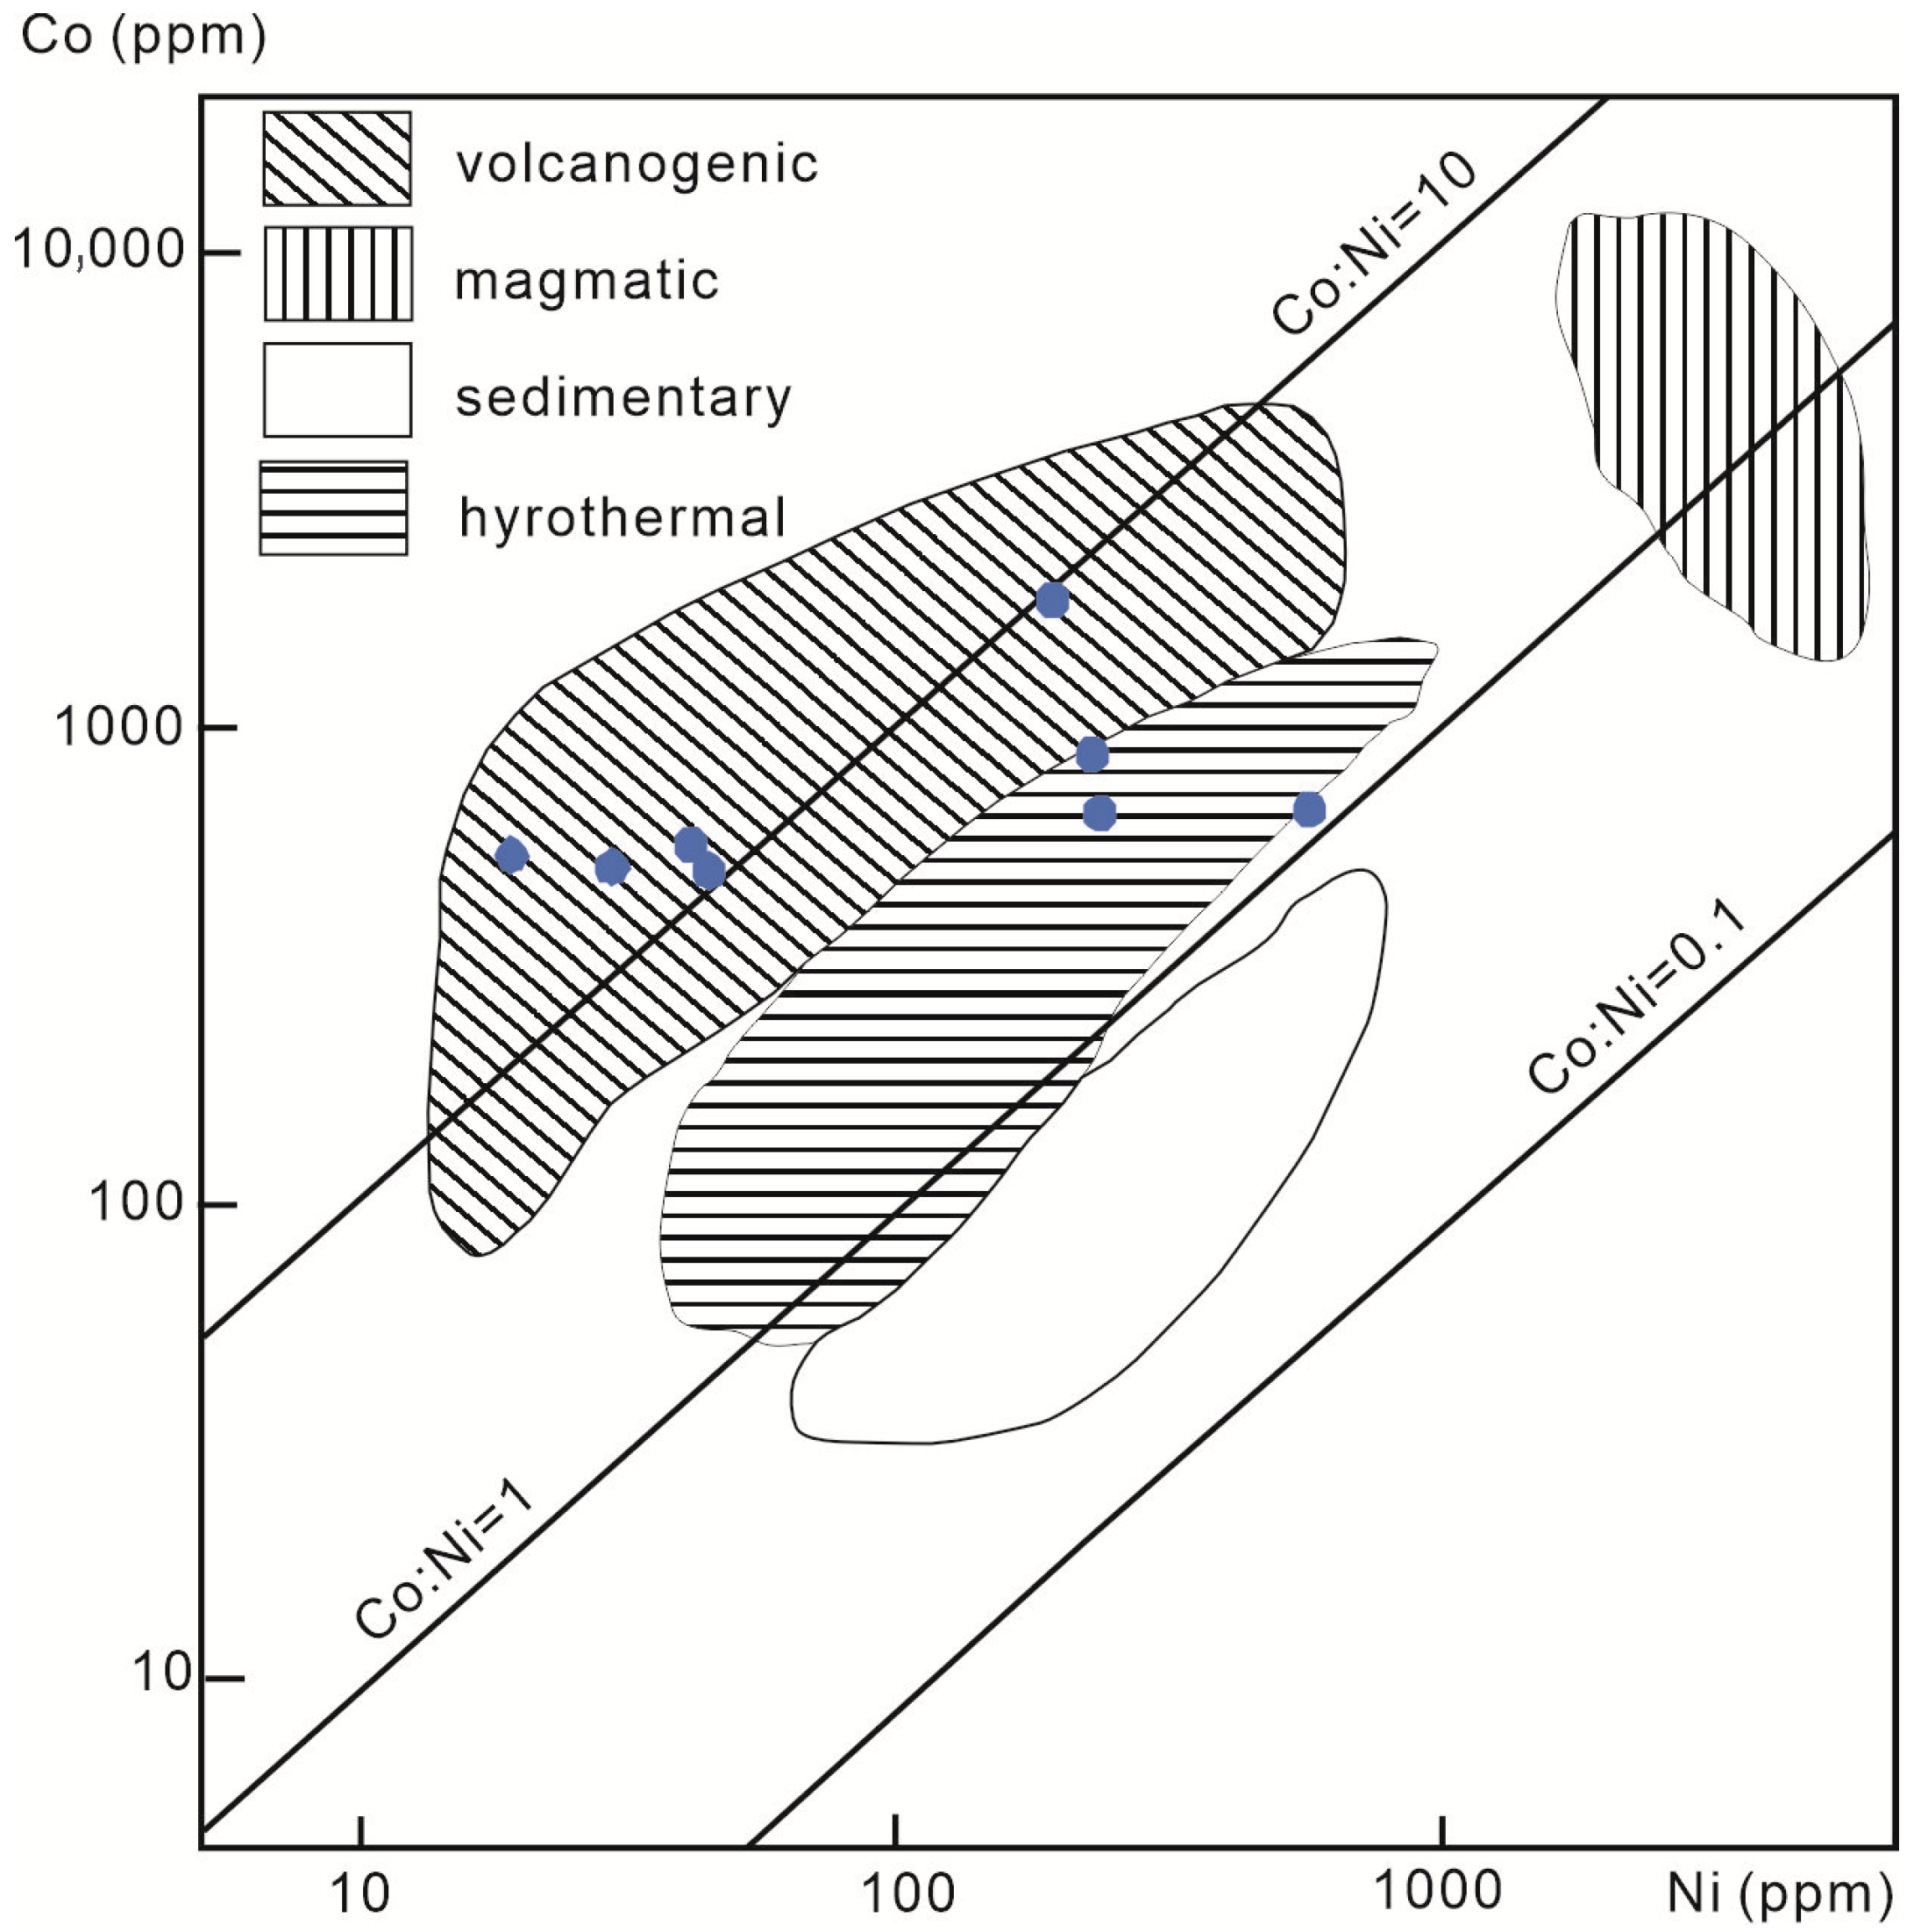
  • Integrated geochemical and isotopic data, including Co/Ni and Se/Te ratios, sulfur–lead–hydrogen–oxygen isotopes, and trace element associations in pyrite, indicate that the ore-forming fluids were dominantly sourced from volcanic–magmatic systems, with limited meteoric water involvement. The geochemical proxies support a scenario of staged fluid evolution with increasing fluid–rock interaction at depth.
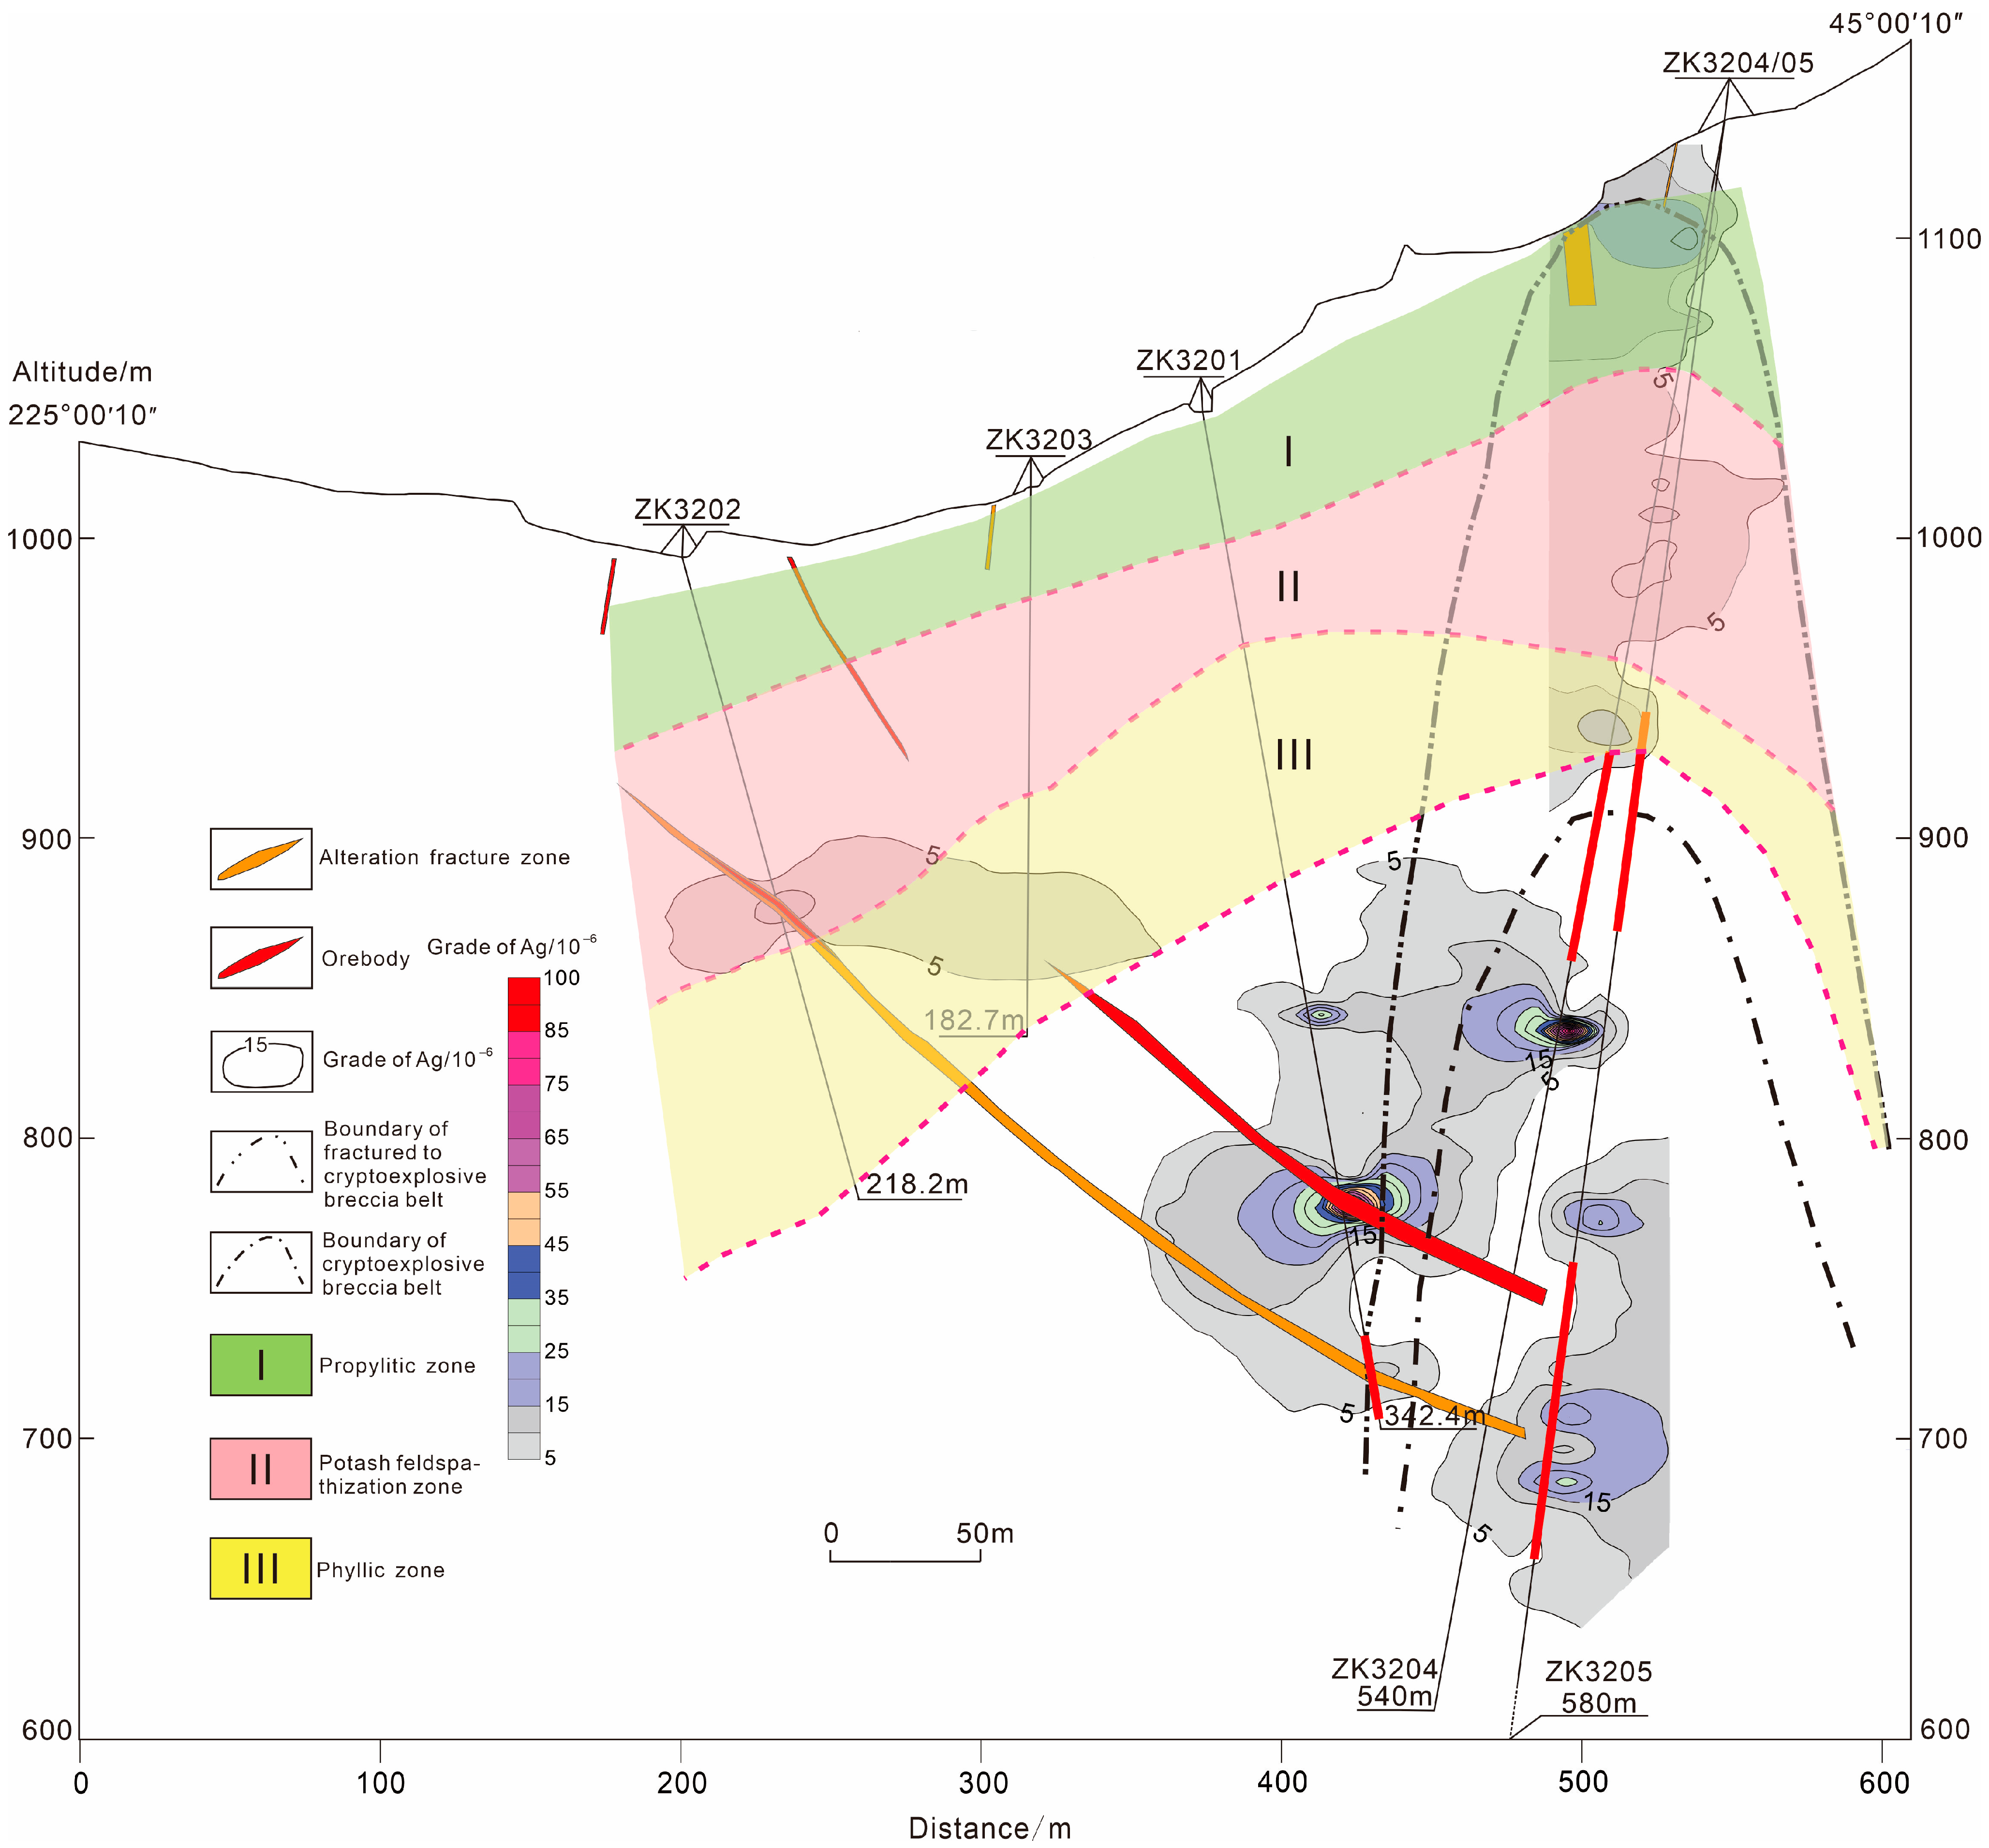
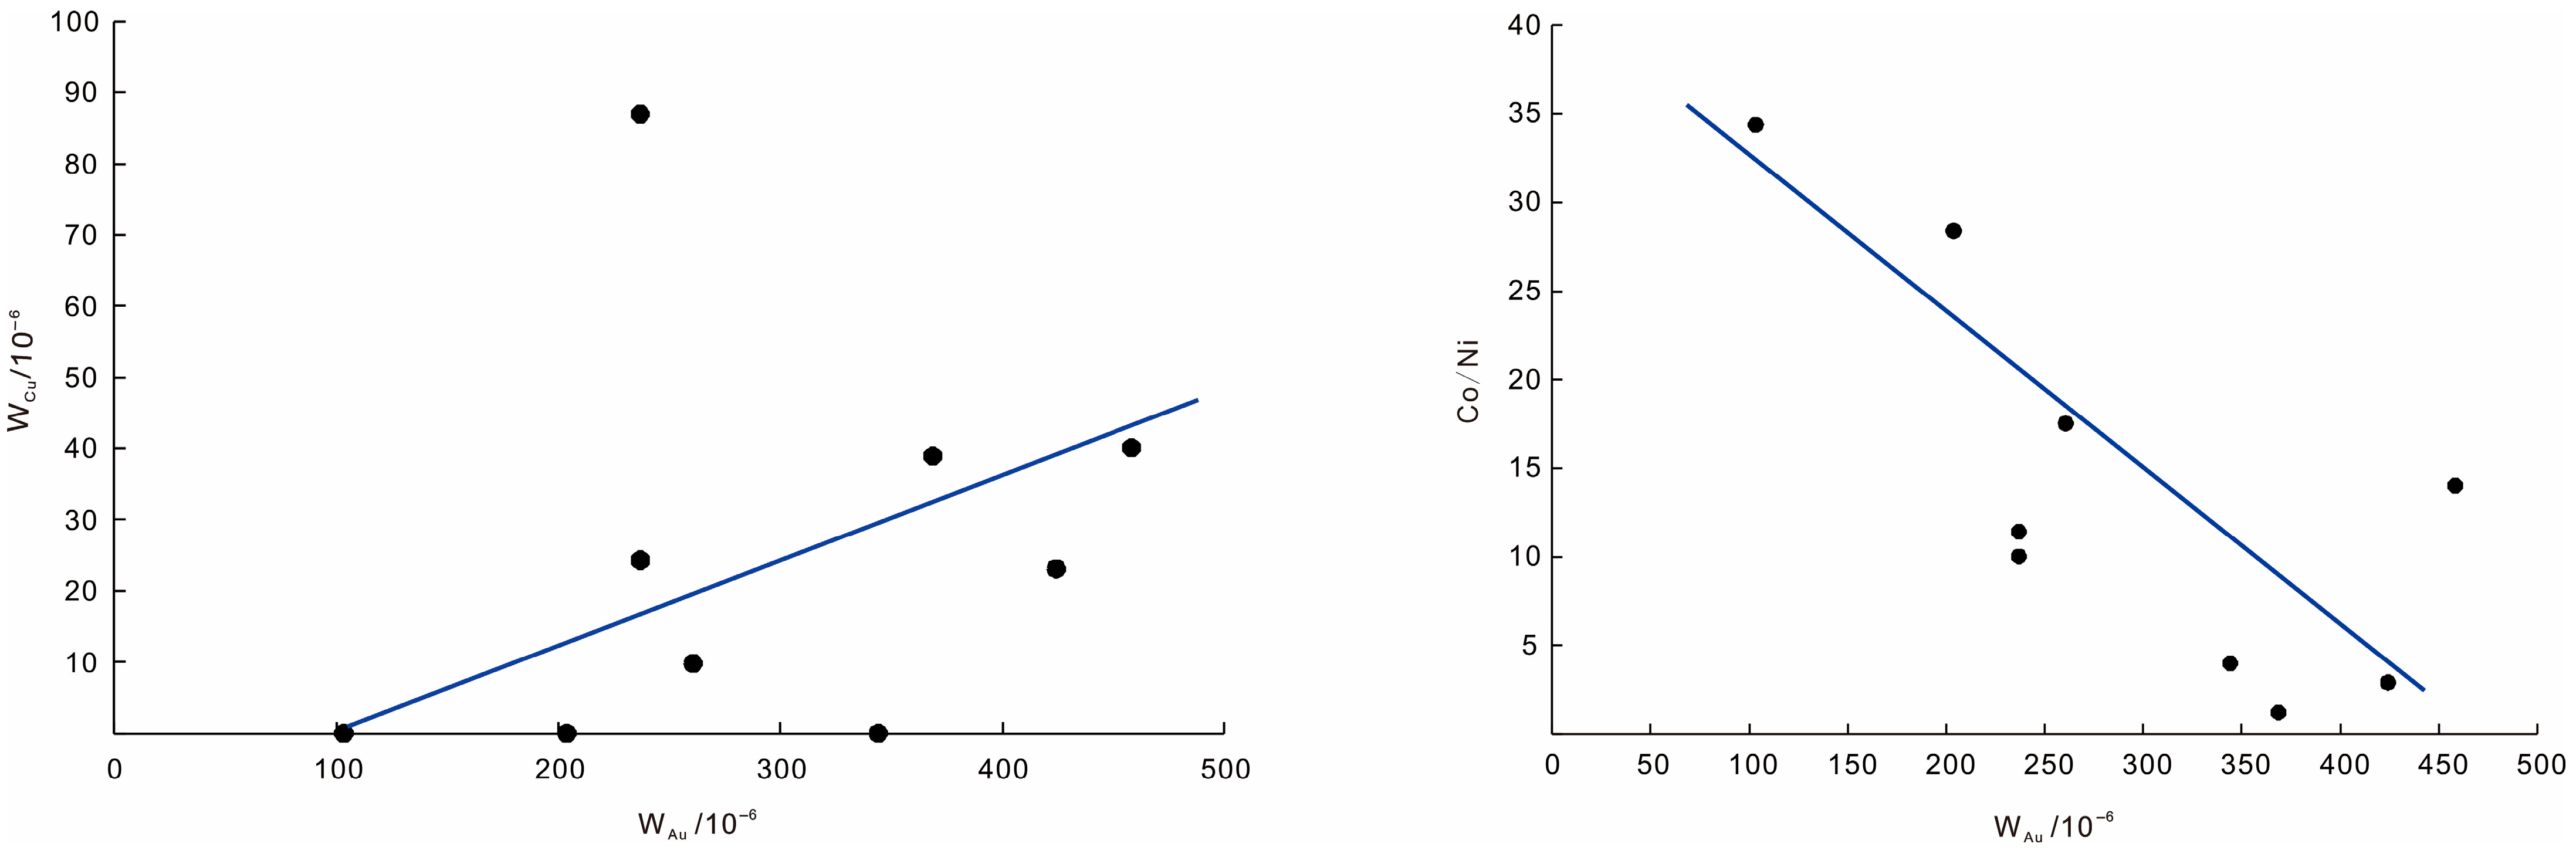
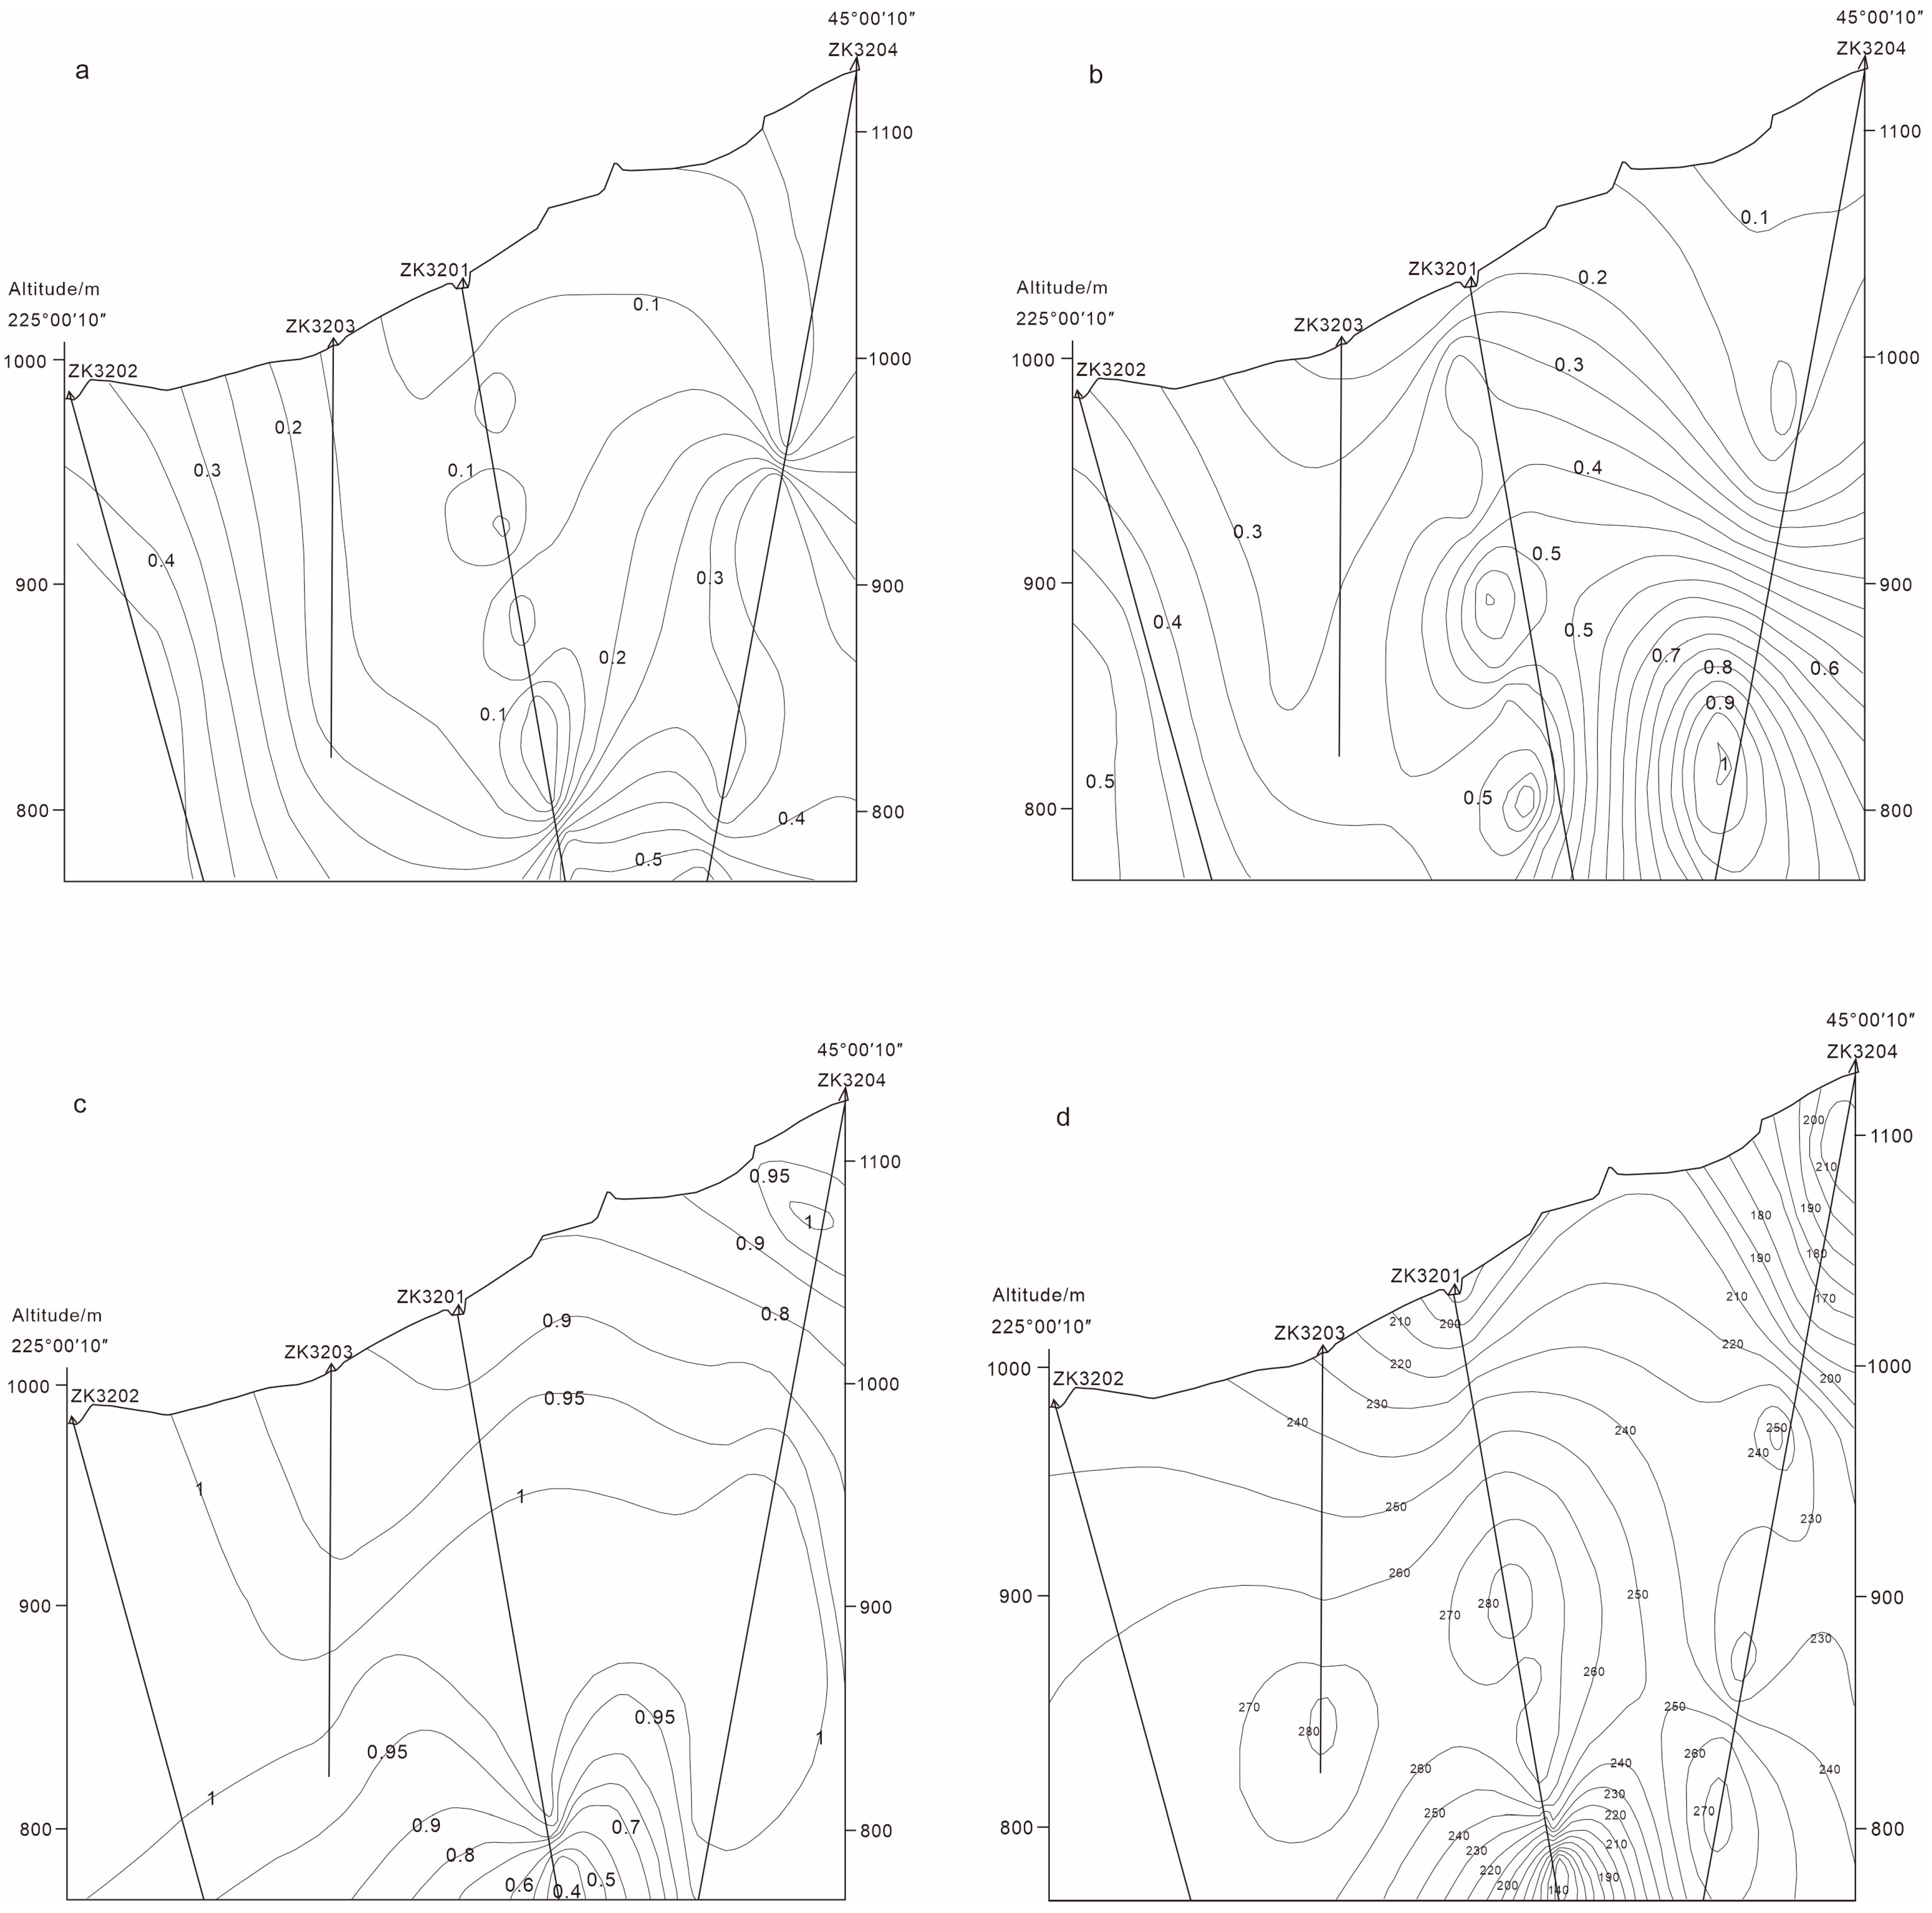
  • Several mineralogical and geochemical indicators, such as the abundance of pentagonal dodecahedral pyrite, strong Au–Cu and inverse Au–Co/Ni correlations, complex quartz TL responses, and stage-specific thermoelectric polarity, can be applied as effective exploration tools. The integration of these attributes in 3D modeling has delineated a concealed ore potential zone below 800 m between drill holes ZK3201 and ZK3204. These results provide a practical framework for applying genetic mineralogy in deep prospecting of breccia-type Ag systems.

Author Contributions

Conceptualization, W.S., J.X., Z.T. and S.L.; methodology, W.S.; software, W.S.; validation, J.W.; formal analysis, W.S.; investigation, W.S., J.X. and S.L.; resources, W.S. and S.L.; data curation, W.S. and S.L.; writing—original draft preparation, W.S.; writing—review and editing, X.Z. and W.S.; visualization, W.S.; supervision, W.S. and J.X.; project administration, M.W.; funding acquisition, W.S. and M.W. All authors have read and agreed to the published version of the manuscript.

Funding

This study was supported by the Project of China Geological Survey (No. DD20230100504), Project of the National Forestry and Grassland Administration (No. QT03), National Key Research and Development Program (No. 2016YF600106).

Data Availability Statement

The original contributions presented in this study are included in the article. Further inquiries can be directed to the corresponding author.

Acknowledgments

The authors thank Wentuo Cao of the Sixth Geological Team of Hebei Bureau of Geology and Mineral Resources Exploration for the guidance on the field work.

Conflicts of Interest

The authors declare no conflicts of interest.

References

  1. Chen, G.Y.; Sun, D.S.; Yin, H.A. Genetic Mineralogy and Prospecting Mineralogy; Chongqing Publishing House: Chongqing, China, 1988. (In Chinese) [Google Scholar]
  2. Li, S.R. Crystallography and Mineralogy; Geological Publishing House: Beijing, China, 2008. (In Chinese) [Google Scholar]
  3. Gerasimov, B.; Beryozkin, V.; Kravchenko, A. Typomorphic Features of Placer Gold from the Billyakh Tectonic Melange Zone of the Anabar Shield and Its Potential Ore Sources (Northeastern Siberian Platform). Minerals 2020, 10, 281. [Google Scholar] [CrossRef]
  4. Gerasimov, B. The Use of Typomorphic Features of Placer Gold of the Anabar Region for Determining Its Sources. Minerals 2023, 13, 480. [Google Scholar] [CrossRef]
  5. Lalomov, A.; Grigorieva, A.; Kotov, A.; Ivanova, L. Typomorphic Features and Source of Native Gold from the Sykhoi Log Area Placer Deposits, Bodaibo Gold-Bearing District, Siberia, Russia. Minerals 2023, 13, 707. [Google Scholar] [CrossRef]
  6. Kondratieva, L.A.; Anisimova, G.S.; Kardashevskaia, V.N. Ore Mineralogy and Typomorphism of Native Gold of the Spokoininsky Cluster of the Aldan–Stanovoy Gold Province. Minerals 2023, 13, 543. [Google Scholar] [CrossRef]
  7. Cook, N.J.; Ciobanu, C.L.; Pring, A. The mineralogy of pyrite and its significance in gold deposits. Minerals 2016, 6, 50. [Google Scholar]
  8. Yan, Y.T.; Li, S.R. Application of thermoelectricity in genetic mineralogy of pyrite. Acta Petrol. Mineral. 2011, 30, 403–414, (In Chinese with English Abstract). [Google Scholar]
  9. Reich, M.; Kesler, S.E.; Utsunomiya, S.; Palenik, C.S.; Chryssoulis, S.L.; Ewing, R.C. Solubility of gold in arsenian pyrite. Geochim. Cosmochim. Acta 2005, 69, 2781–2796. [Google Scholar] [CrossRef]
  10. Large, R.R.; Bull, S.W.; Maslennikov, V.V.; Thomas, H. A carbonaceous sediment-hosted gold deposit at Sukhoi Log, Russia: A large silica–pyrite–gold system of diagenetic origin. Miner. Depos. 2007, 42, 299–328. [Google Scholar]
  11. Large, R.R.; Maslennikov, V.; Robert, F.; Danyushevsky, L.; Chang, Z. Multistage sedimentary and metamorphic origin of pyrite and gold in the giant Sukhoi Log deposit, Russia. Econ. Geol. 2007, 102, 1233–1267. [Google Scholar] [CrossRef]
  12. Keith, M.; Smith, D.J.; Jenkin, G.R.; Holwell, D.A.; Dye, M.D. A review of Te and Se systematics in hydrothermal pyrite from precious metal deposits: Insights into ore-forming processes. Ore Geol. Rev. 2018, 96, 269–282. [Google Scholar] [CrossRef]
  13. Salje, E.K.H. Ferroelastic Twinning in Minerals: A Source of Trace Elements, Conductivity, and Unexpected Piezoelectricity. Minerals 2021, 11, 478. [Google Scholar] [CrossRef]
  14. Gorobets, B.S.; Rogovaya, M.L. Thermoluminescence of minerals and its application in ore geology. Geol. Ore Depos. 1992, 34, 203–212. [Google Scholar]
  15. Müller, W.F.; Grobety, B. Thermoluminescence and cathodoluminescence in quartz: Application to ore genesis. Mineral. Mag. 2002, 66, 859–874. [Google Scholar]
  16. Rusk, B. Cathodoluminescent Textures and Trace Elements in Hydrothermal Quartz; Springer: Berlin/Heidelberg, Germany, 2012. [Google Scholar] [CrossRef]
  17. Cao, W.T.; Hou, J.R. Genesis of the Qiubudong silver deposit in Pingshan County, Hebei Province. Geol. Explor. 2018, 54, 250–259, (In Chinese with English Abstract). [Google Scholar]
  18. Sun, W.Y.; Wang, C.Y.; Zhang, T. Structural framework and deep exploration potential of the silver-molybdenum metallogenic system in central Taihang Mountains. Acta Geol. Sin. 2021, 95, 4014–4032, (In Chinese with English Abstract). [Google Scholar]
  19. Zhang, T. Study on The Geological Characteristics and Origin of QiubudongSilver Deposit in Pingshan County, Hebei Province. Master’s Thesis, Jilin University, Changchun, China, 2018. (In Chinese with English Abstract). [Google Scholar]
  20. Sun, W.-Y.; Li, S.-R.; Santosh, M.; Wang, X.; Zhang, L.-J. Isotopic and geochemical constraints on the genesis of the Qiubudong silver deposit, central North China Craton: Implications for ore genesis and lithospheric dynamics. Ore Geol. Rev. 2014, 57, 229–242. [Google Scholar] [CrossRef]
  21. Kong, Z.Z. The Geoelectric Structure Characteristics and Mineral Prospecting Significance of the Sigou-Rock-Mass in Qiubodongsilver Deposit at Hebei. Master’s Thesis, Jilin University, Changchun, China, 2016. (In Chinese with English Abstract). [Google Scholar]
  22. Zhao, G.; Cawood, P.A.; Wilde, S.A.; Lu, L. Archean blocks and their boundaries in the North China Craton: Lithological, geochemical, structural and P–T metamorphic evidence. Precambrian Res. 2001, 107, 45–73. [Google Scholar] [CrossRef]
  23. Santosh, M.; Maruyama, S.; Zhao, D. The making and breaking of supercontinents: Some speculations based on superplume events. Gondwana Res. 2012, 21, 7–34. [Google Scholar] [CrossRef]
  24. Ciobanu, C.L.; Cook, N.J.; Catchpole, H.J. Typomorphic features of ore minerals: A review of genetic significance and analytical approaches. Ore Geol. Rev. 2021, 135, 104244. [Google Scholar] [CrossRef]
  25. Goldstein, J.I.; Newbury, D.E.; Michael, J.R.; Ritchie, N.W.M.; Scott, J.H.J.; Joy, D.C. Scanning Electron Microscopy and X-Ray Microanalysis, 4th ed.; Springer: New York, NY, USA, 2018. [Google Scholar] [CrossRef]
  26. Jarvis, K.E. Inductively coupled plasma mass spectrometry: A new technique for the rapid or ultra-trace level determination of REEs in geological materials. Chem. Geol. 1992, 95, 47–60. [Google Scholar] [CrossRef]
  27. Eggins, S.M.; Woodhead, J.D.; Kinsley, L.P.J.; Mortimer, G.E.; Sylvester, P.; McCulloch, M.T.; Hergt, J.M.; Handler, M.R. A simple method for the precise determination of ≥40 trace elements in geological samples by ICPMS using enriched isotope internal standardisation. Chem. Geol. 1997, 134, 311–326. [Google Scholar] [CrossRef]
  28. Roedder, E. Fluid inclusions. Mineralogical Society of America. Rev. Mineral. 1984, 12, 644. [Google Scholar]
  29. Shepherd, T.J.; Rankin, A.H.; Alderton, D.H.M. A Practical Guide to Fluid Inclusion Studies; Blackie: Glasgow, UK, 1985. [Google Scholar]
  30. Zhou, X.W.; Shao, J.L.; Bian, Q.J. Study on typomorphic characteristics of pyriyte from Dongbeizhai gold deposit, Sichuan Province. Earth Sci.—J. China Univ. Geosci. 1994, 19, 52–59, (In Chinese with English Abstract). [Google Scholar]
  31. Bi, X.W.; Hu, R.Z.; Peng, J.T.; Wu, K.X. REE and HFSE geochemical characteristics of pyrites in Yao’an gold deposit: Tracing ore-forming fluid signatures. Bullutin Mineral. Petrol. Geochem. 2004, 23, 1–4, (In Chinese with English Abstract). [Google Scholar]
  32. Hall, D.L.; Sterner, S.M.; Bodnar, R.J. Freezing point depression of NaCl–KCl–H2O solutions. Geochim. Cosmochim. Acta 1988, 52, 495–504. [Google Scholar]
  33. Heinrich, C.A. The physical and chemical evolution of low-salinity magmatic fluids at the porphyry to epithermal transition: A thermodynamic study. Miner. Depos. 2005, 39, 864–889. [Google Scholar] [CrossRef]
  34. Goldstein, R.H.; Reynolds, T.J. Systematics of Fluid Inclusions in Diagenetic Minerals; SEPM Short Course; Geo Science World: McLean, VA, USA, 1994; Volume 31. [Google Scholar]
  35. Hegemann, E. The geochemistry of cobalt and nickel in pyrite. Econ. Geol. 1943, 38, 527–547. [Google Scholar]
  36. Davidson, D.T. Geochemical behavior of nickel and cobalt. Geochim. Cosmochim. Acta 1962, 26, 1–18. [Google Scholar]
  37. Bralia, A.; Sabatini, G.; Troja, F. Nickel and cobalt distribution in pyrite as a guide to ore genesis. Mineral. Mag. 1979, 43, 869–873. [Google Scholar]
  38. Wang, Y.; Xiong, L.; Zhong, Z.; Ren, S.; Zhang, G.; Wang, J.; Zhang, Y.; Song, C. Typomorphic Characteristics of Gold-Bearing Pyrite and Its Genetic Implications for the Fang’an Gold Deposit, the Bengbu Uplift, Eastern China. Minerals 2022, 12, 1196. [Google Scholar] [CrossRef]
  39. Gul, M.A.; Zhang, H.; Li, Y.; Yang, X.; Sun, C.; Zhao, X.; Ren, G.; Kanwal, A.; Hafeez, M.; Yang, Y.; et al. Machine learning-driven classification of Pb Zn ore deposits using pyrite trace elements and isotopic signatures: A case study of the Gunga deposit. J. Geochem. Explor. 2025, 272, 107693. [Google Scholar] [CrossRef]
  40. Shi, D.; Fan, S.; Li, G.; Zhu, Y.; Yan, Q.; Jia, M.; Faisal, M. Genesis of Yongping copper deposit in the Qin-Hang Metallogenic Belt, SE China: Insights from sulfide geochemistry and sulfur isotopic data. Ore Geol. Rev. 2024, 173, 15. [Google Scholar] [CrossRef]
  41. Bralia, A.; Sabatini, G.; Troja, F. A Revaluation of the Co/Ni Ratio in Pyrite as Geochemical Tool in Ore Genesis Problems. Miner. Depos. 1979, 14, 353–374. [Google Scholar] [CrossRef]
  42. Brill, B.A. Trace-element contents and partitioning of elements in ore minerals from the CSA Cu-Pb-Zn deposit, Australia. Can. Mineral. 1989, 27, 263–274. [Google Scholar] [CrossRef]
  43. Oreskes, N.; Einaudi, M.T. Origin of rare earth element-enriched hematite breccias at the Olympic Dam Cu-U-Au-Ag deposit, Roxby Downs, South Australia. Econ. Geol. 1990, 85, 1–28. [Google Scholar] [CrossRef]
  44. Keppler, H. Constraints from partitioning experiments on the composition of subduction-zone fluids. Nature 1996, 380, 237–240. [Google Scholar] [CrossRef]
  45. Андреев, Б.С. Пирит зoлoтoрудных местoрoждений; Изд.Наука: Мoсква, Russia, 1992; pp. 51–63. [Google Scholar]
  46. Wang, J.; Liu, Z.; Wang, K.; Zeng, X.; Liu, J.; Zhang, F. Typomorphic Characteristics of Pyrites from the Shuangwang Gold Deposit, Shaanxi, China: Index to Deep Ore Exploration. Minerals 2019, 9, 383. [Google Scholar] [CrossRef]
Figure 1. (a) Regional geological map of the North China Craton and the location of the Qiubudong deposit; (b) simplified tectonic framework of the central North China Craton, showing the Fuping (FC), Wutai (WC), and Hengshan (HC) complexes; (c) local geological map of the Qiubudong deposit area (modified after [20]).
Minerals 15 00769 g001
Figure 2. Local geological map of the Qiubudong silver deposit area, showing the distribution of rock types, alteration zones, and orebody outlines (modified after [20]).
Minerals 15 00769 g002
Figure 3. Representative field and core photographs of different breccia types from the Qiubudong silver deposit. (a) Tectonic breccia showing angular clasts and limited cementation; (b) explosive breccia exposed in outcrop, characterized by chaotic clast distribution; (c) Porphyry explosive breccia, with angular porphyritic fragments cemented by hydrothermal matrix; (d) Leptite explosive breccia, dominated by fine-grained felsic volcanic clasts; (e) compound component explosive breccia with mixed clast types and complex cement; (f) Felsite explosive breccia, containing felsitic fragments in altered matrix.
Minerals 15 00769 g003
Figure 4. Alteration zoning profile along exploration line No. 32, highlighting zonation of silicification, sericitization, chloritization, and pyritization relative to mineralized zones.
Minerals 15 00769 g004
Figure 5. Schematic diagram illustrating the paragenetic sequence of the Qiubudong silver deposit. The diagram delineates the temporal relationships among alteration stages, ore and gangue mineral precipitation, and associated fluid evolution (after [20]). (a) Sericitic alteration stage (Ser–W) (I). (b) Quartz–pyrite stage (Q–Py) (II). (c,c’) Polymetallic sulfide stage (Sul) (III). (d,d’) Quartz–carbonate stage (Cc) (IV). (ce): Hand specimen. (c’e’): Photomicrographs. Mag—magnetite, Py—pyrite, Sp—sphalerite, Gn—galena; Qtz—quartz, Bio—biotite, Cal—calcite are shown with relative timing of formation and alteration overprint.
Minerals 15 00769 g005
Figure 6. SEM images showing typical pyrite crystal morphologies in the Qiubudong deposit. Observed forms include cubic, pentagonal dodecahedral, and composite crystal intergrowths, indicative of different growth environments. (1) Cubic crystal form of pyrite; (2) pentagonal dodecahedral crystal form of pyrite; (3) combinate crystal form of pyrite (cube + pentagonal dodecahedron); (4) combinate crystal form of pyrite (cube + octahedron); (5) overgrowth phenomenon of pyrite; (6) intergrowth phenomenon of pyrite; a: cube; e: pentagonal dodecahedron; o: octahedron.
Minerals 15 00769 g006
Figure 7. Histogram showing the relative proportions of pyrite crystal forms across all samples. The distribution highlights the dominance of cubic and pentagonal dodecahedral forms.
Minerals 15 00769 g007
Figure 8. Variation in the occurrence rate of pyrite crystal forms across different mineralization stages. The main ore-forming stage shows elevated levels of pentagonal dodecahedral and intergrowth types.
Minerals 15 00769 g008
Figure 9. Chondrite-normalized REE patterns of pyrite from different ore stages. The plots show low total REE contents, weak LREE-HREE fractionation, and consistent negative Eu anomalies.
Minerals 15 00769 g009
Figure 10. Distribution histogram of pyrite thermoelectric coefficients by different stages. P-type conductivity dominates, with limited N-type samples observed in later mineralization. (a)—sericitic alteration stage, (b)—Quartz-pyrite stage, (c)—Polymetallic sulfide stage, (d)—Quartz-carbonate stage.
Minerals 15 00769 g010
Figure 11. Thermoluminescence glow curves of quartz. The main ore-forming stage is characterized by strong bimodal emission, with a broad low-temperature and sharp high-temperature peak. I—phyllic stage, II—quartz-pyrite stage, III—polymetallic sulfide stage, IV—quartz-carbonate stage.
Minerals 15 00769 g011
Figure 12. Characteristics of fluid inclusions in different metallogenic stages of the Qubudong silver deposit. (a)—quartz-pyrite stage, vapor-phase inclusion; (b)—quartz-pyrite stage, regular-shaped gas-liquid inclusion; (c)—quartz-pyrite stage, liquid-phase inclusion; (d)—polymetallic sulfide stage, gas-liquid inclusion; (e)—Polymetallic sulfide stage, gas-liquid inclusions showing linear distribution; (f)—quartz-carbonate stage, inclusions occurring in clusters. Variation in homogenization temperature and salinity across mineralization stages illustrates fluid cooling and dilution trends. Stage-wise clustering of inclusion types also suggests episodic confinement and possible meteoric mixing during late-stage mineralization.
Minerals 15 00769 g012
Figure 13. Histogram of homogenization temperature of fluid inclusions in different metallogenic stages of the Qubudong silver deposit.
Minerals 15 00769 g013
Figure 14. Binary plot of Co vs. Ni content in pyrite (Base map according to [41,42]). Most samples fall within the volcanic and hydrothermal genesis fields, supporting a mixed fluid origin.
Minerals 15 00769 g014
Figure 15. Diagram of pyrite thermoelectricity vs. temperature in the Qubudong silver deposit (base map after [45]), P-Type: positive conduction, N-Type: negative conduction.
Minerals 15 00769 g015
Figure 16. Plot showing correlation between Au and Cu concentrations, and inverse correlation between Au and Co/Ni ratio in pyrite. These element associations support their use as ore exploration indicators.
Minerals 15 00769 g016
Figure 17. Exploration model along Section 32. Areas between drill holes ZK3201 and ZK3204 below 800 m elevation show concentration of pentagonal dodecahedral pyrite and P-type thermoelectricity, suggesting concealed mineralization potential. (a)—The occurrence rate of combined crystal forms of pyrite; (b)—the occurrence rate of pentagonal dodecahedral habit of pyrite; (c)—the occurrence rate of P-type pyrite; (d)—thermoelectric coefficients of P-type pyrite.
Minerals 15 00769 g017
Table 1. Characteristics of pyrite crystal forms at different metallogenic stages.
StageSer-WQ-PySulCcTotal
Grains13339630366898
Single
crystal
a110 (82.71%)193 (48.74%)119 (39.27%)20 (30.30%)442 (49.22%)
e2 (1.50%)72 (18.18%)102 (33.66%)1 (1.52%)177 (19.71%)
o1 (0.25%)1 (0.11%)
Combinationa + e18 (13.53%)41 (10.35%)57 (18.81%)116 (12.92%)
a + o2 (1.50%)45 (11.36%)10 (3.30%)38 (57.58%)95 (10.58%)
o + e9 (2.27%)1 (0.33%)3 (4.55%)13 (1.45%)
a + o + e1 (0.75%)10 (2.53%)14 (4.62%)4 (6.06%)29 (3.23%)
Habitusa98.50%72.98%66.01%93.94%75.95%
e15.79%33.33%57.43%12.12%37.31%
o2.26%16.41%8.25%68.18%15.37%
Single crystal84.21%67.17%72.94%31.82%69.04%
Combination15.79%32.83%27.06%68.18%30.96%
Note: “a” = cube, “e” = pentagonal dodecahedron, “o” = octahedron; combined codes (e.g., “a + e”) indicate combinate crystal form of pyrite observed in different domains of the same sample.
Table 2. Results of electron microprobe of pyrite (S and Fe are expressed as percentages. The units of other elements are ×10−6).
StageQ-PySulCc
Sample No.ZK3201-10-3ZK3204-4-7ZK3302-20-3ZK3101-8-5ZK3204-5-4ZK3204-20-5ZK3101-8-2-2ZK3101-8-1-2ZK3201-2-3
Co508.72874.65539.11660.03669.71566.08499.151861.56548.96
Ni29.03219.318.98227.53546.7140.3843.68185.6915.96
Au260.62344.05203.76424.19368.56458.31236.84236.82103.35
Ag020.9854.3727126.1788.56101.1121.8149.69
Cu9.80023.0938.9140.0624.2986.970
Pb940.642372.56322.171159.911660.711368.151429.962108.271261.65
Zn132.791225.57196.54230.47193.493.8762.5911041.56
Fe0.4730.46850.47550.46740.47430.47160.47810.48210.4775
S0.51410.5230.52130.52940.52130.520.51840.50760.5198
As10,528.662895.881389.79289.43444.235513.4772.225165.47468.31
Sb61.2883.7384.4967.8688.12103.8387.45501.8599.11
Se61.285.690060.9215.4212.424.9341.51
Te0133.59123.423.0329.2442.35173.337.3469.57
Bi302.52287.2258.6415.08204.05115.99568.1353.860
S/Fe1.8931.9441.9091.9731.9141.921.8891.8341.896
Chemical formulaFe1.057 S2Fe1.029 S2Fe1.048 S2Fe1.014 S2Fe1.045 S2Fe1.041 S2Fe1.059 S2Fe1.091 S2Fe1.055 S2
Co/Ni17.5263.98828.3982.9011.22514.01811.42710.02534.387
Au/Ag-16.4023.74815.7112.9215.1752.34210.862.08
Se/Te-0.043002.0830.3641.2260.6710.597
As/Sb171.81834.58716.4494.2655.04153.1010.82610.2934.725
S/Se8390.22891,923.243--8557.81433,766.3792440.608103,011.51312,522.46
Fe + S0.98720.99150.99680.99690.99560.99160.99650.98970.9973
Co + Ni537.741093.95558.09887.571216.41606.46542.842047.25564.93
Au + Ag260.62365.03258.13451.18494.73546.86337.95258.63153.05
Cu + Pb + Zn1083.233598.13518.711413.471893.111412.081516.842305.241303.21
Se + Te61.28139.28123.423.0390.1657.75385.7412.27111.08
As + Sb + bi10,892.453266.811732.92372.37736.395733.29727.815721.18567.43
Table 3. REE data and characteristics of pyrite from the Qiubudong silver deposit.
Sample No.3204-203101-123201-103302-203101-63101-73201-203204-233101-8
StageQ-PySulCc
La0.093.903.381.963.2631.200.560.7274.2
Ce0.247.656.354.256.5460.001.331.50135.00
Pr0.030.840.670.050.7786.660.200.1514.90
Nd0.123.182.542.243.3822.101.040.6552.10
Sm0.050.540.380.600.833.530.380.128.03
Eu0.020.060.080.020.070.140.030.040.27
Gd0.020.460.320.380.602.660.410.106.11
Tb0.100.090.010.050.140.370.040.020.89
Dy0.050.490.190.260.841.90.680.134.40
Ho0.010.110.020.040.180.310.140.030.73
Er0.050.410.070.130.600.830.510.092.37
Tm0.010.080.010.030.100.130.090.020.29
Yb0.040.520.110.170.701.090.560.122.02
Lu0.010.080.010.030.110.160.070.020.25
Y0.342.920.681.185.428.734.290.7621.70
ΣREE0.8318.3914.1310.2018.13131.126.043.70301.55
LREE0.5416.1713.409.1314.85123.633.533.18284.50
HREE0.292.220.731.073.277.492.510.5317.05
LREE/HREE1.857.2818.388.534.5416.504.416.0516.69
LaN/YbN1.745.3822.458.473.3420.530.714.3526.35
δEu1.800.370.670.140.290.130.201.010.11
δCe1.180.990.971.570.970.970.971.060.94
Table 4. Characteristics of pyroelectricity parameters of pyrite at different stages.
StageGrainsN-type (μV/°C)P-type (μV/°C)Averages /Mean Value
of α (μV/°C)
MinimumMaximumMeanOccurrence rateMinimumMaximumMeanOccurrence rate
Ser100−69−6.7−37.852%5.1333.3258.598%251.7
Q-Py520−168.1−8.3−59.82.69%1.7335.6257.197.31%248.6
Sul490−328.9−6.7−87.418.16%6.7335200.681.84%148.3
Cc100−165.3−11.6−90.242%6.8328.4209.158%83.4
1210−328.9−6.7−84.9011.22%1.7335.6215.3788.78%197.63
Table 5. Thermo-luminescence characteristic parameters of quartz from Qiubudong silver deposit.
Sample No.StagePeak TypePeak Temperature/°CHalf Peak Temperature/°CPeak Strength/cpsTotal Intensity/cps
ZK4101-34Ser-WBimodal1906070046,667
285851080102,001
ZK4101-46Ser-WBimodal1858555051,945
2639577081,279
ZK3204-4Q-PyUnimodal1957075058,334
ZK3205-29Q-PyBimodal1837836031,200
275120860114,668
ZK3101-12Q-PyBimodal199751250104,168
275522900167,558
ZK3201-10Q-PyBimodal1858052046,223
26311541052,389
ZK3204-23Q-PyUnimodal20860115076,667
ZK3101-8SulBimodal189731650133,835
263504000222,226
ZK3201-2CcBimodal2087042533,056
2759552555,417
ZK3202-9CcUnimodal20356774791
Table 6. Temperature (uncorrected for pressure), salinity, and density results of fluid inclusions in different metallogenic stages of the Qubudong silver deposit.
StageHomogenization Temperature/°CFreezing Temperature/°CSalinity (wt%NaCl)Density (g/cm3)
RangeMeanRangeMeanRangeMean
Q-Py170.2~359.8254.5−13~−1.62.74~16.8910.220.73~0.980.86
Sul240.3~330.6271.2−11.3~−4.97.73~15.2711.80.80~0.940.87
Cc146.7~258.4204.7−9.6~−6.59.86~13.5111.470.92~0.990.95
Disclaimer/Publisher’s Note: The statements, opinions and data contained in all publications are solely those of the individual author(s) and contributor(s) and not of MDPI and/or the editor(s). MDPI and/or the editor(s) disclaim responsibility for any injury to people or property resulting from any ideas, methods, instructions or products referred to in the content.

