Article

Magmatic Evolution at the Saindak Cu-Au Deposit: Implications for the Formation of Giant Porphyry Deposits

1
MNR Key Laboratory for the Study of Focused Magmatism and Giant Ore Deposits, Xi’an Center of Geological Survey, CGS, Xi’an 710054, China
2
Geological Survey of Pakistan, Islamabad 44000, Pakistan
3
School of Earth Sciences, China University of Geosciences (Wuhan), Wuhan 430074, China
4
School of Earth and Space Sciences, University of Science and Technology of China, Hefei 230026, China
5
Department of Earth and Environmental Sciences, School of Engineering and Applied Sciences, Bahria University, Islamabad 44000, Pakistan
*
Author to whom correspondence should be addressed.
Minerals 2025, 15(8), 768; https://doi.org/10.3390/min15080768
Submission received: 11 June 2025 / Revised: 15 July 2025 / Accepted: 16 July 2025 / Published: 22 July 2025
(This article belongs to the Section Mineral Deposits)

Abstract

The Chagai porphyry copper belt is a major component of the Tethyan metallogenic domain, which spans approximately 300 km and hosts several giant porphyry copper deposits. The tectonic setting, whether subduction-related or post-collisional, and the deep dynamic processes governing the formation of these giant deposits remain poorly understood. Mafic microgranular enclaves (MMEs), mafic dikes, and multiple porphyries have been documented in the Saindak mining area. This work examines both the ore-rich and non-ore intrusions in the Saindak porphyry Cu-Au deposit, using methods like molybdenite Re-Os dating, U-Pb zircon ages, Hf isotopes, and bulk-rock geochemical data. Geochronological results indicate that ore-fertile and barren porphyries yield ages of 22.15 ± 0.22 Ma and 22.21 ± 0.33 Ma, respectively. Both MMEs and mafic dikes have zircons with nearly identical 206Pb/238U weighted mean ages (21.21 ± 0.18 Ma and 21.21 ± 0.16 Ma, respectively), corresponding to the age of the host rock. Geochemical and Sr–Nd–Hf isotopic evidence indicates that the Saindak adakites were generated by the subduction of the Arabian oceanic lithosphere under the Eurasian plate, rather than through continental collision. The adakites were mainly formed by the partial melting of a metasomatized mantle wedge, induced by fluids from the dehydrating subducting slab, with minor input from subducted sediments and later crust–mantle interactions during magma ascent. We conclude that shallow subduction of the Arabian plate during the Oligocene–Miocene may have increased the flow of subducted fluids into the sub-arc mantle source of the Chagai arc. This process may have facilitated the widespread deposition of porphyry copper and copper–gold mineralization in the region.

1. Introduction

Porphyry Cu(-Au) deposits, the largest and most significant sources of Cu and Au in the world, are primarily found in convergent geotectonic settings, such as island arcs and continental arcs in conjunction with basic to intermediate calc-alkaline silicic magmas that are associated with subduction [1,2,3,4,5]. Recently, it has been acknowledged that a growing proportion of porphyry deposits originated in active or paleo-collisional (e.g., the Kerman porphyry Cu belt of Iran; [6]) or post-collisional (the Gangdese porphyry Cu belt, China; [7,8,9]) settings (Figure 1). The Kerman and Gangdese porphyry Cu belts belong to the vast Tethyan metallogenic province and record Miocene-age magmatism. Also in this belt lies the Saindak Cu-Au porphyry deposit, situated in the well-mineralized western Chagai arc of the central Tethyan metallogenic belt of Pakistan. Whereas many of the porphyry mineralized centers in the extensive Tethyan metallogenic domain have been well studied and thus characterized in the past few decades [10,11,12,13,14,15,16], and the Chagai belt has not received such attention. The belt comprises almost 48 deposits and prospects of predominantly porphyry copper and copper-gold types, such as the Saindak, Reko Diq, and Koh-e-Sultan deposits. Potassically altered quartz diorite porphyry intrusions are associated with the Saindak Cu-Au porphyry deposit (440 Mt), where the average mineralization reaches 0.46% Cu and 0.35 g/t Au [17]. To constrain and better understand the magmatic aspects of porphyry deposit districts, it is paramount that the age and duration of the causative magmatism and related mineralization be determined and complemented with the equally important petrological studies of these suites [2,5,18,19,20].
In the Saindak copper–gold deposit, mineralized rock types primarily consist of quartz diorite/tonalite porphyries, with subordinate mafic microgranular enclaves and nearly coeval mafic dikes. In this work, we provide results of molybdenite Re–Os dating, U-Pb geochronology, and Hf isotope analysis of zircon, and the complementary petrographic characterization and whole-rock geochemistry for the poly-phase intrusions from the Saindak Cu-Au porphyry deposit. Such data are used to better comprehend the age and magma source of the magmatism of the mineralized district, make inferences with regard to its tectonic setting, assess the petrogenetic evolution of the mineralizing porphyry, and identify the tectonic environment and magmatic evolutionary process that contributed to the genesis of the Saindak deposit. These results reveal the key geological mechanisms responsible for supergiant porphyry copper formation throughout the Tethyan mineral province.

2. Geological Setting

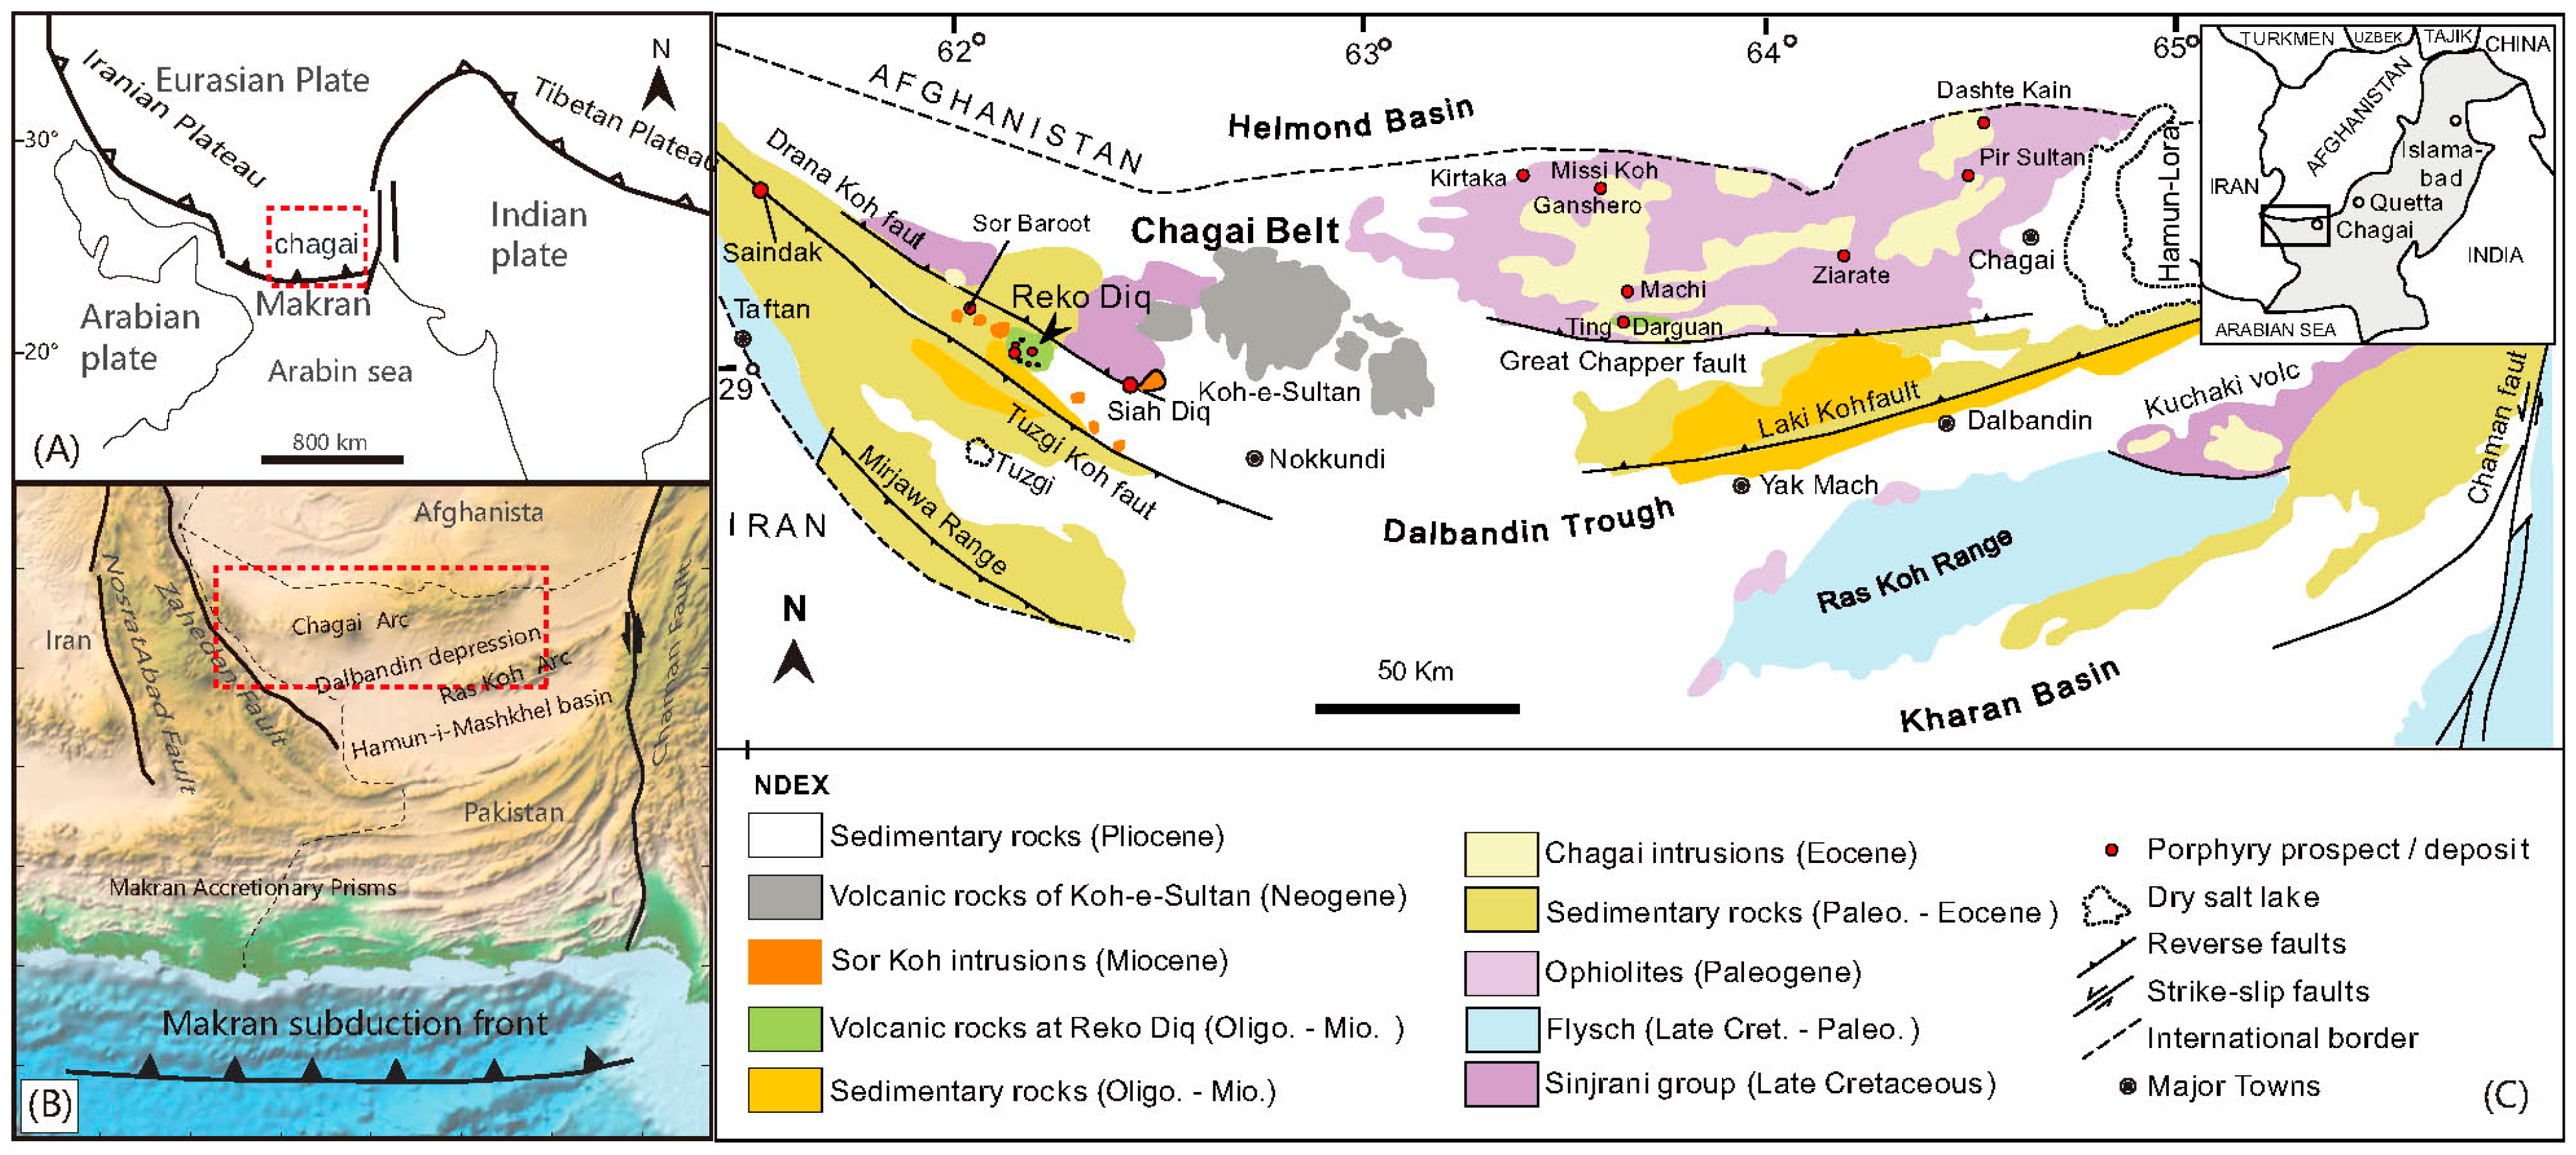
The Saindak Cu-Au porphyry deposit is situated in the western part of the Chagai magmatic arc of the Balochistan province, southwestern Pakistan. With a maximum width of 140 km and an east–west orientation, the Chagai magmatic arc comprises a >500 km elongate zone dominated by calc-alkaline volcanics, intrusive bodies, and associated sedimentary sequences, extending into southern Afghanistan [22]. This belt, alternatively termed the Makran magmatic arc or subduction zone [23], is positioned between the Himalayan convergent margin (east) and the Zagros collision front (west) [22,24,25,26]. The Chagai arc represents just one volcanic pulse in the vast 5000 km Tethyan orogenic system extending across Eastern Europe and Asia within the regional tectonic framework [22,27,28].
The Makran accretionary prism, the Hamun-i-Mashkhel forearc basin, the Chagai arc, the Dalbandin depression, and the Raskoh arc are the five main morphostructural units that can be tectonically separated from south to north in this region (Figure 2B; [28,29,30]). The Chagai–Raskoh arc system developed during and after the union of the microcontinental blocks of Afghanistan and central Iran along the southern edge of the Eurasian continental mass [15,24,31]. The region is tectonically confined by the Zahedan right-lateral fault system to the west and the Chaman transform boundary to the east. The primary left-lateral displacement resulting from the northward movement of the Indian plate is accommodated by the Chaman fault zone, which marks the eastern periphery of the Chagai–Raskoh arc [22].
The Chagai belt comprises alkaline to calc-alkaline intrusive bodies with associated sedimentary formations. The Late Cretaceous Sinjrani volcanic group, which is made up of huge lava flows, tuff, and fragmentary volcanic rocks, is the oldest rock unit in the belt [22,30,32] (Figure 3). The Sinjrani volcanic group comprises an approximately 2 km-thick succession including (1) Cretaceous Humai Formation carbonate units, (2) Paleocene Juzzak through early Oligocene Dalbandin Formation siliciclastic deposits, (3) late Oligocene andesitic lavas and pyroclastics of the Reko Diq and Amalaf Formations [22,30,32]. A km-scale batholith of Chagai intrusions, consisting of gabbro, granodiorite, diorite, and quartz monzonite, intruded the supracrustal rocks [30]). Multiple magmatic episodes from the Eocene to the Miocene emplaced the Chagai intrusions [22,29]. The western part of the Chagai belt exhibits a magmatic architecture characterized by discrete Miocene Sor Koh intrusive bodies—including stocks, domal structures, lopolithic masses, and both discordant and concordant sheet intrusions [33,34,35,36]. The U-Pb zircon dates of the Sor Koh intrusions ranged from 23.7 ± 0.2 to 11.2 ± 0.5 Ma [22,28]. K-Ar geochronology [22,29] constrains Eocene magmatic activity (54.8 ± 1.9–44.2 ± 0.8 Ma) to the central and eastern Chagai belt (Figure 3).

3. Ore Deposit Geology

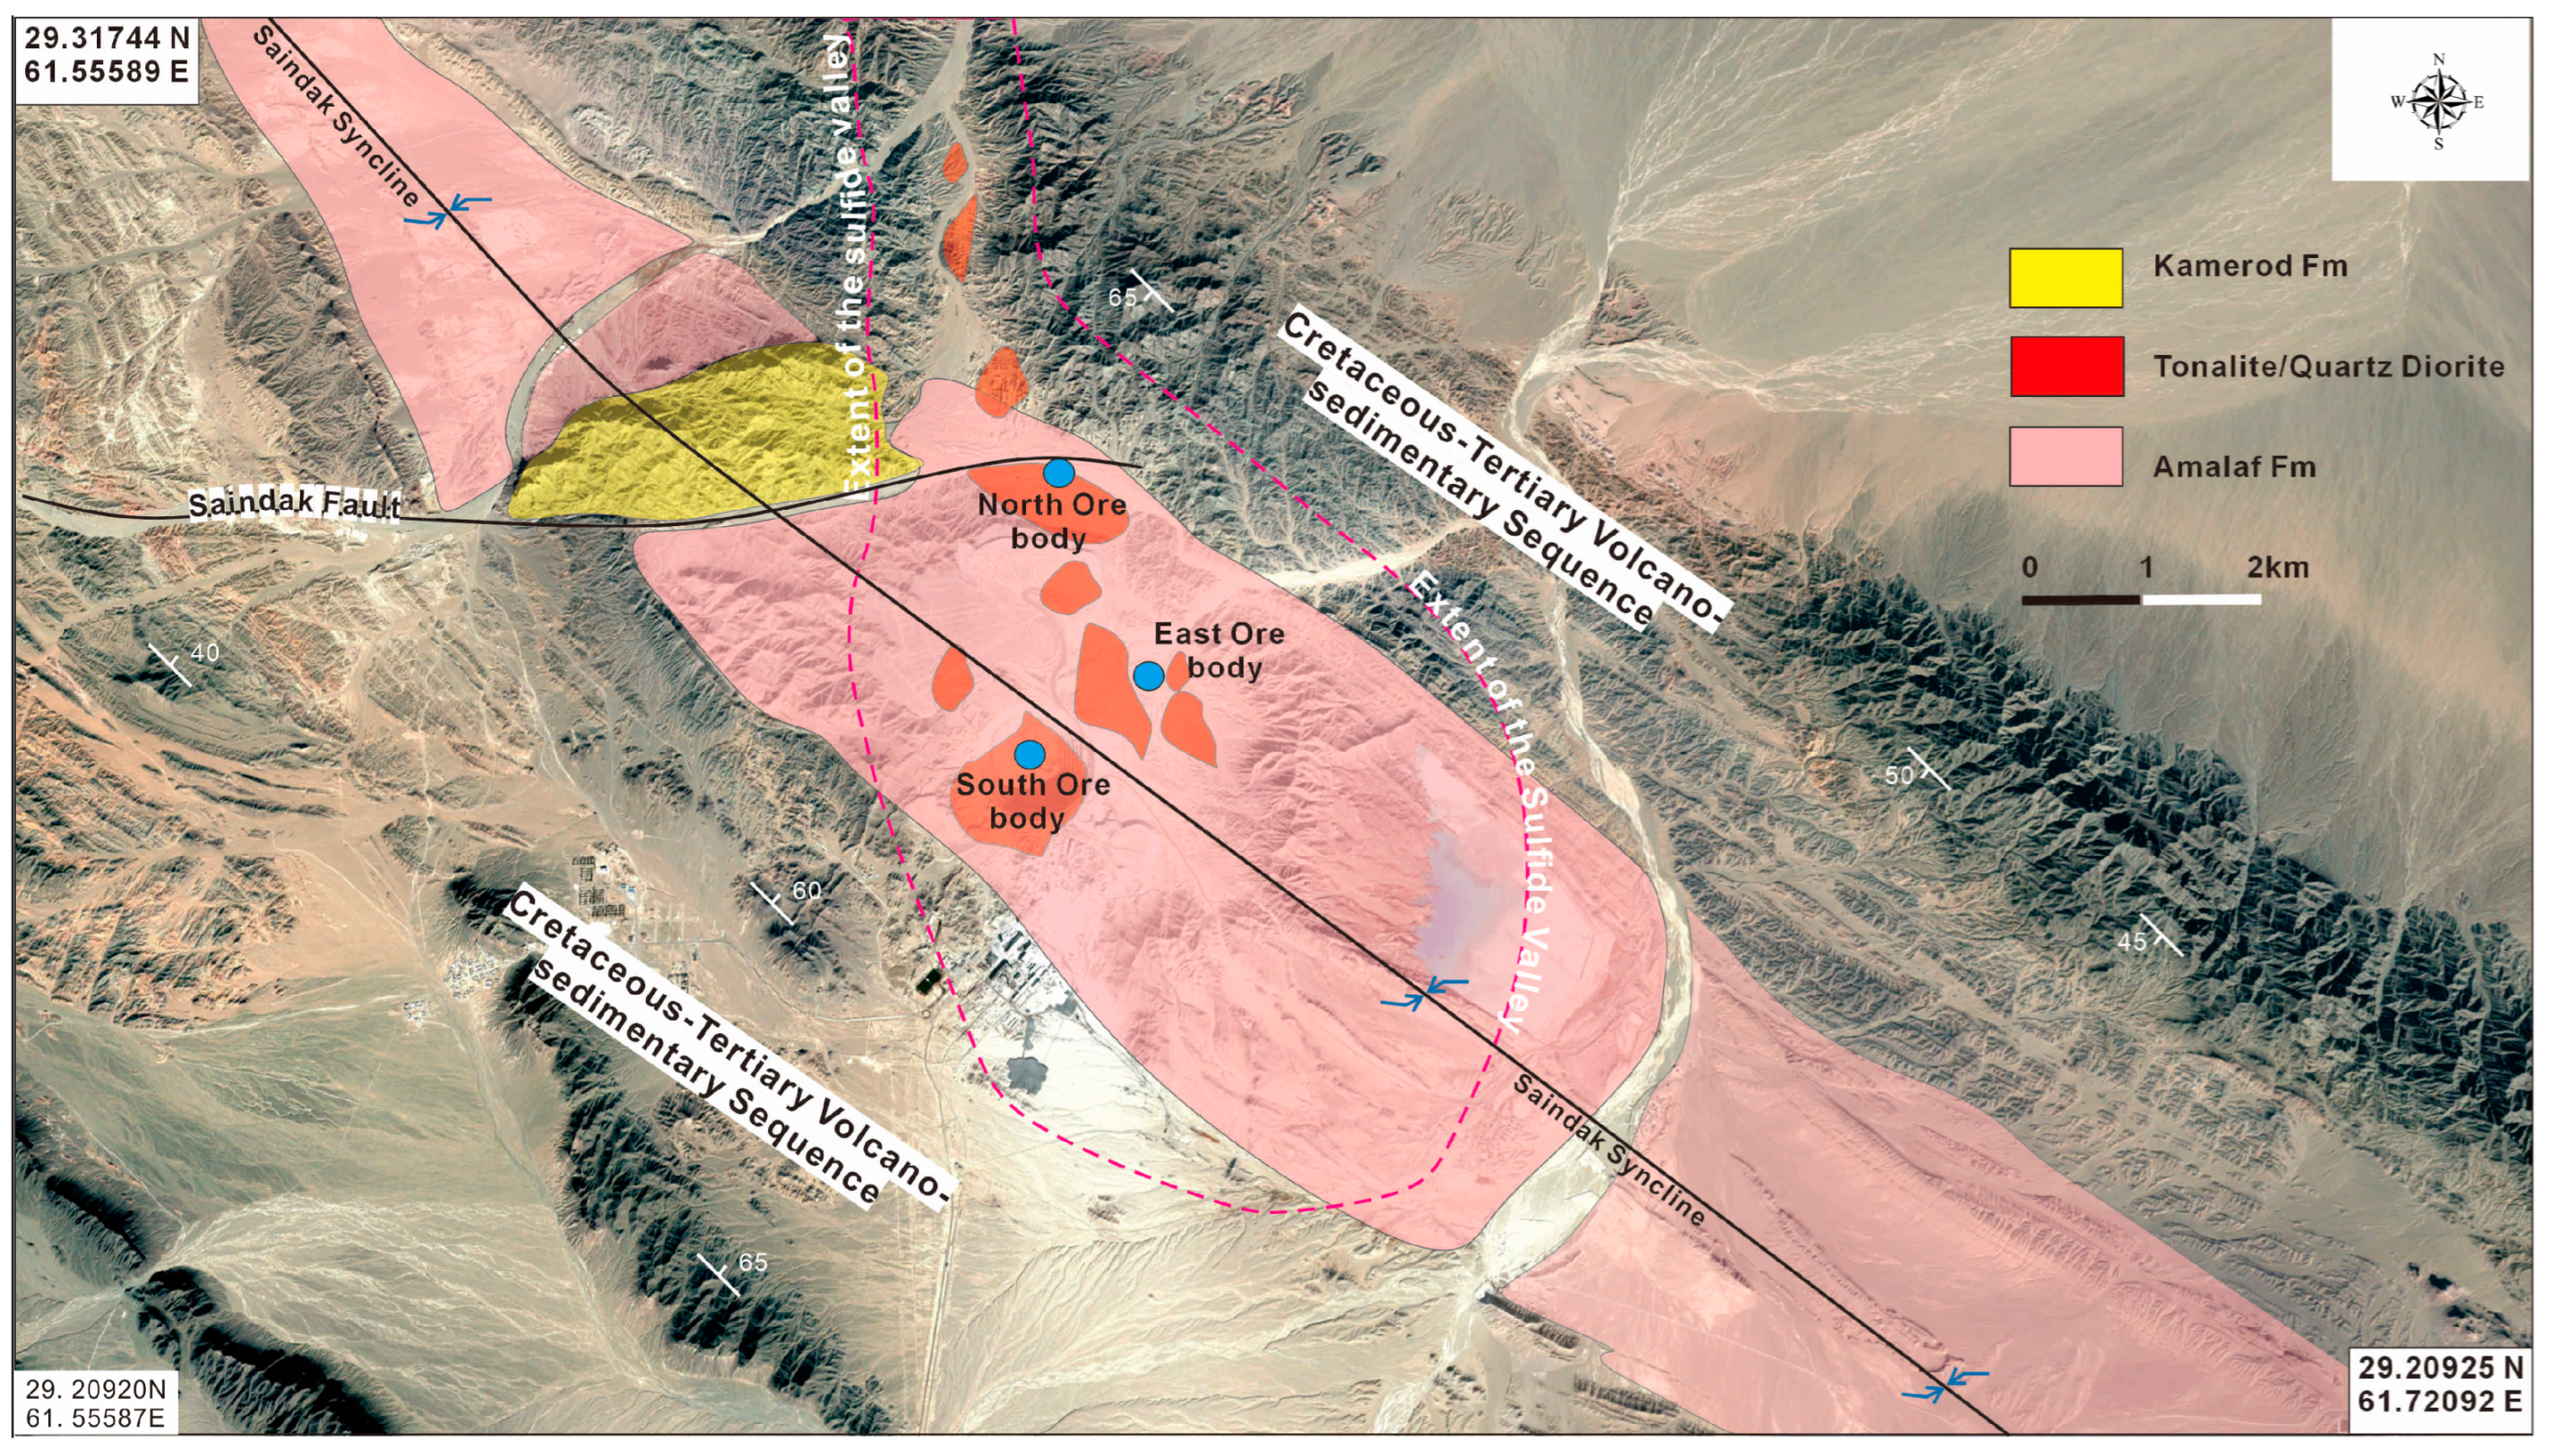
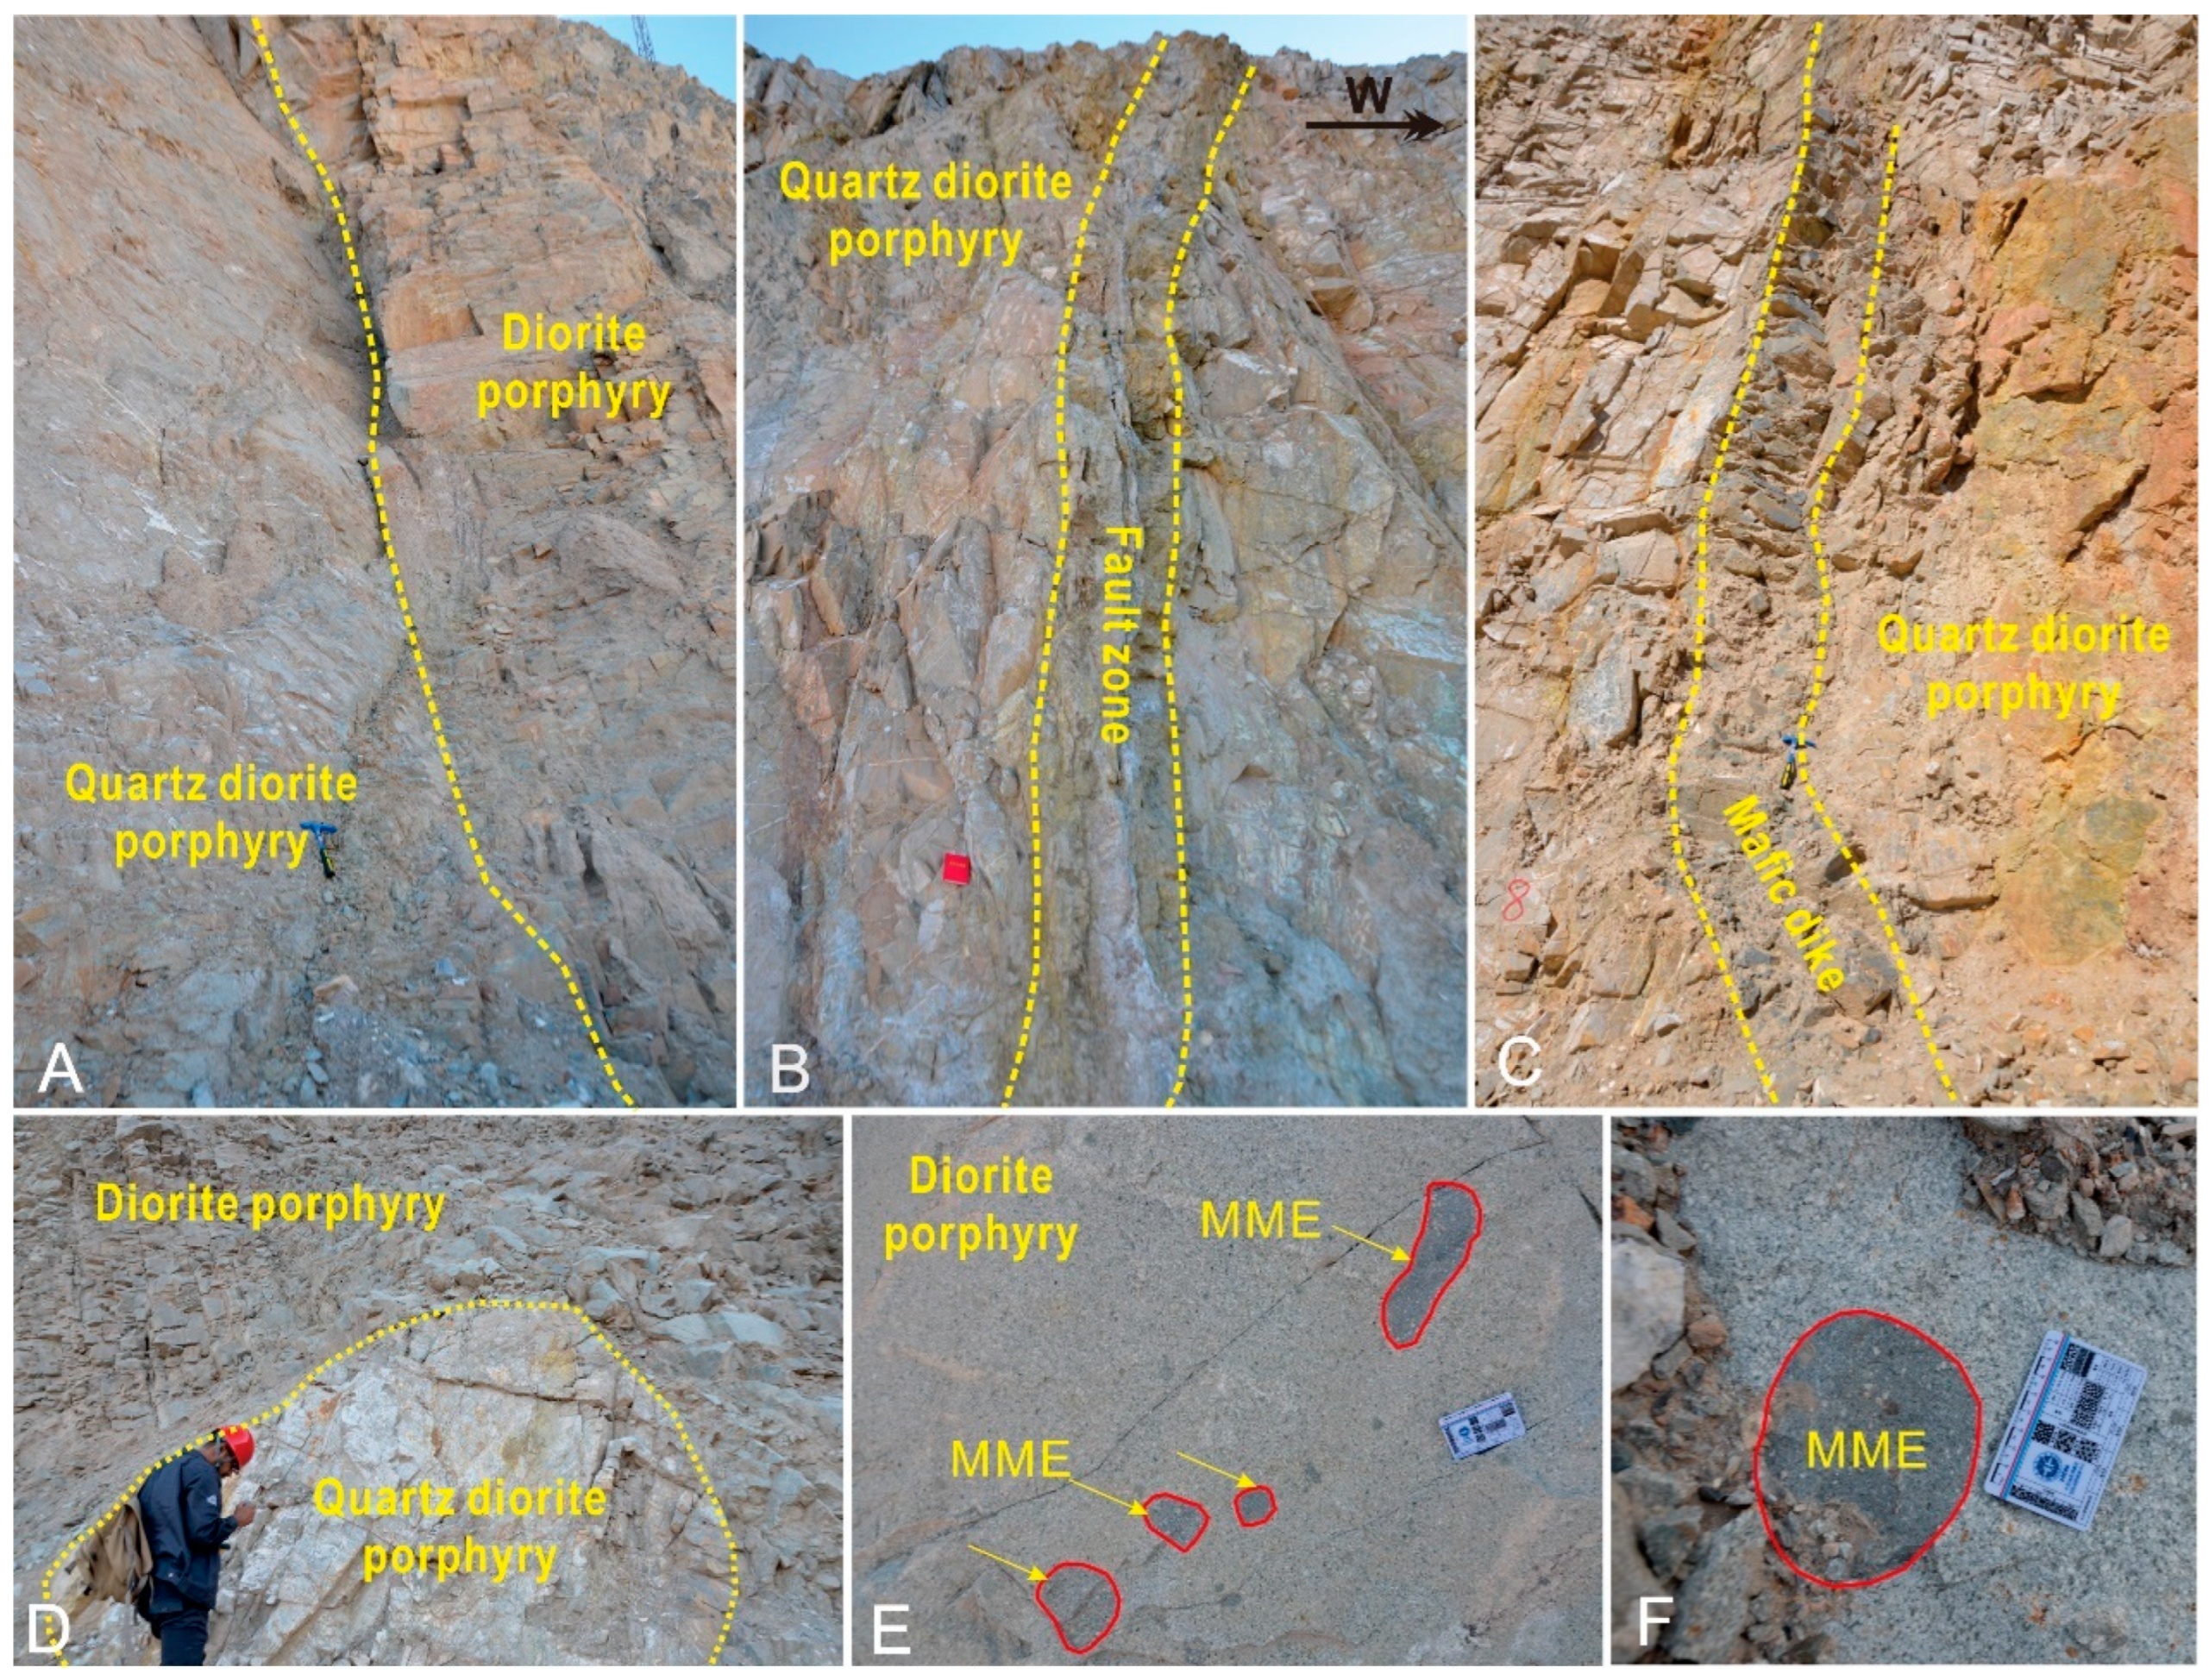
The Saindak copper–gold deposit occurs in the western portion of the Chagai magmatic belt [22,26,29,37]. The deposit consists of three main orebodies—southern, northern, and eastern—each centered on smaller porphyry stocks (Figure 4). The predominant geological features in the mining region are the sizeable W-E running Saindak main fault and its spatiotemporally linked N-S subsidiary fault network. The Saindak mining area comprises at least three Miocene porphyritic intrusive rocks (Figure 5) intruding the Eocene–Oligocene volcanic formations (Saindak and Amalaf). Quartz diorite porphyry is the predominant intrusion linked to the Cu-Au mineralization. The quartz diorite porphyry is intruded by a swarm of barren porphyritic andesite dikes and small plugs of diorite porphyry (Figure 5A). Fault zones with a width of 30 cm, trending north, are present in the south orebody (Figure 5B). Mafic dikes with width of 30–50 cm are also developed in the Saindak mining area (Figure 5C). Mafic microgranular enclaves (MMEs) are common within the studied porphyritic intrusions (Figure 5D–F). They are first observed in outcrop and thin section as rounded to ellipsoidal, fine-grained, dark-colored inclusions. These enclaves typically range from 1 to 10 cm in diameter and are characterized by sharp, sometimes crenulated contacts with the host felsic porphyry.
The mineralized and altered quartz diorite porphyry accounts for more than 90% of plutonic rocks. Both the andesite and diorite porphyry dikes are fresh, ranging from a few to several meters in thickness, and are completely barren, with only a few veins of pyrite. In the core samples from the southern orebody, magmatic-hydrothermal breccia was found intermittently distributed along a depth of approximately 100 m, located at the margins and top of the main orebody. The breccia fragments are of the following two types: one is potassic-altered quartz diorite porphyry, and the other is siltstone with quartz–K–feldspar and quartz–anhydrite veins. Sericitization is typically developed around the breccia fragments, forming sulfide–sericite halos. There is no significant displacement between the breccia fragments, indicating that the magmatic emplacement process generated the magmatic-hydrothermal breccia.
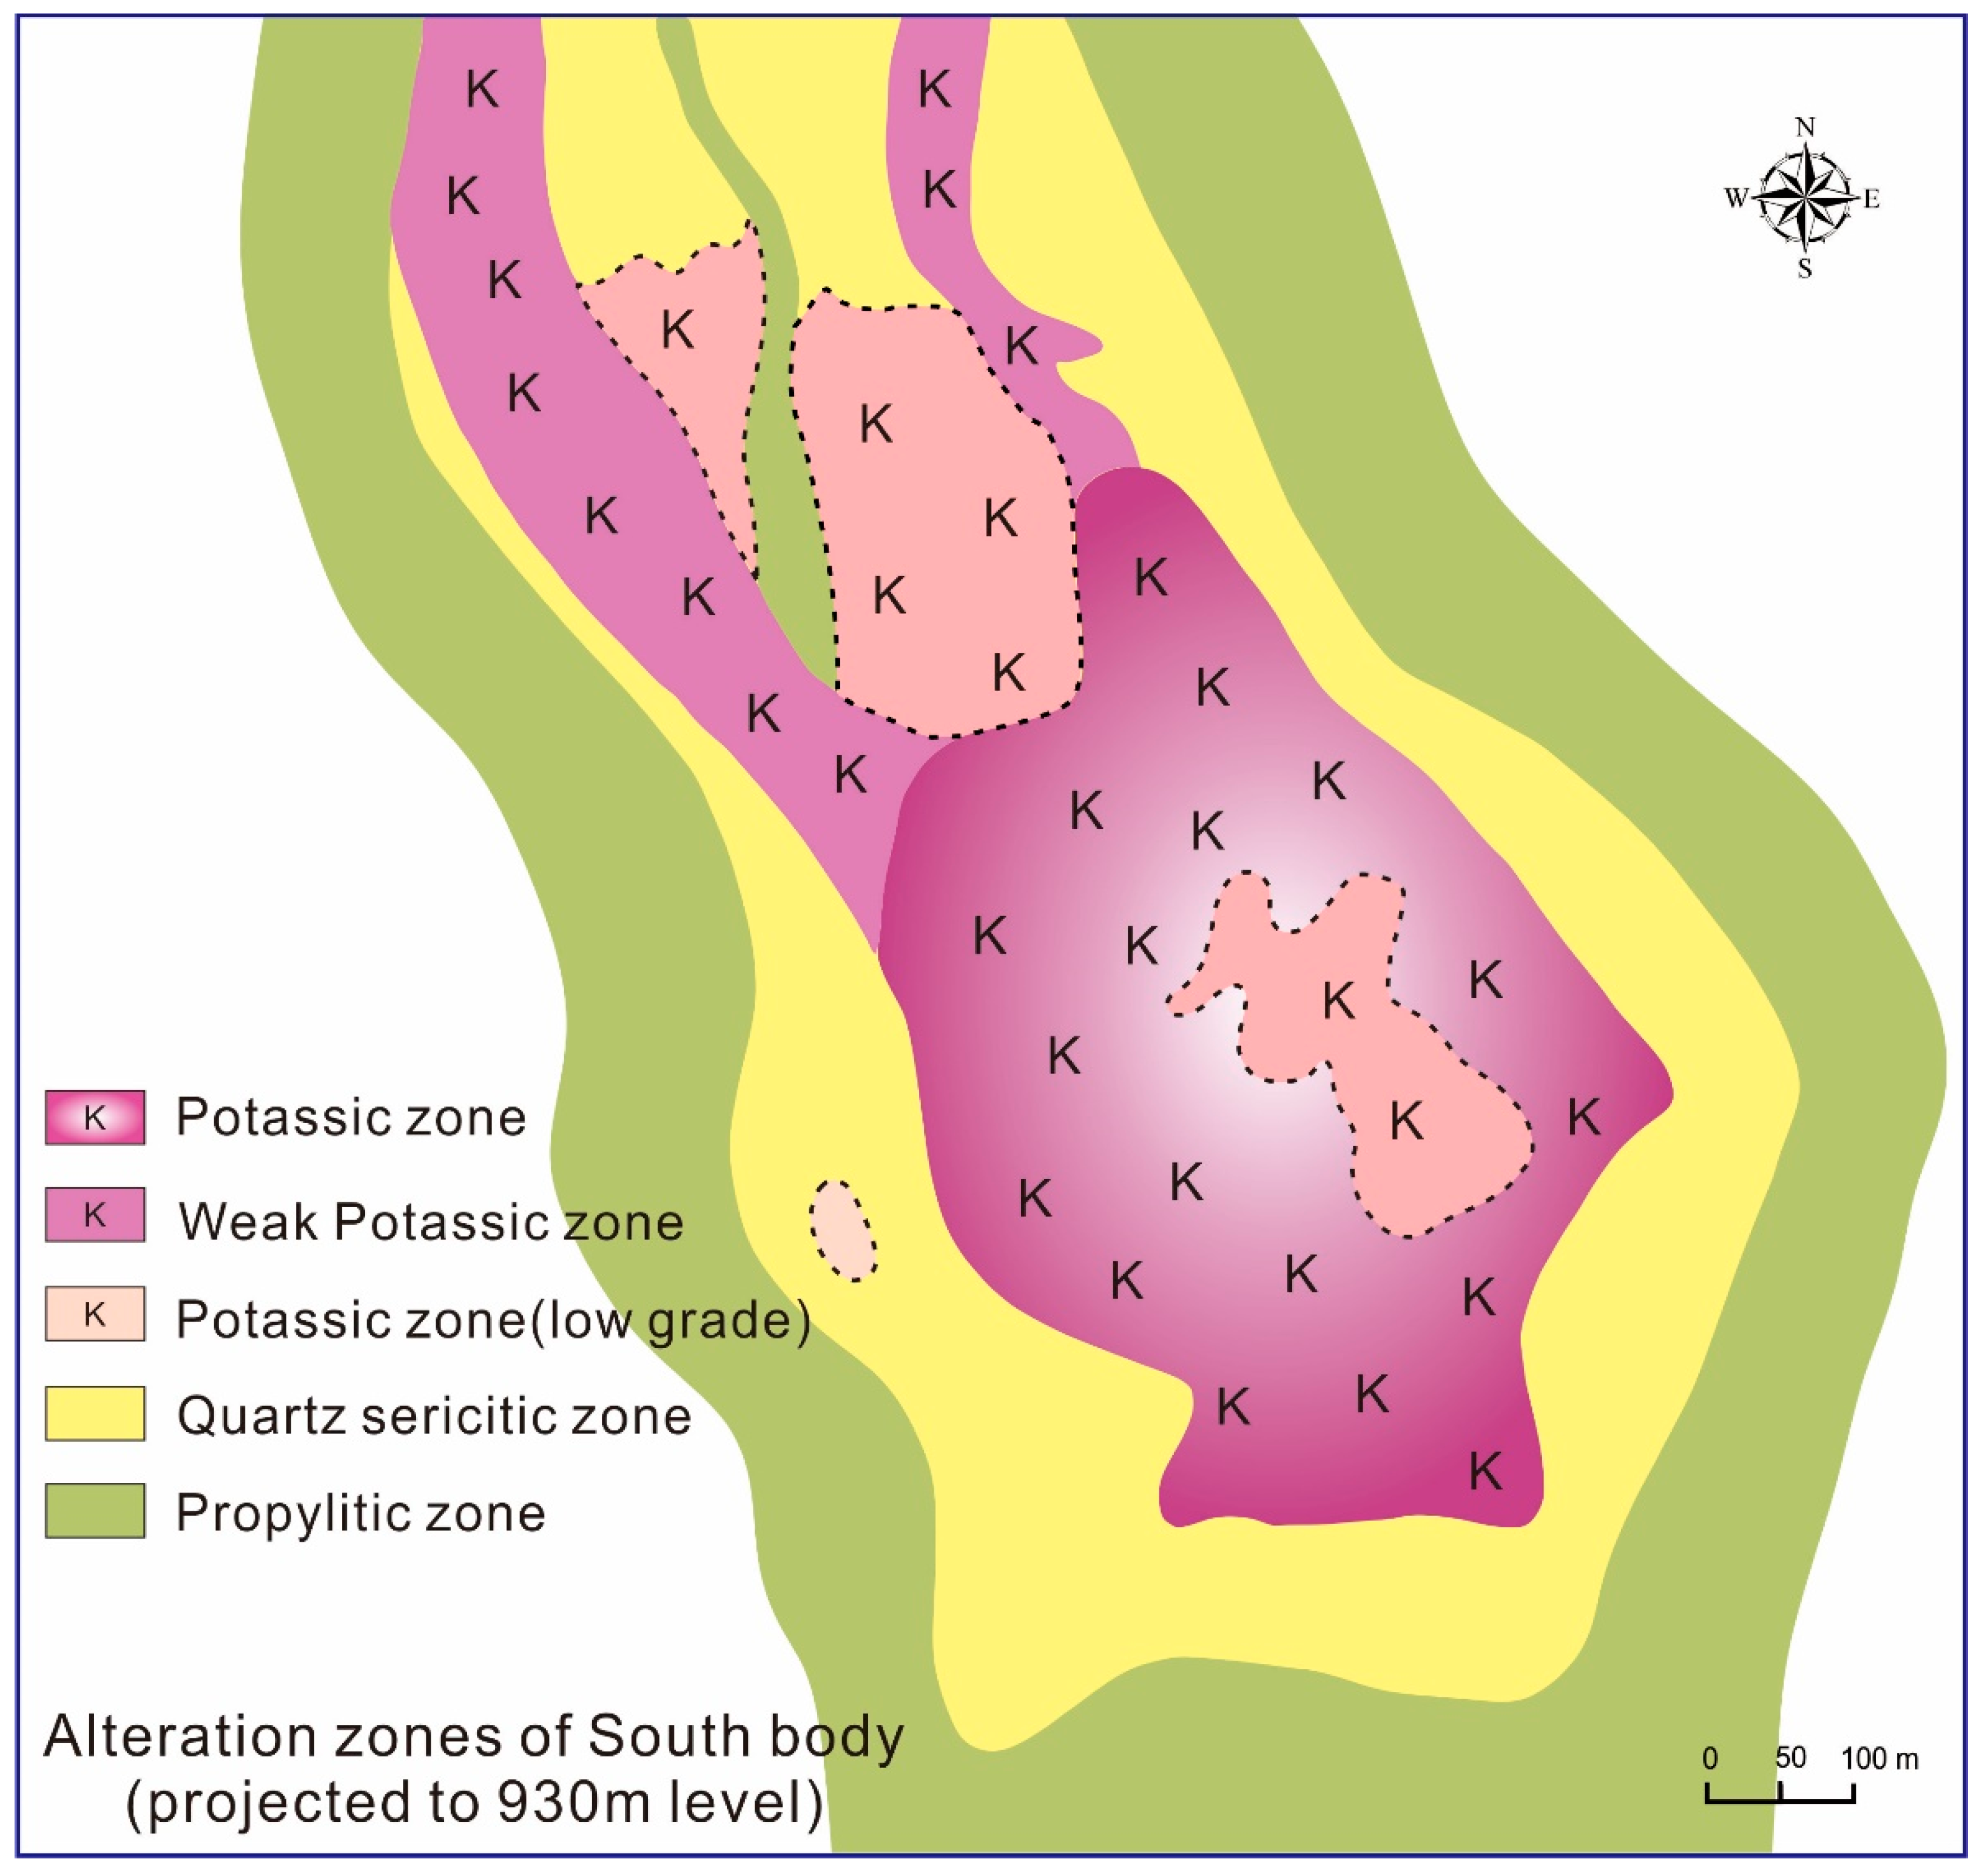
In all the three mineralization centers in Saindak, the tonalite porphyry and its host rock of the Amalaf Formation is immediately surrounded by high-temperature potassic alteration, followed by a phyllic alteration zone and a broad propylitic alteration in the host rock (Figure 6). Secondary potash feldspar and biotite are the characteristics of the potassic zone, whereas the phyllic zone is characterized by sericite, quartz, calcite, and chlorite, and the propylitic comprises chlorite, epidote, and anhydrite. The potassic alteration is the earliest high-temperature zone followed by phyllic and propyllitic alteration, which is similar to porphyry copper deposits in other areas of the world. Only pyrite, chalcopyrite, and occasionally molybdenite and bornite are the sulfides mineralized in the area. These minerals occur both in the hair-line veins, as well as in disseminations. Chalcopyrite accounts for most of the copper mineralization (>90%) in all the three mineralization centers. While gold has not been seen megascopically or microscopically, it is anticipated to form inclusions in pyrite grains similarly to other porphyry copper deposits globally. Molybdenite, one of the minor components of the mineralization in Saindak, is pervasively disseminated primarily in the sericite–chlorite and biotite-rich alteration zones.

4. Sampling and Methodology

4.1. Sampling

Twenty representative rock samples and core samples were collected from the south, north, and east orebodies at the Saindak copper mine to characterize its geological and mineralization features. Surface rock samples were primarily obtained from the open pits of the south and north orebodies, including mineralized and non-mineralized porphyry rocks and mafic microgranular enclaves (MMEs). For whole-rock geochemical analysis during the process of sample collection, relatively fresh samples were selected as far as possible, and areas with intense joint development and severe alterations were avoided. Additionally, core samples were systematically collected from selected drill holes at various depths, chosen to be representative of different mineralization zones and alteration intensities. These core samples cover a spectrum of alteration types, ensuring a comprehensive representation of the mineralization and alteration that are both vertical and lateral.

4.2. Whole-Rock Geochemical Analysis: Major and Trace Elements

Samples were crushed to 200 mesh or smaller. All geochemical analyses were performed at the laboratory of the Xi’an Center of China Geological Survey (CGS). For major element determination, X-ray fluorescence spectrometry (XRF) using the instrument model SX-45, which consistently delivered results with less than 2% analytical variance, was employed. Trace elements and rare earth elements (REEs) were obtained through inductively coupled plasma mass spectrometry (ICP-MS), providing high-precision measurements of these critical elements. The Chinese national standards GB/T14506.2/14/28-2010 and DZ/T0223-2001 were used to monitor analyses [38]. Errors for major element analysis are within 2%, except for P2O5 (5%), and for most trace elements (including REEs) are within 10%.

4.3. Whole-Rock Sr-Nd Isotopes

Sr, Nd, and Pb isotopic compositions of bulk samples were determined at Tongwei Analytical Technology Co., Ltd.’s Radiogenic Isotope Facility (Guizhou, China) employing a Thermo-Finnigan Neptune multi-collector ICP-MS system. Measured 143Nd/144Nd values were normalized to account for deviations between the JNdi-1 standard measurements and their reference value (0.512115; [39]). Similarly, Pb isotopic data were corrected for discrepancies observed between NBS981 standard analyses and their published reference values [40].

4.4. LA-ICP-MS Zircon U-Pb Dating and Hf Isotopes

Zircon grains were extracted from quartz diorite porphyry, diorite porphyry, and MME samples through conventional density-based and magnetic separation methods at the laboratory of Hubei Province’s Regional Geological Survey (Langfang, China). At the laboratory of the Xi’an Center, China Geological Survey (Xi’an, China), LA-ICP-MS was used to synchronously perform U-Pb dating and trace element analysis of zircon. Data reduction and specific operating settings for the ICP-MS (Agilent 7500a (Agilent Technologies, Inc., Santa Clara, CA, USA)) equipment and laser ablation (GeoLas 2005 (LambdaPhysik, Gottingen, Germany)) system were previously described [41,42,43,44]. Target sites for analysis were selected based on cathodoluminescence (CL) and microscopic imaging, with subsequent laser ablation performed using 32 μm spots, 20–40 μm penetration depths, and an 8 Hz pulse rate. NIST 610 was used as the reference standard and 29Si as the internal standard to calibrate the concentrations of U, Th, and Pb. Isotopic ratios measured by ICPMS DataCal [44] underwent fractionation and mass bias corrections standardized to zircon 91500. Ages and concordia diagrams were computed with ISOPLOT/Ex 3.23 [45].
Zircon Lu-Hf isotopes were measured in situ using a Nu Plasma multi-channel inductively coupled plasma mass spectrometer (MC-ICP-MS (Thermo Fisher Scientific, Waltham, MA, USA)) coupled to a GeoLas 2005 system (193 nm ArF excimer laser with integrated ablation cell) at the laboratory of the Xi’an Center of CGS. Lu-Hf measurements targeted zones identical to U-Pb analyses, employing 44 μm laser spots at 10 Hz frequency [46]. Yuan et al. (2008) provides the ICP-MS instrument characteristics and detailed operating conditions [47]. 176Lu→176Hf interference was corrected via 175Lu measurements (176Lu/175Lu = 0.0373106; [48]). Yb-doped JMC475 standard measurements (176Yb/172Yb = 0.58669; Chu et al., 2002 enabled interference corrections [49]. Analytical precision reached ±0.00002 (2σ; ±0.7 εHf). Our 176Hf/177Hf mean (0.282527 ± 28, n = 10) agrees with Griffin-certified values (0.282522 ± 42). Hf isotope analysis of zircon standard 91500 (0.282304 ± 42) matched the literature values [50]. εHf calculations used chondritic ratios 176Lu/177Hf = 0.0336 and 176Hf/177Hf = 0.282785 and depleted mantle parameters 176Lu/177Hf = 0.0384 and 176Hf/177Hf = 0.28325 for TDM ages [51,52]. The 176Hf decay constant was taken as λ = 1.867×10⁻¹¹ yr−1 [53] and the depleted mantle parameters (176Lu/177Hf = 0.0384; 176Hf/177Hf = 0.28325) were used for TDM ages.

4.5. Molybdenite Re–Os Dating

To ensure high purity (>99%), fresh molybdenite grains between 0.2 and 0.5 mm in diameter were carefully picked under a stereoscopic lens, ensuring no oxidation. Four high-quality grains were then chosen under an optical microscope. The Re-Os isotope analysis took place at the Re-Os lab of the National Research Center of Geoanalysis, part of the Chinese Academy of Geological Sciences. Measurements were conducted with a Thermo Electron TJA X-series ICP-MS instrument (Thermo Fisher Scientific, Waltham, MA, USA) [54]. The separation of rhenium and osmium followed chemical methodologies developed by Shirey and Walker (1995) [55] and later adapted by Mao et al. (1999) [56]. To determine model ages, the decay equation t = ln(1 + 187Os/187Re)/λ was used, with λ (the decay constant for 187Re) being 1.666 × 10⁻¹¹ yr−1, following the parameters set by Smoliar et al. (1996) [57].
Throughout the complete Carius tube digestion process, the mean procedural blanks were recorded at 0.22 ± 0.39 micrograms of osmium and 2.9 ± 1.3 micrograms of rhenium. To assess the accuracy of the analytical procedure, a repeat measurement was conducted on the certified reference material GBW04436 (JDC). The obtained Re-Os model age of 140.0 ± 2.2 million years closely aligns with the certified age of 139.6 ± 3.8 Ma, validating the reliability of the method. Model and isochron ages for the six analyzed samples were computed using the ISOPLOT/Ex software (4.15) [58], grounded in these consistent results.

5. Results

5.1. Petrology and Ore Mineralogy

5.1.1. Quartz Diorite Porphyry

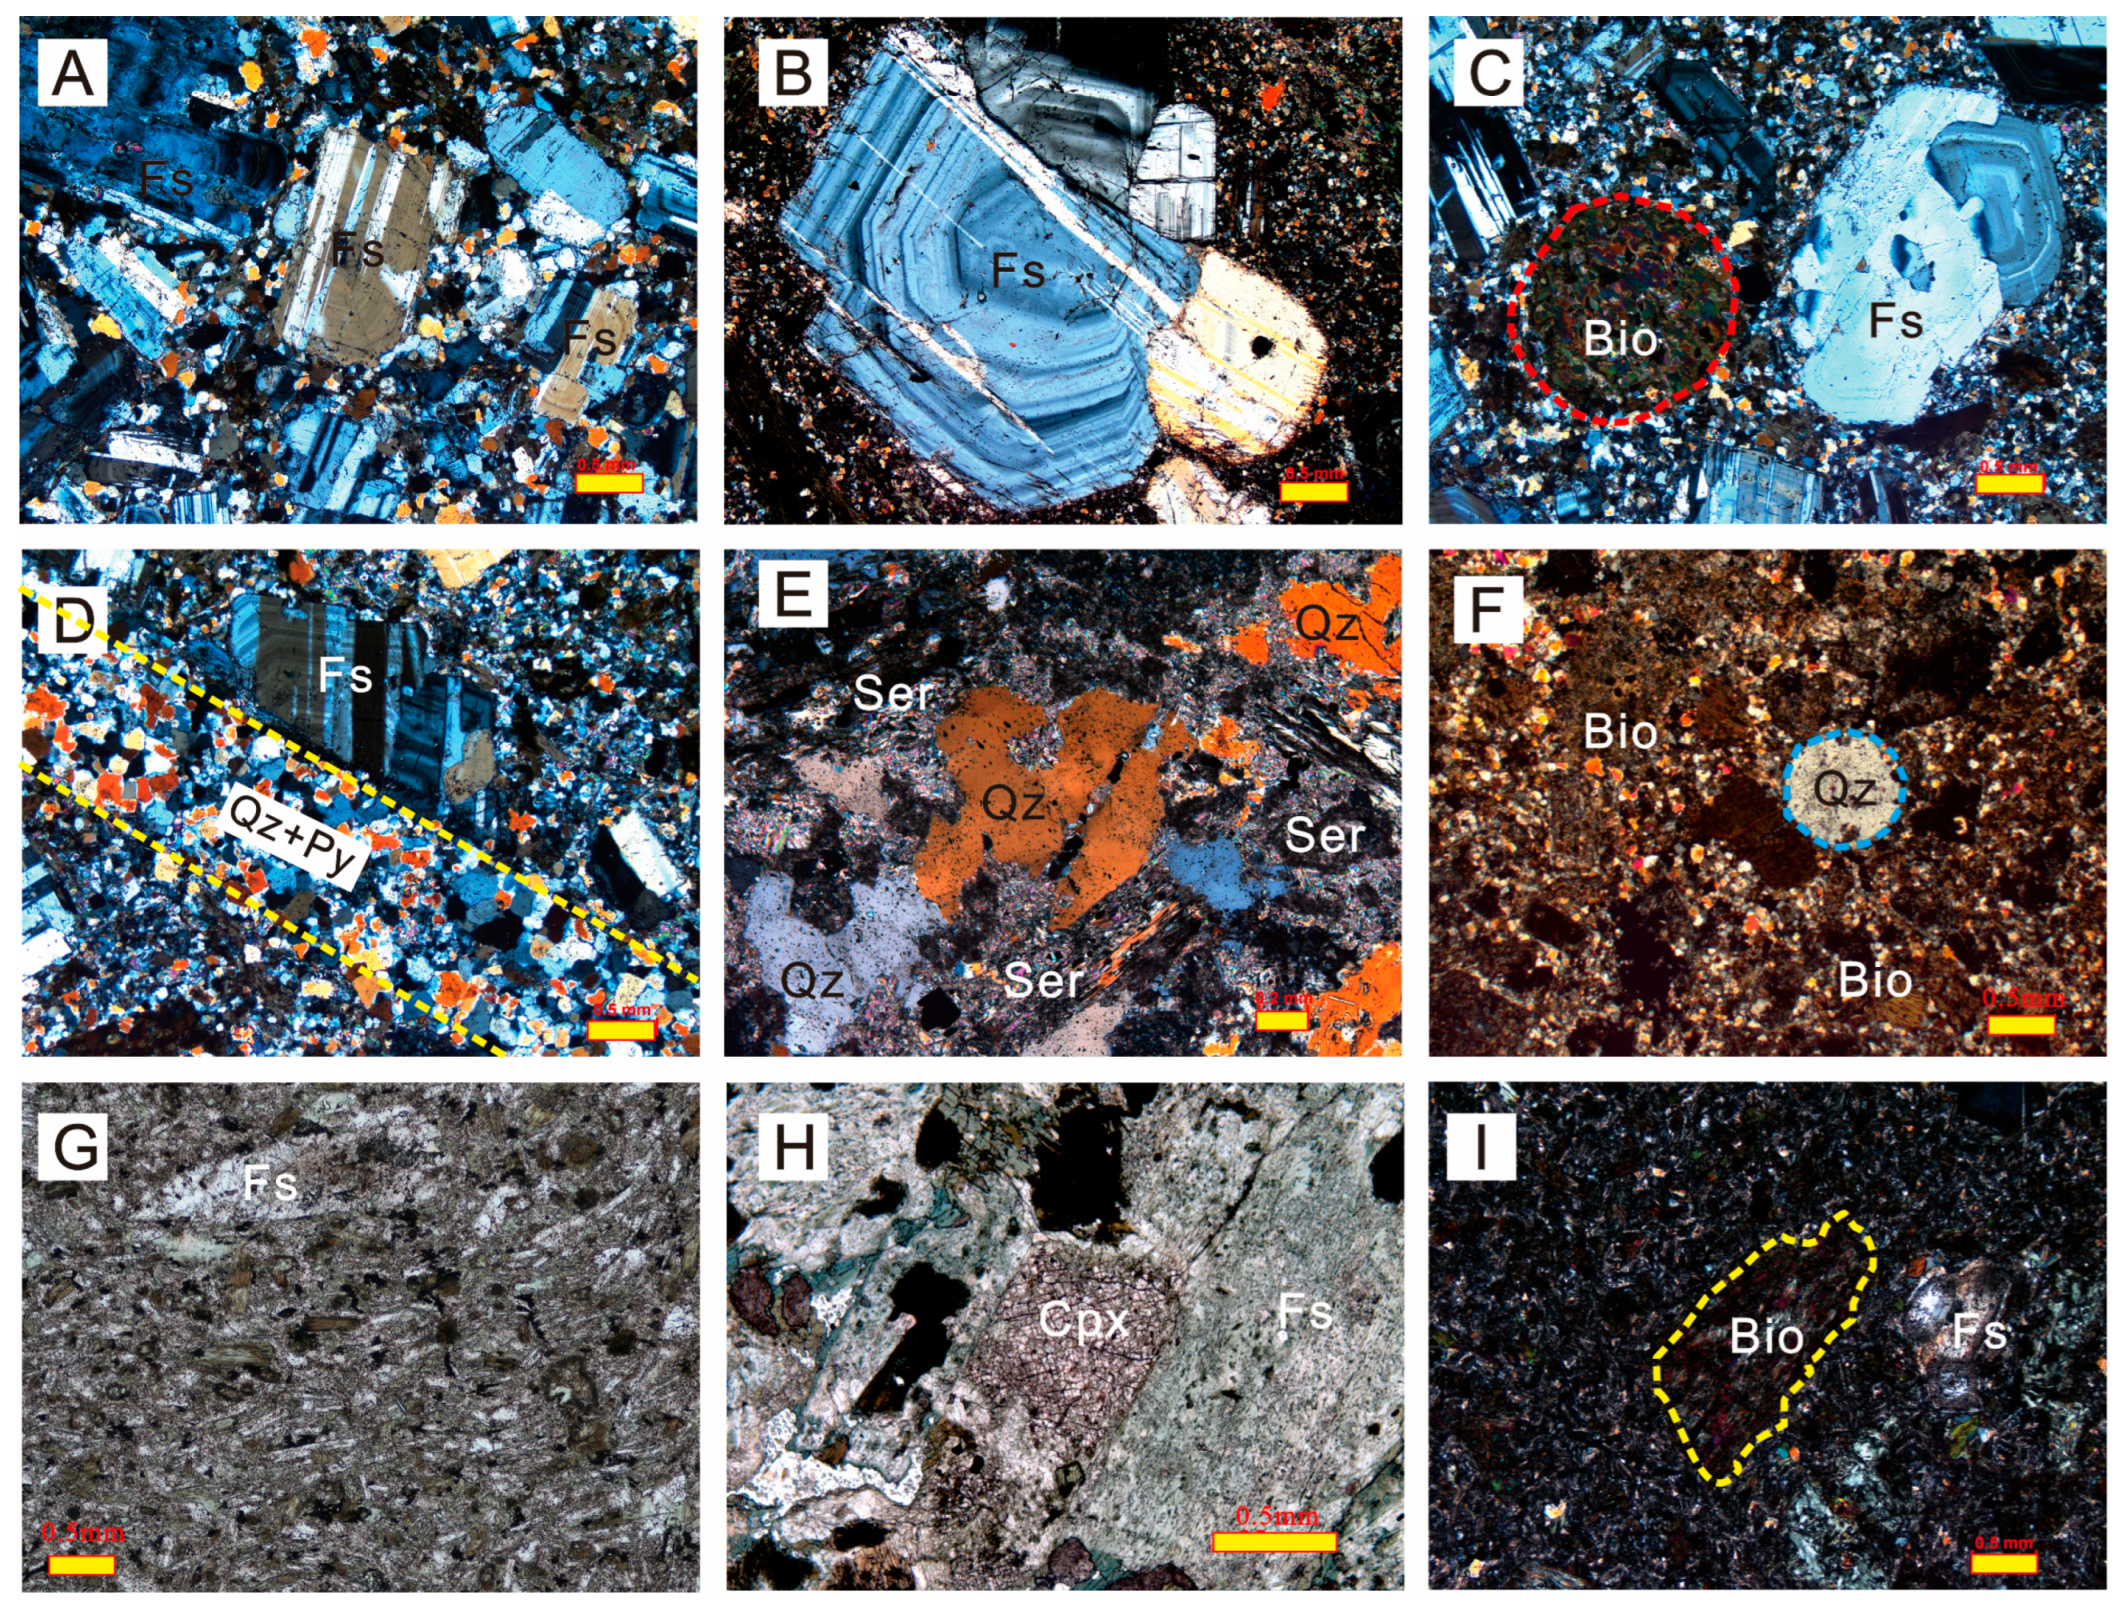
The samples are light gray and porphyritic with a microcrystalline matrix. The phenocrysts are mostly plagioclase (20~30 vol.%), quartz (5~10 vol.%), hornblende (5~10 vol.%), and biotite (5~10 vol.%). The matrix is felsic (35~40 vol.%), comprising mainly of quartz, fine-grained potassium feldspar, hornblende, and a small amount of biotite (~5 vol.%). Other accessory minerals include magnetite, apatite, tourmaline, and zircon. Quartz phenocrysts are mainly aggregated spots composed of multiple fine quartz particles, and plagioclase phenocrysts are plate-shaped euhedral crystals (Figure 7A–C) effected by quartz-sericitization alteration (Figure 7D,E). According to field observations, sericite dominates the alteration of the wallrocks, followed by chloritization.

5.1.2. Diorite Porphyry and MMEs

Diorite porphyry occurs as an apophysis (width 3–5 m) on the west side of the south orebody, cutting through the ore-bearing quartz diorite porphyry. The rock is gray-black with a porphyritic structure, and the phenocrysts are mainly plagioclase (30~35 vol.%), with a minor amount of amphiboles (<5 vol.%) and biotite (<1 vol.%). The total amount of phenocrysts is about 10%. The matrix is mainly plagioclase and amphibole, containing a minor amount of quartz and biotite. Plagioclase phenocrysts are plate-shaped, and the particle size ranges mostly between 1~5 mm and 1~2 cm. The plagioclase giant crystals generally develop ring structures and the quartz and feldspar crystals are typically rounded or oval and the particle sizes are generally 3~5 mm. Most of the grains are harbor-shaped, indicating resorption (Figure 7F,G). The surrounding rocks exhibit weak alteration and are characterized mainly by chloritization and sericitization around plagioclase phenocrysts, along with local carbonatization and hornblendite in some parts. Titanite, apatite, zircon, and opaque minerals make up the accessory phases. MMEs hosted in the diorite porphyry are dominated by plagioclase, hornblende, biotite, and subordinate clinopyroxene (Figure 7H), and they are more mafic (higher Fe, Mg, and Ca contents) than their surrounding host rocks. Their fine-grained, quenched textures and disequilibrium mineral assemblages (e.g., sieve-textured plagioclase, amphibole overgrowths) suggest rapid cooling and mingling of mafic magma injected into a cooler felsic host, reflecting magma mixing processes during the evolution of the intrusive system [59].

5.1.3. Mafic Dikes

Mafic dikes, although generally narrower than 10 m, are commonly encountered within the mining zones. These intrusions are characterized by a porphyritic fabric, containing fine- to medium-sized crystals embedded in a gray-green, extremely fine-grained (aphanitic) matrix. The volume percentage of phenocrysts ranges between 10% and 20%, with amphibole making up about 30%–40%, plagioclase accounting for 20%–30%, and biotite also comprising roughly 20%–30%. Minor constituents include magnetite, zircon, and apatite, which occur as accessory phases. The amphibole phenocrysts are typically prismatic, with euhedral to subhedral shapes and dimensions between 1 and 5 mm exhibiting relatively low elongation. Plagioclase crystals, generally classified as andesine to labradorite, appear in subhedral to euhedral form and measure around 1–4 mm. Biotite phenocrysts are brown, subhedral, and typically range from 1 to 2 mm in size (Figure 7I).

5.1.4. Ore Mineralogy

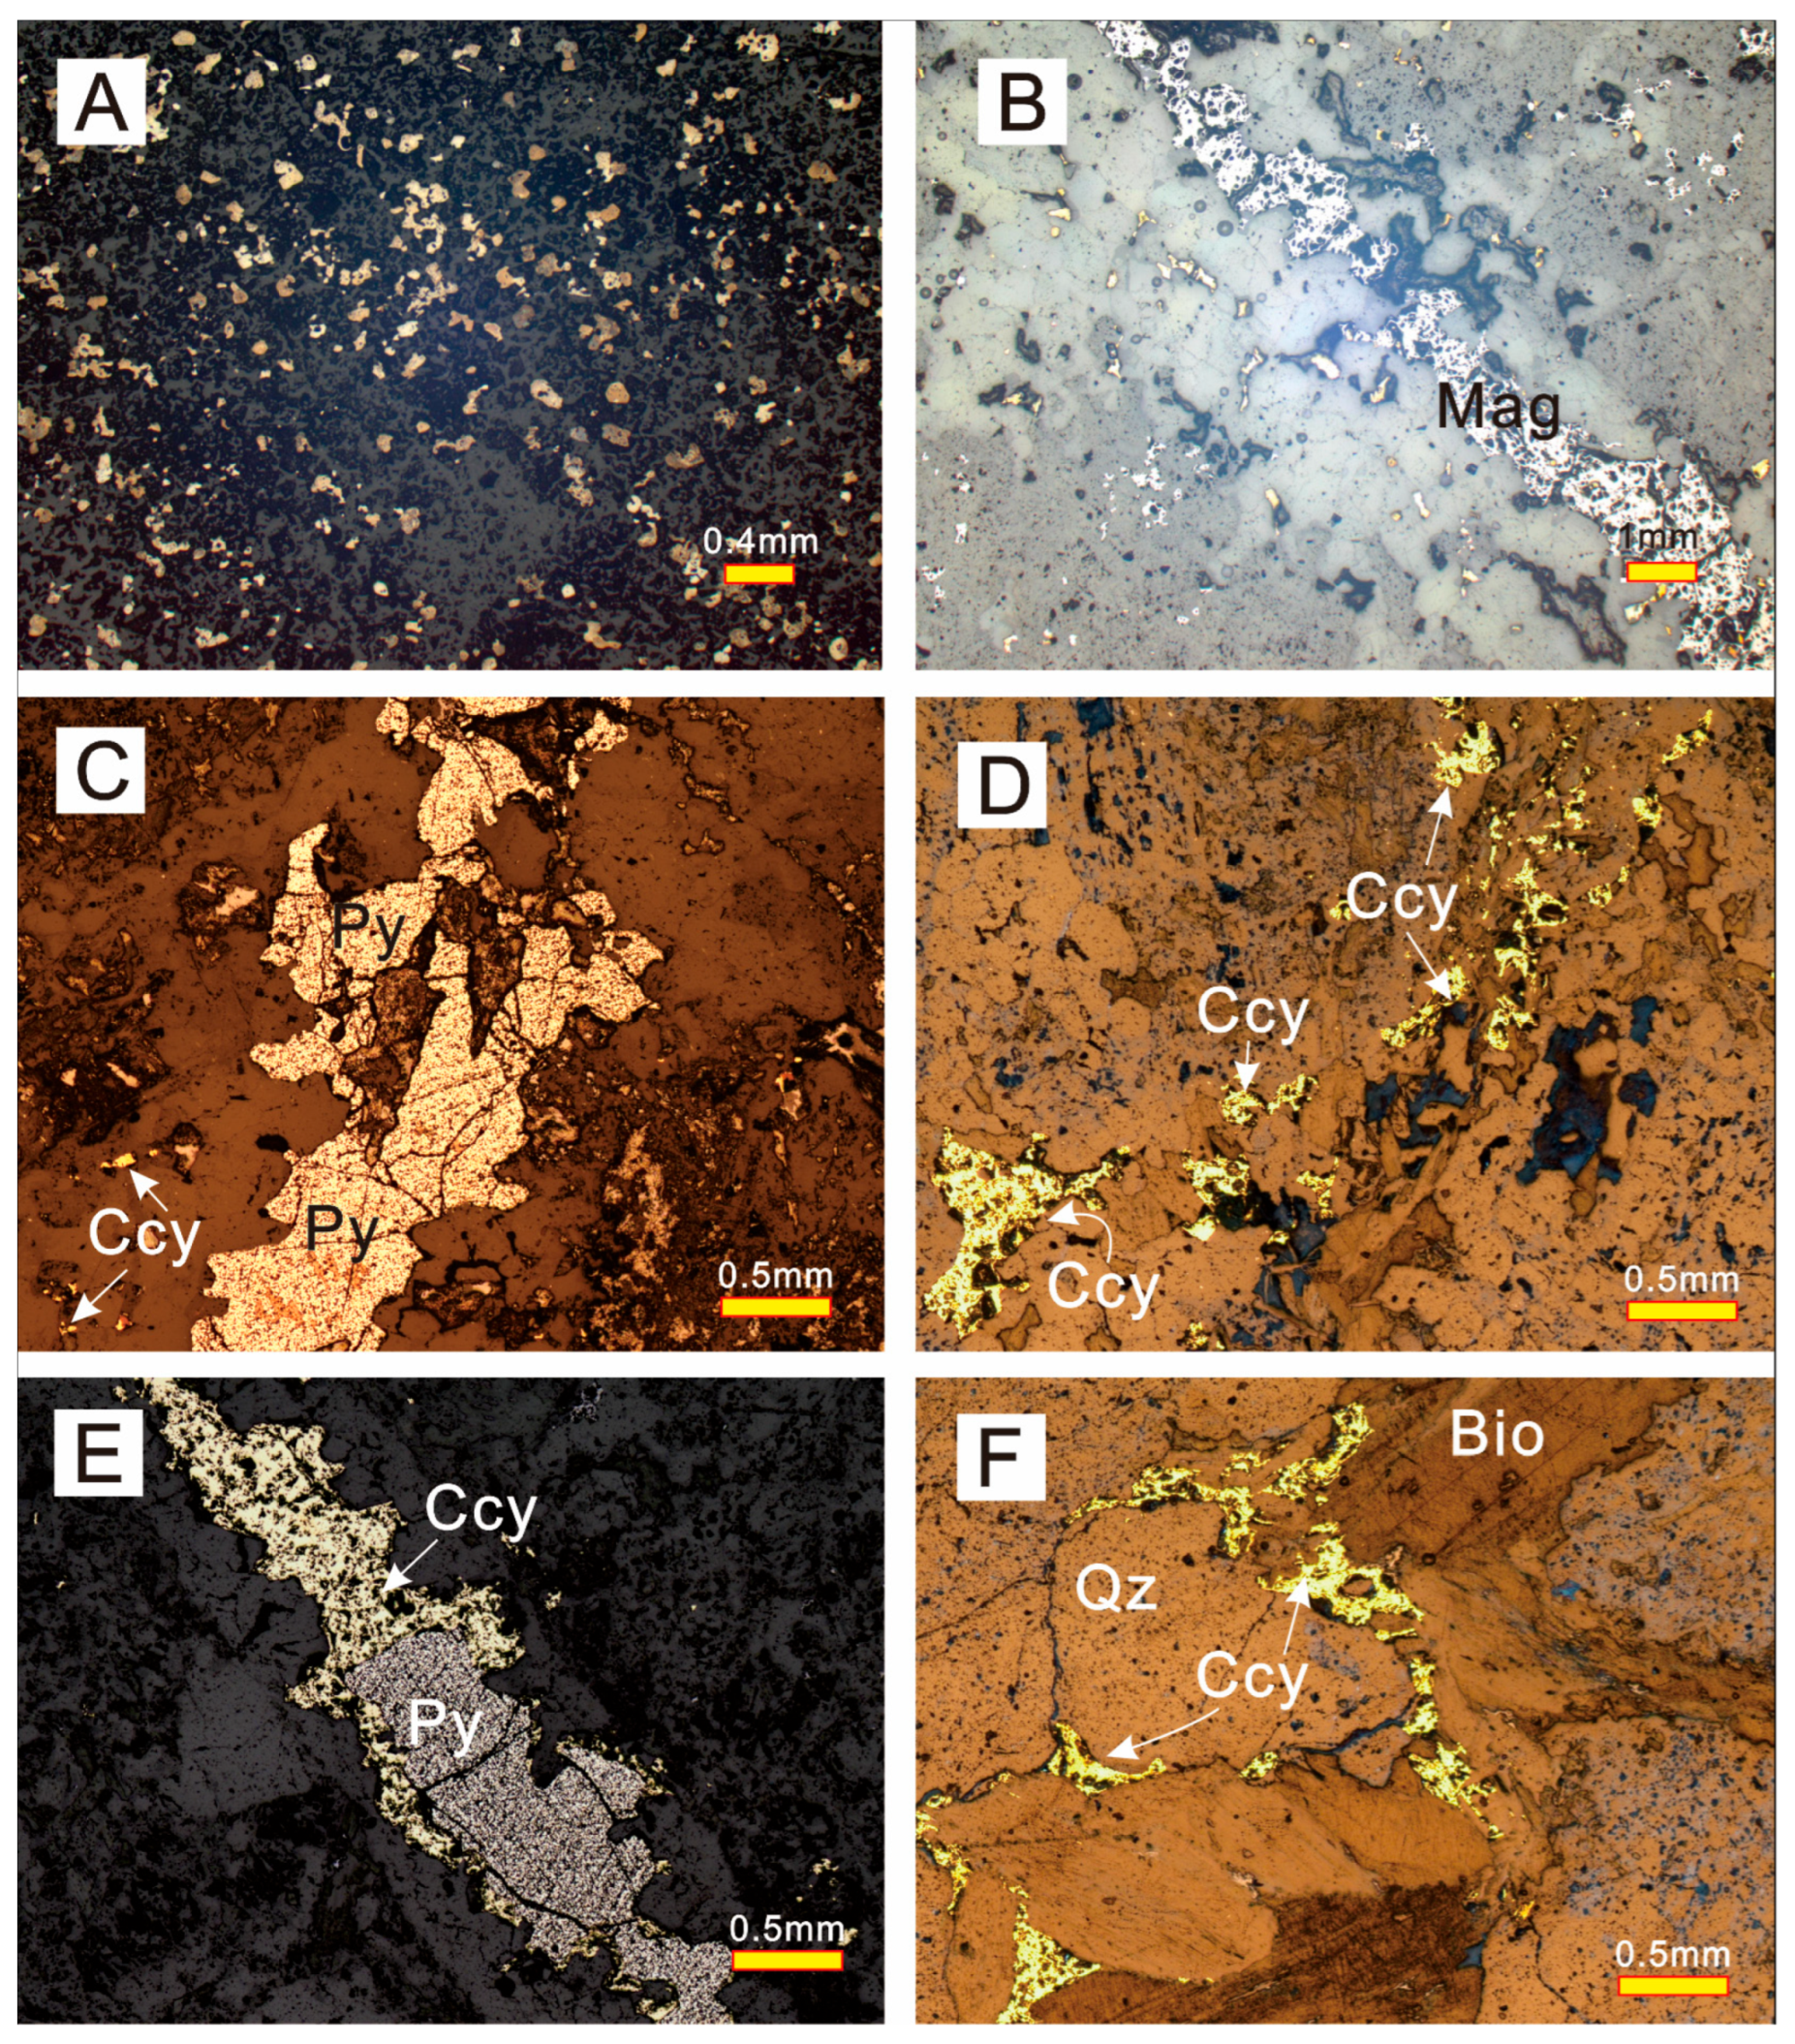
The ore structure of the Saindak porphyry copper deposit is relatively simple, with sulfide minerals occurring predominantly in veinlet-disseminated forms, followed by disseminated and veinlet structures (Figure 8A–F). Metallic mineral grains, appearing as scattered specks or small, short veinlets, are distributed within gangue minerals, forming a disseminated structure. This structure results from the superposition of veinlet-disseminated mineralization of the same or different generations. A large number of veinlet-disseminated ore structures are observed in strongly quartz-sericite altered and sericitized zones, as well as in some moderately quartz-sericite altered and sericitized alteration zones. In certain mineralized zones, a gradual transition can be observed from sparse veinlet-disseminated ores to densely veinlet-disseminated chalcopyrite-rich sericitized zones.
Based on the width of the veins, veinlet structures are classified into micro-veinlet structures (<1 mm), fine-veinlet structures (1–9.9 mm), small-vein structures (10–100 mm), and large vein structures (>100 mm). Among these, fine-veinlet structures are the most developed, followed by micro-veinlet structures. According to the arrangement of veins, they can be categorized into parallel-vein structures, intersecting-vein structures, network-vein structures, and composite-vein structures. Network-vein structures consist of multi-directional mineralized and altered veins formed during the same period, with veins from different periods potentially superimposing to form rich ore segments.
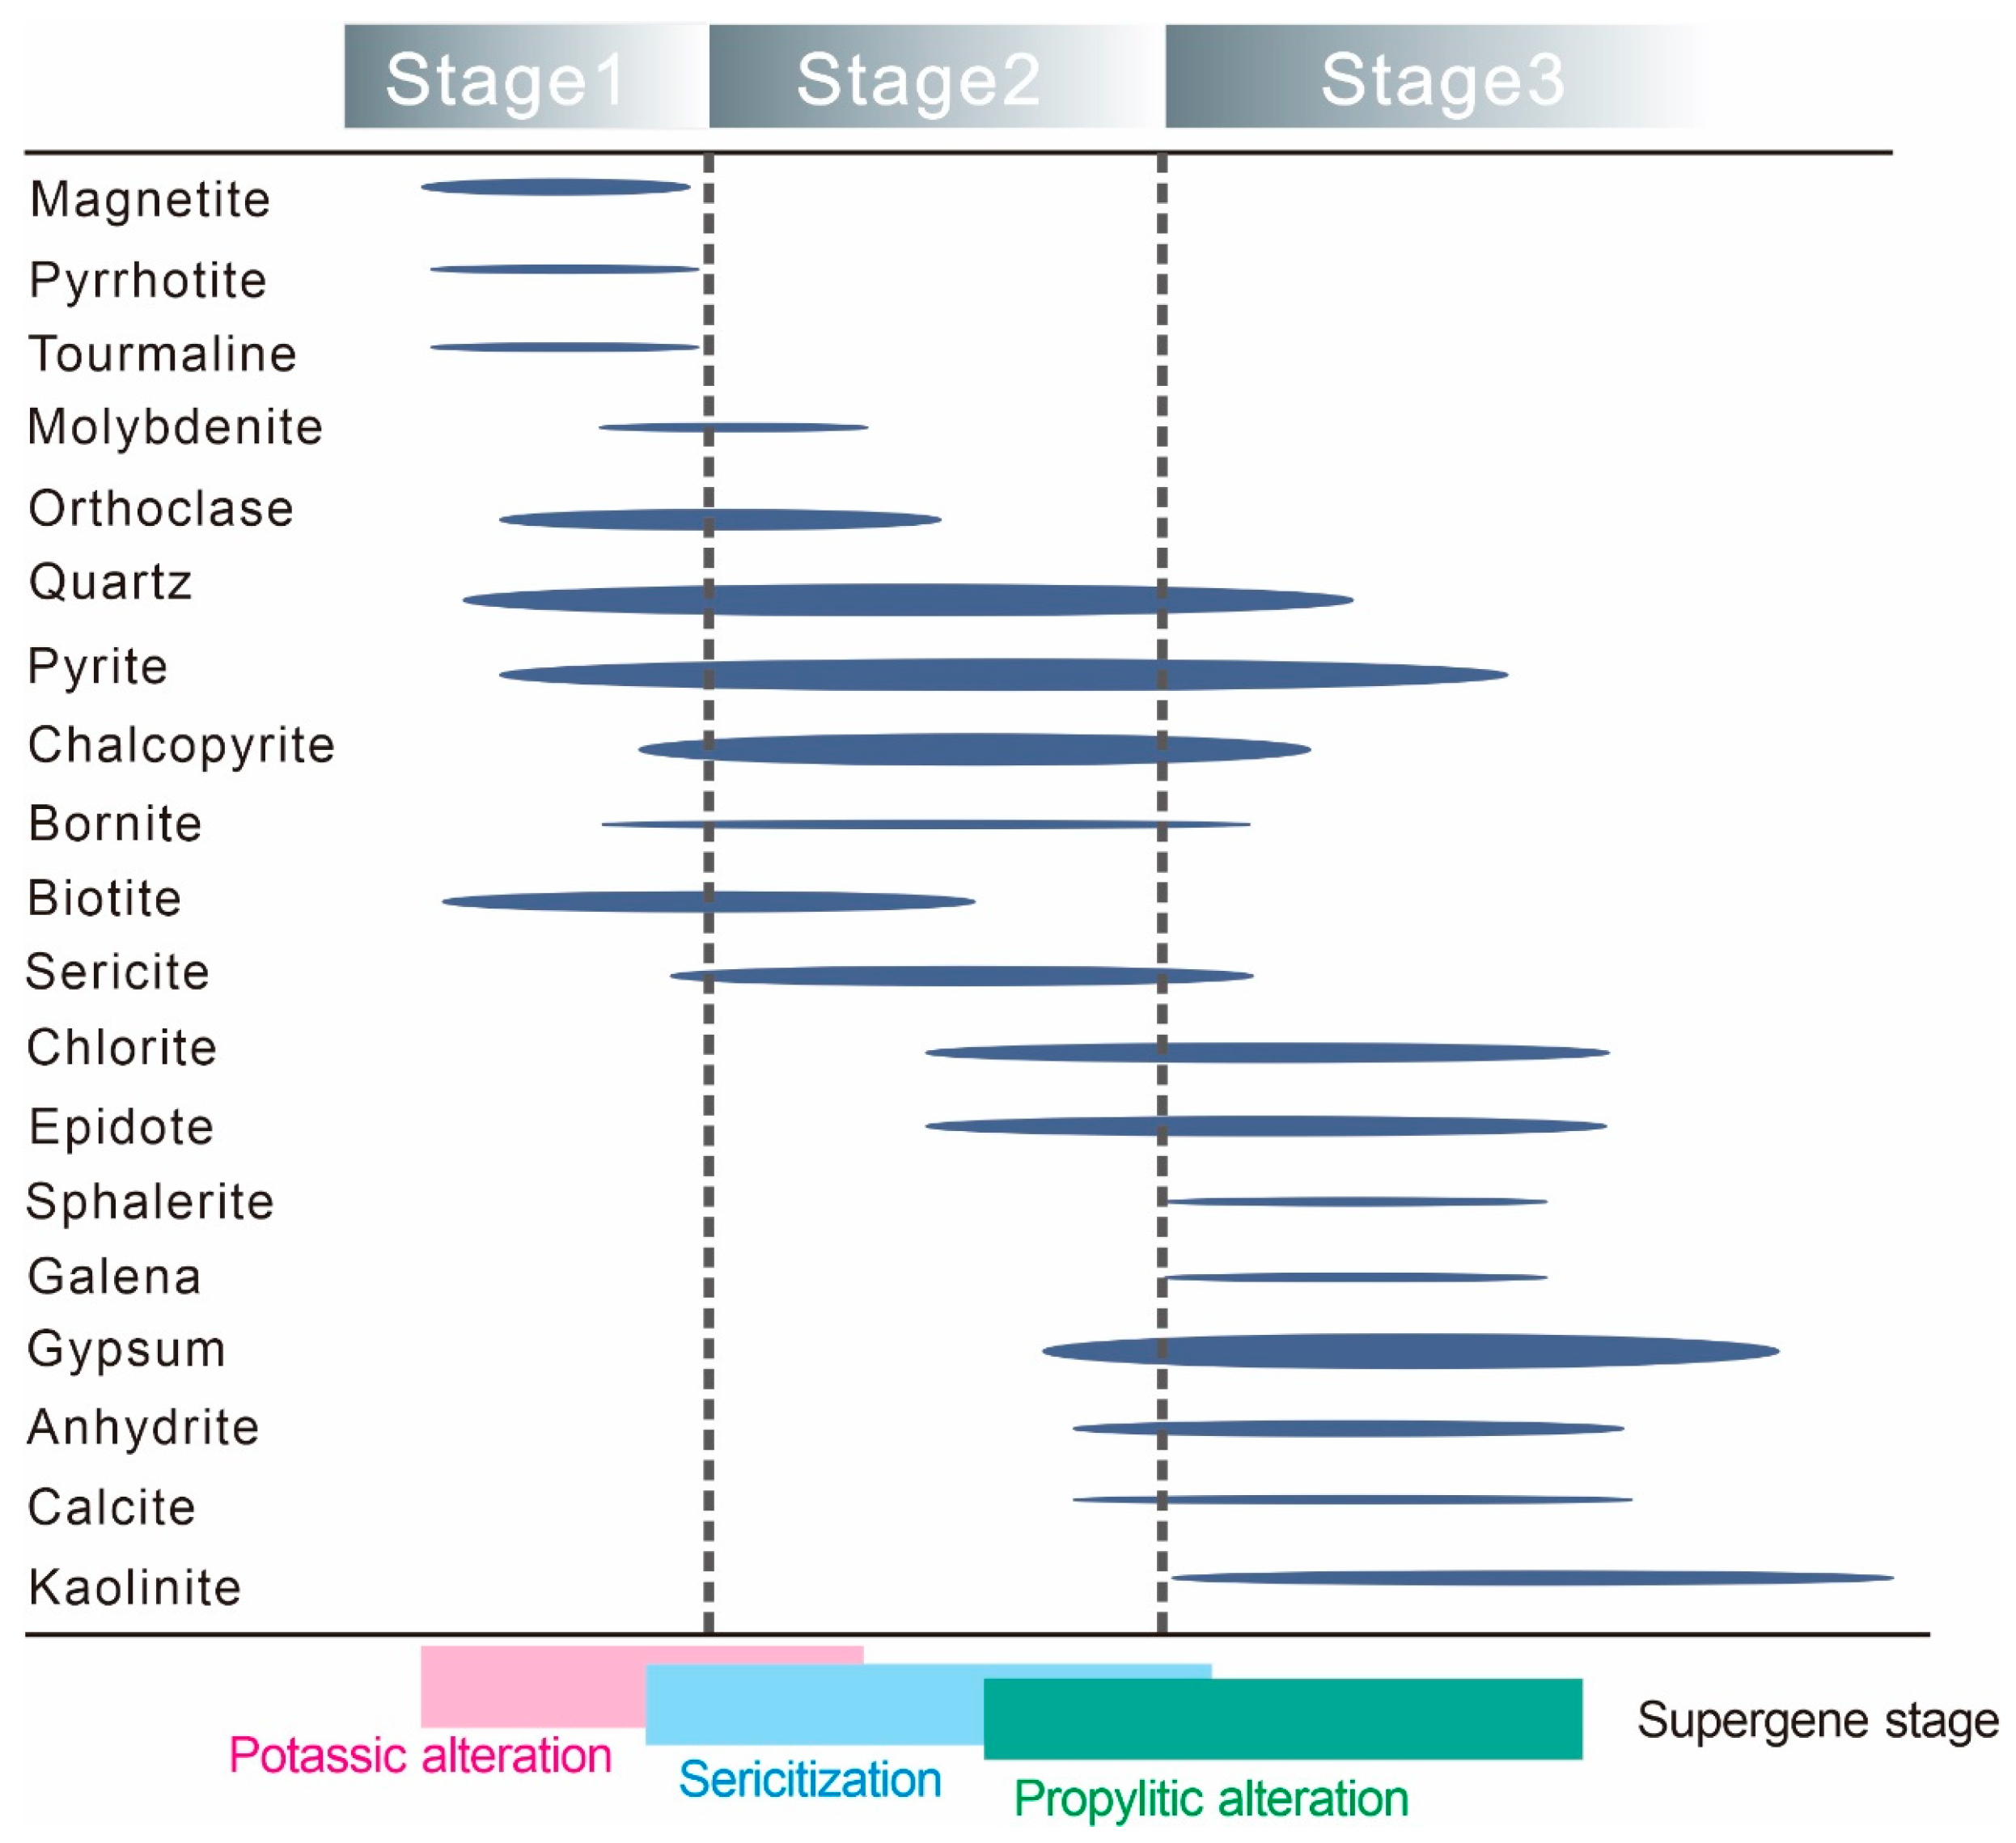
Based on the alteration characteristics of the Saindak deposit, the crosscutting relationships and ore-bearing properties of veins within the ore, as well as the mineral paragenesis and ore texture features, the mineralization process of the deposit is classified into the following two primary stages: the supergene stage and the hydrothermal stage. The following three separate stages are further identified in the hydrothermal stage: the sphalerite–galena–gypsum phase (Stage III), the quartz–chalcopyrite–pyrite phase (Stage II), and the pyrite–magnetite–molybdenite–quartz phase (Stage I) (Figure 9).
(1)
Pyrite–Magnetite–Molybdenite–Quartz Stage
The development of high-temperature indicator minerals defines this stage, including pyrite, magnetite, molybdenite, tourmaline, hydrothermal biotite, and quartz, accompanied by minor chalcopyrite. Metallic minerals predominantly occur as veinlets of filled fractures, with occasionally disseminated spot-like distributions. This stage corresponds to potassic alteration, evidenced by K-feldspathization and biotitization, marking the initiation of post-magmatic hydrothermal mineralization. The metallic minerals formed during this stage are frequently replaced by minerals from subsequent stages or crosscut by later vein systems.
(2)
Quartz–Chalcopyrite–Pyrite Stage
This stage of mineralization, which is the main one in a porphyry copper mine, yields quartz, pyrite, chalcopyrite, chlorite, sericite, and epidote. Chalcopyrite is observed replacing earlier pyrite, displaying replacement dissolution textures or filling fractures within pyrite to form inclusion structures. Veins formed during this stage are commonly intersected by those from later stages. The ore exhibits predominantly anhedral granular textures, with ore structures characterized by disseminated, veinlet, and veinlet–disseminated patterns.
(3)
Sphalerite–Galena–Gypsum Stage
During this stage, gangue minerals such gypsum, anhydrite, calcite, and minor quartz are formed alongside important metallic minerals like pyrite, galena, sphalerite, and lesser chalcopyrite. Metallic sulfides, together with gypsum, anhydrite, calcite, and quartz, are primarily deposited in veins, crosscutting veins from earlier stages (Stages I and II). Sphalerite and galena frequently replace pre-existing pyrite and chalcopyrite. This stage signifies the decline of hydrothermal fluid activity, culminating in the development of barren gypsum veins that mark the termination of the hydrothermal stage. These late-stage ore-barren gypsum veins typically occur in near-horizontal orientations, distinguishing them from the sulfide veins formed during earlier mineralization stages.

5.2. Geochronology of the Multiple Intrusive Phases

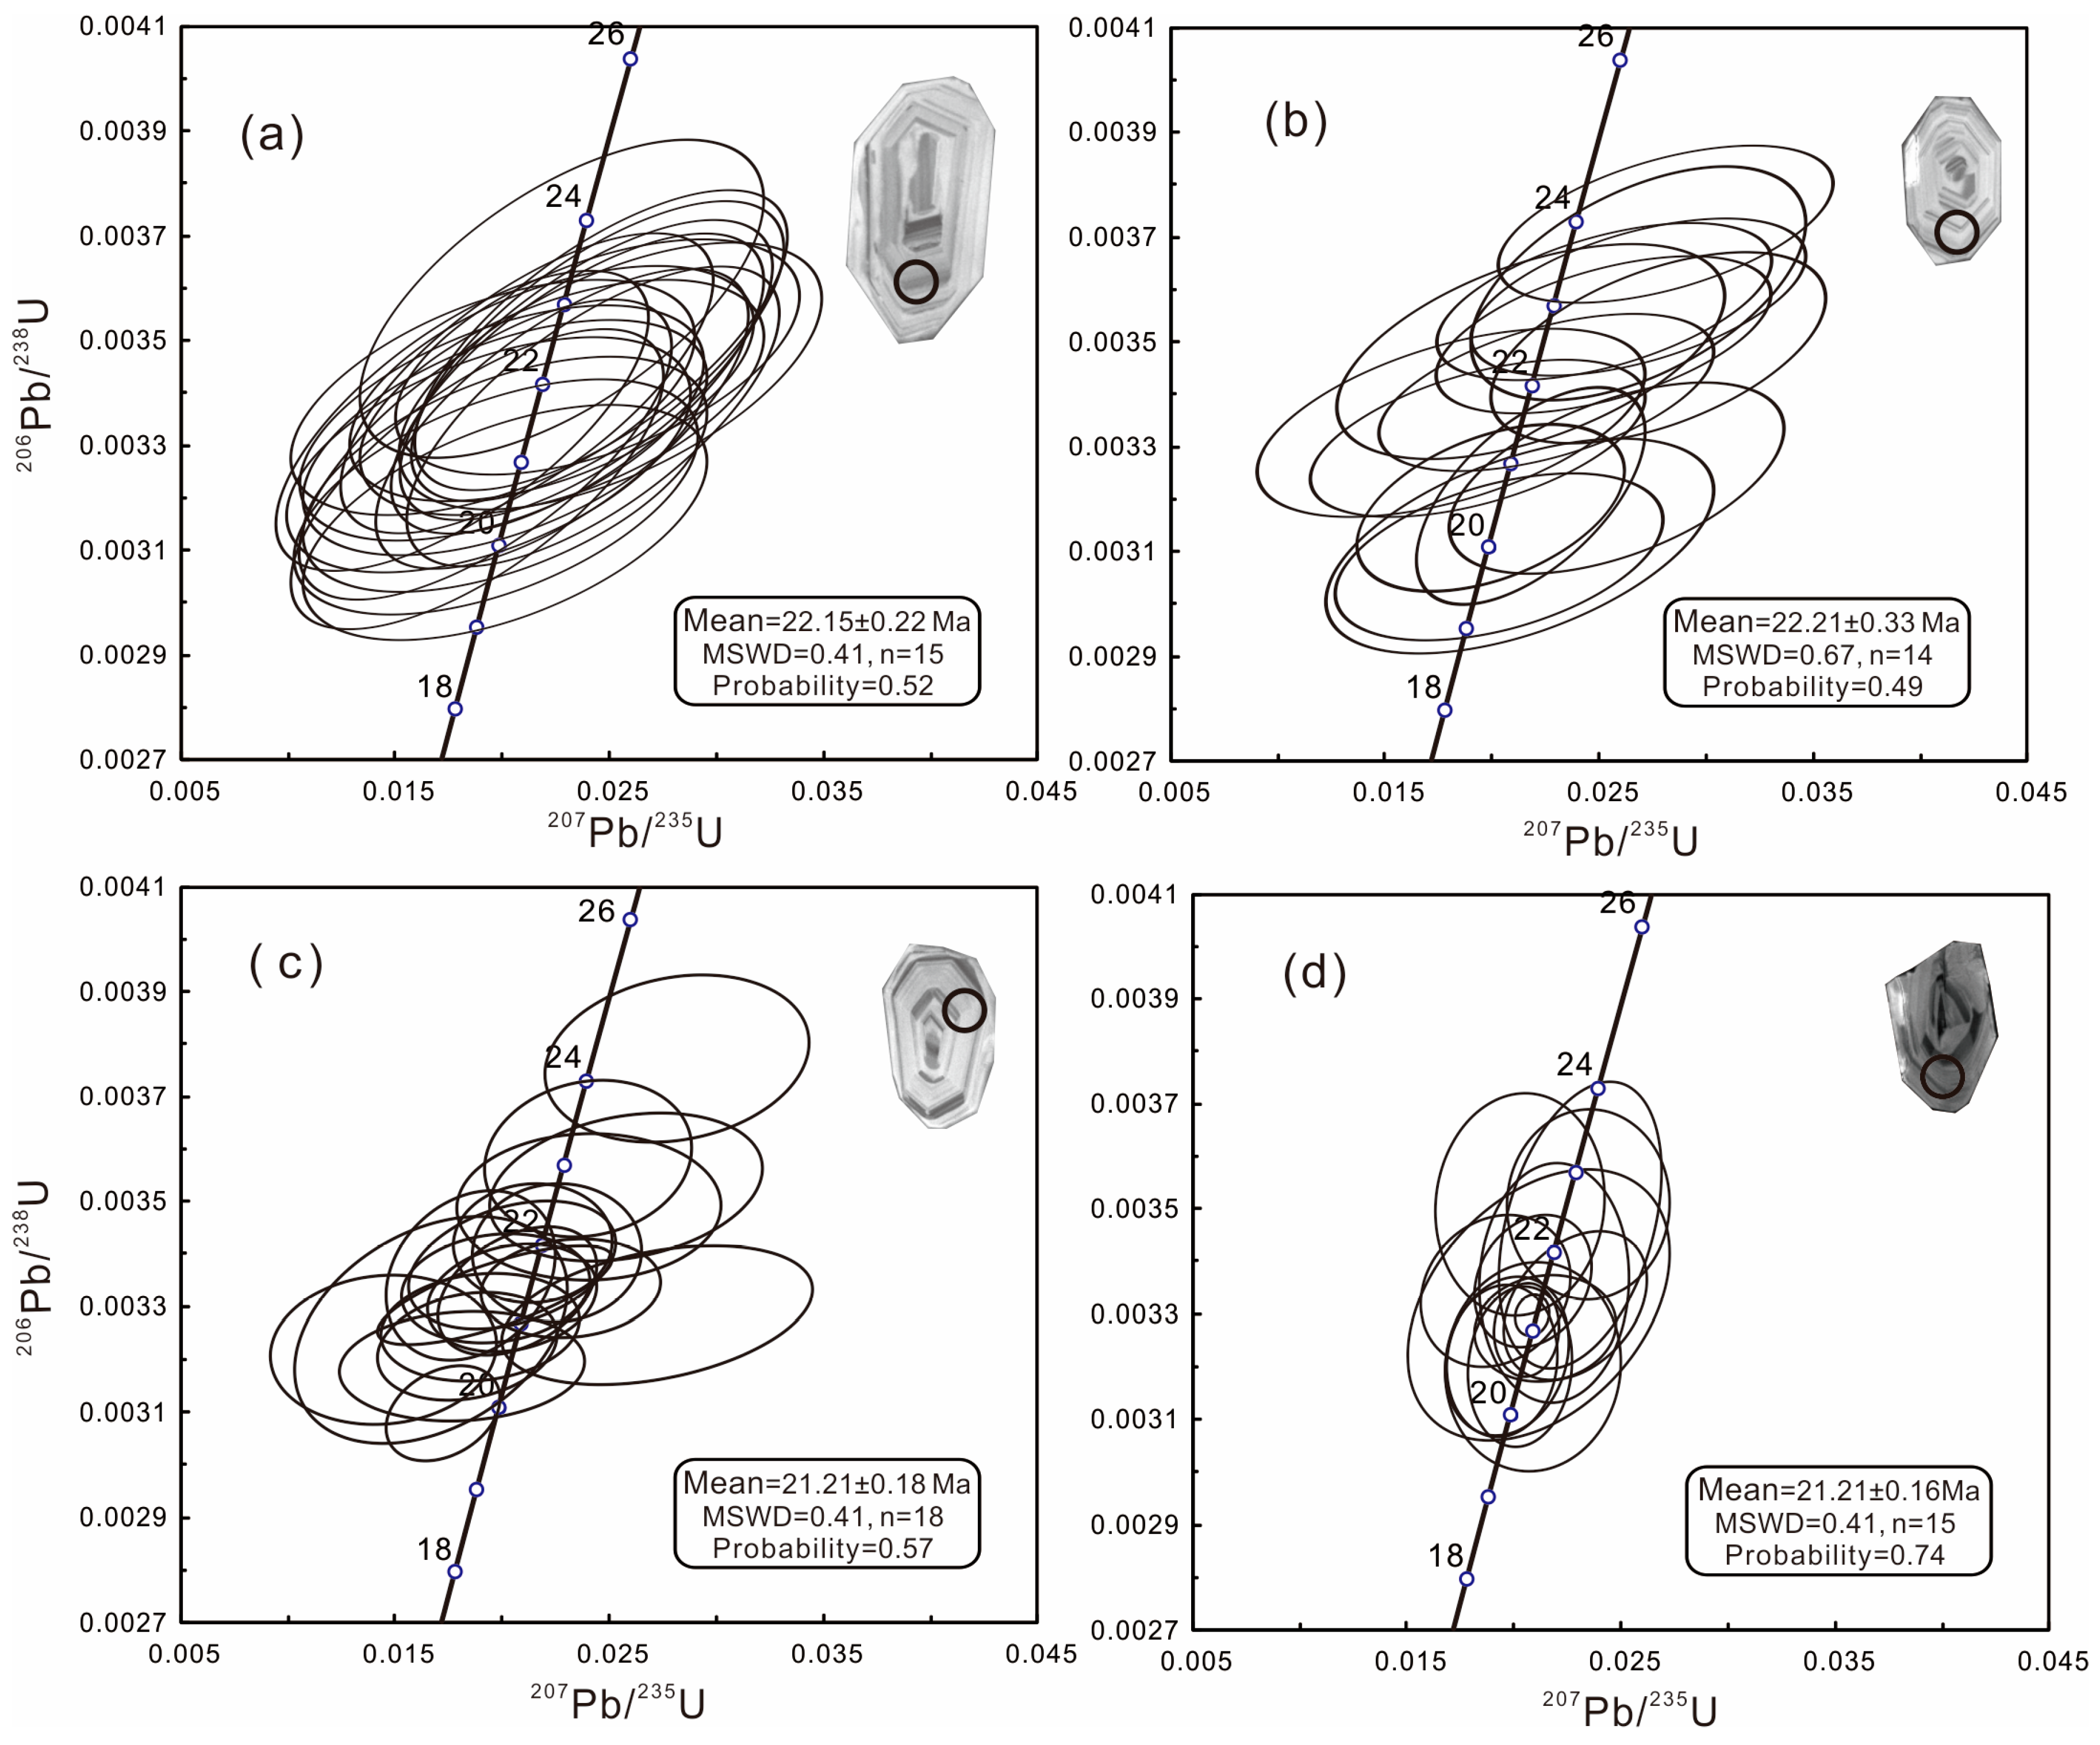
Zircon was separated from the quartz diorite porphyry (and MMEs), diorite porphyry, and mafic dike samples collected from the Saindak deposit. Zircons from these samples are characterized by euhedral to subhedral shapes. Zircons are typically colorless to light brown and translucent. In cathodoluminescence (CL) images of zircons, oscillatory zoning is readily visible, which indicates magmatic origins. Zircon crystals extracted from both the quartz diorite and diorite porphyries specimens exhibit elongation ratios ranging from 1.5:1 to 2.5:1, with individual crystal lengths typically falling within the 50–200 µm interval. Based on in-situ spot analyses, the concordia-weighted average 206Pb/238U age for fifteen zircon grains derived from the quartz diorite porphyry sample is calculated to be 22.15 ± 0.22 Ma (MSWD = 0.41 (Figure 10a). The properties of zircons from diorite porphyry are comparable to those of quartz diorite porphyry, exhibiting elongation proportions between 1.2:1 and 2:1, with individual crystal dimensions typically spanning 40 to 120 μm. U–Pb dating conducted on fourteen analytical points produced internally consistent (concordant) age data, yielding a weighted average 206Pb/238U age of 22.21 ± 0.33 Ma and a mean square of weighted deviates (MSWD) value of 0.67 (Figure 10b).
Zircons from the MMEs and mafic dikes are light brown and smaller in size, mostly less than 100 μm. Compared to quartz diorite porphyry, these zircons have substantially greater Th and U concentrations. CL images reveal that the zircons exhibit relatively dark cathodoluminescence and indistinct oscillatory zoning. The magmatic origin of the zircon crystals is further corroborated by their Th/U values at the analyzed points, which span from 0.43 to 1.87. Radiometric age determinations reveal that the 206Pb/238U ratios from eighteen individual analyses are tightly clustered, aligning closely with the concordia curve. These yield a pooled average 206Pb/238U age of 21.21 ± 0.18 million years (MSWD = 0.41, n = 18) (Figure 10c), an age that corresponds well with that of the associated host lithology. In the case of the mafic dike, fifteen separate analytical sites produced consistent (concordant) U–Pb ages for zircon, with a mean 206Pb/238U date of 21.21 ± 0.16 Ma (MSWD = 0.41, n = 15) (Figure 10d).

5.3. Molybdenite Re–Os Ages

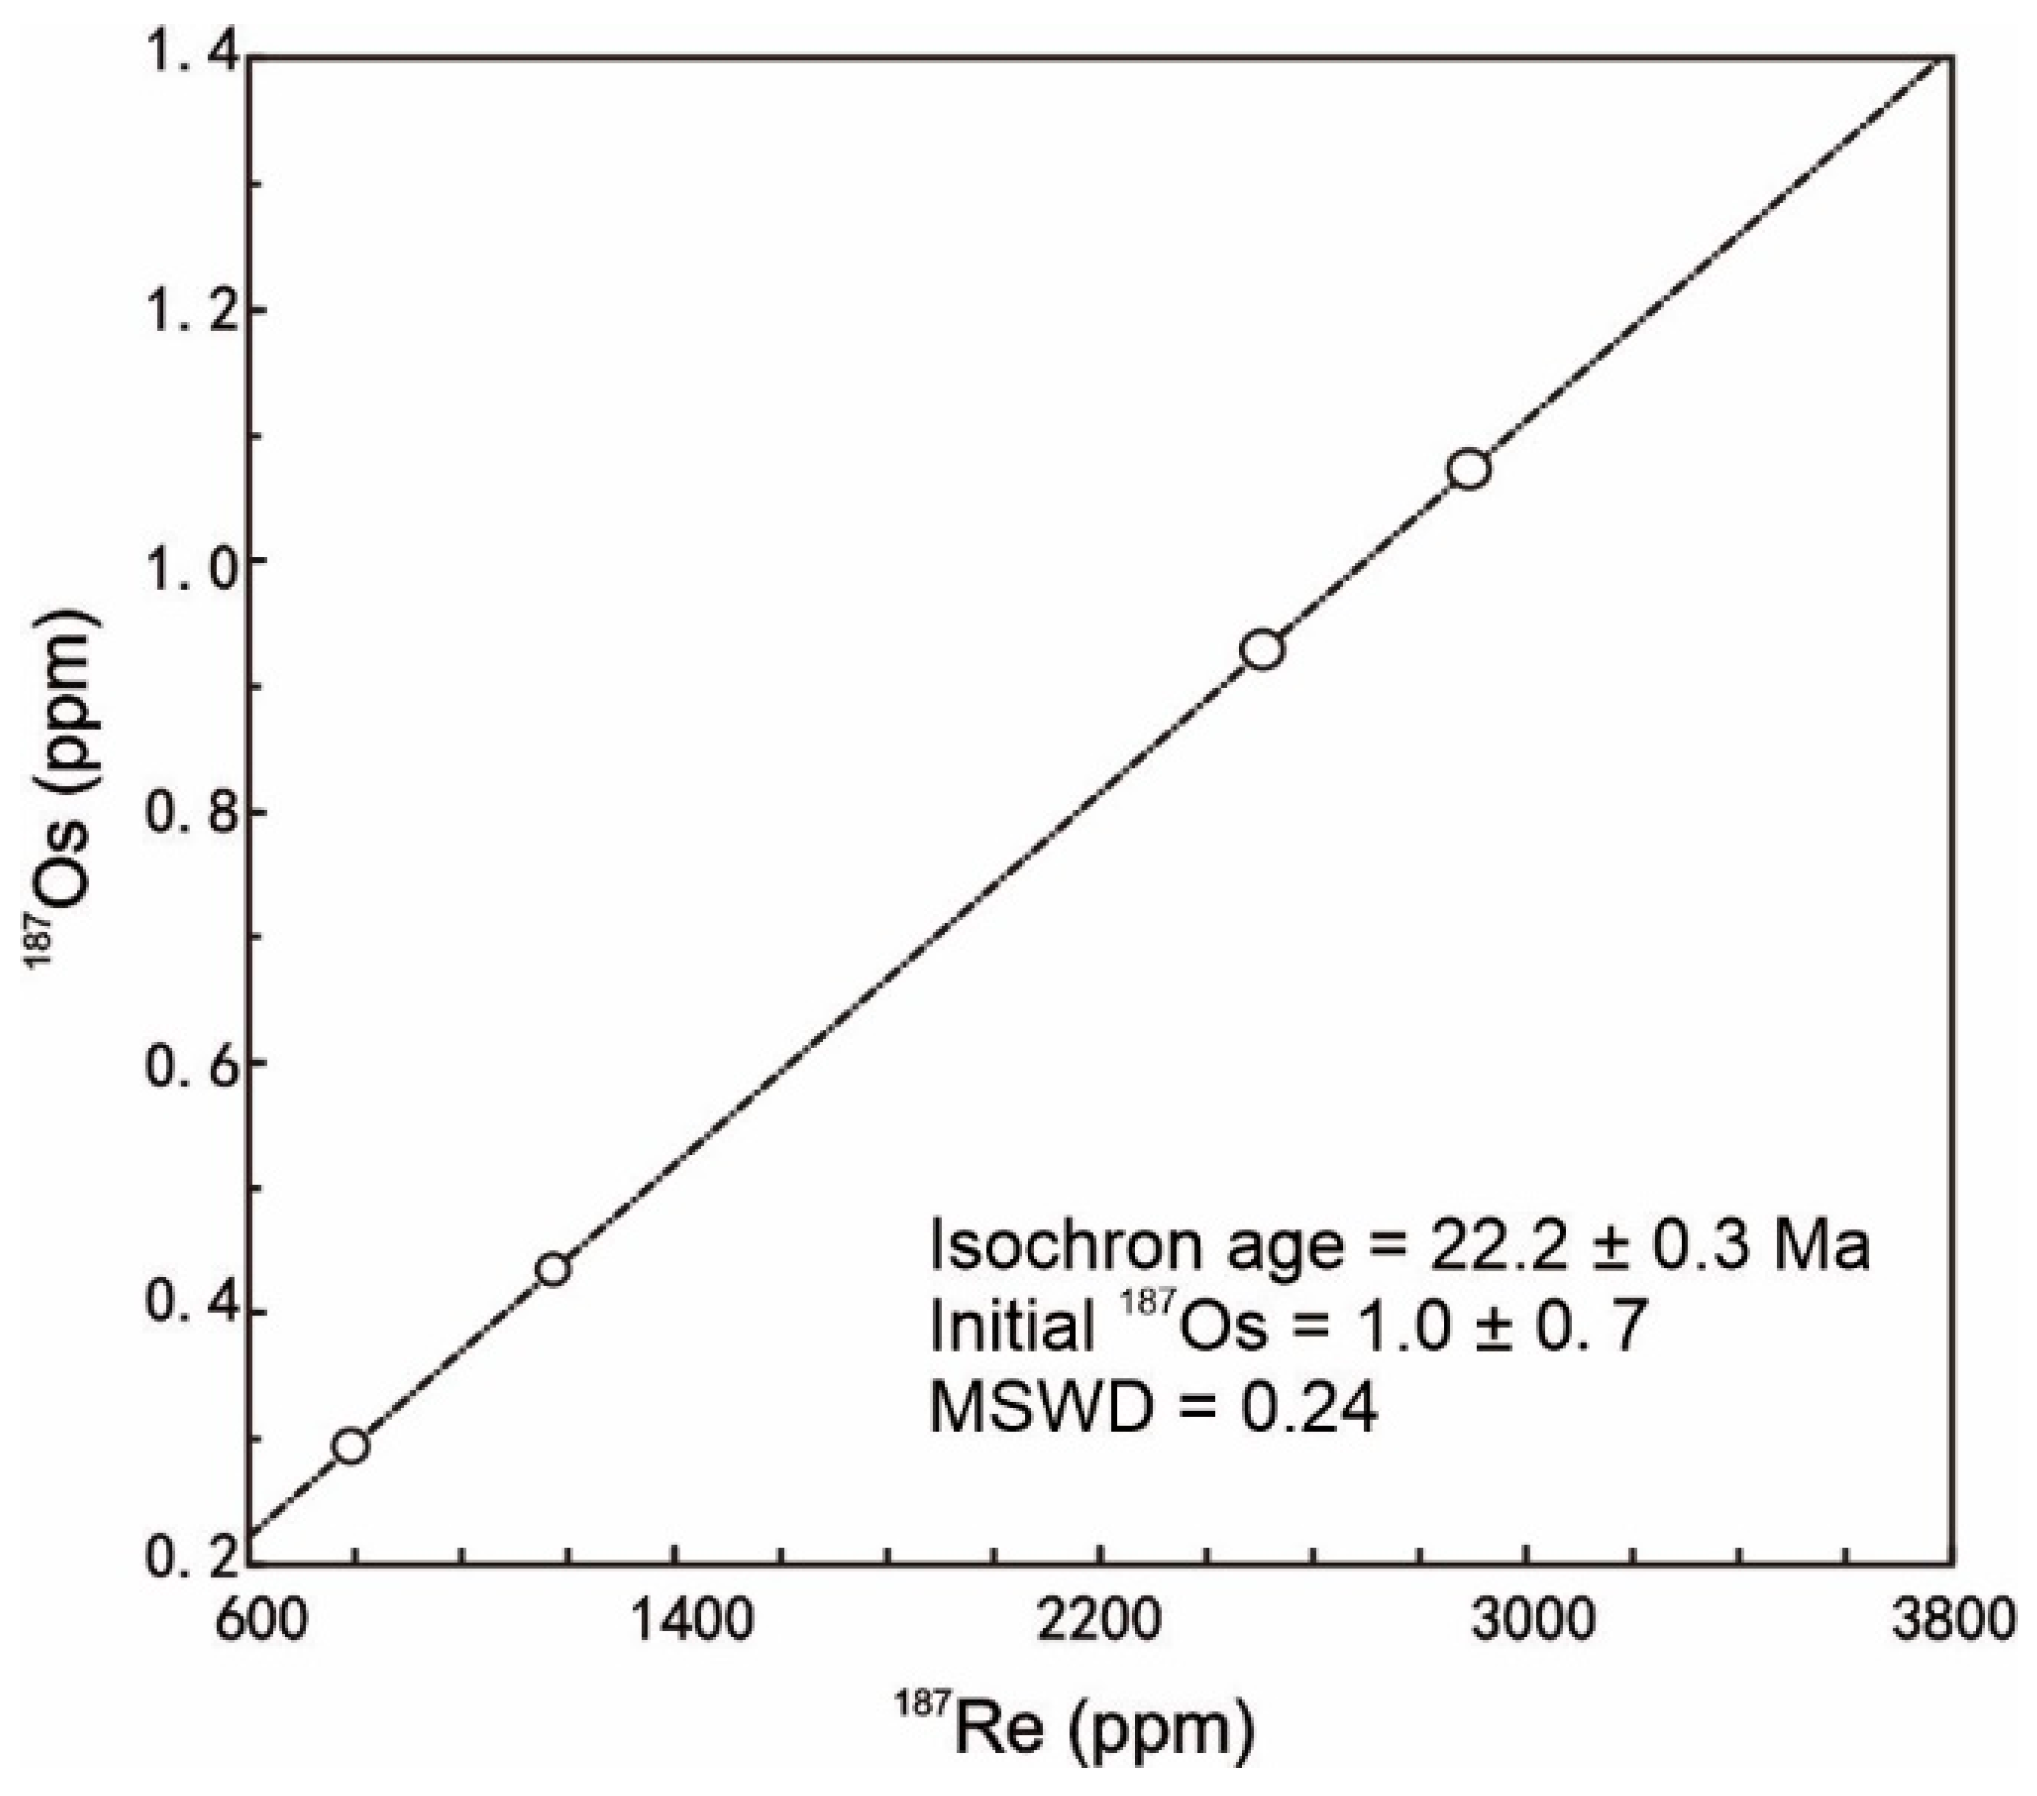
The four molybdenite samples used in this investigation were taken from drill holes, where the molybdenite appears as euhedral flakes and is linked to chalcopyrite, pyrite, and quartz. The isotopic data and Re and Os abundances of the four molybdenite samples are provided in Table 1. The concentrations of 187Os and total Re range from 7.799 to 15.580 ppb and 3.311 to 6.580 ppm, respectively. With a weighted mean of 22.2 ± 0.3 Ma (MSWD = 0.24), the Re–Os model dates of the four molybdenite samples vary from 21.93 ± 0.2 to 22.35 ± 0.3 Ma (Figure 11). The calculated model dates are all comparable within errors. Therefore, the weighted average model age is interpreted as the age of molybdenite crystallization during the mineralization of the Saindak copper deposit.

5.4. Geochemistry of Intrusive Rocks

(1)
Whole-Rock Geochemical Signatures: Major and Trace Constituents
Geochemical analysis results for bulk-rock major and minor elements in quartz diorite porphyry, diorite porphyry, and the associated mafic dike are compiled in Table 2.
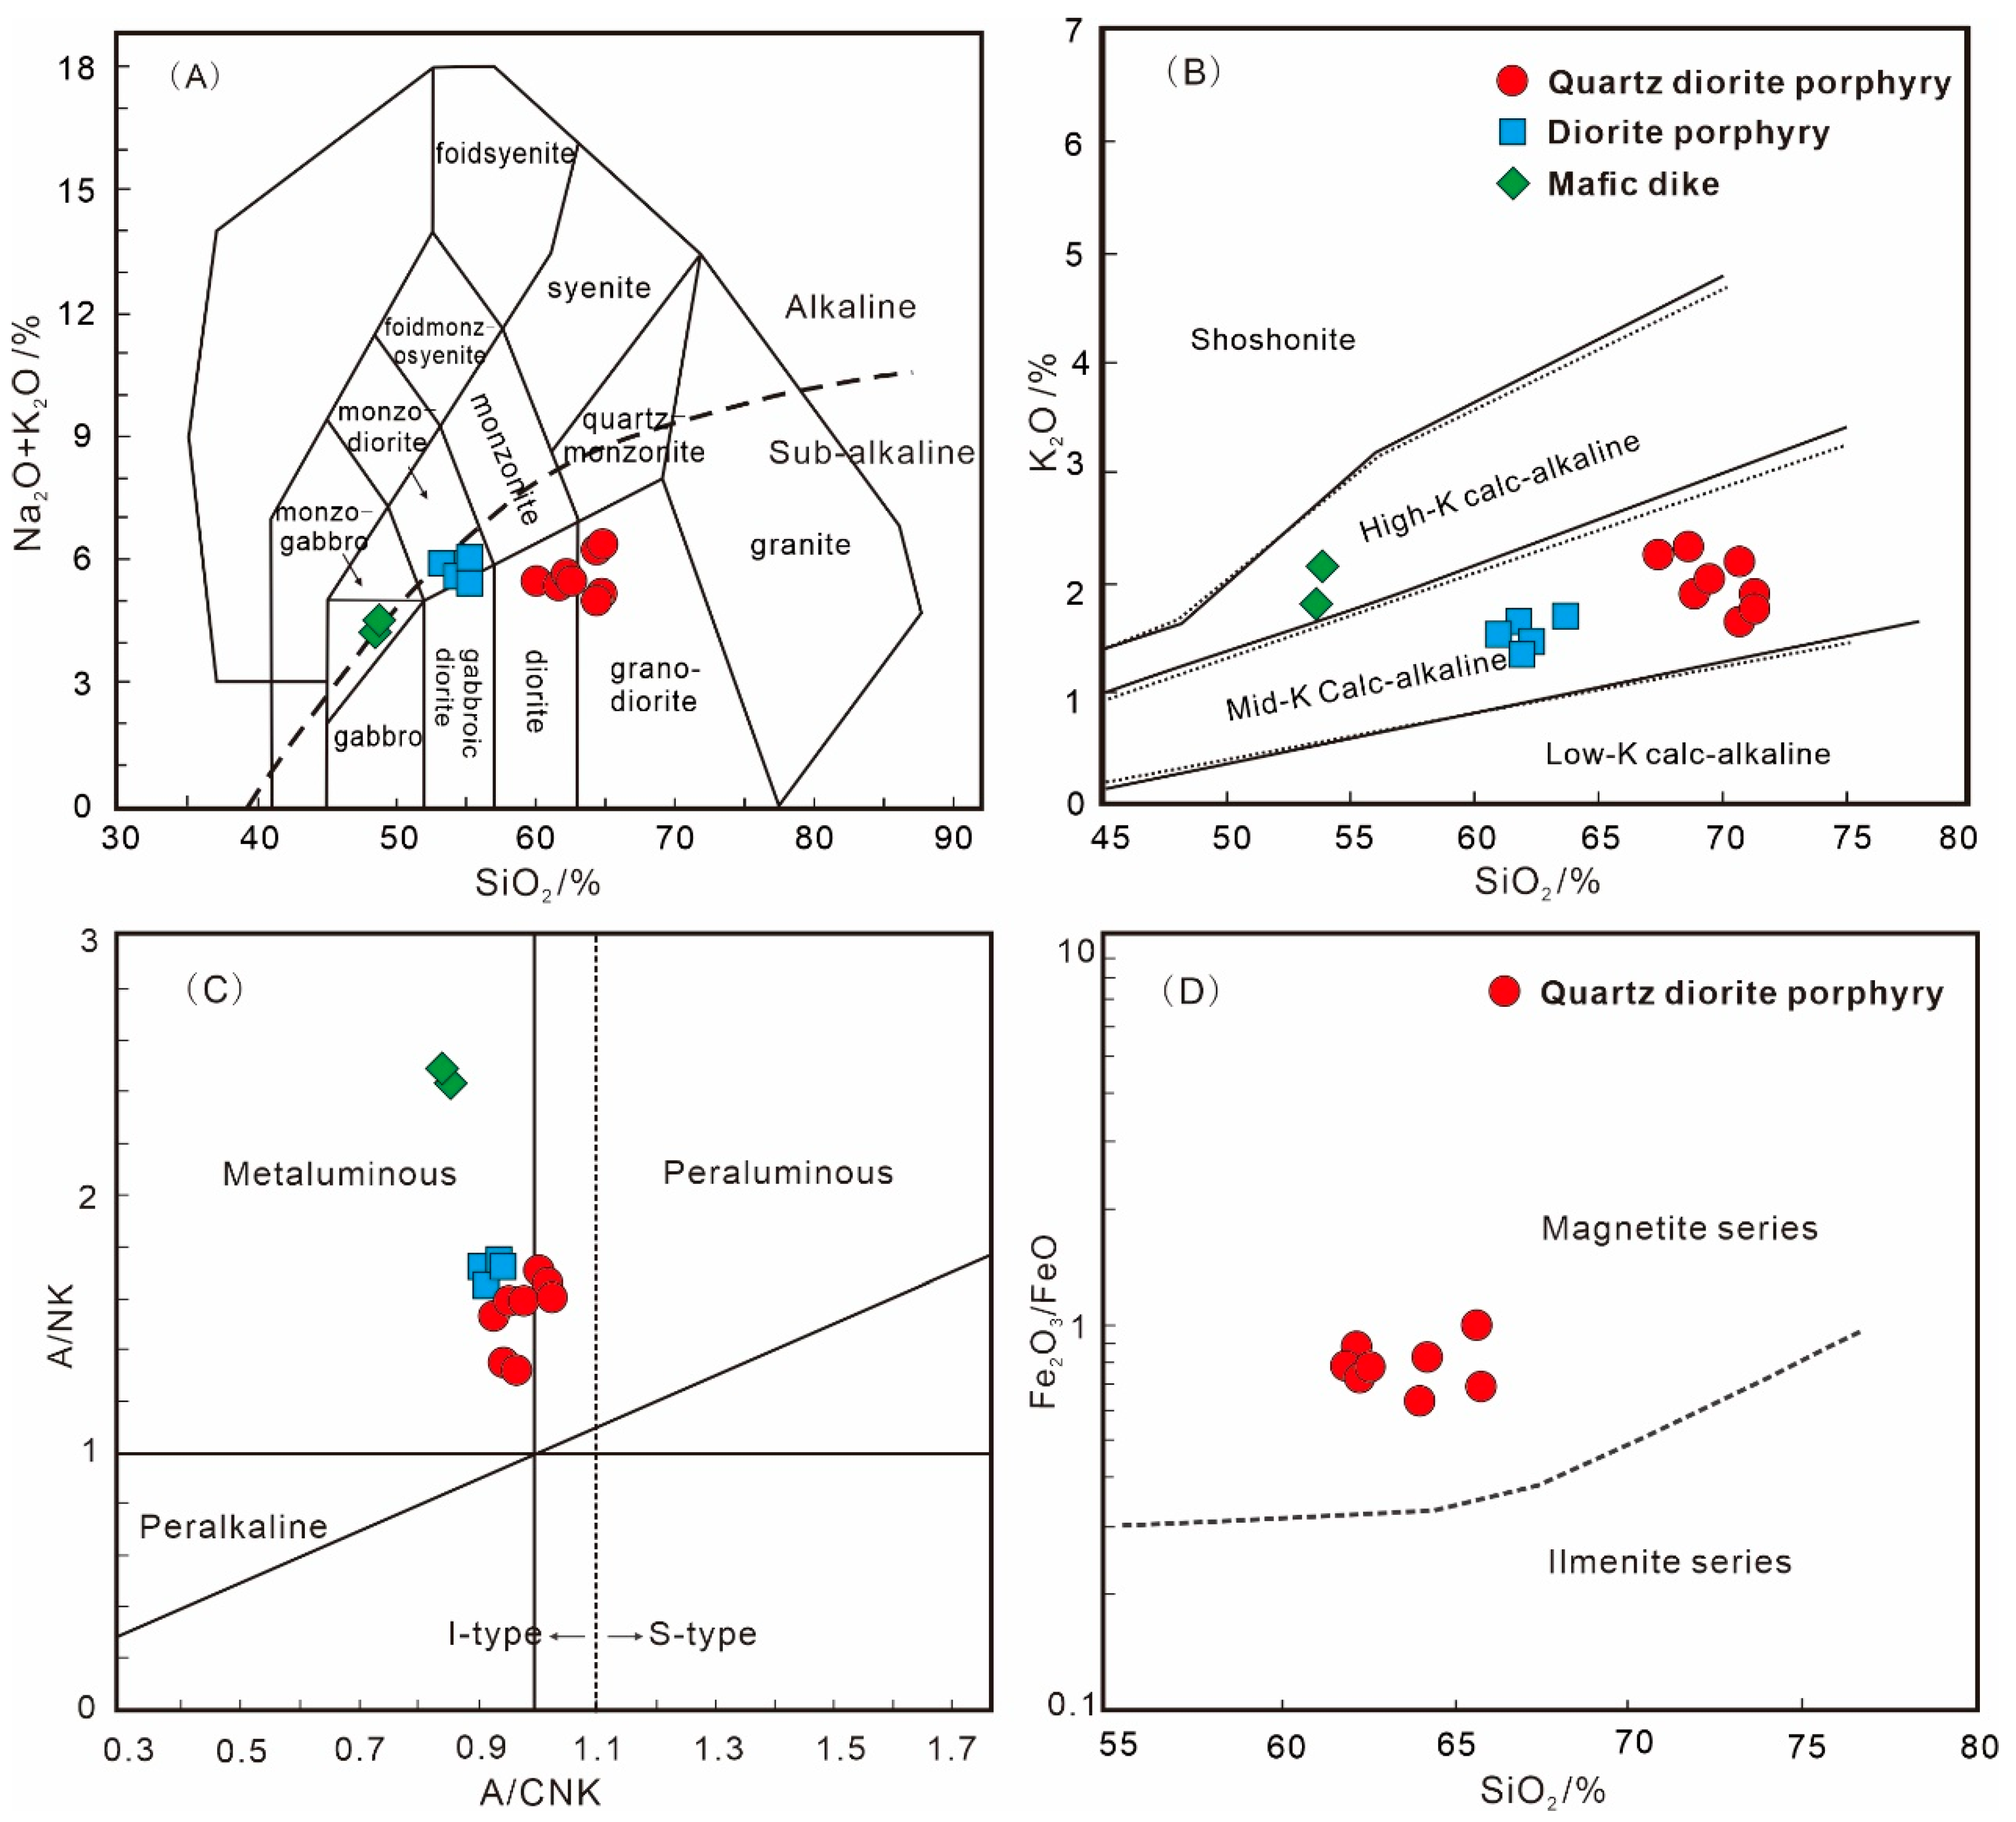
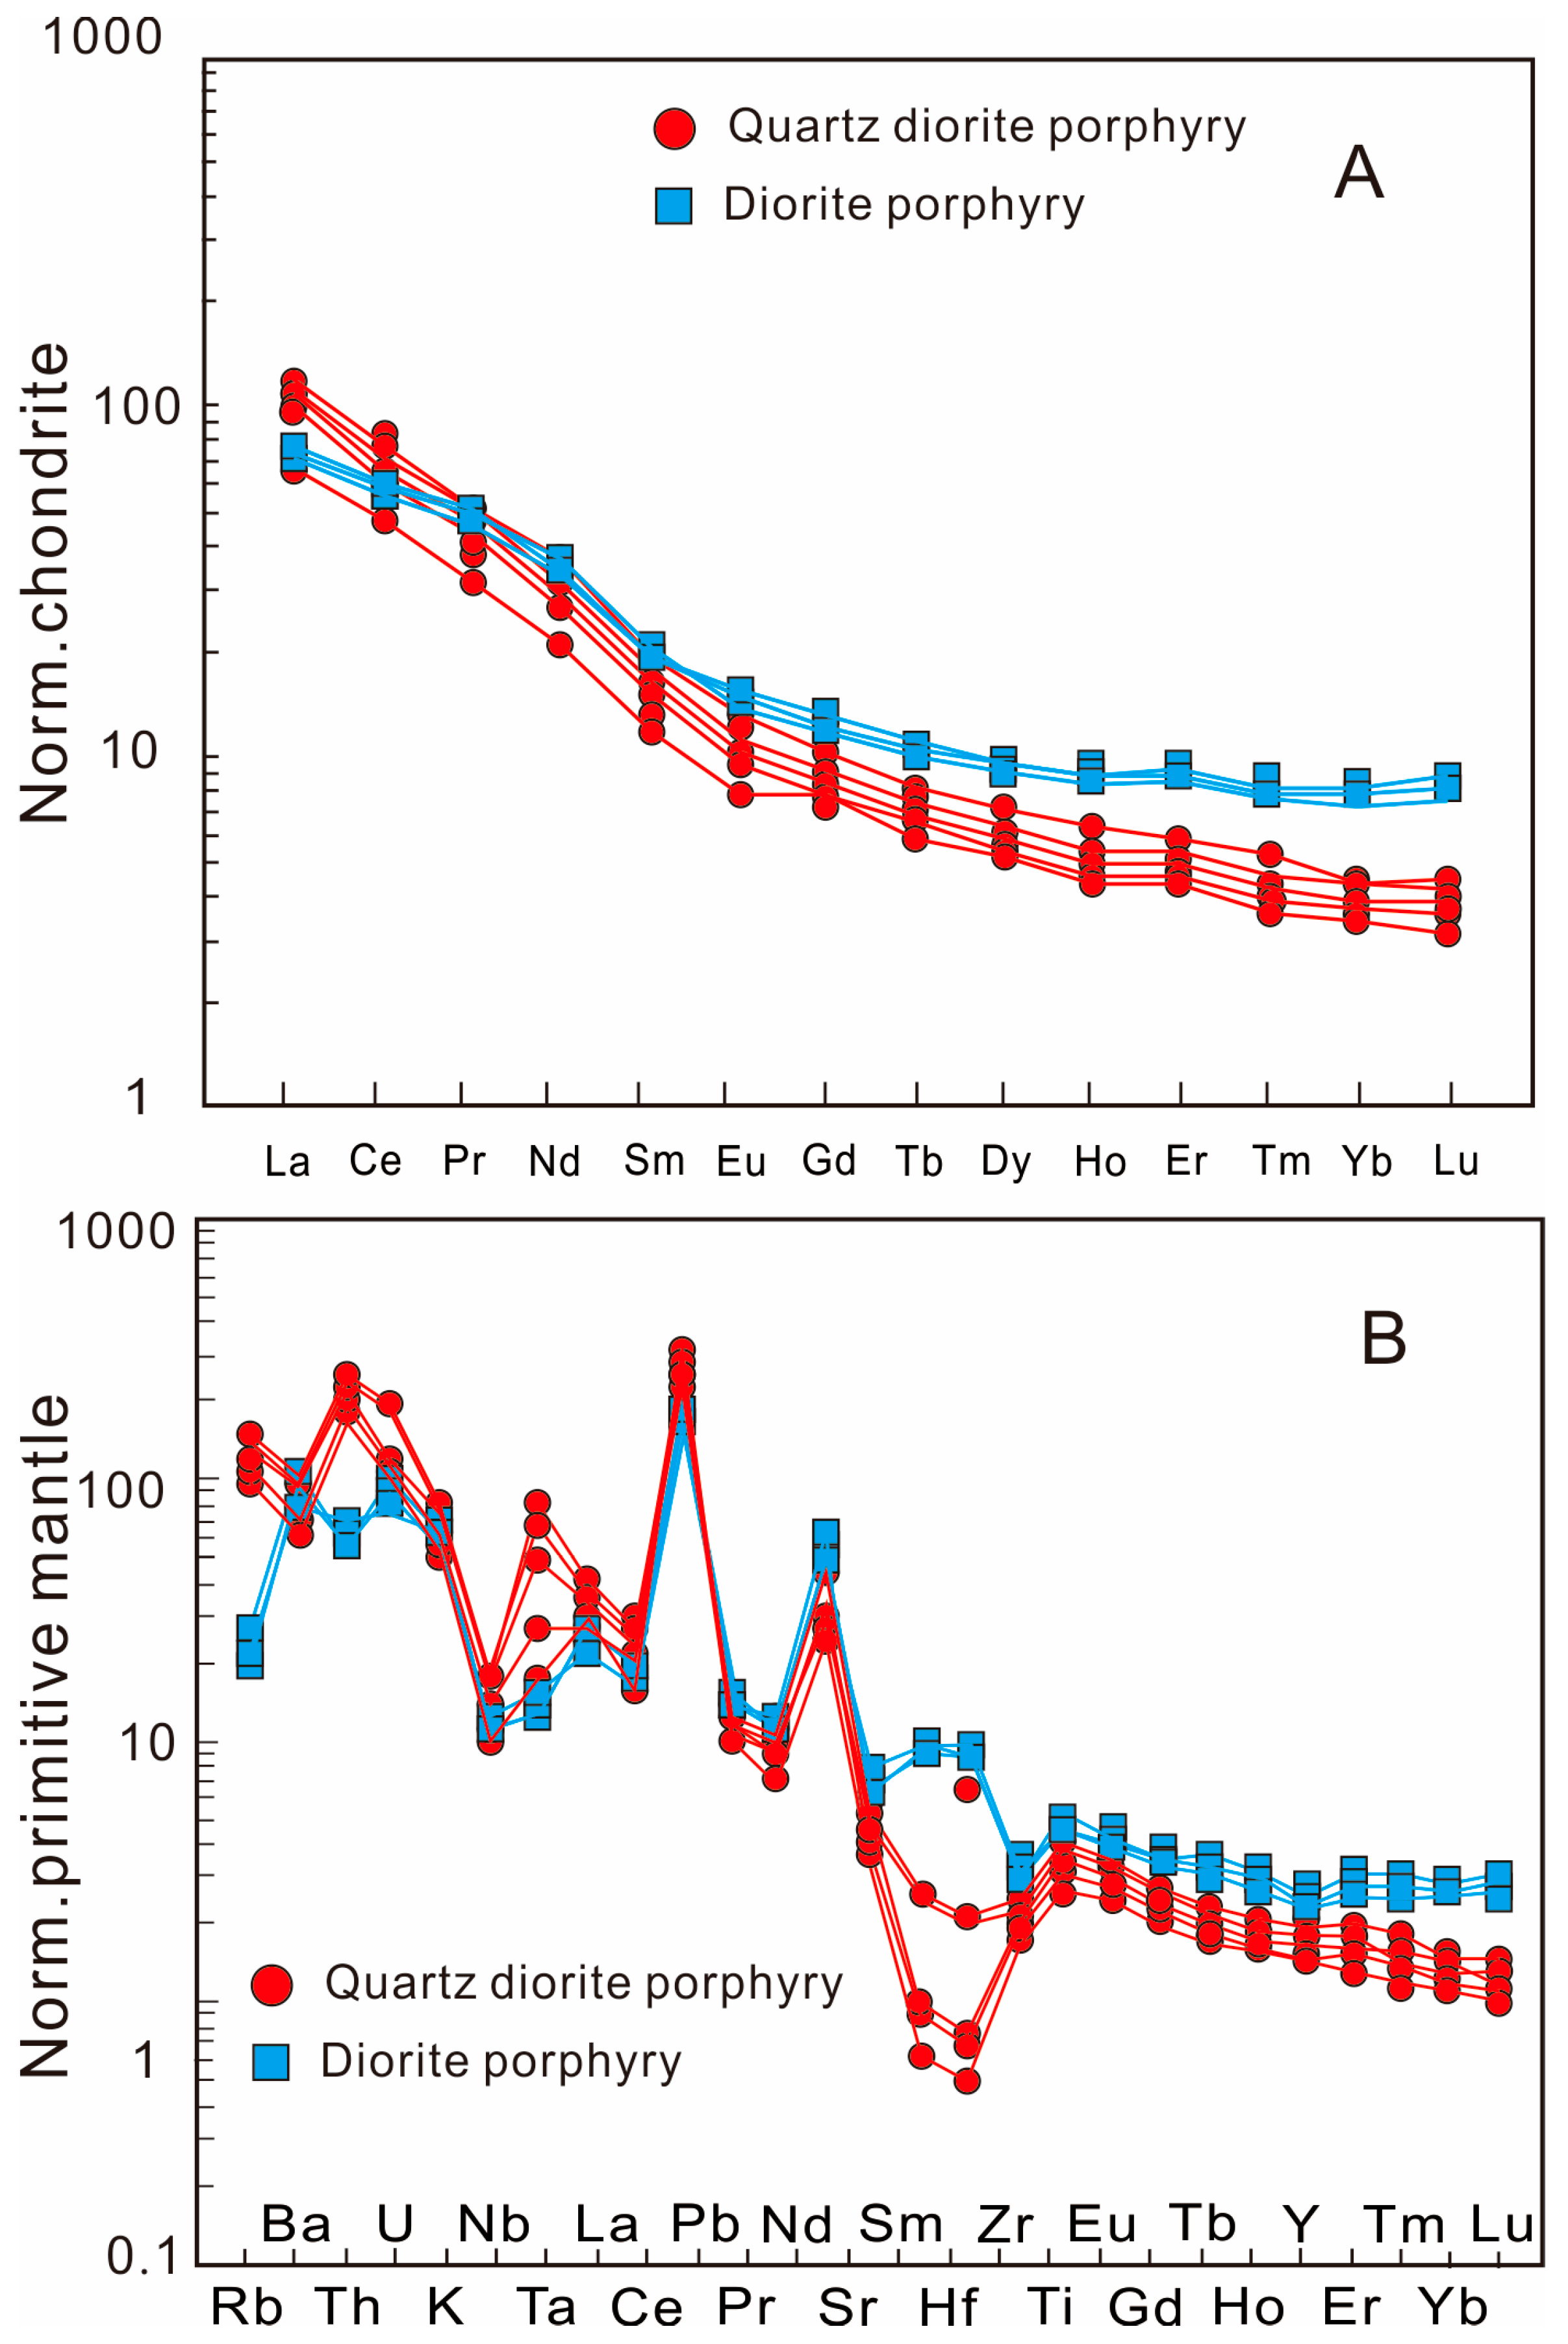
The quartz diorite porphyries that contain ore are distinguished by their low MgO contents (between 2.19 and 3.1 wt.%), high SiO2 contents (61.9 to 65.8 wt.%), depleted levels of compatible trace metals—such as Cr ranging from 36.3 to 79.7 ppm and Ni from 14.5 to 37.8 ppm—and moderate Mg indices (Mg# = 100 × Mg/(Mg + Fe)) falling between 51.05 and 59.21. According to the total alkali-silica (TAS) diagram, they exhibit typical calc-alkaline compositions (Figure 12A) and high Fe2O3/FeO ratios, belonging to magnetite-series granite (Figure 12). Quartz diorite porphyries display chondrite-normalized rare earth element (REE) curves with minimal Eu anomalies (Eu/Eu values from 0.88 to 1.12) and clearly fractionated profiles (Figure 12). These are characterized by elevated La/Yb ratios (ranging from 18.41 to 25.87), suppressed heavy REE levels—such as Yb between 0.99 and 1.40 ppm—and relatively low Y concentrations of 9.07 to 11.9 ppm. Additionally, these rocks have high Sr/Y ratios of 51.58 to 83.24 and high Sr concentrations of 641 to 755 ppm. The samples display marked positive anomalies for Th, U, K, Ba, Rb, and Pb when normalized to primitive mantle values, coupled with significant LILEs enrichment relative to HFSEs (Figure 13).
The diorite porphyry samples also plot within the middle-K calc-alkaline series field in the K2O vs. SiO2 diagram (Figure 12B). They contain high amounts of TFe2O3 (7.47~7.65 wt.%), Al2O3 (18.08~18.26 wt.%), and MgO (4.25~4.40 wt.%). These diorite porphyrites exhibit fractionated REE patterns (La/Yb = 7.51–8.38) and small negative Eu anomalies (Eu/Eu* = 0.79–0.86) in the chondrite-normalized REE patterns. They also have low HREE concentrations (e.g., Yb contents between 1.32 and 1.40 ppm) and Y contents from 11.5 to 11.9 ppm (Table 2). The diorite porphyry samples have Sr/Y ratios of 110.9 to 114.3 and high Sr concentrations between 1275 and 1390 ppm. They are distinguished by positive Th-U-K-Pb anomalies and negative Th-U-K-Pb-Ba-Rb anomalies, as well as enrichment in LILEs and depletion in HFSEs (Figure 13).
There are two mafic dike samples with high MgO levels (9.86 to 10.07 wt.%) and Mg# values (66.1 to 66.3). They contain higher HREE and Y contents (e.g., Yb concentrations of 1.94–2.07 ppm; Y contents of 19.6–19.7 ppm) than quartz diorite porphyry and diorite porphyry, but relatively low LREE and Sr contents (567–603 ppm, Figure 11) and Sr/Y ratios (28.8–30.8). The Chondrite-normalized REE distributions display weak positive Eu anomalies (Eu/Eu* = 0.73–0.82) and fractionated REE patterns (Figure 13).
(2)
Bulk-Rock Sr-Nd Isotopes
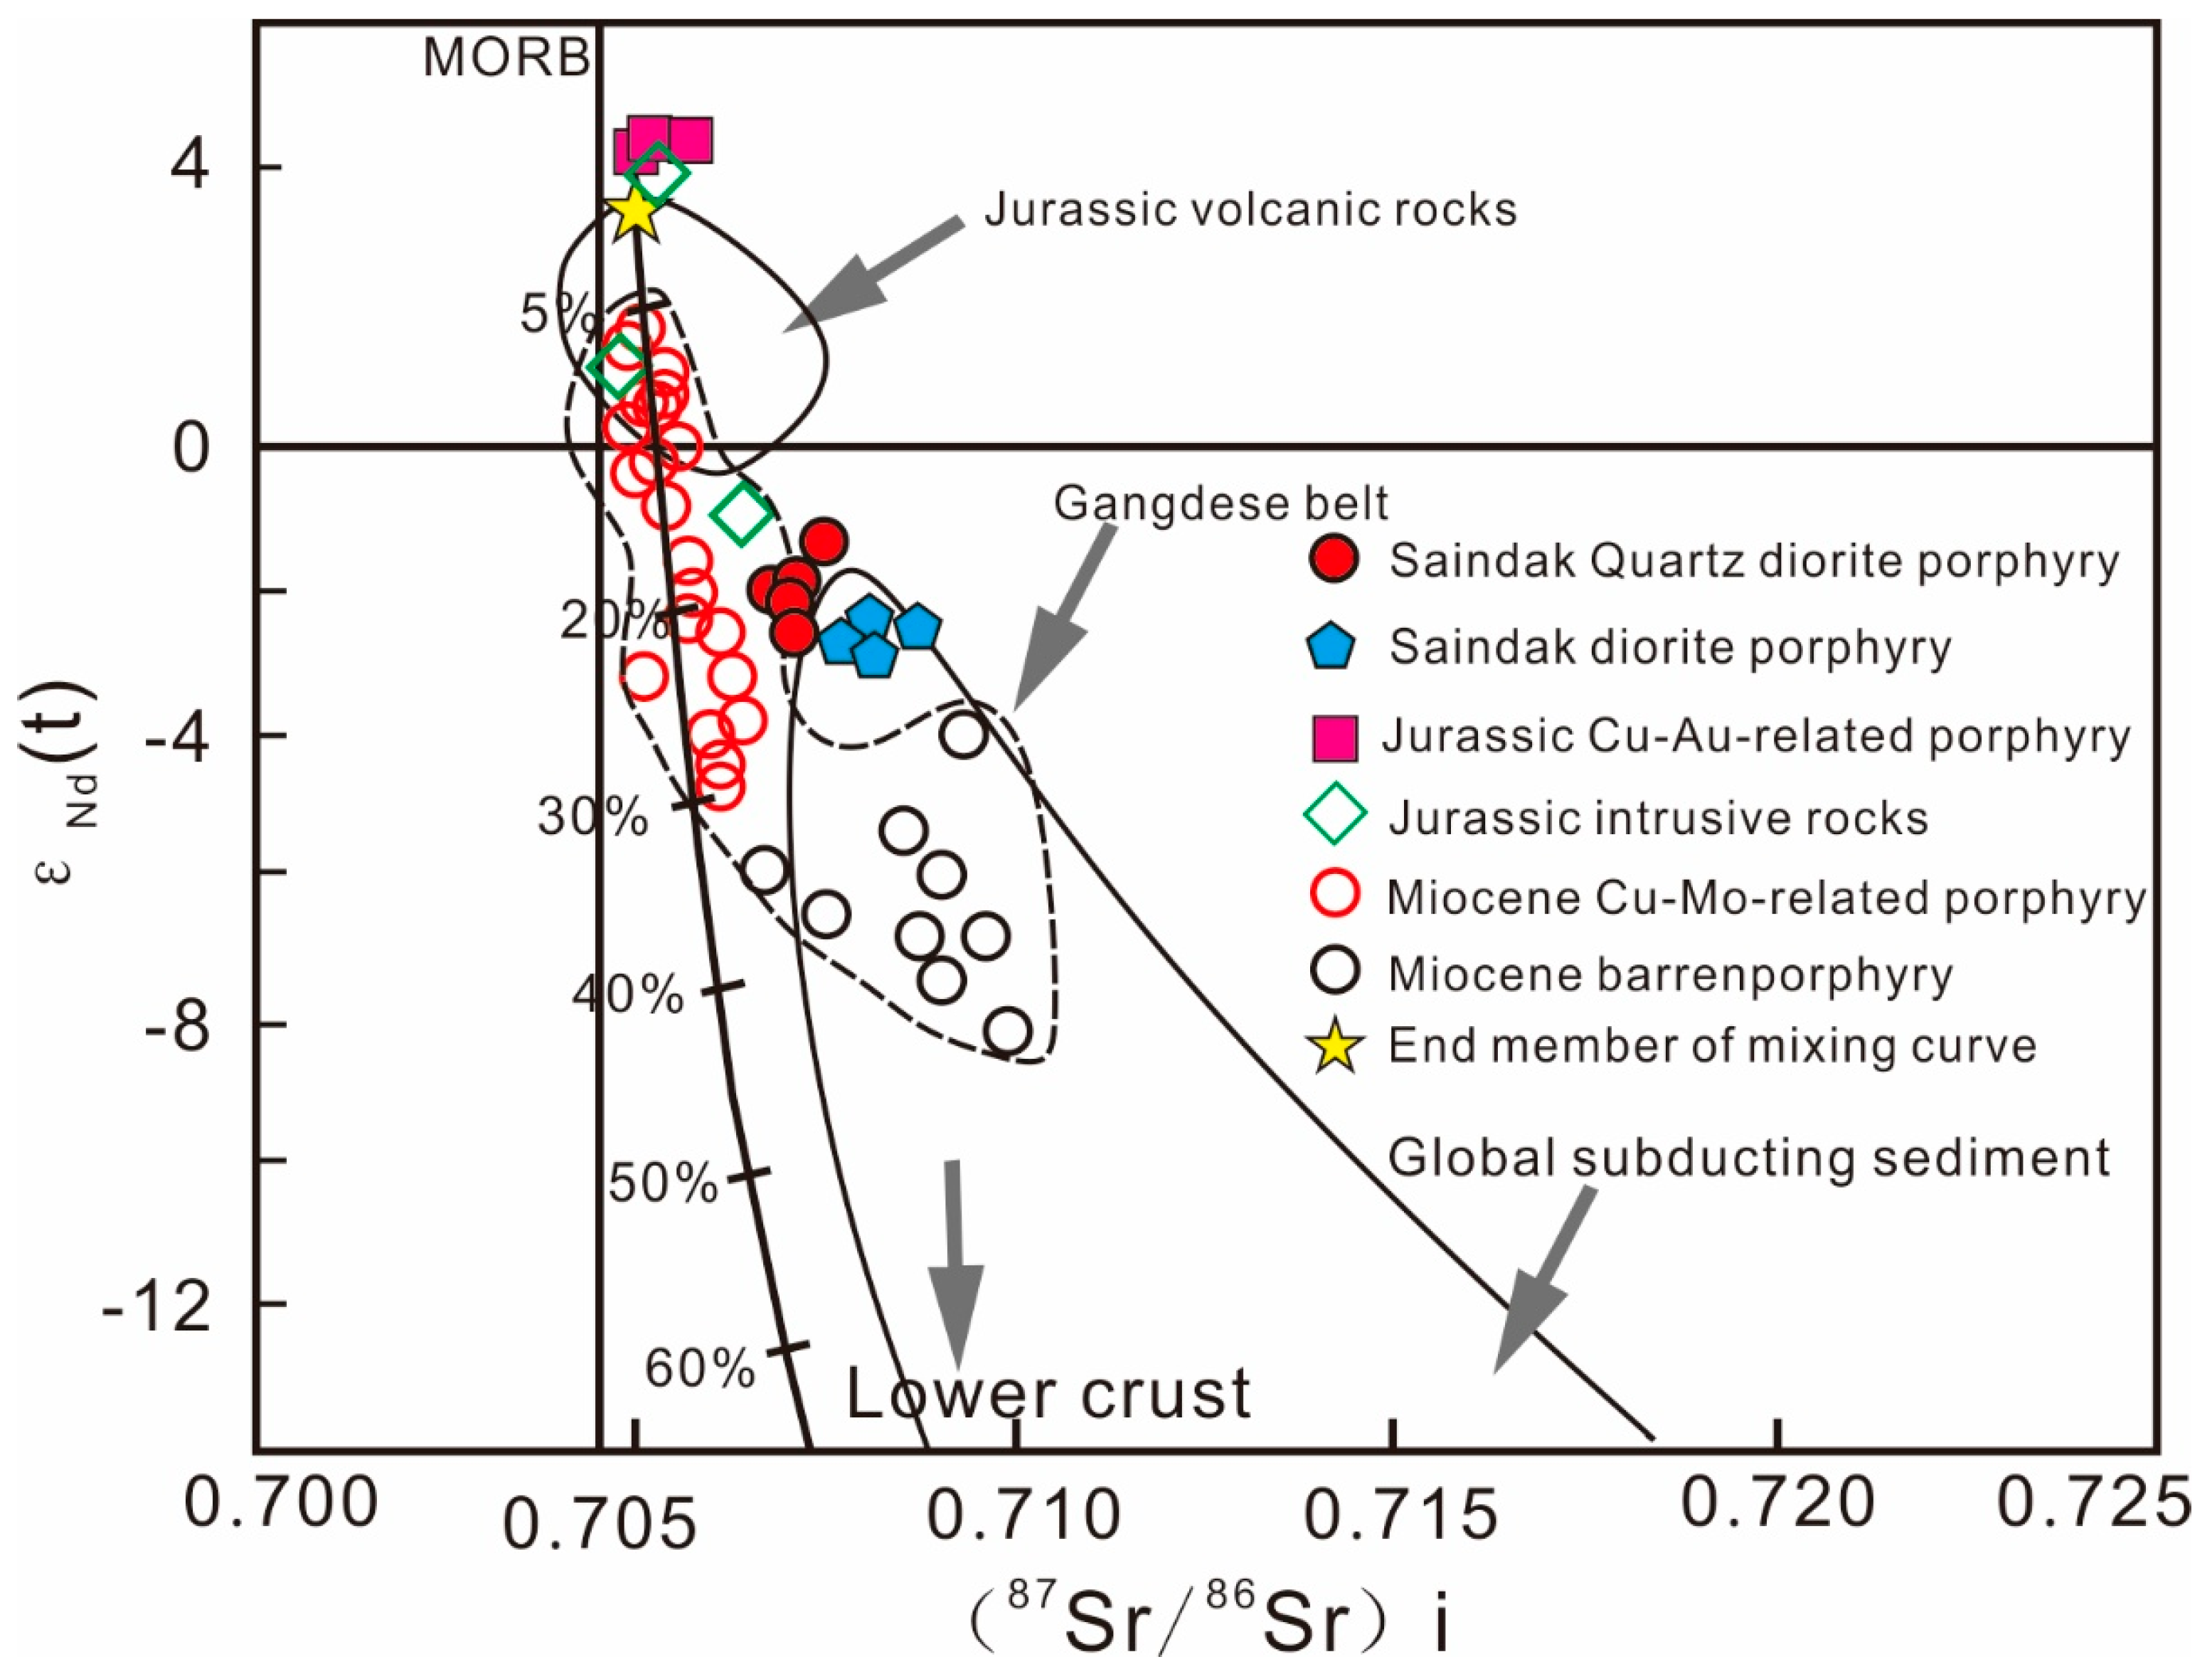
The diorite porphyry and quartz diorite porphyry exhibit distinct Sr-Nd isotopic ratios (Table 3 and Figure 14). The Nd isotopic values (εNd(t)) and the initial Sr isotopic ratio (87Sr/86Sr(i)) values are computed at 22.3 Ma. A range of 87Sr/86Sr(i) ratios and εNd(t) values, having two-stage Nd isotope-depleted mantle model dates (TDM2) of 892 to 1036 Ma, are found in ore-forming quartz diorite porphyry from the Saindak copper deposit. The isotopic signatures of the diorite porphyry samples are characterized by 87Sr/86Sr(i) values of 0.706966–0.707044 and εNd(t) values between −2.9 and −3.0, and have calculated TDM2 ages ranging from 864 to 1081 Ma.

5.5. Lu-Hf Isotope Compositions of Zircons

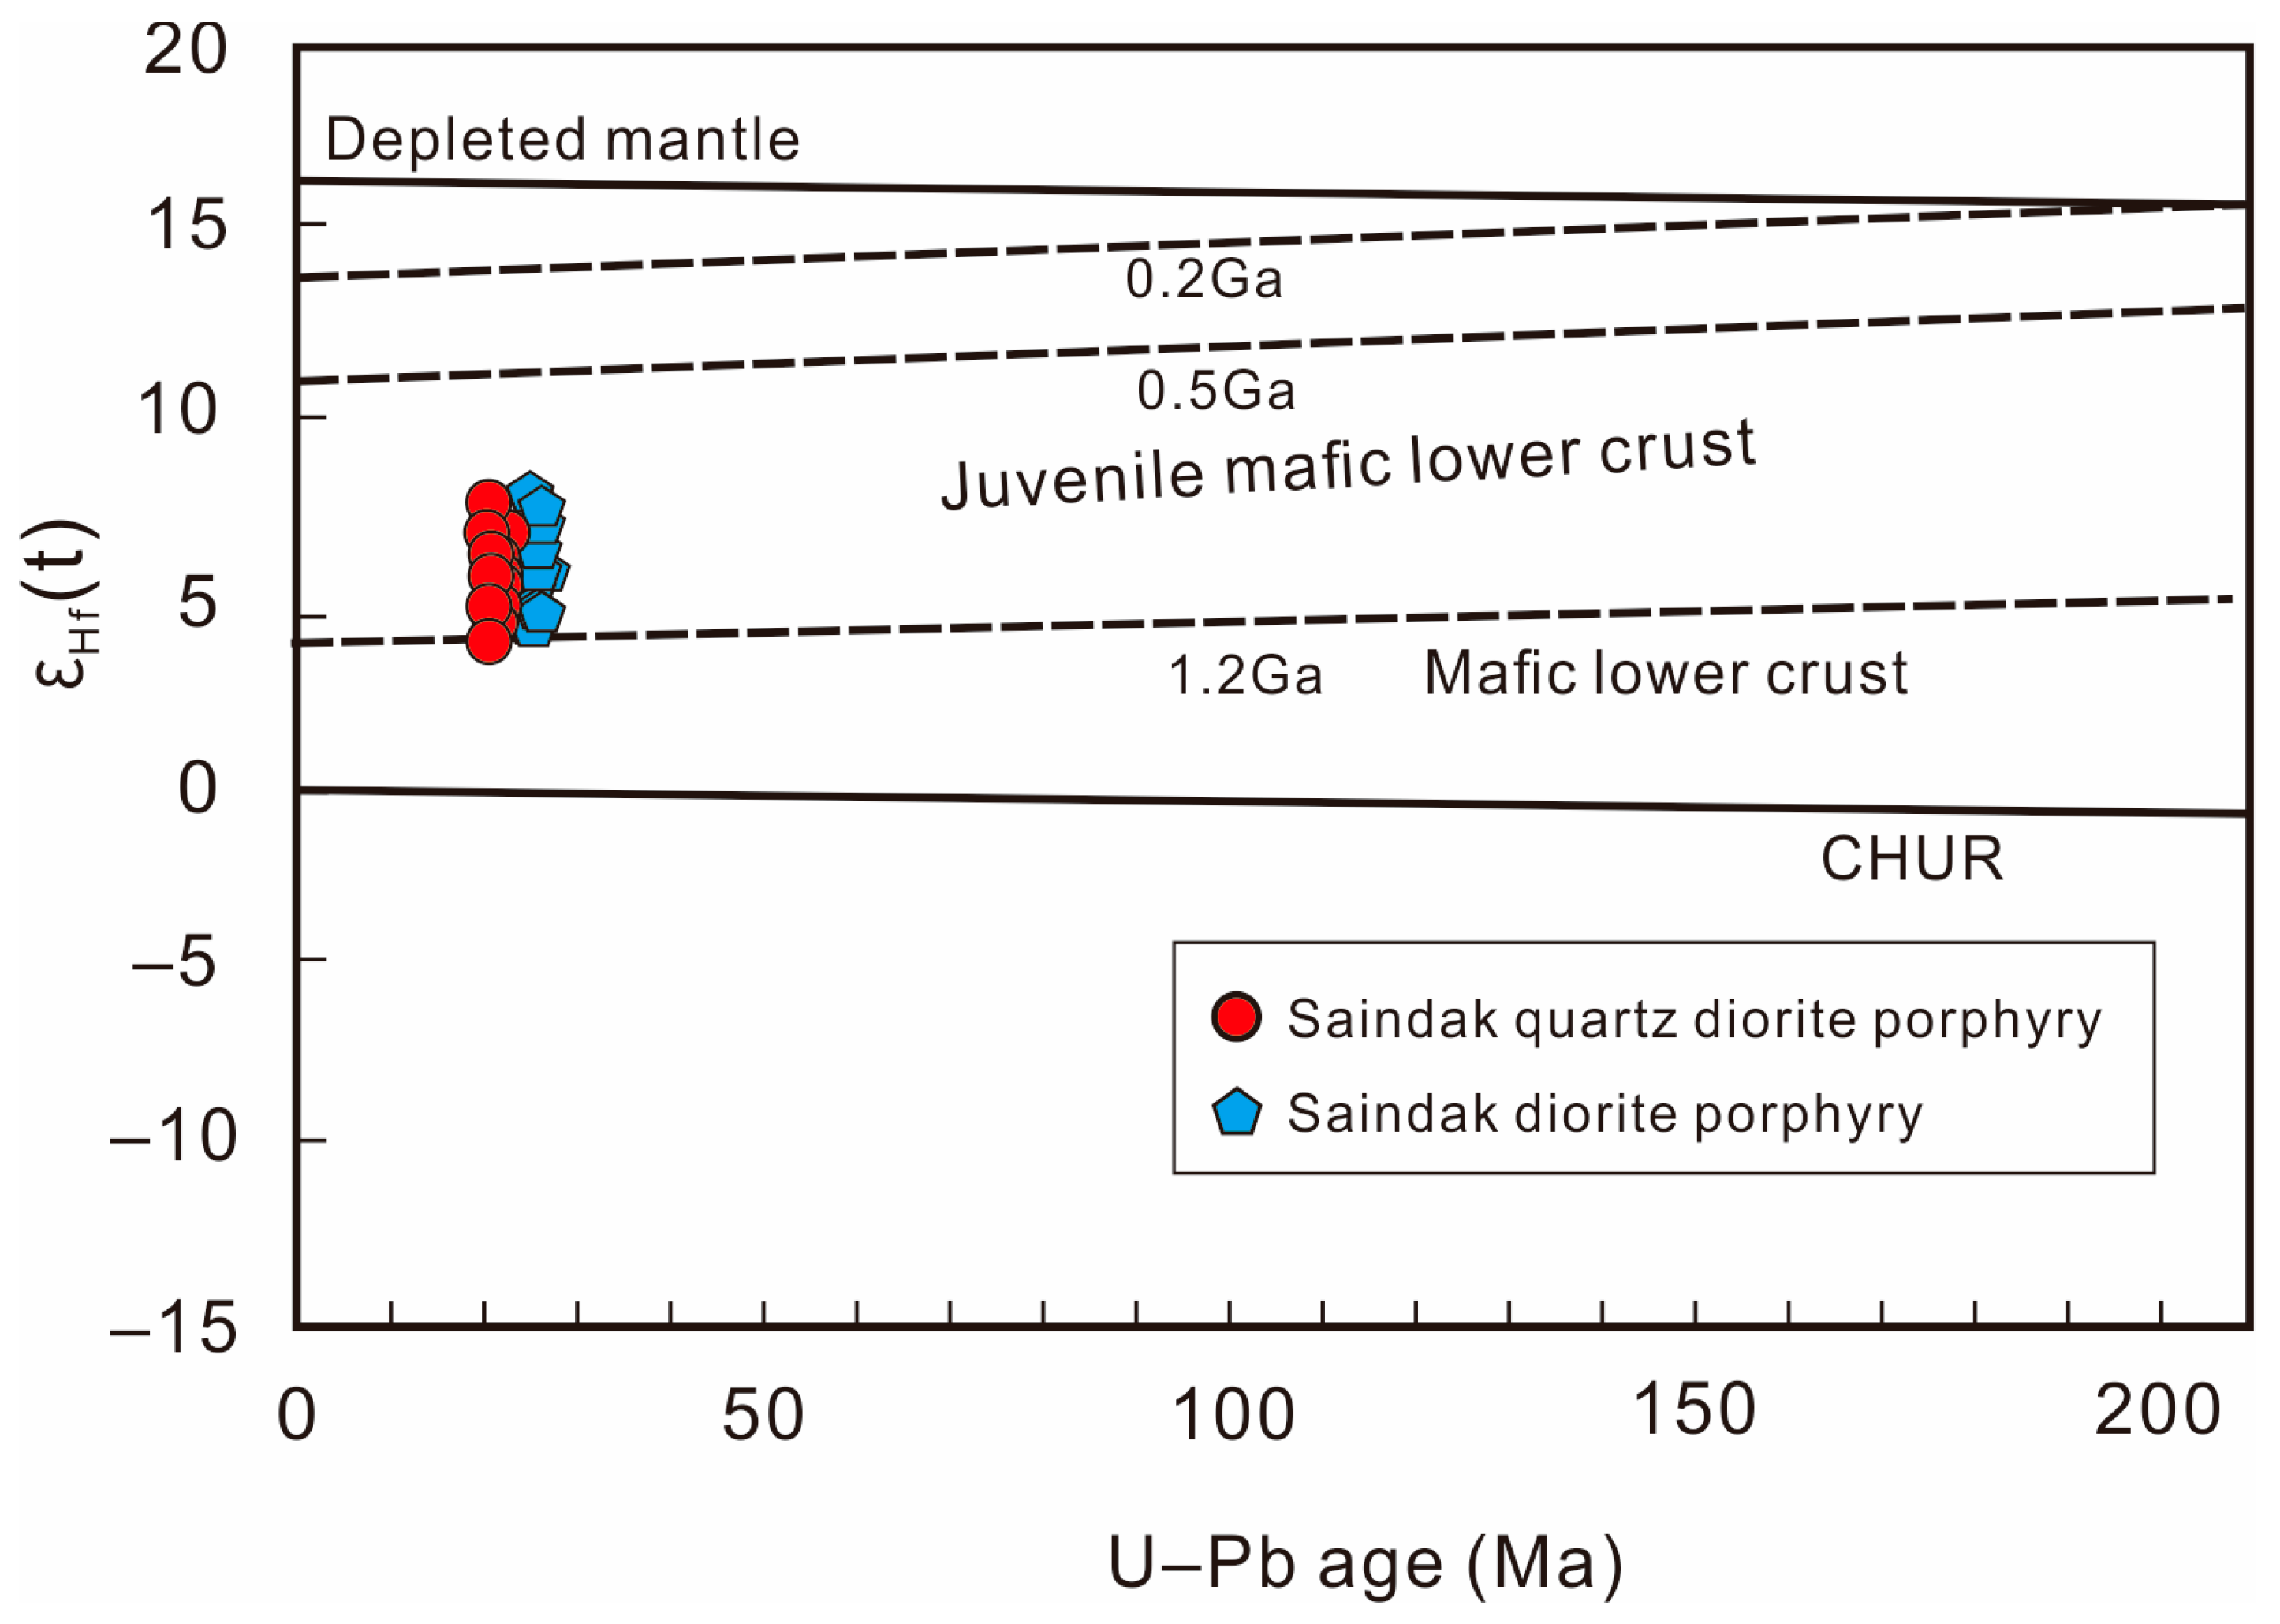
Lu-Hf isotopic analyses of zircons from quartz diorite porphyry (sample No. NS) and diorite porphyry (sample No. NE) samples were conducted on the same zircon grains as those used for U–Pb dating. The Lu-Hf isotope data for zircon are shown in Table 4 and illustrated in Figure 15. Sixteen individual Lu–Hf isotopic determinations were conducted on zircon grains within the quartz diorite porphyry sample, yielding 176Hf/177Hf isotopic ratios ranging from 0.282893 to 0.282964 and εHf(t) values ranging from 4.7 to 7.3 (Figure 15). Model age estimations, referenced against a depleted mantle source, fall between 408 and 506 Ma, while crustal residence times (TDM) span from 638 to 798 Ma. The results of fourteen spot analysis for diorite porphyry showed 176Hf/177Hf isotope compositions which span 0.282901–0.282958, accompanied by εHf(t) values from 5.0 to 7.1. Derived TDM ages tied to a depleted mantle reservoir lie between 412 and 500 Ma, while crustal evolution estimates fall within 650 to 779 Ma.

6. Discussion

6.1. Mineralization Stage Division and Alteration Process

The observed ore textures and mineral assemblages at the Saindak copper–gold deposit provide key insights into the multi-phase evolution of mineralization, consistent with typical porphyry-style systems. The dominance of veinlet-disseminated structures, particularly within sericitized and quartz-sericite altered zones, reflects the persistent activity of hydrothermal fluids along pervasive fracture networks. The classification of vein structures based on size and orientation underscores the dynamic nature of fluid flow, with network and composite vein systems likely representing zones of enhanced permeability and metal deposition. The sequential paragenetic stages—beginning with high-temperature assemblages (pyrite–magnetite–molybdenite) and progressing through chalcopyrite-dominated mineralization to late-stage sphalerite–galena–gypsum associations—suggest a cooling and evolving hydrothermal regime. Notably, the replacement textures (e.g., chalcopyrite replacing pyrite, sphalerite overprinting chalcopyrite) indicate multiple pulses of mineralizing fluids with varying physicochemical conditions. The final stage, marked by gypsum-dominated barren veins, signals waning hydrothermal activity and fluid exhaustion. Collectively, these mineralogical features point to a classic porphyry Cu-Au system with prolonged and overprinting hydrothermal events, controlled by both lithological and structural factors.

6.2. Magmatism and Mineralization Age

Previous geochronological studies indicate that the Chagai belt contains a minimum of five distinct pulses of porphyry-type alteration and mineralization, seen in time windows recorded at 24–22 Ma and again at 18–16 Ma during the early Miocene, followed by mineralization between 13 and 10 Ma in the mid-Miocene, another surge from 6 to 4 Ma during the transition from late Miocene to early Pliocene, and a tentatively proposed phase in the Eocene between 43 and 37 Ma [13,22]. To constrain the magmatism and mineralization ages of the Saindak deposit, a number of recent geochronological investigations have been carried out [26,37,60]. While the widely held studies have focused on intermediate-acid intrusive rocks or porphyry systems, there remains a notable lack of research on the geochronological constraints on mafic microgranular enclaves (MMEs) in felsic rocks and mafic intrusive rocks in this region. Sillitoe and Khan (1977) found mineralization ages of 19.0 ± 1.2 and 20.3 ± 0.8 Ma (K-Ar on hydrothermal biotite) [17], while 22.4 ± 0.4 Ma by Perelló et al. (2008) [22] using K-Ar on hydrothermal biotite and 22.30 ± 0.05 Ma on 40Ar/39Ar on hydrothermal biotite by Richards et al. (2012) [29]. In order to constrain the timing of magmatism, LA–ICP–MS zircon U–Pb dating was used in this study to ascertain the geochronology of many intermediates to mafic intrusive rocks. Additionally, molybdenite Re–Os dating of ore from the K-silicate alteration zone was conducted to elucidate the timing of mineralization.
The quartz diorite porphyry and diorite porphyry contain zircons that exhibit magmatic characteristics, supported by distinct oscillatory zoning patterns and relatively high Th/U values [26,63,64]. Zircon U–Pb dating reveals consistent magmatic ages across multiple intrusive rocks in the study area, constraining the timing of magmatism to the Early Miocene. Zircons from quartz diorite porphyry yield a weighted mean age of 22.15 ± 0.22 Ma for 206Pb/238U, closely matching the age of diorite porphyry, which gives the crystallization age of 22.21 ± 0.33 Ma. In contrast, a slightly younger phase of magmatism is evidenced by zircons within mafic microgranular enclaves (MMEs) and mafic dikes. These zircons yield weighted mean 206Pb/238U ages of 21.21 ± 0.18 Ma for MMEs and 21.21 ± 0.16 Ma for mafic dikes, both concordant and consistent with the host rock ages. The near-identical ages of MMEs and mafic dikes suggest coeval emplacement with the host intrusions, while the ~1 Ma age difference between felsic and mafic rocks points to a rapid transition in magma composition during the early Miocene magmatic event.
Re-Os dating of four molybdenite samples from the Saindak porphyry copper deposit yields a single precise age with a near-zero intercept, confirming that all 187Os is radiogenic with no detectable common Os [65,66]. The copper mineralization correlates strongly with the Re-Os geochronological results (isochron-derived and weighted average age of 22.2 ± 0.3 Ma), suggesting that this dates the porphyry copper mineralization event at Saindak.
Integration of the current data with previous studies [22,26,28,37,61] indicates that magmatism associated with the Saindak porphyry copper deposit in the Chagai belt occurred during the Miocene (22–24 Ma). Similar Miocene porphyry systems, typically associated with the Arabian–Eurasian and Indian–Asian continental collisions, respectively, have been found in the Kerman belt of Iran (20–4 Ma; [9,67,68]) to the west and the Gangdese belt in Tibet (23–12 Ma; [7,69]) to the east [7,67].

6.3. Magma Source, Petrogenesis and Geodynamic Setting

6.3.1. Magma Source of Ore-Bearing Quartz Diorite Porphyry

In the Saindak mining area, copper and gold mineralization is closely associated with the quartz diorite porphyry host rock. This relationship has been confirmed through analysis of drill core samples from the southern, northern, and eastern orebodies. Geochemical analysis of the ore-bearing quartz diorite porphyry reveals adakitic affinities (Figure 16A,B), characterized by elevated Al2O3 (>16.0 wt.%) and Sr (>641 ppm) concentrations, high Sr/Y (>51.6) ratios, and low concentrations of HREE (e.g., Yb = 0.92~ 1.4 ppm) and Y (8.73~13.3 ppm). The relatively low contents of MgO (2.19~3.1 wt.%) and high contents of SiO2 in these quartz diorite porphyries are consistent with high silica adakites (SHAs) (Figure 16; [70,71]).
SHAs form through partial melting of subducted hydrated basalts followed by melt–peridotite interaction during mantle wedge transit [70]. These signatures persist whether derived from direct melting of the subducted slab (marine sediments + MORB) or from partial melting of lower crustal mafic rocks [72].
Figure 16. Sr/Y vs. Y (ppm) diagram (A), (La/Yb)N vs. YbN diagram (B), Sr/Y vs. (La/Yb)N diagram (C), and K2O/Na2O vs. Al2O3 diagram (D) of samples from the Chagai belt, Pakistan [73].
Minerals 15 00768 g016
The quartz diorite porphyries exhibit Mg# values (51.05–59.21) substantially elevated above experimentally produced oceanic crust melts. The samples plot within the compositional field of contemporary island arc adakites (Figure 12B), indicative of mantle wedge interaction during adakitic melt ascent [74]. Further evidence for mantle interaction is also provided by the elevated Cr-Ni concentrations (79.7 ppm Cr, 37.8 ppm Ni; Table 1) in the adakites, reflecting partial melting of metasomatized mantle wedge domains enriched by slab-derived fluids or sediment melts.

6.3.2. Magma Source of Diorite Porphyry and Mafic Dikes

Field investigations in the Saindak mining area revealed, for the first time, the presence of mafic microgranular enclaves (MMEs) within the diorite porphyry (southern orebody). Additionally, mafic dikes are observed intruding into the diorite porphyry (Figure 5). Even while the diorite porphyry also has adakitic affinities, its relatively greater levels of incompatible elements (e.g., K and Rb) indicate that it is unlikely to have been produced from the more primitive quartz diorite porphyry. The diorite porphyry may have developed from mantle-derived magmas or partially melted the subducted slab and then interacted with the overlying mantle wedge, as indicated by the higher MgO contents (4.25~4.40 wt.%) [23,73,74,75,76]. Unlike typical island arc rocks, they exhibit elevated Sr concentrations, depleted Y contents, and characteristically enhanced Sr/Y ratios (Figure 16A). Despite being plotted in the low-silica adakite (LSA) field, they do not fulfill other geochemical characteristics of LSA [70,71], such as higher TiO2 concentrations (>3 wt.%), lower HREE levels compared to high-silica adakite (HSA), and more fractionated REE patterns. Consequently, the formation of the diorite porphyry cannot be attributed to mantle metasomatism by adakitic melts. The most probable agent responsible for modifying the sub-arc mantle and initiating diorite porphyry generation appears to be Si-Al-rich slab-derived fluids. These fluids are marked by elevated Sr concentrations and exhibit less fractionated rare earth element (REE) patterns compared to slab melts. Moreover, the near-identical ages of MMEs and mafic dikes suggest coeval emplacement with the host diorite porphyry. This model is also consistent with comparable in-situ zircon Hf isotopic values and bulk-rock Sr-Nd isotopic compositions between the diorite porphyry and the adakite-like quartz diorite porphyry.

6.3.3. Petrogenesis of Multiple Intrusions

The Saindak samples are related to the medium-potassium calc-alkaline series, marked by relatively low K2O content (K2O < 2.1 wt.%; K2O/Na2O = 0.33–0.55). In the K2O/Na2O vs. Al2O3 discrimination diagram (Figure 16D), all sample points plot within the adakite region associated with slab subduction. Furthermore, geophysical data indicate that the current crustal thickness of the Iranian Kerman porphyry copper belt, located west of the Chagai magmatic arc, ranges from 40 to 50 km, reflecting significant thickening. In contrast, the crustal thickness in the Chagai area is relatively smaller, ranging between 35 and 45 km [74]. Consequently, it is proposed that the Chagai porphyry copper belt, including the Saindak ore-bearing porphyry, does not originate from the partial melting of thickened lower crustal basaltic rocks but is instead linked to the subduction of an oceanic slab.
Whole-rock Sr-Nd isotopic and zircon Hf isotopic analyses reveal that the initial Sr ratios (87Sr/86Sr)ᵢ of the Saindak ore-bearing porphyry range from 0.706481 to 0.706904, with negative εNd(t) values (−0.7 to −2.4). Similar Sr-Nd isotope compositions are found in the barren diorite, with (87Sr/86Sr)ᵢ ranging from 0.706650 to 0.707182, which is a little higher than that of the porphyry that contains ore. The contemporaneous mafic dikes display comparable initial Sr ratios (87Sr/86Sr)ᵢ (0.706966 to 0.707044) and lower εNd(t) values of −3.0 to −2.9. These Sr-Nd isotopic characteristics suggest differences in the magma source for the Saindak ore-bearing porphyry, the barren diorite, and the contemporaneous mafic dikes. The slightly negative εNd(t) values indicate incorporation of evolved lower crustal material or interaction with a metasomatized lithospheric mantle. This decoupling is commonly observed in arc and post-collisional settings where zircon crystallizes early from juvenile melts, preserving the mantle signal, while the Nd isotopic system records subsequent crustal assimilation or mixing [77,78]. However, zircon Hf isotope signatures from all three rock types are remarkably similar, exhibiting positive εHf(t) values (+4.7 to +7.3) and two-stage model ages ranging from 637 to 798 Ma. Geochemical signatures coupled with Sr-Nd-Hf isotope systematics collectively suggest the source region of the ~22 Ma intrusions at the Saindak porphyry copper deposit reflects crust–mantle reaction.
During the crust–mantle magma mixing process, information about mantle-derived magma is recorded in the petrographic and geochemical characteristics of the resulting rocks. The most prominent indicators include mafic enclaves and disequilibrium textures [79]. In the Saindak mining area, mafic microgranular enclaves (MMEs) are reported within the diorite porphyry, potentially representing evidence of magma mixing. In cases where magma mixing is relatively homogeneous, the rock and mineral compositions also preserve this process. For instance, the elements Nb and Ta are immobile and resistant to migration during fractional crystallization or hydrothermal alteration [80]. As such, the Nb/Ta ratio is commonly used to trace the source region of the initial magma. The Saindak samples exhibit Nb/Ta ratios between 9.6 and 16.6, falling between the mantle value (17.7; [81]) and the lower crustal value (8.3; [82]). The high Sr/Y ratios (51.6–83.24) observed in the studied rocks are characteristic of adakitic compositions, but their origin is likely multifactorial. While partial melting of a metasomatized mantle wedge fluxed by slab-derived fluids may have contributed to their genesis, the moderately evolved Nd isotopic compositions and the lack of extremely depleted Y and Yb contents argue against pure slab melt derivation. Instead, the adakitic signature may reflect a combination of high-pressure fractional crystallization (amphibole ± garnet), minor crustal assimilation, and the input of slab-derived components, consistent with hybrid magma evolution in a post-subduction tectonic setting [83,84]. Additionally, the Mg# values of the rocks (53–59) are distinctly different from those expected for pure crustal partial melting or mantle-derived magmas, further supporting the involvement of crust-mantle interaction.

6.3.4. Geodynamic Setting

The Raskoh arc lies in the south, while in the north lies the Chagai arc—together forming the two sub-arcs that make up the Chagai magmatic arc [85]. In the Saindak porphyry copper deposit and the surrounding areas, several phases of magmatism are well developed. Compared to the primitive mantle, granitoids in the Saindak Cu-Au deposit exhibit significant LILEs enrichment alongside HFSEs depletion, indicating that both quartz diorite porphyry and diorite porphyry originated in an environment connected to subduction. It is a classic example of a subduction-related system formed in an active continental margin setting, characterized by oxidized, water-rich magmas and a strong arc geochemical signature [1,5]. In contrast, post-collisional PCDs in the Tibetan Plateau, such as those in the Gangdese belt, are associated with slab break-off and lithospheric delamination processes following the India–Asia collision, leading to more potassic, less oxidized magmas and hybrid mantle–crustal sources [7,86].
Based on earlier research, after the Neo-Tethys oceanic plate subducted, the Arabian plate migrated northwestward and collided with the Eurasian plate at around 25 Ma [87,88]. The Arabian and Eurasian continental plates collided in the northern Zagros (Iran) during 25–23 Ma, and the Late Miocene saw an increase in intensity [89,90]. These studies may suggest that the Saindak deposit, located within the Chagai magmatic arc, formed in a syn-collisional or post-collisional tectonic setting. However, considering the abundance of Cretaceous to Quaternary calc-alkaline arc magmatism in the Chagai belt, the Saindak porphyry copper deposit shows a stronger relationship with the Arabian slab subduction under Eurasia than with continental collision processes [22,26,29,68]. The Makran–Chagai arc is interpreted as a continental collision window sandwiched between the India–Eurasia convergence zone eastward and the Arabia–Eurasia collision zone westward [91]. It is positioned along the Eurasian plate’s southern edge, where the Neo-Tethys’s remaining oceanic lithosphere is still present [91]. The Raskoh–Chagai arc represents a fully developed ocean island arc system that was tectonically accreted onto the Afghan block [30,32]. This suggests that an island arc changed into a mature continental margin arc of the Andean type [15,29,92,93,94].
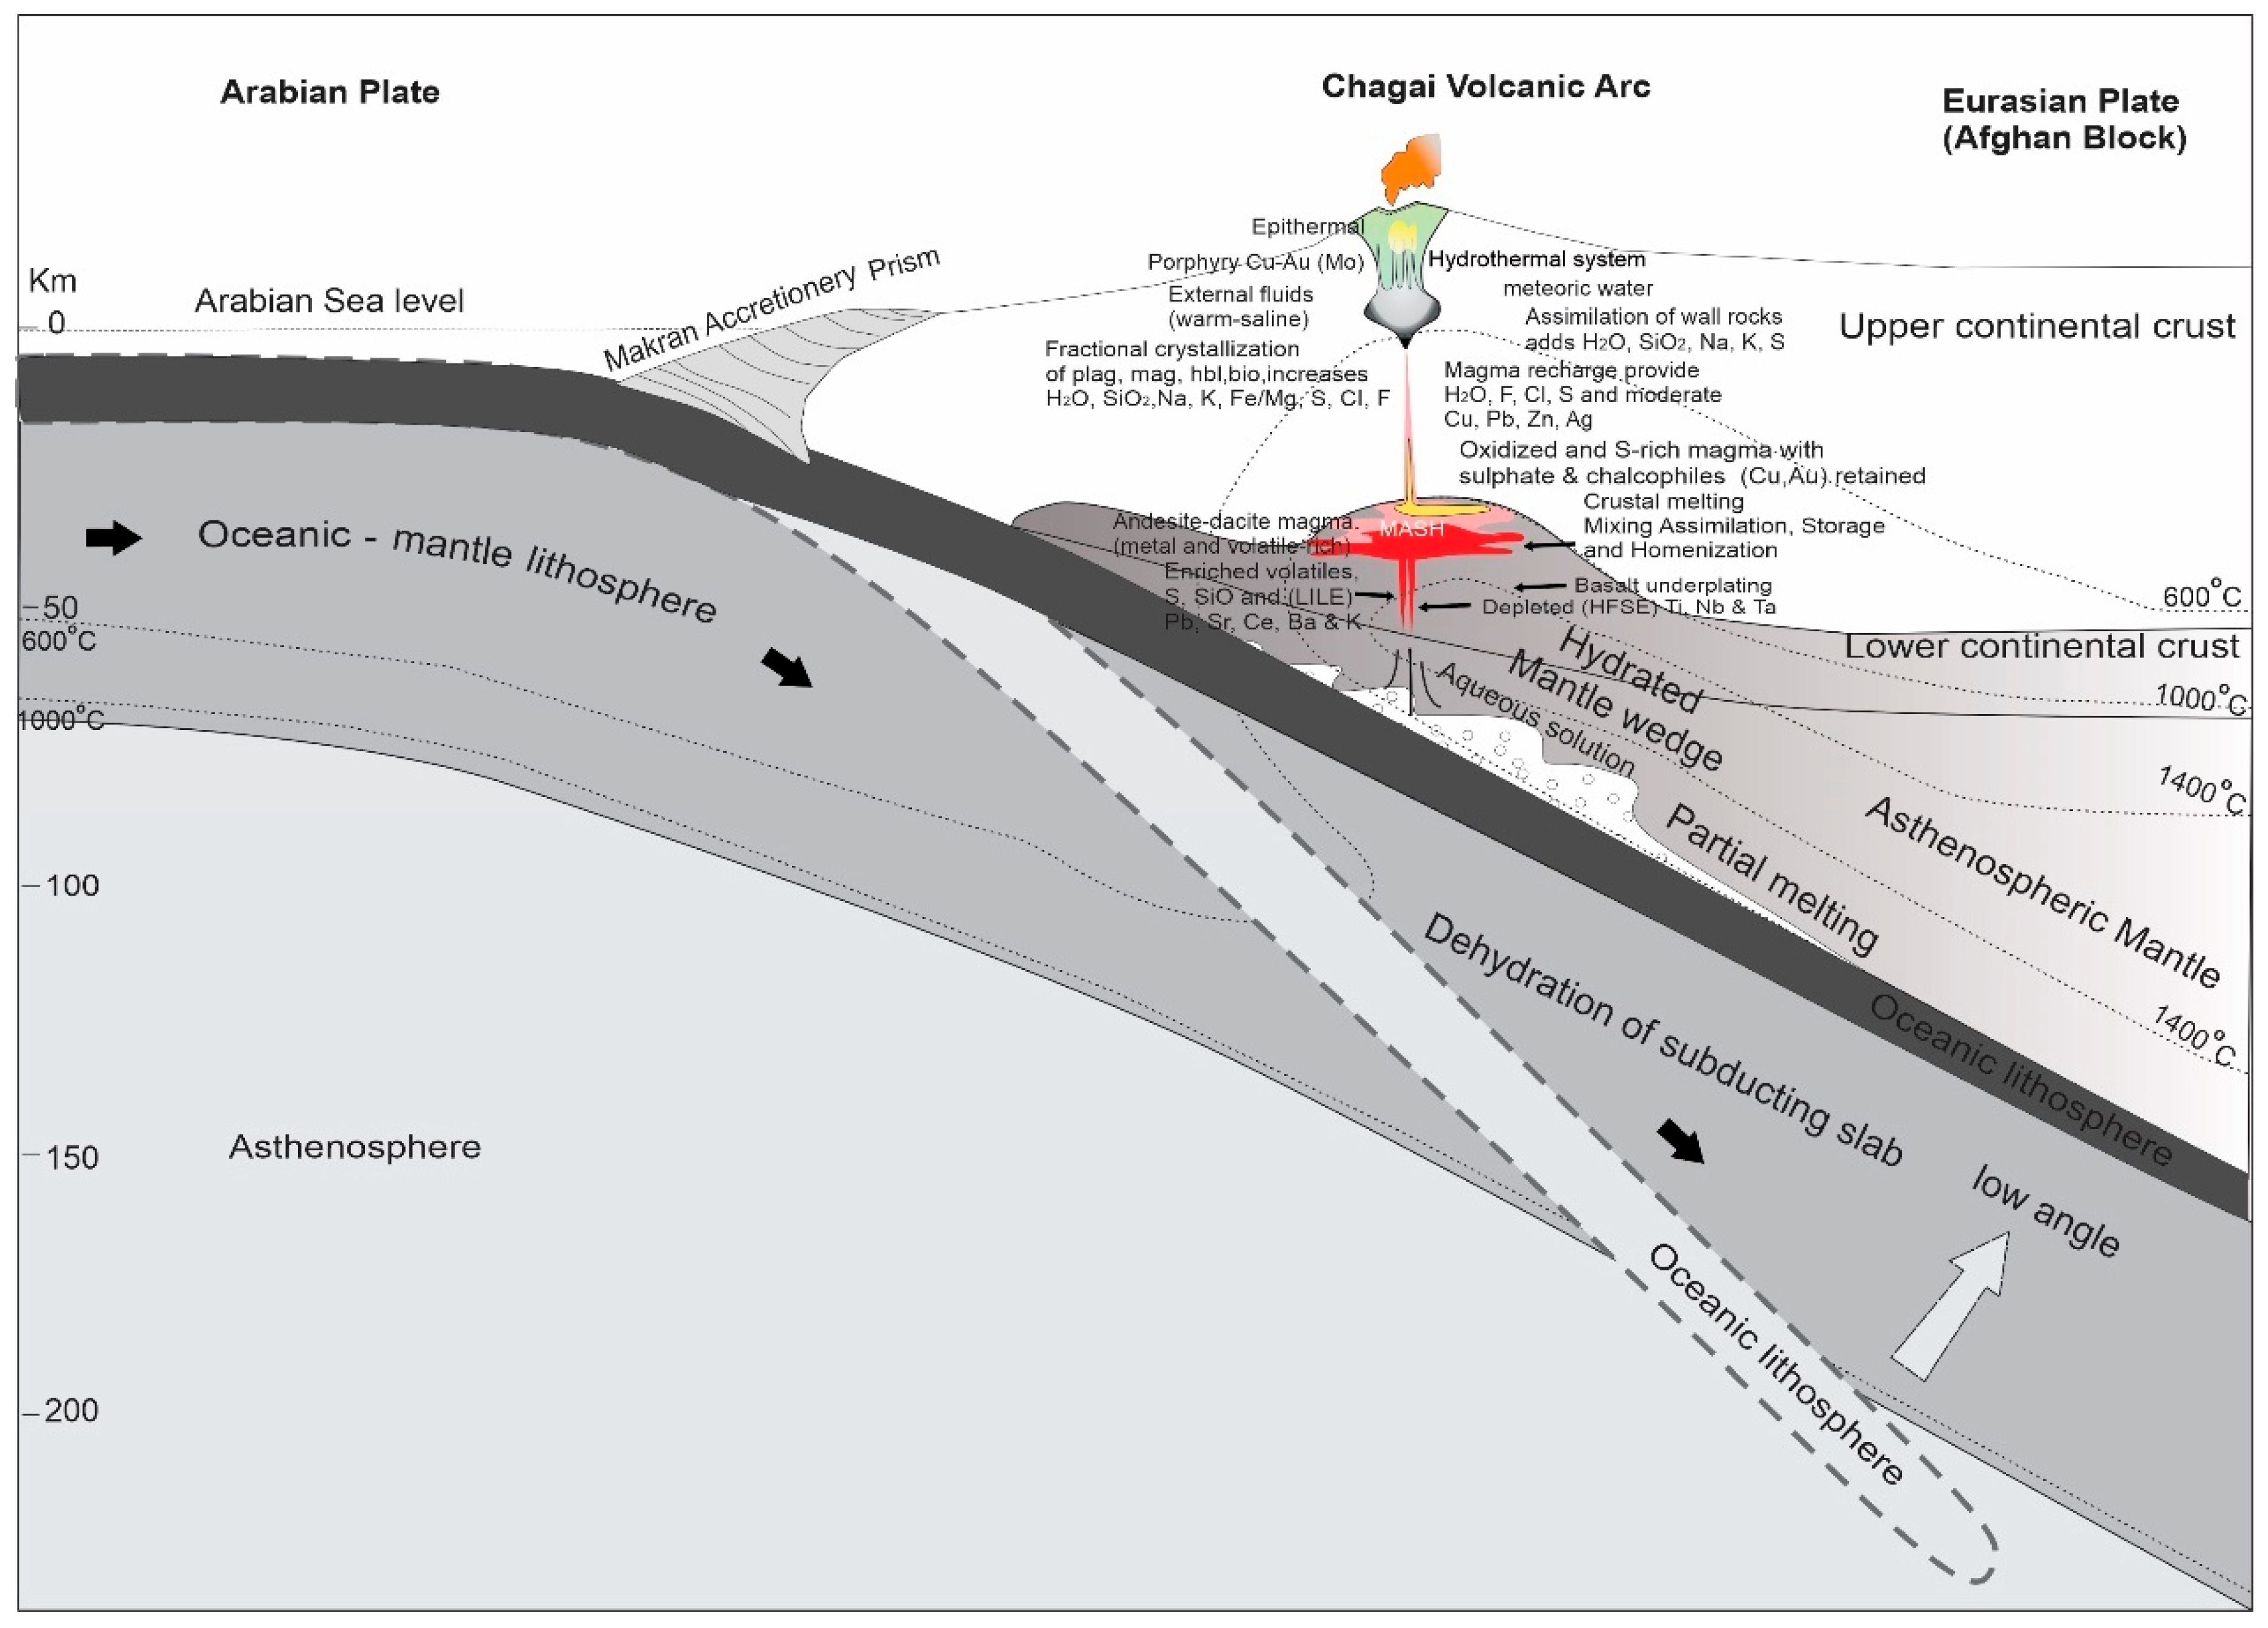
In this study, Sr-Nd-Hf isotopic data and the whole-rock geochemical evidence from the Saindak adakites suggest that the mantle wedge, which had been metasomatized by fluids released from the dehydrating subducting slab, partially melted to generate the main magma. Additionally, a small proportion of subducted sediment components were incorporated into the melt. During its ascent through the continental crust, the magma encountered further modifications through crust–mantle interactions, ultimately leading to the formation of the Saindak adakites. Slab rollback [95] or flat subduction; slab break-off [96]; and slab window during ridge subduction [97,98] or subducted slab tearing [99] are some of the models that explain the formation of ore-forming adakites caused by oceanic slab melting. In the Saindak region, flat subduction or the creation of a slab window during subduction may result in the partial melting of the Neo-Tethys lithosphere underlying the Eurasian plate. It is proposed that the oblique subduction of the Arabian plate led to the accretion of the Chagai arc onto the southern margin of the Afghan block, resulting in a flattening of the subducting slab angle (Figure 17).

6.4. Genetic Model for the Saindak Cu-Au Deposit

Porphyry copper deposits typically form in convergent margin settings where oceanic lithosphere subducts beneath continental crust, as illustrated by the Chagai volcanic arc system (Figure 17). In this tectonic environment, dehydration from the descending oceanic slab releases volatiles (e.g., H2O, Cl, S) into the mantle wedge above, inducing partial melting and generating hydrous, metal-bearing basaltic magmas [1,103]. These magmas ascend and stall in the lower crust, forming MASH (Melting, Assimilation, Storage, and Homogenization) zones where they interact with continental crust, assimilating crustal material and evolving to more felsic, volatile-rich compositions [18]. The tectonic conditions associated with slab shallowing, such as compression and crustal thickening, promote the development of extensive magma reservoirs and the concentration of metal-rich hydrothermal fluids critical for porphyry copper deposit formation [104].
Upon continued ascent and emplacement in the upper crust, fractional crystallization and fluid exsolution lead to the formation of ore-bearing porphyritic intrusions. Exsolved magmatic-hydrothermal fluids, enriched in Cu, Au, Mo, and volatiles, precipitate sulfide minerals in structurally prepared zones, often in association with meteoric water interactions and epithermal overprints [5,105]. These processes result in vertically extensive mineralized systems centered on porphyritic intrusions, often capped by epithermal deposits and surrounded by hydrothermal alteration halos.

6.5. Insights into the Formation of Giant Porphyry Deposits

The Chagai porphyry copper belt is a significant segment of the Tethyan metallogenic belt [12,27,106], which spans approximately 300 km and hosts several giant porphyry copper deposits, including the Reko Diq cluster (27 Mt Cu; [13]), Saindak (1.23 Mt Cu and 59.3 t Au; [16,106]), and the newly discovered Siah Diq deposit (8.11 Mt Cu and 213 t Au; [107,108]), alongside medium to small deposits such as Dasht-e-Kain, Durban Chah, and Ziarat-Pir-Sultan [22,109]. Comparison of the Saindak deposit with other major porphyry copper deposits in the Chagai belt, such as Reko Diq and Siah Diq, reveals similarities and distinctions in petrography, bulk-rock geochemistry, and Sr-Nd-Hf isotopic compositions, offering key insights into regional metallogenic processes.
Molybdenite Re–Os geochronology indicates formation ages of approximately 25 Ma, 22 Ma, and 11 Ma for Siah Diq, Saindak, and Reko Diq, respectively, with a ~3 Ma temporal difference between Saindak and Siah Diq [106,107]. These ages collectively demonstrate that porphyry copper mineralization in the Chagai region is predominantly concentrated in the Late Oligocene to Miocene, reflecting a protracted period of arc-related magmatism and metallogeny.
Ore-bearing porphyries at the Saindak and Siah Diq deposits are mainly quartz diorite porphyries, characterized by the presence of biotite and amphibole phenocrysts. It is a sign of significant magmatic water concentrations when hornblende or biotite phenocrysts are widely distributed. High quantities of magmatic water are necessary to enable arc magma emplacement at shallow crustal levels followed by the development of subvolcanic magmatic-hydrothermal systems that may generate ore [29]. High magmatic water levels, which inhibit early plagioclase crystallization but enhance hornblende crystallization, can also be indicated by high Sr/Y ratios [29]. Geochemical analysis of the ore-bearing quartz diorite porphyry reveals adakitic affinities with high Sr/Y ratios (Saindak > 51.6; Siah Diq > 67.2; [107]).
Mafic microgranular enclaves (MMEs) and mafic dikes are identified for the first time within diorite porphyries of the Saindak deposit. Geochronological data indicate that these MMEs and dikes were emplaced contemporaneously with the host intrusions and are coeval with the mineralization event. Petrographic analysis of the MMEs at Saindak reveals disequilibrium textures such as resorbed and oscillatory-zoned plagioclase, sieve-textured feldspars, and corroded quartz phenocrysts within the host porphyries, which are commonly interpreted as signatures of thermal and chemical disequilibrium induced by the injection of mafic magma [110,111]. Morphologically the MMEs are typically fine-grained, rounded to elliptical, and show sharp but irregular boundaries with the host rocks, supporting their origin as hybridized blobs of mafic magma entrained in felsic host magma [59]. These features imply the mixing of mafic and felsic magmas derived from the mantle, highlighting dynamic crust–mantle exchanges during the formation of the Saindak deposit.
The Chagai arc signifies a mature ocean island arc, suggesting that an island arc developed into a mature continental margin arc of the Andean type after being accreted to the Afghan block. The subduction of remnant oceanic crust beneath the Makran accretionary complex continues today, as evidenced by Pliocene–Quaternary calc-alkaline volcanism in the Chagai arc [29,109]. In arcs connected to shallow subduction zones, high-K calc-alkaline volcanics usually develop [32]. These zones are often characterized by rapid convergence rates and the subduction of younger, less dense, and more buoyant plates [32,93]. Therefore, it is suggested that during the Oligocene–Miocene, shallow subduction of the Arabian plate likely increased the influx of fluids associated with subduction, high in LILE and LREE, into the sub-arc mantle source of the Chagai arc. Porphyry copper and copper–gold mineralization may have been widely formed in the area as a result of this process.
Recent studies have significantly advanced our understanding of the magmatic evolution and metallogeny of the Chagai magmatic arc, providing important context for interpreting the formation and emplacement of porphyry Cu-Au deposits (e.g., Saindak, Reko Diq, and Siah Diq PCDs). For instance, recent studies [36,106,107,108], working on Saindak, Reko Diq, and Siah Diq, respectively, have refined the tectonomagmatic timeline of the arc, highlighting episodic magmatism driven by changes in subduction dynamics and slab geometry in relation to PCD formation. These findings support a multi-phase magmatic evolution, consistent with our observations at Saindak, where Early Miocene intrusions display geochemical signatures typical of a mature continental arc. Additionally, new Sr-Nd-Hf isotopic data from regional studies confirm crustal contributions during arc evolution, which aligns with our isotopic interpretations indicating hybrid magma sources. Integrating these recent regional insights underscores that the Saindak PCD formed during a period of enhanced magmatic flux and crustal reworking, likely associated with intensified arc-perpendicular shortening and increased volatile input, both critical for porphyry-style mineralization. This broader regional framework strengthens the genetic link between tectonomagmatic processes and ore formation along the Chagai arc.

7. Conclusions

In this study, zircon LA–ICP–MS U–Pb, molybdenite Re–Os geochronology with whole-rock major and trace element compositions, and Sr–Nd–Hf isotopic data of the intrusions from the Saindak porphyry copper deposit support the following conclusions:
(1)
LA-ICP-MS zircon U–Pb dating results demonstrate that quartz diorite porphyry, diorite porphyry, and mafic dikes from the Saindak porphyry copper–gold deposit were emplaced during the Miocene (~22 Ma). Molybdenite Re-Os ages indicate that the quartz diorite porphyries are both chronologically and spatially related to the Saindak copper–gold mineralization. U–Pb and Re–Os geochronology confirms that both ore-bearing and barren porphyries, as well as associated mafic dikes and MMEs, are closely coeval, with emplacement ages centered around 22~21 Ma. This suggests a short-lived but dynamic magmatic episode during porphyry formation.
(2)
Porphyry-related magmas are typically related to the medium–K calc-alkaline series, exhibiting evolved compositions and adakitic affinities. They are characterized by hornblende and biotite phenocrysts, indicative of high magmatic water content. They have relatively high Sr/Y and La/Yb ratios and a lack of negative Eu anomalies, reflecting a mature arc setting.
(3)
Rather than a continental collision, the subduction of the Arabian oceanic plate below the Eurasian plate produced the Saindak porphyry copper deposit. Geochemical signatures and isotopic compositions indicate that the Saindak adakitic magmas were primarily derived from the partial melting of a metasomatized mantle wedge and influenced by slab-derived fluids and minor sediment contributions and subsequent crust–mantle interactions during magma ascent.
(4)
It is proposed that a mature Andean-type continental margin arc, characterized by prolonged arc magmatism and shallow subduction of the remnant oceanic crust, was critical to the formation of the giant porphyry copper deposits in the Chagai belt.

Supplementary Materials

The following supporting information can be downloaded at: https://www.mdpi.com/article/10.3390/min15080768/s1, Table S1: U-Pb composition and trace elements of zircon from quartz diorite porphyry, diorite porphyry and its MME, and mafic dike as measured by LA-ICP-MS.

Author Contributions

Conceptualization, B.Y. and H.T.; methodology, Z.W.; investigation, J.H., Y.S.K. and A.A.N.; data curation, H.Z.; writing—original draft preparation, J.H.; writing—review and editing, T.K.; supervision, W.L. and X.Y. All authors have read and agreed to the published version of the manuscript.

Funding

This research received no external funding.

Data Availability Statement

Data are contained within the article and the Supplementary Material.

Acknowledgments

This study was supported financially by the National Natural Sciences Foundation of China (Grant Nos. 92262302, U2244204 and 92055314), the Ministry of Sciences and Technology (Grant Nos. 2021YFE0190500 and 2021YFC2901802), and the Natural Sciences Foundation of Shaanxi Province (2025JC-YBQN-345). We thank Shuangshuang Wang for the help during zircon U-Pb dating and Hf isotope testing. We extend our deepest gratitude and appreciation to the academic editor and anonymous reviewers for their insightful remarks, useful recommendations, and constructive criticism, all of which greatly improved the quality of the manuscript.

Conflicts of Interest

The authors declare no conflict of interest.

References

  1. Richards, J.P. Tectono-magmatic precursors for porphyry Cu-(Mo-Au) deposit formation. Econ. Geol. 2003, 98, 1515–1533. [Google Scholar] [CrossRef]
  2. Richards, J.P. High Sr/Y arc magmas and porphyry Cu ± Mo ± Au deposits: Just add water. Econ. Geol. 2011, 106, 1075–1081. [Google Scholar] [CrossRef]
  3. Cooke, D.R.; Hollings, P.; Walshe, J.L. Giant Porphyry Deposits: Characteristics, Distribution, and Tectonic Controls. Econ. Geol. 2005, 100, 801–818. [Google Scholar] [CrossRef]
  4. Cooke, D.R.; Deyell, C.L.; Waters, P.J.; Gonzales, R.I.; Zaw, K. Evidence for magmatic–hydrothermal fluids and ore–forming processes in epithermal and porphyry deposits of the Baguio District, Philippines. Econ. Geol. 2011, 106, 1399–1424. [Google Scholar] [CrossRef]
  5. Sillitoe, R.H. Porphyry copper systems. Econ. Geol. 2010, 105, 3–41. [Google Scholar] [CrossRef]
  6. Shafiei, B.; Haschke, M.; Shahabpour, J. Recycling of orogenic arc crust triggers porphyry Cu mineralization in Kerman Cenozoic arc rocks, southeastern Iran. Miner. Depos. 2009, 44, 265–283. [Google Scholar] [CrossRef]
  7. Hou, Z.Q.; Yang, Z.M.; Qu, X.M.; Meng, X.J.; Li, Z.Q.; Beaudoin, G.; Rui, Z.Y.; Gao, Y.F.; Zaw, K. The Miocene Gangdese porphyry copper belt generated during post-collisional extension in the Tibetan Orogen. Ore Geol. Rev. 2009, 36, 25–51. [Google Scholar] [CrossRef]
  8. Yang, J.S.; Shi, R.D.; Wu, C.L.; Wang, X.B.; Robinson, P.T. Dur’ngoi ophiolite in East Kunlun, northeast Tibetan Plateau: Evidence for Paleo-Tethyan suture in northwest China. J. Earth Sci. 2009, 20, 303–331. [Google Scholar] [CrossRef]
  9. Yang, Z.M.; Hou, Z.Q.; Xu, J.F.; Bian, X.F.; Wang, G.R.; Yang, Z.S.; Tian, S.H.; Liu, Y.C.; Wang, Z.L. Geology and origin of the post-collisional Narigongma porphyry Cu–Mo deposit, southern Qinghai, Tibet. Gondwana Res. 2014, 26, 536–556. [Google Scholar] [CrossRef]
  10. Hou, Z.Q.; Gao, Y.F.; Qu, X.M.; Rui, Z.Y.; Mo, X.X. Origin of adakitic intrusives generated during mid-Miocene east–west extension in southern Tibet. Earth Planet. Sci. Lett. 2004, 220, 139–155. [Google Scholar] [CrossRef]
  11. Hou, Z.Q.; Zheng, Y.C.; Yang, Z.M.; Rui, Z.Y.; Zhao, Z.D.; Jiang, S.Y.; Qu, X.M.; Sun, Q.Z. Contribution of mantle components within juvenile lower crust to collisional zone porphyry Cu systems in Tibet. Miner. Depos. 2013, 48, 173–192. [Google Scholar] [CrossRef]
  12. Hou, Z.Q.; Yang, Z.M.; Lu, Y.J.; Kemp, A.; Zheng, Y.C.; Li, Q.Y.; Tang, J.X.; Yang, Z.S.; Duan, L.F. A genetic linkage between subduction- and collision-related porphyry Cu deposits in continental collision zones. Geology 2015, 43, 247–250. [Google Scholar] [CrossRef]
  13. Razique, A.; Tosdal, R.M.; Creaser, R.A. Temporal evolution of the western porphyry Cu–Au systems at Reko Diq, Balochistan, western Pakistan. Econ. Geol. 2014, 109, 2003–2021. [Google Scholar] [CrossRef]
  14. Deng, J.; Wang, Q.F.; Li, G.; Santosh, M. Cenozoic tectono–magmatic and metallogenic processes in the Sanjiang region, southwestern China. Earth–Sci. Rev. 2014, 138, 268–299. [Google Scholar] [CrossRef]
  15. Richards, J.P. Tectonic, magmatic, and metallogenic evolution of the Tethyan orogen: From subduction to collision. Ore Geol. Rev. 2015, 70, 323–345. [Google Scholar] [CrossRef]
  16. Deng, J.; Wang, Q. Gold mineralization in China: Metallogenic provinces, deposit types and tectonic framework. Gondwana Res. 2016, 36, 219–274. [Google Scholar] [CrossRef]
  17. Sillitoe, R.H.; Khan, S.N. Geology of Saindak porphyry copper deposit, Pakistan. Trans. Inst. Min. Metall. 1977, 86, B27–B42. [Google Scholar]
  18. Hildreth, W.; Moorbath, S. Crustal contributions to arc magmatism in the Andes of central Chile. Contrib. Mineral. Petrol. 1988, 98, 455–489. [Google Scholar] [CrossRef]
  19. Seedorff, E.; Dilles, J.H.; Proffett, J.M., Jr.; Einaudi, M.T.; Zurcher, L.; Stavast, W.J.A.; Johnson, D.A.; Barton, M.D. Porphyry deposits: Characteristics and origin of hypogene features. Econ. Geol. 2005, 100, 251–298. [Google Scholar] [CrossRef]
  20. Yang, Z.M.; Lu, Y.J.; Hou, Z.Q.; Chang, Z.S. High-Mg diorite from Qulong in southern Tibet: Implications for the genesis of adakite-like intrusions and associated porphyry Cu deposits in collisional orogens. J. Petrol. 2015, 56, 227–254. [Google Scholar] [CrossRef]
  21. Richards, J.P.; Şengör, A.M.C. Did Paleo-Tethyan anoxia kill arc magma fertility for porphyry copper formation? Geology 2017, 45, 591–594. [Google Scholar] [CrossRef]
  22. Perelló, J.; Razique, A.; Schloderer, J.; Rehman, A.U. The Chagai porphyry copper belt, Baluchistan province, Pakistan. Econ. Geol. 2008, 103, 1583–1612. [Google Scholar] [CrossRef]
  23. Doebrich, J.L.; Ludington, S.; Peters, S.G.; Finn, C.A.; Mars, J.C.; Rowan, L.C.; Stoeser, D.B.; King, T.M.; Eppinger, R.G.; Wasy, A.; et al. Porphyry copper potential of Tethyan magmatic arcs of Afghanistan. Ir. Assoc. Econ. Geol. 2007, 1, 129–132. [Google Scholar]
  24. Sillitoe, R.H. Metallogenic evolution of a collisional mountain belt in Pakistan: A preliminary analysis. J. Geol. Soc. Lond. 1978, 135, 377–387. [Google Scholar] [CrossRef]
  25. Sholeh, A.; Rastad, E.; Huston, D.; Gemmell, J.B.; Taylor, R.D. The Chahnaly low-sulfidation epithermal gold deposit, Western Makran volcanic arc, southeast Iran. Econ. Geol. 2016, 111, 619–639. [Google Scholar] [CrossRef]
  26. Wang, L.; Zheng, Y.; Hou, Z.; Xue, C.; Yang, Z.; Shen, Y.; Li, X.; Ghaffar, A. The subduction-related Saindak porphyry Cu–Au deposit formed by remelting of a thickened juvenile lower crust underneath the Chagai belt, Pakistan. Ore Geol. Rev. 2022, 149, 105062. [Google Scholar] [CrossRef]
  27. Hou, Z.Q.; Zhang, H.R.; Pan, X.F.; Yang, Z.M. Porphyry Cu (–Mo–Au) deposits related to melting of thickened mafic lower crust: Examples from the eastern Tethyan metallogenic domain. Ore Geol. Rev. 2011, 39, 21–45. [Google Scholar] [CrossRef]
  28. Razique, A. Magmatic Evolution and Genesis of the Giant Reko Diq H14–H15 Porphyry Copper–Gold Deposit, District Chagai, Balochistan–Pakistan. Ph.D. Thesis, University of British Columbia, Kelowna, BC, Canada, 2013. [Google Scholar]
  29. Richards, J.P.; Spell, T.; Rameh, E.; Razique, A.; Fletcher, T. High Sr/Y Magmas Reflect Arc Maturity, High Magmatic Water Content, and Porphyry Cu ± Mo ± Au Potential: Examples from the Tethyan Arcs of Central and Eastern Iran and Western Pakistan. Econ. Geol. 2012, 107, 295–332. [Google Scholar] [CrossRef]
  30. Siddiqui, R.H.; Jan, M.Q.; Khan, M.A.; Kakar, M.I.; Foden, J.D. Petrogenesis of the Late Cretaceous tholeiitic volcanism and oceanic island arc affinity of the Chagai Arc, western Pakistan. Acta Geol. Sin. 2017, 91, 1248–1263. (In English) [Google Scholar] [CrossRef]
  31. Lawrence, R.D.; Khan, S.H.; DeJong, K.A.; Farah, A.; Yeats, R.S. Thrust and strike-slip fault interaction along the Chaman transform zone, Pakistan. Geol. Soc. Lond. Spéc. Publ. 1981, 9, 363–370. [Google Scholar] [CrossRef]
  32. Siddiqui, R.H.; Jan, M.Q.; Khan, M.A. Petrogenesis of Late Cretaceous lava flows from a Ceno-Tethyan island arc: The Raskoh arc, Balochistan, Pakistan. J. Asian Earth Sci. 2012, 59, 24–38. [Google Scholar] [CrossRef]
  33. Hunting Survey Corporation. Geological survey of Pakistan: Reconnaissance geology of part of Chagai District, West Pakistan. Geol. Surv. Pak. Mem. 1960, 1, 1–80. [Google Scholar]
  34. Breitzman, L.L. Fission-Track Ages of Intrusives of the Chagai District, Baluchistan, Pakistan. Master’s Thesis, Dartmouth College, Hanover, NH, USA, 1979. [Google Scholar]
  35. Breitzman, L.L.; Birnie, R.W.; Johnson, G.D. Fission-track ages of the Chagai intrusives, Baluchistan, Pakistan. Geol. Soc. Am. Bull. 1983, 94, 253–258. [Google Scholar] [CrossRef]
  36. Razique, A.; Tosdal, R.; Bouzari, F. Anatomical similarities and differences between spatially associated porphyry copper–gold deposits at the Reko Diq H14 and H15 complex, Balochistan, Pakistan. Soc. Econ. Geol. Spec. Publ. 2016, 19, 259–278. [Google Scholar]
  37. Ghaffar, A. Genetic Model of the Superlarge Saindak Porphyry Cu–Au Deposits at Western Chagai Arc in Balochistan Province, Pakistan. Ph.D. Thesis, Kunming University of Science and Technology, Yunnan, China, 2018. [Google Scholar]
  38. Hong, J.; Ji, W.H.; Yang, X.Y.; Tahseenullah, K.; Wang, R.; Li, W.Y.; Zhang, H.S. Origin of a Miocene alkaline–carbonatite complex in the Dunkeldik area of Pamir, Tajikistan: Petrology, geochemistry, LA–ICP–MS zircon U–Pb dating, and Hf isotope analysis. Ore Geol. Rev. 2019, 107, 820–837. [Google Scholar] [CrossRef]
  39. Tanaka, T.; Togashi, S.; Kamioka, H.; Amakawa, H.; Kagami, H.; Hamamoto, T.; Yuhara, M.; Orihashi, Y.; Yoneda, S.; Shimizu, H.; et al. JNdi-1: A neodymium isotopic reference in consistency with La Jolla neodymium. Chem. Geol. 2000, 168, 279–281. [Google Scholar] [CrossRef]
  40. Todt, W.; Cliff, R.A.; Hanser, A.; Hofmann, A.W. Evaluation of a 202Pb–205Pb double spike for high precision lead isotope analysis. In Earth Processes: Reading the Isotopic Code; Basu, A., Hart, S., Eds.; American Geophysical Union Geophysical Monograph: Florida Avenue, WA, USA, 1996; pp. 429–437. [Google Scholar]
  41. Horn, I.; Rudnick, R.L.; McDonough, W.F. Precise elemental and isotope ratio determination by simultaneous solution nebulization and laser ablation–ICPMS: A new approach for the analysis of geologic materials. Chem. Geol. 2000, 164, 281–301. [Google Scholar] [CrossRef]
  42. Ballard, J.R.; Palin, J.M.; Williams, I.S.; Campbell, I.H. Two ages of porphyry intrusions resolved for the super-giant Chuquicamata copper deposit of northern Chile by ELA-ICP-MS and SHRIMP. Geology 2001, 29, 383–386. [Google Scholar] [CrossRef]
  43. Yuan, H.L.; Gao, S.; Liu, X.M.; Li, H.M.; Günther, D.; Wu, F.Y.; Zhou, L. Accurate U–Pb age and trace element determinations of zircon by laser ablation–inductively coupled plasma–mass spectrometry. Geostand. Geoanalytical Res. 2004, 28, 353–370. [Google Scholar] [CrossRef]
  44. Liu, Y.; Gao, S.; Hu, Z.; Gao, C.; Zong, K.; Wang, D. Continental and oceanic crust recycling-induced melt-peridotite interactions in the Trans-North China Orogen: U–Pb dating, Hf isotopes and trace elements in zircons from mantle xenoliths. J. Petrol. 2010, 51, 537–571. [Google Scholar] [CrossRef]
  45. Ludwig, K.R. Isoplot/Ex 3.23: A geochronological toolkit for Microsoft Excel. Berkeley Geochronol. Cent. Spec. 2003, 4, 73. [Google Scholar]
  46. Cui, Y.R.; Xiao, Z.B.; Tu, J.R.; Zhou, H.Y.; Li, G.Z. Research Progress in situ Hf Isotopic Analysis of Oxide-type U-bearing Accessory Minerals. Rock Miner. Anal. 2022, 41, 691–703. [Google Scholar] [CrossRef]
  47. Yuan, H.L.; Gao, S.; Dai, M.N.; Zong, C.L.; Günther, D.; Fontaine, G.H.; Liu, X.M.; Diwu, C.R. Simultaneous determinations of U–Pb age, Hf isotopes and trace element compositions of zircon by excimer laser-ablation quadrupole and multiple-collector ICP-MS. Chem. Geol. 2008, 247, 100–118. [Google Scholar] [CrossRef]
  48. DeBievre, P.; Taylor, P.D.P. Table of the isotopic compositions of the elements. Int. J. Mass Spectrom. Ion Process. 1993, 123, 149–166. [Google Scholar] [CrossRef]
  49. Chu, N.; Taylor, R.N.; Chavagnac, V.; Nesbitt, R.W.; Boella, R.; Milton, J.A.; German, C.R.; Bayon, G.; Burton, K.W. Hf isotope ratio analysis using multi-collector inductively coupled plasma mass spectrometry: An evaluation of isobaric interference corrections. J. Anal. At. Spectrom. 2002, 17, 1567–1574. [Google Scholar] [CrossRef]
  50. Griffin, W.L.; Pearson, N.J.; Belousova, E.A.; O’Reilly, S.Y. Comment: Hf isotopes in zircon and the formation of continental crust. Chem. Geol. 2006, 233, 358–363. [Google Scholar] [CrossRef]
  51. Griffin, W.L.; Pearson, N.J.; Belousova, E.; Jackson, S.E.; van Achterbergh, E.; O’Reilly, S.Y.; Shee, S.R. The Hf isotope composition of cratonic mantle: LAM–MC–ICPMS analysis of zircon megacrysts in kimberlites. Geochim. Cosmochim. Acta 2000, 64, 133–147. [Google Scholar] [CrossRef]
  52. Vervoort, J.D.; Blichert-Toft, J. Evolution of the depleted mantle: Hf isotope evidence from juvenile rocks through time. Geochim. Cosmochim. Acta 1999, 63, 533–556. [Google Scholar] [CrossRef]
  53. Scherer, E.E.; Münker, C.; Mezger, K. Calibration of the lutetium–hafnium clock. Science 2001, 293, 683–687. [Google Scholar] [CrossRef] [PubMed]
  54. Li, X.W.; Li, C.; Zhou, L.M.; Zhao, H.; Qu, W.J. A Review of Research Progress on Re-Os Isotopic System of Carbon-enriched Geological Samples. Rock Miner. Anal. 2023, 42, 221–238. [Google Scholar] [CrossRef]
  55. Shirey, S.B.; Walker, R.J. Carius tube digestion for low-blank rhenium–osmium analysis. Anal. Chem. 1995, 67, 2136–2141. [Google Scholar] [CrossRef]
  56. Mao, J.W.; Zhang, Z.C.; Zhang, Z.H.; Du, A.D. Re–Os isotopic dating of molybdenites in the Xiaoliugou W (Mo) deposit in the northern Qilian mountains and its geological significance. Geochim. Cosmochim. Acta 1999, 63, 1815–1818. [Google Scholar]
  57. Smoliar, M.I.; Walker, R.J.; Morgan, J.W. Re–Os ages of group IIA, IIIA, IVA, and IVB iron meteorites. Science 1996, 271, 1099–1102. [Google Scholar] [CrossRef]
  58. Ludwig, K.R. ISOPLOT/Ex version 2.49: A geochronological toolkit for Microsoft Excel. Berkeley Geochronol. Cent. Spec. Publ. 1999, 55, 10011476874. [Google Scholar]
  59. Wiebe, R.A.; Blair, K.; Hawkins, D.P.; Sabine, C.P. Mafic injections, magma mixing, and the formation of dioritic enclaves in granitic rocks of the Cadillac Mountain intrusive complex, Maine. J. Petrol. 2002, 43, 2027–2048. [Google Scholar]
  60. Mastoi, A.S.; Yang, X.; Deng, J.; Kashani, A.G.; Hakro, A.A.D. Geochronological and geochemical studies of adakites from Tethyan Belt, Western Pakistan: A clue to geodynamics and Cu–Au mineralization. Int. Geol. Rev. 2019, 62, 1273–1293. [Google Scholar] [CrossRef]
  61. Sun, S.S.; McDonough, W.F. Chemical and isotopic systematics of oceanic basalts: Implications for mantle composition and processes. Geol. Soc. Lond. Spec. Publ. 1989, 42, 313–345. [Google Scholar] [CrossRef]
  62. Griffin, W.L.; Wang, X.; Jackson, S.E.; Pearson, N.J.; O’Reilly, S.Y.; Xu, X.S.; Zhou, X.M. Zircon chemistry and magma mixing, SE China: In–situ analysis of Hf isotopes, Tonglu and Pingtan igneous complexes. Lithos 2002, 61, 237–269. [Google Scholar] [CrossRef]
  63. Belousova, E.; Griffin, W.; O’Reilly, S.; Fisher, N. Igneous zircon: Trace element composition as an indicator of source rock type. Contrib. Mineral. Petrol. 2002, 143, 602–622. [Google Scholar] [CrossRef]
  64. Hoskin, P.W.O.; Schaltegger, U. The composition of zircon and igneous and metamorphic petrogenesis. Rev. Mineral. Geochem. 2003, 53, 27–62. [Google Scholar] [CrossRef]
  65. Hintenberger, H.; Herr, W.; Voshage, H. Radiogenic osmium from rhenium-containing molybdenite. Phys. Rev. 1954, 95, 1690–1691. [Google Scholar] [CrossRef]
  66. Shirey, S.B.; Walker, R.J. The Re–Os isotope system in cosmochemistry and high-temperature geochemistry. Annu. Rev. Earth Planet. Sci. 1998, 26, 423–500. [Google Scholar] [CrossRef]
  67. Mirnejad, H.; Mathur, R.; Hassanzadeh, J.; Shafie, B.; Nourali, S. Linking Cu mineralization to host porphyry emplacement: Re–Os ages of molybdenites versus U–Pb ages of zircons and sulfur isotope compositions of pyrite and chalcopyrite from the Iju and Sarkuh porphyry deposits in southeast Iran. Econ. Geol. 2013, 108, 861–870. [Google Scholar] [CrossRef]
  68. Richards, J.P.; Razavi, A.M.; Spell, T.L.; Locock, A.; Sholeh, A.; Aghazadeh, M. Magmatic evolution and porphyry–epithermal mineralization in the Taftan volcanic complex, southeastern Iran. Ore Geol. Rev. 2018, 95, 258–279. [Google Scholar] [CrossRef]
  69. Zheng, Y.C.; Wu, C.D.; Tian, S.H.; Hou, Z.Q.; Fu, Q.; Zhu, D.C. Magmatic and structural controls on the tonnage and metal associations of collision-related porphyry copper deposits in southern Tibet. Ore Geol. Rev. 2020, 122, 103509. [Google Scholar] [CrossRef]
  70. Martin, H.; Smithies, R.H.; Rapp, R.; Moyen, J.F.; Champion, D. An overview of adakite, tonalite–trondhjemite–granodiorite (TTG), and sanukitoid: Relationships and some implications for crustal evolution. Lithos 2005, 79, 1–24. [Google Scholar] [CrossRef]
  71. Moyen, J.F. High Sr/Y and La/Yb ratios: The meaning of the “adakitic signature”. Lithos 2009, 112, 556–574. [Google Scholar] [CrossRef]
  72. Rapp, R.P.; Watson, E.B. Dehydration melting of metabasalt at 8–32 kbar: Implications for continental growth and crust–mantle recycling. J. Petrol. 1995, 36, 891–931. [Google Scholar] [CrossRef]
  73. Defant, M.J.; Drummond, M.S. Derivation of some modern arc magmas by melting of young subducted lithosphere. Nature 1990, 347, 662–665. [Google Scholar] [CrossRef]
  74. Rapp, R.P.; Shimizu, N.; Norman, M.D.; Applegate, G.S. Reaction between slab-derived melts and peridotite in the mantle wedge: Experimental constraints at 3.8 GPa. Chem. Geol. 1999, 160, 335–356. [Google Scholar] [CrossRef]
  75. Zhu, D.C.; Zhao, Z.D.; Pan, G.T.; Lee, H.Y.; Kang, Z.Q.; Liao, Z.L.; Wang, L.Q.; Li, G.M.; Dong, G.C.; Liu, B. Early Cretaceous subduction-related adakite-like rocks of the Gangdese Belt, southern Tibet: Products of slab melting and subsequent melt–peridotite interaction? J. Asian Earth Sci. 2009, 34, 298–309. [Google Scholar] [CrossRef]
  76. Wu, C.D.; Zheng, Y.C.; Xu, B.; Hou, Z.Q. The genetic relationship between JTA-like magmas and typical adakites: An example from the Late Cretaceous Nuri complex, southern Tibet. Lithos 2018, 320–321, 265–279. [Google Scholar] [CrossRef]
  77. Kemp, A.I.S.; Hawkesworth, C.J.; Paterson, B.A.; Kinny, P.D. Episodic growth of the Gondwana continental crust: New SHRIMP zircon U–Pb and Hf isotope data from the Lachlan Fold Belt, southeastern Australia. Earth Planet. Sci. Lett. 2007, 251, 303–326. [Google Scholar] [CrossRef]
  78. Xu, Y.G.; Zhang, H.H.; Zou, H.B. Geochemistry of continental basalts and mantle xenoliths. In Petrology and Geochemistry of Continental Volcanic Rocks in Eastern China; Tang, D.H., Ed.; Geological Publishing House: Beijing, China, 2012. [Google Scholar]
  79. Feeley, T.C.; Cosca, M.A.; Lindsay, C.R. Petrogenesis and implications of calc-alkaline cryptic hybrid magmas from Washburn volcano, Absaroka Volcanic Province, USA. J. Petrol. 2002, 43, 663–703. [Google Scholar] [CrossRef]
  80. McDonough, W.F.; Sun, S.S. The Composition of the Earth. Chem. Geol. 1995, 120, 223–253. [Google Scholar] [CrossRef]
  81. Hawkesworth, C.J.; Gallagher, K.; Hergt, J.M.; McDermott, F. Mantle and slab contributions in arc magmas. Annu. Rev. Earth Planet. Sci. 1993, 21, 175–204. [Google Scholar] [CrossRef]
  82. Rudnick, R.L.; Gao, S. Composition of the Continental Crust. In Treatise on Geochemistry; Holland, H.D., Turekian, K.K., Eds.; Elsevier: Oxford, UK, 2003; pp. 1–64. [Google Scholar]
  83. Castillo, P.R. Adakite petrogenesis. Lithos 2012, 134–135, 304–316. [Google Scholar] [CrossRef]
  84. Richards, J.P.; Kerrich, R. Adakite-like rocks: Their diverse origins and questionable role in metallogenesis. Econ. Geol. 2007, 102, 537–576. [Google Scholar] [CrossRef]
  85. Siddiqui, R.H. Magmatic evolution of Chagai–Raskoh arc terrane and its implication for porphyry copper mineralization. Geologica 1996, 2, 87–119. [Google Scholar]
  86. Yang, Z.M.; Goldfarb, R.; Chang, Z.S. Generation of postcollisional porphyry copper deposits in southern Tibet triggered by subduction of the Indian continental plate. Soc. Econ. Geol. Spec. Publ. 2016, 19, 279–300. [Google Scholar]
  87. Jolivet, L.; Faccenna, C. Mediterranean extension and the Africa–Eurasia collision. Tectonics 2000, 19, 1095–1106. [Google Scholar] [CrossRef]
  88. McQuarrie, N.; Stock, J.M.; Verdel, C.; Wernicke, B.P. Cenozoic evolution of Neotethys and implications for the causes of plate motions. Geophys. Res. Lett. 2003, 30, 2036. [Google Scholar] [CrossRef]
  89. Homke, S.; Vergés, J.; Garcés, M.; Emami, H.; Karpuz, R. Magnetostratigraphy of Miocene–Pliocene Zagros foreland deposits in the front of the Push-e-Kush Arc (Lurestan Province, Iran). Earth Planet. Sci. Lett. 2004, 225, 397–410. [Google Scholar] [CrossRef]
  90. Molinaro, M.; Leturmy, P.; Guezou, J.C.; Frizon de Lamotte, D.; Eshraghi, S.A. The structure and kinematics of the southeastern Zagros fold-thrust belt, Iran: From thin-skinned tectonics. Tectonics 2005, 24, TC3007. [Google Scholar] [CrossRef]
  91. Pang, K.N.; Chung, S.L.; Zarrinkoub, M.H.; Chiu, H.Y.; Li, X.H. On the magmatic record of the Makran arc, southeastern Iran: Insights from zircon U–Pb geochronology and bulk-rock geochemistry. Geochem. Geophys. Geosystems 2014, 15, 2151–2169. [Google Scholar] [CrossRef]
  92. Khan, M.A.; Siddiqui, R.H.; Jan, M.Q. Temporal Evolution of Cretaceous to Pleistocene Magmatism in the Chagai Arc, Balochistan, Pakistan; Open-File Report 2010–1099; U.S. Geological Survey: Reston, VA, USA, 2010.
  93. Nicholson, K.N.; Khan, M.; Mahmood, K. Geochemistry of the Chagai–Raskoh arc, Pakistan: Complex arc dynamics spanning the Cretaceous to the Quaternary. Lithos 2010, 118, 338–348. [Google Scholar] [CrossRef]
  94. Zürcher, L.; Bookstrom, A.A.; Hammarstrom, J.M.; Mars, J.C.; Ludington, S.D.; Zientek, M.L.; Dunlap, P.; Wallis, J.C. Tectono–magmatic evolution of porphyry belts in the central Tethys region of Turkey, the Caucasus, Iran, western Pakistan, and southern Afghanistan. Ore Geol. Rev. 2019, 111, 1–74. [Google Scholar] [CrossRef]
  95. Wong, J.; Sun, M.; Xing, G.; Li, X.; Zhao, G.; Wong, K.; Yuan, C.; Xia, X.; Li, L.; Wu, F. Geochemical and zircon U–Pb and Hf isotopic study of the Baijuhuajian metaluminous A-type granite: Extension at 125–100 Ma and its tectonic significance for South China. Lithos 2009, 112, 289–305. [Google Scholar] [CrossRef]
  96. Gutscher, M.A.; Maury, R.; Eissen, J.P.; Bourdon, E. Can slab melting be caused by flat subduction? Geology 2000, 28, 535–538. [Google Scholar] [CrossRef]
  97. Abratis, M.; Wörner, G. Ridge collision slab-window formation and the flux of Pacific asthenosphere into the Caribbean realm. Geology 2001, 29, 127–130. [Google Scholar] [CrossRef]
  98. Ling, M.X.; Wang, F.Y.; Ding, X.; Hu, Y.H.; Zhou, J.B.; Zartman, R.E.; Yang, X.Y.; Sun, W.D. Cretaceous ridge subduction along the lower Yangtze River Belt, Eastern China. Econ. Geol. 2009, 104, 303–321. [Google Scholar] [CrossRef]
  99. Yogodzinski, G.M.; Lees, J.M.; Churikova, T.G.; Dorendorf, F.; Woerner, G.; Volynets, O.N. Geochemical evidence for the melting of subducting oceanic lithosphere at plate edges. Nature 2001, 409, 500–504. [Google Scholar] [CrossRef] [PubMed]
  100. Sillitoe, R.H. A plate tectonic model for the origin of porphyry copper deposits. Econ. Geol. 1972, 67, 184–197. [Google Scholar] [CrossRef]
  101. Hollings, P.; Cook, D.; Clark, A. Regional geochemistry of Tertiary igneous rocks in Central Chile: Implications for the geodynamic environment of giant porphyry copper and epithermal gold mineralization. Econ. Geol. 2005, 100, 887–904. [Google Scholar] [CrossRef]
  102. Tosdal, R.M.; Dilles, J.H.; Cook, D.R. From source to sinks in auriferous magmatic hydrothermal porphyry and epithermal deposits. Elements 2009, 5, 289–295. [Google Scholar] [CrossRef]
  103. Stern, R.J. Subduction zones. Rev. Geophys. 2002, 40, 3-1–3-38. [Google Scholar] [CrossRef]
  104. Rubinstein, N.A.; Zappettini, E.O.; Gómez, A.L.R. Porphyry CU deposits in the Central Andes of Argentina: An overview. J. S. Am. Earth Sci. 2021, 112, 103543. [Google Scholar] [CrossRef]
  105. Audétat, A.; Günther, D.; Heinrich, C.A. Magmatic-hydrothermal evolution in a porphyry copper system: A case study from the Bingham Canyon deposit, Utah. Geochim. Cosmochim. Acta 2008, 72, 139–168. [Google Scholar]
  106. Hong, J.; Zhang, H.S.; LV, P.R.; Tahseenullah, K.; Yasir, S.K.; Wang, Z.H.; Zhang, H.D. Tectono–magmatic evolution of the Neo-Tethys belt in Pakistan and related mineralization of major metal mineral meposits. Northwestern Geol. 2024, 57, 1–23, (In Chinese with English Abstrct). [Google Scholar] [CrossRef]
  107. Wang, X.; Li, W.; Romer, R.L.; Yang, F.; Li, J.; Liu, K.; Zhang, Z.; Yan, L. Genesis and geodynamic setting of granitoids at the giant Siah Diq S1 porphyry Cu Au deposit, Chagai belt, Western Pakistan. Lithos 2025, 494–495, 107919. [Google Scholar] [CrossRef]
  108. Khalil, Y.S.; Wenyuan, L.; Huang, J.; Abbas, S.A.; Jun, H. Geophysical exploration and geological appraisal of the Siah Diq porphyry Cu–Au prospect: A recent discovery in the Chagai volcano magmatic arc, SW Pakistan. Open Geosci. 2022, 14, 1250–1267. [Google Scholar] [CrossRef]
  109. Siddiqui, R.H.; Khan, M.A.; Jan, M.Q.; Kakar, M.I.; Kerr, A.C. Geochemistry and petrogenesis of Oligocene volcaniclastic rocks from the Chagai arc: Implications for the emplacement of porphyry copper deposits. Arab. J. Geosci. 2015, 8, 8655–8667. [Google Scholar] [CrossRef]
  110. Dorais, M.J.; Whitney, J.A.; Peterman, Z.E. Origin of biotite-apatite-rich enclaves, Lamarck Granodiorite, Sierra Nevada, California. J. Petrol. 1990, 31, 763–797. [Google Scholar]
  111. Barbarin, B. Mafic microgranular enclaves and mafic rocks associated with some granitoids of the central Sierra Nevada batholith, California: Nature, origin and relations with the hosts. Lithos 2005, 80, 155–177. [Google Scholar] [CrossRef]
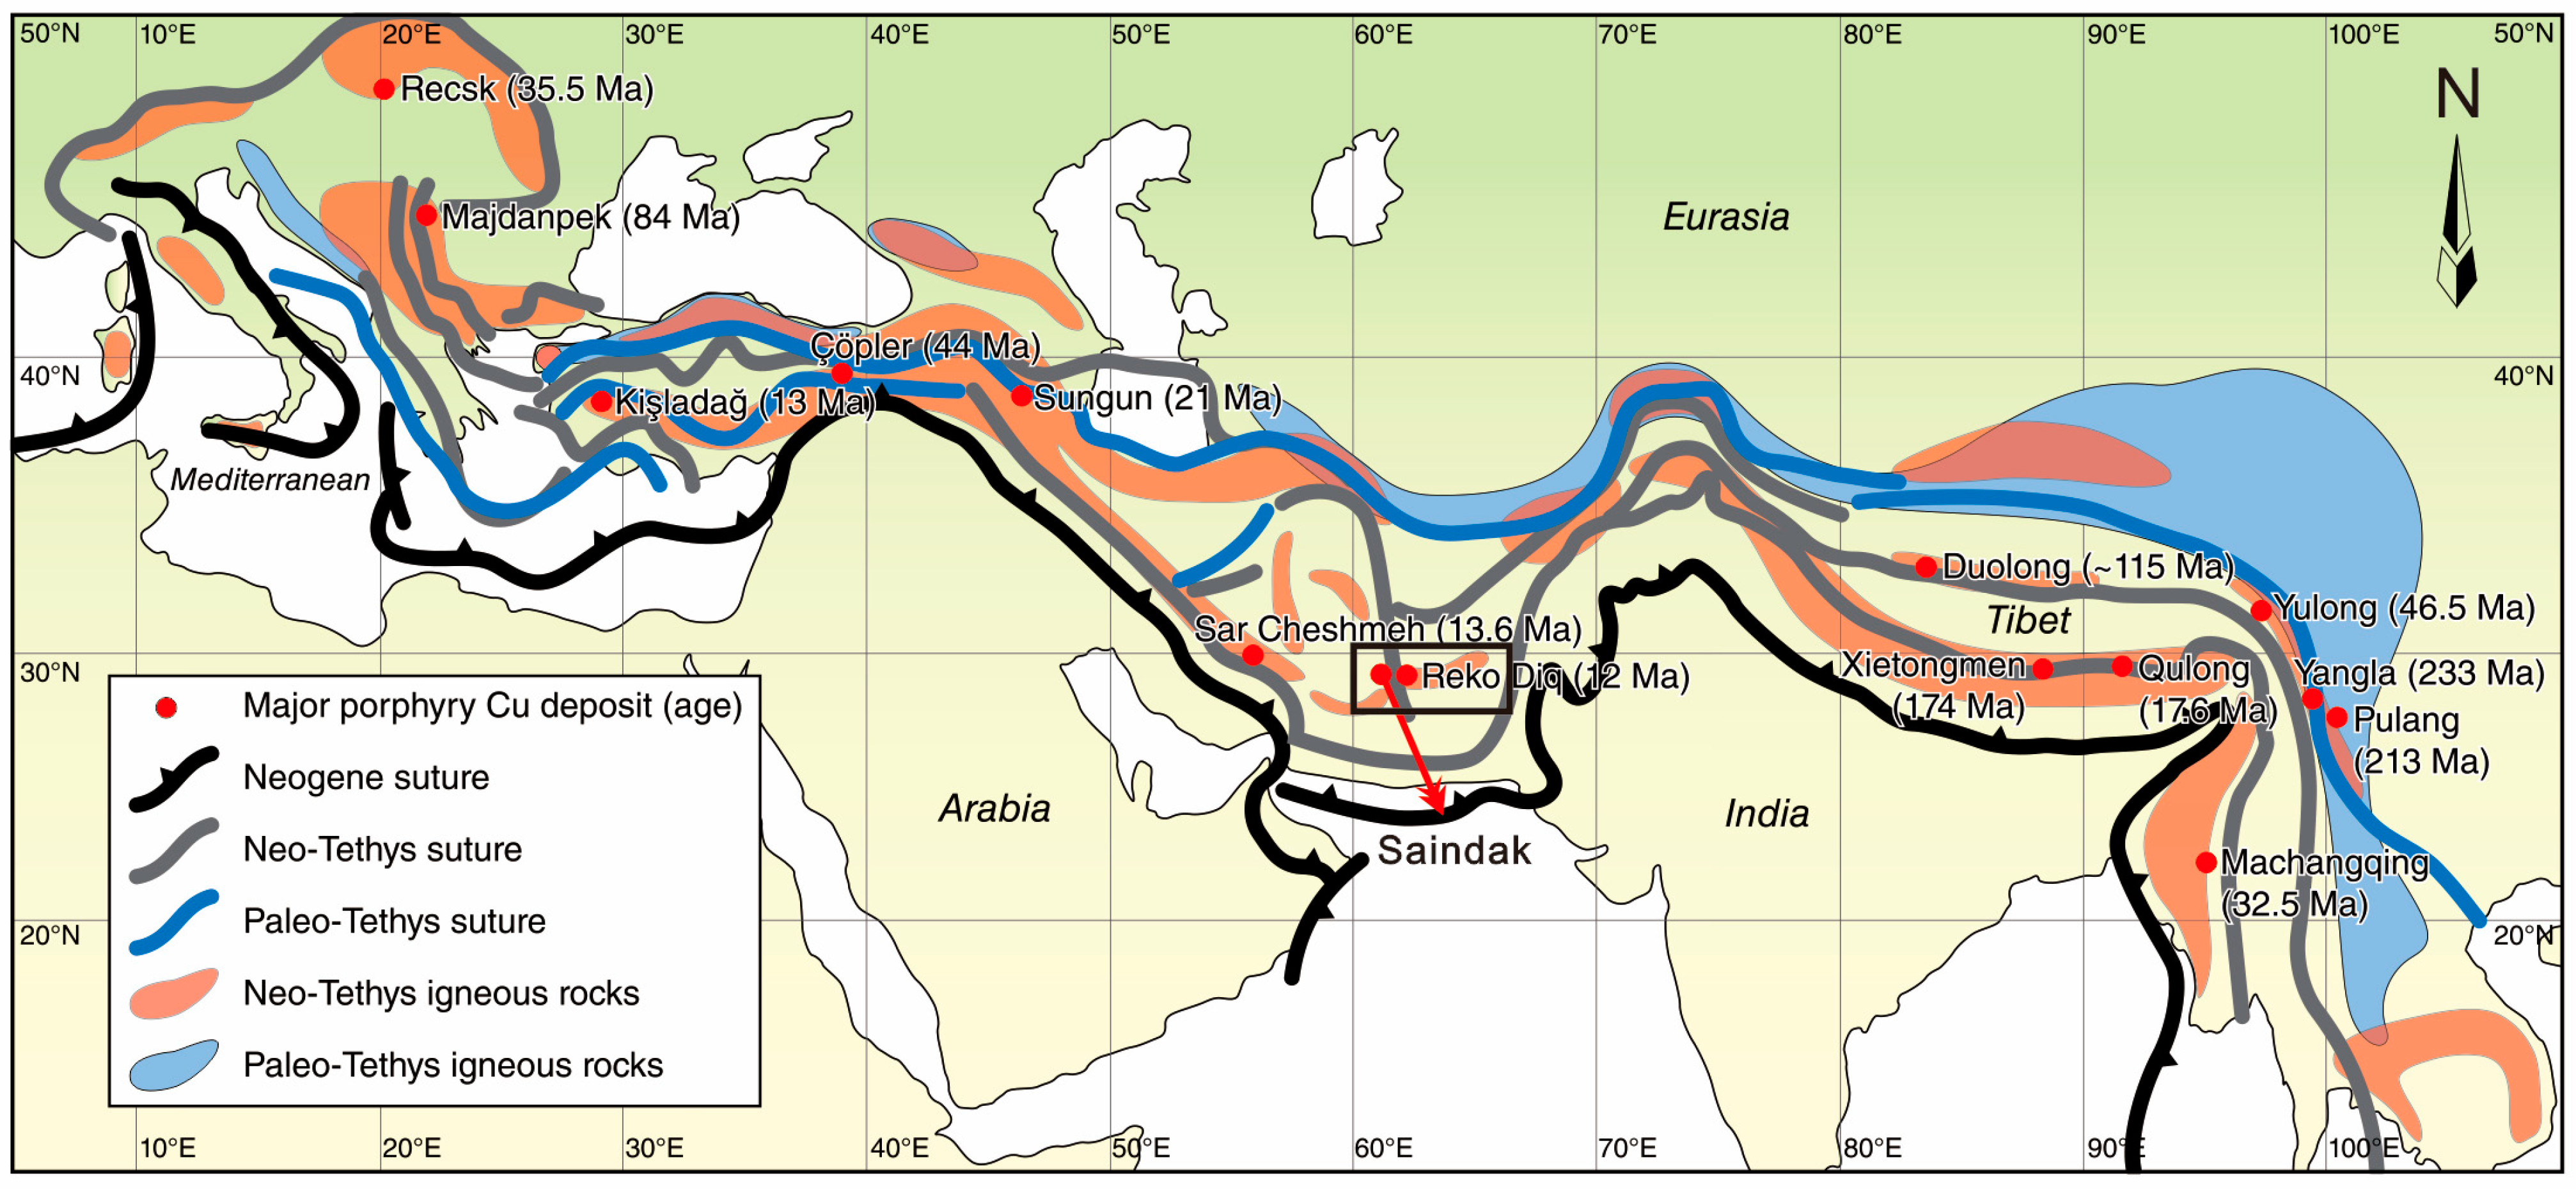
Figure 1. Distribution of porphyry Cu deposits linked to collisional closure and subduction during the Permian–Jurassic Paleo-Tethyan and Cretaceous–Cenozoic Neo-Tethyan periods (after Richards, 2015; Richards and Şengör, 2017) [15,21].
Minerals 15 00768 g001
Figure 2. Tectonic maps (A,B) and geological map (C) of the Chagai belt, Balochistan province, Pakistan (modified after [22,26]).
Minerals 15 00768 g002
Figure 3. A generalized stratigraphic sequence showing multiple phases of intrusion and mineralization timing in the Chagai arc, Balochistan province, Pakistan (modified from [22,26]).
Minerals 15 00768 g003
Figure 4. A generalized geologic map of the Saindak porphyry Cu deposit and the surrounding area.
Minerals 15 00768 g004
Figure 5. Field photographs in the Saindak mining area, Chagai arc. (A) Field relationship of diorite porphyry and ore-bearing quartz diorite porphyry; (B) a small fault zone developed in the quartz diorite porphyry; (C) a mafic dike intruded the quartz diorite porphyry; (D) small plugs of quartz diorite porphyry within the diorite porphyry; (E,F) MMEs with different shapes and sizes hosted in diorite porphyry.
Minerals 15 00768 g005
Figure 6. Alteration zoning of the south orebody of the Saindak copper mine.
Minerals 15 00768 g006
Figure 7. Representative photomicrographs of Saindak porphyry copper deposit: (A) porphyry structure in quartz diorite porphyry; (B) plagioclase phenocrysts often develop ring structures; (C) biotite phenocryst, rounded shaped; (D) quartz + pyrite veins cut through plagioclase phenocrysts; (E) quartz occurs as anhedral crystals with embayed alteration margins; (F) intense potassic zone, where a large amount of fine-grained biotite is developed; (G) carbonatization and quartz+calcite mineral assemblage; (H) altered minerals include actinolite, pyrite, and other opaque minerals; and (I) biotite phenocryst (Bio—biotite; Cpx—clinopyroxene; Fs—feldspar; Qz—quartz; Ser—sericite).
Minerals 15 00768 g007
Figure 8. Photomicrographs of ore textures of the Saindak porphyry copper deposit. (A) disseminated ores, chalcopyrite, and pyrite are disseminated; (B) magnetite in the ore is relatively developed, and the early magnetite occur as veins; (C) disseminated chalcopyrite and pyrite crystals; (D) hydrothermal biotite and chalcopyrite in biotite–quartz veins hosted by a biotite-rich alteration zone; (E) C-veins characterized by quartz-free pyrite–chalcopyrite association; (F) chalcopyrite is heteromorphically embedded in cracks of quartz and biotite. Abbreviation: Bio = biotite; Ccy = chalcopyrite; Mag = magnetite; Py = pyrite; Qz = quartz.
Minerals 15 00768 g008
Figure 9. Mineralization stages, sequence of minerals growth, and relationship with alteration of the Saindak porphyry copper deposit.
Minerals 15 00768 g009
Figure 10. CL images and zircon U–Pb concordia plots from intrusive rocks of Saindak porphyry copper deposit (error ellipses are 1 sigma and age errors represent 95% confidence levels). (a) quartz diorite porphyry; (b) diorite porphyry; (c) MME hosted in diorite porphyry; (d) mafic dike.
Minerals 15 00768 g010
Figure 11. Isochron-derived Re–Os ages for molybdenite samples from the Saindak porphyry copper deposit.
Minerals 15 00768 g011
Figure 12. Geochemical characteristics of intrusive rocks in the Saindak copper deposit. (A) TAS diagram; (B) K2O vs. SiO2 diagram; (C) A/NK-A/CNK diagram; A/NK = Al/(Na+K) (molar ratio). A/CNK = Al/(Ca+Na+K) (molar ratio) (D) Fe2O3/FeO vs. SiO2 diagram.
Minerals 15 00768 g012
Figure 13. (A) Chondrite-normalized REE compositions and (B) primitive-mantle-normalized spider diagram for the intrusive rocks of Saindak copper deposit. The chondrite and primitive mantle values are after [61].
Minerals 15 00768 g013
Figure 14. Sr and Nd isotope ratio variation diagram for the Saindak porphyry copper deposit.
Minerals 15 00768 g014
Figure 15. εHf(t) vs. U–Pb age diagram for the Saindak porphyry copper deposit. The values used for constructing the depleted mantle and crustal volution reference lines were taken from [62]. The field for juvenile lower crust is after [12].
Minerals 15 00768 g015
Figure 17. Diagrammatic representation of the evolution path, porphyry copper deposit production, and arc magmatism associated with subduction at the continental plate edges (After [1,18,100,101,102]).
Minerals 15 00768 g017
Table 1. Re-Os dating results of molybdenites in the Saindak porphyry copper deposit.
No.Weight
(g)
Re (μg/g)Normal Os (μg/g)187Re (μg/g)187Os (μg/g)Model Age
Measured2 δMeasured2 δMeasured2 δMeasured2 δMeasured2 δ
SK-010.008001281.8821.170.04190.0257805.6913.300.30000.001722.350.45
SK-020.002111836.6312.570.17770.00791150.440.7900.42170.002921.930.30
SK-030.001233977.7941.780.43570.01322500.1226.260.92720.007222.260.36
SK-040.054604.89 34.75 0.730.04192894.2621.840.10760.0083 22.300.33
Table 2. Abundances of major (wt.%), trace, and rare earth elements (ppm) analyses for multiple intrusions of the Saindak Cu deposit (ppm).
No.NS-1NS-2NS-3NS-4NA2-1NA2-2NA2-3NA2-4NE-1 *NE-2 *NE-3 *NE-4 *NS10-1NS10-2
SampleQDPQDPQDPQDPQDPQDPQDPQDPDPDPDPDPGabbroGabbro
SiO262.1262.3261.9262.265.865.763.9664.1954.0554.3154.2153.5747.9648.11
TiO20.450.430.420.430.40.420.440.440.650.630.630.630.90.9
Al2O316.0516.1816.0116.2316.1415.6416.5516.4318.2618.0818.2818.1415.315.43
FeO2.252.252.352.281.882.052.452.02 6.656.7
Fe2O31.921.711.741.691.32.041.481.737.657.607.477.533.022.8
MnO0.070.0690.0740.0690.0820.0390.0460.060.140.140.140.140.120.11
MgO3.13.083.063.092.192.272.392.344.404.254.284.289.8610.07
CaO5.485.475.525.493.913.474.824.45.925.995.855.766.616.53
Na2O3.683.863.883.843.493.443.493.384.314.284.334.392.522.7
K2O2.042.051.62.021.62.151.151.461.501.501.581.512.111.68
P2O50.130.130.130.140.140.140.150.150.210.210.210.210.270.28
LOI2.532.263.122.362.792.392.913.22.562.802.542.724.434.4
Total99.8299.8199.8299.8499.7299.7599.8499.80 99.6699.75
K2O/Na2O0.55 0.53 0.41 0.53 0.46 0.63 0.33 0.43 0.350.350.360.340.84 0.62
K2O + Na2O5.72 5.91 5.48 5.86 5.09 5.59 4.64 4.84 5.815.785.915.904.63 4.38
Li10.110.111.610.214.213.615.115.9 13.214
Be2.212.322.242.383.343.523.082.98 2.412.46
Sc15.415.71414.61311.612.612 31.731.2
V11496.491.594.692.390.8100101 223224
Cr79.776.176.17830.331.431.726.3 441464
Co12.21111.51113.311.310.67.22 2020.6
Ni37.836.636.636.817.717.217.414.5 171176
Cu33.14820.616.482741011963.4 306914
Zn81.272.878.873.3122101128188 136141
Ga17.517.317.417.317.517.218.917.8 19.320.6
Rb79.276.163.171.953.86038.852.112.717.113.913.280.178.4
Sr7037227556756446417566861275139013151360567603
Ba929823672712665912607648750800810800538435
Zr74.876.27670.667.586.959.556.895.4101.5105.5101.0115122
Hf3.052.332.282.172.272.732.041.972.72.92.92.93.083.28
Nb7.697.917.517.810.412.310.8106.87.37.47.412.112.5
Ta0.800.770.720.730.951.040.860.800.450.440.470.460.760.76
Cs1.631.461.71.4232.972.793.66 5.098.5
La31.63130.230.535.542.645.343.315.416.915.615.761.566.5
Ce49.648.147.247.456.96769.765.833.435.634.735.4111122
Pr5.094.94.834.846.096.77.617.13.934.164.034.0912.513.4
Nd16.415.715.815.319.420.224.122.715.215.815.415.743.745.2
Sm2.672.582.492.493.182.933.643.382.953.002.882.976.466.88
Eu0.940.880.820.870.980.911.000.990.790.790.790.861.621.54
Gd2.342.242.102.212.712.403.142.932.452.522.582.635.425.64
Tb0.380.360.330.340.410.350.470.440.380.390.400.400.800.82
Dy1.791.701.631.612.141.702.282.322.292.392.462.443.793.92
Ho0.380.340.320.320.420.330.450.450.480.490.510.500.720.74
Er0.890.810.800.781.060.841.121.201.431.471.511.501.781.87
Tm0.180.170.150.150.190.160.200.200.200.210.210.210.310.33
Yb1.081.040.920.991.301.111.401.341.321.361.401.351.942.07
Lu0.190.170.150.160.200.170.200.220.200.220.220.210.280.31
Y10.49.159.078.7311.99.413.413.311.511.911.711.919.719.6
Pb26.725.323.427.75129.628.146.612.912.913.113.612.313.3
Th21.020.921.520.229.837.126.826.85.305.975.615.5314.915.4
U4.985.005.404.724.355.729.303.781.71.71.92.43.673.90
Mg#58.1859.2058.2559.2156.1851.0553.0153.8753.2952.5953.2053.0065.2766.10
Sr/Y67.6078.9183.2477.3254.1268.1956.4251.58110.9116.8112.4114.328.7830.77
ΣREE113.5110.0107.7108.0130.5147.4160.6152.480.4285.3082.6983.96251.8271.2
LREE/
HREE
14.6815.1315.8215.4814.4619.8616.3415.758.198.437.908.0915.7316.28
LaN/YbN19.7320.1022.0820.8818.4125.8721.8121.797.878.387.517.8421.3721.66
δEu1.121.101.061.121.001.020.880.940.870.860.870.920.820.73
δCe0.850.850.850.850.860.860.830.821.010.991.031.040.910.93
QDP—quartz diorite porphyry; DP—diorite porphyry; data with * are from [60].
Table 3. Sr-Nd isotope compositions of intrusive rocks of the Saindak copper deposit.
No.Rock NameAge/MaRbSr87Rb/
86Sr
87Sr/
86Sr
87Sr/
86Sr i
SmNd147Sm/
144Nd
143Nd/
144Nd
εNd(t)
NS-1QDP2279.27030.32587 0.706581 0.0000080.706481 2.6716.40.09838 0.5125890.000002−0.7
NS-2QDP2276.17220.30488 0.706596 0.0000080.706502 2.5815.70.09930 0.5125770.000003−0.9
NA2-1QDP2253.86440.24165 0.706968 0.0000080.706894 3.1819.40.09905 0.5125260.000003−1.9
NA2-2QDP2260.06410.27076 0.706987 0.0000080.706904 2.9320.20.08765 0.5124970.000002−2.4
NA2-3QDP2238.87560.14846 0.706906 0.0000080.706860 3.6424.10.09127 0.5125360.000002−1.7
NA2-4QDP2252.16860.21969 0.706961 0.0000080.706893 3.3822.70.08997 0.5125400.000002−1.6
NE-1 *DP2261.89090.19666 0.7067100.00000120.706650 2.8217.00 −1.7
NE-2 *DP2212.712750.02881 0.7071850.00000120.707176 2.9515.20 −1.1
NE-3 *DP2213.913150.03058 0.7071910.00000120.707182 2.8815.40 −1.2
NE-4 *DP2213.213600.02808 0.7071680.00000120.707159 2.9715.70 −1.1
NS10-1Gabbro2280.15670.40865 0.707092 0.0000060.706966 6.4643.70.08932 0.5124730.000003−2.9
NS10-2Gabbro2278.46030.37610 0.707160 0.0000080.707044 6.8845.20.09198 0.5124690.000003−3.0
QDP—Quartz diorite porphyry; DP—diorite porphyry; data with * are from [60].
Table 4. Zircon Lu-Hf isotopic compositions for intrusions of Saindak porphyry copper deposit.
No.176Hf/
177Hf
176Lu/
177Hf
176Yb/
177Hf
Hf iεHf
(t)
TDM1/
Ga
TDM2/Ga
NS-010.2829250.0000130.0007780.0260040.282925.90.40.4610.0180.7240.018
NS-020.2828930.0000150.0007170.0243440.282894.70.50.5060.0210.7980.021
NS-030.2829120.0000170.0007730.0257420.282915.40.60.4800.0230.7550.023
NS-040.2829290.0000160.0006930.0225350.282936.00.50.4550.0220.7170.022
NS-050.2829310.0000150.0007960.0269230.282936.10.50.4540.0210.7130.021
NS-060.2829640.0000160.0005250.0176850.282967.30.60.4030.0220.6370.022
NS-070.2829010.0000150.0005070.0175830.282905.10.50.4910.0210.7780.021
NS-080.2829630.0000140.0008260.0278140.282967.20.50.4080.0200.6380.020
NS-090.2829150.0000150.0012910.0452230.282915.50.50.4820.0220.7480.022
NS-100.2829420.0000140.0006000.0201350.282946.50.50.4360.0200.6880.020
NS-110.2829380.0000150.0008150.0276990.282946.40.50.4430.0210.6950.021
NS-120.2829220.0000150.0005400.0177660.282925.80.50.4630.0210.7320.021
NS-130.2829500.0000150.0006150.0204430.282956.80.50.4240.0220.6680.022
NS-140.2829070.0000170.0007100.0240360.282915.30.60.4850.0240.7650.024
NS-150.2829440.0000160.0008560.0288750.282946.50.60.4350.0230.6820.023
NS-160.2829150.0000160.0005860.0195050.282915.50.60.4730.0230.7470.023
NE-010.2829320.0000160.0007180.0241640.282936.10.50.4500.0220.7090.022
NE-020.2829450.0000170.0010830.0376230.282946.60.60.4370.0250.6810.025
NE-030.2829200.0000160.0003320.0112180.282925.70.50.4630.0220.7370.022
NE-040.2829580.0000150.0005520.0187080.282967.10.50.4120.0210.6500.021
NE-050.2829120.0000200.0012960.0457840.282915.40.70.4860.0280.7550.028
NE-060.2829180.0000150.0007380.0251220.282925.60.50.4710.0210.7410.021
NE-070.2829010.0000160.0011890.0426710.282905.00.60.5000.0230.7790.023
NE-080.2829130.0000160.0008360.0285550.282915.50.50.4790.0220.7520.022
NE-090.2829320.0000160.0005260.0180300.282936.10.50.4480.0220.7090.022
NE-100.2829390.0000130.0005560.0191080.282946.40.50.4400.0190.6940.019
NE-110.2829320.0000150.0005500.0186300.282936.10.50.4480.0210.7080.021
NE-120.2829200.0000140.0008870.0305400.282925.70.50.4690.0200.7360.020
NE-130.2829470.0000150.0005500.0184570.282956.60.50.4280.0210.6760.021
NE-140.2829090.0000140.0006410.0221480.282915.30.50.4820.0200.7610.020
Disclaimer/Publisher’s Note: The statements, opinions and data contained in all publications are solely those of the individual author(s) and contributor(s) and not of MDPI and/or the editor(s). MDPI and/or the editor(s) disclaim responsibility for any injury to people or property resulting from any ideas, methods, instructions or products referred to in the content.