Article

Tectonic Evolution of the Eastern Central Asian Orogenic Belt: Evidence from Magmatic Activity in the Faku Area, Northern Liaoning, China

1
Shenyang Center of China Geological Survey, Shenyang 110034, China
2
School of Resource & Environment and Safety Engineering, University of South China, Hengyang 421001, China
3
Liaoning Province Natural Resources Affairs Service Center, Shenyang 110034, China
*
Author to whom correspondence should be addressed.
Minerals 2025, 15(7), 736; https://doi.org/10.3390/min15070736
Submission received: 9 May 2025 / Revised: 1 July 2025 / Accepted: 8 July 2025 / Published: 15 July 2025
(This article belongs to the Special Issue Selected Papers from the 7th National Youth Geological Congress)

Abstract

The Permian–Triassic magmatic record in the eastern Central Asian Orogenic Belt (CAOB) provides critical insights into the terminal stages of the Paleo-Asian Ocean (PAO) evolution, including collisional and post-collisional processes following its Late Permian closure. The northeastern China region, tectonically situated within the eastern segment of the CAOB, is traditionally known as the Xingmeng Orogenic Belt (XOR). This study integrates zircon U-Pb geochronology, whole-rock geochemistry, and zircon Hf isotopic analyses of intermediate-acid volcanic rocks and intrusive rocks from the former “Tongjiatun Formation” in the Faku area of northern Liaoning. The main objective is to explore the petrogenesis of these igneous rocks and their implications for the regional tectonic setting. Zircon U-Pb ages of these rocks range from 260.5 to 230.1 Ma, indicating Permian–Triassic magmatism. Specifically, the Gongzhuling rhyolite (260.5 ± 2.2 Ma) and Gongzhuling dacite (260.3 ± 2.4 Ma) formed during the Middle-Late Permian (270–256 Ma); the Wangjiadian dacite (243 ± 3.0 Ma) and Wafangxi rhyolite (243.9 ± 3.0 Ma) were formed in the late Permian-early Middle Triassic (256–242 Ma); the Haoguantun rhyolite (240.9 ± 2.2 Ma) and Sheshangou pluton (230.1 ± 1.7 Ma) were formed during the Late Middle-Late Triassic (241–215 Ma). Geochemical studies, integrated with the geochronological results, reveal distinct tectonic settings during successive stages: (1) Middle-Late Permian (270–256 Ma): Magmatism included peraluminous A-type rhyolite with in calc-alkaline series (e.g., Gongzhuling) formed in an extensional environment linked to a mantle plume, alongside metaluminous, calc-alkaline I-type dacite (e.g., Gongzhuling) associated with the subduction of the PAO plate. (2) Late Permian-Early Middle Triassic (256–242 Ma): Calc-alkaline I-type magmatism dominated, represented by dacite (e.g., Wangjiadian) and rhyolite (e.g., Wafangxi), indicative of a collisional uplift environment. (3) Late Middle-Late Triassic (241–215 Ma): Magmatism transitioned to high-K calc-alkaline with A-type rocks affinities, including rhyolite (e.g., Haoguantun) and plutons (e.g., Sheshangou), formed in a post-collisional extensional environment. This study suggests that the closure of the PAO along the northern margin of the North China Craton (NCC) occurred before the Late Triassic. Late Triassic magmatic rocks in this region record a post-orogenic extensional setting, reflecting tectonic processes following NCC-XOR collision rather than PAO subduction. Combined with previously reported age data, the tectonic evolution of the eastern segment of the CAOB during the Permian-Triassic can be divided into four stages: active continental margin (293–274 Ma), plate disintegration (270–256 Ma), final collision and closure (256–241 Ma), and post-orogenic extension (241–215 Ma).

1. Introduction

Situated between the Tarim Block, Siberian Block (SB), and North China Craton (NCC), the Central Asian Orogenic Belt (CAOB) (Figure 1a) is the world’s largest and youngest segment of Phanerozoic crust, formed through complex accretionary processes [1,2]. Its evolution is dominated by the bidirectional subduction of the Paleo-Asian Ocean (PAO): northward beneath the SB during the Ordovician-Silurian, and southward beneath the NCC from the Devonian to Triassic [3,4]. The CAOB represents the most significant region documenting Phanerozoic crustal growth, with subduction and accretion processes initiating as early as the Ordovician along the southern Siberian margin. While these early stages were dominated by progressive accretionary tectonics, our study focuses specifically on the terminal closure of the PAO during the late Permian to Triassic along the northern NCC margin. The CAOB represents the most significant region documenting Phanerozoic crustal growth [1,2], with subduction and accretion processes initiating as early as the Ordovician along the southern Siberian margin. While these early stages were dominated by progressive accretionary tectonics, our study focuses specifically on the terminal closure of the PAO during the late Permian to Triassic along the northern NCC margin. Since the Neoproterozoic, the CAOB has undergone complex subduction–accretion processes, closely linked to the double-sided subduction of the PAO plate during the Paleozoic–Mesozoic. Its unique geographical position and geological history make it a focus of geological research [5,6]. The northeastern segment of the CAOB, located within Northeastern China, is traditionally referred to as the Xingmeng Orogenic Belt (XOR). This belt comprises a series of crustal fragments (microcontinental blocks, island arcs, accretionary wedges, and ophiolites that underwent progressive amalgamation [7,8,9]. Recent studies [4] suggest many of these fragments may have shared a common tectonic history since ~500 Ma, though their final amalgamation records the PAO’s subduction and subsequent Siberian-NCC collision [3,10,11]. During the Mesozoic, the XOR was further modified by the superposition of the circum-Pacific and Mongolia–Okhotsk tectonic domains [10], which resulted in an extremely complex tectonic evolution [3,12,13,14,15,16]. Therefore, a better understanding of the geological evolution of the XOR is essential to reconstruct the tectonic history of the CAOB. Current data indicate several issues and controversies regarding the Late Paleozoic to Early Mesozoic evolution of the XOR, particularly concerning the timing and location of the closure of the PAO and the collision processes along the northern margin of the NCC. Two competing viewpoints exist regarding the timing of the closure of the PAO: one hypothesis suggests that the collision between the NCC and northern blocks occurred between the Middle to Late Devonian and Early Carboniferous [10,17], while the other suggests that the collision occurred during the Late Permian–Early Middle Triassic [3,18]. One view places the collision between the NCC and northern blocks along the Solonker–Hegen–Heihe zone [7,19,20], whereas another locates it along the Solonker–Xar Moron–Changchun–Yanji zone [9,13,15,18,21]. Another major debate centers on whether the eastern margin of the NCC was in a collisional or post-collisional stage during the Triassic. Different interpretations include the following: (1) an extensional environment due to post-collisional gravitational collapse triggered by isostatic rebound following slab breakoff [22]; (2) extension-induced decompression melting within the mantle wedge above the subducted slab [19]; (3) possible continuation of the NCC–northern blocks collision into the Middle Triassic [23]. These interpretations reflect two fundamental debates about Triassic tectonics: (1) The tectonic state—whether the region was in post-collisional extension or still experiencing terminal collision; (2) the driving mechanisms of extension, where some models emphasize (a) slab breakoff-induced collapse [22]; (b) mantle wedge decompression [19]; (c) detachment of PAO fragments [14,16,24,25].
The northern Liaoning region is located south of the Solonker–Xar Moron–Changchun–Yanji suture zone and spans two major tectonic units: the NCC and XOR (Figure 1b). During the Paleozoic, this region recorded the responses to the retreating subduction zone of the PAO, characterized by back-arc basin extension and fragmentation of the continental margin, culminating in the final closure of the PAO. This complex evolution involved intense magmatic activity and diverse geological processes [26,28,29,30,31,32,33,34,35,36,37]. To address stratigraphic uncertainties in northern Liaoning, our geological fieldwork employed detailed structural–lithological mapping, with particular attention to tectonic mélange zones as key markers of paleo-subduction and collision boundaries [38]. This approach follows established methodologies for resolving complex orogenic belts, where mélange zones—despite their complexity—provide critical evidence for reconstructing tectonic interfaces between distinct crustal blocks [38]. This approach enabled us to redefine and formally separate the previously ambiguous “Fangjiatun Formation” and “Tongjiatun Formation”. These two formations were distinguished by contrasting matrix compositions and rock fragment assemblages. Both formations contain a series of Permian–Triassic intermediate metavolcanic rocks. The Fangjiatun–Tongjiatun contact zone, a suture-parallel melange, preserves relics of the PAO subduction. Volcanic clasts in Fangjiatun directly correlate with our dated magmatic suite, while Tongjiatun’s Proterozoic clasts indicate crustal recycling during the NCC–Songliao collision [18,38]. This study investigates the geochronology and geochemistry of these magmatic rocks and explores the nature of the magma source and tectonic evolution in the area covered by the Songliao Basin along the eastern margin of the NCC, providing essential data for understanding the tectonic history of the southern margin of the XOR.

2. Geological Background and Sample Description

The study area is tectonically complex and bordered by the Solonker–Xar Moron– Changchun–Yanji suture zone, with the eastern segment of the CAOB to the north and the NCC to the south (Figure 1c,d). The research area lies within the PAO domain, encompassing distinct near-EW-trending active continental margin belts of both Early and Late Paleozoic age, primarily developed along the northern margin of the NCC since the Ordovician. Since the Mesozoic, the study area has been within the circum-Pacific tectonic domain, with extensive superposition of rift basins and the development of NE- and NNE-oriented structures. The study area preserves a pre-Mesozoic basement composed primarily of highly metamorphosed and deformed intrusive-volcanic complexes, now partially overlain by Mesozoic sedimentary cover. After the Mesozoic, the area became covered by the sedimentary strata of the Songliao Basin and intermediate basic to acidic volcanic rocks. The exposed strata mainly include Early Cretaceous Yixian Formation volcanic rocks, Early Cretaceous Shahuizhen Formation sedimentary strata, and mid-Cretaceous Quantou Formation sedimentary strata. The study area predominantly comprises Silurian, Permian, Triassic, and Jurassic granitic intrusions (Figure 1d).
For this study, Mesozoic–Triassic magmatic rocks were chosen for geochronological and geochemical analyses. Representative sample collection locations are shown in Figure 1c. The samples include the Gongzhuling rhyolite and dacite, Wangjiadian dacite, Wafangxi rhyolite, Haoguantun rhyolite, and Sheshangou pluton.
The Gongzhuling rhyolite (PM107-9, 123°16′32″ E, 42°30′55″ N) and Gongzhuling dacite (PM107-8, 123°16′32″ E, 42°30′54″ N) are located in the eastern part of the study area, covering a small area, in contact with Early to Middle Permian volcanic rock structures. The Gongzhuling rhyolite has a foliated granoblastic texture with foliate and massive structures. The rock consists of quartz (±60%), muscovite (±35%), and hornblende (±5%), with quartz being the predominant felsic mineral (Figure 2a and Figure 3a). The Gongzhuling dacite has a similar foliated granoblastic texture with a mylonitic structure. It is composed of felsic minerals (±55%), biotite (±20%), muscovite (±10%), and hornblende (±15%). The felsic minerals are mainly quartz, which is elongated and oriented, with some parts showing banded quartz (Figure 2b and Figure 3b).
The Wangjiadian dacite (LWY, 123°15′30″ E, 42°33′12″ N) is exposed in the northeastern part of the study area, covering approximately 0.51 km2. The Gongzhuling dacite is tectonically juxtaposed with Early–Middle Permian volcanic rocks within the NNE-trending shear zone, as evidenced by its foliated granoblastic texture and mylonitic structure. This contact represents a tectonic boundary rather than a magmatic inclusion, confirming its emplacement during post-collisional deformation. The rock is composed of felsic minerals (±57%), muscovite (±25%), biotite (±15%), and hornblende (3%). The felsic minerals include feldspar and quartz, with some feldspar exhibiting a ball structure, indicating a mylonitic structure. Biotite and muscovite are arranged in a continuously oriented manner, forming a foliated structure (Figure 2c and Figure 3c).
The Wafangxi (PM201-5, 123°33′16″ E, 42°39′12″ N) and Haoguantun rhyolites (PM202-6, 123°34′21″ E, 42°37′57″ N) are exposed in the northwestern part of the study area and are in contact with Early to Middle Permian volcanic rocks. The Wafangxi rhyolite covers an area of approximately 1.1 km2. The rock appears grayish-white, with a mylonitic structure, and the matrix has a foliated granoblastic texture containing phenocrysts of plagioclase and quartz. Plagioclase (±7%) develops polysynthetic twinning, with weak clay and carbonate alteration. Quartz (±5%) forms several lens-shaped and short-banded aggregates that are oriented. The matrix is mainly composed of small felsic minerals and muscovite, with felsic minerals (±48%) being granular and embedded with muscovite (±40%), showing an oriented distribution (Figure 2d and Figure 3d).
The Haoguantun rhyolite (PM202-6, 123°34′21″ E, 42°37′57″ N) is exposed in the northwestern part of the study area, covering an area of approximately 1.2 km2. The rock appears grayish-white, with a weak mylonitic structure, predominantly composed of felsic components. The rock consists of muscovite (±5%), feldspar (±15%), alkaline feldspar (±45%), and quartz (±35%). The feldspar and quartz appear elongated or lens-shaped, with muscovite appearing as fibrous sheets, constituting a weak mylonitic structure. Plagioclase exhibits polysynthetic twinning. Alkaline feldspar is composed of microcline and exhibits grid-like twinning (Figure 2e and Figure 3e).
The Sheshangou pluton (SSGC, 123°29′47″ E, 42°30′34″ N) is exposed in the central part of the study area, covering 12.95 km2. It intrudes Middle Triassic granite and Middle Permian quartz diorite bodies. The lithologies include monzogranite and muscovite-bearing monzogranite. The rock appears gray with a faint pink hue, exhibiting a medium-to-coarse-grained granite structure and massive texture. The mineral composition includes muscovite (±5%), plagioclase (±30%), alkaline feldspar (±40%), and quartz (±30%). Plagioclase exhibits polysynthetic twinning, while alkaline feldspar appears as striped feldspar, with some developing Carlsbad twinning (Figure 2f and Figure 3f).
Major elements were analyzed by XRF (1–5% precision) and trace elements by ICP-MS (>10% precision), using contamination-free equipment. Zircon U-Pb dating employed a 193 nm laser ablation system (32 μm spot) coupled with ICP-MS, with data processed using ICPMSDATACAL and Isoplot, following Andersen’s Pb-correction method [39] and Yuan et al.’s protocol [40]. Zircon Lu-Hf isotopes were analyzed via laser ablation MC-ICP-MS (60 μm spot), yielding 176Hf/177Hf values of 0.282316 ± 30 (91500) and 0.282507 ± 50 (MT), with methods detailed in Geng et al. [41].

3. Test Results

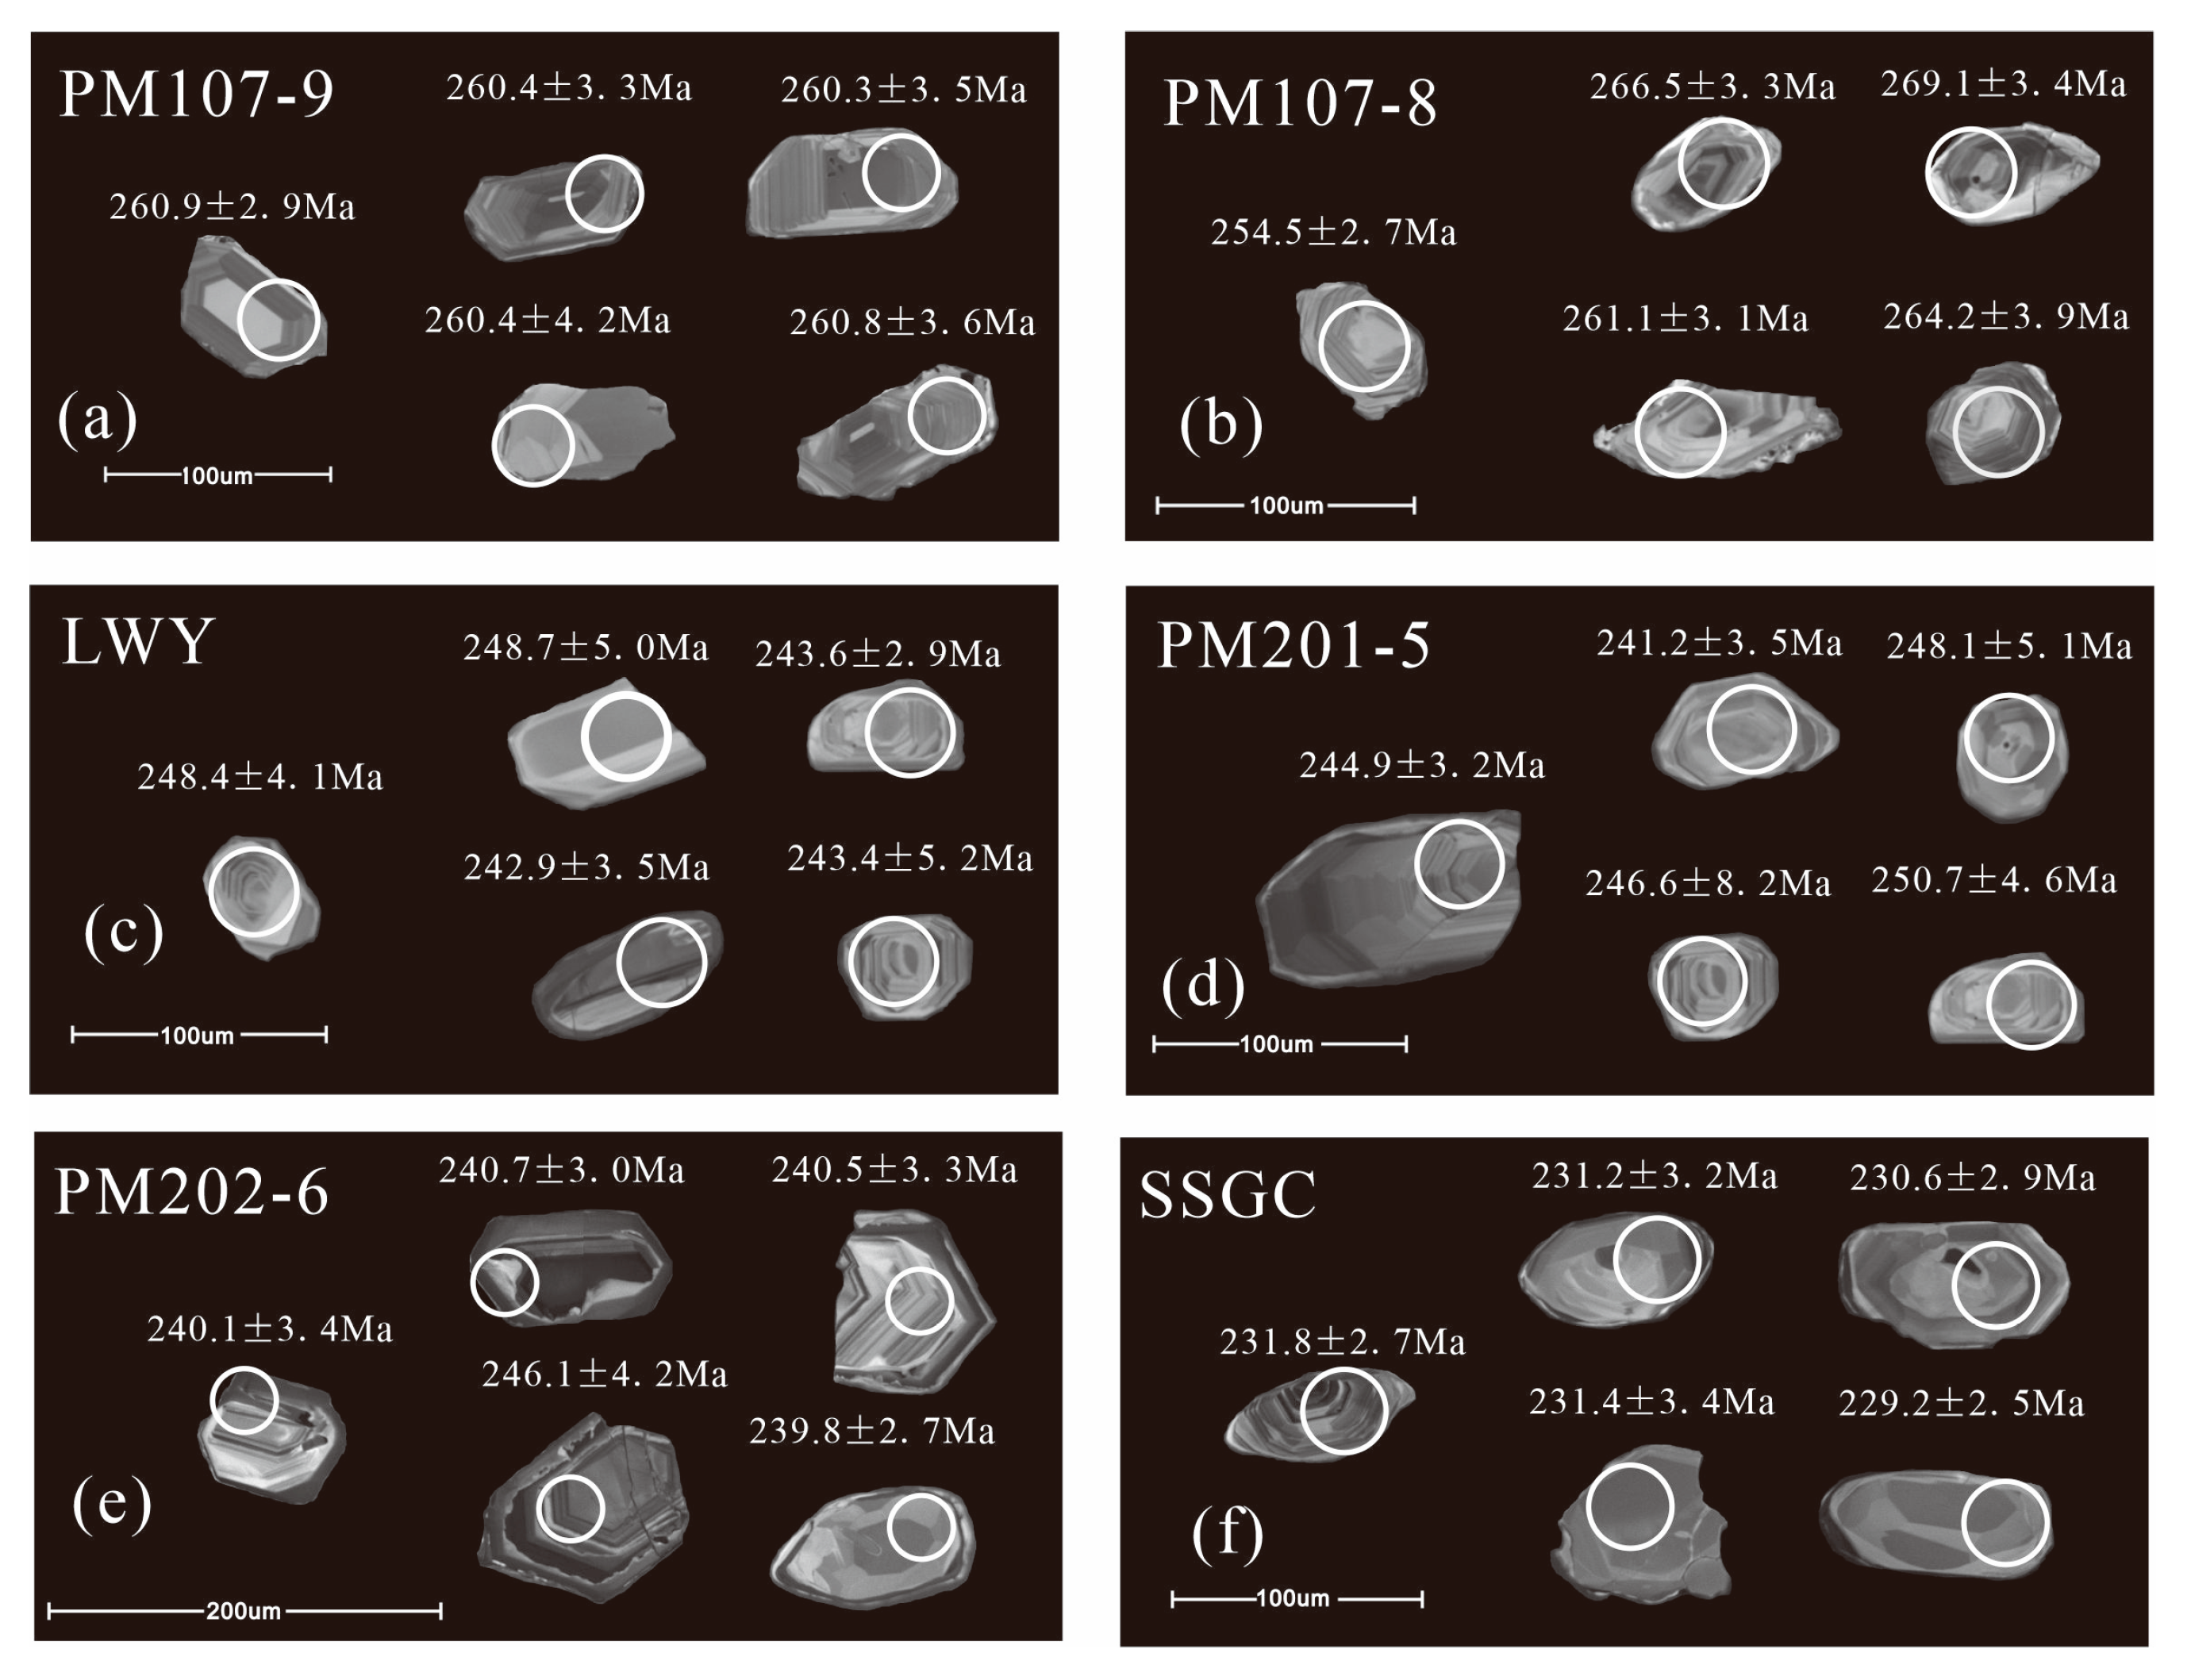
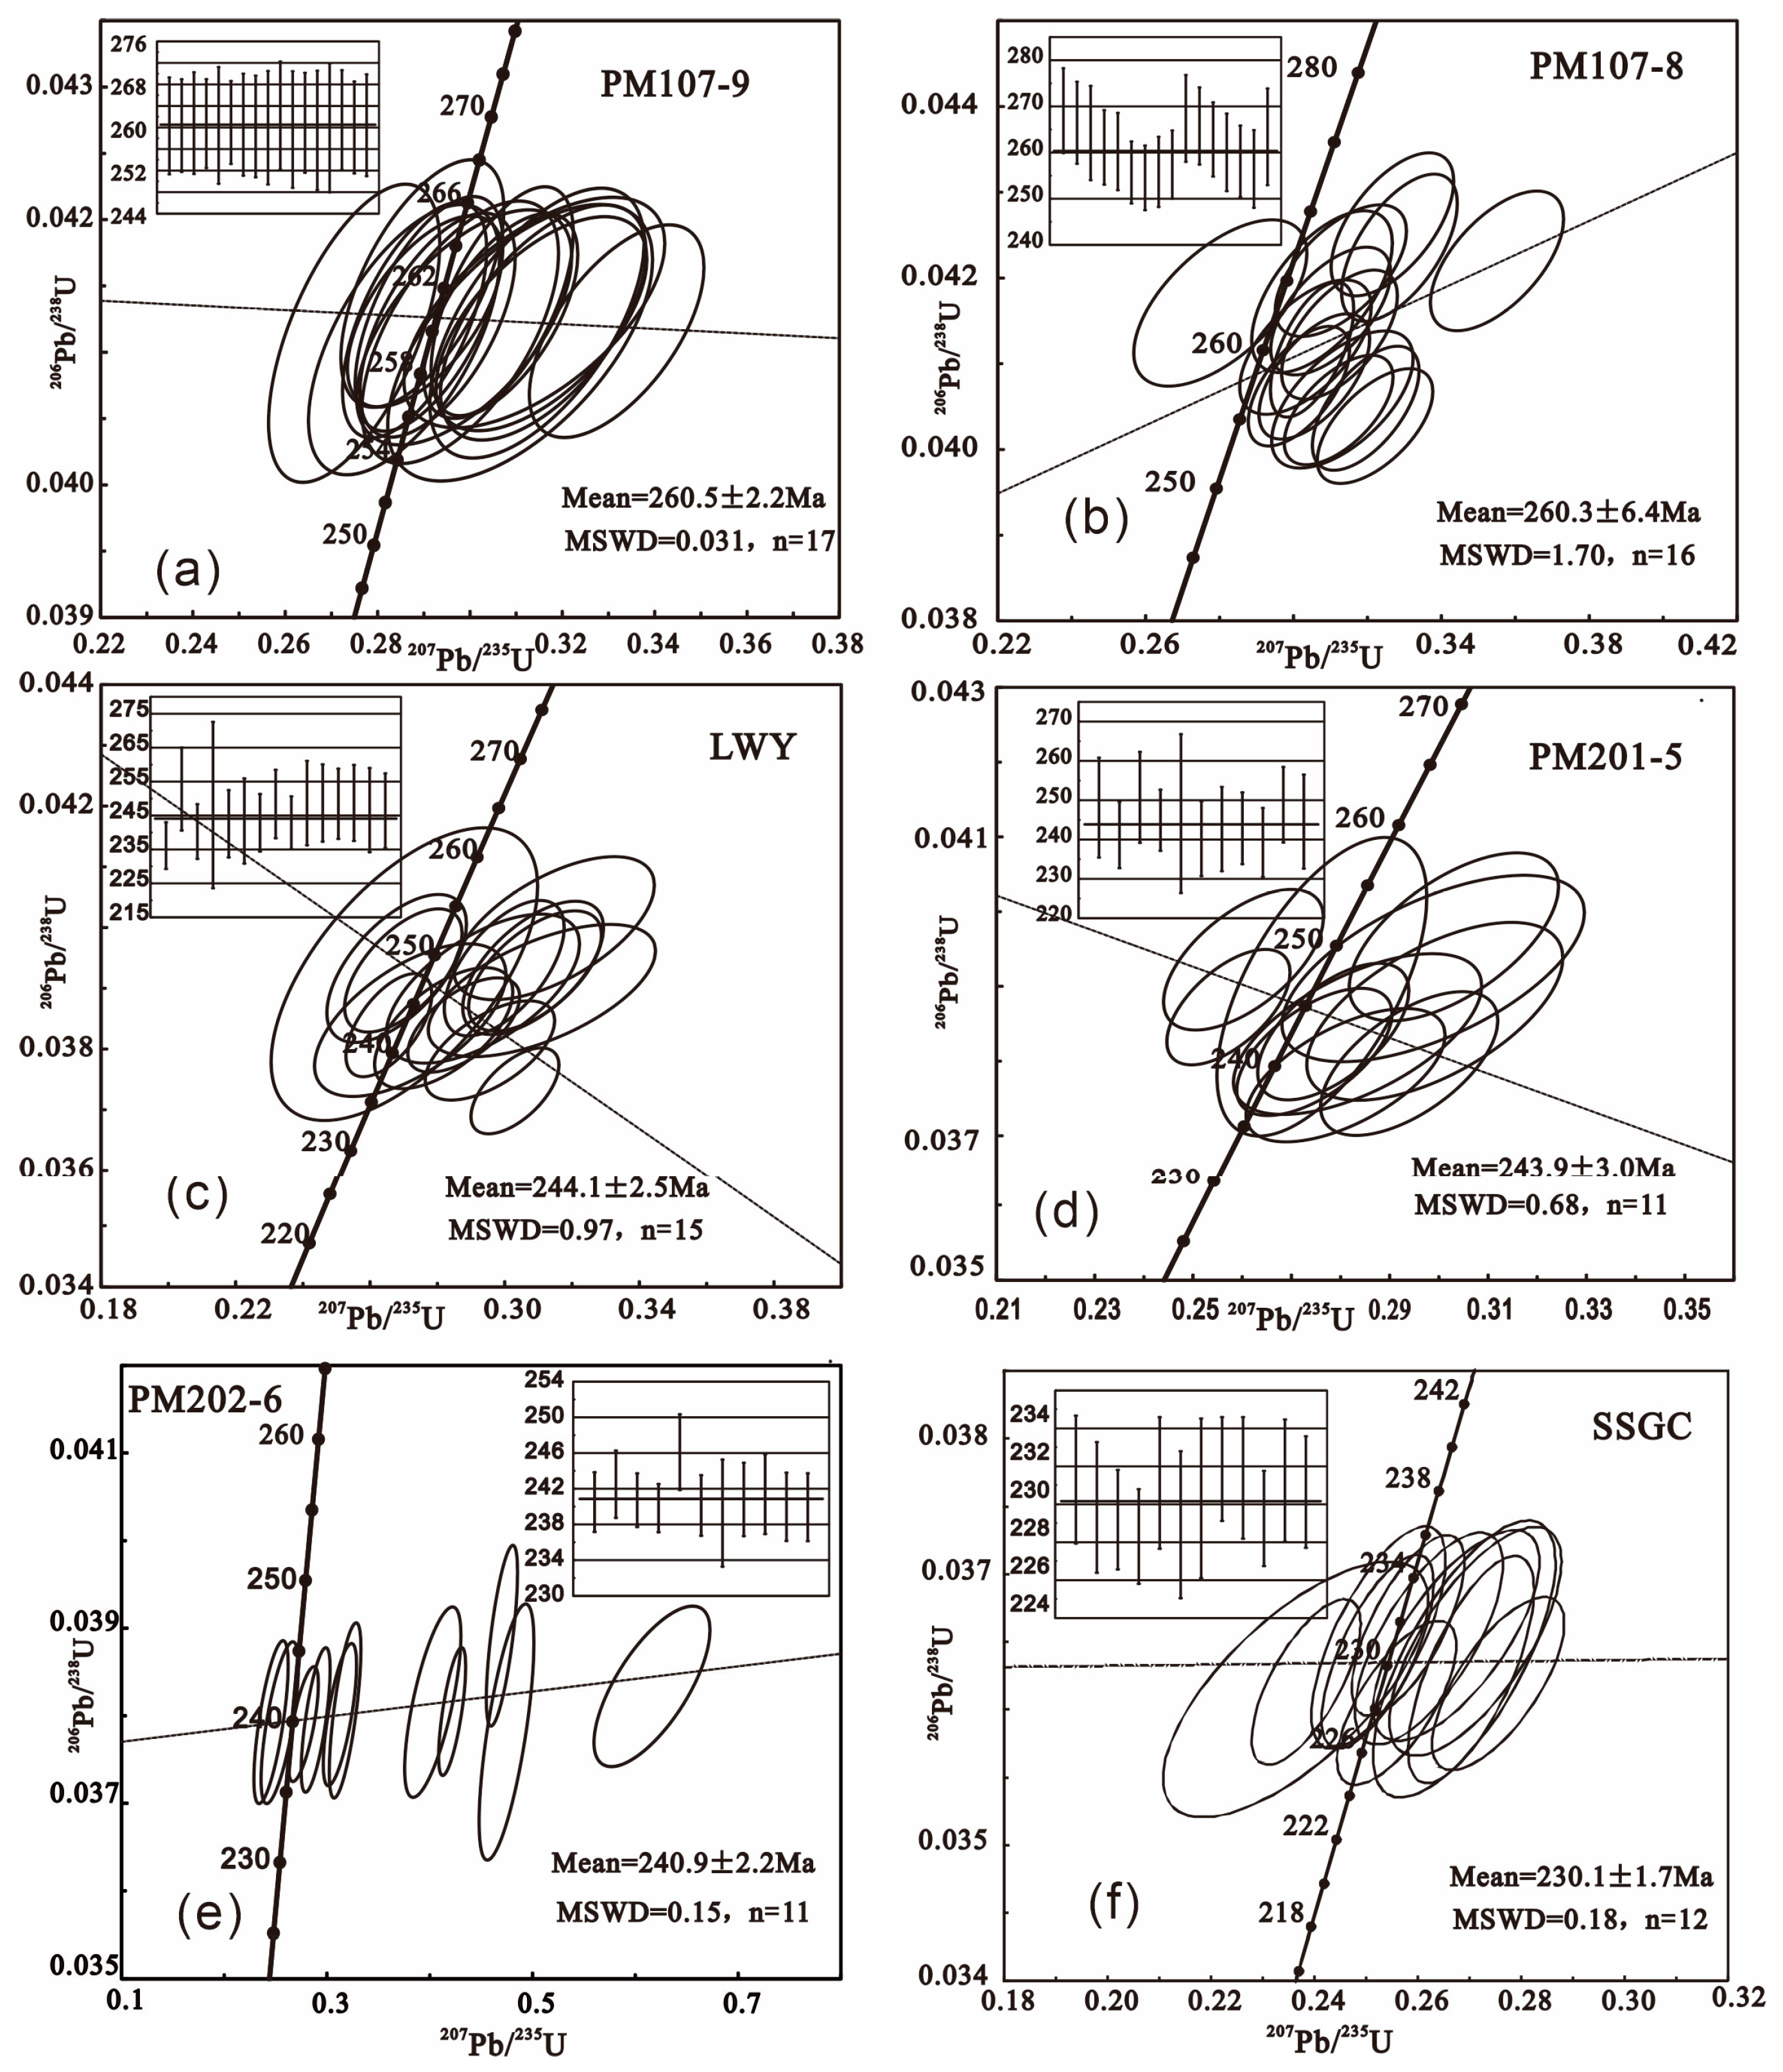
3.1. Chronological Characteristics

Zircon age determinations were conducted on the six collected samples. Colorless, transparent zircons without inclusions or fissures were selected for U-Pb isotopic analysis. These zircons exhibit relatively high Th/U values (0.37–1.53) (Table 1) and display euhedral–subhedral shapes, with sizes ranging from 50 to 200 μm and aspect ratios of 1:3. They exhibit visible oscillatory zoning (Figure 4), characteristic of magmatic zircon [42], representing the crystallization age of the volcanic rock.
For the Gongzhuling rhyolite (PM107-9), the Th/U values range from 0.53 to 1.08. They exhibit typical magmatic zircon characteristics, with some zircons showing narrow white bright rims, indicating weak recrystallization. The zircons are elongated, ranging in length from 80 to 120 μm, with aspect ratios of 1:2.5 to 1:4 (Figure 4a). A total of 17 valid test points were analyzed, and 206Pb/238U surface ages ranging from 259.5 to 262.2 Ma (Table 1) were obtained. The weighted average 206Pb/238U age is 260.5 ± 2.2 Ma (MSWD = 0.031, n = 17) (Figure 5a).
Zircons from the Gongzhuling dacite (PM107-8) exhibit distinct oscillatory zoning (Figure 4b), with Th and U contents ranging from 61.9 × 10⁻⁶ to 404.6 × 10⁻⁶ and 86.2 × 10⁻⁶ to 665.8 × 10⁻⁶, respectively, with Th/U values ranging from 0.37 to 0.85 (Table 1). The 16 measurement points exhibit 206Pb/238U ages falling on or near the concordia curve, ranging from 254.5 to 269.1 Ma (Table 1), with a weighted average age of 260.3 ± 2.4 Ma (MSWD = 1.70, n = 16) (Figure 5b).
For the Wangjiadian dacite (LWY), the zircons are semi-automorphic short columnar, with aspect ratios of 1:1 to 1:3 (Figure 4c). Th/U values range from 0.39 to 1.50. The 206Pb/238U surface ages of the measurement points range from 236.2 to 252.8 Ma and fall on or near the concordia curve (Table 1). The weighted average age is 244.1 ± 2.5 Ma (MSWD = 0.97, n =15) (Figure 5c).
Zircons from the Wafangxi rhyolite (PM201-5) range in length from 80 to 160 μm, with aspect ratios of 1:1 to 1:3 (Figure 4d) and Th/U values between 0.42 and 1.16. The surface ages of the measurement points range from 239.3 to 250.7 Ma (Table 1), falling on or near the concordia curve, yielding a weighted average age of 243.9 ± 3.0 Ma (MSWD = 0.68, n = 11) (Figure 5d).
Zircons from the Haoguantun rhyolite (PM202-6) are euhedral or subhedral, with well-defined internal structures and growth zoning, and some display core–rim structures. The aspect ratios range from 1:1 to 1:2.5 (Figure 4e), and Th/U values range from 0.74 to 1.53. The 11 valid measurement points yielded surface ages ranging from 239.3 to 246.1 Ma (Table 1), falling on or near the U-Pb age concordia, with a weighted average age of 240.9 ± 2.2 Ma (MSWD = 0.15, n = 11) (Figure 5e).
Zircons from the Sheshangou pluton (SSGC) are semi-automorphic, long columnar, with long-axis lengths of 50–100 μm and aspect ratios of 1:1 to 1:3 (Figure 4f). Th/U values range from 0.70 to 1.11. A total of 12 valid measurement points were analyzed, and surface ages ranging from 228.3 to 231.8 Ma (Table 1) were obtained. The ages fall on or near the concordia curve, with a weighted average age of 230.1 ± 1.7 Ma (MSWD = 0.28, n = 12) (Table 1).
While some samples exhibit intense mylonitization, zircon U-Pb ages reflect magmatic crystallization rather than recrystallization events. This is evidenced by (1) concordant ages with magmatic Th/U (>0.4 in 148/159 spots); (2) juvenile εHf(t) values uncorrelated with deformation intensity; (3) exclusion of inherited cores (e.g., 487 Ma in PM202-6) via CL-guided spot placement. Low Th/U values (0.37–0.44) in PM107-8 reflect late-stage magmatic crystallization, not metamorphic overprinting—consistent with their high-U (>200 ppm) and trace element signatures (Ce/Ce* > 10).
While some samples show intense mylonitization, zircon U-Pb ages reflect magmatic crystallization rather than recrystallization events, supported by the following: (1) Concordant ages with magmatic Th/U (>0.4 in 148/159 spots), typical of magmatic zircon, contrasting with metamorphic zircon (Th/U < 0.1). (2) Juvenile εHf(t) values independent of deformation: Zircon Hf isotopes exhibit juvenile characteristics (e.g., εHf(t) = +2.3 to +5.1 in PM107-8) with no correlation to deformation intensity, confirming magmatic origin. (3) CL-guided exclusion of inherited cores: Cathodoluminescence imaging targeted magmatic oscillatory zoning, excluding inherited detrital cores (e.g., 487 Ma in PM202-6). (4) Low Th/U values indicating late magmatic differentiation: PM107-8 zircons with Th/U = 0.37–0.44 show high U (>200 ppm) and Ce/Ce* > 10, consistent with late-stage magmatic crystallization rather than metamorphic overprinting. (5) Greenschist facies constraints: Metamorphic conditions (≤350 °C, <0.3 GPa) were insufficient to reset zircon isotopes, as evidenced by preserved magmatic zoning and lack of metamorphic inclusions. (6) Spatial–temporal separation from younger intrusions: Mylonitized samples lie >10 km from the 230.1 Ma Sheshangou pluton, outside its <2 km contact metamorphic halo, ruling out thermal disturbance [3,18,24,42].

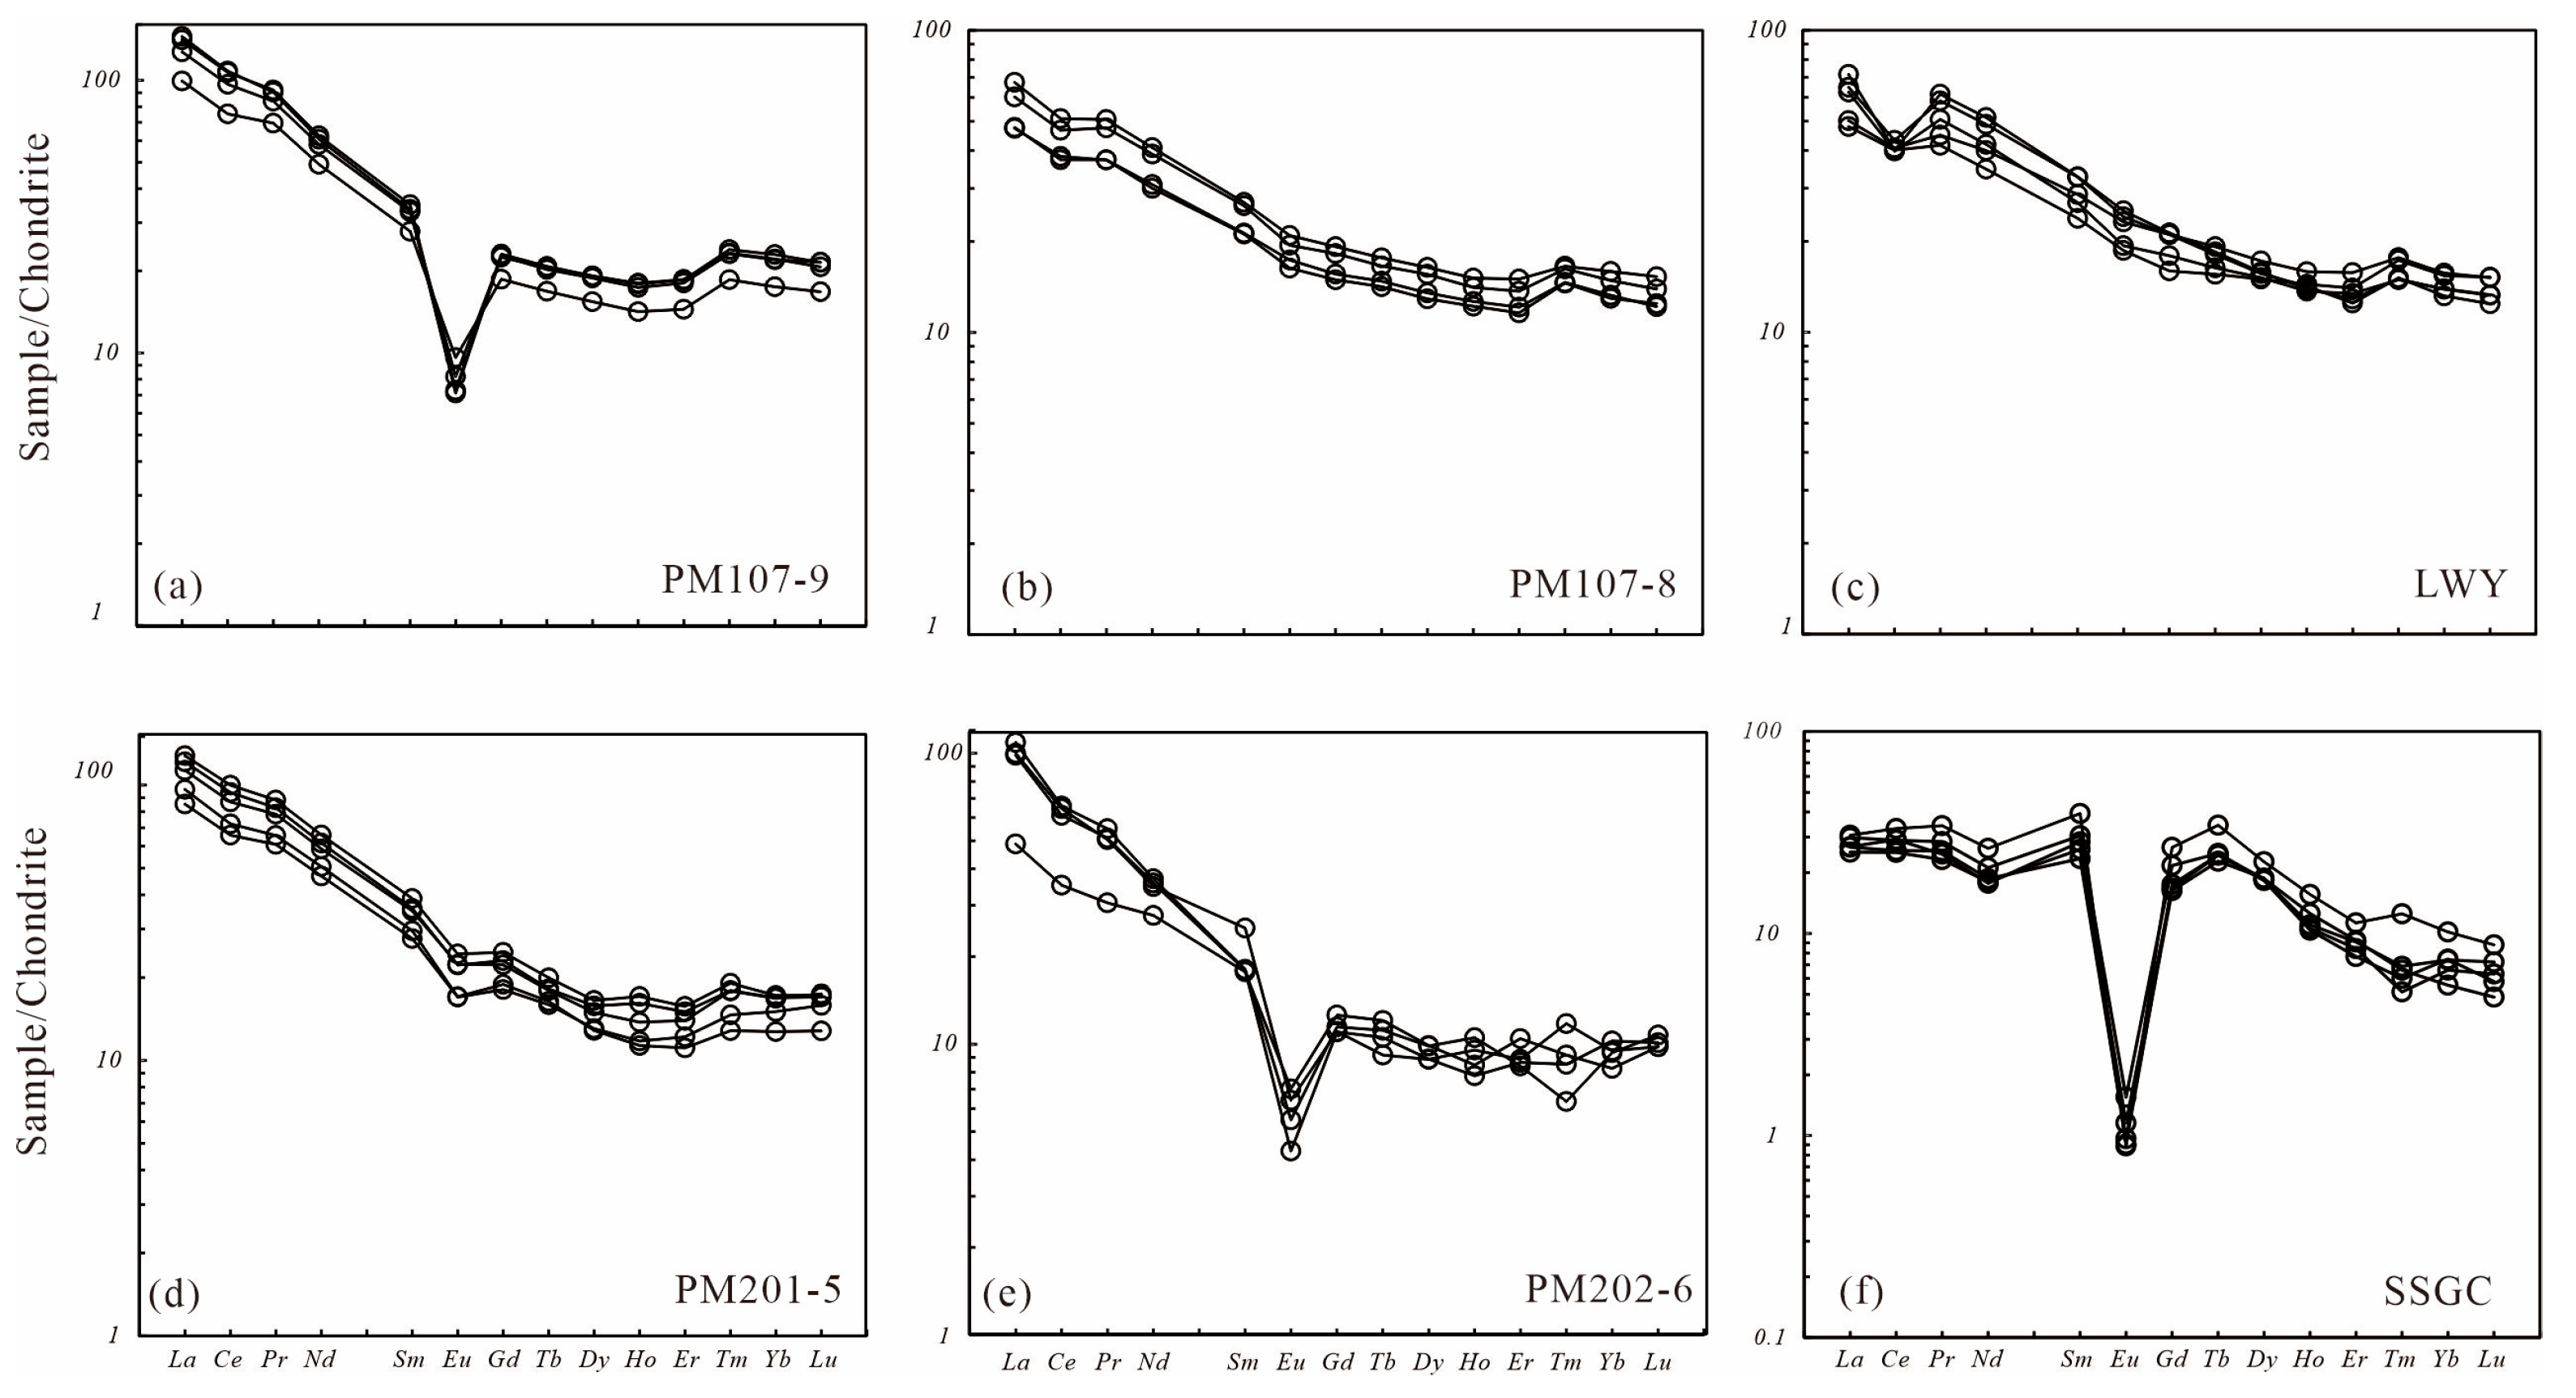
3.2. Geochemical Characteristics

The results of the major and trace element analyses are presented in Table 2 (all data used for plotting were calculated after loss on ignition).
The Gongzhuling rhyolite (PM107-9) exhibits a relatively high SiO2 content (75.00%–76.20%), with smaller amounts of CaO (3.11%–3.62%) and Na2O+K2O (3.33%–3.88%) (Table 2). The TAS diagram shows that the samples primarily fall within the rhyolite range (Figure 6a). The Rittmann Index (σ) ranges from 0.34 to 0.47 (Table 2). The aluminum saturation index (A/CNK) is 1.17–1.20 (Table 2), classifying the rock as peraluminous. The ratio of light rare earth elements (LREEs) to heavy rare earth elements (HREEs) for the Gongzhuling rhyolite samples is 4.53–5.04 (Table 2), with a notably high total rare earth element content (183.12 × 10⁻⁶–248.76 × 10⁻⁶). The samples exhibit a strong negative Eu anomaly (δEu = 0.26–0.42), and the rare earth element distribution pattern is overall right-leaning (Figure 7a). The element spider diagram shows that the samples are relatively enriched in large-ion lithophile elements (LILEs), such as Rb, Th, and K, and depleted in high-field strength elements (HFSEs), such as Nb, P, and Ti (Figure 8a).
The TAS diagram for the Gongzhuling dacite (PM107-8) indicates that samples primarily fall within the dacite range (Figure 6a). Although both rhyolite and dacite occur within a NE-trending shear zone, their distinct geochemical signatures (e.g., SiO2 content, A/CNK ratios, and trace element patterns) are interpreted as primary magmatic features rather than alteration products. These samples have a relatively lower SiO2 content (65.33%–66.19%), MgO content (1.44%–1.75%), Mg# values of 29.6–34.7, and K2O/Na2O ratios of 0.64–0.91 (Table 2). The SiO2-K2O diagram shows that the samples fall within the calc-alkaline series (Figure 6b). The Al2O3 content of the samples ranges from 13.90% to 14.39%, indicating that they are quasi-aluminous rocks (Figure 6c). The total rare earth element content is relatively high (105.25 × 10⁻⁶–141.00 × 10⁻⁶), with LREE/HREE ratios of 4.53–5.04. The Gongzhuling dacite is enriched in LREEs and relatively depleted in HREEs (Table 2) with a right-leaning rare earth element distribution (Figure 7b). The element spider diagram shows that the samples are relatively enriched in LILEs (Rb, Ba, Th, and K) and depleted in HFSE (Nb, P, and Ti) (Figure 8b).
The Wangjiadian dacite (LWY) samples exhibit a relatively low SiO2 content (63.01%–64.24%) and MgO content (2.15%–2.88%), with Mg# values of 27.0–39.7. These samples have a higher Al2O3 content (15.02%–15.70%) (Table 2). The TAS diagram shows that the samples mainly fall within the andesitic range (Figure 6a). The Rittmann Index (σ) varies from 1.38 to 1.71 (Table 2), indicating that they belong to the calc-alkaline series (Figure 6b). The aluminum saturation index (A/CNK) values range from 1.33 to 1.55 (Table 2), classifying these rocks as peraluminous. These samples have a relatively high total rare earth element content (114.72 × 10⁻⁶–141.82 × 10⁻⁶), and the rare earth element distribution pattern is overall right-leaning (Figure 7c). The Wangjiadian dacite is enriched in LREEs and relatively depleted in HREEs ((La/Yb)N ranges from 3.12 to 5.15) (Table 2), with a slight negative Eu anomaly (δEu = 0.88–0.96). The element spider diagram shows that the samples are relatively enriched in LILEs (Rb, Th, Ba, and K) but depleted in HFSEs (Nb, P, and Ti) and Sr (Figure 8c).
The Wafangxi rhyolite (PM201-5) has a relatively low SiO2 content (66.99%–68.30%) and MgO content (0.77%–1.20%), with Mg# values of 33.7–42.8 and K2O/Na2O ratios of 0.88–1.19 (Table 2). The TAS diagram shows that the samples mainly fall within the rhyolite range (Figure 6a). The SiO2-K2O diagram further classifies them within the high potassium and calc-alkaline series (Figure 6b). The Al2O3 content of the samples is in the range of 14.03%–15.47% (Table 2), indicating that they are quasi-aluminous rocks (Figure 6c). The rare-earth element distribution pattern is overall right-leaning (Figure 7d). The total rare earth element content is high (ΣREE = 164.14 × 10⁻⁶–238.74 × 10⁻⁶), with LREE/HREE ratios ranging from 7.07 to 8.19. The Wafangxi rhyolite is enriched in LREEs and relatively depleted in HREEs ((La/Yb)N ranges from 5.68 to 7.58) (Table 2). The element spider diagram shows that the samples are relatively enriched in LILEs (Rb, Ba, Th, and K) and depleted in HFSEs (Nb, P, and Ti) (Figure 8d).
The TAS diagram for the Haoguantun rhyolite (PM202-6) shows that the samples fall within the rhyolite range (Figure 6a). The samples exhibit high SiO2 content (77.77%–78.33%), Na2O+K2O content (8.00%–8.11%), K2O/Na2O ratios of 1.02–1.34 (Table 2), and low FeOT content (0.85%–1.08%). The Rittmann Index (σ) is 1.81–1.89 (Table 2), and the SiO2-K2O diagram shows that the samples primarily fall within the high potassium and calc-alkaline series (Figure 6b). The samples are enriched in LREEs and relatively depleted in HREEs ((La/Yb)N values in the range of 2.84–4.56) (Table 2), with negative Eu anomalies (δEu = 0.31–0.47). The rare earth element distribution pattern is right-leaning (Figure 7e). The element spider diagram shows that the samples are relatively enriched in LILEs (Rb, Th, and K) and depleted in HFSEs (Nb, P, and Ti) (Figure 8e).
The Sheshangou pluton exhibits a high SiO2 content (75.62%–77.49%) and low MgO content (0.03%–0.41%), with Mg# values ranging from 35.0 to 46.9 (Table 2). The TAS diagram classifies the samples within the granite range (Figure 6a). The Rittmann Index (σ) ranges from 1.71 to 2.02 (Table 2). The SiO2-K2O diagram indicates that the samples predominantly fall within the high potassium and calc-alkaline series (Figure 6b). The Sheshangou pluton samples exhibit strong negative Eu anomalies (δEu = 0.04–0.06) (Figure 7f) and a relatively high total rare earth element content (ΣREE = 48.54 × 10⁻⁶–66.67 × 10⁻⁶), with LREE/HREE ratios of 2.80–3.08. The Sheshan Gou pluton is enriched in LREEs and relatively depleted in HREEs. The trace element spider diagram shows that the samples are relatively enriched in LILEs (Rb, Th, and K) and depleted in HFSEs (Nb, P, and Ti) and Sr (Figure 8f).

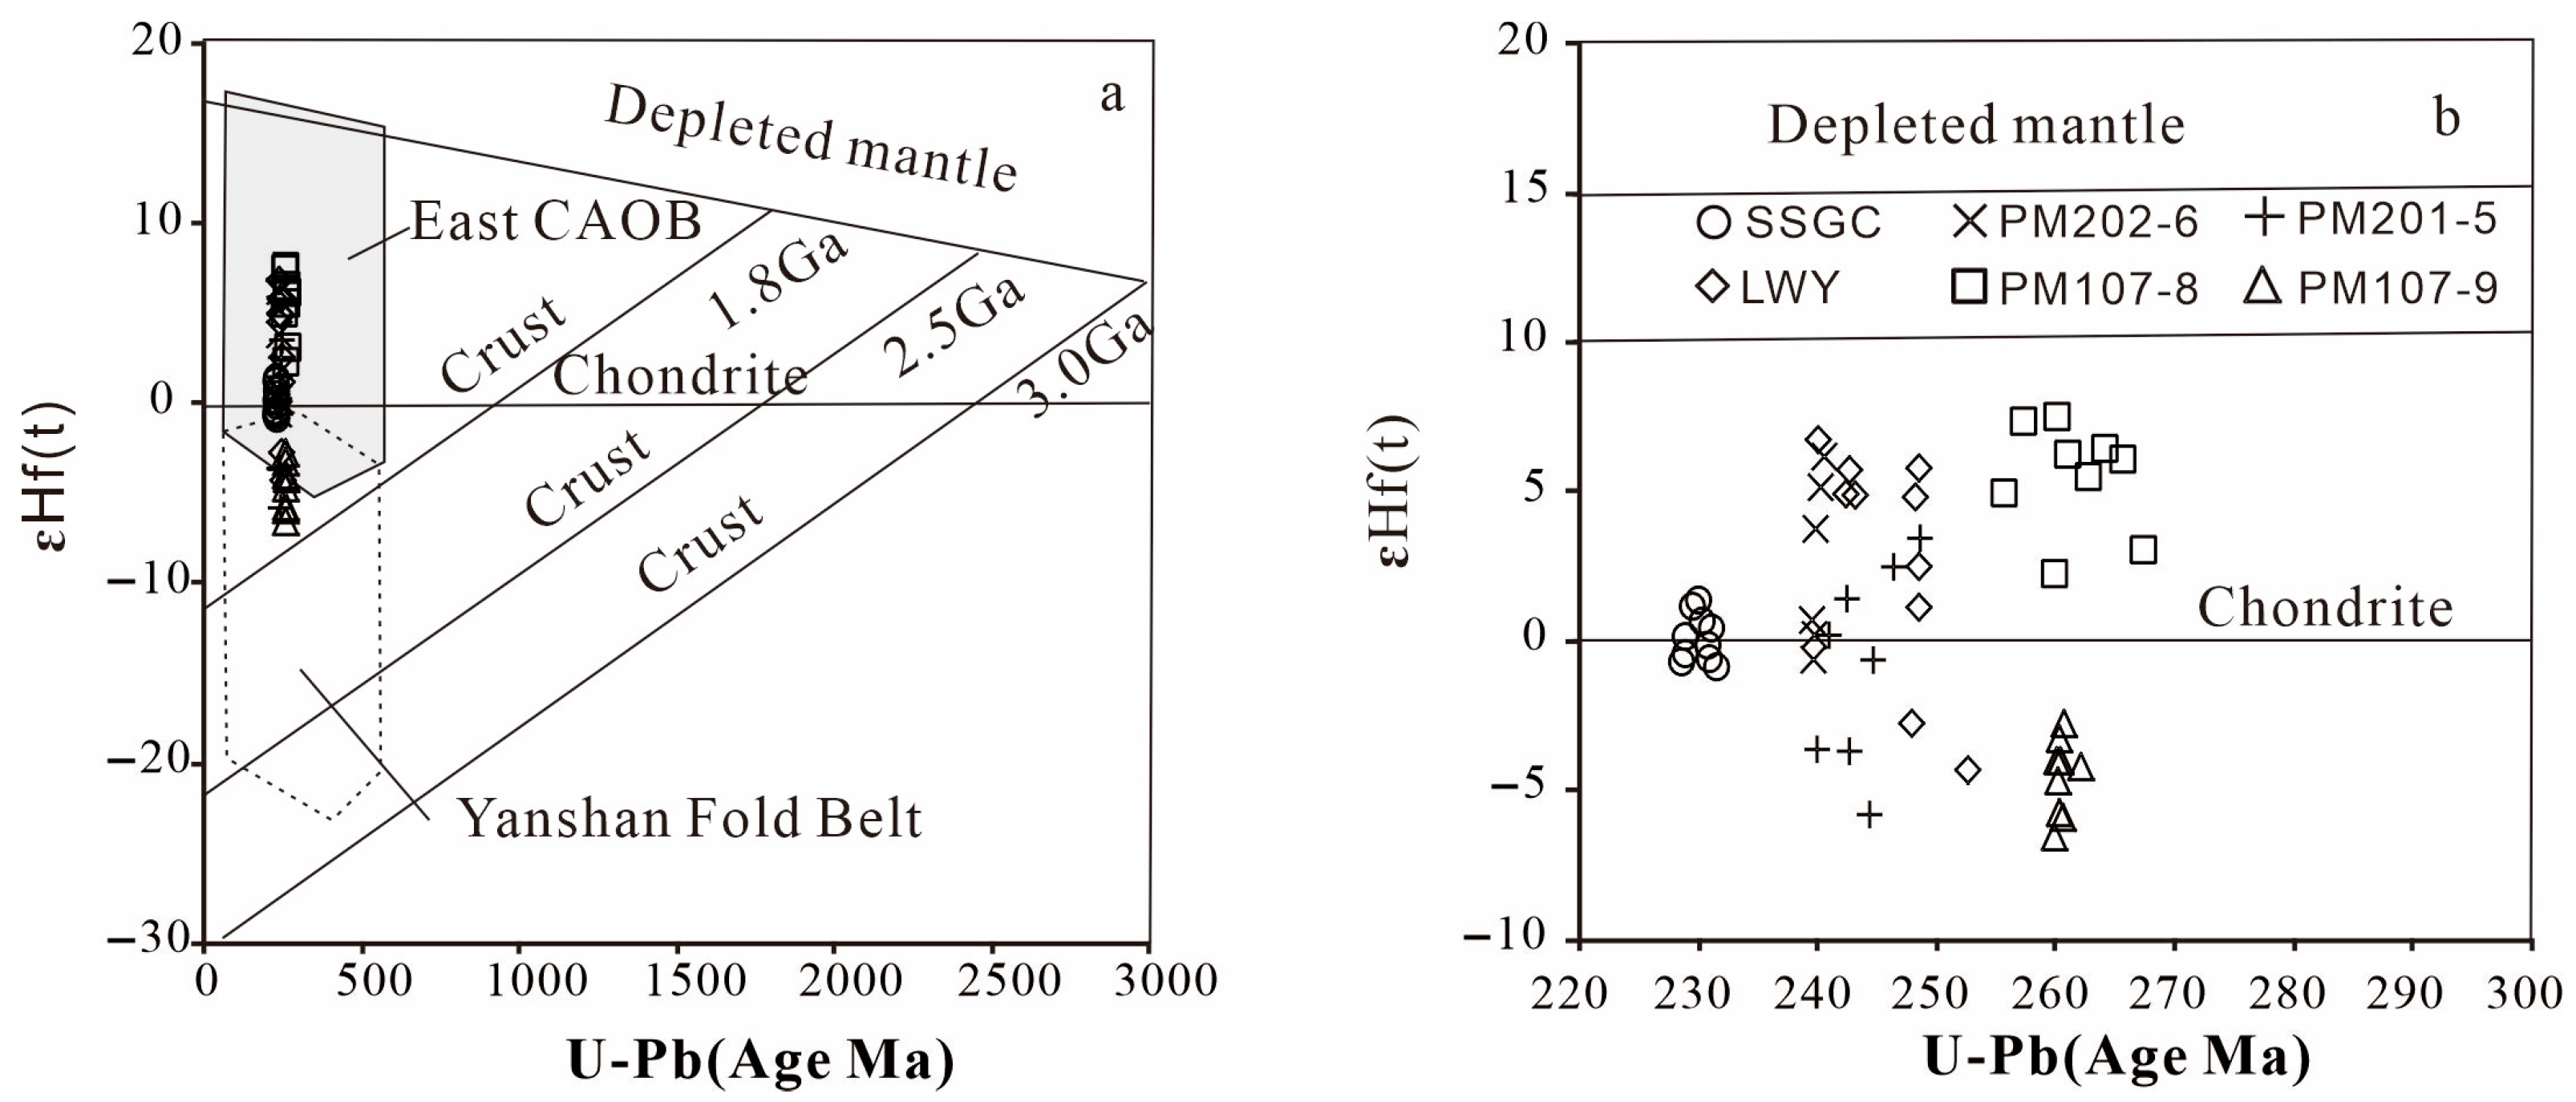
3.3. Hf Isotope Characteristics

This study conducted in situ Lu-Hf isotope analyses on the magmatic rocks with determined zircon ages. All analyses yielded fLu/Hf values between −0.98 and −0.90 (Table 3), which are significantly lower than those of mafic (−0.34, Amelin et al. [48]) and silicon-aluminous crust (−0.72, Vervoort et al. [49]), suggesting that the two-stage model age better reflects the time when the source material was extracted from the depleted mantle or the average residence age of the source material in the crust [50].
Nine zircons from the Gongzhuling rhyolite (PM107-9) were analyzed. The initial 176Hf/177Hf ratios ranged from 0.282583 to 0.28269, and εHf(t) values ranged from −6.7 to −2.88 (Table 3, Figure 9). The single-stage Hf model ages (tDM1) ranged from 816.7 to 970 Ma, while the two-stage model ages (tDM2) ranged from 1265.6 to 1507.4 Ma. The single-stage Hf model age (tDM1) was greater than the zircon formation age.
Nine zircons from the Gongzhuling dacite (PM107-8) were analyzed, yielding initial 176Hf/177Hf ratios between 0.282833 and 0.282983 (Table 3, Figure 9), with εHf(t) values ranging from +2.17 to +7.46. The single-stage Hf model ages (tDM1) ranged from 385.4 to 606.5 Ma, while the two-stage model ages (tDM2) ranged from 606.7 to 944.5 Ma. The single-stage model age (tDM1) was greater than the zircon formation age.
Ten zircons from the Wangjiadian dacite (LWY) were analyzed. The initial 176Hf/177Hf ratios ranged from 0.282646 to 0.282961, and εHf(t) values ranged from −4.44 to +6.68 (Table 3, Figure 9). The single-stage Hf model ages (tDM1) ranged from 421.2 to 866.5 Ma, while the two-stage model ages (tDM2) ranged from 656.5 to 1364.7 Ma. The single-stage Hf model age (tDM1) was greater than the zircon formation age.
Eight zircons from the Wafangxi rhyolite (PM201-5) were selected for testing, yielding initial 176Hf/177Hf ratios between 0.282604 and 0.282867, with εHf(t) values ranging from −5.95 to +3.36 (Table 3, Figure 9). The single-stage Hf model age (tDM1) ranged from 544.4 to 915.8 Ma, while the two-stage model age (tDM2) ranged from 868.5 to 1460.5 Ma. The single-stage model age (tDM1) was greater than the zircon formation age.
Six zircons from the Haoguantun rhyolite (PM202-6) were analyzed, with initial 176Hf/177Hf ratios ranging from 0.282751 to 0.282944 and εHf(t) values ranging from −0.73 to +6.10 (Table 3, Figure 9). The single-stage Hf model age (tDM1) ranged from 465.7 to 707.5 Ma, while the two-stage model age (tDM2) ranged from 693.7 to 1128.9 Ma. The single-stage Hf model age (tDM1) was greater than the zircon formation age.
Ten zircons from the Sheshangou pluton (SSGC) were analyzed, showing two-stage Hf model ages (tDM2) ranging from 1001.0 to 1144.5 Ma. The single-stage Hf model ages (tDM1), which ranged from 631.2 to 716.5 Ma, were greater than the zircon formation age. The initial 176Hf/177Hf ratios ranged from 0.282744 to 0.282808, and εHf(t) values ranged from −0.97 to +1.28 (Table 3, Figure 9).

4. Discussion

4.1. Formation Era

A nearly east–west trending Permian–Triassic magmatic rock belt extends along the northern margin of the NCC in the northern Hebei, northern Liaoning, and central Jilin regions [31,52,53,54,55]. This belt corresponds to the Solonker suture zone, which records the final closure of the PAO by 256–241 Ma. The NNE-trending shear zones developed during the post-collisional extension phase (241–215 Ma), crosscutting the earlier east–west magmatic belt and accommodating lithospheric stretching in the CAOB. Extensive Late Paleozoic to Early Mesozoic magmatism has been well-documented along the eastern NCC northern margin, particularly in the region south of the Solonker–Xar Moron–Changchun–Yanji suture zone. This magmatic record includes Carboniferous–Permian arc-related intrusions and Triassic post-collisional granitoids, as evidenced by numerous zircon U-Pb ages and geochemical studies [3,10,15,18,29,34,53,56]. The spatial distribution of these magmatic rocks forms distinct NE-trending belts that align with the regional tectonic framework. These igneous bodies are mainly calc-alkaline, indicating that the northern margin of the NCC was an active continental margin during this period [15,27,29,53,57]. In the CAOB context, magmatic arcs can vary in proximity to sutures due to complex post-collisional processes [27,53]. Based on their zircon U-Pb age data statistics, the Late Paleozoic to Early Mesozoic magmatic activity can be divided into five stages (Figure 10), regardless of their tectonic affiliations: (1) Early Permian (293–274 Ma); (2) Middle to Late Permian (270–256 Ma); (3) Late Permian to Early Middle Triassic (256–242 Ma); (4) Late Middle to Late Triassic (240–215 Ma); (5) Late Triassic (209–200 Ma).
The zircon U-Pb ages of the Late Paleozoic to Early Mesozoic magmatic rocks in the study area range from 260.5 to 230.1 Ma, confirming their formation during the Permian–Triassic period. The formation ages of the Gongzhuling rhyolite and dacite (260 Ma), Wangjiadian dacite and Wafangxi rhyolite (244 Ma), Haoguantun rhyolite (241 Ma), and Sheshangou pluton (230 Ma) are consistent with the various stages of magmatic activity that occurred along the northern margin of the NCC during the Permian–Triassic, suggesting a close relationship between this magmatic activity and the PAO tectonic domain.
The zircon U-Pb ages of the Late Paleozoic to Early Mesozoic magmatic rocks in the study area range from 260.5 to 230.1 Ma, confirming their formation during the Permian–Triassic period. The formation ages of the Gongzhuling rhyolite and dacite (260 Ma), Wangjiadian dacite and Wafangxi rhyolite (244 Ma), Haoguantun rhyolite (241 Ma), and Sheshangou pluton (230 Ma) are consistent with the various stages of magmatic activity along the northern margin of the NCC during the Permian–Triassic. This magmatic activity is genetically linked to the PAO tectonic domain, as evidenced by its temporal coincidence with the PAO closure phase (256–241 Ma) and post-collisional extension (241–215 Ma) [15,53].

4.2. Petrogenesis

4.2.1. Gongzhuling Rhyolite and Dacite

The Gongzhuling rhyolite is rich in silica and poor in Mg, Al, and Ca, classifying it as a peraluminous calc-alkaline rock, a geochemical characteristic of A-type granites. It exhibits enrichment in Rb, Th, K, Hf, and Y, along with depletion in Ba, Sr, Cr, Co, Ni, and V, features typical of A-type granites. Its strong negative Eu anomaly and enrichment in light rare earth elements result in a “seagull”-shaped rare earth element distribution pattern, further supporting its A-type classification. Compared to highly differentiated granites, the Gongzhuling rhyolite has relatively higher Ba, Sr, and Ca contents and lower Rb content. It falls within the A-type granite region on the 10,000Ga/Al-Ce diagram, confirming its classification as an A-type rhyolite. According to Eby [68], its Y/Nb and Yb/Ta ratios are greater than 1, classifying it as an A2-type granite. In addition, it falls into the A2-type granite region on the Nb-Y-Ce triangular diagram (Figure 11b) and aligns with A2-type discriminants from Hildebrand and Whalen [69]. These geochemical characteristics collectively indicate that the Gongzhuling rhyolite is an A-type rhyolite with A2-type features. The linear correlation between SiO2 and other major elements (Table 2) suggests that it underwent fractional crystallization. The Gongzhuling rhyolite is relatively enriched in LILEs and depleted in HFSFs, which is similar to the chemical properties of typical island arc granites [70]. The Zr/Hf ratios of the Gongzhuling rhyolite vary from 29.47 to 30.03 (average 29.72), which closely matches crustal averages (33; Taylor and McClennan [46]), consistent with a dominant crustal melt source. Its Nb/Ta ratios vary from 13.09 to 15.69 (average 14.76), which is higher than the crustal average of 11 but lower than the mantle average of 17.5, indicating contributions from mantle source components [46,47]. Therefore, the Gongzhuling rhyolite likely formed during slab breakoff at the terminal stage of PAO subduction, which may have facilitated mantle-derived magma underplating at the crust–mantle boundary, with potential contributions from mantle magmas. The negative εHf(t) values of the Gongzhuling rhyolite indicate it was formed from the cycling and alteration of ancient materials. The two-stage Hf model ages (tDM2) range from 1265.6 to 1507.4 Ma. In the Hf isotopic feature diagram (Figure 9a), the samples are distributed between the crustal Hf isotopic differentiation evolution lines, indicating contributions from a Mesoproterozoic crustal crystalline basement. Despite negative εHf(t) values, the variability in εHf(t) and (tDM2) indicates some heterogeneity in material components, suggesting the possible addition of a small amount of juvenile mantle components in a predominantly crustal material context. In summary, available data suggest that the magma of the Gongzhuling rhyolite originated primarily from partial melting of Mesoproterozoic crust, with possible contributions from mantle-derived magmas
The Gongzhuling dacite exhibits relatively high SiO2 content and strong alkalinity. It is enriched in K, Rb, and Th but depleted in Nb, Ta, and Ti—typical characteristics of I-type granites [18]. It falls within the I- and S-type granite region on the 10,000Ga/Al-Ce diagram (Figure 11a). Compared to S-type granites, it possesses lower P2O5 and Al2O3 contents. Both K2O/Na2O ratios are less than 1, further confirming its I-type affinity. Additionally, the Gongzhuling dacite is characterized by relatively high SiO2 (65.33%–66.19%) content, low Mg# (29.6–34.7), moderate Eu depletion (δEu = 0.78–0.82), peraluminous affinity (A/CNK = 1.17–1.20), positive εHf(t) values, with significant enrichment in LILEs and LREEs while being depleted in HFSEs (Nb, Ta, and Ti). These characteristics are similar to those of island arc granites [70] and collectively suggest that the primary magma was derived from partial melting of crustal material. The presence of a slightly negative Eu anomaly distinguishes it from mantle-derived acidic rocks, which typically exhibit strong negative Eu anomalies [72], providing further evidence for a crustal source. In the Y+Nb-Nb and Rb/30-Hf-3Ta diagrams, the Gongzhuling dacite falls within the island arc granite field (Figure 12a,b), reinforcing its island arc character. The positive εHf(t) values (>0) and the two-stage Hf model age (tDM2), ranging from 696.7 to 944.5 Ma, reveal that the island arc signatures arose from assimilation of pre-existing subduction-modified crust, not active subduction. This interpretation is further supported by its low Mg# (29.6–34.7) and moderate Eu depletion (δEu = 0.78–0.82), which distinguishes those rocks from mantle-derived magmas.

4.2.2. Wafangxi Rhyolite and Wangjiadian Dacite

Both the Wafangxi rhyolite and Wangjiadian dacite exhibit relatively high SiO2 content, strong alkalinity, and enrichment in K, Rb, and Th, while being depleted in Nb, Ta, and Ti, features characteristic of I-type granites [18]. Their Al2O3 and P2O5 contents are lower than those of S-type granites, and their Na2O content exceeds 3.2%, further supporting an I-type granite classification. They fall within the I- and S-type granite region on the 10,000Ga/Al-Ce diagram (Figure 11a).
The Wafangxi rhyolite and Wangjiadian dacite display relatively high total rare earth element content, enrichment in LILEs and LREEs, and depletion in HFSEs (such as Ta, Nb, P, and Ti) with weak negative Eu anomalies, which are characteristic of magmatic rocks from active continental margins. The Al2O3, MgO, FeO, and Fe2O3 contents are relatively high, with the Mg# values ranging from 27.0 to 42.8. The Wafangxi rhyolite has lower Cr, Co, and Ni contents than the Wangjiadian dacite, although both remain well below the levels found in primitive mantle magmas. In the Y+Nb-Nb diagram, both fall within the volcanic arc granite region (Figure 12a), further supporting their formation in an active continental margin. Zr enrichment and P depletion suggest a crustal origin. The εHf(t) values of the Wafangxi rhyolite and Wangjiadian dacite show significant variability. However, no contact reaction rim structures were observed, and the predominant positive εHf(t) values indicate the involvement of ancient crustal materials in their source regions. The two-stage Hf model ages (tDM2) range from 868.5 to 1460.5 Ma for the Wafangxi rhyolite and from 656.5 to 1364.7 Ma for the Wangjiadian dacite. In summary, both the Wafangxi rhyolite and Wangjiadian dacite originated from the partial melting of Middle to Neoproterozoic crust.

4.2.3. Sheshangou Pluton and Haoguantun Rhyolite

The Sheshangou pluton and Haoguantun rhyolite are characterized by high silica, high sodium, and low calcium, magnesium, and aluminum contents, indicating A-type granite characteristics based on the major element features. Their rare earth element patterns exhibit strong negative Eu anomalies, as evidenced by their distinctive “seagull”-shape distribution in the rare earth element distribution diagrams. The two share a similar genesis. Compared with the highly differentiated I-type granites, the Sheshangou pluton and Haoguantun rhyolite have relatively higher Ba, Sr, and Ca contents. The trace element analysis shows Sr levels below 100 × 10−6 and Yb levels above 1 × 10⁻⁶ (except for one instance at 0.94 × 10⁻⁶), confirming their classification as A-type granites on the 10,000Ga/Al-Ce diagram. According to Eby [68], the Y/Nb and Yb/Ta ratios of the Sheshangou pluton and Haoguantun rhyolite are mostly <1, indicating proximity to A1-type granites, and all fall within the A1-type granite region on the Nb-Y-Ce triangular diagram (Figure 11b). Although structural preservation differs, both units constitute parts of a genetically related A1-type magmatic system that developed during lithospheric extension following PAO closure. The absence of large basic–ultrabasic bedrock exposures surrounding the Sheshangou pluton and Haoguantun rhyolite suggests that they were not formed through direct crystallization and differentiation of mantle-derived magmas [75]. Instead, their higher SiO2, Na2O, and K2O contents, combined with lower FeO and MgO contents, suggest that their magmas likely originated from the partial melting of the crust. The negative correlations between SiO2 and Al2O3, CaO, MgO, P2O5, and FeO (Table 2) indicate that these magmas underwent fractional crystallization during their evolution. The low Yb and Sr levels suggest the presence of plagioclase in the residual phase. Additionally, the Sheshangou pluton and Haoguantun rhyolite exhibit low Co and Cr contents, enrichment in LILEs and LREEs, and depletion in HFSEs (such as Nb, P, and Zr). These geochemical characteristics, along with strong negative Ba anomalies, further indicate that the source of the magma may have been of crustal origin.
In the Y+Nb-Nb diagram (Figure 12a), the Sheshangou pluton falls within the intraplate region, while the Haoguantun rhyolite falls within the island-arc granite region. However, in the Rb/30-Hf-3Ta diagram, both fall within the post-collision region (Figure 12b), displaying characteristic negative Ba anomalies of intraplate granites. This apparent discrepancy reflects the complex tectonic transition from subduction-related arc magmatism to post-collisional extension. The two-stage Hf model ages (tDM2: 1001–1144 Ma for Sheshangou, 693–1128 Ma for Haoguantun) indicate derivation from Mesoproterozoic to Neoproterozoic crust, consistent with a shared crustal source modified by different tectonic overprints.

4.3. Tectonic Significance

During the Permian–Triassic period, the eastern segment of the CAOB underwent several geological processes, including the subduction of the PAO, ocean basin closure, terrane amalgamation, crustal thickening, and lithospheric delamination. The evolution of orogenic belts is typically recorded in the compositional variations in associated magmatic rocks [3,4,76]. Therefore, studying the compositional characteristics of Permian–Triassic magmatic rocks is important for understanding the tectonic history of the eastern segment of the CAOB.
Early Permian magmatic rocks (293–274 Ma) are predominantly acidic and mainly belong to the high-potassium calc-alkaline series. These rocks are enriched in LILEs and depleted in HFSEs, forming in an active continental margin during northwest-directed subduction of the PAO plate beneath the NCC, as documented by regional tectonic studies [3,13,14,15]. The granitic rocks from this period are characterized by low Sr/Y and (La/Yb)N ratios, typical of island arc volcanic rocks formed in a continental margin setting [58]. The south-directed subduction of the PAO plate beneath the NCC created a north-dipping subduction zone, leading to the formation of a magmatic arc on the northern side of the NCC–PAO suture. The bidirectional subduction (southward beneath the NCC and northward beneath adjacent terranes) facilitated subsequent accretion and collision [3,13,14,15,77].
For the Middle to Late Permian period (270–256 Ma), the representative rocks in the study area include the Gongzhuling rhyolite (260.5 ± 2.2 Ma) and Gongzhuling dacite (260.3 ± 2.4 Ma), both formed during the Middle Permian. The Gongzhuling rhyolite is classified as an A-type rhyolite with A2-type characteristics. It falls within the intraplate granite region in the Rb/30-Hf-3Ta discrimination diagram and within the intraplate region in the Y+Nb-Rb diagram, indicating an extensional environment. In the R1-R2 diagram, it falls within the mantle differentiation field, suggesting the occurrence of magmatic activity related to the mantle thermal plume [35] posited that magmatic activity in the eastern Xiaoling body (264.6 Ma) was also related to this mantle thermal plume. The Gongzhuling dacite falls within the mantle differentiation area on the R1-R2 diagram, indicating an extensional setting caused by the detachment of fragments from the PAO plate. At this time, the large-scale underplating of mantle-derived magmas at the crust–mantle boundary led to partial melting of the crust. The Gongzhuling dacite exhibits geochemical signatures characteristic of island arc magmatism, which are interpreted to result primarily from the assimilation of pre-existing subduction-modified crustal materials rather than active slab subduction. This suggests that the ascending magma incorporated crustal components that were recycled from earlier PAO subduction events.
The Gongzhuling dacite exhibits geochemical signatures of island arc magmatism, including enrichment in LILEs and depletion in HFSEs, while its high SiO2 content (65.2–67.8 wt.%) and positive εHf(t) values (+2.3 to +5.1) indicate crustal material involvement during magma ascent. This crustal input likely resulted from partial melting of the overlying continental crust or contamination by crustal rocks during magmatic emplacement, a common process in active continental margin arcs where subduction-driven melts interact with the crust [18,58].
During the Middle–Late Permian (270–256 Ma), the eastern segment of the NCC underwent significant tectonic processes, including the closure of the PAO, the onset of collision, crustal thickening, and the detachment of the oceanic plate. Granitic rocks developed significantly along the west–east trending Changchun–Yanji suture zone during this period, including both A- and I-type granites, indicating complex petrogenesis. The transition from subduction in the Early Permian to collision in the Late Permian resulted in crustal thickening, as exemplified by the garnet-bearing granite from Poniugou (270 Ma), which formed during this crustal thickening process [78]. The discovery of mixed Angara flora within the Huaxia flora in the Permian strata [79] records the closure of the ocean basin that separated the Siberian Craton from the NCC [4]. Regional paleosedimentary evidence suggests that the PAO was a remnant oceanic basin in the Late Permian [80], marking the beginning of the collision between the northern margin of the NCC and the northern Songliao Block. It is generally accepted that A-type granites and bimodal volcanic rocks form in extensional environments, with igneous rocks composed of mafic and felsic components during the Middle Permian (270–256 Ma), displaying the characteristics of bimodal rocks. Regionally, the development of A-type granites in the Kaiyuan area [14], “bimodal” intrusions in the Longjing area, and high-Mg andesites in the Kaiyuan area [14] indicate the possibility of an extensional environment in the Changchun–Yanji area during the Early to Late Permian, possibly related to plate detachment.
Numerous magmatic rocks, primarily composed of felsic rocks, of Late Permian to Early–Middle Triassic (256–242 Ma), were documented south of the Solonker–Xar Moron–Changchun suture zone in prior studies. The Wafangxi rhyolite is classified as a high-potassium calc-alkaline I-type rock, while the Wangjiadian dacite is classified as a calc-alkaline I-type rock, formed at 243.9 ± 3.0 Ma and 244.1 ± 2.5 Ma, respectively. Both rocks exhibit the characteristics of arc volcanic rocks, which are typical of magmatic rocks in active continental margins [Figure 12]. In the R1-R2 diagram, these rocks transition from a collision phase to a collision-uplift phase, confirming that the area was in a collision-uplift period with crustal thickening. The widespread distribution of syn-collisional granitoids in the area—including molasse deposits at the base of the Lujiatun Formation in central Jilin and adakitic granites in northern Liaoning—further confirms the final collision and amalgamation between the northern margin of the North China Craton (NCC) and the northern blocks during the Late Permian to Early–Middle Triassic. The Northeast China region is characterized by Syn-collisional granites, indicating that the NCC underwent collision with the Songliao massif and amalgamation during the Triassic. With the convergence of continental margins, orogenic processes gradually intensified [18,22,53,56,59]. Paleomagnetic evidence suggests that the initial collision between the NCC and the northern blocks commenced during the late Permian (255–250 Ma), culminating in final amalgamation by the Triassic. Additionally, the discovery of molasse deposits at the base of the Lujiatun Formation in central Jilin and granitic edifice rocks in northern Liaoning further supports the occurrence of collisional uplift in the region [16,22]. Currently, most scholars believe that the collision in the eastern segment of the CAOB likely concluded during the Late Permian to Early Middle Triassic [3,4,9,13,20,78]. The collision resulted in the closure of narrow remnant ocean basins [56], regional greenschist to amphibolite facies metamorphism [9,30], and intense magmatic activity [18,21,22,25,56]. In the central Jilin region, metamorphic events of the Hulan and Wudao groups, as well as granitic mylonites in the Faku region, were dated between 256 and 250 Ma [18,27,29], along with the metamorphic age of the greenschist- to amphibolite-facies in the Zhaobeishan Formation in the Kaiyuan area (245 Ma) [78] further constraining the final collision time in the eastern segment of the CAOB to be between the Late Permian and Early–Middle Triassic. Molasse deposits serve as reliable indicators of the cessation of orogenic activity. Discoveries of molasse deposits in the Dajianggang (central Jilin Province), Xiaoyingzi (western Liaoning), and Xiaohekou (eastern Inner Mongolia) formations further confirm that the final closure occurred before the Late Triassic. In summary, the final collision in the eastern segment of the CAOB occurred between the Late Permian and Early–Middle Triassic, with crustal thickening persisting until the Middle Triassic.
During the Late Middle to Late Triassic (240–215 Ma), magmatic activity in the study area formed several rocks, including the Haoguantun rhyolite (241 Ma), the Sheshangou pluton (230 Ma), and the Shidonggou pluton (231 Ma) [37], all of which are high-K calc-alkaline rocks with A-type granite characteristics. Their classification in the late orogenic (R1-R2) and post-collision (Rb/30-Hf-3Ta) domains confirms lithospheric extension after PAO closure. Bimodal felsic-mafic associations reflect post-collisional collapse [15,24], while A-type magmatism marks the NCC margin’s transition to extension. Crucially, their planar distribution (vs. subduction-related linear belts) decouples this magmatism from PAO subduction [4,22,81]. Moreover, the Late Triassic magmatic rock assemblages formed under extensional conditions exhibit a planar distribution across different geological units, such as the CAOB and NCC, differing from the linear distribution associated with subduction. This indicates that regional magmatic activity was no longer related to the subduction of the PAO plate [22]. The NE-trending shear zone in the study area records significant mylonitization, with magmatic rocks yielding ages of 290–270 Ma, and the undeformed Sheshangou pluton (240 Ma) defining the upper limit of shearing. This brackets the main phase of mylonitization to 270–240 Ma, coinciding with the transition from the “Plate Disintegration” to “Final Collision” phases. The mylonitization occurred during lithospheric delamination following PAO closure. This shear zone is an integral part of the CAOB’s post-collisional deformation system, distinct from the NNE-trending Paleo-Pacific structures (active since Jurassic) in strike orientation and timing [22,81].
A complete orogenic cycle typically comprises three distinct phases: (1) A pre-collisional phase, characterized by oceanic subduction, basin closure, and terrane accretion. (2) A syn-collisional phase, marked by arc-continent or continent–continent collision accompanied by significant crustal thickening. (3) A post-collisional phase, featuring lithospheric extension and tectonic collapse. A comprehensive analysis of our findings, combined with regional geological data, reveals crucial insights. The Paleo-Asian Ocean’s terminal closure along the eastern segment of the North China Craton’s northern margin, specifically along the Solonker–Xar Moron–Changchun–Yanji suture zone, was completed before the Late Triassic period. During the Early–Middle Triassic, observed extensional thinning phenomena represent post-collisional collapse processes rather than indicating continued PAO subduction activity. Significantly, this extensional event demonstrates distinct characteristics that differentiate it from potential Paleo-Pacific subduction influences, particularly through its distinctive east–west magmatic distribution pattern, the complete absence of diagnostic Pacific-type magmatic suites such as adakites, and its exclusive development within the orogenic core zone rather than along continental margins. This systematic investigation enables the division of Permian–Triassic magmatic activity within the eastern Central Asian Orogenic Belt into five distinct tectonic stages. The sequence commences with the active continental margin stage, progresses through the slab break-off stage and final collision-closure stage, evolves into the post-orogenic extension stage, and culminates in the locally developed Jiamusi–Songliao collision stage, as clearly illustrated in Figure 10. Each stage reflects specific geodynamic processes that collectively document the complete orogenic cycle from initial subduction through to terminal collapse.

5. Conclusions

(1)
A series of volcanic rocks identified from the former “Tongjiatun Formation” yielded zircon LA-ICP-MS U-Pb ages of 240.9 ± 2.2 Ma, 243.9 ± 3.0 Ma, 244.1 ± 2.5 Ma, 260.3 ± 2.4 Ma, and 260.5 ± 2.2 Ma, indicating formation during the Permian–Triassic. The Sheshangou pluton was dated at 230.1 ± 1.7 Ma, confirming its Triassic origin.
(2)
The rocks are intermediate to acidic, with a SiO2 content (63.01%–78.33%), K2O content (1.62%–4.59%), and Al2O3 content (11.42%–15.7%), classifying them as calc-alkaline to high-potassium calc-alkaline rocks that range from peraluminous to quasi-aluminous. The Gongzhuling dacite originated from the partial melting of depleted mafic lower crust; the Gongzhuling rhyolite was derived from the partial melting of Mesoproterozoic mantle, modified by fluids during its ascent and emplacement; the Wafangxi rhyolite, Wangjiadian dacite, and Haoguantun rhyolite originated primarily from the Middle to Neoproterozoic crust; the Sheshangou pluton originated from the Mesoproterozoic crust.
(3)
The eastern segment of the CAOB underwent several tectonic evolutionary stages during the Permian–Triassic, including the active continental margin phase, plate disintegration phase, final collision and closure phase, and post-orogenic extension phase. The final closure of the PAO along the eastern margin of the NCC occurred before the Late Triassic. During the Late Triassic, the study area entered a post-orogenic extensional environment driven by gravitational collapse following the NCC-XOR collision, a process genetically linked to the PAO closure rather than paleo-Pacific subduction.

Author Contributions

Conceptualization, S.S., Y.S. and X.Z.; methodology, N.J., Y.Z. and S.J.; software, X.Z. and S.J.; validation, N.J. and Y.Z.; investigation, S.S., Y.S., N.J. and Y.Z.; writing—original draft preparation, S.S. and Y.S.; writing—review and editing, N.J., Y.Z., X.Z. and S.J.; visualization, S.J. and Y.Z.; project administration, Y.S.; funding acquisition, S.S. and Y.S. All authors have read and agreed to the published version of the manuscript.

Funding

This research was funded by the National Natural Science Foundation of China (Grant/Award Numbers: 42272253) and Geological Survey Project of China (Grants/Award Numbers: DD2024071).

Data Availability Statement

The authors confirm that the data generated or analyzed during this study are provided in full within the published article.

Acknowledgments

The analysis of the samples benefited from the strong support of the Northeast Mineral Resources Supervision and Testing Center of the Ministry of Natural Resources, the Key Laboratory of Mineral Resource Evaluation of the Ministry of Natural Resources at Jilin University, the North China Mineral Resources Supervision and Testing Center, and the Changchun Zhongneng Rock and Mineral Testing Service Company. We sincerely thank them. We also appreciate the constructive comments from the reviewers on this paper.

Conflicts of Interest

The authors declare no conflicts of interest.

References

  1. Xiao, W.J.; Huang, B.C.; Han, C.M.; Sun, S.; Li, J.L. A review of the western part of the Altaids: A key to understanding the architecture of accretionary orogens. Gondwana Res. 2010, 18, 253–273. [Google Scholar] [CrossRef]
  2. Liu, Z.H.; Xu, Z.Y.; Yang, Z.S. Tectonic-gneiss and its origin mechanism. J. Jilin Univ. (Earth Sci. Ed.) 2011, 41, 1314–1321, (In Chinese with English Abstract). [Google Scholar]
  3. Xiao, W.J.; Windley, B.F.; Hao, J.; Zhai, M.G. Accretion leading to collision and the permian solonker suture, Inner Mongolia, China: Termination of the central Asian Orogenic Belt. Tectonics 2003, 22, 1069. [Google Scholar] [CrossRef]
  4. Wilde, S.A. Final amalgamation of the Central Asian Orogenic Belt in NE China: Paleo-Asian Ocean closure versus Paleo-Pacific plate subduction—A review of the evidence. Tectonophysics 2015, 662, 345–362. [Google Scholar] [CrossRef]
  5. Safonova, I.; Seltmann, R.; Kröner, A.; Gladkochub, D.; Schulmann, K.; Xiao, W.J.; Kim, J.; Komiya, T.; Sun, M. A new concept of continental construction in the Central Asian Orogenic Belt. Episodes 2011, 34, 186–196. [Google Scholar] [CrossRef]
  6. Safonova, I.Y.; Santosh, M. Accretionary complexes in the Asia-Pacific region: Tracing archives of ocean plate stratigraphy and tracking mantle plumes. Gondwana Res. 2014, 25, 126–158. [Google Scholar] [CrossRef]
  7. Ge, W.C.; Wu, F.Y.; Zhou, C.Y.; Zhang, J.H. Zircon U-Pb ages and its significance of the Mesozoic granites in the Wulanhaote region, central Da Hinggan Mountain. Acta Petrol. Sin. 2005, 21, 749–762, (In Chinese with English Abstract). [Google Scholar]
  8. Liu, Y.J.; Feng, Z.Q.; Jiang, L.W.; Jin, W.; Li, W.M.; Guan, Q.B.; Wen, Q.B.; Liang, C.Y. Ophiolite in the eastern Central Asian Orogenic Belt, NE China. Acta Petrol. Sin. 2019, 35, 3017–3047, (In Chinese with English Abstract). [Google Scholar]
  9. Liu, Y.J.; Li, W.M.; Feng, Z.Q.; Wen, Q.B.; Neubauer, F.; Liang, C.Y. A review of the Paleozoic tectonics in the eastern part of Central Asian Orogenic Belt. Gondwana Res. 2017, 43, 123–148. [Google Scholar] [CrossRef]
  10. Xu, B.; Charvet, J.; Chen, Y.; Zhao, P.; Shi, G.Z. Middle Paleozoic convergent orogenic belts in western Inner Mongolia (China): Framework, kinematics, geochronology and implications for tectonic evolution of the Central Asian Orogenic Belt. Gondwana Res. 2013, 23, 1342–1364. [Google Scholar] [CrossRef]
  11. Xu, B.; Zhao, P.; Wang, Y.Y.; Liao, W.; Luo, Z.W.; Bao, Q.Z.; Zhou, Y.H. The pre-devonian tectonic framework of Xing’an-Mongolia orogenic belt (XMOB) in North China. J. Asian Earth Sci. 2015, 97, 183–196. [Google Scholar] [CrossRef]
  12. Li, C.D.; Zhang, F.Q.; Miao, L.C.; Xie, H.Q.; Xu, Y.W. Zircon SHRIMP geochronology and geochemistry of Late Permian high-Mg andesites in Seluohe area, Jilin province, China. Acta Petrol. Sin. 2007, 23, 767–776, (In Chinese with English Abstract). [Google Scholar]
  13. Jian, P.; Liu, D.Y.; Kröner, A.; Windley, B.F.; Shi, Y.R.; Zhang, W.; Zhang, F.Q.; Miao, L.C.; Zhang, L.; Tomurhuu, D. Evolution of a Permian intraoceanic arc-trench system in the Solonker suture zone, Central Asian Orogenic Belt, China and Mongolia. Lithos 2010, 118, 169–190. [Google Scholar] [CrossRef]
  14. Cao, H.H.; Xu, W.L.; Pei, F.P.; Guo, P.Y.; Wang, F. Permian tectonic evolution of the eastern section of the northern margin of the North China Plate: Constraints from zircon U-Pb geochronology and geochemistry of the volcanic rocks. Acta Petrol. Sin. 2012, 28, 2733–2750, (In Chinese with English Abstract). [Google Scholar]
  15. Cao, H.H. Geochronology and Geochemistry of the Late Paleozoic-Early Mesozoic Igneous Rocks in the Eastern Segment of the Northern Margin of the North China Block. Ph.D. Thesis, Jilin University, Changchun, China, 2013. (In Chinese with English Abstract). [Google Scholar]
  16. Liu, J.; Liu, Z.H.; Li, S.C.; Zhao, C.; Wang, C.J.; Peng, Y.B.; Yang, Z.J.; Dou, S.Y. Geochronology and geochemistry of Triassic intrusive rocks in Kaiyuan area of the eastern section of the northern margin of North China. Acta Petrol. Sin. 2016, 32, 2739–2756, (In Chinese with English Abstract). [Google Scholar]
  17. Tong, Y.; Jahn, B.M.; Wang, T.; Hong, D.W.; Smith, E.I.; Sun, M.; Gao, J.F.; Yang, Q.D.; Wei, H. Permian alkaline granites in the Erenhot-Hegenshan belt, Northern Inner Mongolia, China: Model of generation, time of emplacement and regional tectonic significance. J. Asian Earth Sci. 2015, 97, 320–336. [Google Scholar] [CrossRef]
  18. Sun, D.Y.; Wu, F.Y.; Zhang, Y.B.; Gao, S. The final closing time of the west Lamulun River-Changchun-Yanji plate suture zone–Evidence from the Dayushan granitic pluton, Jilin Province. J. Jilin Univ. (Earth Sci. Ed.) 2004, 34, 174–181, (In Chinese with English Abstract). [Google Scholar]
  19. Li, J.Y.; Gao, L.M.; Sun, G.H.; Li, Y.P.; Wang, Y.B. Shuangjingzi middle Triassic syn-collisional crust-derived granite in the east Inner Mongolia and its constraint on the timing of collision between Siberian and Sino-Korean paleo-plates. Acta Petrol. Sin. 2007, 23, 565–582, (In Chinese with English Abstract). [Google Scholar]
  20. Miao, L.C.; Fan, W.M.; Liu, D.Y.; Zhang, F.Q.; Shi, Y.R.; Guo, F. Geochronology and geochemistry of the Hegenshan ophiolitic complex: Implications for late-stage tectonic evolution of the Inner Mongolia-Daxinganling Orogenic Belt, China. J. Asian Earth Sci. 2008, 32, 348–370. [Google Scholar] [CrossRef]
  21. Sun, D.Y.; Wu, F.Y.; Gao, S. LA-ICPMS Zircon U-Pb age of the Qingshui Pluton in the East Xiao Hinggan mountains. Acta Geosci. Sin. 2004, 25, 213–218, (In Chinese with English Abstract). [Google Scholar]
  22. Cao, H.H.; Xu, W.L.; Pei, F.P.; Wang, Z.W.; Wang, F.; Wang, Z.J. Zircon U-Pb geochronology and petrogenesis of the Late Paleozoic-Early Mesozoic intrusive rocks in the eastern segment of the northern margin of the North China Block. Lithos 2013, 170–171, 191–207. [Google Scholar] [CrossRef]
  23. Zhou, J.B.; Wilde, S.A. The crustal accretion history and tectonic evolution of the NE China segment of the central Asian Orogenic Belt. Gondwana Res. 2013, 23, 1365–1377. [Google Scholar] [CrossRef]
  24. Sun, D.Y.; Wu, F.Y.; Gao, S.; Lu, X.P. Confirmation of two episodes of A-type granite emplacement during Late Triassic and Early Jurassic in the central Jilin Province, and their constraints on the structural pattern of Eastern Jilin-Heilongjiang Area, China. Earth Sci. Front. 2005, 12, 263–275, (In Chinese with English Abstract). [Google Scholar]
  25. Yuan, L.L.; Zhang, X.H.; Xue, F.H.; Lu, Y.H.; Zong, K.Q. Late Permian high-Mg andesite and basalt association from northern Liaoning, North China: Insights into the final closure of the Paleo-Asian Ocean and the orogen-craton boundary. Lithos 2016, 258–259, 58–76. [Google Scholar] [CrossRef]
  26. Shi, Y.; Shi, S.S.; Liu, Z.H.; Wang, L.; Liu, J.; Chen, J.S.; Yang, F.; Zhang, C.; Li, B.; Zhang, L.D. Back-arc system formation and extinction in the southern Central Asian Orogenic Belt: New constraints from the Faku ophiolite in north Liaoning, NE China. Gondwana Res. 2022, 103, 64–83. [Google Scholar] [CrossRef]
  27. Wu, F.Y.; Sun, D.Y.; Ge, W.C.; Zhang, Y.B.; Grant, M.L.; Wilde, S.A.; Jahn, B.M. Geochronology of the Phanerozoic granitoids in northeastern China. J. Asian Earth Sci. 2011, 41, 1–30. [Google Scholar] [CrossRef]
  28. Zhang, X.H.; Zhai, M.G. Magmatism and its metallogenetic effects during the Paleozoic continental crustal construction in northern North China: An overview. Acta Petrol. Sin. 2010, 26, 1329–1341, (In Chinese with English Abstract). [Google Scholar]
  29. Zhang, X.H.; Wang, H.; Li, T.S. 40Ar/39Ar geochronology of the Faku tectonites: Implications for the tectonothermal evolution of the Faku block, northern Liaoning. Sci. China Ser. D Earth Sci. 2004, 38, 601–612. [Google Scholar] [CrossRef]
  30. Zhang, X.H.; Su, W.J.; Wang, H. Zircon SHRIMP geochronology of the Faku tectonites in the northern Liaoning Province: Implications for the northern boundary of the North China Craton. Acta Petrol. Sin. 2005, 21, 135–142, (In Chinese with English Abstract). [Google Scholar]
  31. Zhang, X.H.; Zhang, H.F.; Zhai, M.G.; Wilde, S.A.; Xie, L.W. Geochemistry of Middle Triassic gabbros from northern Liaoning, North China: Origin and tectonic implications. Geol. Mag. 2009, 146, 540–551. [Google Scholar] [CrossRef]
  32. Zhang, X.H.; Zhang, H.F.; Wilde, S.A.; Yang, Y.H.; Chen, H.H. Late Permian to early Triassic mafic to felsic intrusive rocks from North Liaoning, North China: Petrogenesis and implications for Phanerozoic continental crustal growth. Lithos 2010, 117, 283–306. [Google Scholar] [CrossRef]
  33. Shi, Y.; Shi, S.S.; Liu, Z.H.; Liu, J.; Ju, N.; You, H.X.; Zhang, Z.B.; Zhao, C.Q. Petrogenesis of the late Early Palaeozoic adakitic granitoids in the southern margin of the Songliao Basin, NE China: Implications for the subduction of the Palaeo-Asian Ocean. Geol. J. 2019, 54, 3821–3839. [Google Scholar] [CrossRef]
  34. Shi, Y.; Liu, Z.H.; Liu, Y.J.; Shi, S.S.; Wei, M.H.; Yang, J.J.; Gao, T. Late Paleozoic-Early Mesozoic southward subduction-closure of the Paleo-Asian Ocean: Proof from geochemistry and geochronology of Early Permian-Late Triassic felsic intrusive rocks from North Liaoning, NE China. Lithos 2019, 346–347, 105165. [Google Scholar] [CrossRef]
  35. Shi, Y.; Chen, J.S.; Wei, M.H.; Shi, S.S.; Zhang, C.; Zhang, L.D.; Hao, Y.J. Evolution of eastern segment of the Paleo-Asian Ocean in the Late Paleozoic: Geochronology and geochemistry constraints of granites in Faku area, North Liaoning, NE China. Acta Petrol. Sin. 2020, 36, 3287–3308, (In Chinese with English Abstract). [Google Scholar]
  36. Shi, Y.; Shi, S.S.; Shu, G.L. Discovery of the early paleozoic arc-continent collision in northern Liaoning province tectonic implication. Geol. Resour. 2020, 29, 397–400, (In Chinese with English Abstract). [Google Scholar]
  37. Shi, S.S.; Shi, Y.; Zhang, C.; Shi, J.M.; Jiang, S. Geochronology and geochemistry of the Triassic intrusive rocks in the Faku area, northern Liaoning, China: Constraints on the evolution of the Palaeo-Asian Ocean. Geol. J. 2022, 57, 1658–1681. [Google Scholar] [CrossRef]
  38. Li, R.S.; Ji, W.H.; Gu, P.Y. A Mapping Method for Melange in Orogenic Belt (Ophiolite) Structure; China University of Geosciences Press: Wuhan, China, 2016. (In Chinese) [Google Scholar]
  39. Andersen, T. Correction of common lead in U-Pb analyses that do not report 204Pb. Chem. Geol. 2002, 192, 59–79. [Google Scholar] [CrossRef]
  40. Yuan, H.L.; Gao, S.; Liu, X.M.; Li, H.M.; Günther, D.; Wu, F.Y. Accurate U-Pb age and trace element determinations of zircon by laser ablation-inductively coupled plasma-mass spectrometry. Geostand. Geoanalytical Res. 2004, 28, 353–370. [Google Scholar] [CrossRef]
  41. Geng, J.Z.; Li, H.K.; Zhang, J.; Zhou, H.Y.; Li, H.M. Zircon Hf isotope analysis by means of LA-MC-ICP-MS. Geol. Bull. China 2011, 30, 1508–1513, (In Chinese with English Abstract). [Google Scholar]
  42. Hoskin, P.W.O.; Ireland, T.R. Rare earth element chemistry of zircon and its use as a provenance indicator. Geology 2000, 28, 627–630. [Google Scholar] [CrossRef]
  43. Middlemost, E.A.K. Naming materials in the magma/igneous rock system. Earth-Sci. Rev. 1994, 37, 215–224. [Google Scholar] [CrossRef]
  44. Peccerillo, A.; Taylor, S.R. Geochemistry of Eocene calc-alkaline volcanic rocks from the Kastamonu area, Northern Turkey. Contrib. Mineral. Petrol. 1976, 58, 63–81. [Google Scholar] [CrossRef]
  45. Maniar, P.D.; Piccoli, P.M. Tectonic discrimination of granitoids. Geol. Soc. Am. Bull. 1989, 101, 635–643. [Google Scholar] [CrossRef]
  46. Taylor, S.R.; McClennan, S.M. The Continental Crust: Its Composition and Evolution: An Examination of the Geochemical Record Preserved in Sedimentary Rocks; Blackwell Scientific: Oxford, UK, 1985. [Google Scholar]
  47. Sun, S.S.; McDonough, W.F. Chemical and isotopic systematics of oceanic basalts: Implications for mantle composition and processes. Geol. Soc. Lond. Spec. Publ. 1989, 42, 313–345. [Google Scholar] [CrossRef]
  48. Amelin, Y.; Lee, D.C.; Halliday, A.N. Early-Middle Archaean crustal evolution deduced from Lu-Hf and U-Pb isotopic studies of single zircon grains. Geochim. Cosmochim. Acta 2000, 64, 4205–4225. [Google Scholar] [CrossRef]
  49. Vervoort, J.D.; Patchett, P.J.; Gehrels, G.E.; Nutman, A.P. Constraints on early earth differentiation from Hafnium and Neodymium isotopes. Nature 1996, 379, 624–627. [Google Scholar] [CrossRef]
  50. Liu, C.H.; Wu, C.L.; Gao, Y.H.; Lei, M.; Qin, H.P.; Li, M.Z. Zircon LA-ICP-MS U-Pb dating and Lu-Hf isotopic system of A-type granitoids in South Tianshan, Baicheng County, Xinjiang. Acta Petrol. Sin. 2014, 30, 1595–1614, (In Chinese with English Abstract). [Google Scholar]
  51. Yang, J.H.; Wu, F.Y.; Shao, J.A.; Wilde, S.A.; Xie, L.W.; Liu, X.M. Constraints on the timing of uplift of the Yanshan fold and thrust belt, North China. Earth Planet. Sci. Lett. 2006, 246, 336–352. [Google Scholar] [CrossRef]
  52. Wu, F.Y.; Yang, J.H.; Liu, X.M. Geochronological framework of the mesozoic granitic magmatism in the Liaodong Peninsula, Northeast China. Geol. J. China Univ. 2005, 11, 305–317, (In Chinese with English Abstract). [Google Scholar]
  53. Zhang, Y.B.; Wu, F.Y.; Wilde, S.A.; Zhai, M.G.; Lu, X.P.; Sun, D.Y. Zircon U-Pb ages and tectonic implications of ‘Early Paleozoic’ granitoids at Yanbian, Jilin Province, Northeast China. Isl. Arc 2004, 13, 484–505. [Google Scholar] [CrossRef]
  54. Zhang, S.H.; Zhao, Y.; Song, B.; Hu, J.M.; Liu, S.W.; Yang, Y.H.; Chen, F.K.; Liu, X.M.; Liu, J. Contrasting late carboniferous and late Permian-Middle Triassic intrusive suites from the northern margin of the North China craton: Geochronology, petrogenesis, and tectonic implications. GSA Bull. 2009, 121, 181–200. [Google Scholar] [CrossRef]
  55. Zhang, S.H.; Zhao, Y.; Liu, X.C.; Liu, D.Y.; Chen, F.K.; Xie, L.W.; Chen, H.H. Late paleozoic to early mesozoic mafic-ultramafic complexes from the northern North China Block: Constraints on the composition and evolution of the lithospheric mantle. Lithos 2009, 110, 229–246. [Google Scholar] [CrossRef]
  56. Wang, Z.J.; Xu, W.L.; Pei, F.P.; Wang, Z.W.; Li, Y.; Cao, H.H. Geochronology and geochemistry of middle Permian-Middle Triassic intrusive rocks from central-eastern Jilin Province, NE China: Constraints on the tectonic evolution of the eastern segment of the Paleo-Asian Ocean. Lithos 2015, 238, 13–25. [Google Scholar] [CrossRef]
  57. Guan, Q.B.; Li, S.C.; Zhang, C.; Shi, Y.; Li, P.C. Zircon U-Pb dating, geochemistry and geological significance of the I type granites in Helong area, the eastern section of the southern margin of Xing-Meng Orogenic Belt. Acta Petrol. Sin. 2016, 32, 2690–2706, (In Chinese with English Abstract). [Google Scholar]
  58. Liu, J.; Zhang, J.; Liu, Z.H.; Yin, C.Q.; Zhao, C.; Yu, X.Y.; Chen, Y.; Tian, Y.; Dong, Y. Petrogenesis of Permo-Triassic intrusive rocks in Northern Liaoning Province, NE China: Implications for the closure of the eastern Paleo-Asian Ocean. Int. Geol. Rev. 2020, 62, 754–780. [Google Scholar] [CrossRef]
  59. Shi, Y. Late Ordovician-Late Triassic Tectonic Evolution of Faku Area in the Eastern Segment of the Northern Margin of the North China Craton-Evidence from Magmatic Activity. Ph.D. Thesis, Jilin University, Changchun, China, 2020. (In Chinese with English Abstract). [Google Scholar]
  60. Fu, C.L.; Sun, D.Y.; Zhang, X.Z.; Wei, H.Y.; Gou, J. Discovery and geological significance of the Triassic high-Mg diorites in Hunchu area, Jilin Province. Acta Petrol. Sin. 2010, 26, 1089–1102, (In Chinese with English Abstract). [Google Scholar]
  61. Song, Z.G.; Han, Z.Z.; Gao, L.H.; Geng, H.Y.; Li, X.P.; Meng, F.X.; Han, M.; Zhong, W.J.; Li, J.J.; Du, Q.X.; et al. Permo-Triassic evolution of the southern margin of the Central Asian Orogenic Belt revisited: Insights from Late Permian igneous suite in the Daheishan Horst, NE China. Gondwana Res. 2018, 56, 23–50. [Google Scholar] [CrossRef]
  62. Jing, Y.; Ge, W.C.; Dong, Y.; Yang, H.; Ji, Z.; Bi, J.H.; Zhou, H.Y.; Xing, D.H. Early-Middle Permian southward subduction of the eastern Paleo-Asian Ocean: Constraints from geochronology and geochemistry of intermediate-acidic volcanic rocks in the northern margin of the North China Craton. Lithos 2020, 364–365, 105491. [Google Scholar] [CrossRef]
  63. Jing, Y.; Ji, Z.; Ge, W.C.; Dong, Y.; Yang, H.; Bi, J.H. Middle-late Permian I-type granitoids from the Diaobingshan region in the northern margin of the North China Craton: Insight into southward subduction of the Paleo-Asian Ocean. Int. Geol. Rev. 2021, 63, 357–379. [Google Scholar] [CrossRef]
  64. Liu, S.; Hu, R.Z.; Gao, S.; Feng, C.X.; Feng, G.Y.; Coulson, I.M.; Li, C.; Wang, T.; Qi, Y.Q. Zircon U-Pb age and Sr-Nd-Hf isotope geochemistry of Permian granodiorite and associated gabbro in the Songliao Block, NE China and implications for growth of Juvenile crust. Lithos 2010, 114, 423–436. [Google Scholar] [CrossRef]
  65. Liaoning Bureau of Geology and Mineral Resources. Regional Geology of Liaoning Province; Geological Publishing House: Beijing, China, 1989. (In Chinese) [Google Scholar]
  66. Miao, L.C.; Qiu, Y.M.; Fan, W.M.; Zhang, F.Q.; Zhai, M.G. Geology, geochronology, and tectonic setting of the Jiapigou gold deposits, southern Jilin Province, China. Ore Geol. Rev. 2005, 26, 137–165. [Google Scholar] [CrossRef]
  67. Zhang, C.; Shi, S.S.; Shi, Y.; Wei, M.H.; Yang, F.; Huan, H.F.; Li, W.B.; Wang, L.Y. Tectonic evolution of northern margin of Eastern North China Craton: Evidences of middle triassic plutons in Faku Area, Liaoning Province. J. Jilin Univ. (Earth Sci. Ed.) 2021, 51, 734–748, (In Chinese with English Abstract). [Google Scholar]
  68. Eby, G.N. Chemical Subdivision of the A-type granitoids: Petrogenetic and tectonic implications. Geology 1992, 20, 641–644. [Google Scholar] [CrossRef]
  69. Hildebrand, R.S.; Whalen, J.B. Dichotomy in I- and S-type granites revisited. Geology 2018, 46, 475–478. [Google Scholar]
  70. Stern, R.J. Subduction zones. Rev. Geophys. 2002, 40, 1012. [Google Scholar] [CrossRef]
  71. Whalen, J.B.; Currie, K.L.; Chappell, B.W. A-type granites: Geochemical characteristics, discrimination and petrogenesis. Contrib. Mineral. Petrol. 1987, 95, 407–419. [Google Scholar] [CrossRef]
  72. Rollison, H.R. Petrogeochemistry; Yang, X.M.; Yang, X.Y.; Chen, S.X., Translators; University of Science and Technology of China Press: Hefei, China, 2000. (In Chinese) [Google Scholar]
  73. Pearce, J.A.; Harris, N.B.W.; Tindle, A.G. Trace element discrimination diagrams for the tectonic interpretation of granitic rocks. J. Petrol. 1984, 25, 956–983. [Google Scholar] [CrossRef]
  74. Harris, N.B.W.; Pearce, J.A.; Tindle, A.G. Geochemical characteristics of collision-zone magmatism. Geol. Soc. Lond. Spec. Publ. 1986, 19, 67–81. [Google Scholar] [CrossRef]
  75. Huang, H.; Zhang, Z.C.; Zhang, D.Y.; Du, H.X.; Ma, L.T.; Kang, J.L.; Xue, C.J. Petrogenesis of late carboniferous to early permian granitoid plutons in the Chinese South Tianshan: Implications for crustal accretion. Acta Geol. Sin. 2011, 85, 1305–1333, (In Chinese with English Abstract). [Google Scholar]
  76. Li, S.; Wang, T.; Wilde, S.A.; Tong, Y. Evolution, source and tectonic significance of Early Mesozoic granitoid magmatism in the Central Asian Orogenic Belt (central segment). Earth-Sci. Rev. 2013, 126, 206–234. [Google Scholar] [CrossRef]
  77. Li, Y.L.; Zhou, H.W.; Brouwer, F.M.; Xiao, W.J.; Wijbrans, J.R.; Zhong, Z.Q. Early Paleozoic to Middle Triassic divergent accretion in the Central Asian Orogenic Belt: Insights from zircon U-Pb dating of ductile shear zones in central Inner Mongolia, China. Lithos 2014, 205, 84–111. [Google Scholar] [CrossRef]
  78. Liu, J.; Liu, Z.H.; Zhao, C.; Wang, C.J.; Guan, Q.B.; Dou, S.Y. Geochemistry and U-Pb detrital zircon ages of late Permian to Early Triassic metamorphic rocks from northern Liaoning, North China: Evidence for the timing of final closure of the Paleo-Asian Ocean. J. Asian Earth Sci. 2017, 145, 460–474. [Google Scholar] [CrossRef]
  79. Yang, T. Late Permian Jiefangcun Flora from Hunchun of Jilin, China. Ph.D. Thesis, Jilin University, Changchun, China, 2010. (In Chinese with English Abstract). [Google Scholar]
  80. Shi, G.R. The marine Permian of East and Northeast Asia: An overview of biostratigraphy, palaeobiogeography and palaeogeographical implications. J. Asian Earth Sci. 2006, 26, 175–206. [Google Scholar] [CrossRef]
  81. Wu, F.Y.; Sun, D.Y.; Li, H.M.; Jahn, B.M.; Wilde, S. A-type granites in northeastern China: Age and geochemical constraints on their petrogenesis. Chem. Geol. 2002, 187, 143–173. [Google Scholar] [CrossRef]
Figure 1. Palinspastic reconstruction of the current ocean–continent framework of China and adjacent regions ((a) modified after Shi et al. [26]; sketch tectonic map of the southern Central Asian orogenic belt and the northern margin of the North China block (b), modified after Xiao et al. [3]); geological sketch map (c) and regional location map ((d) modified after Wu et al. [27]) of the study area.
Minerals 15 00736 g001
Figure 2. Macro characteristics of Permian–Triassic magmatic rocks in the study area.
Minerals 15 00736 g002
Figure 3. Micro characteristics under CPL of Permian–Triassic magmatic rocks in the study area Qtz—quartz; Pl—plagioclase; Fsp—feldspar; Mus—muscovit.
Minerals 15 00736 g003
Figure 4. Cathodoluminescence (CL) images of representative zircons of the Permian–Triassic magmatic rocks in the study areas.
Minerals 15 00736 g004
Figure 5. Zircon U-Pb concordia diagram from the Permian–Triassic magmatic rocks of the study area.
Minerals 15 00736 g005
Figure 6. SiO2 vs. total alkali (Na2O+K2O) ((a) modified after Middlemost [43]), SiO2 vs. K2O ((b) modified after Peccerillo and Taylor [44]), and A/CNK vs. A/NK ((c) modified after Maniar and Piccoli [45]) diagrams for the Permian–Triassic magmatic rocks of the study area.
Minerals 15 00736 g006
Figure 7. Chondrite-normalized REE patterns (normalization values after Taylor and McLennan [46] for the Permian–Triassic magmatic rocks of the study area.
Minerals 15 00736 g007
Figure 8. Chondrite-normalized trace element spider diagrams (normalization values after Sun and McDonough [47]) for the Permian–Triassic magmatic rocks of the study area.
Minerals 15 00736 g008
Figure 9. Correlations between Hf isotopic compositions and the formation ages ((a) after Yang et al. [51]), and εHf (t) vs. U-Pb ages for zircons (b) for the Permian–Triassic magmatic rocks of the study area.
Minerals 15 00736 g009
Figure 10. Age histogram of Permian–Triassic igneous rocks in the Changchun–Yanji belt (data sources [8,12,14,18,22,24,25,27,30,31,32,37,53,56,57,58,59,60,61,62,63,64,65,66,67]).
Minerals 15 00736 g010
Figure 11. A total of 10,000Ga/Al vs. Ce ((a) modified after Whalen et al. [71]) and Nb vs. Y Vs. Ce ((b) modified after Eby [68]) diagrams for the Permian–Triassic magmatic rocks of the study area.
Minerals 15 00736 g011
Figure 12. Y+Nb vs. Rb ((a) modified after Pearce et al. [73]), Rb/30 vs. Hf Vs. 3Ta ((b) modified after Harris et al. [74]), and R1 vs. R2 ((c) modified after Eby [68]) diagrams for the Permian–Triassic magmatic rocks of the study area.
Minerals 15 00736 g012
Table 1. Zircon LA-ICP-MS U-Pb dating results for the Permian–Triassic magmatic rocks of the study area.
Spot ppmTh/URatioAge (Ma)
PbThU206Pb/238U207Pb/235U206Pb/238U207Pb/235U
PM107-9
316.7231.9295.50.780.04120.00060.29300.0111260.33.5260.98.7
417.3231.8307.30.750.04120.00050.31550.0151260.43.3278.411.6
511.9140.9230.70.610.04130.00060.29110.0106260.83.6259.48.3
614.1187.8252.80.740.04130.00050.30670.0110260.73.2271.68.6
76.485.1113.50.750.04120.00070.31450.0153260.44.2277.711.8
813.5180.8241.30.750.04130.00050.29020.0111260.92.9258.78.7
913.8204.2241.30.850.04120.00060.28800.0103260.53.6257.08.1
108.3123.1132.50.930.04120.00060.29870.0154260.23.6265.412.0
1110.0126.8193.90.650.04120.00070.29790.0141260.04.0264.711.0
1211.9133.2237.30.560.04150.00060.28970.0116262.23.8258.39.2
1310.3133.0201.20.660.04110.00070.28570.0189259.64.2255.210.8
1510.5118.9214.80.550.04130.00060.31390.0186260.93.6277.214.4
165.961.2115.00.530.04110.00070.31090.0189259.54.3274.814.7
177.1111.2103.11.080.04110.00070.27490.0122259.94.6246.69.7
1818.8239.2345.90.690.04140.00060.30700.0102261.43.5271.87.9
1910.2111.2196.30.570.04120.00050.33180.0125260.03.3290.99.5
209.5109.2188.80.580.04120.00060.31590.0147260.43.6278.711.3
PM107-8
123.7271.5452.30.600.04260.00060.32680.0109269.13.4287.18.4
313.1130.2257.60.510.04220.00050.35500.0119266.53.3308.58.9
414.9198.6232.90.850.04180.00060.30770.0126264.23.9272.49.8
510.295.0214.10.440.04130.00050.31240.0103261.13.1276.18.0
710.9118.8214.30.550.04120.00050.30320.0117260.23.2268.99.2
818.1217.7339.60.640.04050.00040.31220.0097255.72.6275.97.5
910.8101.1223.70.450.04030.00040.32210.0103254.52.7283.57.9
1014.5151.4293.80.520.04050.00050.31950.0095255.83.0281.57.3
1120.8200.7449.50.450.04070.00050.30150.0090257.42.9267.57.1
1216.9149.6335.90.450.04240.00060.32870.0103267.43.5288.57.9
149.375.3205.60.370.04210.00050.31280.0117265.73.1276.49.1
1511.3108.6231.30.470.04160.00050.31010.0107262.83.0274.28.3
1634.8404.6665.80.610.04120.00050.30500.0074260.03.2270.35.8
1726.2403.6479.10.840.04090.00050.30560.0099258.13.0270.87.7
1910.7141.2197.60.710.04060.00050.31320.0126256.43.3276.79.8
205.061.986.20.720.04170.00060.28020.0155263.44.0250.812.3
LWY
241.9427.11025.90.420.03730.00050.30300.0086236.22.9268.86.7
58.876.3193.50.390.04000.00080.31470.0197252.84.8277.815.2
618.8204.8375.40.550.03800.00050.29560.0127240.33.4263.010.0
860.71216.31256.60.970.03920.00160.27020.0261248.19.9242.820.9
921.8366.2274.91.330.03830.00070.28190.0136242.64.1252.110.7
105.856.1115.00.490.03850.00080.27190.0188243.45.2244.215.0
1270.31165.61095.31.060.03840.00060.26560.0084242.93.5239.16.8
1315.0158.6272.50.580.03930.00070.30900.0130248.44.1273.410.1
1427.3311.0542.60.570.03840.00050.28780.0110242.93.2256.88.7
1522.9461.5308.31.500.03930.00080.26790.0137248.75.0241.011.0
1622.1227.4426.30.530.03930.00070.29980.0118248.74.6266.39.2
1718.3176.8364.80.480.03930.00070.26990.0115248.54.2242.69.2
1813.7141.5255.80.550.03930.00070.30840.0138248.74.5273.010.7
198.6105.5165.20.640.03900.00080.29350.0190246.65.0261.314.9
207.877.5150.70.510.03900.00070.31100.0223246.44.5275.017.3
PM201-5
17.1101.9119.90.850.03920.00080.29880.0203248.15.1265.515.9
421.7262.5455.90.580.03810.00060.27470.0104241.23.5246.48.3
613.0118.9238.70.500.03970.00070.30300.0140250.74.6268.810.9
729.3361.6608.70.590.03870.00050.25720.0083244.93.2232.46.7
1013.6198.9226.90.880.03900.00130.27620.0141246.68.2247.611.2
1328.6397.1482.50.820.03800.00060.29400.0119240.23.9261.79.3
1414.2195.1256.70.760.03840.00070.28350.0167242.74.4253.413.2
1929.0431.8468.20.920.03840.00060.27850.0101242.93.7249.58.1
2123.2317.3399.70.790.03780.00060.28100.0134239.33.7251.510.6
2228.7496.9430.11.160.03940.00060.26030.0107248.83.9234.98.6
2515.1108.5259.20.420.03870.00080.29920.0172244.64.9265.713.4
PM202-6
334.7491.8647.40.760.03800.00050.31260.0107240.53.3276.28.3
518.7217.2240.20.900.03830.00060.61620.0373242.53.8487.523.4
6124.82196.71630.81.350.03800.00050.42180.0087240.73.0357.36.2
724.2347.1450.30.770.03790.00040.27710.0096239.82.7248.37.6
8117.61904.11511.51.260.03890.00070.47020.0100246.14.2391.36.9
1032.3548.7500.51.100.03800.00050.28900.0093240.13.4257.87.3
12288.74512.93751.61.200.03780.00100.47470.0176239.36.0394.412.1
16116.51802.51784.21.010.03810.00070.31760.0102240.84.1280.17.8
17192.93550.62313.31.530.03820.00070.40290.0181241.44.5343.813.1
1928.0387.9523.20.740.03790.00060.24560.0110240.03.8223.09.0
2018.2262.6343.00.770.03790.00060.25400.0120239.93.8229.89.7
SSGC
127.3389.0549.80.710.03640.00050.25230.0072230.62.9228.55.8
218.5277.0346.40.800.03650.00050.26220.0095231.23.2236.57.6
329.8440.3567.80.780.03620.00040.23850.0070229.22.5217.25.7
414.8225.0285.80.790.03650.00050.26750.0106231.43.2240.78.5
639.3608.6733.70.830.03660.00040.25820.0072231.82.7233.25.8
755.0963.2865.41.110.03640.00070.26910.0117230.34.2242.09.3
1013.2210.8253.60.830.03610.00060.23640.0170228.93.9215.513.9
1219.6306.5344.00.890.03650.00060.27120.0110231.13.5243.78.8
1326.0407.1509.80.800.03600.00040.25600.0076228.32.5231.46.2
1446.4777.8819.50.950.03620.00040.27570.0084229.22.6247.26.7
1841.7586.5832.30.700.03630.00060.27040.0080229.83.4243.06.4
2019.7301.4366.30.820.03650.00050.25250.0086231.33.4228.67.0
Table 2. Major (wt%) and trace (×10−6) elements for the Permian–Triassic of magmatic rocks of the study area.
SamplePM107-9 PM107-8LWY
YQ1YQ2YQ3YQ4YQ1YQ2YQ3YQ4YQ1YQ2YQ3YQ4YQ5
SiO276.17 75.99 75.00 76.20 65.33 65.59 66.19 65.38 64.08 64.24 63.23 63.57 63.01
Al2O312.69 12.83 12.98 12.65 14.09 13.90 13.94 14.39 15.50 15.29 15.70 15.39 15.02
Fe2O31.62 1.53 2.08 1.49 4.41 3.96 3.85 3.49 7.04 6.39 7.51 7.57 7.24
FeO0.22 0.25 0.47 0.31 2.06 2.69 2.66 2.69 1.34 1.46 0.91 1.20 1.30
CaO3.40 3.62 3.11 3.18 5.41 4.81 4.10 4.33 1.43 1.38 1.54 1.15 1.67
MgO0.51 0.52 0.52 0.51 1.74 1.75 1.44 1.73 2.16 2.21 2.62 2.15 2.88
K2O2.06 2.13 1.62 2.17 2.06 2.07 1.90 1.93 2.16 2.28 2.28 2.35 2.54
Na2O1.31 1.24 2.26 1.59 2.66 2.27 2.98 2.84 3.28 3.67 3.40 3.24 3.36
TiO20.19 0.16 0.27 0.17 0.85 0.82 0.92 0.80 1.34 1.02 1.24 1.24 1.17
P2O50.01 0.02 0.04 0.01 0.16 0.14 0.15 0.19 0.42 0.24 0.37 0.35 0.38
MnO0.08 0.08 0.08 0.08 0.17 0.16 0.14 0.14 0.15 0.14 0.15 0.17 0.18
LOI1.74 1.63 1.58 1.62 1.07 1.85 1.73 2.09 1.11 1.68 1.05 1.62 1.25
A/NK2.90 2.95 2.37 2.55 2.13 2.33 2.01 2.13 2.00 1.80 1.95 1.96 1.81
A/CNK1.20 1.17 1.17 1.18 0.86 0.94 0.97 0.98 1.50 1.39 1.45 1.55 1.33
σ0.34 0.34 0.47 0.42 0.99 0.82 1.01 1.00 1.38 1.64 1.57 1.49 1.71
K2O/Na2O1.58 1.71 0.71 1.36 0.78 0.91 0.64 0.68 0.66 0.62 0.67 0.72 0.76
K2O+Na2O3.37 3.37 3.88 3.76 4.72 4.34 4.88 4.77 5.44 5.95 5.68 5.59 5.90
FeOT1.69 1.63 2.36 1.67 6.08 6.31 6.17 5.89 7.81 7.33 7.78 8.12 7.89
Mg#31.72 32.77 28.17 30.02 33.89 34.61 29.56 34.66 33.43 31.41 26.96 28.50 39.67
Li11.85 10.21 10.84 10.67 22.41 21.32 19.53 24.96 19.99 33.88 17.27 19.38 17.13
Be4.27 4.78 2.86 4.65 1.61 1.47 1.48 1.61 1.74 1.36 1.37 1.40 1.27
Sc3.94 3.79 6.77 3.89 20.70 19.13 19.57 20.00 24.47 20.51 23.31 22.01 22.25
V17.28 17.39 31.83 18.06 98.45 104.26 111.64 100.53 72.55 84.01 52.08 53.85 55.44
Cr20.28 21.61 21.10 20.39 22.24 17.97 22.76 21.16 24.72 56.15 29.52 21.26 21.62
Co5.05 5.99 6.85 6.00 13.93 15.58 14.80 15.46 15.83 13.87 14.85 14.33 13.02
Ni4.66 3.36 4.43 3.68 4.68 3.81 11.54 3.95 4.93 15.97 7.97 5.71 4.47
Ga21.64 21.70 18.32 21.73 19.28 18.30 16.90 19.28 20.60 19.86 21.09 19.98 19.67
Rb48.80 48.27 38.06 52.31 55.02 56.75 47.38 51.34 101.31 55.33 58.68 58.28 46.27
Sr225.17 245.73 254.14 233.84 358.28 299.84 274.13 306.88 112.77 179.48 177.74 143.88 131.33
Zr234.52 222.78 213.80 223.89 180.99 165.32 174.96 198.89 219.70 241.30 199.98 260.59 217.29
Nb22.05 19.84 16.03 19.76 6.86 5.89 5.03 7.17 5.51 6.16 6.27 4.99 5.70
Hf7.81 7.47 7.26 7.57 5.20 4.91 4.94 5.77 6.26 6.97 5.67 6.08 6.19
Ta1.41 1.32 1.23 1.29 0.49 0.32 0.28 0.33 0.59 0.41 0.42 0.19 0.40
Th12.42 12.57 13.16 12.12 6.37 4.67 3.84 5.48 3.97 4.61 3.53 3.14 3.24
U3.07 3.03 1.92 2.83 1.49 1.04 0.96 1.38 1.10 1.10 1.40 0.87 0.97
Ba313.52 339.84 217.84 344.22 412.87 370.38 323.10 396.34 561.34 350.71 339.27 321.97 319.39
La53.09 51.58 36.42 46.57 22.09 17.41 17.51 24.67 26.23 17.62 23.77 22.91 18.45
Ce103.40 102.20 71.96 92.47 44.67 36.60 35.71 48.88 38.35 38.38 41.32 38.09 38.99
Pr12.39 12.60 9.53 11.48 6.52 5.11 5.11 6.95 8.42 5.70 7.99 6.94 6.16
Nd43.17 44.49 34.94 41.34 27.69 21.35 21.98 29.12 36.55 24.67 34.68 29.77 28.44
Sm7.77 8.08 6.45 7.61 6.07 4.89 4.93 6.23 7.57 5.51 7.53 6.21 6.60
Eu0.62 0.64 0.84 0.71 1.69 1.42 1.51 1.82 2.20 1.62 2.10 1.68 2.02
Gd6.93 7.05 5.70 6.86 5.59 4.58 4.78 5.89 6.53 4.88 6.45 5.49 6.44
Tb1.17 1.20 0.98 1.19 0.96 0.82 0.86 1.02 1.07 0.90 1.05 0.95 1.11
Dy7.17 7.30 5.87 7.28 5.94 4.93 5.15 6.26 6.02 5.71 5.96 5.78 6.57
Ho1.48 1.52 1.21 1.53 1.20 1.04 1.08 1.29 1.19 1.23 1.21 1.16 1.35
Er4.49 4.61 3.60 4.63 3.41 2.89 3.02 3.74 3.21 3.49 3.11 3.34 3.92
Tm0.82 0.85 0.66 0.83 0.58 0.52 0.52 0.59 0.53 0.62 0.54 0.53 0.63
Yb5.44 5.69 4.34 5.48 3.69 3.22 3.29 3.95 3.44 3.82 3.27 3.45 3.90
Lu0.82 0.82 0.64 0.79 0.53 0.48 0.46 0.58 0.51 0.58 0.47 0.51 0.58
Y41.27 42.54 33.04 42.22 32.99 27.98 29.78 35.26 35.30 37.13 32.68 36.72 39.66
ΣREE248.76 248.63 183.12 228.77 130.63 105.25 105.92 141.00 141.82 114.72 139.46 126.81 125.15
LREE220.44 219.58 160.13 200.19 108.72 86.78 86.76 117.66 119.32 93.50 117.39 105.61 100.65
HREE28.33 29.05 22.99 28.59 21.90 18.47 19.16 23.33 22.50 21.22 22.06 21.21 24.50
LREE/HREE7.78 7.56 6.97 7.00 4.96 4.70 4.53 5.04 5.30 4.41 5.32 4.98 4.11
LaN/YbN6.60 6.13 5.67 5.74 4.05 3.65 3.59 4.22 5.15 3.12 4.91 4.48 3.20
δEu0.26 0.26 0.42 0.30 0.89 0.92 0.95 0.92 0.96 0.96 0.92 0.88 0.95
δCe0.94 0.94 0.90 0.94 0.87 0.91 0.88 0.87 0.60 0.90 0.70 0.71 0.86
SamplePM201-5PM202-6 SSGC
YQ1YQ2YQ3YQ4YQ5YQ1YQ2YQ3YQ4YQ1YQ2YQ3YQ4YQ5
SiO266.99 68.30 67.88 67.79 67.68 78.14 77.77 78.25 78.33 75.62 77.49 77.05 77.42 76.83
Al2O315.47 14.03 14.21 14.82 15.11 11.57 11.84 11.42 11.78 12.88 11.94 12.24 12.17 12.45
Fe2O32.52 2.88 3.05 3.06 3.15 0.80 1.09 0.83 0.96 1.25 0.88 0.98 0.89 1.04
FeO0.74 0.62 0.65 0.57 0.58 0.13 0.10 0.22 0.05 0.13 0.09 0.14 0.13 0.05
CaO2.76 3.21 2.89 2.54 2.79 0.44 0.58 0.51 0.34 0.70 0.67 0.56 0.47 0.58
MgO1.20 0.77 0.95 0.92 0.88 0.46 0.23 0.37 0.17 0.41 0.38 0.35 0.07 0.03
K2O3.65 4.45 4.12 4.08 4.28 4.59 4.44 4.08 4.42 3.99 3.78 3.81 3.81 4.20
Na2O4.14 3.73 3.70 3.67 3.68 3.42 3.67 4.01 3.58 4.12 3.91 3.97 3.99 4.00
TiO20.62 0.47 0.55 0.55 0.60 0.12 0.13 0.12 0.12 0.09 0.07 0.08 0.08 0.08
P2O50.13 0.08 0.12 0.10 0.11 0.02 0.02 0.02 0.01 0.05 0.03 0.04 0.04 0.04
MnO0.10 0.14 0.12 0.12 0.11 0.01 0.02 0.02 0.01 0.19 0.12 0.17 0.15 0.19
LOI1.69 1.31 1.76 1.78 1.04 0.31 0.12 0.16 0.24 0.56 0.65 0.64 0.77 0.52
A/NK1.44 1.28 1.35 1.42 1.41 1.09 1.09 1.04 1.10 1.16 1.14 1.15 1.14 1.12
A/CNK0.98 0.84 0.90 0.98 0.96 1.02 1.00 0.96 1.04 1.04 1.02 1.05 1.05 1.02
σ2.49 2.62 2.43 2.39 2.55 1.82 1.89 1.86 1.81 2.02 1.71 1.77 1.77 1.99
K2O/Na2O0.88 1.19 1.11 1.11 1.16 1.34 1.21 1.02 1.23 0.97 0.97 0.96 0.95 1.05
K2O+Na2O7.79 8.18 7.83 7.75 7.96 8.00 8.11 8.09 8.00 8.12 7.68 7.78 7.81 8.21
FeOT3.02 3.23 3.42 3.34 3.44 0.85 1.08 0.96 0.91 1.27 0.89 1.02 0.93 0.99
Mg#42.78 38.13 36.15 36.04 33.65 46.59 27.08 40.51 24.56 36.57 46.93 38.08 34.95 36.37
Li13.30 1.63 16.42 15.67 15.03 8.06 5.15 5.91 5.86 31.27 25.01 29.95 33.38 30.43
Be2.61 1.85 2.58 2.50 2.74 4.40 3.61 3.95 3.45 3.55 3.20 3.22 3.93 3.93
Sc8.07 7.66 9.36 9.55 9.53 2.44 2.20 1.84 2.31 4.41 3.99 4.00 4.69 4.16
V85.35 54.79 93.71 90.77 88.88 8.12 6.98 7.20 7.17 5.58 3.81 4.09 4.06 3.94
Cr5.93 7.19 11.59 13.35 14.94 34.09 38.65 30.27 34.51 25.70 41.43 38.66 34.19 44.00
Co2.91 2.61 3.11 2.90 3.23 3.35 3.34 4.64 3.61 1.66 1.52 1.74 1.92 1.68
Ni1.15 0.74 1.03 1.16 1.09 11.36 14.92 10.39 12.50 11.49 14.79 11.57 9.94 11.12
Ga16.78 15.54 18.25 18.22 18.95 16.69 17.56 16.65 17.43 25.03 23.86 24.99 26.25 25.70
Rb116.80 66.14 129.89 127.40 134.10 197.72 155.15 162.76 197.77 267.48 280.09 279.67 279.26 282.90
Sr110.50 158.65 162.65 167.34 154.18 79.69 49.11 51.89 54.98 22.54 17.17 17.48 17.38 17.25
Zr343.68 258.60 310.59 308.09 327.15 81.11 95.57 91.89 95.85 35.79 31.62 34.38 32.49 30.88
Nb14.42 11.70 12.43 11.99 13.02 17.10 13.59 14.24 16.44 53.89 86.73 57.25 66.26 55.86
Hf9.34 7.29 8.68 8.38 9.04 4.36 4.02 4.54 3.14 2.53 2.42 2.41 1.98 2.66
Ta0.77 0.36 0.83 0.72 0.99 1.81 1.57 1.85 0.69 8.25 6.37 4.48 7.78 7.86
Th8.65 10.48 14.39 13.74 15.02 22.78 20.17 22.82 22.45 10.09 9.05 11.07 12.00 9.79
U2.62 2.46 2.71 2.87 3.10 1.73 1.62 1.84 1.59 2.22 2.50 2.40 2.23 2.13
Ba701.81 548.64 799.68 642.20 798.86 6.68 72.25 59.46 92.51 72.35 70.71 90.23 12.31 75.74
La31.36 35.42 46.97 44.58 41.52 23.31 25.81 23.71 11.56 6.37 6.34 7.06 5.99 7.27
Ce62.99 69.23 95.73 90.08 83.10 37.39 40.28 39.41 21.53 17.84 15.78 17.70 15.43 20.24
Pr8.35 9.00 12.09 11.33 10.75 4.85 5.22 4.79 2.91 2.35 2.43 2.71 2.20 3.25
Nd33.25 35.99 46.89 43.81 41.75 16.71 17.30 16.25 12.93 8.30 8.72 9.89 8.42 12.31
Sm6.40 6.83 8.96 8.24 8.06 2.74 2.77 3.83 2.71 4.34 3.59 4.66 4.00 6.00
Eu1.48 1.48 2.12 1.93 1.95 0.25 0.32 0.37 0.41 0.05 0.06 0.09 0.07 0.05
Gd5.53 5.78 7.56 7.06 6.81 2.26 2.35 2.27 2.59 3.60 3.35 4.46 3.45 5.49
Tb0.93 0.95 1.16 1.06 1.04 0.39 0.42 0.34 0.45 0.92 0.85 0.93 0.91 1.29
Dy4.98 4.90 6.29 6.02 5.69 2.26 2.50 2.25 2.51 4.74 4.77 4.69 4.64 5.75
Ho1.00 0.96 1.45 1.37 1.17 0.44 0.60 0.54 0.48 0.71 0.60 0.63 0.59 0.88
Er3.03 2.77 3.91 3.74 3.48 1.43 1.39 1.47 1.73 1.53 1.39 1.50 1.27 1.87
Tm0.52 0.46 0.68 0.64 0.64 0.22 0.16 0.30 0.23 0.17 0.13 0.18 0.15 0.32
Yb3.73 3.16 4.27 4.19 4.17 1.74 1.59 1.61 1.40 0.94 1.12 1.26 1.27 1.73
Lu0.60 0.49 0.66 0.65 0.67 0.26 0.27 0.25 0.25 0.12 0.16 0.18 0.15 0.22
Y24.88 25.37 37.06 35.07 31.82 13.69 15.13 14.17 16.27 25.95 25.28 25.90 26.49 25.81
ΣREE164.14 177.41 238.74 224.69 210.80 94.25 100.98 97.41 61.68 51.98 49.30 55.94 48.54 66.67
LREE143.81 157.95 212.76 199.97 187.13 85.25 91.70 88.37 52.04 39.24 36.92 42.11 36.11 49.12
HREE20.33 19.47 25.99 24.72 23.67 9.00 9.29 9.04 9.64 12.73 12.38 13.83 12.43 17.55
LREE/HREE7.07 8.11 8.19 8.09 7.90 9.47 9.88 9.78 5.40 3.08 2.98 3.04 2.90 2.80
LaN/YbN5.68 7.58 7.43 7.19 6.72 9.03 10.98 9.94 5.57 4.56 3.82 3.79 3.19 2.84
δEu0.76 0.72 0.79 0.77 0.80 0.31 0.38 0.39 0.47 0.04 0.05 0.06 0.06 0.03
δCe0.91 0.91 0.94 0.94 0.92 0.82 0.81 0.87 0.87 1.08 0.94 0.95 0.99 0.98
Table 3. Zircon in situ Hf isotope data for the magmatic rocks of the study area.
SampleAge (Ma)176Yb/177Hf176Lu/177Hf176Hf/177Hf εHf(0)εHf(t)TDM1(Ma)TDM2(Ma)fLu/Hf
SSGC
1230.6 ± 2.90.0216 0.0008 0.282788 0.570.57653.7 1046.2 −0.98
2231.2 ± 3.20.0143 0.0005 0.282752 −0.69−0.69699.3 1126.6 −0.98
3229.2 ± 2.50.0260 0.0009 0.282773 0.050.05677.1 1079.4 −0.97
4231.4 ± 3.20.0162 0.0006 0.282781 0.330.33660.2 1061.5 −0.98
6231.8 ± 2.70.0221 0.0009 0.282744 −0.97−0.97716.5 1144.5 −0.97
7230.3 ± 4.20.0285 0.0012 0.282808 1.281.28631.8 1001.0 −0.96
10228.9 ± 3.90.0191 0.0007 0.282749 −0.80−0.80706.4 1133.4 −0.98
12231.1 ± 3.50.0177 0.0006 0.282765 −0.24−0.24683.2 1097.9 −0.98
14229.2 ± 2.60.0174 0.0006 0.282757 −0.52−0.52694.1 1115.9 −0.98
18229.8 ± 3.40.0167 0.0006 0.282802 1.071.07631.2 1014.6 −0.98
PM202-6
3240.5 ± 3.30.0269 0.0012 0.282915 5.065.06479.9 759.7 −0.96
7239.8 ± 2.70.0233 0.0009 0.282789 0.600.60653.5 1044.1 −0.97
10240.1 ± 3.40.0325 0.0014 0.282876 3.673.67538.1 848.4 −0.96
16240.8 ± 4.10.0981 0.0034 0.282944 6.106.10465.7 693.7 −0.90
19240.0 ± 3.80.0216 0.0008 0.282775 0.100.10672.1 1075.9 −0.98
20239.9 ± 3.80.0253 0.0009 0.282751 −0.73−0.73707.5 1128.9 −0.97
PM201-5
4241.2 ± 3.50.0236 0.0008 0.282775 0.090.09673.0 1076.7 −0.98
7244.9 ± 3.20.0196 0.0007 0.282751 −0.74−0.74704.6 1129.7 −0.98
10246.6 ± 8.20.0183 0.0007 0.282840 2.392.39579.7 930.5 −0.98
13240.2 ± 3.90.0267 0.0010 0.282666 −3.76−3.76829.7 1321.4 −0.97
14242.7 ± 4.40.0370 0.0013 0.282809 1.311.31633.6 999.1 −0.96
19242.9 ± 3.70.0183 0.0007 0.282664 −3.82−3.82826.2 1325.5 −0.98
22248.8 ± 3.90.0234 0.0009 0.282867 3.363.36544.4 868.5 −0.97
25244.6 ± 4.90.0256 0.0009 0.282604 −5.95−5.95915.8 1460.5 −0.97
LWY
6252.8 ± 4.80.0368 0.0014 0.282646 −4.44−4.44866.5 1364.7 −0.96
6240.3 ± 3.40.0476 0.0018 0.282961 6.686.68421.2 656.5 −0.95
8248.1 ± 9.90.0389 0.0014 0.282691 −2.88−2.88803.4 1265.3 −0.96
9242.6 ± 4.10.0515 0.0020 0.282909 4.854.85499.6 773.6 −0.94
10243.4 ± 5.20.0439 0.0016 0.282908 4.814.81496.1 776.1 −0.95
13248.4 ± 4.10.0296 0.0012 0.282906 4.734.73493.0 780.7 −0.96
14242.9 ± 3.20.0388 0.0015 0.282932 5.665.66459.7 721.7 −0.95
15248.7 ± 5.00.0295 0.0010 0.282801 1.031.03639.7 1017.0 −0.97
16248.7±4.60.0569 0.0021 0.282934 5.725.72464.2 717.6 −0.94
18248.7 ± 4.60.0530 0.0020 0.282840 2.402.40600.4 929.6 −0.94
PM107-8
4264.2 ± 3.90.0346 0.0014 0.282952 6.386.38429.5 675.5 −0.96
5261.1 ± 3.10.0465 0.0018 0.282947 6.196.19442.1 687.6 −0.94
7260.2 ± 3.20.0284 0.0014 0.282983 7.467.46385.4 606.7 −0.96
10255.8 ± 3.00.0334 0.0014 0.282910 4.884.88489.2 771.3 −0.96
11257.4 ± 2.90.0520 0.0021 0.282978 7.307.30399.1 617.0 −0.94
12267.4 ± 3.50.0555 0.0021 0.282856 2.982.98577.5 892.7 −0.94
14265.7 ± 3.10.0354 0.0013 0.282942 6.036.03442.5 698.2 −0.96
15262.8 ± 3.00.0311 0.0013 0.282926 5.435.43465.6 736.0 −0.96
16260.0 ± 3.20.0507 0.0018 0.282833 2.172.17606.5 944.5 −0.95
PM107-9
3260.3 ± 3.50.0660 0.0023 0.282636 −4.81−4.81902.7 1388.1 −0.93
4260.4 ± 3.30.0760 0.0027 0.282676 −3.39−3.39853.9 1297.5 −0.92
5260.8 ± 3.60.0586 0.0020 0.282690 −2.88−2.88816.7 1265.6 −0.94
6260.7 ± 3.20.0630 0.0022 0.282601 −6.04−6.04952.8 1465.8 −0.93
7260.4 ± 4.20.0823 0.0028 0.282606 −5.88−5.88960.5 1455.4 −0.92
9260.5 ± 3.60.0966 0.0031 0.282655 −4.13−4.13896.0 1344.4 −0.91
10260.2 ± 3.60.0472 0.0020 0.282655 −4.14−4.14868.2 1345.1 −0.94
11260.0 ± 4.00.0531 0.0019 0.282583 −6.70−6.70970.0 1507.4 −0.94
12262.2 ± 3.80.0579 0.0019 0.282650 −4.33−4.33874.4 1357.1 −0.94
Disclaimer/Publisher’s Note: The statements, opinions and data contained in all publications are solely those of the individual author(s) and contributor(s) and not of MDPI and/or the editor(s). MDPI and/or the editor(s) disclaim responsibility for any injury to people or property resulting from any ideas, methods, instructions or products referred to in the content.

