Article

Reassessment of Heavy Metal Adsorption Performance in Halloysite Clay Nanotubes: Geographical Variation and Structure–Activity Relationship

1
School of Railway Architecture, Hunan Technical College of Railway High-Speed, Hengyang 421002, China
2
College of Environmental Science and Engineering, Hunan University, Changsha 410082, China
3
School of Railway Engineering, Hunan Technical College of Railway High-Speed, Hengyang 421002, China
*
Author to whom correspondence should be addressed.
Minerals 2025, 15(7), 739; https://doi.org/10.3390/min15070739
Submission received: 9 June 2025 / Revised: 4 July 2025 / Accepted: 11 July 2025 / Published: 15 July 2025
(This article belongs to the Section Clays and Engineered Mineral Materials)

Abstract

Halloysite nanotubes, a naturally occurring nanomaterial with a unique tubular morphology, have shown considerable potential for heavy metal remediation. However, significant inconsistencies in the reported maximum adsorption capacities (qmax) for heavy metal ions—such as Pb2+, which ranges from 7.5 to 84.0 mg/g with a coefficient of variation (CV) of 68%—have severely hindered both scientific understanding and practical application of this promising material. To address this critical knowledge gap, we conducted a reassessment using carefully selected halloysite specimens from three geologically distinct deposits (Utah, USA; Henan and Yunnan, China). Under rigorously controlled experimental conditions, we precisely quantified the adsorption capacities of halloysite for Cd2+, Zn2+, and Pb2+. Through an integrated multi-technique characterization approach involving XRF, XRD, FTIR, TEM, and BET analyses, we identified two fundamental crystallochemical parameters that govern the adsorption performance of halloysite: the degree of lattice substitution and the density of surface hydroxyl groups. Our findings reveal that optimal heavy metal adsorption occurs in halloysite with lower lattice substitution and higher surface hydroxyl density. This work not only provides a reliable range of adsorption capacities for halloysite but, more importantly, establishes a scientific foundation for optimizing the application of halloysite in heavy metal remediation.

1. Introduction

Clay minerals are widely recognized for their remarkable heavy metal adsorption capacity. This adsorption capability primarily stems from their unique charge characteristics: on the one hand, the permanent charge generated by lattice substitution enables clay minerals to adsorb heavy metal cations through Coulombic interactions and hydrogen bonding, etc.; on the other hand, the variable charge arising from surface hydroxyl groups allows clay minerals to form short-range ionic bonds or direct covalent coordination with heavy metal cations [1]. Compared to artificially modified clay adsorbents [2,3,4], natural clay minerals offer significant advantages, such as low cost, high renewability, and environmental friendliness, and have been widely applied in environmental remediation projects, such as heavy metal wastewater treatment and soil pollution remediation [5,6].
Halloysite (Al2Si2O5(OH)4·nH2O), a distinct 1:1 dioctahedral clay mineral in the kaolinite group, has attracted growing research interest in recent years owing to its naturally occurring nanotubular morphology (tube length: 0.2–1.5 μm; outer diameter: 50–100 nm; inner lumen: 10–30 nm) [7,8]. From a crystallographic perspective, halloysite nanotubes can be regarded as a special form resulting from the curling mechanism of kaolinite’s layered structure [9,10]. Halloysite resources are widely distributed globally, with industrial-grade deposits found in regions such as the United States, China, Ukraine, and France, etc. [11,12]. Toxicological studies have shown that halloysite exhibits excellent biocompatibility and extremely low cytotoxicity, making it a recognized safe and reliable natural nanomaterial [13,14]. Given its unique nanotube structure and environmentally friendly properties, systematic research on its heavy metal adsorption performance and mechanisms is not only of great theoretical significance but also provides a scientific basis for its practical application in environmental remediation projects.
Recent studies have demonstrated the adsorption capacity of natural halloysite for heavy metal ions, such as Cd2+, Zn2+, Pb2+, and Cu2+ [15,16,17,18,19,20]. However, significant variations have been observed in the reported adsorption capacities across different studies, with the maximum adsorption capacity (qₘₐₓ) for Pb2+ showing particularly wide fluctuations ranging from 7.5 to 84.0 mg/g (CV = 68%), while similarly notable dispersion was evident for Cd2+ (0.5–2.1 mg/g, CV = 92%), Zn2+ (0.1–9.8 mg/g, CV = 145%), and Cu2+ (1.1–23.9 mg/g, CV = 118%). These discrepancies may primarily stem from two factors. First, variations in experimental conditions, such as temperature, pH, background electrolyte composition, ionic strength, initial adsorbate concentration, and adsorbent dosage, can significantly alter the physicochemical environment at adsorption interfaces, thereby modulating the adsorption process [21]. Second, inherent differences in halloysite samples from diverse geological sources play a crucial role. Variations in lattice substitution, surface chemical properties (particularly surface hydroxyl group density), and associated impurity profiles may directly influence the binding affinity and adsorption mechanisms of heavy metal ions, ultimately leading to substantial differences in observed adsorption capacities.
To address these uncertainties, we conducted a systematic investigation using representative halloysite samples from three major deposits, with montmorillonite and kaolinite as reference materials. Through implementation of rigorously controlled experimental conditions, we established reliable qₘₐₓ values for Cd2+, Zn2+, and Pb2+ adsorption by halloysite. Furthermore, a comprehensive structural characterization for three halloysite samples elucidated the structure–activity relationships governing the variations in heavy metal adsorption performance at the crystallochemical level.

2. Materials and Methods

2.1. Chemical Reagents

All chemicals used in this study were of analytical grade: nitric acid (HNO3, 98%) and sodium hydroxide (NaOH, ≥99.0%) were purchased from Shanghai Aladdin Biochemical Technology Co., Ltd. (Shanghai, China); sodium nitrate (NaNO3, ≥99.0%), cadmium nitrate tetrahydrate (Cd(NO3)2·4H2O, ≥99.0%), zinc nitrate (Zn(NO3)2, ≥99.0%), and lead nitrate (Pb(NO3)2, ≥99.0%) were obtained from Sinopharm Chemical Reagent Co., Ltd. (Shanghai, China). All solutions were prepared using ultrapure water (resistivity > 18.2 MΩ·cm at 25 °C). Prior to use, all glassware was soaked in 10% (v/v) HNO3 for 24 h and thoroughly rinsed three times with ultrapure water.
In this study, three halloysite samples were designated as follows: HU (commercially obtained from Sigma-Aldrich, USA; origin: Dragon Mine, UT, USA), HY (purchased from Guangzhou Runwo Nano Technology Co., Guangzhou, China; origin: Yunnan Province, China), and HH (collected from Henan Province, China, and subsequently purified). For comparative purposes, reference samples of montmorillonite (designated M; purchased from Jiuding Chemical Reagent Co., Ltd. (Shanghai, China)) and kaolinite (designated K; obtained from Sinopharm Chemical Reagent Co., Ltd. (Shanghai, China)) were employed (Figure 1a,b). The preparation process for mineral samples was as follows: the HH sample was obtained after purification of the original ore (see Section 2.2); the HU, HY, K, and M samples were used without further purification, being dried overnight at 80 °C and stored in a desiccator prior to use.

2.2. Mineral Purification

The purification procedure for the HH sample followed established protocols [22,23], comprising five key steps: drying and grinding, deionized water washing for salt removal, alkaline dispersion for impurity separation, acidic flocculation for concentration, and final sieving, as detailed below.
First, the raw halloysite ore (Figure 1c,d) was dried overnight at 70 °C. After complete moisture evaporation, the material was gently ground into fine powder using an agate mortar. Approximately 150 g of the powdered sample was transferred into a 1 L graduated cylinder containing 800 mL of deionized water (Figure 1e). Following thorough mixing and 1 h settling, the supernatant was carefully decanted via siphonation. This washing procedure was repeated three times to effectively remove soluble salts. Then, the desalted halloysite slurry was redispersed in 800 mL diluted NaOH solution (pH 11) within a 1 L cylinder (Figure 1f). Under these alkaline conditions, the deprotonation process (yielding a ζ–potential of approximately −45 mV on nanotubes [24]) enhanced the surface charge of halloysite and electrostatic repulsion forces, resulting in stable colloidal dispersion. After 10 min settling, the coarse impurities (e.g., quartz, mica, feldspar, illite, rutile, and iron-containing minerals) sedimented due to Stokes’ gravitational settling, allowing the upper halloysite colloidal solution to be siphoned off while discarding the lower sediment layer. Then, the purified colloidal solution was transferred to a 1 L cylinder (Figure 1g), where acidification to pH ≈ 3 reduced the surface charge (yielding a ζ–potential approaching 0 mV on nanotubes [24]) and electrostatic repulsion, thereby destabilizing the colloid and promoting halloysite flocculation. Following sedimentation, the supernatant was removed via siphonation, and the concentrated slurry (Figure 1h) was transferred to a crucible for overnight drying at 70 °C. Finally, the dried material was gently ground and sequentially sieved through 100-mesh (150 μm) and 200-mesh (74 μm) screens to obtain the final HH sample, which was stored in a desiccator for subsequent use.

2.3. Structural Characterization and Compositional Analysis of Minerals

The morphology of mineral samples was characterized using field emission scanning electron microscope (SEM: JSM-6700F, JEOL Ltd., Tokyo, Japan). Samples were mounted on aluminum stubs with conductive adhesive and sputter-coated with gold for 120 s prior to imaging. Transmission electron microscopy (TEM: JEM-2100plus, JEOL Ltd., Tokyo, Japan) was employed to investigate the crystalline phases and microstructural features of minerals. For TEM analysis, samples were ultrasonically dispersed in deionized water for 5 min and deposited onto 400-mesh copper grids. The specific surface area (SSA), pore volume, and average pore size were determined through N2 adsorption–desorption isotherm measurements using a fully automatic physical adsorption–desorption instrument (Surface Area Analyzer: ASAP 2460, Micromeritics Instrument Corporation, Norcross, GA, USA). Samples were degassed at 150 °C for 12 h before analysis, with subsequent data processing using the Brunauer–Emmett–Teller (BET) formula.
The chemical composition analysis of the mineral samples was performed via X-ray fluorescence spectroscopy (XRF: Axios mAX, Malvern Panalytical, Almelo, The Netherlands). Samples were fused with lithium borate flux in Pt/Au crucibles at 1050 °C, with the resulting glass beads subjected to XRF measurement. Mineral phase identification was conducted via X-ray diffraction (XRD: SmartLab SE, Rigaku Corporation, Tokyo, Japan) using Cu-Kα radiation, with scans performed from 5° to 90° (2θ) at a rate of 2°/min. Surface functional groups were analyzed via Fourier transform infrared spectroscopy (FTIR: Nicolet iS20, Thermo Fisher Scientific, Waltham, MA, USA). Samples for FTIR measurement were prepared by homogenizing 0.9 mg of mineral powder with 80 mg KBr, followed by pellet formation. FTIR spectra were acquired at 4 cm−1 resolution across the 4000–400 cm−1 wavenumber range.

2.4. pH Boundary Experiment (Blank Experiment)

The pH conditions significantly alter the aqueous speciation of Cd, Zn, and Pb, with hydroxide precipitation becoming predominant under alkaline conditions. Since such precipitation would severely interfere with accurate determination of adsorption capacity, preliminary blank experiments (without adsorbent) were conducted to identify the critical pH thresholds for Cd2+, Zn2+, and Pb2+ precipitation under experimental conditions prior to adsorption tests.
Working solutions (50 mg/L each of Cd2+, Zn2+, and Pb2+) were prepared by dissolving Cd(NO3)2, Zn(NO3)2, and Pb(NO3)2 in a background electrolyte solution (pH 3.0, 0.001 M NaNO3). Subsequently, under constant stirring at 25 °C, the pH was incrementally increased, with 5 mL aliquots collected at pH intervals of 3, 4, 5, 6, 7, 8, 9, and 10. These samples were immediately filtered through 0.22 μm syringe filters, and the filtrates were acidified with 2% HNO3 for stabilization prior to determining metal concentrations using inductively coupled plasma optical emission spectrometry (ICP-OES: Agilent 5100 VDV, Agilent Technologies, Santa Clara, CA, USA). The pH-dependent removal efficiency curves for Cd, Zn, and Pb were then constructed based on these measurements. Additionally, under the same background conditions (25 °C, initial heavy metal ion concentration of 50 mg/L, and ion strength of 0.001 M NaNO3), the aqueous speciation changes in Cd, Zn, and Pb along the pH gradient were calculated using Visual MINTEQ software (Version 3.1) [25].

2.5. Adsorption Equilibrium Experiment

Based on the pH boundary experiment results in Section 2.4, the background conditions for the adsorption experiment were determined as follows: pH 5.5, 25 °C, and ionic strength of 0.001 M NaNO3. In the Cd adsorption experiment, Cd(NO3)2 was first dissolved in a solution with pH 5.5 and a background ionic strength of 0.001 M NaNO3 to prepare a series of Cd2+ solutions with initial concentrations ranging from 5 to 150 mg/L. Subsequently, 20 mL of the above Cd2+ solutions was added to a 50 mL Nalgene screw-cap glass bottle containing 5 mg of adsorbent. The glass bottle was placed in a reciprocating vibrating sieve at 25 °C and 150 rpm for 24 h to achieve equilibrium. After the experiment, the suspension was filtered using a 0.22 μm syringe filter, and the Cd concentration in the filtrate was measured. The same procedure was followed for Zn and Pb adsorption experiments.
All adsorption experiments were repeated three times. During the experiment, the solution pH was measured at least three times at regular intervals and maintained at pH 5.5 by adding 0.1 M NaOH or HNO3 solution. Since the volume of the pH adjustment solution added was very small, its effect on the initial solution volume was negligible. During the experiment, significant changes in solution pH were observed. Therefore, it is essential to strictly control the solution pH to remain constant, as solution pH has a decisive influence on adsorption equilibrium.

3. Results

3.1. Structural Characterization of Minerals

3.1.1. TEM and SEM

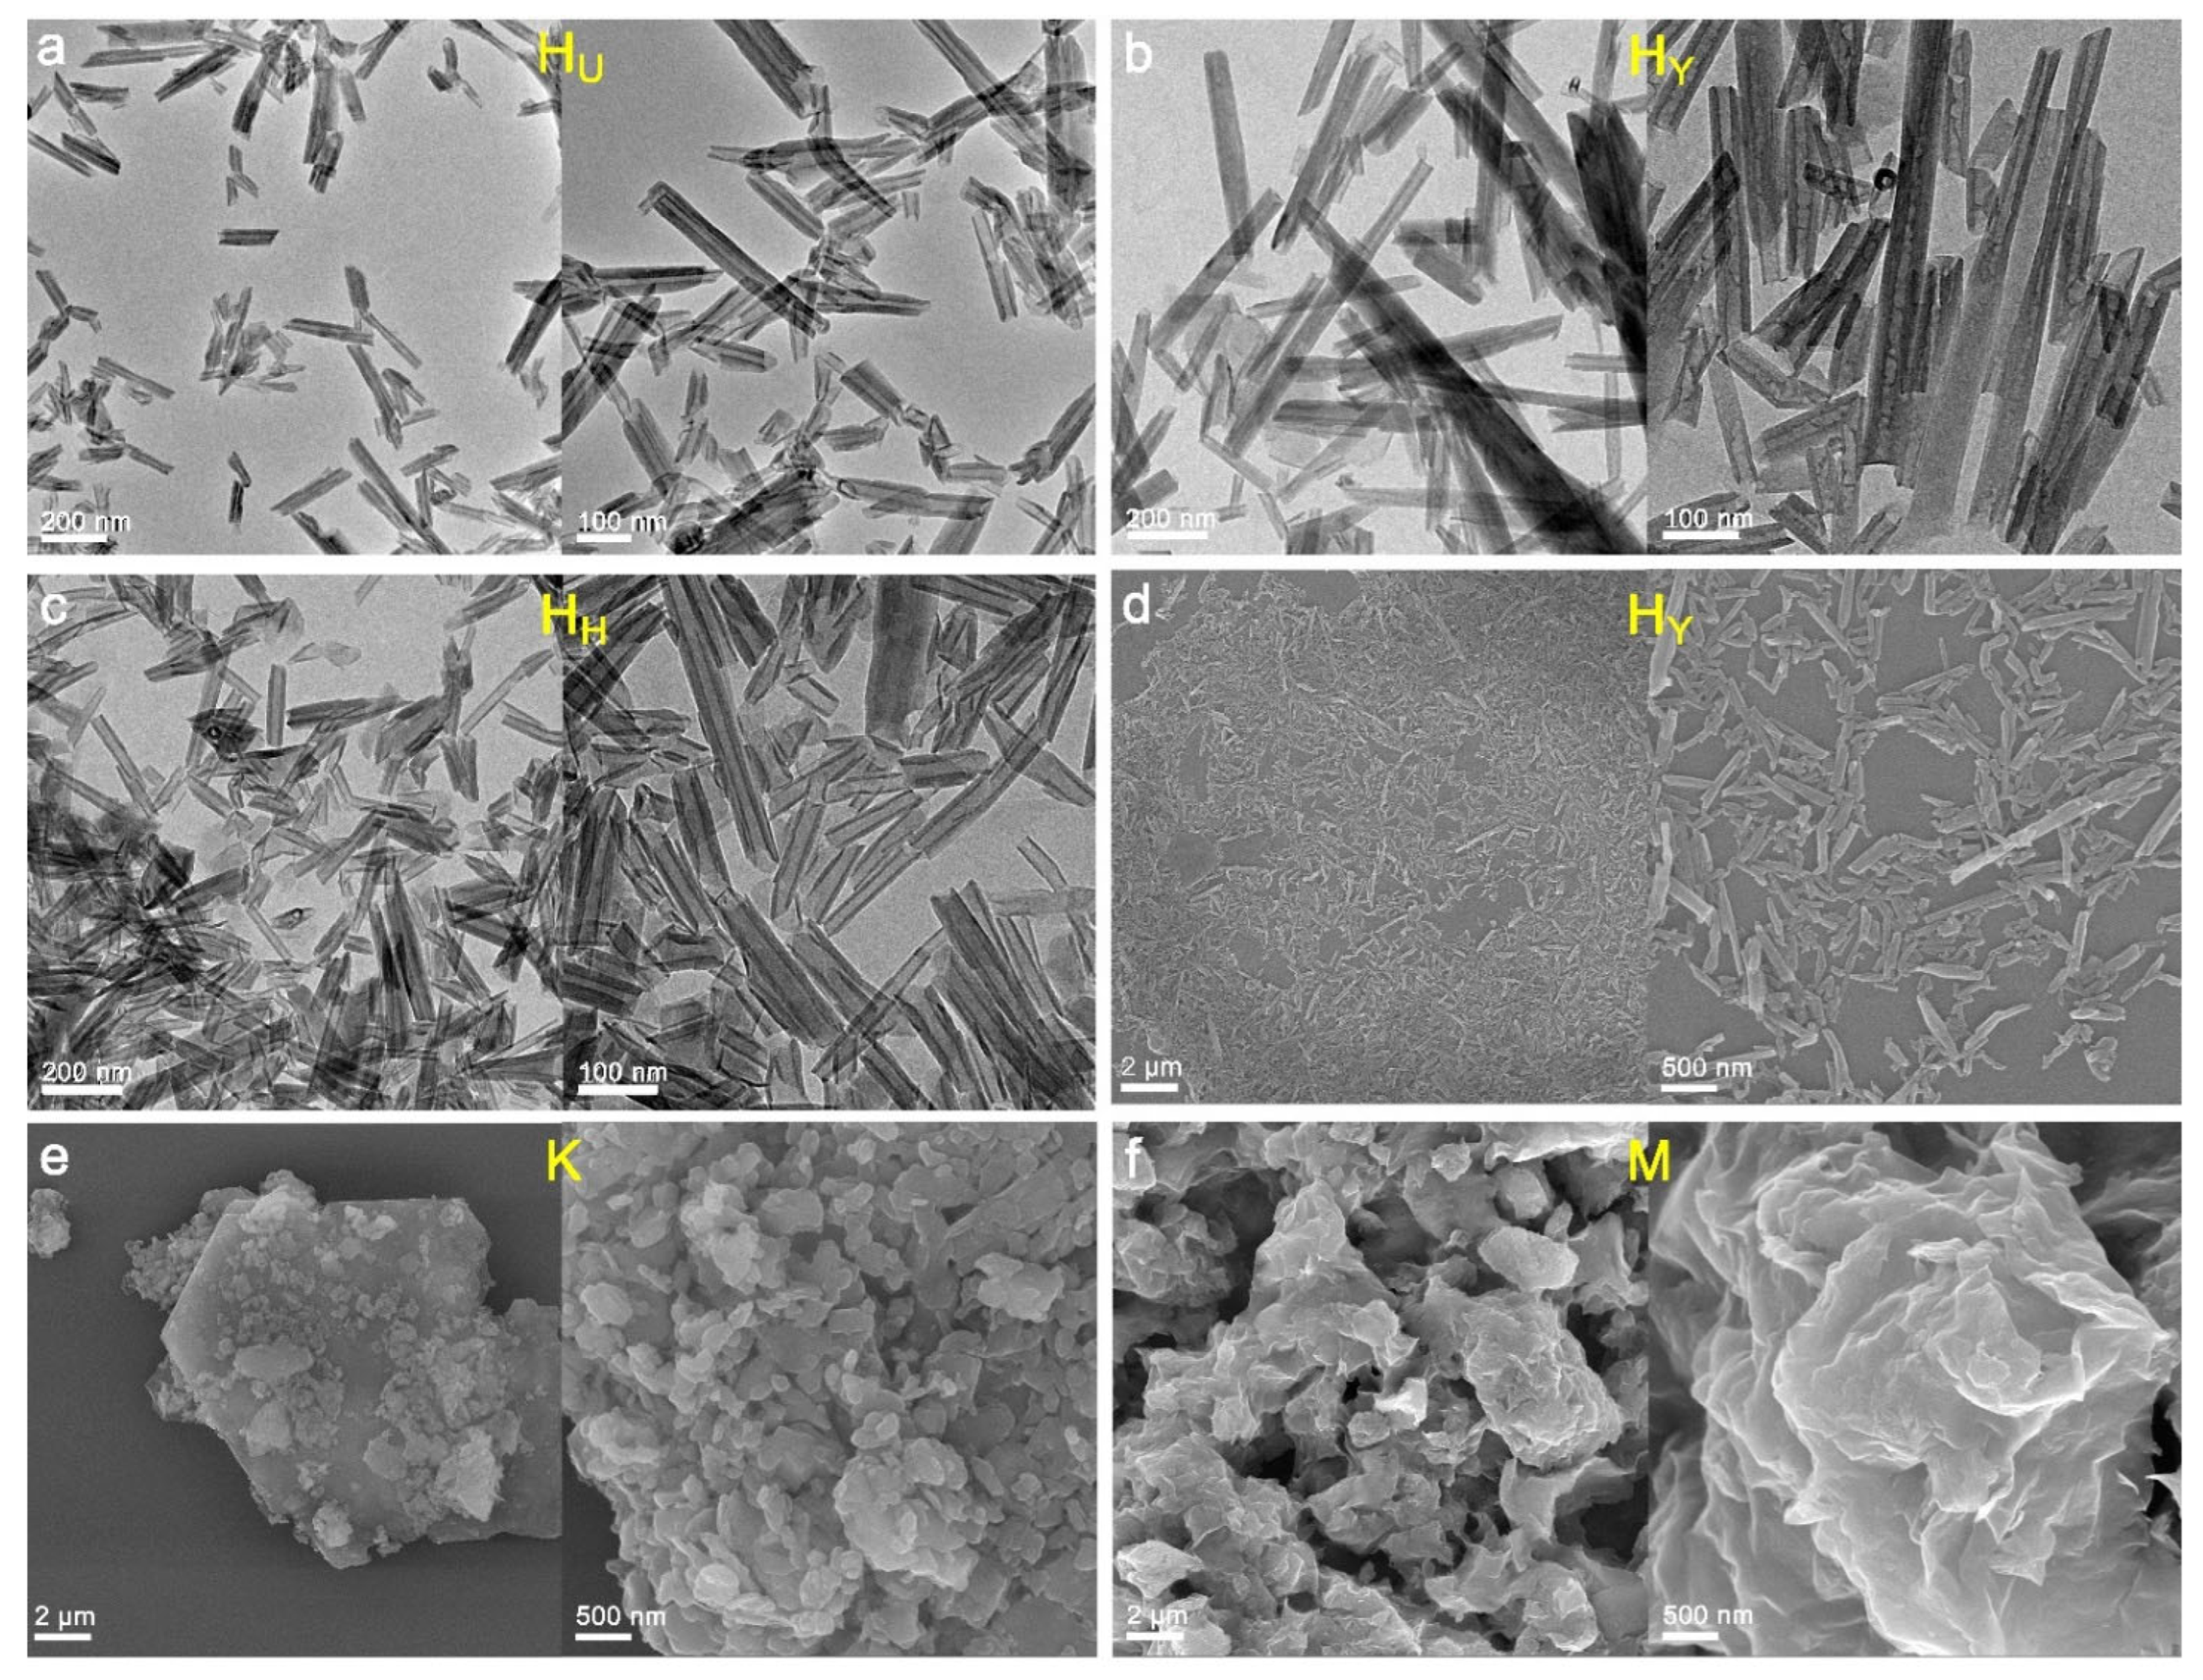
TEM characterization (Figure 2a–c) demonstrates that all three halloysite samples (HU, HY, and HH) display cylindrical nanotubular structures, with transparent central regions confirming hollow, open lumens, which fully aligns with the typical morphology of halloysite nanotubes. Notably, while the nanotubes in the HU and HH samples present clean inner surfaces, the nanotubes in the HY sample contain visible particles within their lumens. This observation aligns with previous reports [26], which indicate that residual soluble salts (such as K+ salts) may be present in natural halloysite deposits. SEM images (Figure 2d–f) clearly reveal distinct morphological differences among the clay minerals: halloysite exhibits well-dispersed nanotubular structures, in sharp contrast to the characteristic layered stacking of tabular crystals observed in both kaolinite and montmorillonite, which aligns perfectly with previous reports [27,28].
To quantify the dimensional variations in the nanotubes, twenty individual nanotubes were randomly selected from the TEM images of each halloysite sample for measurement, with the results summarized in Table 1. The statistical analysis revealed significant geographical variations in nanotube dimensions. The Utah-sourced halloysite (HU) exhibited relatively slender nanotubes with predominantly short lengths, displaying an average inner diameter, outer diameter, and length of 14.5 nm, 42.4 nm, and 181.6 nm, respectively. In contrast, the Yunnan-sourced halloysite (HY) displayed thicker and longer nanotubes, averaging 16.7 nm in inner diameter, 51.3 nm in outer diameter, and 590.4 nm in length. The Henan-sourced halloysite (HH) featured thicker nanotubes with considerable length variation, mainly comprising short tubes averaging 15.2 nm (inner diameter), 43.6 nm (outer diameter), and 223.5 nm (length). The aspect ratio analysis demonstrated the following order: HY (11.6) > HH (5.1) > HU (4.3).
Collectively, the SEM and TEM characterizations confirmed that all three halloysite samples possess the characteristic nanotubular structure while exhibiting marked geographical differences in dimensional parameters, with HU and HH dominated by short nanotubes and HY characterized by predominantly long nanotubes.

3.1.2. BET

The N2 adsorption–desorption isotherms of the three halloysite samples (HU, HY, and HH) nearly overlap (Figure 3a), all conforming with Type IV isotherms with H2-type hysteresis loops in the IUPAC classification [29], with the hysteresis loop appearing in the relative high-pressure region (P/P0 ≈ 0.8–1.0). This result indicates that the three halloysite samples exhibit high similarity in surface characteristics, such as pore size, pore volume, and SSA, all containing abundant mesopores. Further pore size distribution analysis (Figure 3b) shows that the main peak of the halloysite samples is located in the mesopore range of 15–25 nm, which directly corresponds to the hollow lumen of halloysite nanotubes. Notably, almost no micropores are detected in the halloysite samples, which is closely related to the characteristics of their 1:1 type crystalline layered structure; the narrow-fixed interlayer spacing (approximately 0.72 nm) of this structure limits the formation of micropore channels [30]. Additionally, the small number of macropores observed in the larger pore size region may originate from the aggregation effect of nanotube particles [31].
Comparative studies indicate that the N2 adsorption–desorption isotherms of the kaolinite sample exhibit typical Type II characteristics with almost no hysteresis, confirming the absence of microporous and mesoporous structures. The montmorillonite sample, however, displays Type IV isotherm characteristics with H3-type hysteresis loops, whose hysteresis loops cover a wide relative pressure range (P/P0 ≈ 0.6–1.0), indicating that this mineral has both microporous and mesoporous structures. This structural difference stems from the 2:1 layered structure of montmorillonite; its relatively wide interlayer spacing (approximately 1.2–1.8 nm) enables the formation of abundant interlayer narrow pores [30,32], thereby producing significant microporous characteristics of montmorillonite.
The N2 adsorption–desorption data were analyzed using the BET method to determine the average pore diameter, pore volume, and SSA of the clay mineral samples, as summarized in Table 2. The results indicate that the three halloysite samples (HU, HY, and HH) exhibit comparable SSA values, all falling within the literature-reported range of 22–88 m2/g [11,23]. Comparing the results of the nanotube morphology analysis above (see Table 1), the SSA of the short-tube-dominated halloysite (HU and HH) is slightly higher (48.2 and 44.6 m2/g, respectively), whereas the long-tube-predominant halloysite (HY) exhibits a slightly lower SSA (42.9 m2/g). The montmorillonite sample, featuring both microporous and mesoporous structures, possesses a SSA (70.2 m2/g) approximately 1.5 times greater than that of halloysite, consistent with previously reported values of 70–624 m2/g [33,34]. In contrast, the macropore-dominated kaolinite sample shows the lowest SSA (17.6 m2/g), about half that of halloysite and within the documented range of 10–23 m2/g [35,36,37].
Collectively, all three halloysite samples in this study are primarily mesoporous materials with negligible microporosity. While their SSAs are similar, the short-tube-predominant halloysite (HU and HH) exhibits relatively higher SSA compared to the long-tube-dominant halloysite (HY), suggesting a morphological influence on textural properties.

3.2. Mineral Composition Analysis

3.2.1. XRF

The XRF analysis results (Table 3) reveal that the three halloysites (HU, HY, and HH) share similar chemical compositions dominated by SiO2 (43.9%–45.4%) and Al2O3 (35.1%–38.9%). This composition profile aligns with the kaolinite reference sample due to their shared 1:1 phyllosilicate structure, whereas the montmorillonite sample shows characteristically higher SiO2 (56.2%) versus Al2O3 (21.8%) content, consistent with its 2:1 layered architecture.
Minor impurity oxides (Fe2O3, CaO, MgO, K2O, Na2O, TiO2) collectively account for 0.9%, 1.5%, and 2.3% of the total composition in halloysite samples HU, HY, and HH, respectively. These trace components, commonly present in natural clay minerals, likely originate from isomorphous substitution, residual soluble salts (e.g., Mg/Na/K salts), or associated weathering products (e.g., allophane, mica, quartz) [11]. The elevated CaO, MgO, and K2O levels in Henan-sourced halloysite (HH) may reflect geological associations with bauxite and limestone deposits in its source region (personal communication).
Further analysis reveals subtle differences in the Si:Al ratios among the three halloysite samples (Table 3). The Yunan-sourced halloysite (HY) has an Si:Al ratio of 0.97, close to the theoretical value of 1:1 for the kaolin group. In contrast, the Utah- and Henan-sourced halloysites (HU and HH) exhibit Si:Al ratios of 1.08 and 1.10, respectively, slightly higher than the ideal 1:1. The existing studies had indicated that natural halloysite often undergoes varying degrees of isomorphic substitution, such as the replacement of Si4+ by Al3+ in [SiO4] tetrahedrons or the substitution of Al3+ with Mg2+, Fe2+, or Ti2+ in [AlO6] octahedrons [11,38,39]. Therefore, it is speculated that the HU and HH samples exhibit more significant Al3+ substitution in their [AlO6] octahedral lattices, thereby increasing their Si:Al ratios. Combined with the color characteristics of halloysite samples (see Figure 1b), the white HU sample may undergo Al3+ → Mg2+ substitution, while the light-red HH sample may involve an Al3+ → Fe2+ substitution mechanism.
These findings collectively demonstrate that while all three halloysite samples maintain the fundamental 1:1 aluminosilicate framework, their exact Si:Al ratios exhibit geographical dependence. This highlights how local geological conditions influence the crystallochemical properties of natural halloysites.

3.2.2. XRD

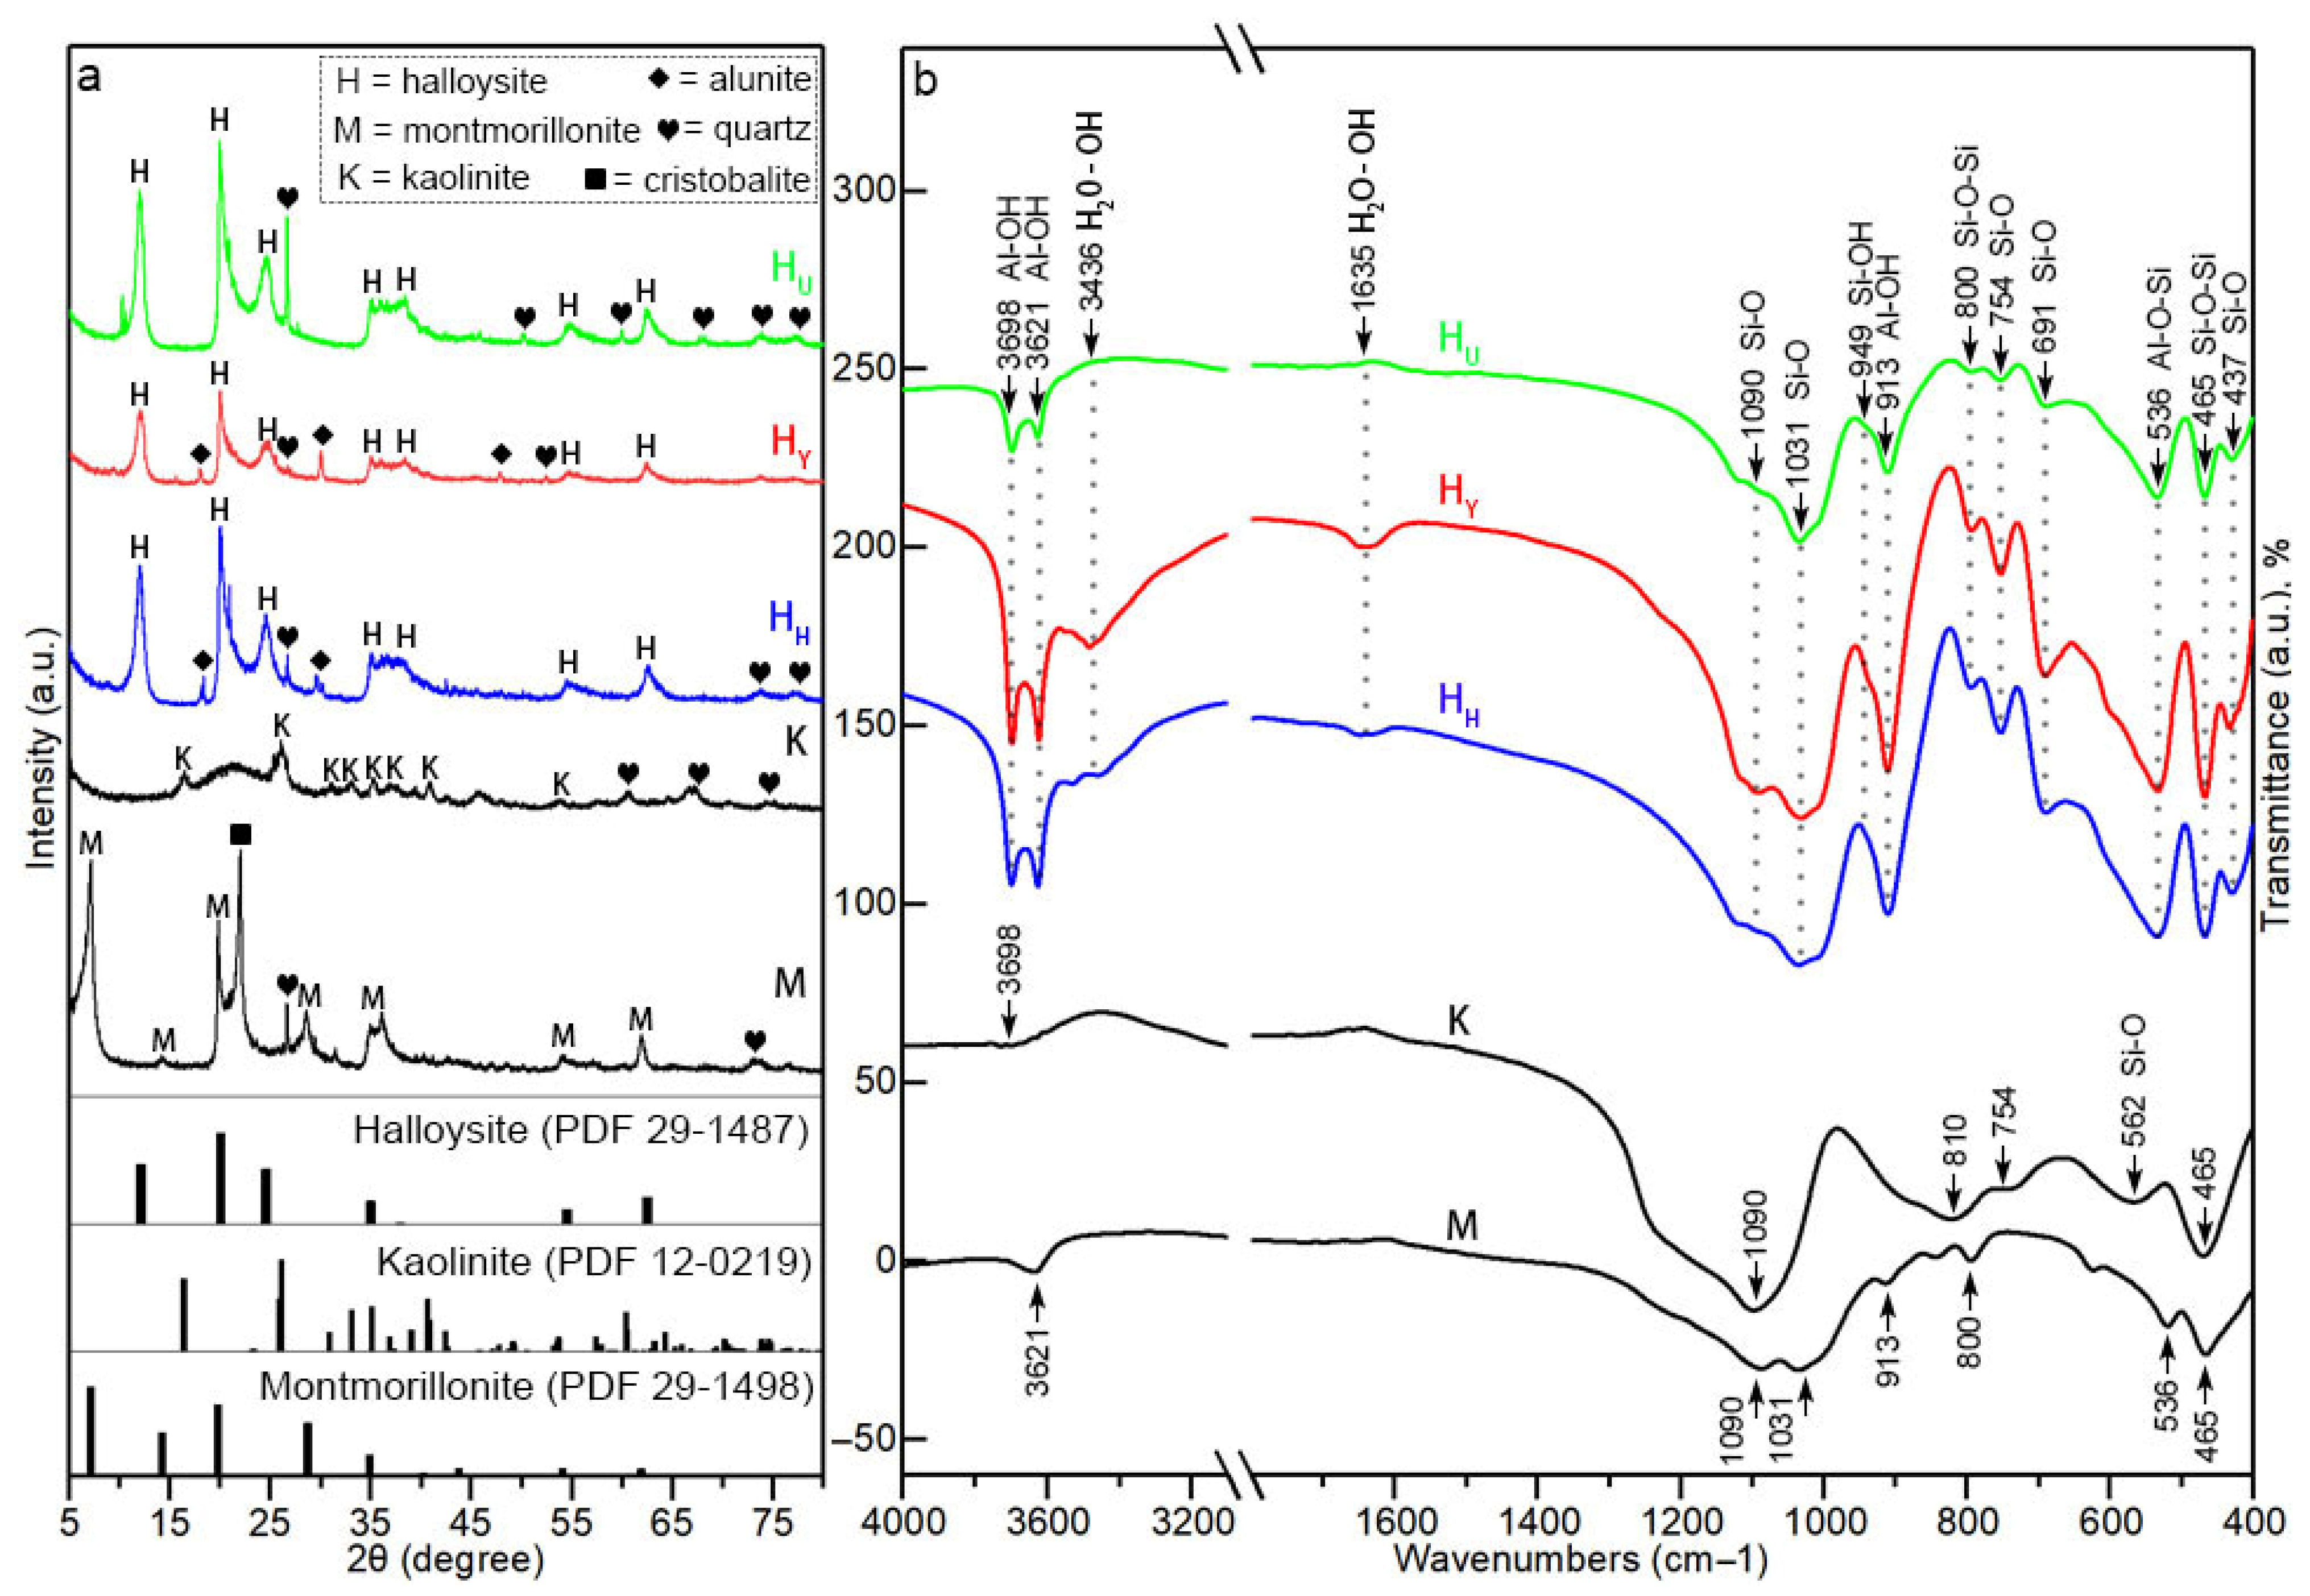
The XRD patterns of the three halloysite samples (HU, HY, and HH) all exhibit diffraction peaks at 2θ = 12°, corresponding to the (001) crystal plane with a basal spacing of 0.754 nm (Figure 4a). The interlayer spacing is smaller than that of hydrated halloysite (approximately 10 Å), indicating that dehydration occurred during sample pretreatment [26,40]. In addition to 2θ = 12°, the remaining characteristic diffraction peaks in the halloysite standard card JCPDS No. 29–1487 (such as the (100), (002), (110), (003), (210), and (300) crystal plane diffraction peaks at 2θ = 20°, 24.5°, 35°, 38°, 55°, and 62.5°) are clearly visible in the XRD patterns of the three halloysite samples. The XRD patterns of the kaolinite and montmorillonite samples, used as references, show good agreement with the characteristic diffraction peaks of their standard cards JCPDS No. 12-0219 and JCPDS No. 29-1498, respectively [34].
Additionally, the XRD patterns indicate that all three halloysite samples contain quartz impurities, with diffraction peaks at 2θ = 28°, 51°, 60.5°, 68°, 75°, and 78° corresponding to the (012), (400), (332), (511), (440), and (530) planes of quartz (JCPDS No. 85-0621) [40], consistent with the geological characteristics of natural clay minerals coexisting with quartz. Notably, alunite impurities were detected in the halloysite samples HY and HH, with diffraction peaks at (012), (021), and (033) crystal planes (2θ = 18°, 30°, and 48°) matching the alunite standard card JCPDS No. 70-3158 [3]. Based on the intensity of the diffraction peaks, the Utah-sourced halloysite (HU) has a higher content of quartz impurities, while the Yunan- and Henan-sourced halloysites (HY and HH) have lower contents of alunite and quartz impurities, which is consistent with the results of XRF chemical composition analysis.
In summary, the XRD characteristic diffraction peaks of the three different-origin halloysite samples show no significant differences, with only minor variations in the types and intensities of impurity diffraction peaks. This further confirms the consistency of their primary mineral structure and the regional differences in impurity composition.

3.2.3. FTIR

FTIR spectral analysis revealed consistent characteristic vibration bands across halloysite samples from different origins (Figure 4b), with peak position and assignments detailed in Table 4 based on reference spectra of halloysites, Al2O3, and SiO2 [41,42,43,44]. Specifically, there are three bands centered at 3698, 3621, and 913 cm−1. The first two bands are attributed to the stretching vibrations of Al–OH on the inner surface of the halloysite nanotubes and of internally embedded Al–OH, respectively, and the third band is identified as the bending vibration of the embedded Al–OH. In addition, two weak bands at 3436 and 1635 cm−1 corresponded to stretching and bending vibrations of physically adsorbed H2O molecules. The remaining nine Si-related bands included Si–O in-plane and longitudinal stretching/bending vibrations (1090, 1031, 754, 691, 437 cm−1), Si–OH bending (949 cm−1), Si–O–Si bending (800, 465 cm−1), and Al–O–Si bending vibrations (536 cm−1). The reference kaolinite and montmorillonite samples exhibited FTIR patterns fully consistent with literature reports [45,46].
Despite identical peak positions, the band intensities in the FTIR spectrum varied significantly among three different-origin halloysite samples (Figure 4b). The Yunnan-sourced halloysite (HY) displays the most intense characteristic peaks, particularly for Al–OH groups at 3698, 3621, and 913 cm−1, with transmittance reduction (Δ%T) measuring 67%, 68%, and 76%, respectively—approximately 20% higher than Henan’s halloysite (HH) and threefold greater than Utah’s halloysite (HU). This indicates significantly higher Al–OH group density in Yunnan-sourced HY, which can be explained crystallochemically. According to previous studies [47,48,49], homocrystalline substitution of [AlO6] octahedra (e.g., substitution of Al3+ with Mg2+, Fe2+, and Ti2+) can disrupt the local symmetry and hydrogen bonding network of surface Al–OH groups, thus reducing the surface Al–OH density. In this study, the near-ideal Si:Al ratio (0.96, see Table 3) in Yunnan’s halloysite HY suggests minimal substitution, whereas higher ratios in the other halloysites HH (1.10) and HU (1.08) indicate substantial octahedral substitutions that degrade Al–OH structural integrity. Consequently, the halloysite (HY) from Yunan retains superior Al–OH group density (as reflected in FTIR peak intensities) compared to the other halloysites (HH and HU), which undergo significant substitution.
These findings collectively demonstrate geographical variations in surface Al–OH density among the three halloysite samples, with the HY sample exhibiting the highest density due to its near-stoichiometric composition (Si:Al ≈ 1:1), while the HH and HU samples show reduced densities from extensive octahedral substitutions.

3.3. pH Boundary Determination

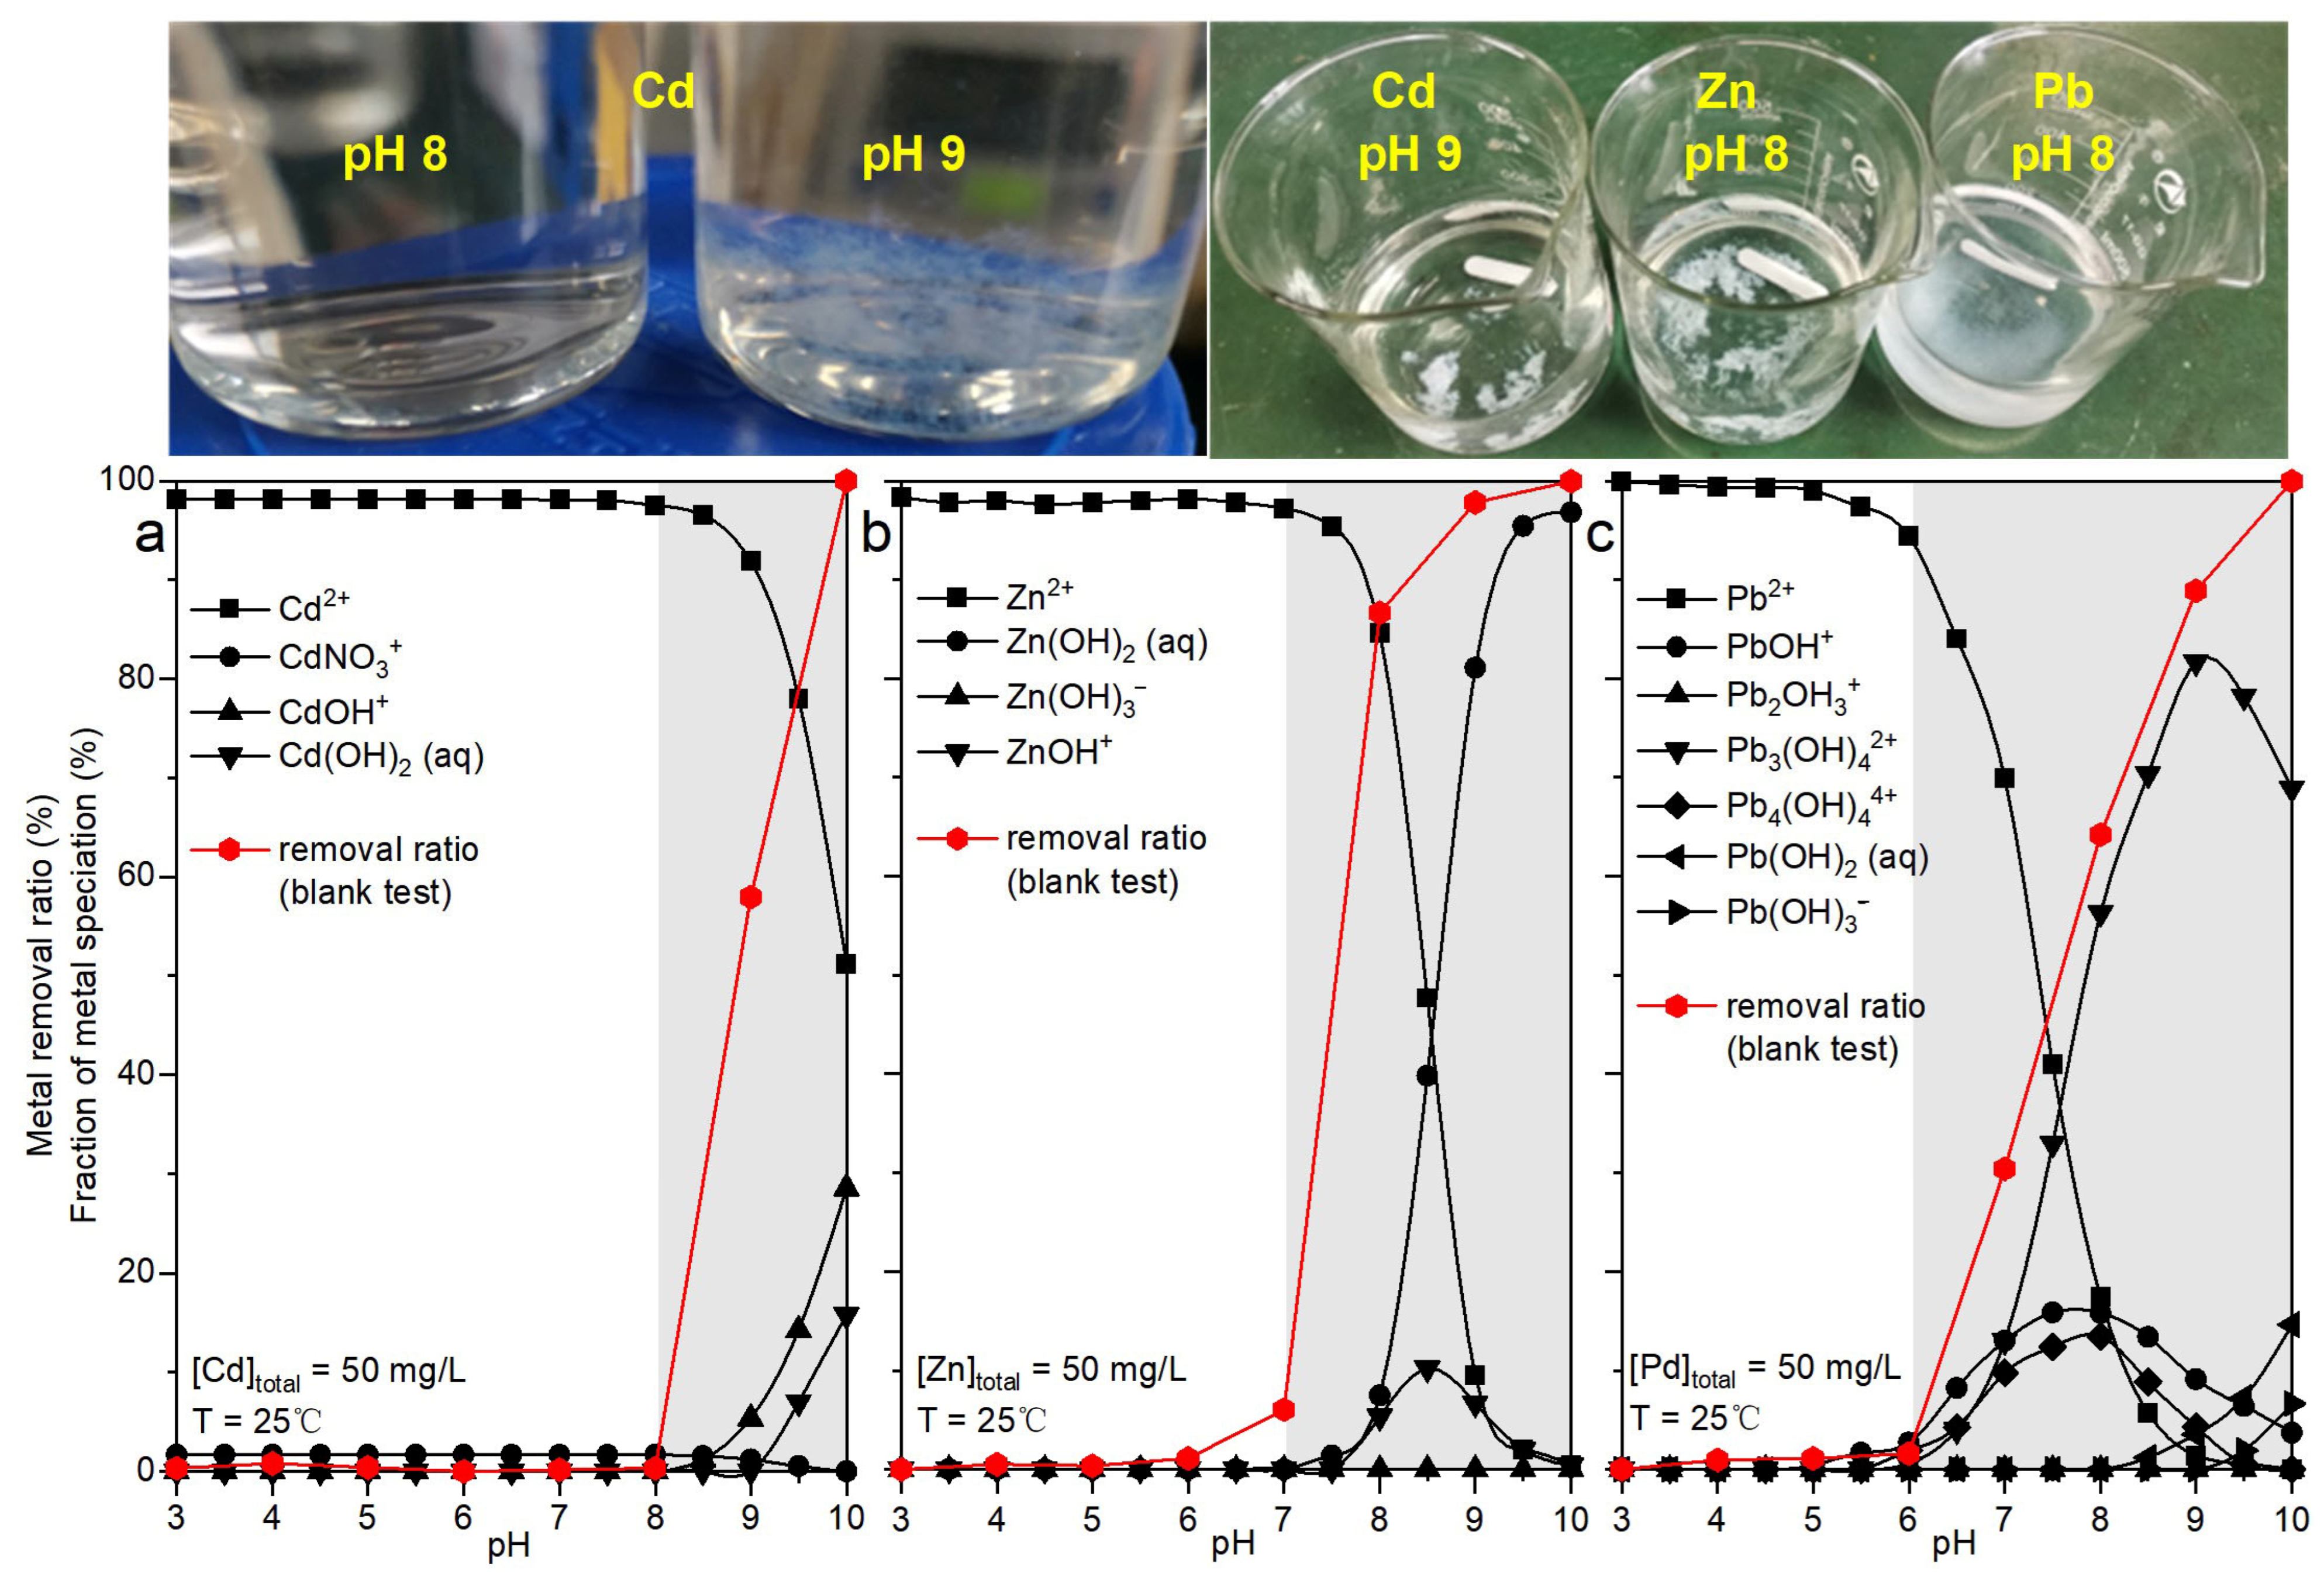
Blank experiments (without adsorbent) conducted under specified conditions (25 °C, initial heavy metal concentration of 50 mg/L, ionic strength of 0.001 M NaNO3) revealed pH-dependent removal trends for Cd, Zn, and Pb, as shown by the red solid lines in Figure 5. Parallel chemical speciation modeling using Visual MINTEQ software (Version 3.1) (black solid lines in Figure 5) provided mechanistic insights into these behaviors.
For Cd (Figure 5a), at pH 3–8, Cd2+ represented the absolutely dominant form, and the removal rate of Cd was almost zero; meanwhile, above pH 8, rapid formation of CdOH+ and Cd(OH)2(aq) species triggered white precipitate generation, achieving 100% removal of Cd at pH 10. Zn exhibited similar trends with negligible removal at pH 3–7, followed by abrupt increases in Zn(OH)2(aq) dominance and complete precipitation by pH 10 (Figure 5b). Pb demonstrated more pronounced pH sensitivity (Figure 5c). While remaining soluble as free Pb2+ below pH 6, it rapidly formed PbOH+, Pb3(OH)32+, Pb4(OH)44+, and Pb(OH)2(aq) species above this threshold, reaching full precipitation at pH 10 with visible white particulates.
These combined experimental and computational results demonstrate that under the study’s background conditions, all three metals exist predominantly as free hydrated cations (Cd2+, Zn2+, Pb2+) below pH 6.0 without precipitation interference. Therefore, subsequent adsorption experiments were conducted at a pH of 5.5 to exclusively evaluate sorptive removal mechanisms while avoiding complications from hydroxide precipitation.

3.4. Adsorption Capacity Measurement

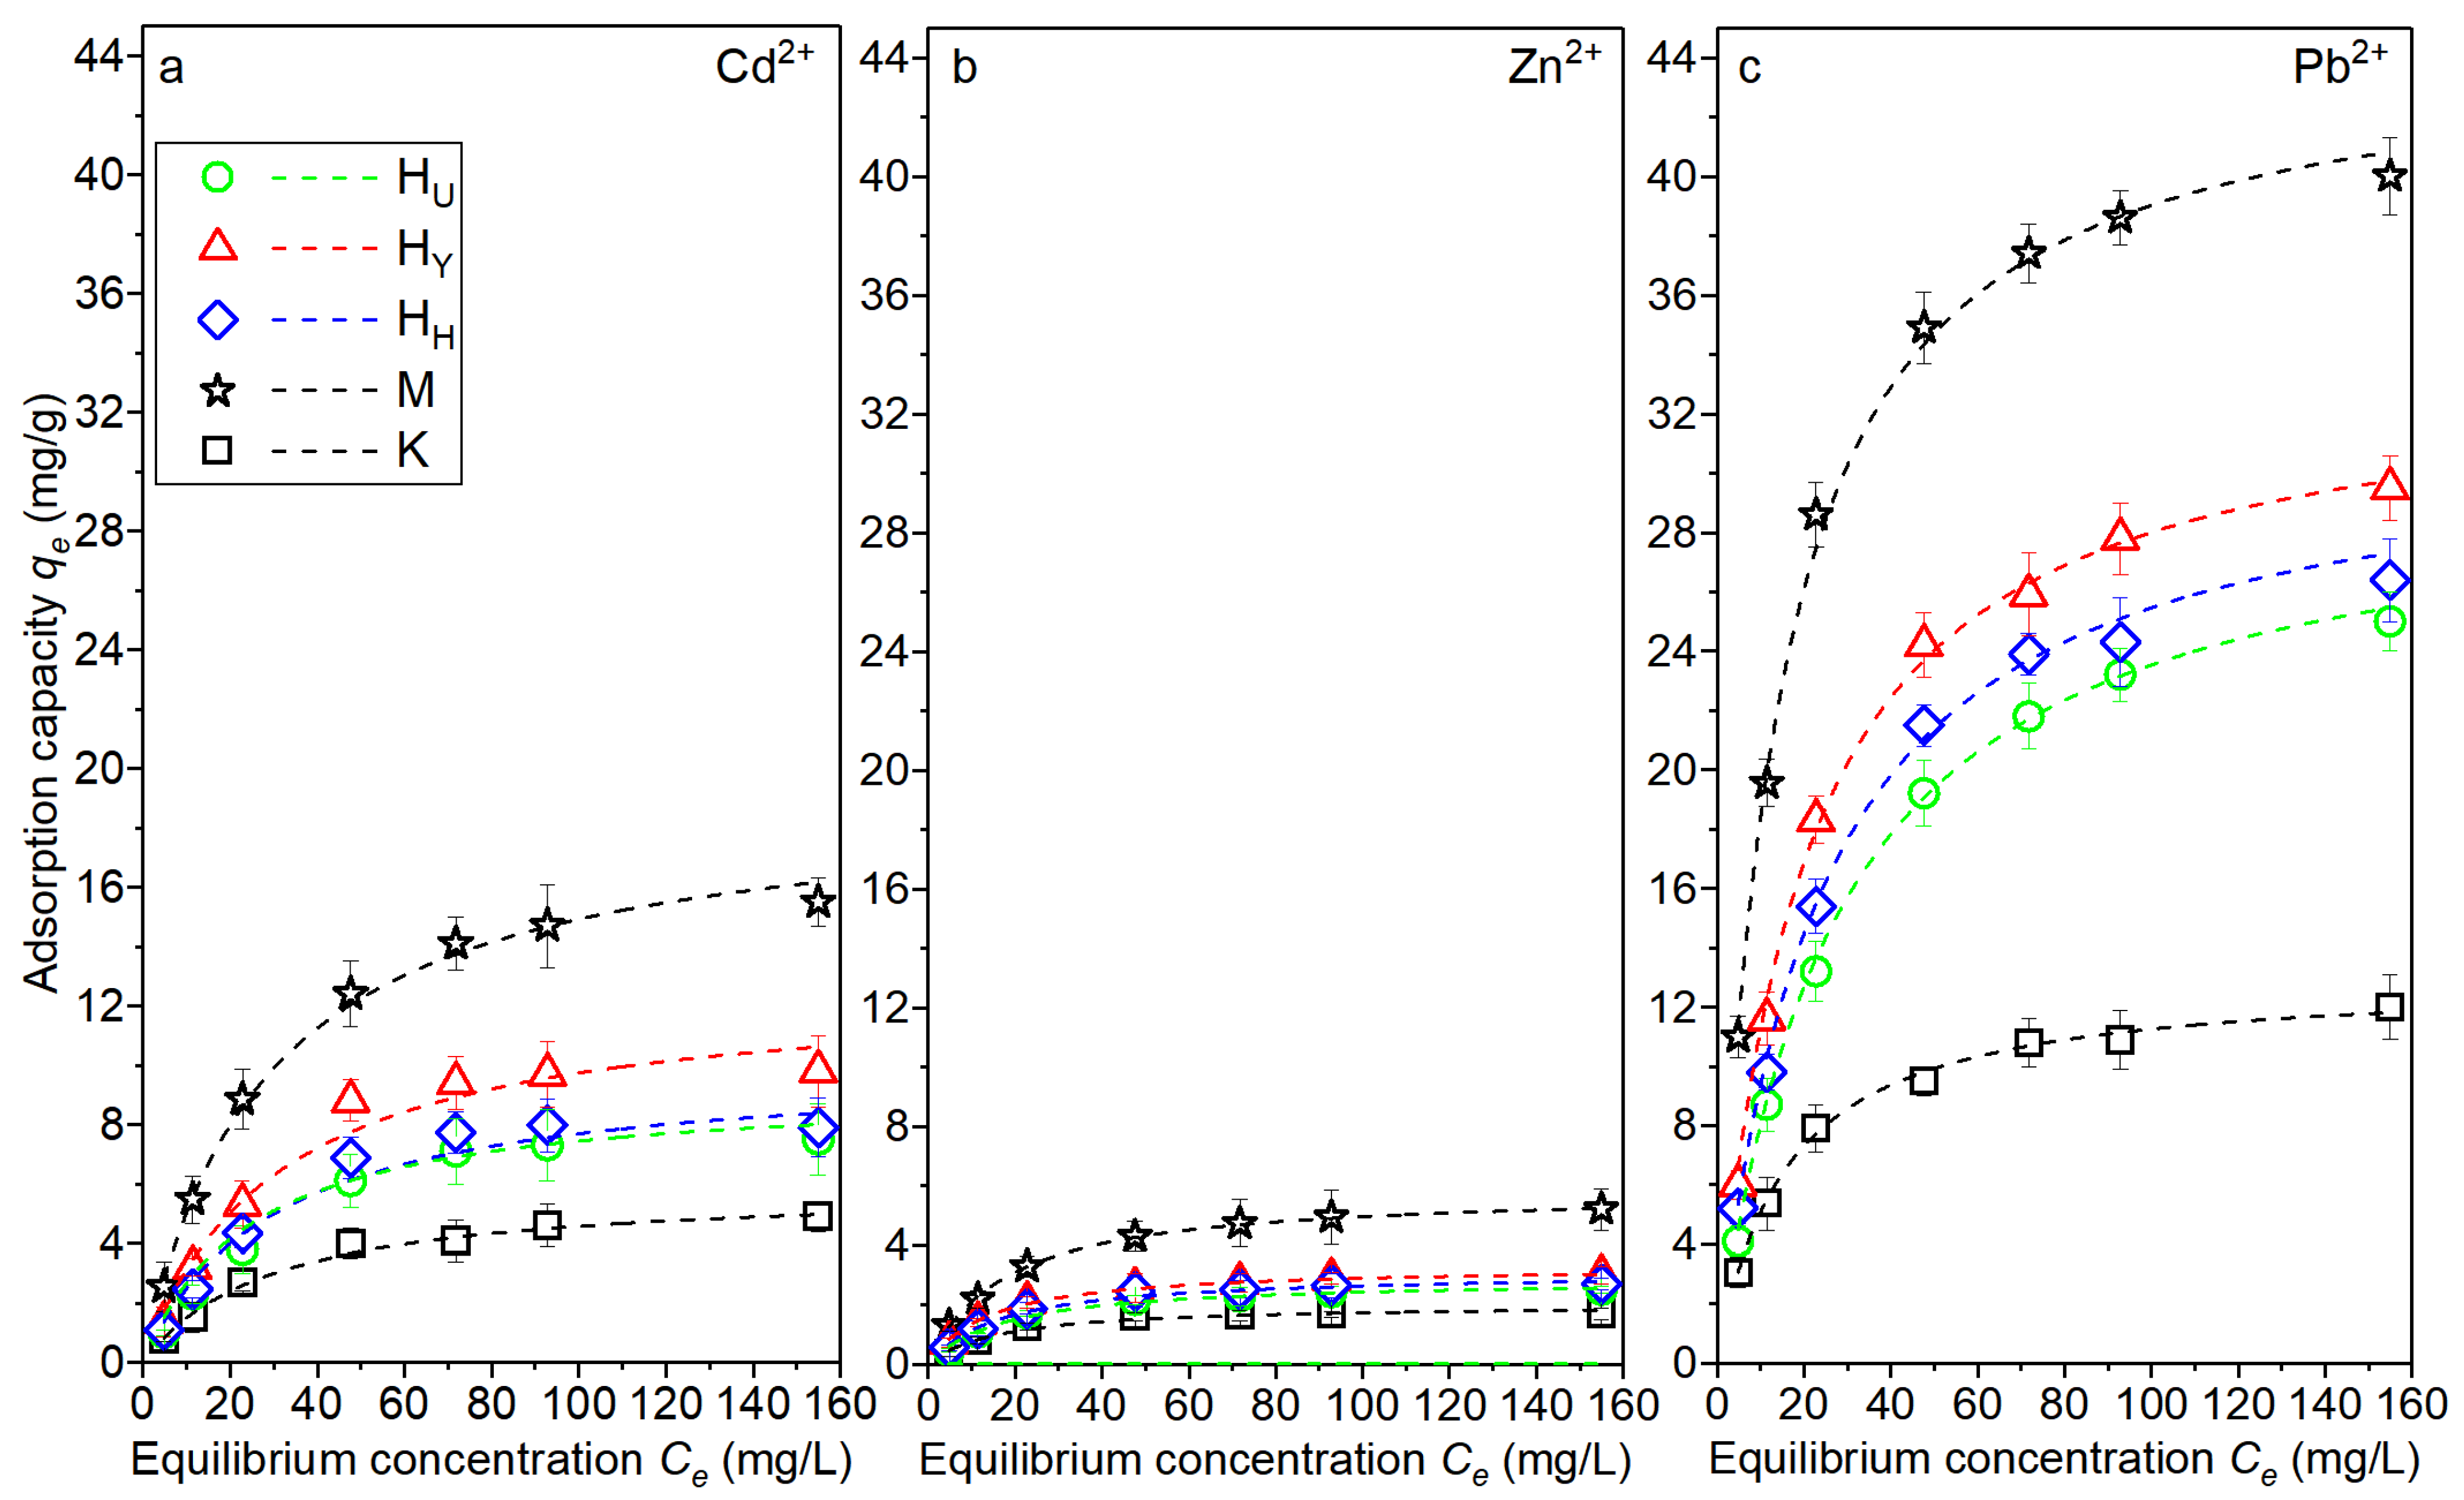
Under standardized experimental conditions (pH 5.5, 25 °C, ionic strength of 0.001 M, adsorbent dosage of 0.25 g/L), the adsorption capacity (qe) of clay mineral samples for heavy metal ions was determined across varying initial concentrations (Ce), as shown in Figure 6. The data demonstrate a characteristic adsorption pattern, where qe initially rises rapidly with increasing Ce before plateauing at equilibrium.
The equilibrium performance was described using the succeeding adsorption isotherm models:
Langmuir isotherm: qe = qmaxKLCe/(1 + KLCe)
Freundlich isotherm: qe = KfCe1/n
where qe (mg/g) represents the adsorption capacity at equilibrium concentration Ce (mg/L); qmax (mg/g) denotes the theoretical maximum adsorption capacity; KL (L/mg) indicates the binding affinity constant; and Kf (mg/g)(L/mg)1/n and 1/n are constants related to adsorptive capacity and intensity, respectively.
The constants calculated by the isotherm model fitting are listed in Table 5. The Cd2+, Zn2+, and Pb2+ adsorption onto each mineral sample well obeyed the Langmuir model (R2 = 0.884–0.959) or Freundlich model (R2 = 0.864–0.991). The constant 1/n was always greater than zero (0 < 1/n < 1), indicating that the adsorption was favorable [50]. The maximum theoretical adsorption capabilities (qmax) were calculated on the basis of the Langmuir models.
The results reveal distinct adsorption preferences: Pb2+ consistently achieved the highest qmax values across all clay types, followed by Cd2+, with Zn2+ exhibiting the lowest capacities. This hierarchy correlates with the metals’ physicochemical properties [51,52,53]. Pb’s greater atomic mass, higher electronegativity (2.33), and larger ionic radius (1.33 Å) enhance electrostatic and chemical bonding with clay surfaces, while Zn’s smaller size (0.74 Å), lower electronegativity (1.65), and reduced mass weaken these interactions, leaving Cd (1.69 electronegativity, 0.97 Å radius) intermediate in performance.
Comparative analysis identified a consistent performance gradient among clay types: montmorillonite showed superior adsorption, kaolinite the lowest capacities, and halloysite intermediate values. Taking Cd2+ adsorption as an example, the qmax values of halloysite samples for it were 7.8–10.1 mg/g, which was about 30% lower than those of montmorillonite (15.8 mg/g) but nearly 100% higher than those of kaolinite (5.2 mg/g). These findings position halloysite as a twice more effective adsorbent than kaolinite for heavy metals while emphasizing the critical role of provenance in its environmental applications.
Further, the adsorption performance of halloysite from different origins showed significant geographic heterogeneity. The Yunnan-sourced HY exhibited exceptional capacities, with qmax values of 10.1 mg/g, 3.2 mg/g, and 30.6 mg/g for Cd2+, Zn2+, and Pb2+, respectively, which was about 25% higher than those of Utah-sourced HU (qmax of 7.8 mg/g, 2.7 mg/g, and 25.5 mg/g) and about 20% higher than those of Henan-sourced HH (qmax of 8.2 mg/g, 2.9 mg/g, and 27.4 mg/g). This suggests that the geological conditions of origin have a significant effect on the adsorption performance of halloysite. Furthermore, the qmax value of halloysite for Cd2+, Zn2+, and Pb2+ varies depending on its mining location, falling within ranges of 7.8–10.1 mg/g, 2.7–3.2 mg/g, and 25.5–30.6 mg/g, respectively. The corresponding coefficients of variation (CV) were 6.3%, 4.2%, and 13.1%, indicating significantly lower variability compared to previous studies (Pb2+: CV = 68%; Cd2+: CV = 92%; Zn2+: CV = 145%) (Table 6).

3.5. Structure–Activity Relationship Analysis

The structural characteristics, compositional analyses, and adsorption results are systematically summarized in Table 7 to elucidate the structure–activity relationships of halloysite from different origins.
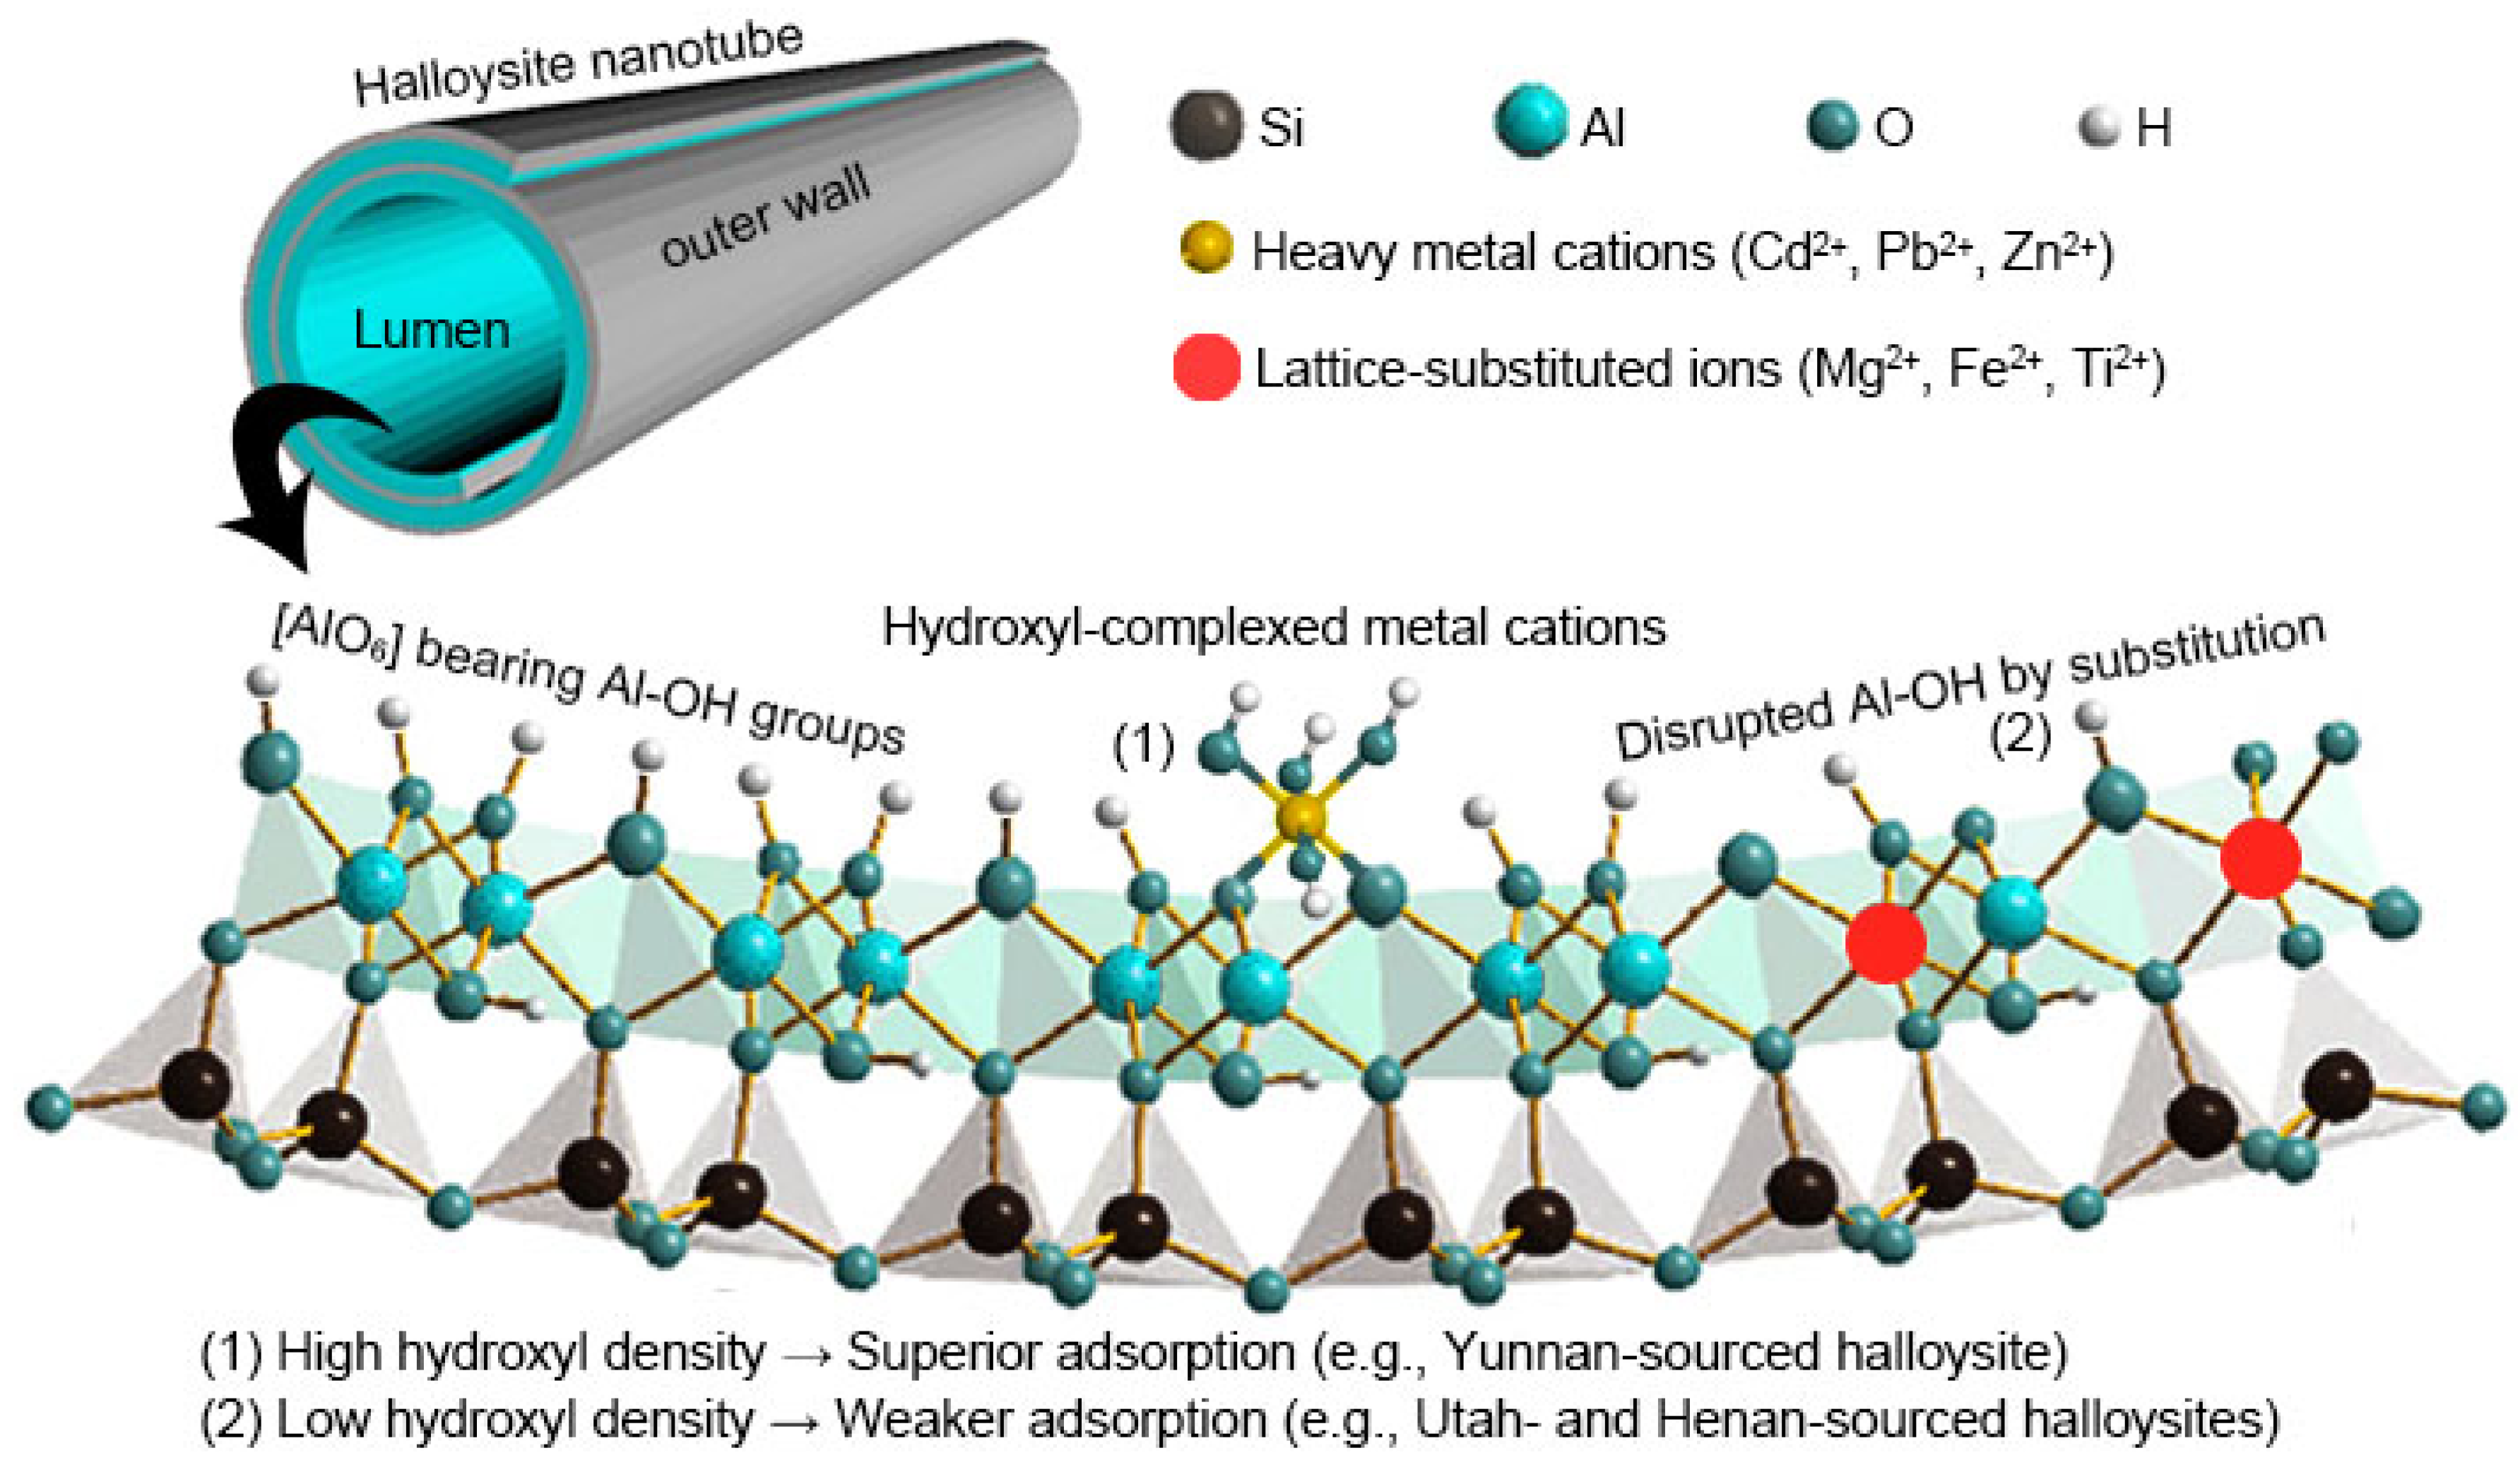
The data reveal a strong positive correlation between adsorption performance and Al–OH group density: the Yunnan-sourced halloysite (HY), exhibiting the highest Al–OH density among the three samples (HU, HY, and HH), demonstrated superior adsorption capacities for Cd2+, Zn2+, and Pb2+. This phenomenon can be explained by the dual adsorption mechanism of surface hydroxyl groups (≡X–OH) in clay minerals. On the one hand, the hydroxyl groups ≡X–OH can be deprotonated to form negatively charged ≡X–O sites, which then form stable mono-/bi-/tridentate complexes with metal cations through short-range ionic or covalent bonding (Equation (3)). On the other hand, hydrogen bonding between ≡X–OH and the hydration shells of aqueous metal ions (e.g., [Cd(H2O)n]2+) enables coordinated adsorption (Equation (4)) [54]. Consequently, higher hydroxyl density directly enhances the adsorption performance of halloysite by providing more active sites.
≡X–OH → ≡X–O → ≡X–O–M+
≡X–OH + [M(H2O)n]2+ → ≡X–OH⋯(H2O)nM2+
where ≡X represents the surface sites of Si or Al, and M is the heavy metal.
Further analysis establishes an intrinsic link between hydroxyl density and Si:Al ratio. The high-hydroxyl-density halloysite sample HY shows a near-ideal 1:1 Si:Al ratio, whereas lower-hydroxyl-density halloysite samples (HU, and HH) exhibit elevated ratios (>1:1). This pattern can be explained by the “isomorphous substitution in [AlO6] octahedra”. That is, the replacement of Al3+ by Mg2+/Fe2+/Ti2+ disrupts the local symmetry and hydrogen bonding networks of surface Al–OH groups, reducing Al–OH density on the clay mineral surface [47,48,49]. Therefore, the minimal substitution in Yunnan-sourced halloysite (HY) preserves optimal hydroxyl and variable charge densities (Figure 7), explaining its higher adsorption capacity than the other two halloysites (HU and HH).
Notably, isomorphous substitution in the lattice of clay minerals exerts dual effects, as follows: In one aspect, isomorphous substitution reduces the surface hydroxyl density and variable charge strength by destroying the hydroxyl structure, which in turn weakens the adsorption capacity of the heavy metal ions. In another aspect, isomorphous substitution simultaneously generates an excess of negative charge on the lattice basal oxygen atoms, allowing them to adsorb hydrated metal cations (e.g., [Cd(H2O)n]2+) via Coulomb forces or ion exchange action [55]. In this study, the dominant correlation between adsorption capacity and hydroxyl density suggests that surface hydroxyl configuration and chemistry play a more dominant role than the permanent charge in halloysite’s metal adsorption mechanisms.
Interestingly, the highest adsorption performance occurred in Yunnan-sourced halloysite (HY), despite its moderately lower SSA, likely because the limited surface area variations (42.9–48.2 m2/g) among the three samples (HU, HY, and HH) rendered this factor statistically insignificant. The consistent trends in Table 7 underscore that geographical origin controls halloysite’s adsorption efficacy primarily through crystallochemical modifications of surface hydroxyl populations rather than textural properties.

4. Conclusions

Standardized adsorption performance tests were conducted on halloysite samples from different geographical origins under rigorously controlled experimental conditions (pH = 5.5, T = 25 °C, ionic strength = 0.001 mol/L NaNO3). This yielded reliable maximum adsorption capacities (qmax) for halloysite toward Cd2+ (7.8–10.1 mg/g, CV = 6.3%), Zn2+ (2.7–3.2 mg/g, CV = 4.2%), and Pb2+ (25.5–30.6 mg/g, CV = 13.1%). These values were approximately 30% lower than those of montmorillonite but nearly 100% higher than those of kaolinite, highlighting halloysite’s significant potential for large-scale environmental remediation applications.
Comprehensive structural characterization and compositional analysis further revealed a distinct structure–activity relationship underlying the metal adsorption behavior of halloysite. Specifically, halloysite samples with lower octahedral sheet substitution exhibited higher Al–OH group densities, which directly correlated with enhanced adsorption performance. These findings establish a scientific basis for optimizing halloysite’s application in heavy metal remediation, enabling the targeted selection of naturally occurring halloysite variants with superior adsorption properties.

Author Contributions

Y.L. (Ying Li) received the project and performed the experiment; X.Y. designed the experiment; X.W. and Y.L. (Yao Long) analyzed the data; X.W. and Y.L. (Yao Long) wrote and revised the manuscript, respectively. All authors have read and agreed to the published version of the manuscript.

Funding

This research was funded by the Scientific Research Project of the Education Department of Hunan Province, China, grant number 23C0567.

Data Availability Statement

The original contributions presented in this study are included in the article. Further inquiries can be directed to the corresponding author.

Conflicts of Interest

The authors declare no conflicts of interest.

References

  1. Uddin, M.K. A review on the adsorption of heavy metals by clay minerals, with special focus on the past decade. Chem. Eng. J. 2017, 308, 438–462. [Google Scholar] [CrossRef]
  2. Guan, X.; Yuan, X.; Zhao, Y.; Bai, J.; Li, Y.; Cao, Y.; Chen, Y.; Xiong, T. Adsorption behaviors and mechanisms of Fe/Mg layered double hydroxide loaded on bentonite on Cd(II) and Pb(II) removal. J. Colloid Interface Sci. 2022, 612, 572–583. [Google Scholar] [CrossRef] [PubMed]
  3. Li, Y.; Yuan, X.; Guan, X.; Bai, J.; Wang, H. One-pot synthesis of siliceous ferrihydrite−coated halloysite nanorods in alkaline medium: Structure, properties and cadmium adsorption performance. J. Colloid Interface Sci. 2023, 636, 435–449. [Google Scholar] [CrossRef]
  4. Xie, Y.Y.; Yuan, X.Z.; Wu, Z.B.; Zeng, G.M.; Jiang, L.B.; Peng, X.; Li, H. Adsorption behavior and mechanism of Mg/Fe layered double hydroxide with Fe3O4-carbon spheres on the removal of Pb(II) and Cu(II). J. Colloid Interface Sci. 2019, 536, 440–455. [Google Scholar] [CrossRef]
  5. Borisover, M.; Davis, J.A. Adsorption of inorganic and organic solutes by clay minerals. In Developments in Clay Science; Tournassat, C., Steefel, C.I., Bourg, I.C., Bergaya, F., Eds.; Elsevier: Amsterdam, The Netherlands, 2015; pp. 33–70. [Google Scholar]
  6. Yuan, G.D.; Theng, B.K.G.; Churchman, G.J.; Gates, W.P. Clays and clay minerals for pollution control. In Developments in Clay Science; Bergaya, F., Lagaly, G., Eds.; Elsevier: Amsterdam, The Netherlands, 2013; pp. 587–644. [Google Scholar]
  7. Bessaha, F.; Marouf-Khelifa, K.; Batonneau-Gener, I.; Khelifa, A. Characterization and application of heat-treated and acid-leached halloysites in the removal of malachite green: Adsorption, desorption, and regeneration studies. Desalination Water Treat. 2016, 57, 14609–14621. [Google Scholar] [CrossRef]
  8. Bessaha, G.; Bessaha, F.; Mahrez, N.; Boucifa, F.; Çoruhb, A.; Khelifa, A. Enhancement of the comprehensive performance of tetracycline adsorption by halloysite nanotubes: Kinetics, mechanism, and reusability study. Desalination Water Treat. 2024, 320, 100695. [Google Scholar] [CrossRef]
  9. Lvov, Y.; Wang, W.C.; Zhang, L.Q.; Fakhrullin, R. Halloysite clay nanotubes for loading and sustained release of functional compounds. Adv. Mater. 2016, 28, 1227–1250. [Google Scholar] [CrossRef] [PubMed]
  10. Li, Y.; Yuan, X.; Jiang, L.; Dai, H.; Zhao, Y.; Guan, X.; Bai, J.; Wang, H. Manipulation of the halloysite clay nanotube lumen for environmental remediation: A review. Environ. Sci. Nano 2022, 9, 841–866. [Google Scholar] [CrossRef]
  11. Joussein, E.; Petit, S.; Churchman, J.; Theng, B.; Righi, D.; Delvaux, B. Halloysite clay minerals—A review. Clay Miner. 2005, 40, 383–426. [Google Scholar] [CrossRef]
  12. Wilson, I.R. Kaolin and halloysite deposits of China. Clay Miner. 2004, 39, 1–15. [Google Scholar] [CrossRef]
  13. Wu, B.; Jiang, M.; Liu, X.; Huang, C.; Gu, Z.; Cao, Y. Evaluation of toxicity of halloysite nanotubes and multi-walled carbon nanotubes to endothelial cells in vitro and blood vessels in vivo. Nanotoxicology 2020, 14, 1017–1038. [Google Scholar] [CrossRef]
  14. Hu, T.; Gui, Z.; Gong, J.; Rong, R.; Wang, X.; Tan, W.; Wang, Z.; Xu, X. INOS-mediated acute stomach injury and recovery in mice after oral exposure to halloysite nanotubes. Environ. Pollut. 2020, 258, 113758. [Google Scholar] [CrossRef] [PubMed]
  15. Maziarz, P.; Matusik, J. Halloysite composites with Fe3O4 particles: The effect of impregnation on the removal of aqueous Cd(II) and Pb(II). Mineralogia 2017, 48, 107–125. [Google Scholar] [CrossRef]
  16. Maziarz, P.; Matusik, J. The effect of acid activation and calcination of halloysite on the efficiency and selectivity of Pb(II), Cd(II), Zn(II) and As(V) uptake. Clay Miner. 2016, 51, 385–394. [Google Scholar] [CrossRef]
  17. Matusik, J.; Wscislo, A. Enhanced heavy metal adsorption on functionalized nanotubular halloysite interlayer grafted with aminoalcohols. Appl. Clay Sci. 2014, 100, 50–59. [Google Scholar] [CrossRef]
  18. Dong, Y.H.; Liu, Z.J.; Chen, L. Removal of Zn(II) from aqueous solution by natural halloysite nanotubes. J. Radioanal. Nucl. Chem. 2012, 292, 435–443. [Google Scholar] [CrossRef]
  19. Chiew, C.S.C.; Yeoh, H.K.; Pasbakhsh, P.; Krishnaiah, K.; Poh, P.E.; Tey, B.T.; Chan, E.S. Halloysite/alginate nanocomposite beads: Kinetics, equilibrium and mechanism for lead adsorption. Appl. Clay Sci. 2016, 119, 301–310. [Google Scholar] [CrossRef]
  20. Wang, P.L.; Tang, Y.Y.; Liu, Y.S.; Wang, T.; Wu, P.F.; Lu, X.Y. Halloysite nanotube@carbon with rich carboxyl groups as a multifunctional adsorbent for the efficient removal of cationic Pb(II), anionic Cr(VI) and methylene blue (MB). Environ. Sci. Nano 2018, 5, 2257–2268. [Google Scholar] [CrossRef]
  21. Loganathan, P.; Vigneswaran, S.; Kandasamy, J.; Naidu, R. Cadmium sorption and desorption in soils: A Review. Crit. Rev. Environ. Sci. Technol. 2012, 42, 489–533. [Google Scholar] [CrossRef]
  22. Farinmade, A.; Ojo, O.F.; Trout, J.; He, J.; John, V.; Blake, D.A.; Lvov, Y.M.; Zhang, D.; Nguyen, D.; Bose, A. Targeted and stimulus-responsive delivery of surfactant to the oil-water interface for applications in oil spill remediation. ACS Appl. Mater. Interfaces 2020, 12, 1840–1849. [Google Scholar] [CrossRef]
  23. Pasbakhsh, P.; Churchman, G.J.; Keeling, J.L. Characterisation of properties of various halloysites relevant to their use as nanotubes and microfibre fillers. Appl. Clay Sci. 2013, 74, 47–57. [Google Scholar] [CrossRef]
  24. Joo, Y.; Sim, J.H.; Jeon, Y.; Lee, S.U.; Sohn, D. Opening and blocking the inner-pores of halloysite. Chem. Commun. 2013, 49, 4519–4521. [Google Scholar] [CrossRef] [PubMed]
  25. Li, B.; Wei, D.; Zhou, Y.; Huang, Y.; Tie, B.; Lei, M. Mechanisms of arsenate and cadmium co-immobilized on ferrihydrite inferred from ternary surface configuration. Chem. Eng. J. 2021, 424, 130410. [Google Scholar] [CrossRef]
  26. Keeling, J.L.; Self, P.G.; Raven, M.D. Halloysite in Cenozoic sediments along the Eucla Basin margin. Math. Eng. Sci. Aerosp. 2010, 59, 25–28. [Google Scholar]
  27. Salata, R.; Melo, V.F.; Batista, L.F.A.; Abate, G.; Azevedo, A.C. Atrazine adsorption and desorption on functionalized montmorillonite: Aluminum-pillared and lithium saturated. J. Environ. Sci. Health 2022, 57, 980–988. [Google Scholar] [CrossRef]
  28. Olusegun, S.J.; Mohallem, N.D.S. Comparative adsorption mechanism of doxycycline and Congo red using synthesized kaolinite supported CoFe2O4 nanoparticles. Environ. Pollut. 2020, 260, 114019. [Google Scholar] [CrossRef]
  29. Thommes, M.; Kaneko, K.; Neimark, A.V.; Olivier, J.P.; Rodriguez-Reinoso, F.; Rouquerol, J.; Sing, K.S.W. Physisorption of gases, with special reference to the evaluation of surface area and pore size distribution (IUPAC Technical Report). Pure Appl. Chem. 2015, 87, 1051–1069. [Google Scholar] [CrossRef]
  30. Biswas, B.; Warr, L.N.; Hilder, E.F.; Goswami, N.; Rahman, M.M.; Churchman, J.G.; Vasilev, K.; Pan, G.; Naidu, R. Biocompatible functionalisation of nanoclays for improved environmental remediation. Chem. Soc. Rev. 2019, 48, 3740–3770. [Google Scholar] [CrossRef]
  31. Wang, X.M.; Cheng, H.J.; Chai, P.C.; Bian, J.H.; Wang, X.M.; Liu, Y.; Yin, X.B.; Pan, S.D.; Pan, Z.J. Pore characterization of different clay minerals and its impact on methane adsorption capacity. Energy Fuels 2020, 34, 12204–12214. [Google Scholar] [CrossRef]
  32. Wang, W.B.; Wang, A.Q. Nanoscale clay minerals for functional ecomaterials: Fabrication, applications, and future trends. In Handbook of Ecomaterials; Martínez, L.M.T., Ed.; Springer: Cham, Switzerland, 2019; pp. 2409–2490. [Google Scholar]
  33. Liu, X.; Lu, X.; Sprik, M.; Cheng, J.; Meijer, E.J.; Wang, R. Acidity of edge surface sites of montmorillonite and kaolinite. Geochim. Cosmochim. Acta 2013, 117, 180–190. [Google Scholar] [CrossRef]
  34. Deng, L.L.; Yuan, P.; Liu, D.; Annabi-Bergaya, F.; Zhou, J.M.; Chen, F.R.; Liu, Z.W. Effects of microstructure of clay minerals, montmorillonite, kaolinite and halloysite, on their benzene adsorption behaviors. Appl. Clay Sci. 2017, 143, 184–191. [Google Scholar] [CrossRef]
  35. Won, J.; Wirth, X.; Burns, S.E. An experimental study of cotransport of heavy metals with kaolinite colloids. J. Hazard. Mater. 2019, 373, 476–482. [Google Scholar] [CrossRef] [PubMed]
  36. Struijk, M.; Rocha, F.; Detellier, C. Novel thio-kaolinite nanohybrid materials and their application as heavy metal adsorbents in wastewater. Appl. Clay Sci. 2017, 150, 192–201. [Google Scholar] [CrossRef]
  37. Ruyter-Hooley, M.; Johnson, B.B.; Morton, D.W.; Angove, M.J. The adsorption of myo-inositol hexaphosphate onto kaolinite and its effect on cadmium retention. Appl. Clay Sci. 2017, 135, 405–413. [Google Scholar] [CrossRef]
  38. Tunega, D.; Zaoui, A. Mechanical and bonding behaviors behind the bending mechanism of Kaolinite clay layers. J. Phys. Chem. C 2020, 124, 7432–7440. [Google Scholar] [CrossRef]
  39. Yang, H.; Zhang, Y.; Ouyang, J. Physicochemical properties of halloysite. In Developments in Clay Science; Yuan, P., Thill, A., Bergaya, F., Eds.; Elsevier: Amsterdam, The Netherlands, 2016; pp. 67–91. [Google Scholar]
  40. Ramanayaka, S.; Sarkar, B.; Cooray, A.T.; Ok, Y.S.; Vithanage, M. Halloysite nanoclay supported adsorptive removal of oxytetracycline antibiotic from aqueous media. J. Hazard. Mater. 2020, 384, 121301. [Google Scholar] [CrossRef]
  41. Deng, L.L.; Yuan, P.; Liu, D.; Du, P.X.; Zhou, J.M.; Wei, Y.F.; Song, Y.R.; Liu, Y.Q. Effects of calcination and acid treatment on improving benzene adsorption performance of halloysite. Appl. Clay Sci. 2019, 181, 105240. [Google Scholar] [CrossRef]
  42. Chaudhari, S.; Baek, M.H.; Kwon, Y.; Shon, M.; Nam, S.; Park, Y. Surface-modified halloysite nanotube-embedded polyvinyl alcohol/polyvinyl amine blended membranes for pervaporation dehydration of water/isopropanol mixtures. Appl. Surf. Sci. 2019, 493, 193–201. [Google Scholar] [CrossRef]
  43. Yu, J.Y.; Niedenthal, W.; Smarsly, B.M.; Natile, M.M.; Huang, Y.X.; Carraro, M. Au nanoparticles supported on piranha etched halloysite nanotubes for highly efficient heterogeneous catalysis. Appl. Surf. Sci. 2021, 546, 149100. [Google Scholar] [CrossRef]
  44. Yilmaz, R.B.; Bayram, G.; Yilmazer, U. Effect of halloysite nanotubes on multifunctional properties of coaxially electrospun poly(ethylene glycol)/polyamide-6 nanofibrous thermal energy storage materials. Thermochim. Acta 2020, 690, 178673. [Google Scholar] [CrossRef]
  45. Qin, C.; Yuan, X.; Xiong, T.; Tan, Y.Z.; Wang, H. Physicochemical properties, metal availability and bacterial community structure in heavy metal-polluted soil remediated by montmorillonite-based amendments. Chemosphere 2020, 261, 128010. [Google Scholar] [CrossRef]
  46. Shaban, M.; Sayed, M.I.; Shahien, M.G.; Abukhadra, M.R.; Ahmed, Z.M. Adsorption behavior of inorganic- and organic-modified kaolinite for Congo red dye from water, kinetic modeling, and equilibrium studies. J. Sol-Gel Sci. Technol. 2018, 87, 427–441. [Google Scholar] [CrossRef]
  47. Madejová, J. FTIR techniques in clay mineral studies. Vib. Spectrosc. 2003, 31, 1–10. [Google Scholar] [CrossRef]
  48. Paikaray, S.; Essilfie-Dughan, J.; Hendry, M.J. Ionic substitution of Mg2+ for Al3+ and Fe3+ with octahedral coordination in hydroxides facilitate precipitation of layered double hydroxides. Geochim. Cosmochim. Acta 2018, 220, 217–234. [Google Scholar] [CrossRef]
  49. Pimentel, C.; Hernández-Laguna, A.; Sainz-Díaz, C.I. Effect of iron isomorphic substitution in Mg:Al and Zn:Al-layered double-hydroxide structures by means of first principle calculations. ACS Earth Space Chem. 2022, 6, 2499–2507. [Google Scholar] [CrossRef] [PubMed]
  50. Al-Ghouti, M.A.; Da, D.A. Guidelines for the use and interpretation of adsorption isotherm models: A review. J. Hazard. Mater. 2020, 393, 122383. [Google Scholar] [CrossRef] [PubMed]
  51. Ucarli, O.; Yayintas, O.T.; Engin, M.S.; Cay, S.; Saglikoglu, G.; Yilmaz, S. Investigation of competitive and noncompetitive adsorption of some heavy metals ions on Leucodon sciuroides (Hedw.) Schwagr. Langmuir 2020, 36, 8265–8271. [Google Scholar] [CrossRef] [PubMed]
  52. Rout, K.; Mohapatra, M.; Anand, S. Line ferrihydrite: Synthesis, characterization and its adsorption behaviour for removal of Pb(II), Cd(II), Cu(II) and Zn(II) from aqueous solutions. Dalton Trans 2012, 41, 3302–3312. [Google Scholar] [CrossRef]
  53. Hong, C.; Dong, Z.; Zhang, J.; Zhu, L.; Che, L.; Mao, F.; Qiu, Y. Effectiveness and mechanism for the simultaneous adsorption of Pb(II), Cd(II) and As(III) by animal-derived biochar/ferrihydrite composite. Chemosphere 2022, 293, 133583. [Google Scholar] [CrossRef]
  54. Naidu, R.; Kookana, R.S.; Sumner, M.E.; Harter, R.D.; Tiller, K. Cadmium sorption and transport in variable charge soils: A review. J. Environ. Qual. 1997, 26, 602–617. [Google Scholar] [CrossRef]
  55. Baeyens, B.; Fernandes, M.M. Adsorption of heavy metals including radionuclides. In Developments in Clay Science; Schoonheydt, R., Johnston, C.T., Bergaya, F., Eds.; Elsevier: Amsterdam, The Netherlands, 2018; pp. 125–172. [Google Scholar]
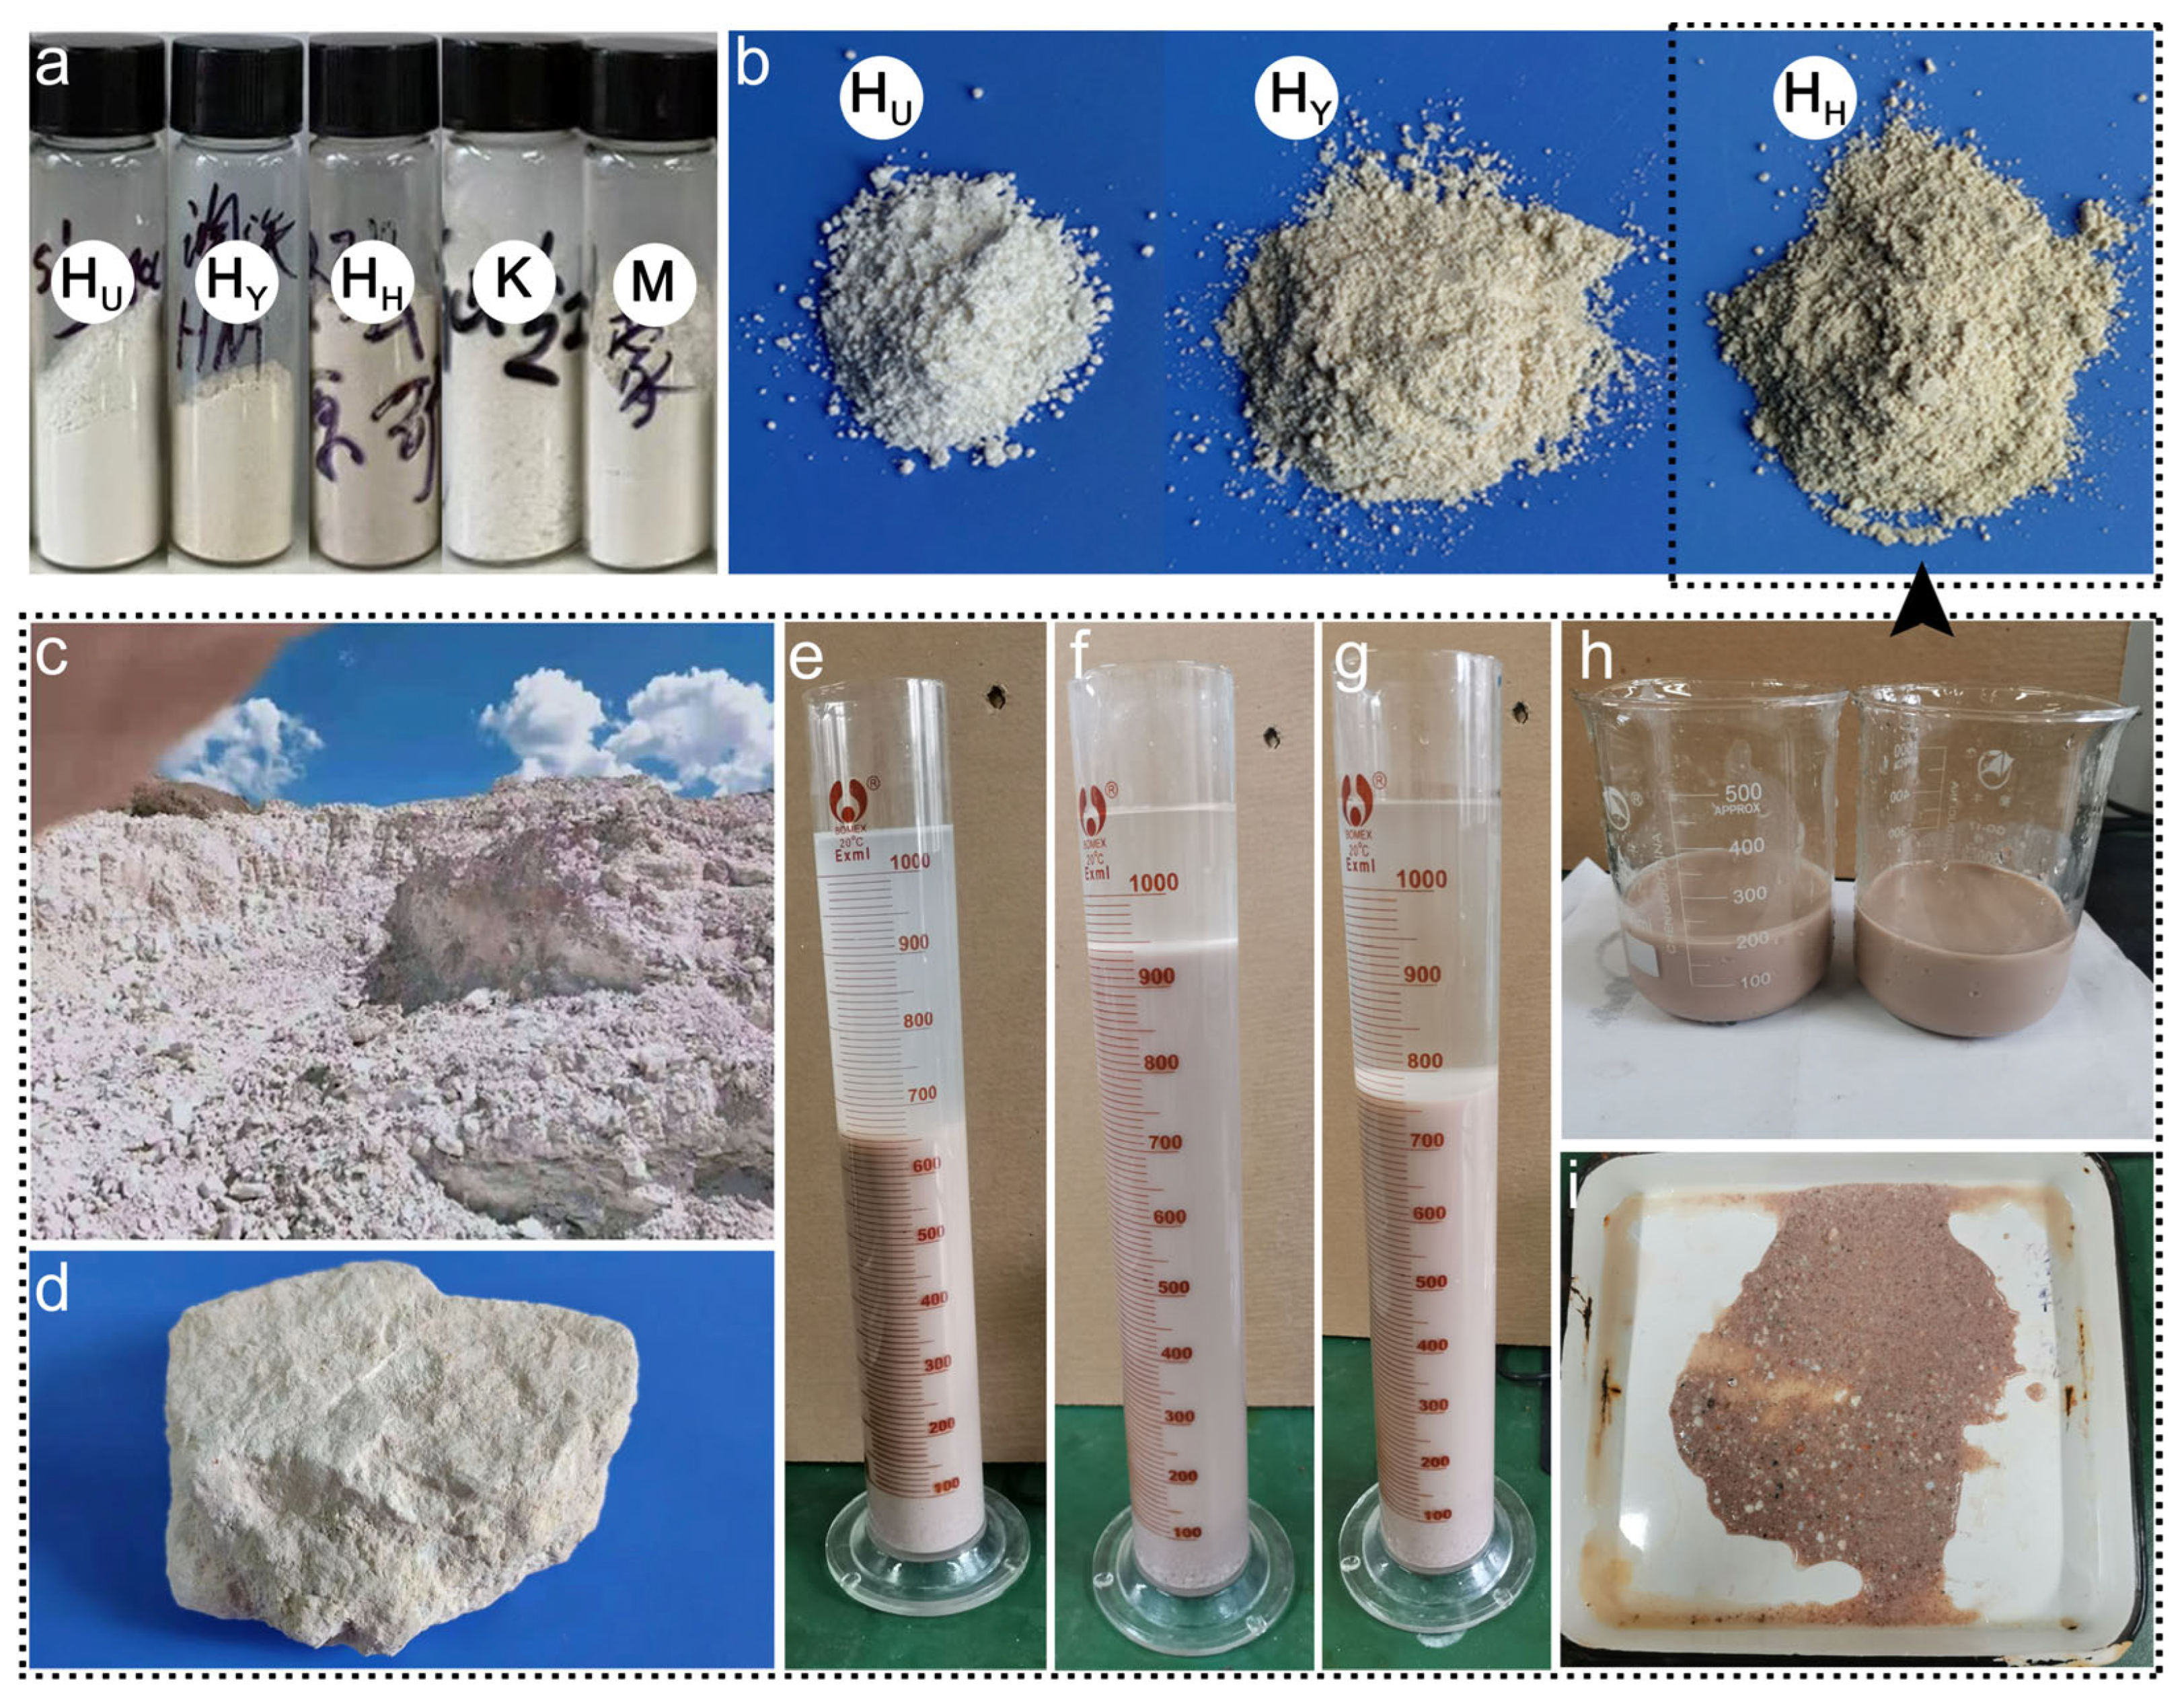
Figure 1. (a) The three halloysite samples used in this study: HU (origin: Utah, USA), HY (origin: Yunnan, China), and HH (origin: Henan, China), along with reference adsorbents montmorillonite (M) and kaolinite (K). (The non-English markings on the sample bottles are original records from the experimental process) (b) Close-up images of three halloysite powder samples. (c,d) The HH sample was obtained through purification of raw ore collected from Kongshan area in the Taihang Mountains, Henan Province, China. The purification process included (e) desalination, (f,i) impurity removal, and (g,h) flocculation–concentration.
Minerals 15 00739 g001
Figure 2. TEM images of halloysite samples from three different origins: (a) HU, (b) HY, and (c) HH, as well as SEM images of (d) halloysite HY, (e) kaolinite, and (f) montmorillonite.
Minerals 15 00739 g002
Figure 3. N2 adsorption–desorption isotherms (a) and pore size distribution curves (b) of clay minerals in this study.
Minerals 15 00739 g003
Figure 4. XRD spectrum (a) and FTIR spectrum (b) of clay mineral samples in this study.
Minerals 15 00739 g004
Figure 5. pH-dependent chemical speciation transformation and removal efficiency of (a) Cd, (b) Zn, and (c) Pb in aqueous solutions (25 °C, initial heavy metal concentration of 50 mg/L, ionic strength of 0.001 M NaNO3).
Minerals 15 00739 g005
Figure 6. Adsorption capacity of Cd2+ (a), Zn2+ (b), and Pb2+ (c) by clay minerals in this study. The lines represent the Langmuir isotherm (metal solutions with ionic strength of 0.001 M, 25 °C, pH = 5.5, and adsorbent dosage of 0.25 g/L; the error estimate was based on the results calculated from three replicate experiments).
Minerals 15 00739 g006
Figure 7. Structure–activity analysis concept map of adsorption variations in halloysite from different sources.
Minerals 15 00739 g007
Table 1. Morphology and dimensions of halloysite nanotubes from different geographical origins.
Sample OriginTagPrimary MorphologyGeometric Dimension 1Aspect Ratio
ID (nm)OD (nm)WT (nm)LR (nm)
Utah, USAHUSlender, short tube10–2813–7010–30100–10004.3
Yunnan, ChinaHYRobust, long tube10–3530–9120–50100–300011.6
Henan, ChinaHHThicker-walled, short tube15–3215–805–3050–25005.1
1 ID: inner diameter; OD: outer diameter; WT: wall thickness; LR: length range.
Table 2. The average pore size, pore volume, and SSA data of clay minerals in this study.
Clay MineralTagAverage Pore Size (nm)Pore Volume (cm3/g)SSA (m2/g)
HalloysiteHU10.90.13348.2
HY12.10.129 42.9
HH11.60.13144.6
MontmorilloniteK28.10.05117.6
KaoliniteM6.80.11870.2
Table 3. Main chemical composition of clay minerals in this study.
Clay MineralMain Chemical Composition (%)Si:Al
SiO2Al2O3Fe2O3CaOMgOK2ONa2OTiO2IL 1
HU45.1935.430.330.260.120.070.070.0215.701.08
HY43.9938.570.620.280.190.180.090.1517.530.97
HH45.3535.070.900.510.390.160.280.0316.021.10
K45.6638.900.290.010.090.170.030.3713.601.01
M56.2121.760.752.994.990.260.220.3213.362.20
1 IL: loss on ignition.
Table 4. FTIR vibrational band assignments for halloysites, Al2O3, and SiO2 [41,42,43,44].
Wavenumber (cm−1)AssignmentWavenumber (cm−1)Assignment
3698Inner-surface Al–OH stretch800Si–O–Si bend
3621Inner Al–OH stretch754Transverse Si–O stretch
3436Adsorbed H2O–OH stretch691Transverse Si–O stretch
1635Adsorbed H2O–OH bend562Si–O stretch
1090/1031In-plane Si–O stretch536Al–O–Si bend
949Si–OH bend465Si–O–Si bend
913Inner Al–OH bend437Si–O bend
Table 5. Parameters from isotherm models of Cd2+, Zn2+, and Pb2+ adsorption in this study.
Metal IonsClayLangmuir ModelFreundlich Model
KL (L/mg)qmax (mg/g)R2nKf (mg/g)(L/mg)1/nR2
Cd2+HU0.047.80.9333.712.70.954
HY0.0310.10.8913.313.80.925
HH0.038.20.8843.512.40.917
K0.015.20.9127.310.20.935
M0.0615.80.9312.914.80.957
Zn2+HU0.042.70.9384.112.00.945
HY0.043.20.9513.712.20.935
HH0.032.90.9243.911.90.958
K0.021.80.9038.29.80.864
M0.075.40.9593.113.90.991
Pb2+HU0.0725.50.9424.213.50.966
HY0.0630.60.9473.613.70.974
HH0.0627.40.9524.013.10.961
K0.0412.30.9366.810.80.944
M0.0942.70.9152.717.70.926
Table 6. Comparison of halloysite sources, adsorption conditions, and qₘₐₓ values with previous studies.
Metal IonsHalloysite Mining LocationAdsorption Experimental Conditionsqmax (mg/g)Ref.
Cd2+Lower Silesia, PolandpH = 5.0, 25 °C1.2[15]
Lower Silesia, PolandpH = 5.0, 25 °C2.1[16]
Lower Silesia, PolandpH = 5.00.5[17]
Utah, USA (HU)pH = 5.5, 25 °C, ionic strength of 0.001 M7.8This study
Yunnan, China (HY)pH = 5.5, 25 °C, ionic strength of 0.001 M10.1This study
Hennan, China (HH)pH = 5.5, 25 °C, ionic strength of 0.001 M8.2This study
Zn2+Lower Silesia, PolandpH = 5.0, 25 °C1.8[16]
Lower Silesia, PolandpH = 5.00.1[17]
Guangzhou, ChinapH = 6.0, 20 °C, ionic strength of 0.01 M9.8[18]
Utah, USA (HU)pH = 5.5, 25 °C, ionic strength of 0.001 M2.7This study
Yunnan, China (HY)pH = 5.5, 25 °C, ionic strength of 0.001 M3.2This study
Hennan, China (HH)pH = 5.5, 25 °C, ionic strength of 0.001 M2.9This study
Pb2+Lower Silesia, PolandpH = 5.0, 25 °C7.5[15]
Lower Silesia, PolandpH = 5.0, 25 °C8.1[16]
Lower Silesia, PolandpH = 5.08.1[17]
New ZealandpH = 5.0, 25 °C84.0[19]
Hebei, ChinapH = 6.0, 25 °C11.2[20]
Utah, USA (HU)pH = 5.5, 25 °C, ionic strength of 0.001 M25.5This study
Yunnan, China (HY)pH = 5.5, 25 °C, ionic strength of 0.001 M30.6This study
Hennan, China (HH)pH = 5.5, 25 °C, ionic strength of 0.001 M27.4This study
Table 7. Structure–activity relationships of heavy metal adsorption by halloysite nanotubes.
HalloysiteMorphologySSA
(m2/g)
Si:AlFTIR Transmittance Reduction at Al–OH (%)qmax (mg/g)
3698 cm−13621 cm−1913 cm−1Cd2+Zn2+Pb2+
HUShort tube48.21.082019297.82.725.5
HYLong tube42.90.9767687610.13.230.6
HHShort tube44.61.105052628.22.927.4
Disclaimer/Publisher’s Note: The statements, opinions and data contained in all publications are solely those of the individual author(s) and contributor(s) and not of MDPI and/or the editor(s). MDPI and/or the editor(s) disclaim responsibility for any injury to people or property resulting from any ideas, methods, instructions or products referred to in the content.