Article

The Mazenod–Sue–Dianne IOCG District of the Great Bear Magmatic Zone Northwest Territories, Canada

1
Department of Geology, Brandon University, Brandon, MB R7A 6A9, Canada
2
Alamos Gold Island Gold Mine, Dubreuilville, ON P0S 1B0, Canada
*
Author to whom correspondence should be addressed.
Minerals 2025, 15(7), 726; https://doi.org/10.3390/min15070726
Submission received: 9 April 2025 / Revised: 25 June 2025 / Accepted: 1 July 2025 / Published: 11 July 2025

Abstract

The Mazenod Lake region of the southern Great Bear Magmatic Zone (GBMZ) of the Northwest Territories, Canada, comprises the north-central portion of the Faber volcano-plutonic belt. Widespread and abundant surface exposure of several coalescing hydrothermal systems enables this paper to document, without ambiguity, the relationships between geology, structure, alteration, and mineralization in this well exposed iron-oxide–copper–gold (IOCG) mineral system. Mazenod geology comprises rhyodacite to basaltic-andesite ignimbrite sheets with interlayered volcaniclastic sedimentary rocks dominated by fine-grained laminated tuff sequences. Much of the intermediate to mafic nature of volcanic rocks is masked by low-intensity but pervasive metasomatism. The region is affected by a series of coalescing magmatic–hydrothermal systems that host the Sue–Dianne magnetite–hematite IOCG deposit and several related showings including magnetite, skarn, and iron oxide apatite (IOA) styles of alteration ± mineralization. The mid to upper levels of these systems are exposed at surface, with underlying batholith, pluton and stocks exposed along the periphery, as well as locally within volcanic rocks associated with more intense alteration and mineralization. Widespread alteration includes potassic and sodic metasomatism, and silicification with structurally controlled giant quartz complexes. Localized tourmaline, skarn, magnetite–actinolite, and iron-oxide alteration occur within structural breccias, and where most intense formed the Sue–Dianne Cu-Ag-Au diatreme-like breccia deposit. Magmatism, volcanism, hydrothermal alteration, and mineralization formed during a negative tectonic inversion within the Wopmay Orogen. This generated a series of oblique offset rifted basins with continental style arc magmatism and extensional structures unique to GBMZ rifting. All significant hydrothermal centers in the Mazenod region occur along and at the intersections of crustal faults either unique to or put under tension during the GBMZ inversion.

1. Introduction

This paper documents and discusses the evolution of magmatic–hydrothermal iron-oxide–copper–gold (IOCG) systems in the Mazenod Lake, in the Sue–Dianne region of the southern Great Bear Magmatic Zone (GBMZ) of the Northwest Territories, Canada. The relationships between geology, structure, alteration, and mineralization are investigated. Widespread semi-continuous surface exposure through the core and periphery of several coalescing hydrothermal centers, regional host rocks, and source intrusions enables, without ambiguity, analysis of a magmatic–hydrothermal IOCG system. It provides excellent regional IOCG context for those exploring or carrying out research in areas with little or no outcrop exposure. The study region covers the northern part of the 1.87 Ga Faber volcanic belt and bordering plutons (Figure 1). The NICO Au-Co-Bi-Cu magnetite-hosted IOCG deposit is located about 8 km southeast of the study area within a 1.88 Ga metasedimentary basin at its unconformity with Faber belt volcanic rocks [1,2,3,4]. The current understanding of the interrelationships among the region’s magmatic, volcanic and sedimentary rocks, hydrothermal alteration (metasomatism), mineralization, and tectonic features is facilitated by good outcrop exposure along with detailed geological mapping, geophysics, local diamond drilling, and subsequent mineralogical and geochemical studies. In this paper, we use the term IOCG systems to refer to sulphur-poor magmatic hydrothermal systems that generate IOCG, IOA, and affiliated deposits [5,6]. We follow the general broad classification of IOCG and affiliated deposits given by Williams [7].
Regional 1.87 Ga IOCG volcano–plutonic systems formed in the GBMZ during a short-lived negative tectonic inversion coeval with the development of 1.87 Ga intra-arc sedimentary rift fill basins, and underlying emplacement of pan GBMZ batholiths. Batholith emplacement along with extensive ignimbrite cover continued through to the youngest recorded intrusions at ~1.85 Ga. Magmatism, along with extensive tectonic disruption, led to widespread penetrative and intense metasomatism and mineralization including iron-oxide–apatite (IOA), iron-oxide–copper–gold (IOCG), skarn, albitite hosted uranium, epithermal, and affiliated deposits and prospects [2,4,8,9,10,11,12,13,14,15,16,17,18,19,20,21].
This paper documents and discusses the greater Mazenod district IOCG systems, which host the Sue–Dianne magnetite–hematite IOCG deposit and several other mineral prospects. Detailed mapping in the northern Mazenod Region (Sue–Dianne area) was primarily conducted from 1995 to 1997 by a team of Geologists from Fortune Minerals, Ltd., Brandon University, and Western University [2,3,4,22]. Further geological mapping was carried out in parts of the Mazenod and Sue–Dianne region by the Geological Survey of Canada [23,24]. The current study is based on detailed geological mapping that was carried out in the central and southern Mazenod Lake regions during the summers of 2012 and 2013 by the authors and a team of geologists from BFR Copper and Gold Inc. and Brandon University [25]. Additional reconnaissance visits to the region were intermittently conducted up to ~2019 by geologists from the Geological Survey of Canada and Fortune Minerals Ltd. [14,15]. Magnetic and radiometric geophysical surveys and satellite imagery referred to in this study were acquired by BFR Copper and Gold Inc. in 2012, and by the Geological Survey of Canada [26,27]. This paper combines the results of detailed geological fieldwork with various follow-up mineralogical, alteration, geochemical, and structural investigations carried out mostly since 2012. Geological mapping presented in this report is corroborated by ~906 field samples with geochemical analyses, as well as satellite imagery, airborne geophysical surveys, geochemical discrimination, and regional hydrothermal alteration and structural investigations. The current work was supported primarily by BFR Copper and Gold Inc., with work in the Sue–Dianne area supported mainly by Fortune Minerals Limited.
Figure 1. Geology of the Mazenod Lake region, Great Bear Magmatic Zone, NWT [24].
Minerals 15 00726 g001

2. Great Bear Magmatic Zone

The Great Bear Magmatic Zone (GBMZ) lies along the northwest margin of the Canadian Shield extending northward from Great Slave Lake to the eastern shoreline of Great Bear Lake. The exposed part of the GBMZ forms a triangular wedge extending approximately 450 km north-south and reaching a maximum exposed east-west width of about 100 km. The GBMZ is unconformably overlain by Paleoproterozoic siliciclastic and carbonate sedimentary rocks of the Hornby Bay basin at its northern limits and is known to continue southwest under Paleozoic cover rocks of the Mackenzie Platform (Figure 1) [10,28,29].
The GBMZ comprises the western segment of the Wopmay Orogen, an Andean style accretionary orogenic belt that formed along the western boundary of the Archean Slave craton. From east to west, the Wopmay Orogen is now divided into the Coronation margin, the Metamorphic Internal Zone, and the focus of this investigation the Great Bear Magmatic Zone. The western edge of the GBMZ is bounded by the older Hottah Terrane continental volcanic arc and the eastern edge abuts the Metamorphic Internal Zone (Wopmay fault zone) to the east. The Metamorphic Internal Zone is a significant belt of crustal deformation where syn to pre GBMZ rocks have been folded and faulted along a northern axial trace [30]. The Wopmay Orogen is the result of protracted eastward subduction and the accretion of the northward translated Hottah Terrane under an accretionary wedge and the Slave craton prior to GBMZ formation. About 30% of the GBMZ is comprised of 1.87 Ga felsic-to-intermediate calc-alkaline-to-shoshonitic volcano–plutonic intra-arc basins that have been extensively metasomatized and mineralized. Volcanic rocks include an extensive 1.86 Ga ignimbritic cover over an underlying 1.88 Ga inverted sedimentary basin, also extensively metasomatized. The remaining 70% are granitoid batholiths and plutons ranging from syn-volcanic to younger ages that postdate the magmatic hydrothermal activity [4,19,24,28,31,32,33,34,35,36,37,38,39].
Metamorphism and deformation in the GBMZ are limited. Rocks are at sub-greenschist facies with no regional penetrative ductile deformation and metamorphic foliation except along the Wopmay fault zone where ductile deformation and metamorphic foliation can occur. Some localized fluid-induced zones of ductile deformation are observed, associated with early syn-tectonic 1.876 Ma magma emplacement of granitic dikes and zones of high-temperature metasomatism. These tectonic movements are related to the development of intra-arc 1.87 Ga rifted basins that are now highly segmented, interlinked by transverse fault zones, and partially to largely obscured by the emplacement of batholiths [14,30,40,41].
The entire GBMZ is cut by a series of northeast-trending crustal-scale transverse dextral faults that systematically offset southeast trending supracrustal volcanic and sedimentary belts. These structures are oblique to the subduction front of the GBMZ and were active during and after formation of the GBMZ. A second, in part older orthogonal set of belt parallel (north-south) structures occur in direct association with the 1.87 Ga magmatism, hydrothermal alteration and mineralization. At least some of the older structures are interpreted to have been active during Wopmay Orogen compression and were reactivated during formation of the GBMZ. Great Bear magmatism is interpreted as a continental arc superimposed on an older series of intra-arc sedimentary basins interlinked by transverse faults, all of which formed in response to a negative tectonic inversion during the Wopmay Orogen [28,34,35,39,41,42,43,44,45].

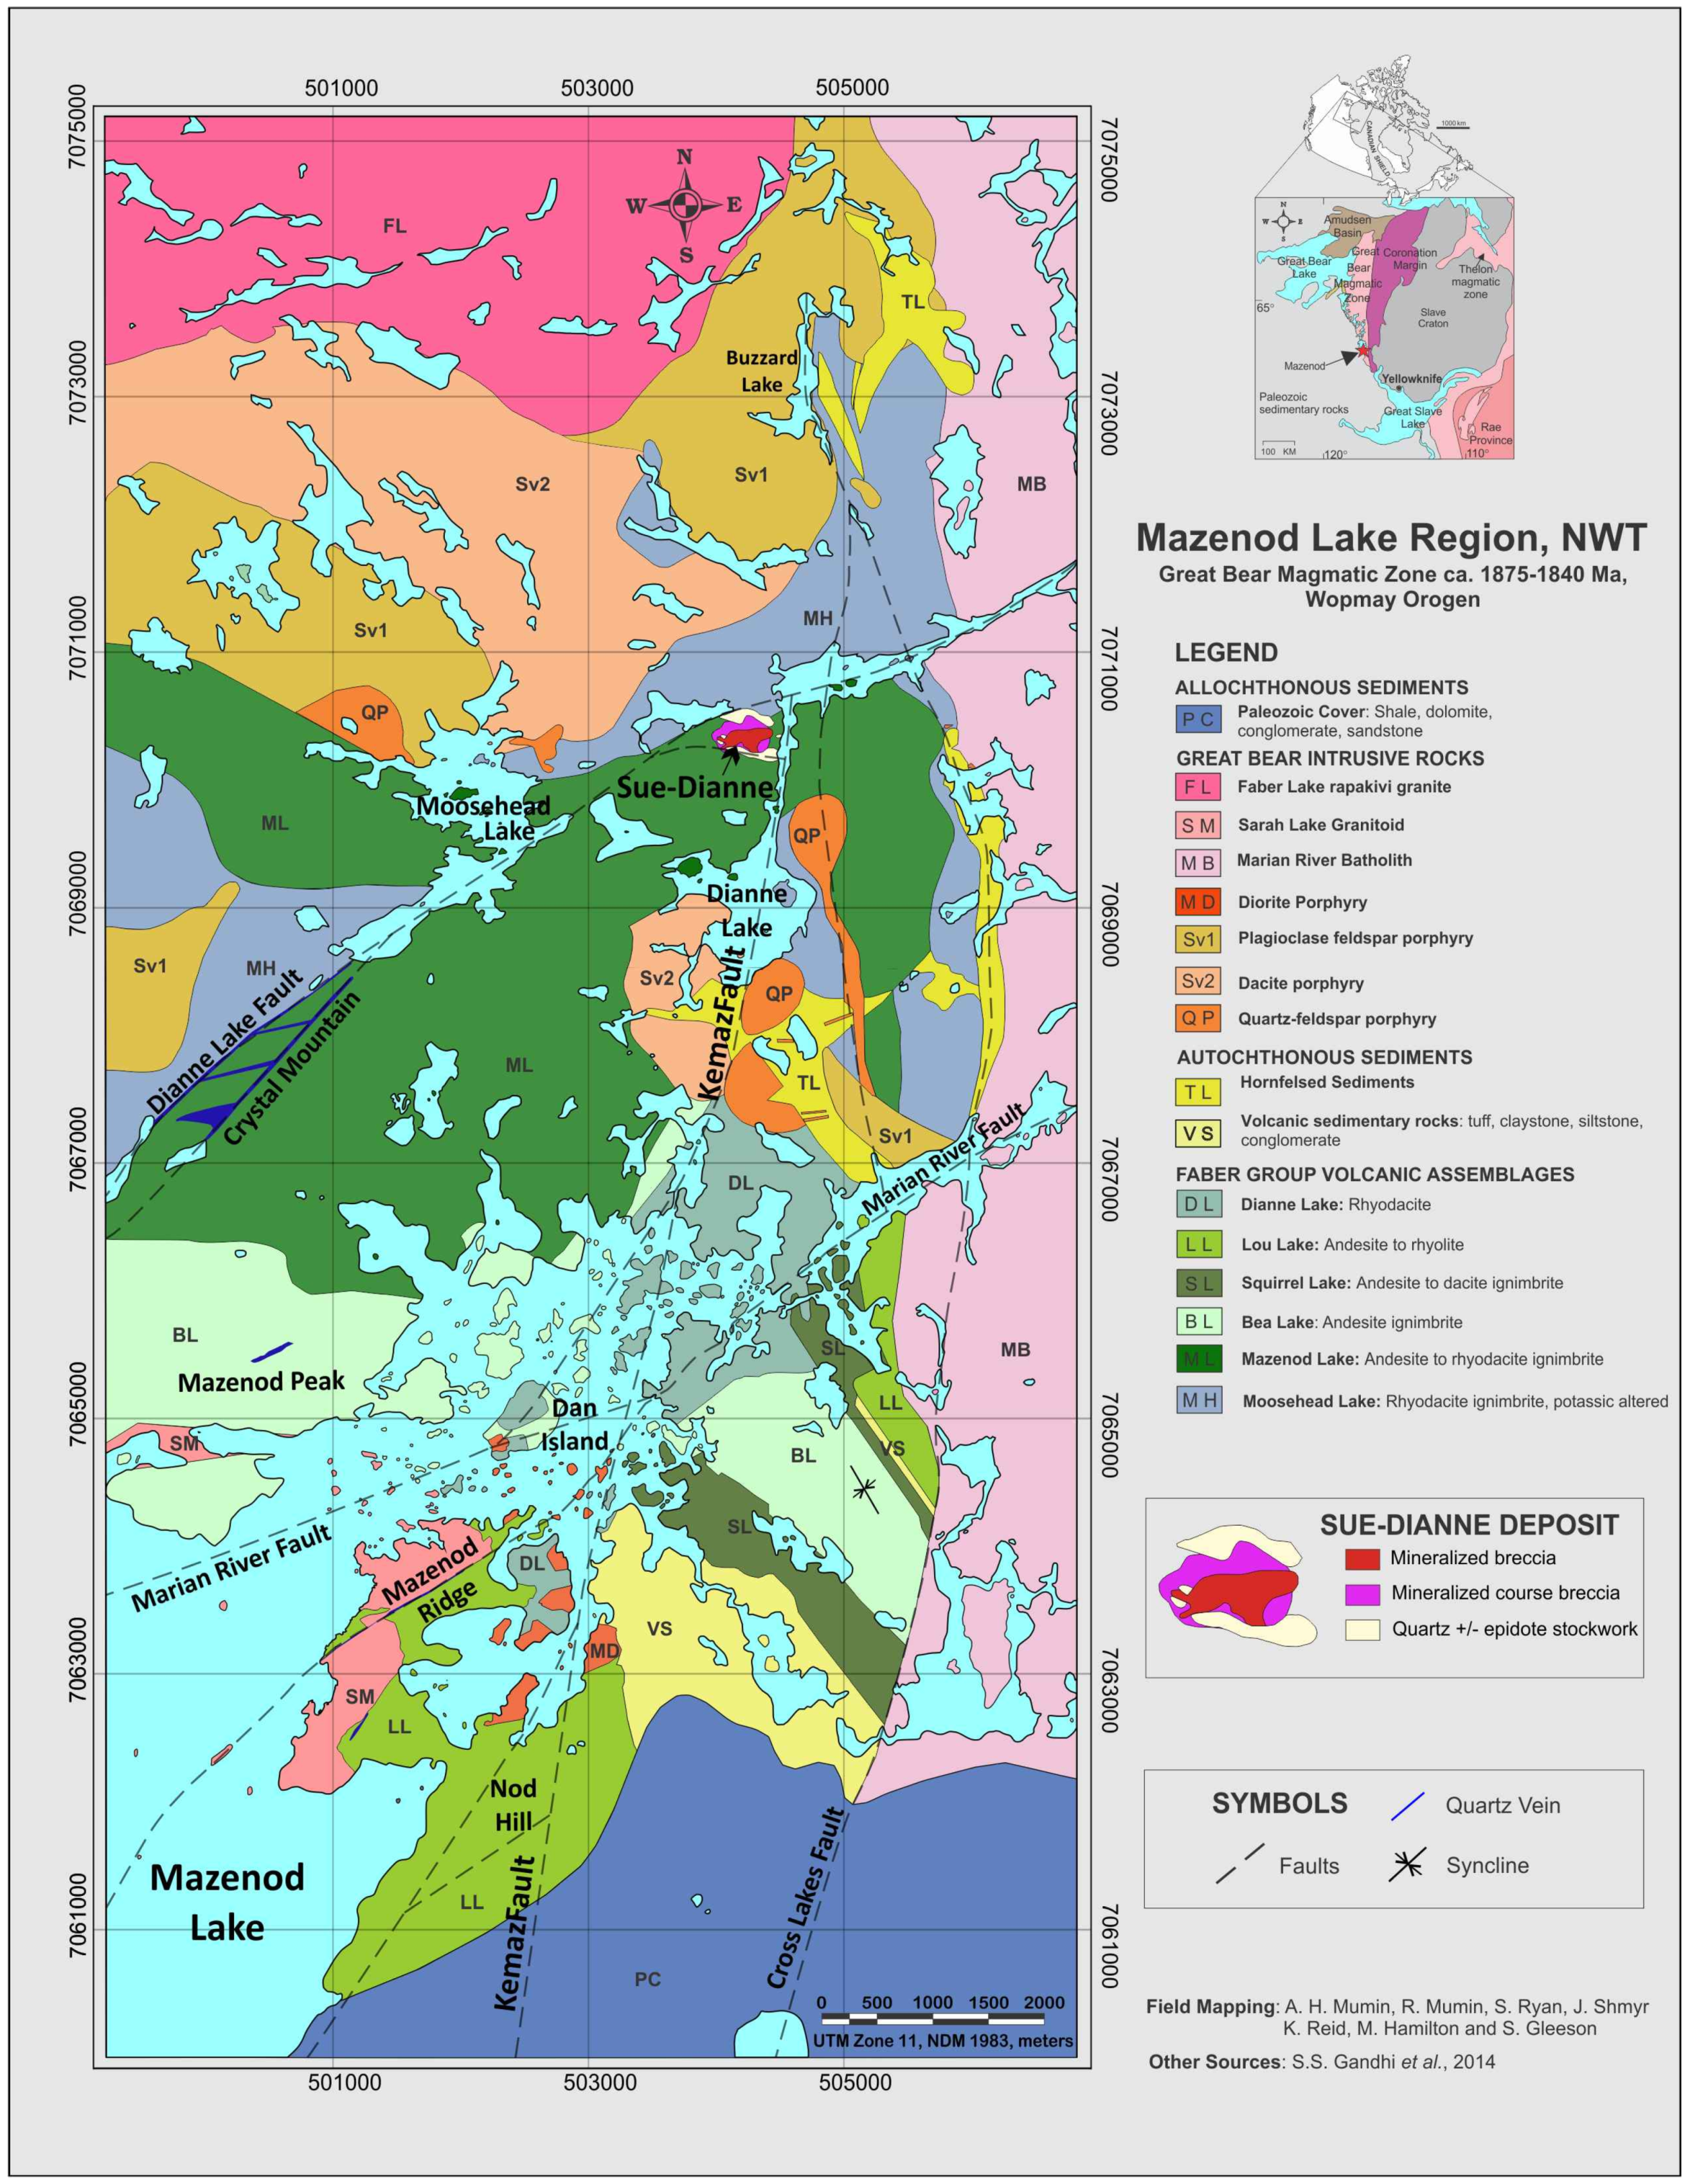
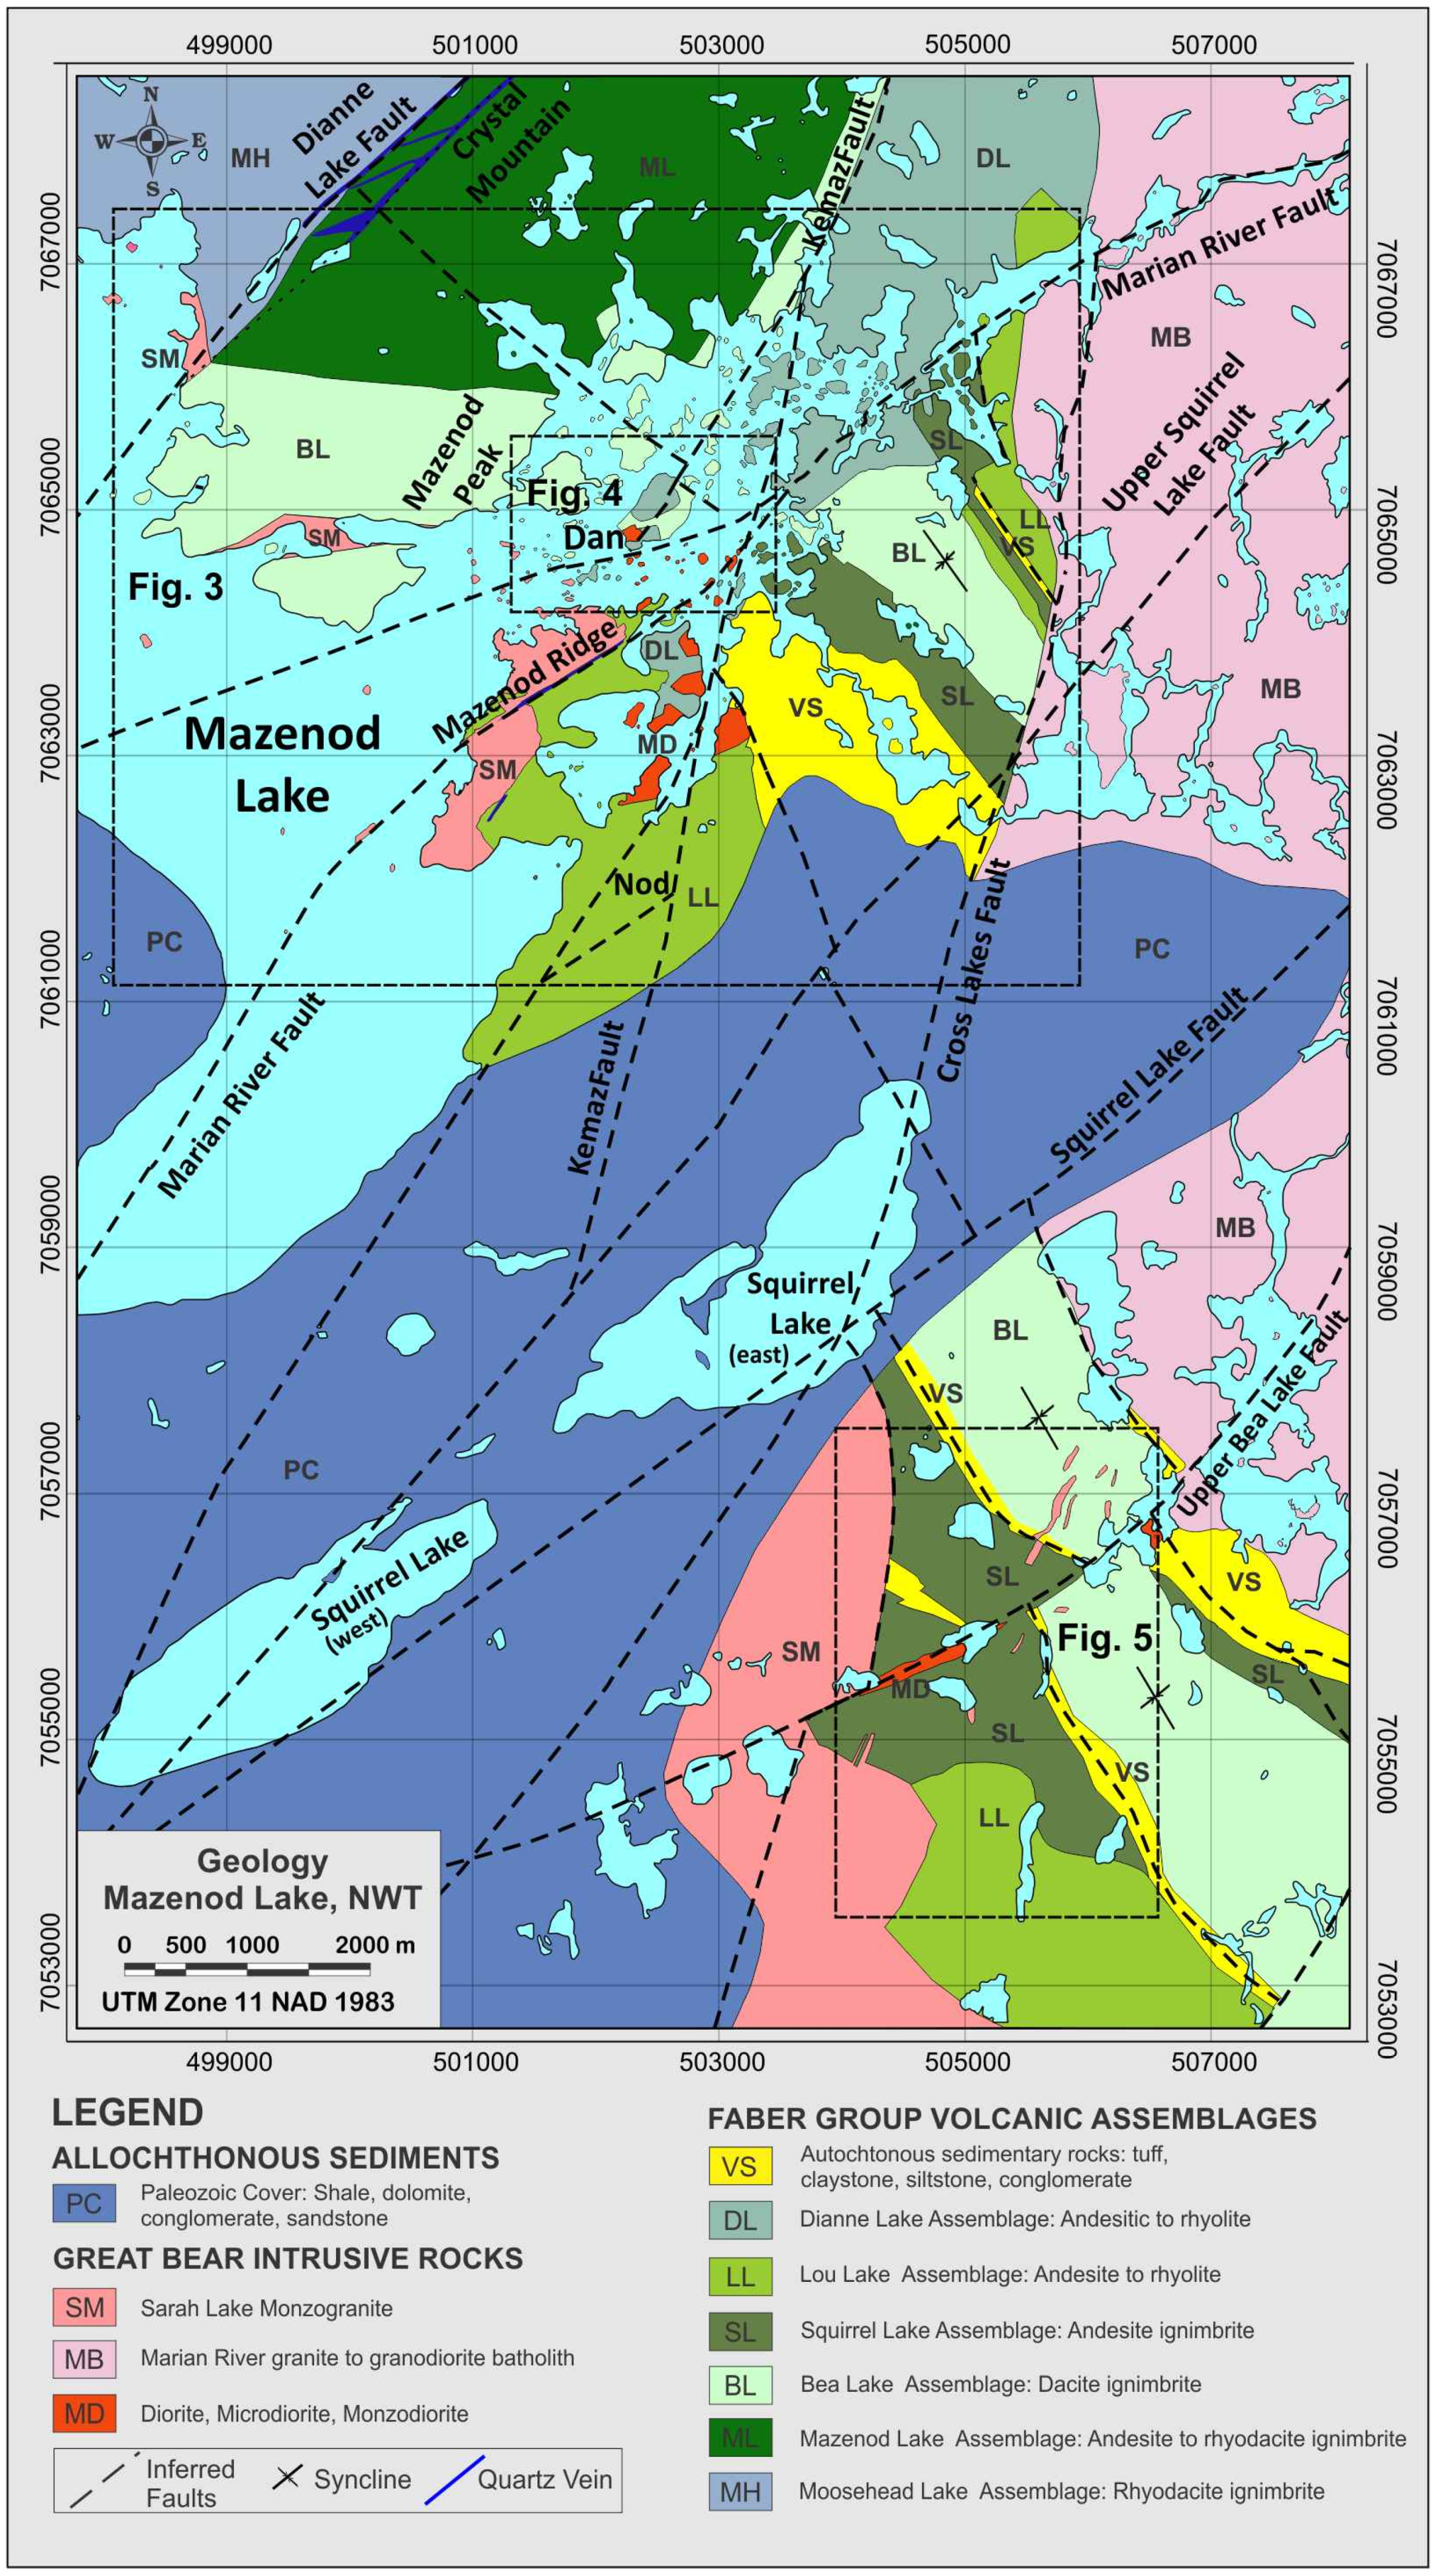
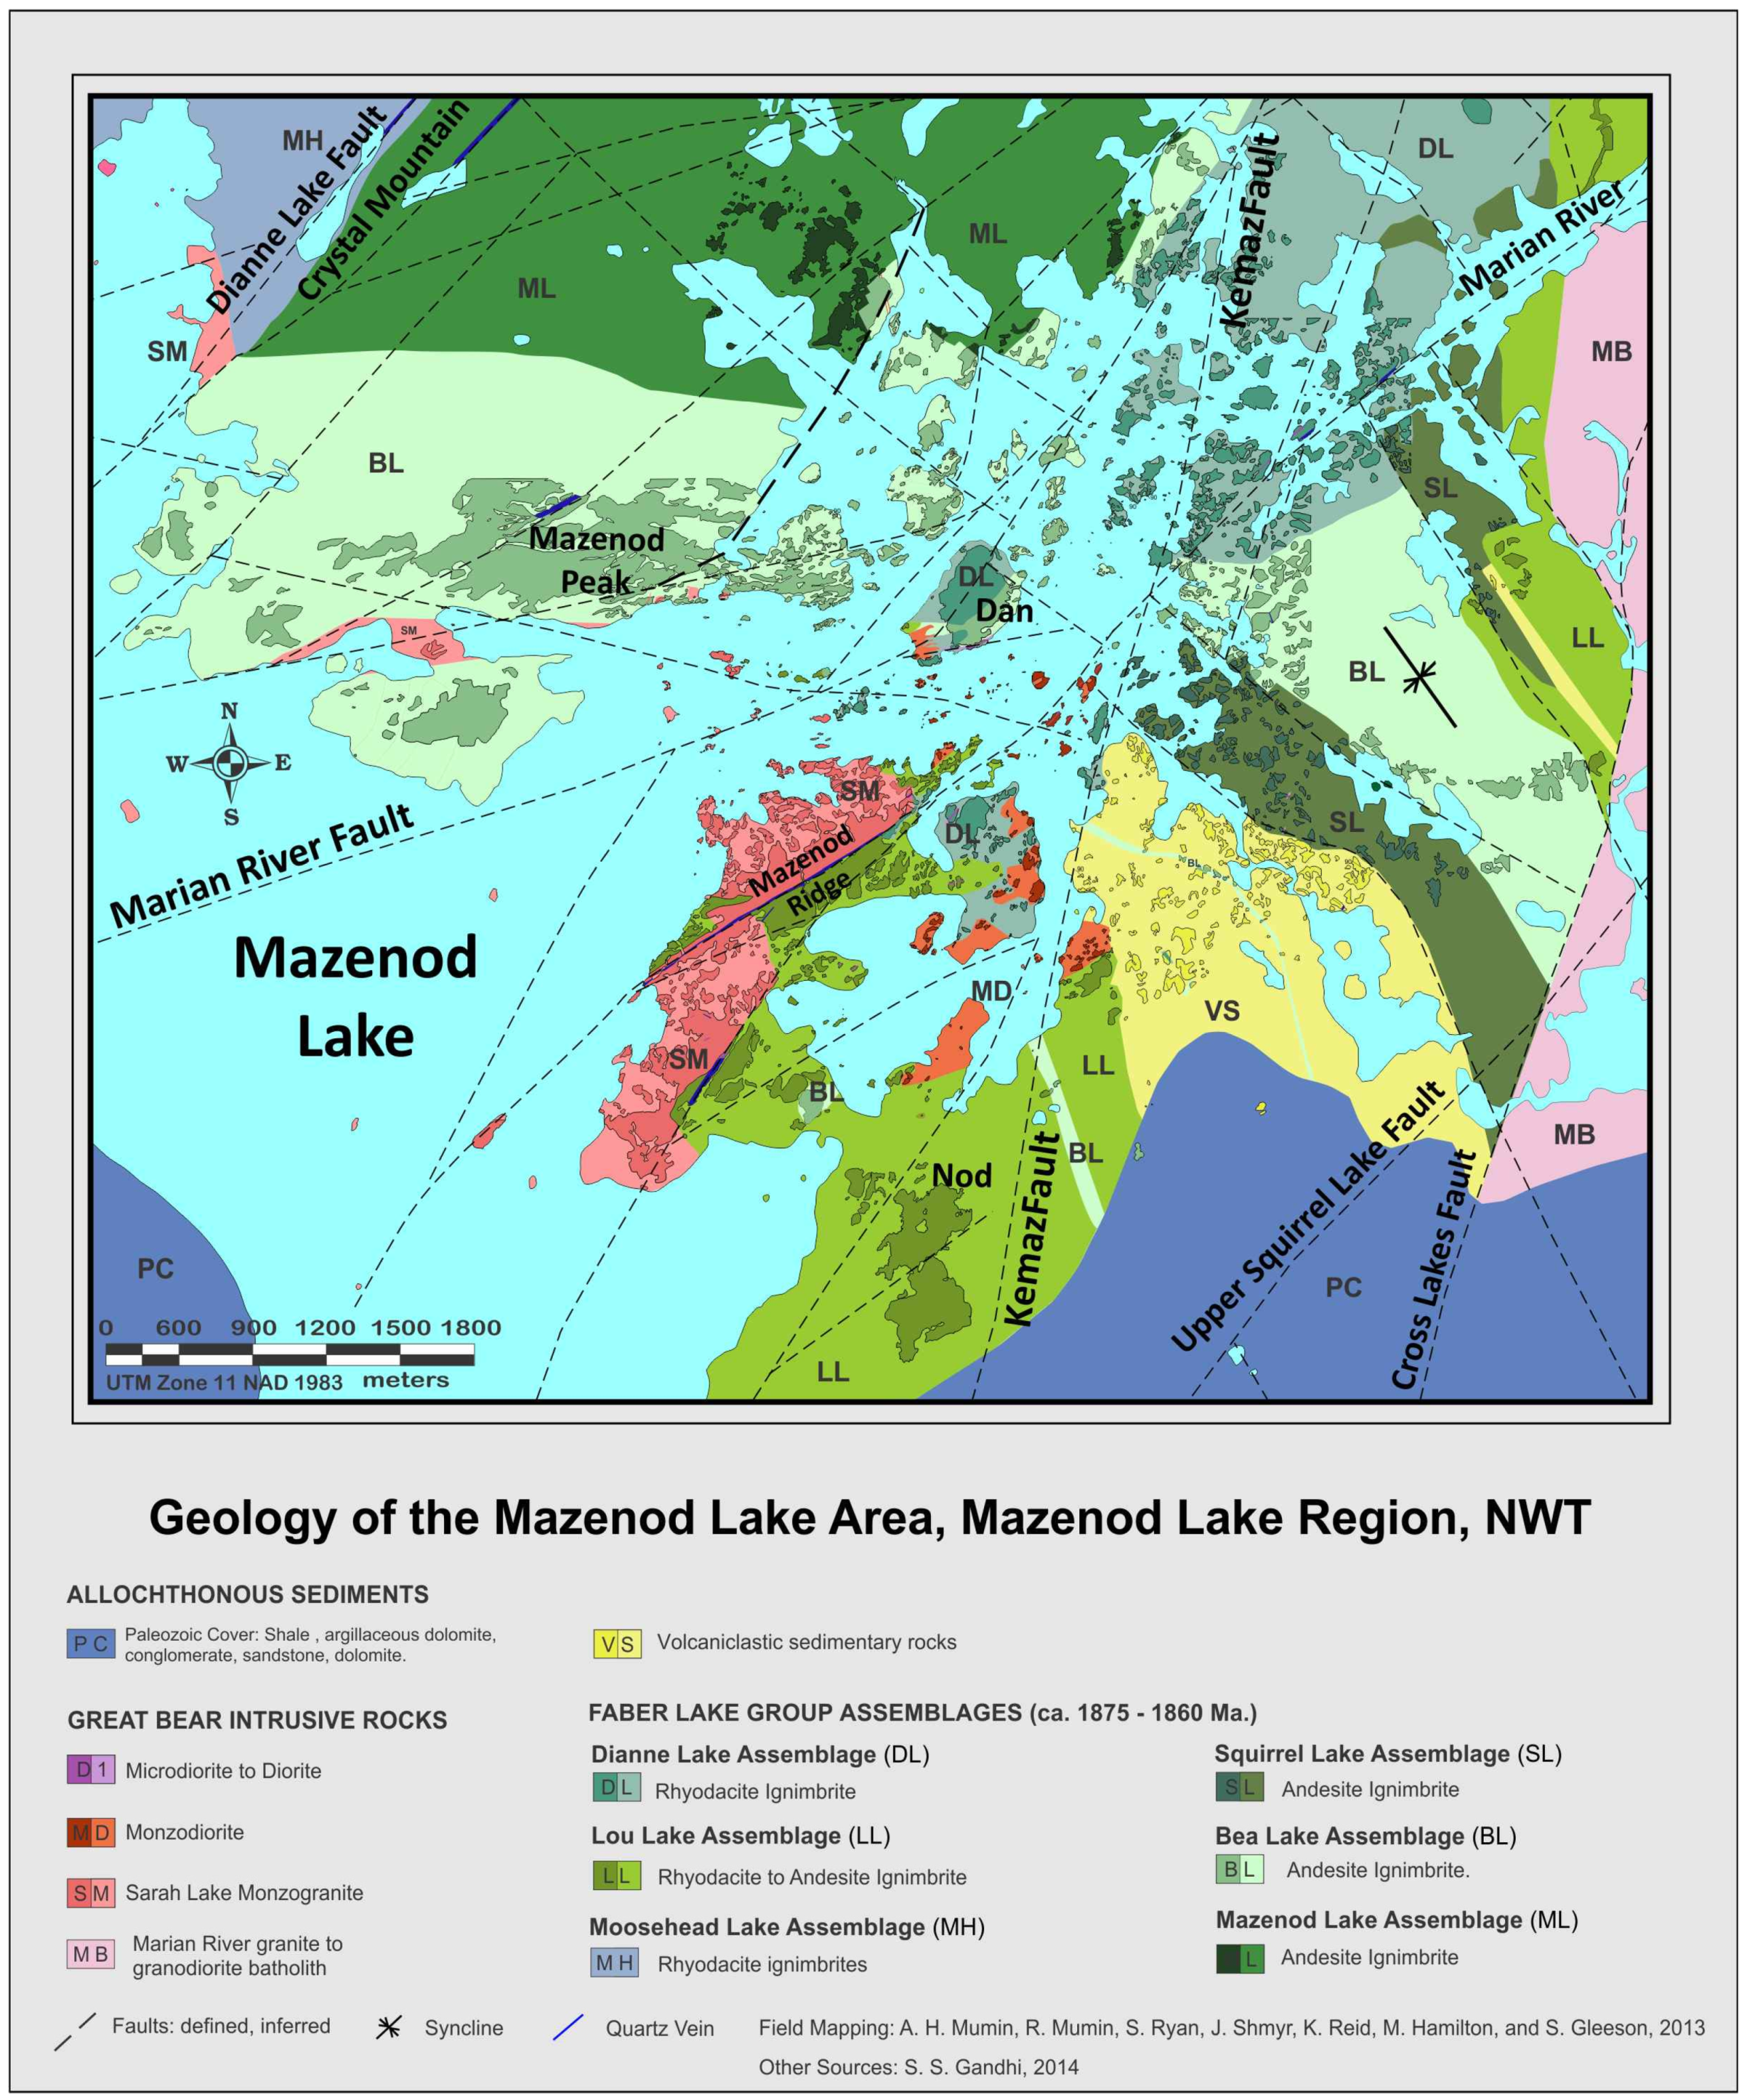
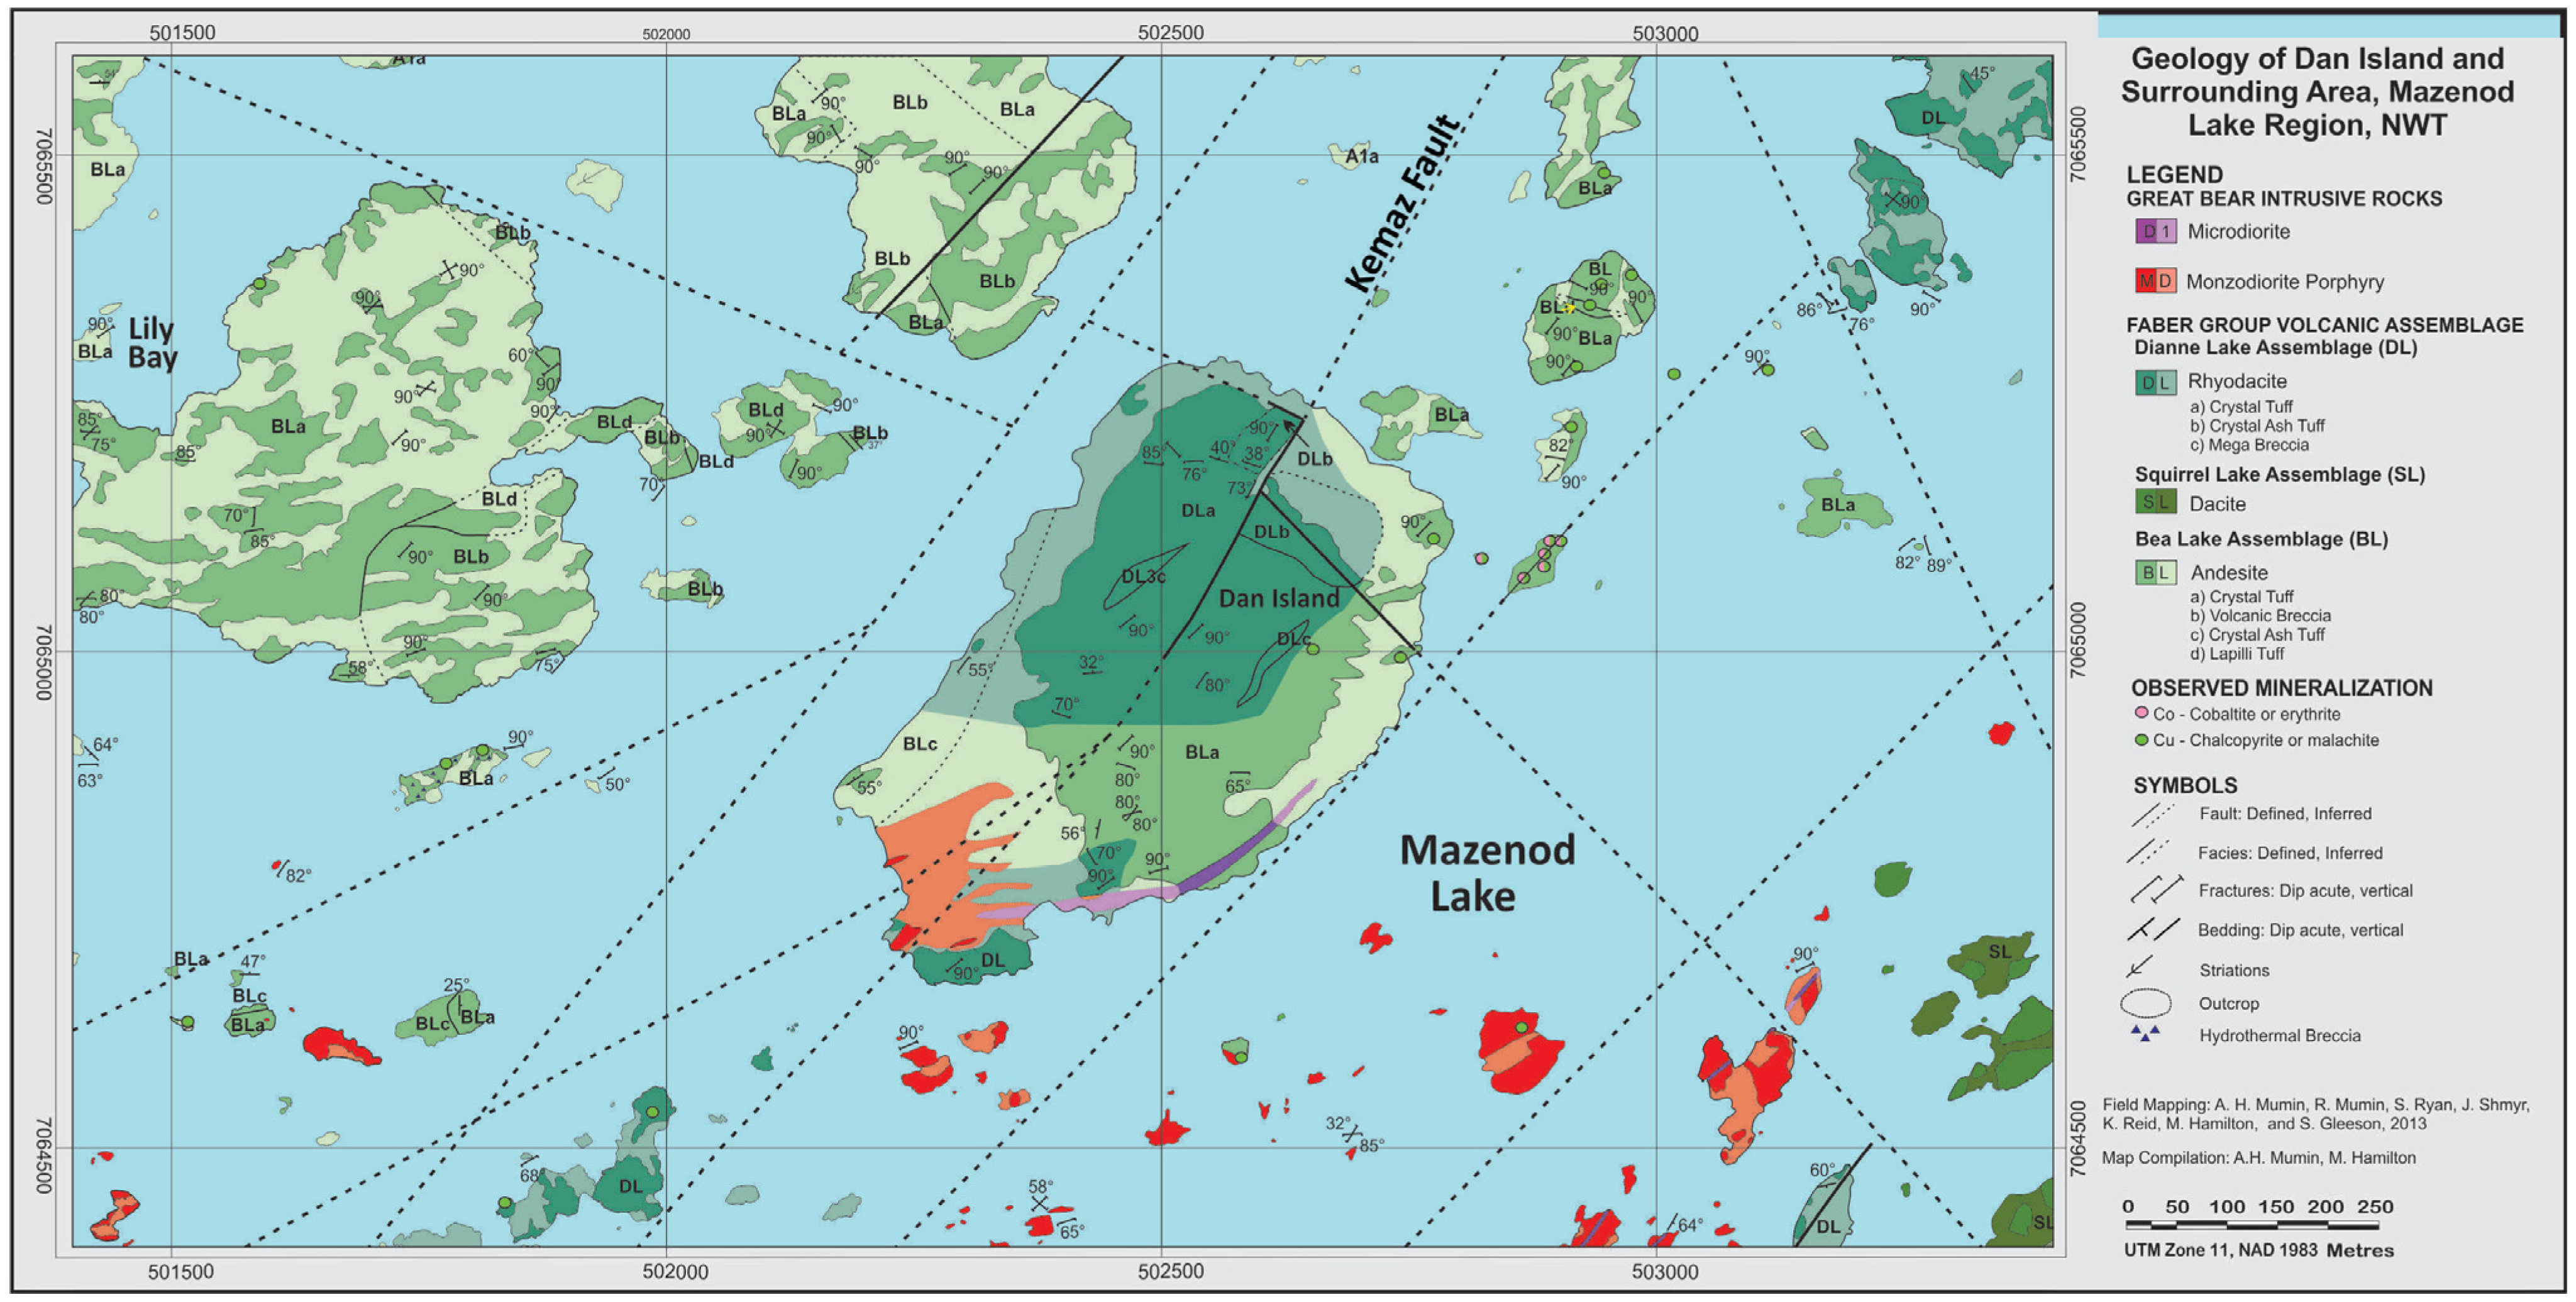
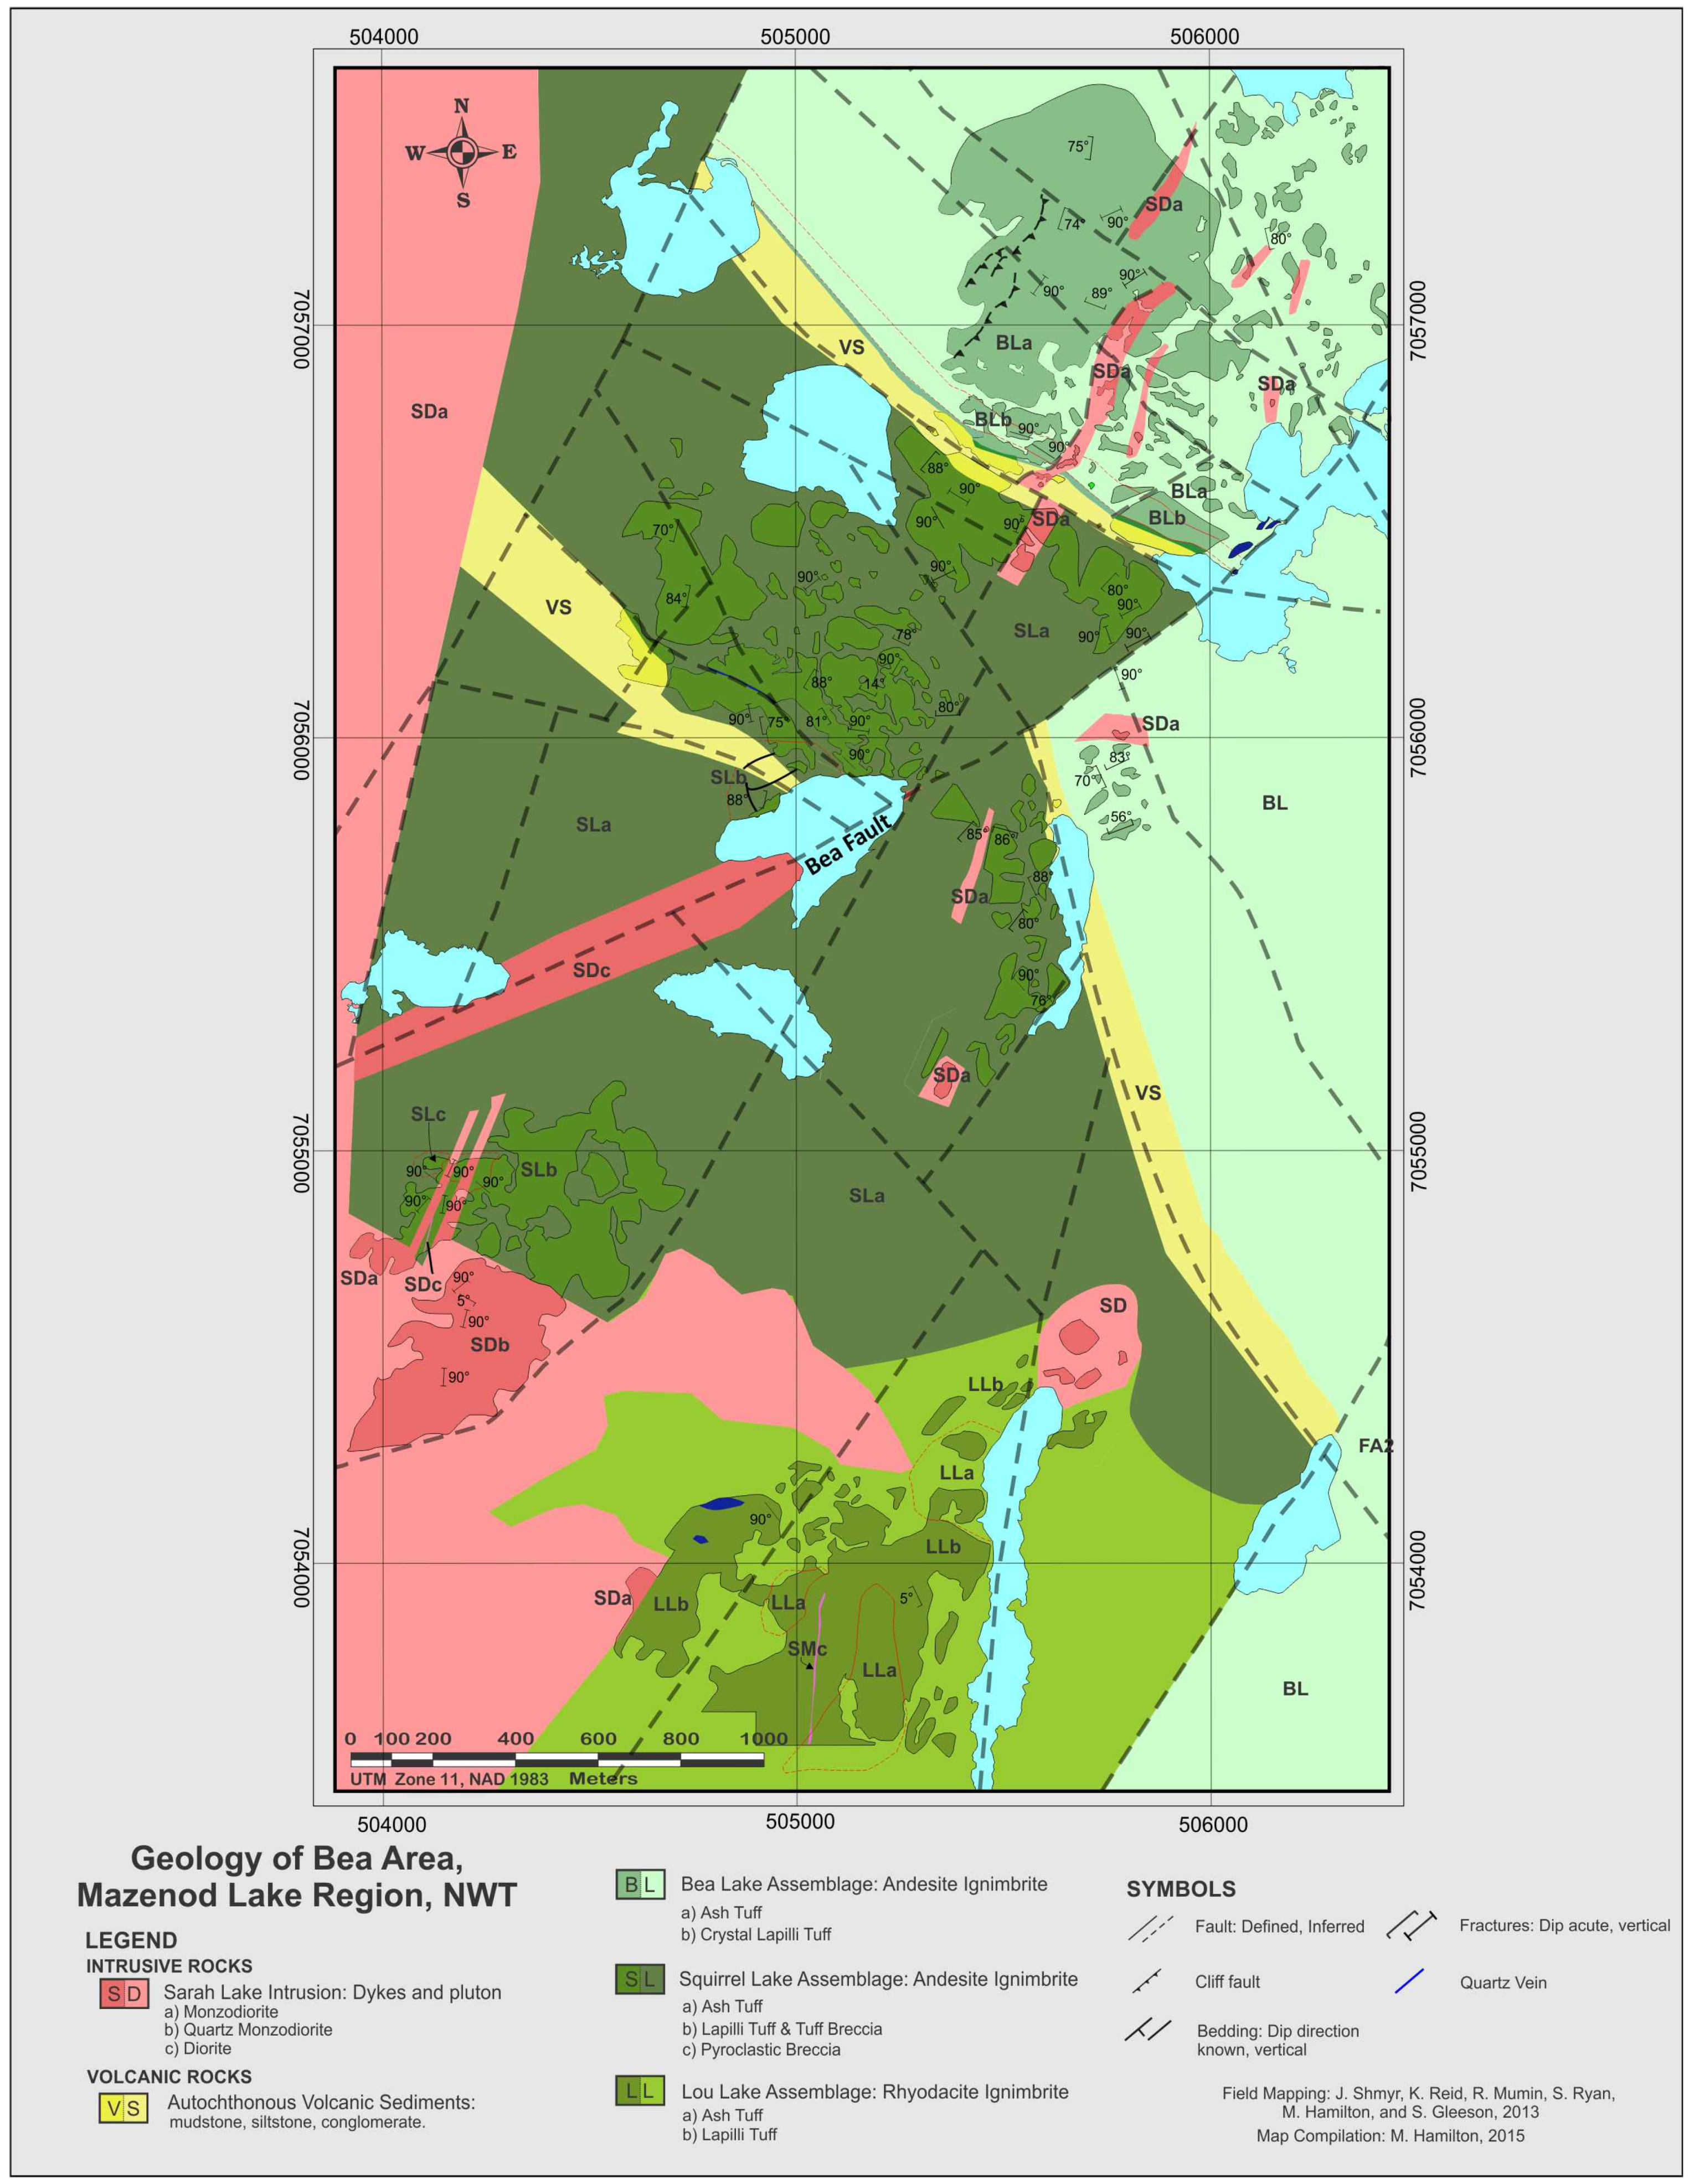
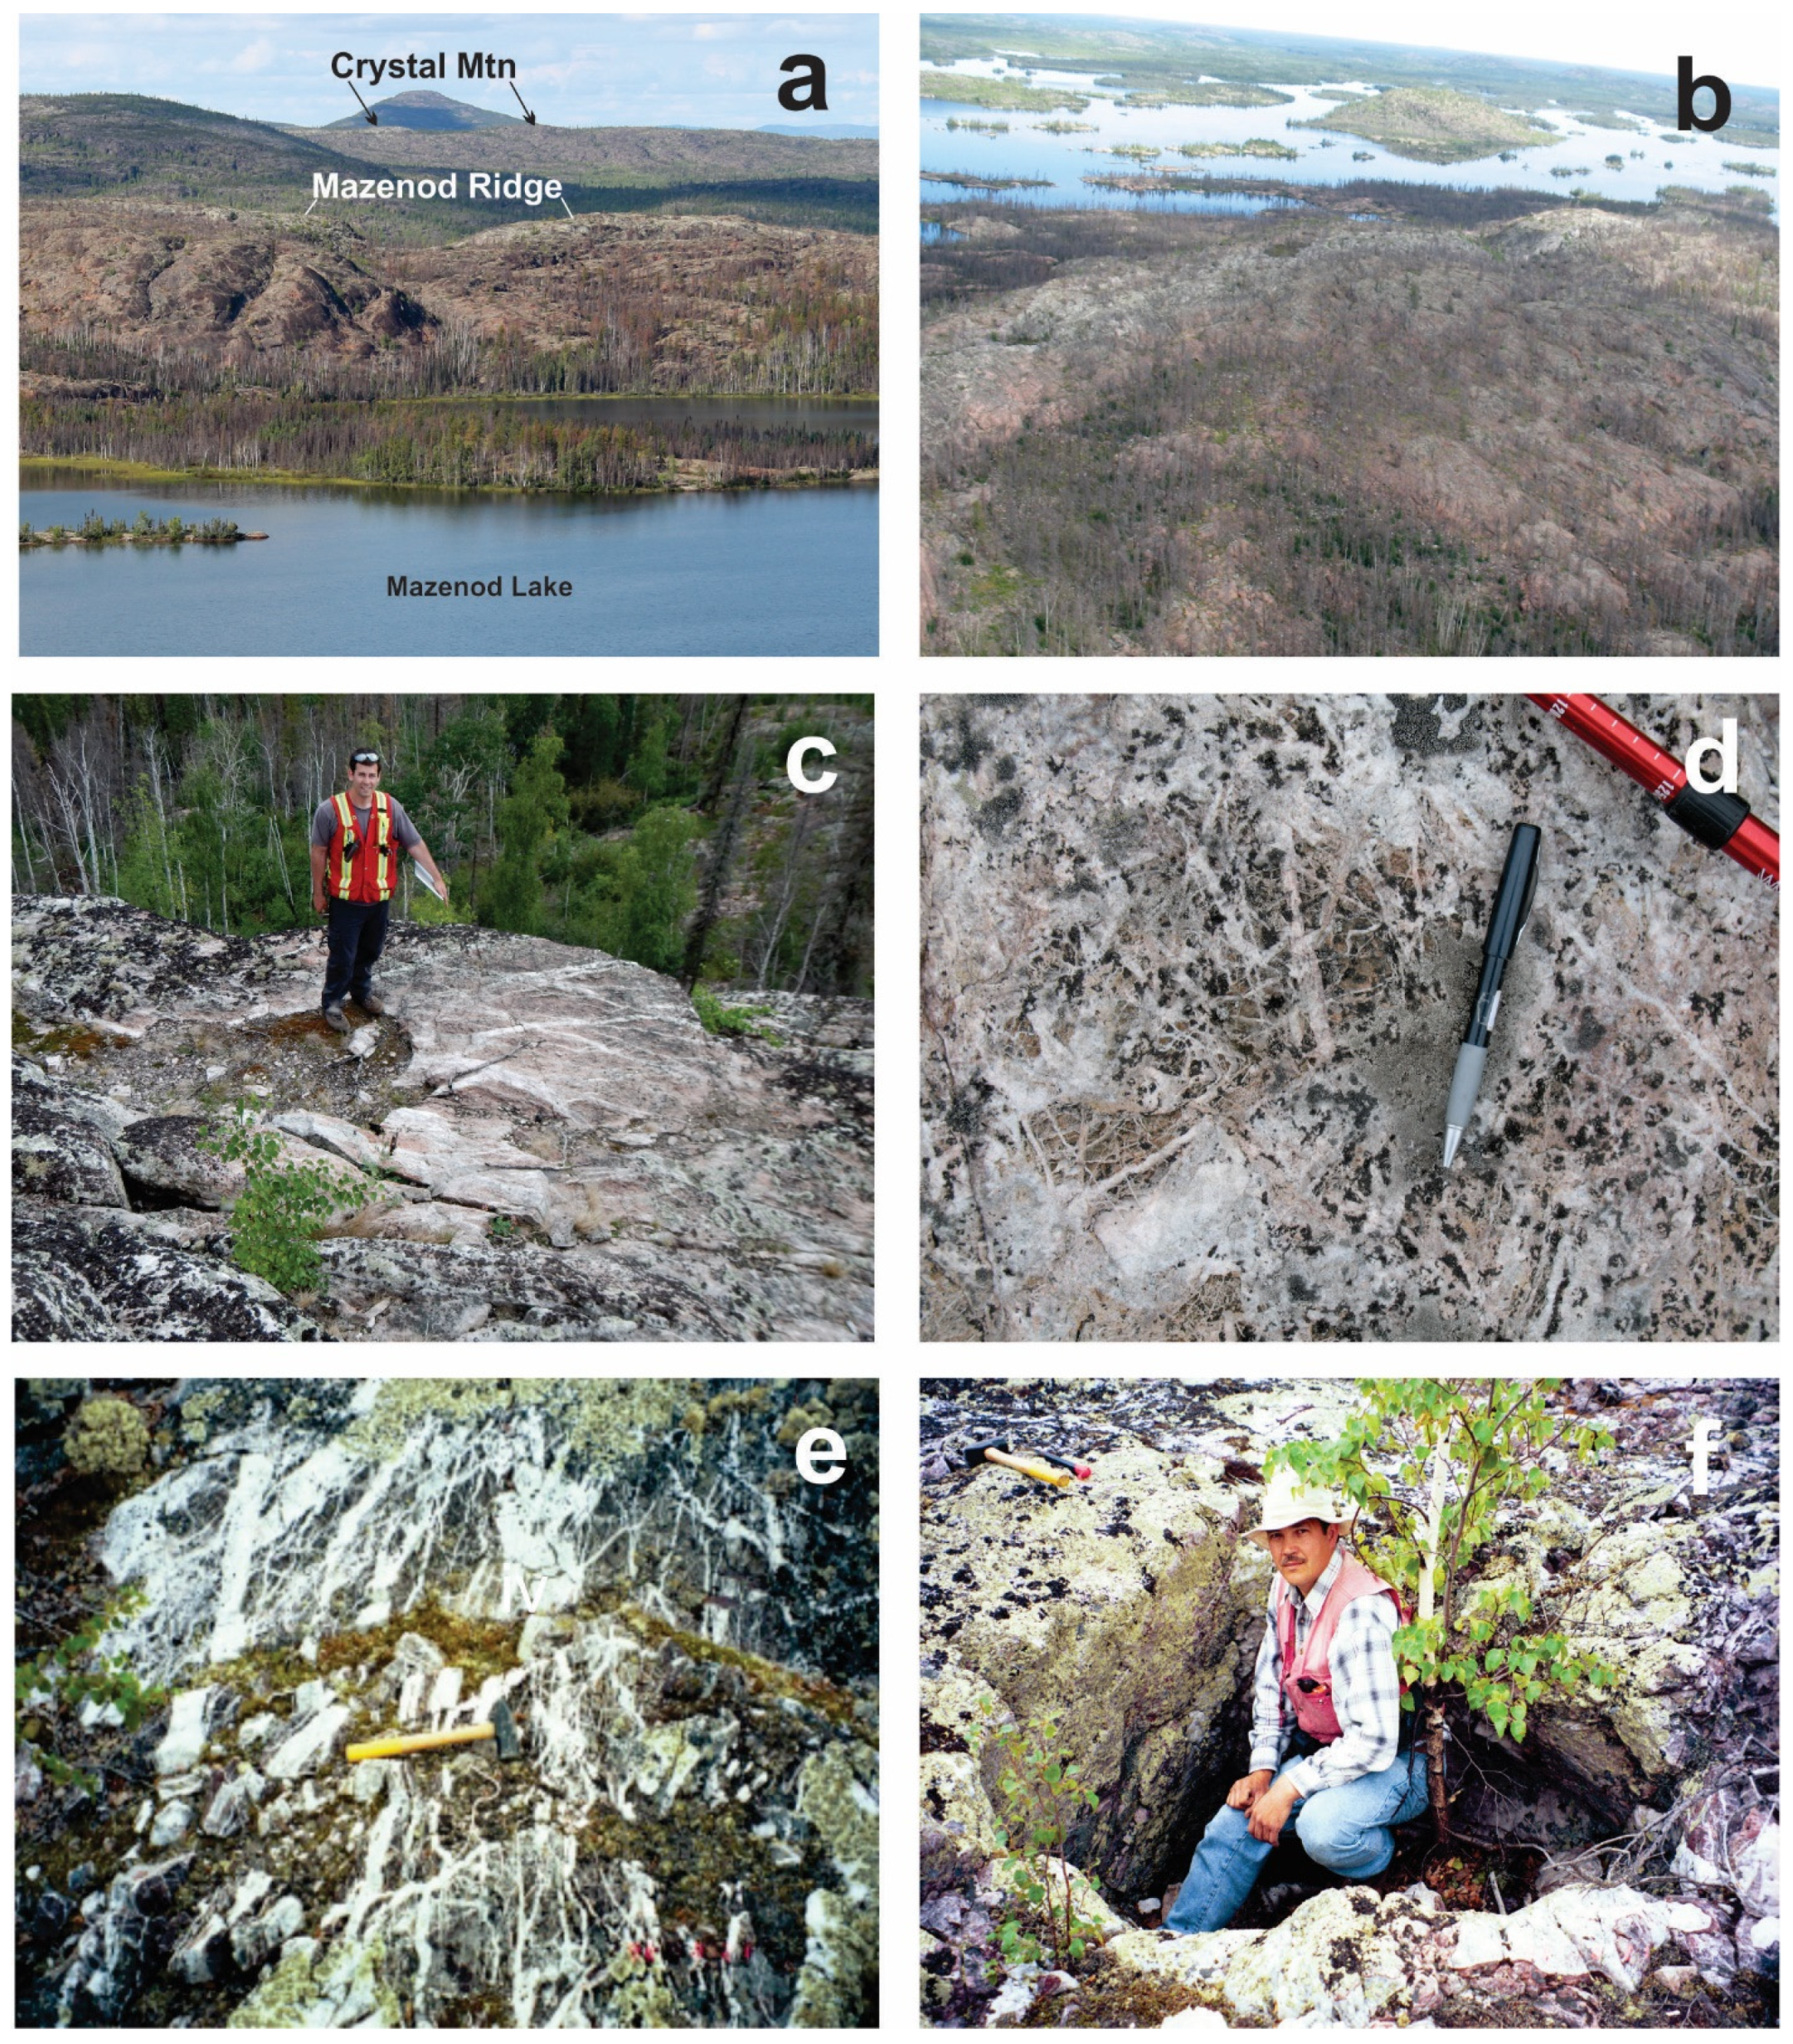
3. Geology of the Mazenod Lake Region

Faber Group volcanic rocks form an approximately 85 km long and 10 km wide belt that extends northward from the Ray Rock mine area to Faber Lake (Figure 1). The lithology ranges in composition from rhyolite (with early andesite and dacite locally), predominant in the southern portion, to rhyodacite, andesite and basaltic andesites that are more common in the Mazenod region [3,14,24,36]. The Mazenod area encompasses an ~23 km section of the northern part of the belt, comprised of six volcanic assemblages interlayered with <50 m to ~1600 m thick beds of volcaniclastic rocks and tuffaceous sediments (Figure 1, Figure 2, Figure 3, Figure 4 and Figure 5). Sedimentary sequences, and a suite of Great Bear intrusive rocks complete the geology. The volcanic rocks occur along the western boundary of the Marion River granite-to-granodiorite batholith, and to the west are bounded by the Sarah Lake monzogranite. To the north, the belt is bounded by the 1.856 Ga Faber Lake rapakivi granite, which is ~10 Ma younger than the volcanic belt ([46], Figure 1). The volcanic belt is overlain in the central area by Paleozoic cover of the Mackenzie Platform.
A series of east-west- and northwest-trending rhyolite and rhyodacite ignimbrite flows, dacite, and plagioclase and quartz–feldspar porphyritic volcanic rocks, sills and subvolcanic intrusions of the Faber Group occur north of Mazenod Lake [2,3,22,36]. Coeval subvolcanic and later intrusions include quartz–feldspar and plagioclase porphyry, diorite, monzodiorite, monzonite and marginal phases of the Marion River and Sarah Lake granitic batholiths. Remnants of an earlier suite of Treasure Group metasedimentary rocks (≥1.885 Ga) that predate the volcanic assemblage are exposed marginal to the Marion River Batholith north and south of the Dianne Lake fault. Volcanic and igneous rocks associated with the Sue–Dianne deposit have been dated at 1.865 ± 4 Ga [36,39].
Metamorphism and deformation in the Mazenod region are limited and consistent with the rest of the GBMZ. Rocks are sub-greenschist facies with no penetrative metamorphic foliation except along the Wopmay fault zone. Some localized fluid-induced zones of ductile deformation are associated with high-temperature metasomatism [12,47,48]). Despite the limited internal fabric, Faber Group rocks are often intensely structurally disrupted, with typical examples of brittle and brittle–ductile behavior. Faults indicated on maps 1–5 are interpreted from a combination of field mapping, geophysics and lineament analysis. Widespread pervasive hydrothermal alteration has affected almost all rocks of the district, including parts of the batholiths, most of the subvolcanic intrusions, nearly all volcanic rocks, and most sedimentary sequences. Modification of the alkali metal, silica, calcium and ferro-magnesian content (among other metals) has modified the nature of rocks in the district to the point where field identification of protolith is often difficult.
Paleozoic sediments (PC, Figure 1, Figure 2 and Figure 3) cover a significant portion of the south-central project area. The sedimentary rocks comprise a relatively thin veneer (<100 m) of sub-horizontal shales, argillaceous dolomite, polymictic conglomerates, quartzose sandstone and nodular and oolitic dolomite of the Mackenzie platform. A brief description of these Cambrian-aged Paleozoic rocks can be found in Gandhi [23]. The thin Paleozoic veneer and magnetic signature of underlying GBMZ rocks enables projection of the volcanic belt under the Paleozoic cover as dextral northeast-displaced blocks.
Treasure Lake sedimentary rocks (TL Figure 1) predate the Faber Group volcanic assemblage and have been dated at <1885 Ma [35,49,50]. They are intruded by dikes and stocks emanating from the Marion River batholith, as well as from other syn-volcanic intrusions. In the Mazenod area, TL rocks are preserved only as relatively thin beds marginal to the batholith in the northern (Sue–Dianne) region. Here they comprise several relatively thin sequences of meta-arenite, -siltstone, and calcsilicate. To the south in the NICO area, Treasure Lake rocks comprise a sequence of variably albitized, hornfelsed and indurated laminated siltstone and wacke ~500 m in thickness. Locally, along a 3 km long corridor near the contact with the Marion River Batholith, they have been altered to albitite and brecciated albitite with localized anomalous uranium mineralization. The upper ~300 m of the sequence was altered to a biotite (annite), amphibole and magnetite-rich assemblage that hosts the NICO deposit immediately beneath a younger rhyodacite ignimbrite cap. Contact metamorphism of Treasure Lake rocks largely predates alteration, and localized ductile deformation during high-temperature metasomatism has led to additional foliation within the metasedimentary rocks. Contact metamorphism is believed to be the direct result of proximity to, or direct contact with, the Marion River Batholith [2,8,10,14,22,25,51]. This has resulted in the hornfels and induration that has been used herein to help distinguish older Treasure Lake sedimentary rocks from the 1.87 Ga volcaniclastic sedimentary rocks (VS) located in the central and southern parts of the map area. Stratigraphy and structural analyses are also used to help distinguish between Faber and Treasure Lake Group rocks.
Volcaniclastic sedimentary rocks of the Faber Group (VS, Figure 1, Figure 2, Figure 3 and Figure 5) are a coeval suite of epiclastic detrital and pyroclastic sedimentary rock strata. They are mostly homogeneous fine-grained tuff and mudstone beds laminated with cm-scale banding, with occasional conglomerate and lapilli tuff interlayers [25] (Figure 6a–f). These strata form linear northwest-trending units interlayered with volcanic rocks. They contain excellent structures from which to measure bedding planes and obtain geopetal indicators (way-up structures, e.g., Figure 6d,e). Both subaerial and water-lain strata appear to be common in the region, suggesting the former presence of lakes, and cross-bedding may indicate local fluvial activity (Figure 6a). The volcaniclastic sedimentary rocks range from thin beds to multilayered sequences up to 1.6 km wide at surface. South of Mazenod Lake, the volcaniclastic rocks appear overturned and dip ~75° southwest.
Great Bear Intrusions in the Mazenod region comprise a suite of plutonic and epizonal igneous rocks that are contemporaneous and younger than the volcanic event. Plutonic rocks are medium-to-coarse-grained, texturally massive, dominantly calc-alkaline, spatially extensive, and intrude volcanic rocks along the east, west, and northern boundaries of the Faber volcanic belt (Figure 7). They generally have a strong orange to pinkish color on weathered surfaces, which appears to result from one or more of K–feldspar content, surface weathering, and incipient hydrothermal alteration with minor to significant additions of K and Fe (Figure 7a,c,d). The intrusions have a compositional range that includes granite, granodiorite, monzogranite, and quartz monzonite (Figure 7a,f). Other epizonal and hypabyssal plutons, stocks and dikes that are likely spatially and genetically linked to the region’s volcanic rocks include diorite and monzodiorite (Figure 7b–e), and quartz–feldspar and feldspar-porphyritic intrusions (Figure 8c,d). Also present are the occasional mafic dike and very minor lamprophyre. Monzogranite, monzodiorite, monzonite, syenite, intrusive porphyry and rapakivi granite all plot within the volcanic arc and syn-collisional to post-collision fields [22,25] of the granite discrimination diagram of Pearce et al. [52]. Spatially and temporally, Great Bear intrusions surround, underlie, intrude, and bracket the volcanic assemblages. (Figure 1, Figure 2, Figure 3 and Figure 5). In the Mazenod region, the Marion River batholith, subvolcanic intrusions, and volcanic rocks all have similar ages within the limits of analytical error of 1868 Ma to 1862 Ma [2,3,4,18,36,39].
High-level porphyry, diorite, and monzodiorite intrusions are present in several areas as dikes and irregular stocks that range from sub-meter to an ~160 m wide monzodiorite dike infilling the NE-oriented transverse Bea fault (Figure 5 and Figure 7b–d). At surface, monzodiorite looks like ignimbrite, but is texturally uniform, porphyritic, has more abundant ferromagnesian minerals (mostly pyroxene), and lacks any evidence of volcanic clasts or textures. Monzodiorite grades into diorite in a number of locations and essentially loses its K–feldspar and moderate orangey-pinkish hue. It is apparent that monzodiorite represents the shallower potassic-altered parts of diorite intrusions. This is comparable to a similar phenomenon that is well documented in the northern GBMZ around Echo Bay [4,18], where magmatic–hydrothermal fluids associated with diorite alter their upper parts such that their field name for mapping is monzodiorite. Diorite and monzodiorite outcrop in the central Mazenod Lake area in a series of stocks and dikes that extend from Dan Island southward for about 2.3 km (Figure 3). Collectively, they constitute surface manifestations of the central Mazenod pluton.
Quartz–feldspar porphyry intrusions outcrop east and south of Sue–Dianne as irregular stocks and linear bodies and are typically slightly to moderately potassically altered (Figure 1). However, the most significant porphyry stock occurs ~300 m below surface directly under the Sue–Dianne deposit. The Sue–Dianne feldspar porphyry is sodically altered at depth, transitioning to potassic-altered felsite in its highest levels immediately below the Sue–Dianne breccia complex and mineralization (Figure 8c,d). Alteration to felsite of both the uppermost intrusion and overlying ignimbrite occurred prior to explosive hydrothermal brecciation. This phenomenon is common also in other areas of the GBMZ, including the Echo Bay region [4,9,12,53].

3.1. The Faber Lake Rapikivi Granite

The Faber Lake rapakivi granite (FLR, Figure 1) terminates the northern extent of the volcanic belt in the study area and is the youngest identified major intrusive rock in the southern GBMZ. It is dated at 1856 +2/−3 Ma, postdating crystallization of the Marion River batholith [36]. It comprises a medium-to-coarse-grained granite with K–feldspar crystals often overgrown and rimmed by plagioclase producing its rapakivi texture. It contains minor amounts of muscovite and ferromagnesian minerals, and locally is fluorite-bearing.

3.2. The Marion River Batholith

The Marion River Batholith (MB, Figure 2) forms the eastern boundary of the entire Faber volcanic belt and is present throughout most of the southern GBMZ between the Metamorphic Internal Zone and volcanic rocks. Composition of the batholith ranges from granite to mostly granodiorite characterized by euhedral feldspar crystals set in a medium-to-coarse-grained matrix of feldspar, quartz, hornblende, biotite, and accessory minerals [36]. Along its western margin, in contact with volcanic assemblages, the Marion River batholith grades into marginal phases that include monzogranite (Figure 7f). East of the Sue–Dianne deposit, near the south side of the Dianne Lake fault, it grades locally into unusual, shattered, K–feldspar–hematite–epidote–chlorite-altered pegmatitoidal enclaves (Figure 8e,f).

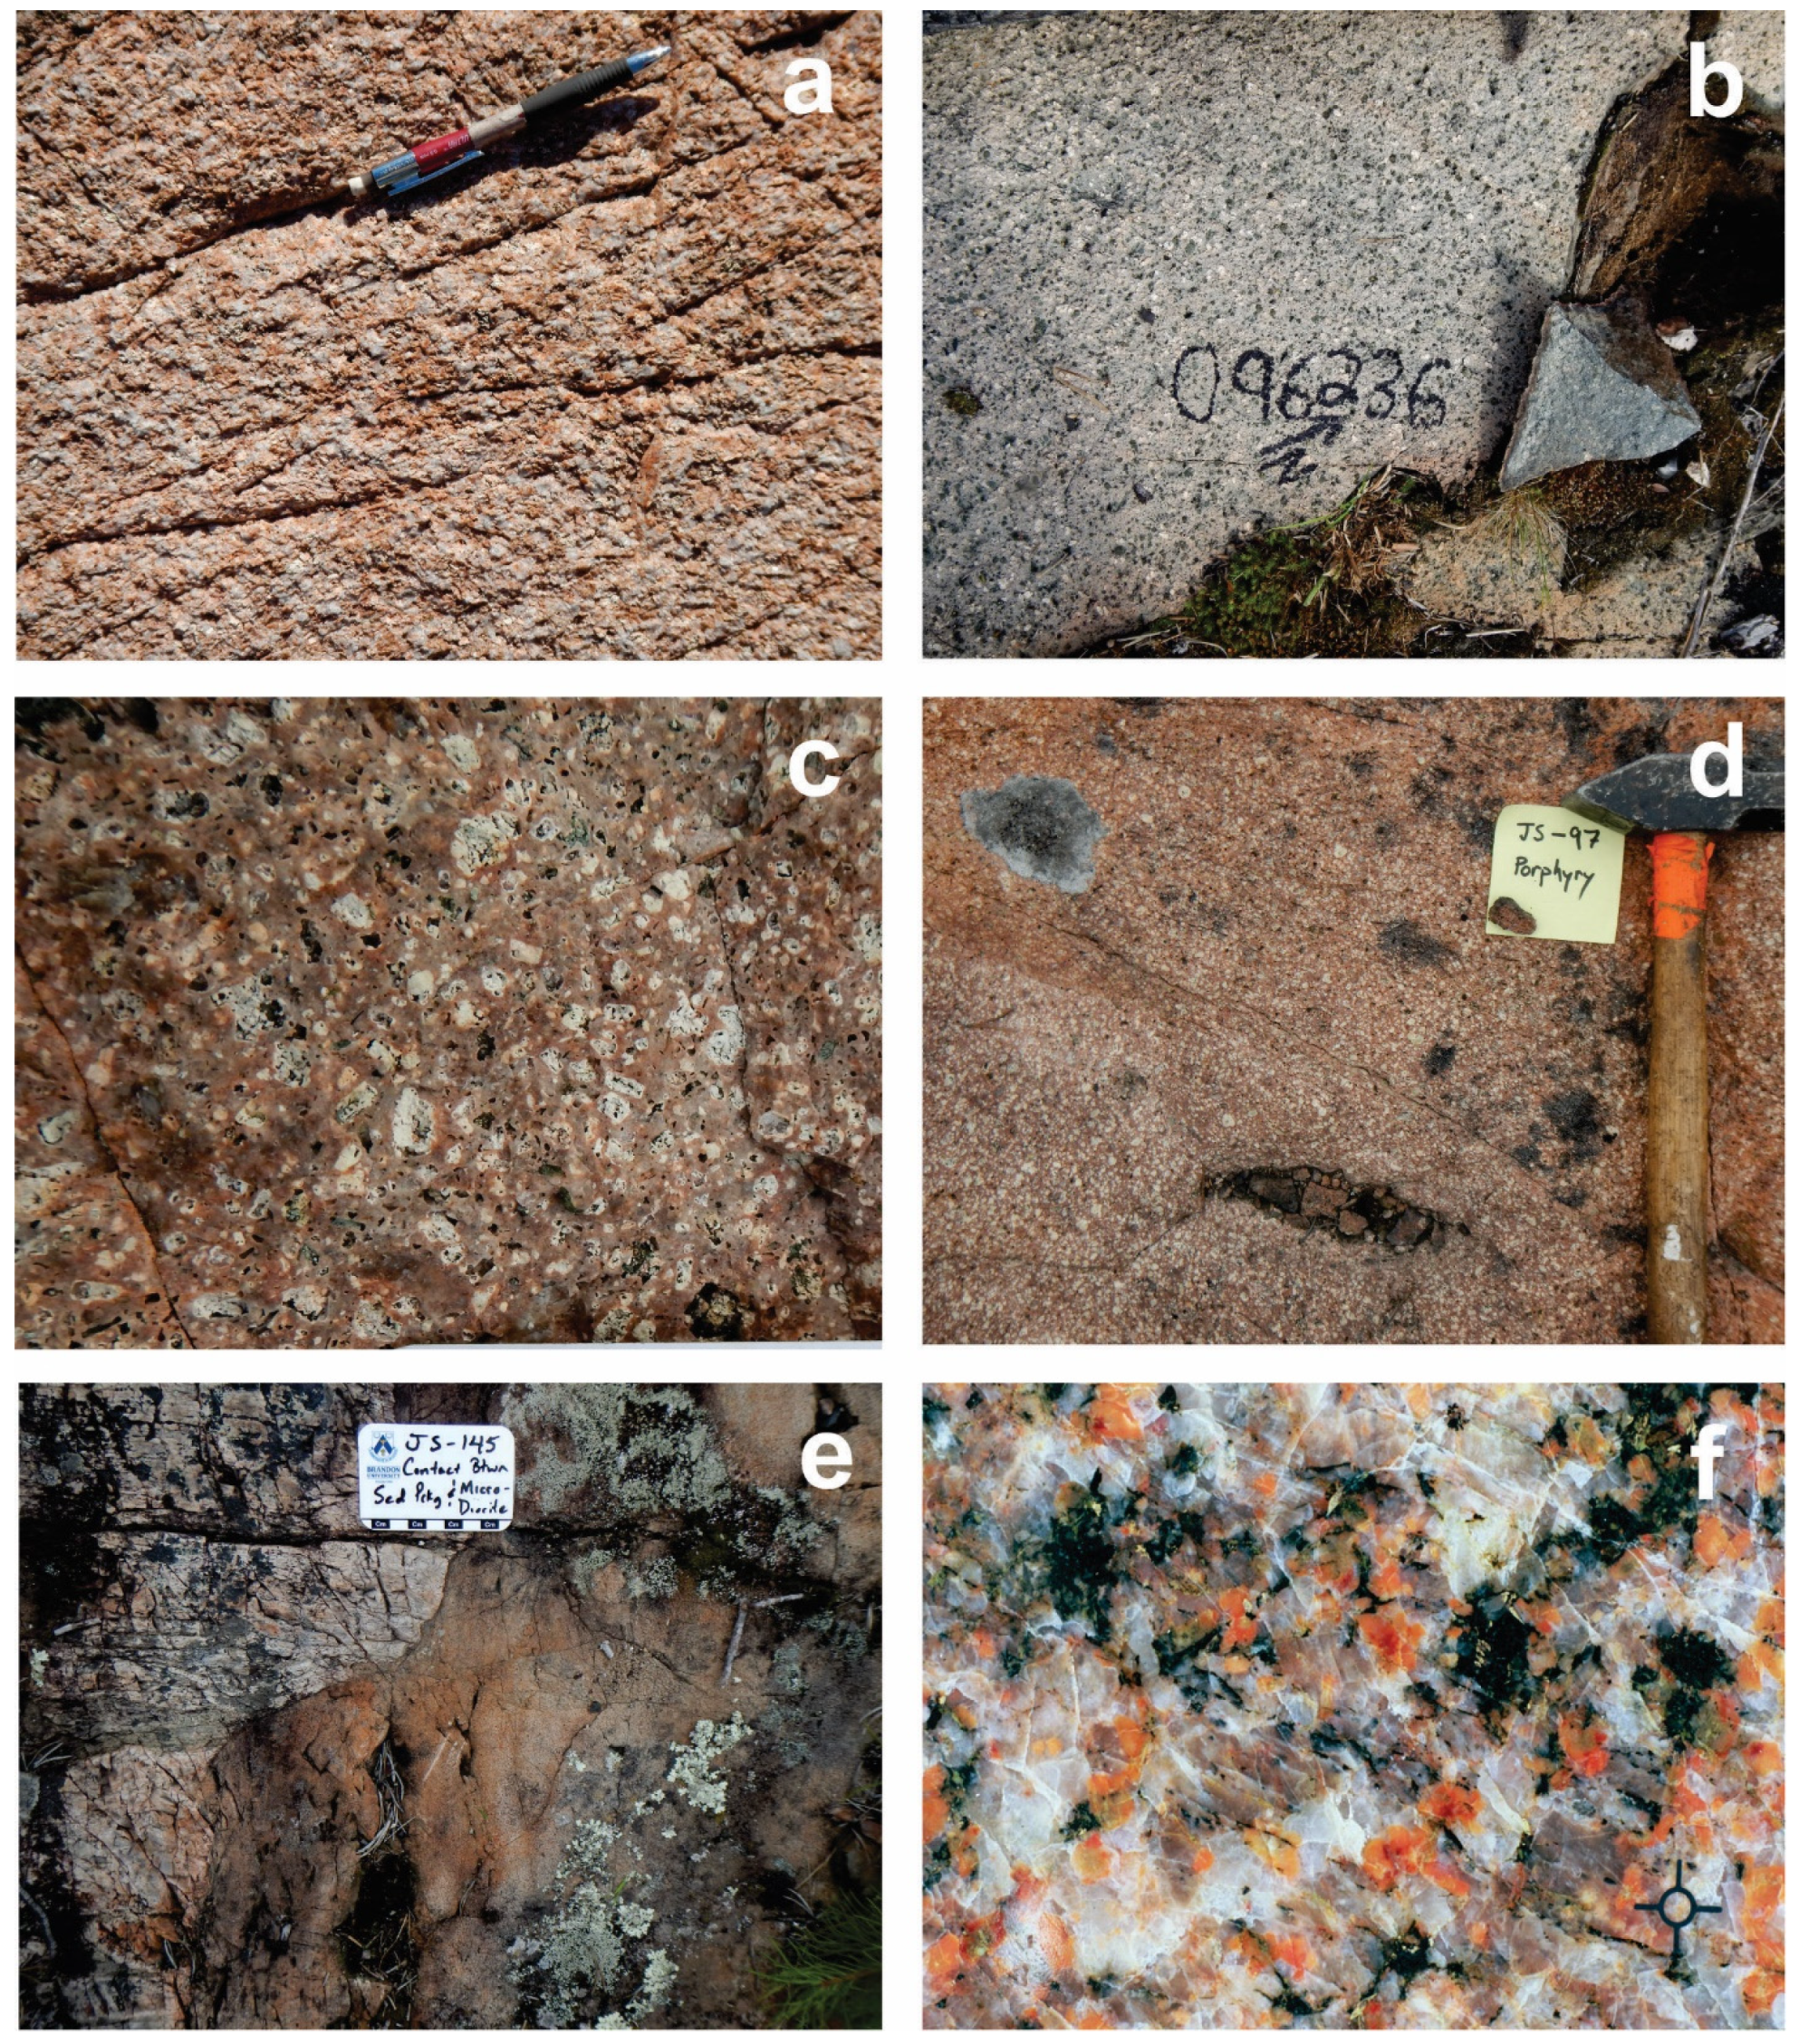
3.3. The Sarah Lake Granite

The Sarah Lake granite (SM Figure 1, Figure 2, Figure 3 and Figure 5) is compositionally a monzogranite within the mapped area. It is mostly homogeneous and grades eastward from medium-to-coarse-grained with quartz, feldspar, and relatively minor hornblende ± biotite phenocrysts. Locally, near the volcanic belt such as near the Mazenod giant quartz vein, it has a strong and distinct orange-pinkish color that appears to be the result of a pervasive sericite alteration of feldspars ± trace hematite (Figure 7a). The intrusion has a prominent right-lateral offset of ~1200 m along the Marion River fault, as documented along the Mazenod Ridge (Figure 3). Aplitic dikes of similar composition to the Sarah Lake granite intrude the adjoining volcanic rocks. South of Squirrel Lake, the Sarah Lake granite grades to diorite and monzodiorite along its eastern boundary in contact with the volcanic belt (Figure 5). It appears most probable that the Sarah Lake granite is the western extent of the Marion River batholith, separated from each other by overlying Faber group supracrustal rocks.

3.4. Subvolcanic Intrusions

The northern part of the Faber Group volcanic belt transitions into a series of subvolcanic intrusions (SV1 and SV2). They range in composition from plagioclase porphyry and plagioclase-K–feldspar porphyry to feldspar-quartz porphyry (Figure 1). Subvolcanic intrusions also outcrop along and near the southeastern portion of Dianne Lake. They are generally a homogeneous sequence of igneous rocks resembling least-altered ignimbrites with minor variations in feldspar and quartz content. They are interpreted as synchronous with and compositionally analogous to the volcanic rocks of the belt. These intrusions often exhibit varying degrees of potassic alteration, usually minor to modest, but locally grade to felsite ± chlorite, amphibole, epidote, and other accessory secondary minerals.
A separate and unique suite of subvolcanic diorite and monzodiorite (MD) comprise the central Mazenod pluton which outcrops in dikes and stocks on various islands within the east arm of Mazenod Lake, near to and extending south of Dan Island for about 2.3 km (Figure 7b–d). This pluton is apparently directly associated with extensive hydrothermal alteration of the surrounding andesite and rhyodacite. Monzodiorite is a potassically altered higher level (closer to surface) expression of the diorite pluton, with the potassic alteration (K-fsp) most likely caused by fluids emanating from the diorite itself. This is a similar phenomenon to the monzodiorite and diorite plutons of the Echo Bay and Contact Lake regions of the northern GBMZ, where the relationship between extensive hydrothermal alteration of andesite and the transition from diorite to monzodiorite is well documented [4,18,19].

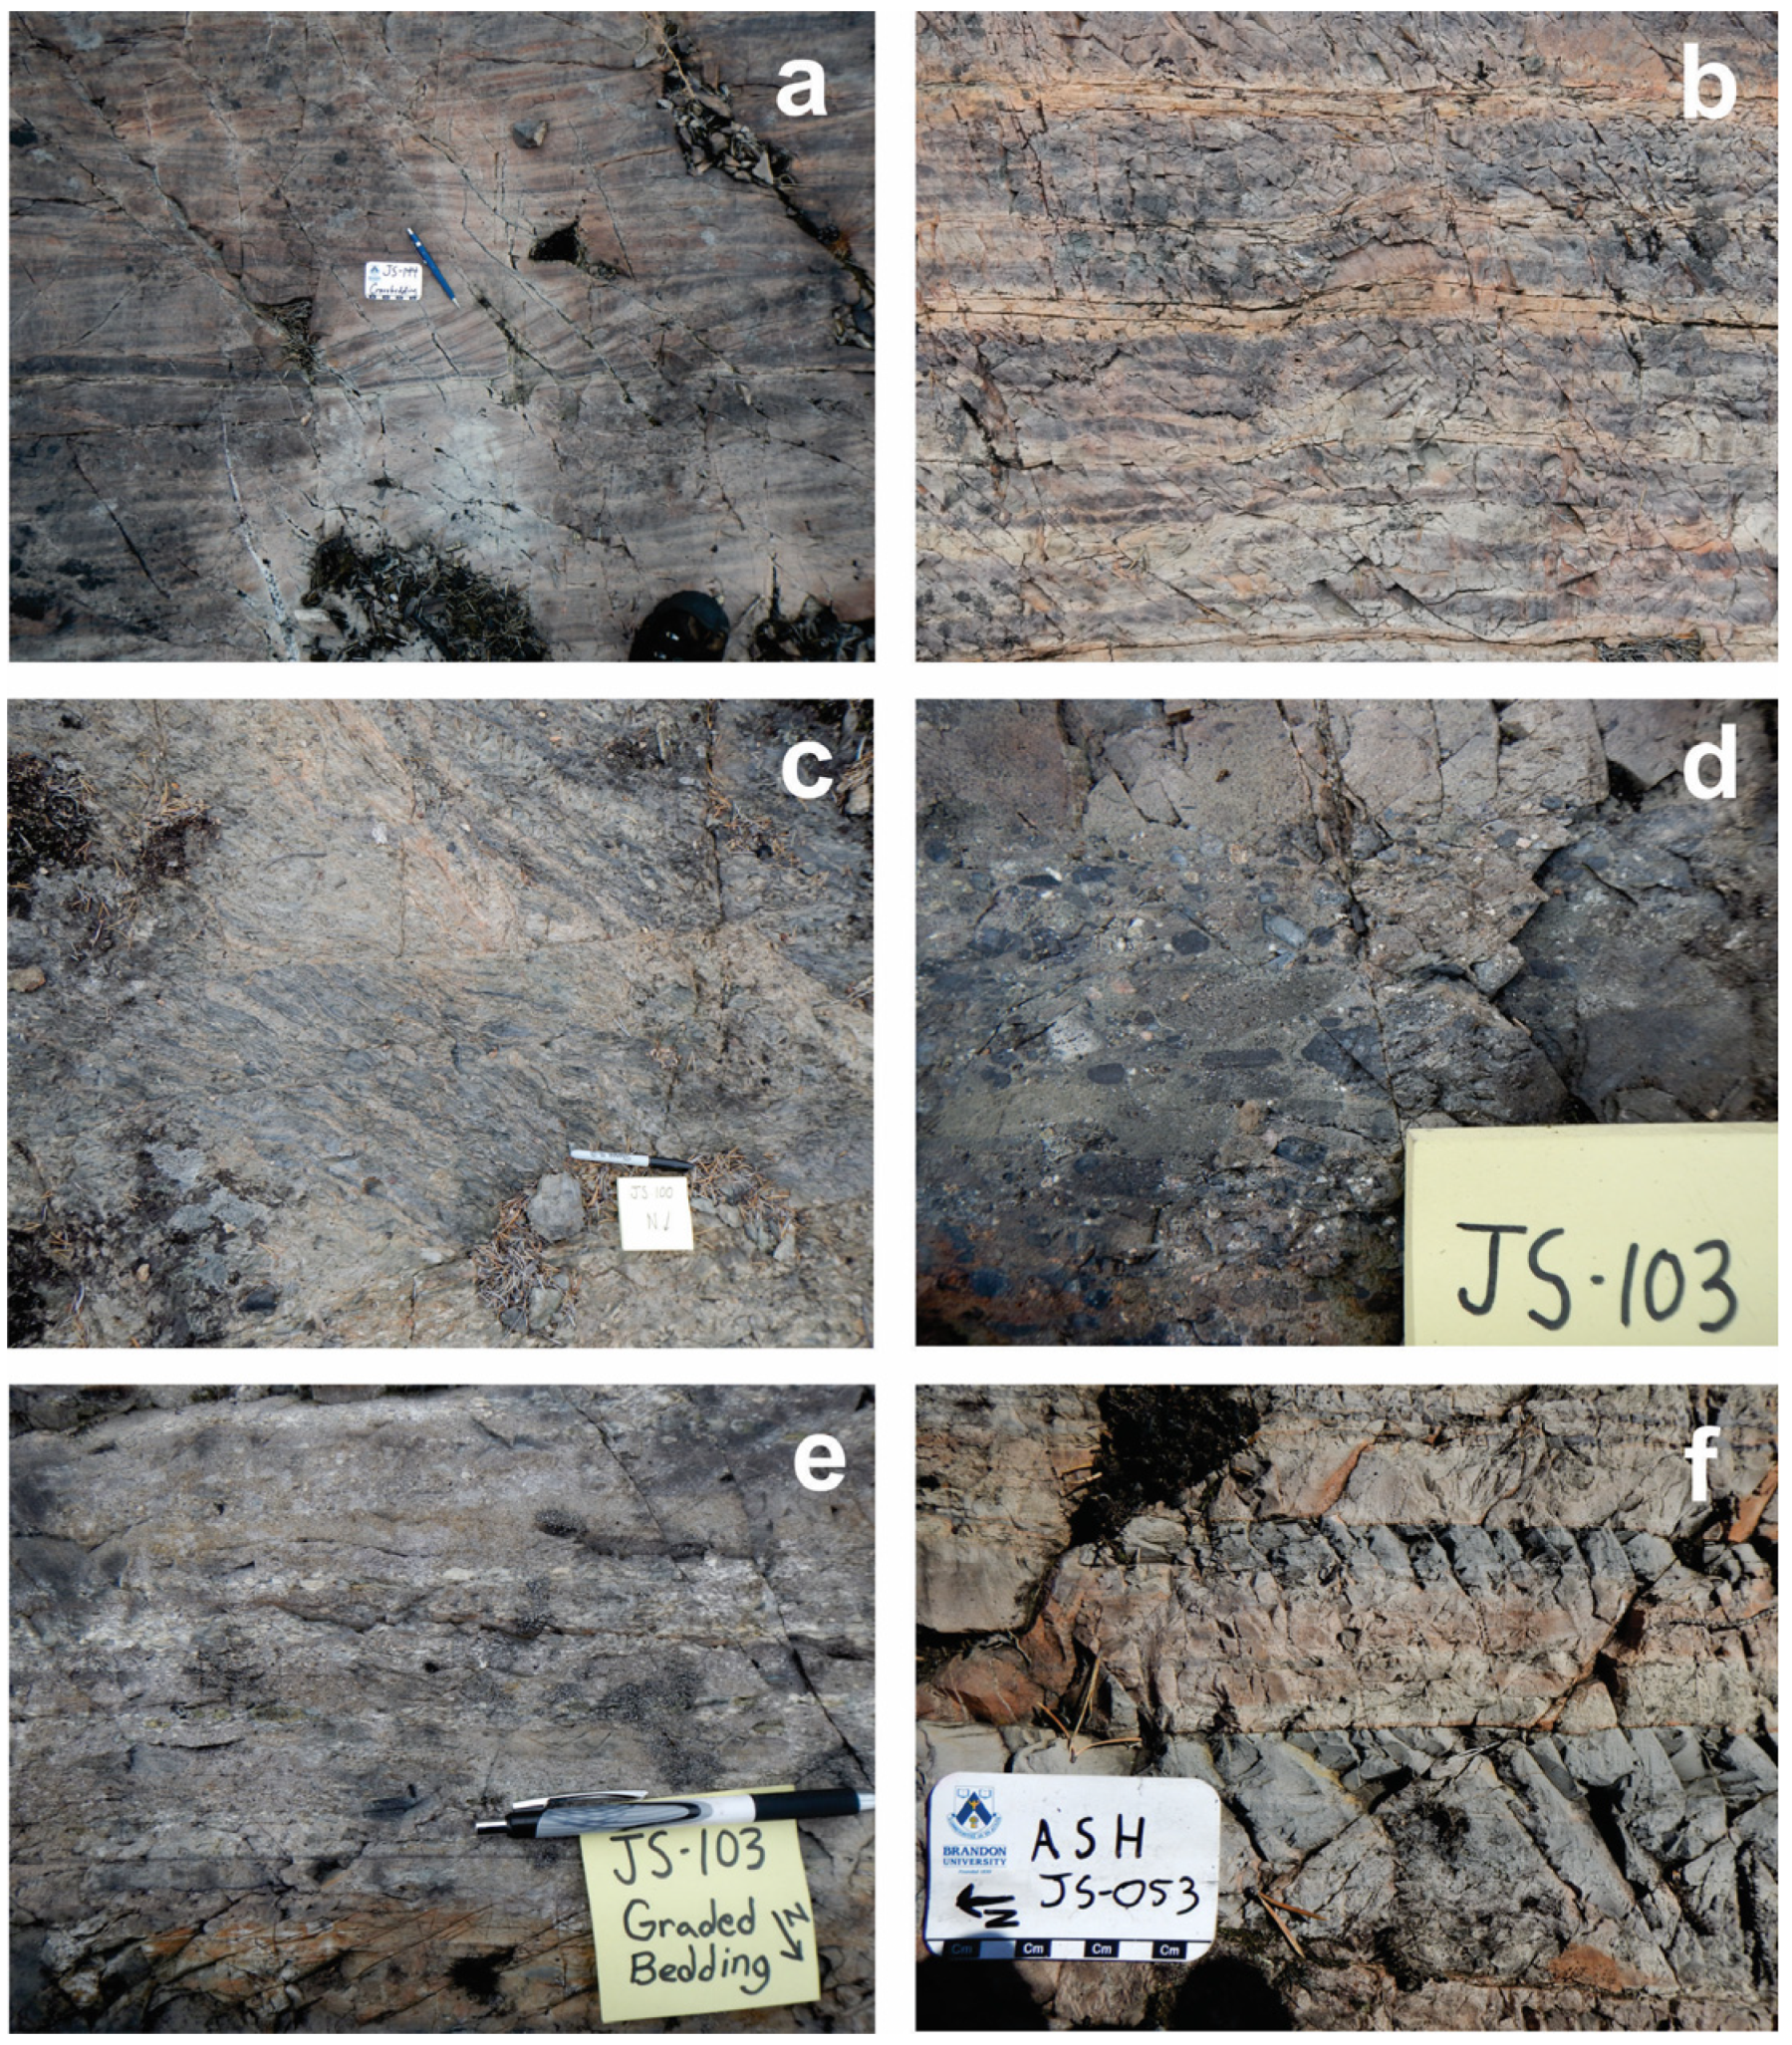
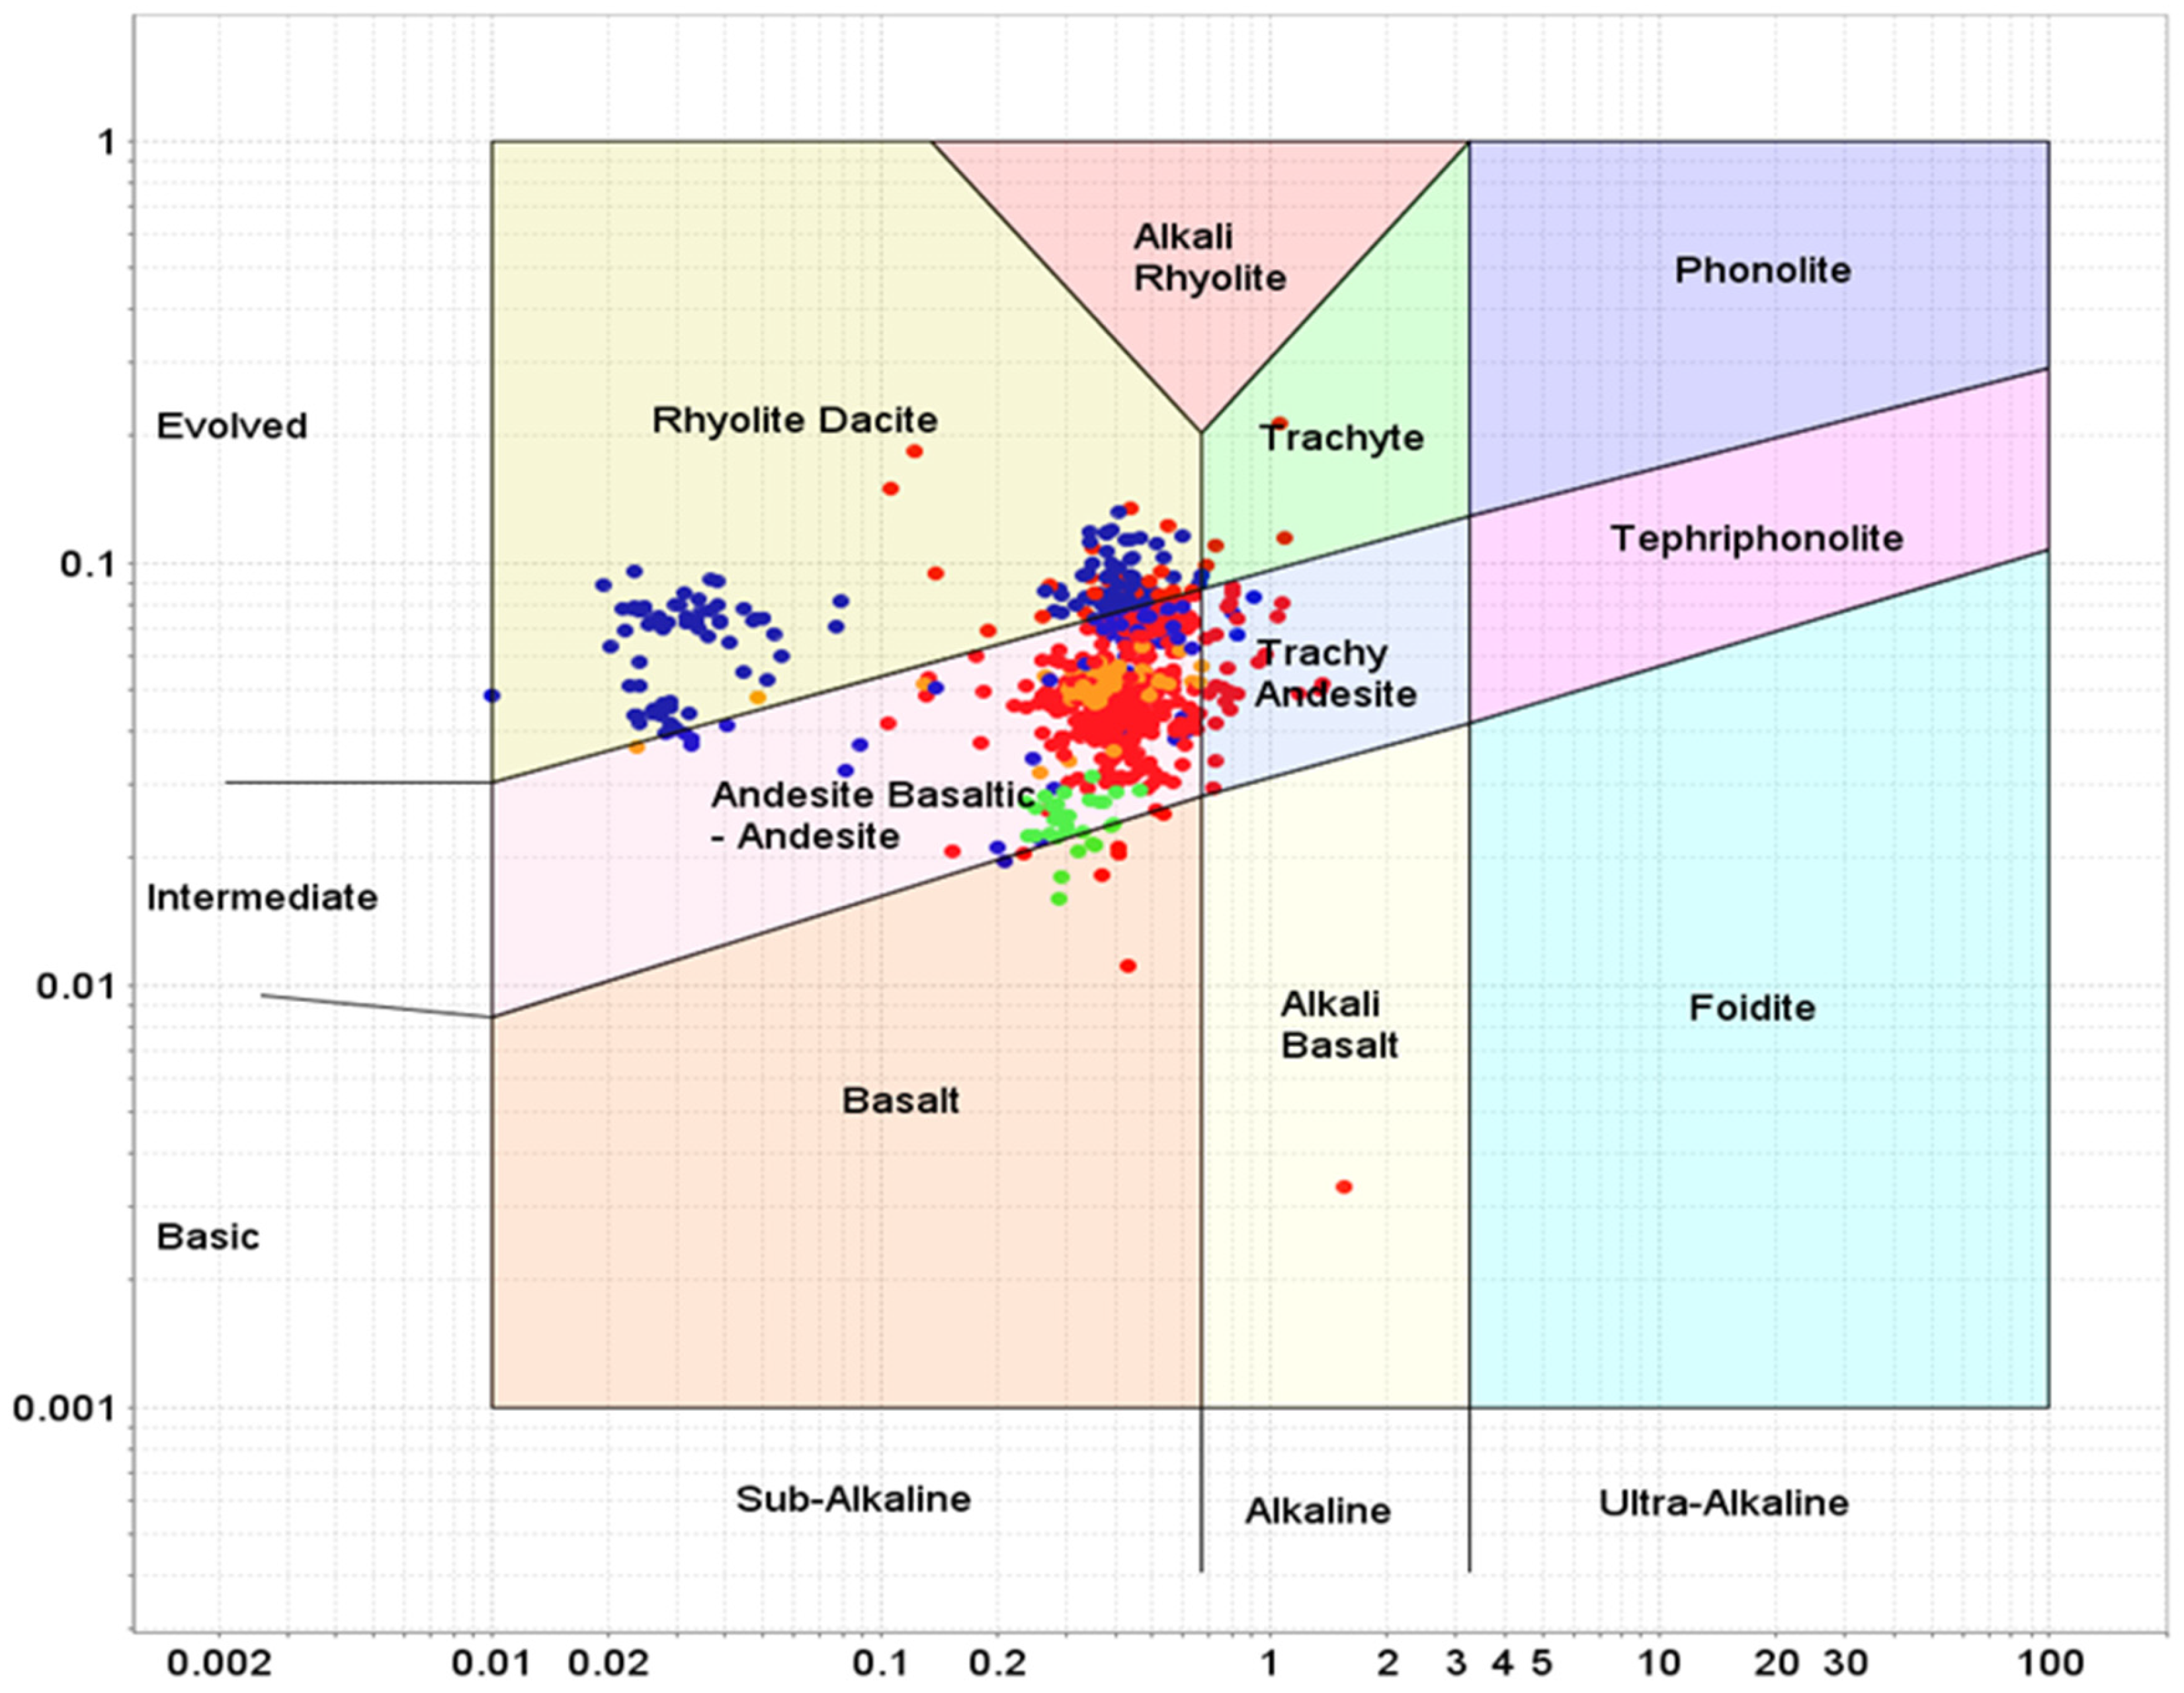
3.5. Faber Group Volcanic Rocks

The Faber Group is comprised of volcanic and volcaniclastic rocks that form an approximately 85 km long and 10 km wide belt. The lithology ranges from predominantly rhyolite to rhyodacite and local andesite in the southern portion to rhyodacite, andesite and basaltic andesites that are more common in the Mazenod region (Figure 1, Figure 2, Figure 3, Figure 4 and Figure 5). Volcanic rocks between the Mazenod Lake and the Sue–Dianne deposit were previously mapped as a series of east-trending ignimbrite sheets, with clastic bases, welded tuff central portions and crystal tuff upper layers (Figure 9a,b,d, Figure 10b,f, Figure 11a–c, Figure 12c, Figure 13a and Figure 14b). However, much of the ignimbrite layering appears to follow the regional northwest trend [2,3,22,25,36]. North of the Dianne Lake fault, volcanic sequences are also northwest trending. Volcanic and volcaniclastic sediments (Figure 6) extending from the northeast arm of Mazenod Lake southward to the Bea Lake area appear to form a synclinal series of inward-dipping and southeast-trending strata. Throughout the Faber Group, the geology is displaced into orthogonal blocks by a series of northeast-trending transverse faults (Figure 1, Figure 2 and Figure 3).
Even though they are generally well exposed, many of the volcanic rocks at Mazenod are difficult to properly field-classify due to pervasive hydrothermal overprinting that varies from incipient to extreme. The greatest difficulty in rock identification in the field results from pervasive moderate to intense potassic alteration ± minor to moderate silicification of the rocks and localized minor albite alteration. Consequently, systematic geochemical discrimination was carried out for most of a large suite of 906 samples, of which 724 are volcanic rocks, 99 intrusive rocks, 52 from volcaniclastic sedimentary strata, 15 boulders, 3 quartz veins, and 13 drill core samples from the Phelps Dodge 2005 drilling [25]. Geochemical discrimination, combined with field observations, is used to classify volcanic rocks into the following assemblages.

3.6. Mazenod Lake Assemblage

The Mazenod Lake assemblage (ML, Figure 1, Figure 2 and Figure 3) extends from the northeast shore of Mazenod Lake, where it is dominantly andesitic, to the Dianne Lake fault and Sue–Dianne deposit, where the rocks are dominated by rhyodacite ignimbrite sheets. The assemblage transitions to dacite porphyry in its northernmost extent and is ultimately terminated by the younger Faber Lake rapakivi granite. The Mazenod Lake assemblage appears to be older than the adjacent Dianne Lake assemblage and is likely the oldest exposed in the map area. ML rocks are dominantly feldspar-porphyritic crystal tuffs with common ignimbrite textures. Dip varies from near vertical to ~25–30° NE, and thickness is estimated at more than 2 km. It comprises a series of “cooling units” with a lapillus to breccia base, welded tuff central portion with abundant fiamme, and a generally more extensive upper crystal and ash tuff sequence. The variations in orientation likely reflect the complex and dynamic nature of explosive volcanism in a tectonically active belt [22,24,36].
Potassically altered rhyodacite ignimbrite (felsite) of the Mazenod Lake assemblage hosts the Sue–Dianne IOCG deposit at the intersection of the Dianne Lake and Kemaz (aka MAR) faults (Figure 1).

3.7. Lou Lake Assemblage

The Lou Lake assemblage comprises mostly rhyodacite ignimbrite sheets that locally grade to andesitic rocks (LL, Figure 1, Figure 2, Figure 3 and Figure 5). The assemblage extends from Mazenod Lake southward to Lou Lake and the NICO deposit region. The assemblage is dominantly rhyodacite with some rhyolite, dacite and andesite in the Lou Lake region [2,14,36], with an increased intermediate component toward Mazenod Lake where andesite dominates. The lowermost assemblage near Lou Lake is predominantly massive flow-banded rhyolite lavas intercalated with rhyolitic volcaniclastic rocks. Near Mazenod, rocks strike ~324° and dip steeply. Rocks are crystal, ash and lapilli tuff, with the distinction between andesite and rhyodacite is sometimes difficult to distinguish due to the hydrothermal alteration overprint, as may be the case in the immediate vicinity of the NOD showing (Figure 10b,f). Rocks typically contain 5 to 30% feldspar phenocrysts and up to 4% quartz crystals. Locally stretched fiamme and eutaxitic textures are visible in outcrop and are used to determine bedding orientations (Figure 9a and Figure 13b). Southeast of Mazenod Lake the Lou Lake assemblage forms parts of the eastern and western limbs of the apparent Faber Lake synclinal volcanic assemblage. The western limb dips ~75° NE and the eastern limb dips in the opposite direction at ~75° SW. The eastern Lou Lake assemblage is unconformably overlain by a sequence of volcaniclastic tuffs and sediments, which apparently may be overturned, as they also dip to the southwest.
Rocks of the Nod Hill area are grouped with the Lou Lake assemblage in keeping with Gandhi et al. [36]. Regionally most of the area is underlain by andesite. However, the main outcrops at Nod Hill are rhyodacite feldspar-quartz crystal tuffs. Nod Hill rocks are unique in texture and chemical composition and have a high Ti content suggesting that much of this area may only be rhyodacite in field appearance, whereas much of it may be potassically altered and/or silicified andesite (Figure 10b).
Most of the Nod Hill area is strongly hydrothermally altered, making identification of the precursor rock types difficult. The alteration increases in intensity toward the northern portion of the hill and proximal to faults. Alteration grades from sodic enrichment (albitization) to pervasive K–feldspar alteration (felsite). Small-scale tourmaline veins grade to hematite and magnetite from the central to northern parts. At the northern extremity of the Nod Hill outcrop coarse grained to megacrystic actinolite ± magnetite ± quartz-cemented breccias and fracture stockworks affect the rhyodacite (or altered andesite), with hydrothermally cemented breccia a common textural observation locally (Figure 10b–d). Minor pyrite of up to a few percent occurs along with trace chalcopyrite locally across the Nod Hill area.
A few hundred meters northeast of Nod Hill, a local magnetic high anomaly was drilled by Phelps Dodge 2005, Moss Xemac 1997, and earlier by Noranda. They intersected a modest zone of highly altered rocks comprising skarn-like assemblages of pyroxene, garnet, amphibole, magnetite and alkali feldspar, along with other more widespread alteration, particular silicification. The zone contained minor pyrite and chalcopyrite (up to ~0.95 wt% Cu over 9.4 m) and minor local REE-rich allanite veining (Figure 10e). Immediately north of Nod Hill are a series of diorite and monzodiorite intrusions described earlier as the Mazenod pluton, that may also underlie Nod Hill and be directly related to the hydrothermal alterations in this area.
Unconformably overlying the Lou Lake assemblage is an autochthonous sedimentary assemblage that separates Lou Lake (LL) from the younger Squirrel Lake and Bea Lake assemblages. The Lou Lake assemblage is in direct contact with the Dianne Lake assemblage (DL) to the north, and may transition into DL rocks, or they may be the same continuous sequence of felsic to intermediate volcanic rocks, with minor compositional variations.

3.8. Dianne Lake Assemblage

The Dianne Lake assemblage (DL, Figure 1, Figure 2 and Figure 3) is a sequence of feldspar ± quartz phyric ignimbrite flows that include ash, crystal and welded tuffs and volcanic breccia, with a few locations showing trachytic textures. The Dianne Lake assemblage was previously grouped with LL rocks; however, lithogeochemistry reveals a compositional range with more intermediate compositions to the west and felsic rocks dominating the eastern portion. Relatively thin layers of ash tuff indicate an average strike of ~340° dipping to the east at ~70°.

3.9. Moosehead Lake Assemblage

Moosehead Lake assemblage rocks (MH, Figure 1, Figure 2 and Figure 3) are rhyodacite ignimbrite sequences [2,22,25]. They are distinguished from DL, LL and BL rocks by their pervasive to very strong potassic alteration that locally grades to felsite. MH rocks occur immediately north of the Dianne Lake fault, suggesting that rocks north of the fault are up thrown and dextrally displaced [22]. This has resulted in a distinct break in the regional lithology and stratigraphic sequencing. On the north side of the fault, apparently deeper levels of the stratigraphy are exposed at surface revealing more intense hydrothermal alteration. Due to the degree of pervasive hydrothermal alteration, at least some of the altered rhyodacites may have been andesite originally. Potassically altered rhyodacites also occur in narrow belts proximal to the Marion River batholith and are separated from it by thin sequences of Treasure Lake metasedimentary rocks.

3.10. Squirrel Lake Assemblage

The Squirrel Lake assemblage (SL, Figure 1, Figure 2, Figure 3 and Figure 5) comprises a synclinal sequence of volcanic and pyroclastic feldspar phyric rocks previously mapped as a subvolcanic intrusion that predates the LL assemblage. Textures throughout much of the assemblage are generally consistent with Gandhi’s [24,36] interpretation of a subvolcanic intrusion; however, lapilli and volcanic breccia and an amygdaloidal flow suggest that the assemblage may be largely volcanic rocks with probable subvolcanic facies.
On the northeast arm of the interpreted syncline an autochthonous volcaniclastic tuff and sediment layer (VS) that is a few meters wide unconformably overlies the SL sequence and separates it from the LL assemblage near the northeast arm of Mazenod Lake. The bedding in the sedimentary rocks appears overturned and has a younging direction toward the east. The volcaniclastic sequence thickens to ~1.6 km width at surface along the southwest limb.
SL andesite generally is texturally massive, sometimes seriate, and locally trachytic in outcrop. Abundant very fine-grained magnetite occurs in samples of this unit. The magnetite appears to be a hydrothermal alteration product associated with sericite and/or actinolite, and imparts a fairly consistent weak to moderate magnetism to the unit.
A monomictic volcanic breccia occurs in the southwestern portion of the assemblage, containing sub-angular clasts from 1–40 cm in size. Dark grey-black clasts within the breccia are very strongly magnetic, which appears to be comparable to selective magnetite alteration of clasts within volcaniclastic breccia as well as in albitite breccia elsewhere in the GBMZ [47].

3.11. Bea Lake Assemblage

The Bea Lake volcanic assemblage (BL, Figure 1, Figure 2 and Figure 5) is an extensive suite of mineralogically uniform feldspar–quartz phyric ash and lapilli tuff, as well as pyroclastic breccia that has an andesitic chemical composition. The assemblage occupies the approximate center of the volcanic belt and extends from the southern limits of the study area northeast to its termination near the Dianne Lake fault. The Bea Lake assemblage generally resembles rhyodacite in field and hand specimen [24,36] but is reclassified by Montreuil et al. [14] and here as andesite to reflect its geochemistry as plotted in the chemical classification diagram of Pearce (Figure 15) [54]. As with some other parts of the Mazenod district, it appears that in many areas widespread regional potassic ± silica alteration accompanied by removal of Ca, Fe and Mg have modified the original chemistry and mineralogy, causing the present rocks to resemble rhyodacite. Bedding strikes NW in the southern and central map areas, changing to a more westerly direction north of Mazenod Lake. Dips consistently vary from ~70° NE to 70° SW.
North of Dan Island, coarse volcanic breccia with abundant concentrically zoned volcanic bombs outcrops in several areas near the lakeshore (Figure 3, unit BLd; Figure 11a, unit 3; Figure 11b). A layer of boulder-sized ignimbrite debris that may represent avalanche, scree or basal-like breccia (Figure 3, unit R2c; Figure 11a, unit 6) is exposed on Dan Island. These coarse breccia units may indicate proximity to a former volcanic vent, consistent with the intensification of alteration in the Dan Island and central Mazenod area. The volcanic bomb breccia grades northward into lapilli tuff, and then ash tuff, providing a vector toward a possible source near Dan Island. On Dan Island itself, the exact contact between the Bea Lake andesite and the overlying rhyodacite ignimbrite of the Dianne Lake assemblage is difficult to determine as the entire island is intensely and pervasively hydrothermally altered, often to a felsite.

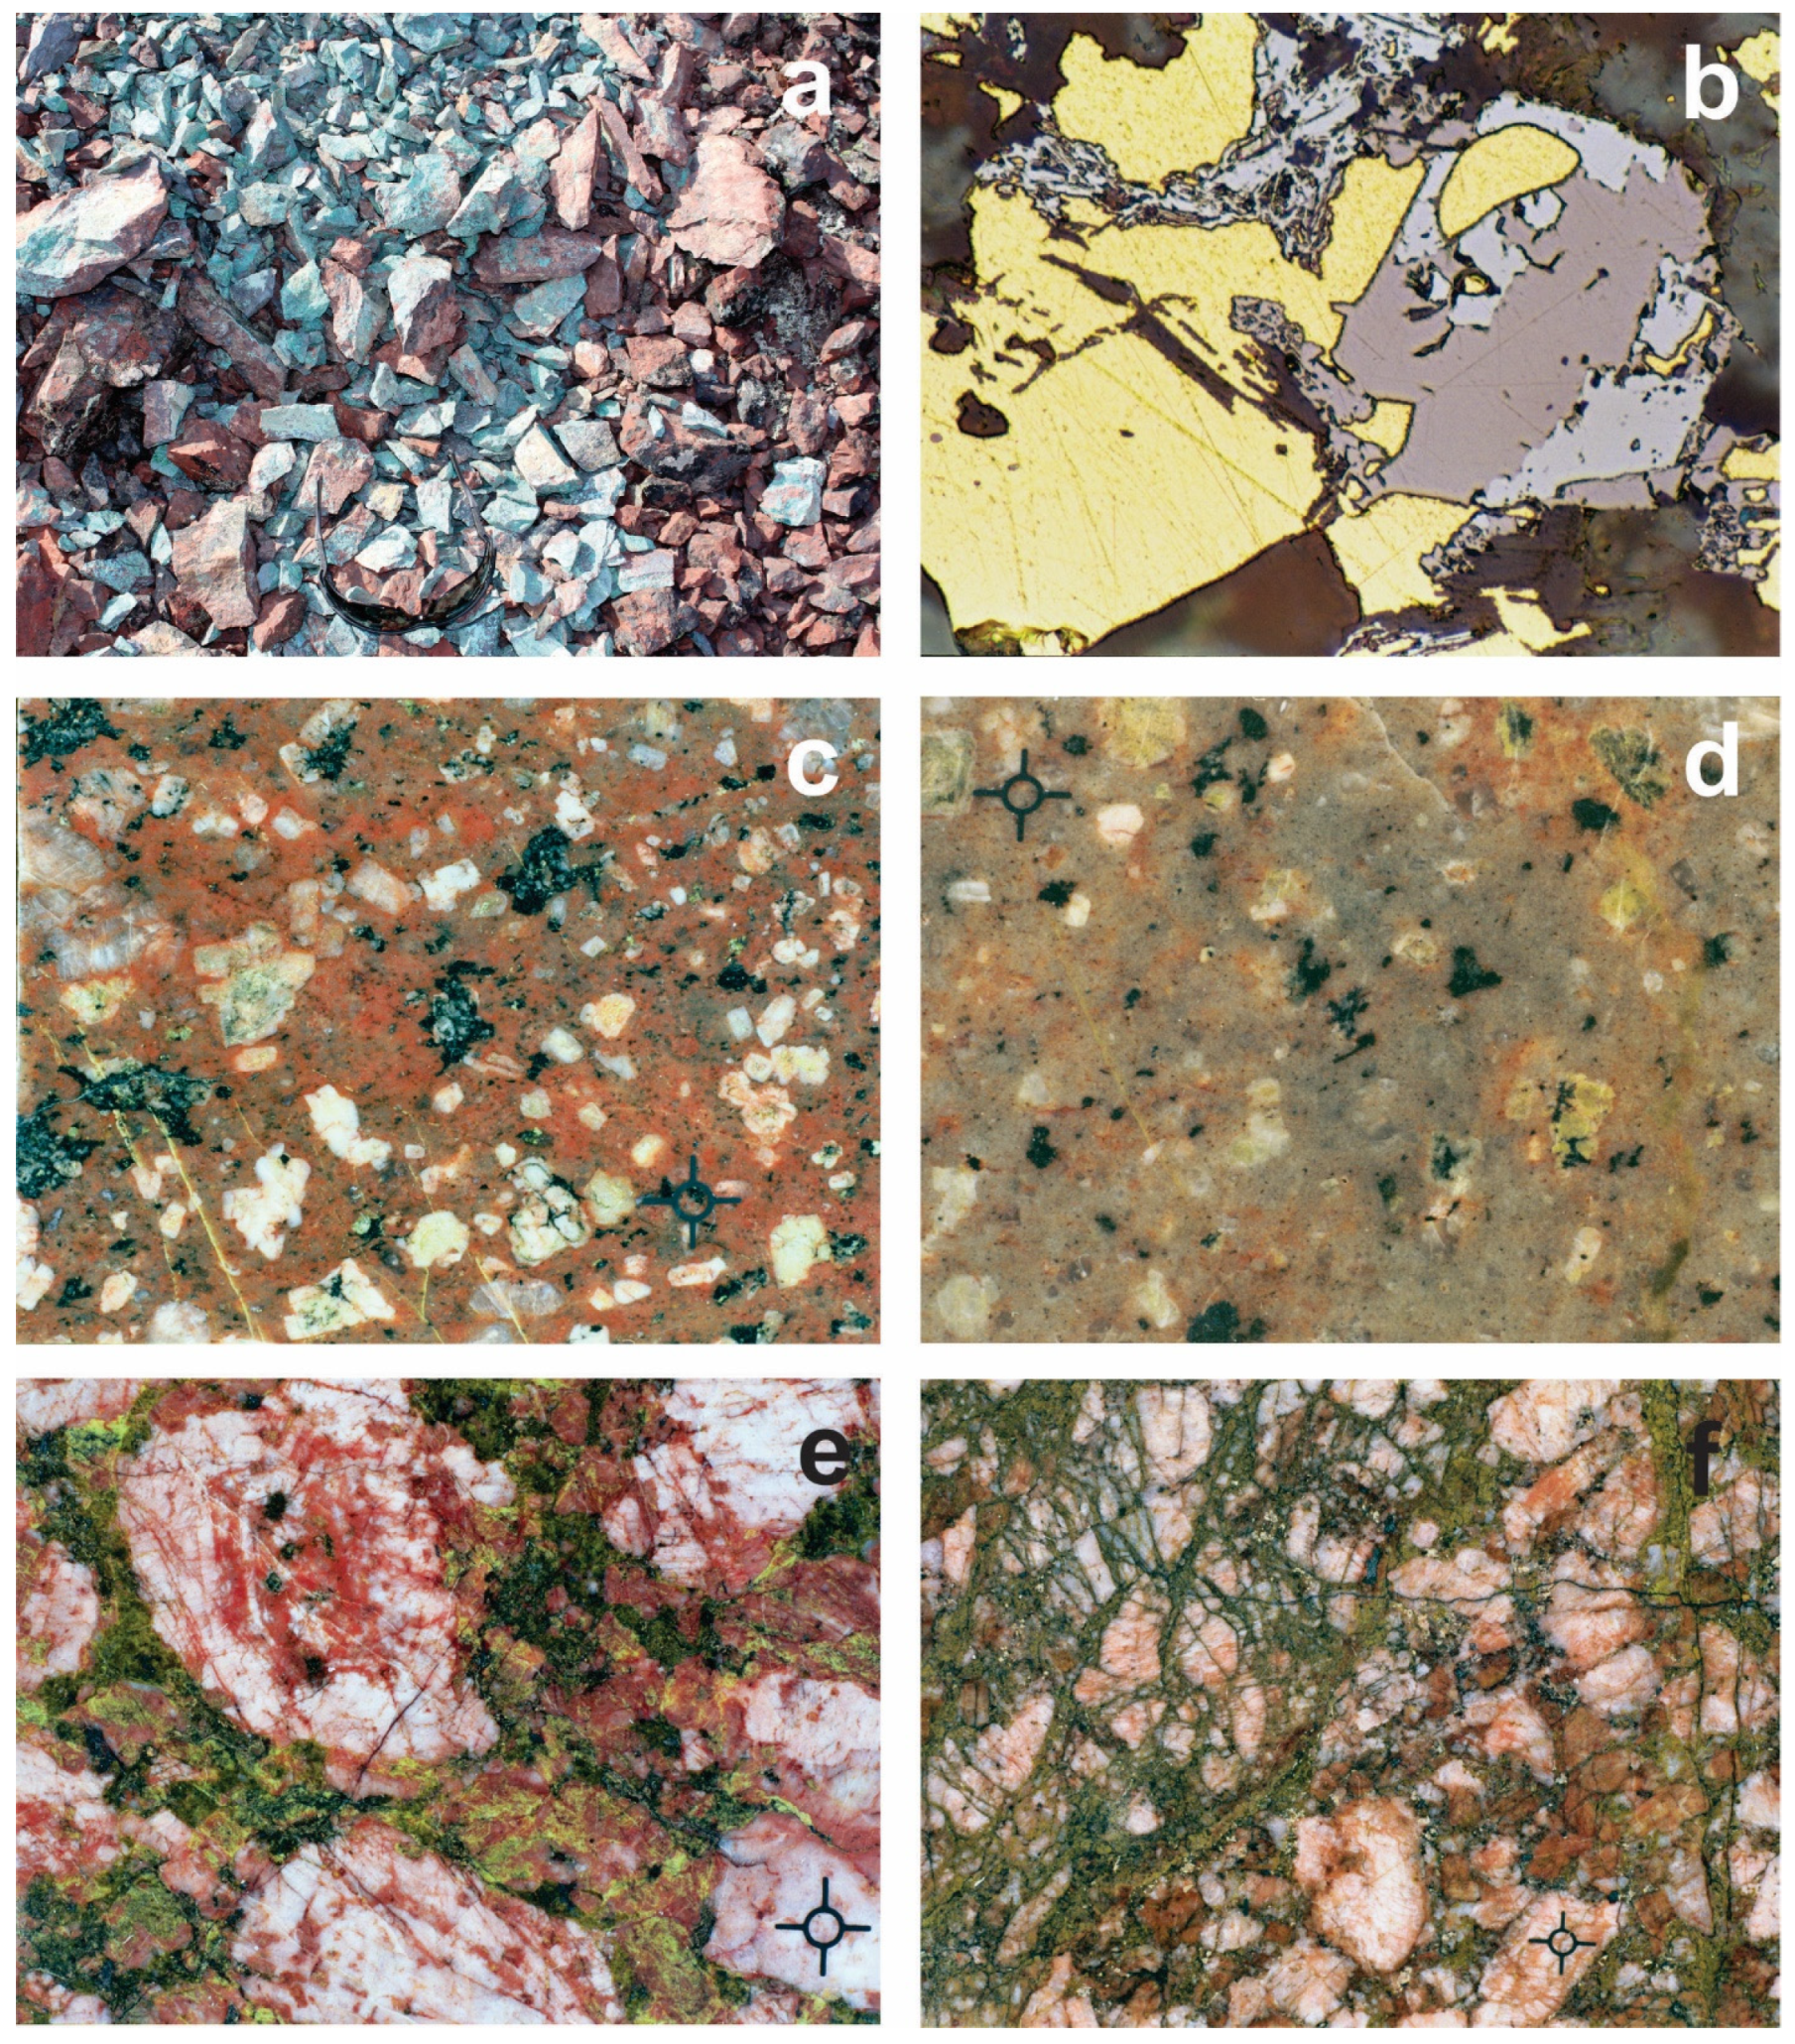
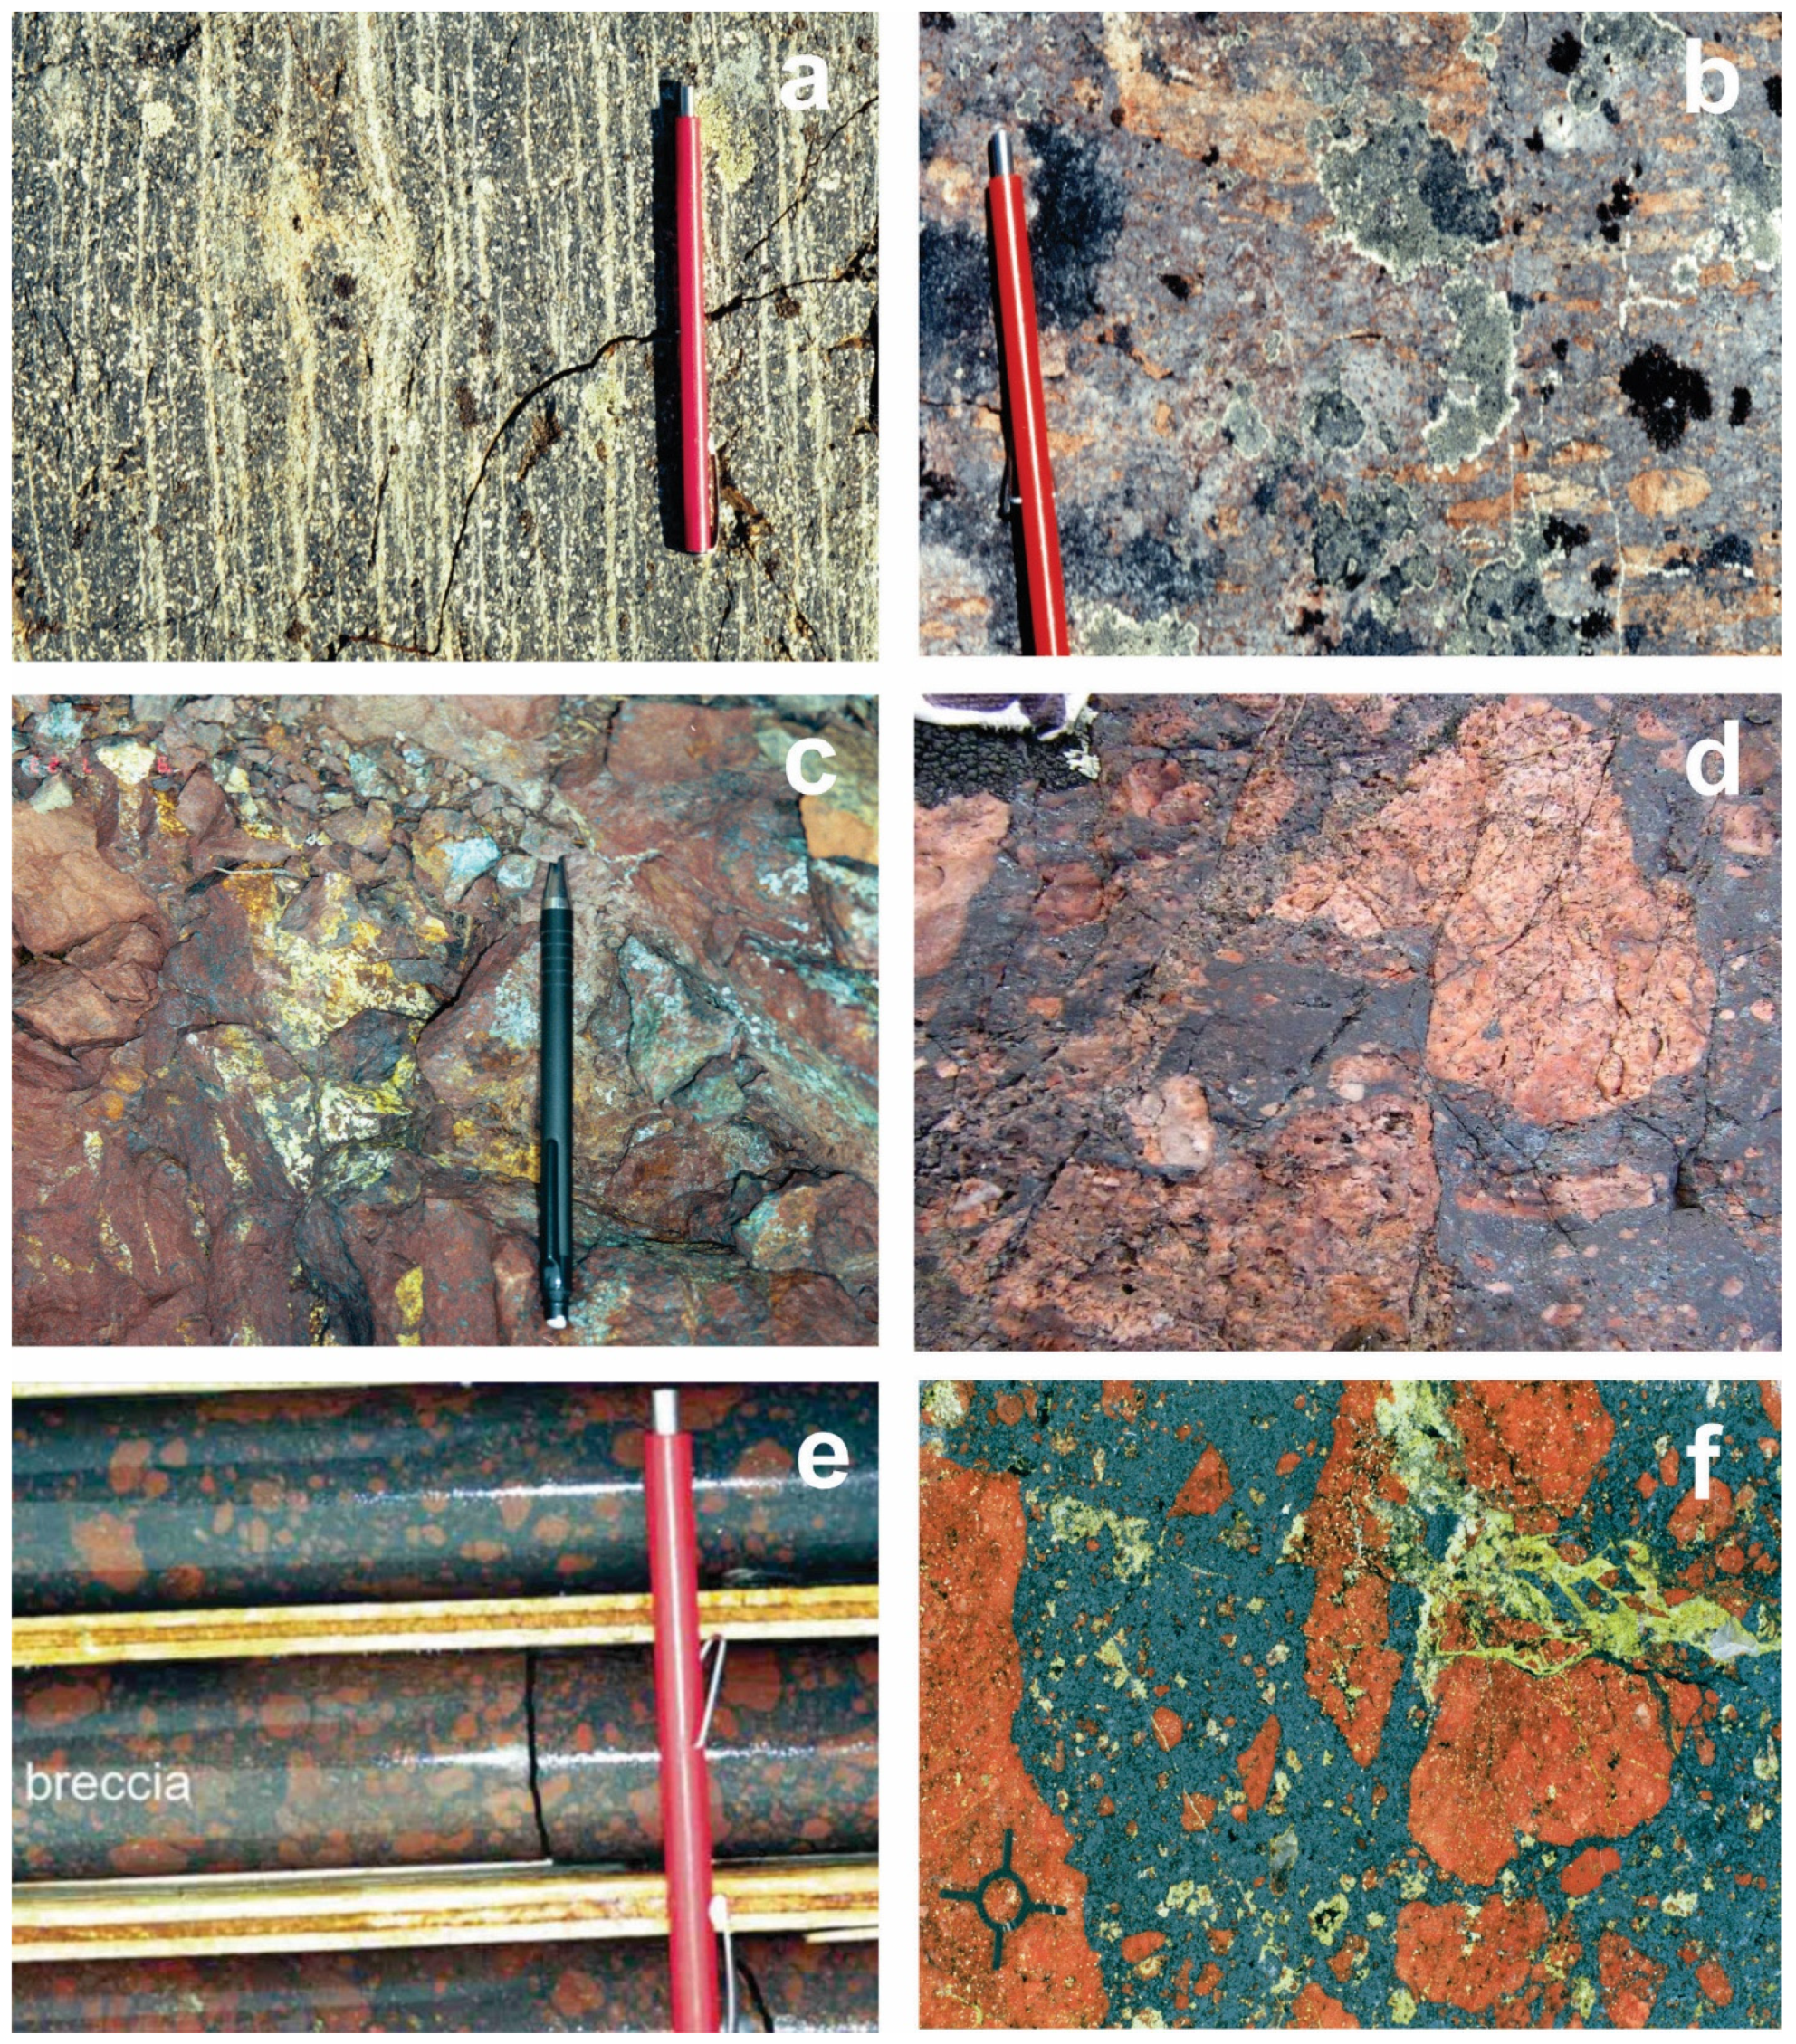
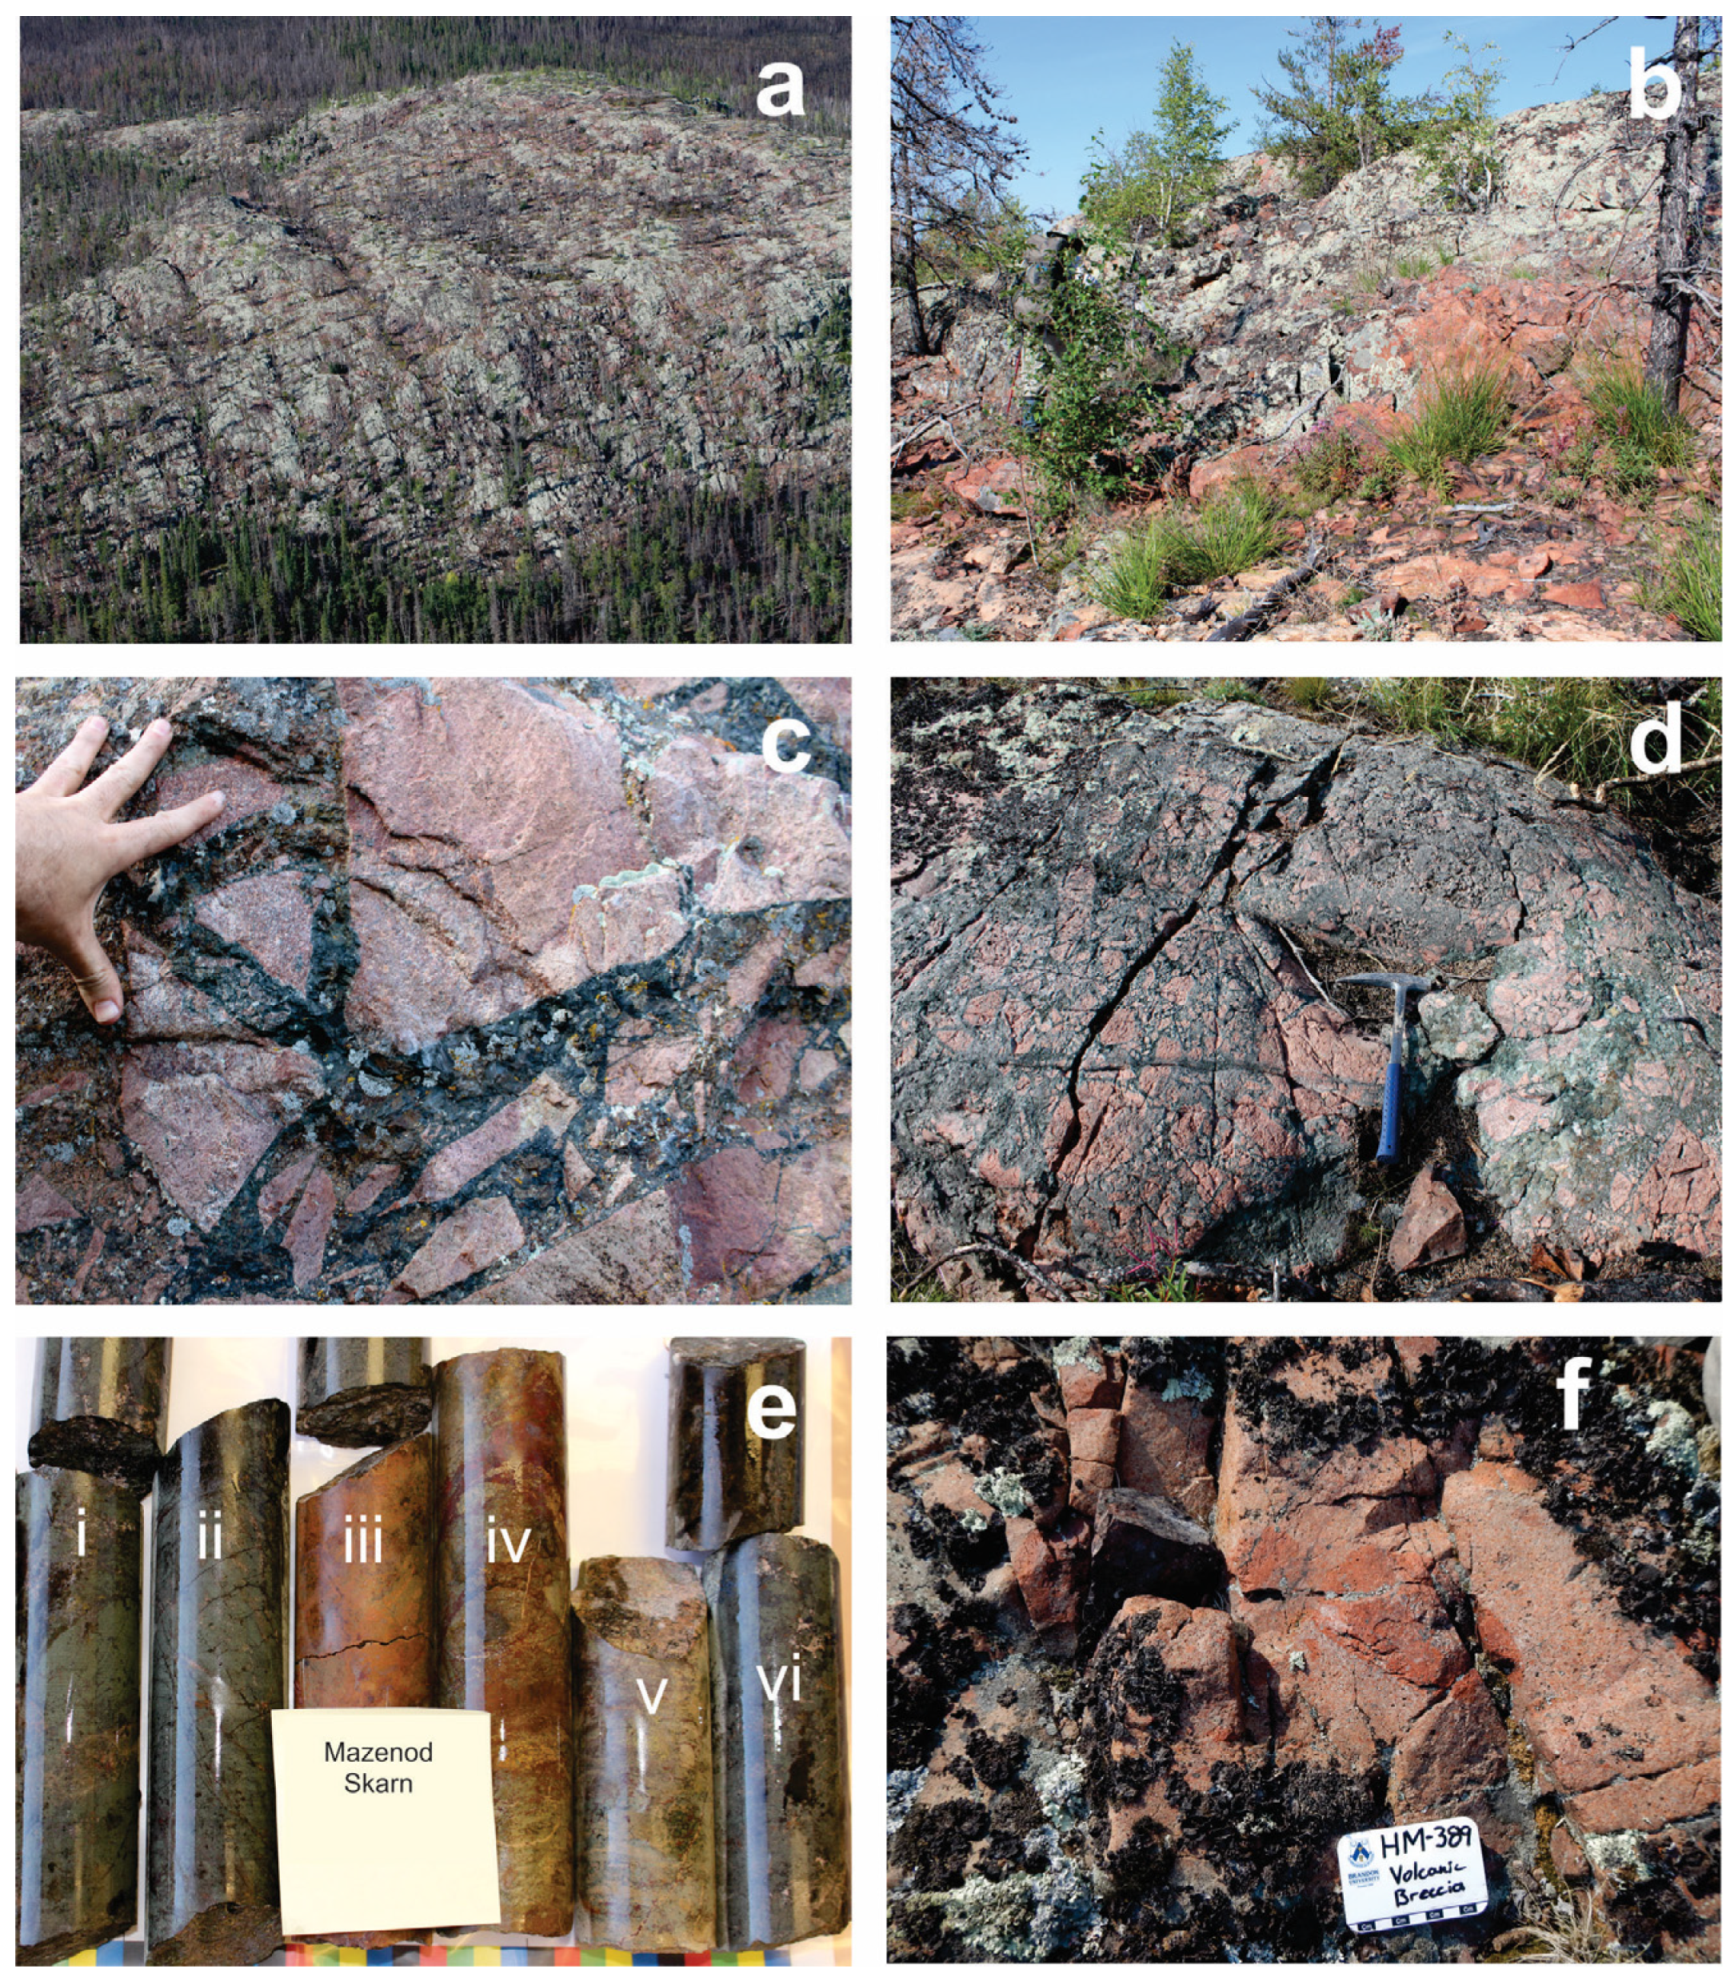
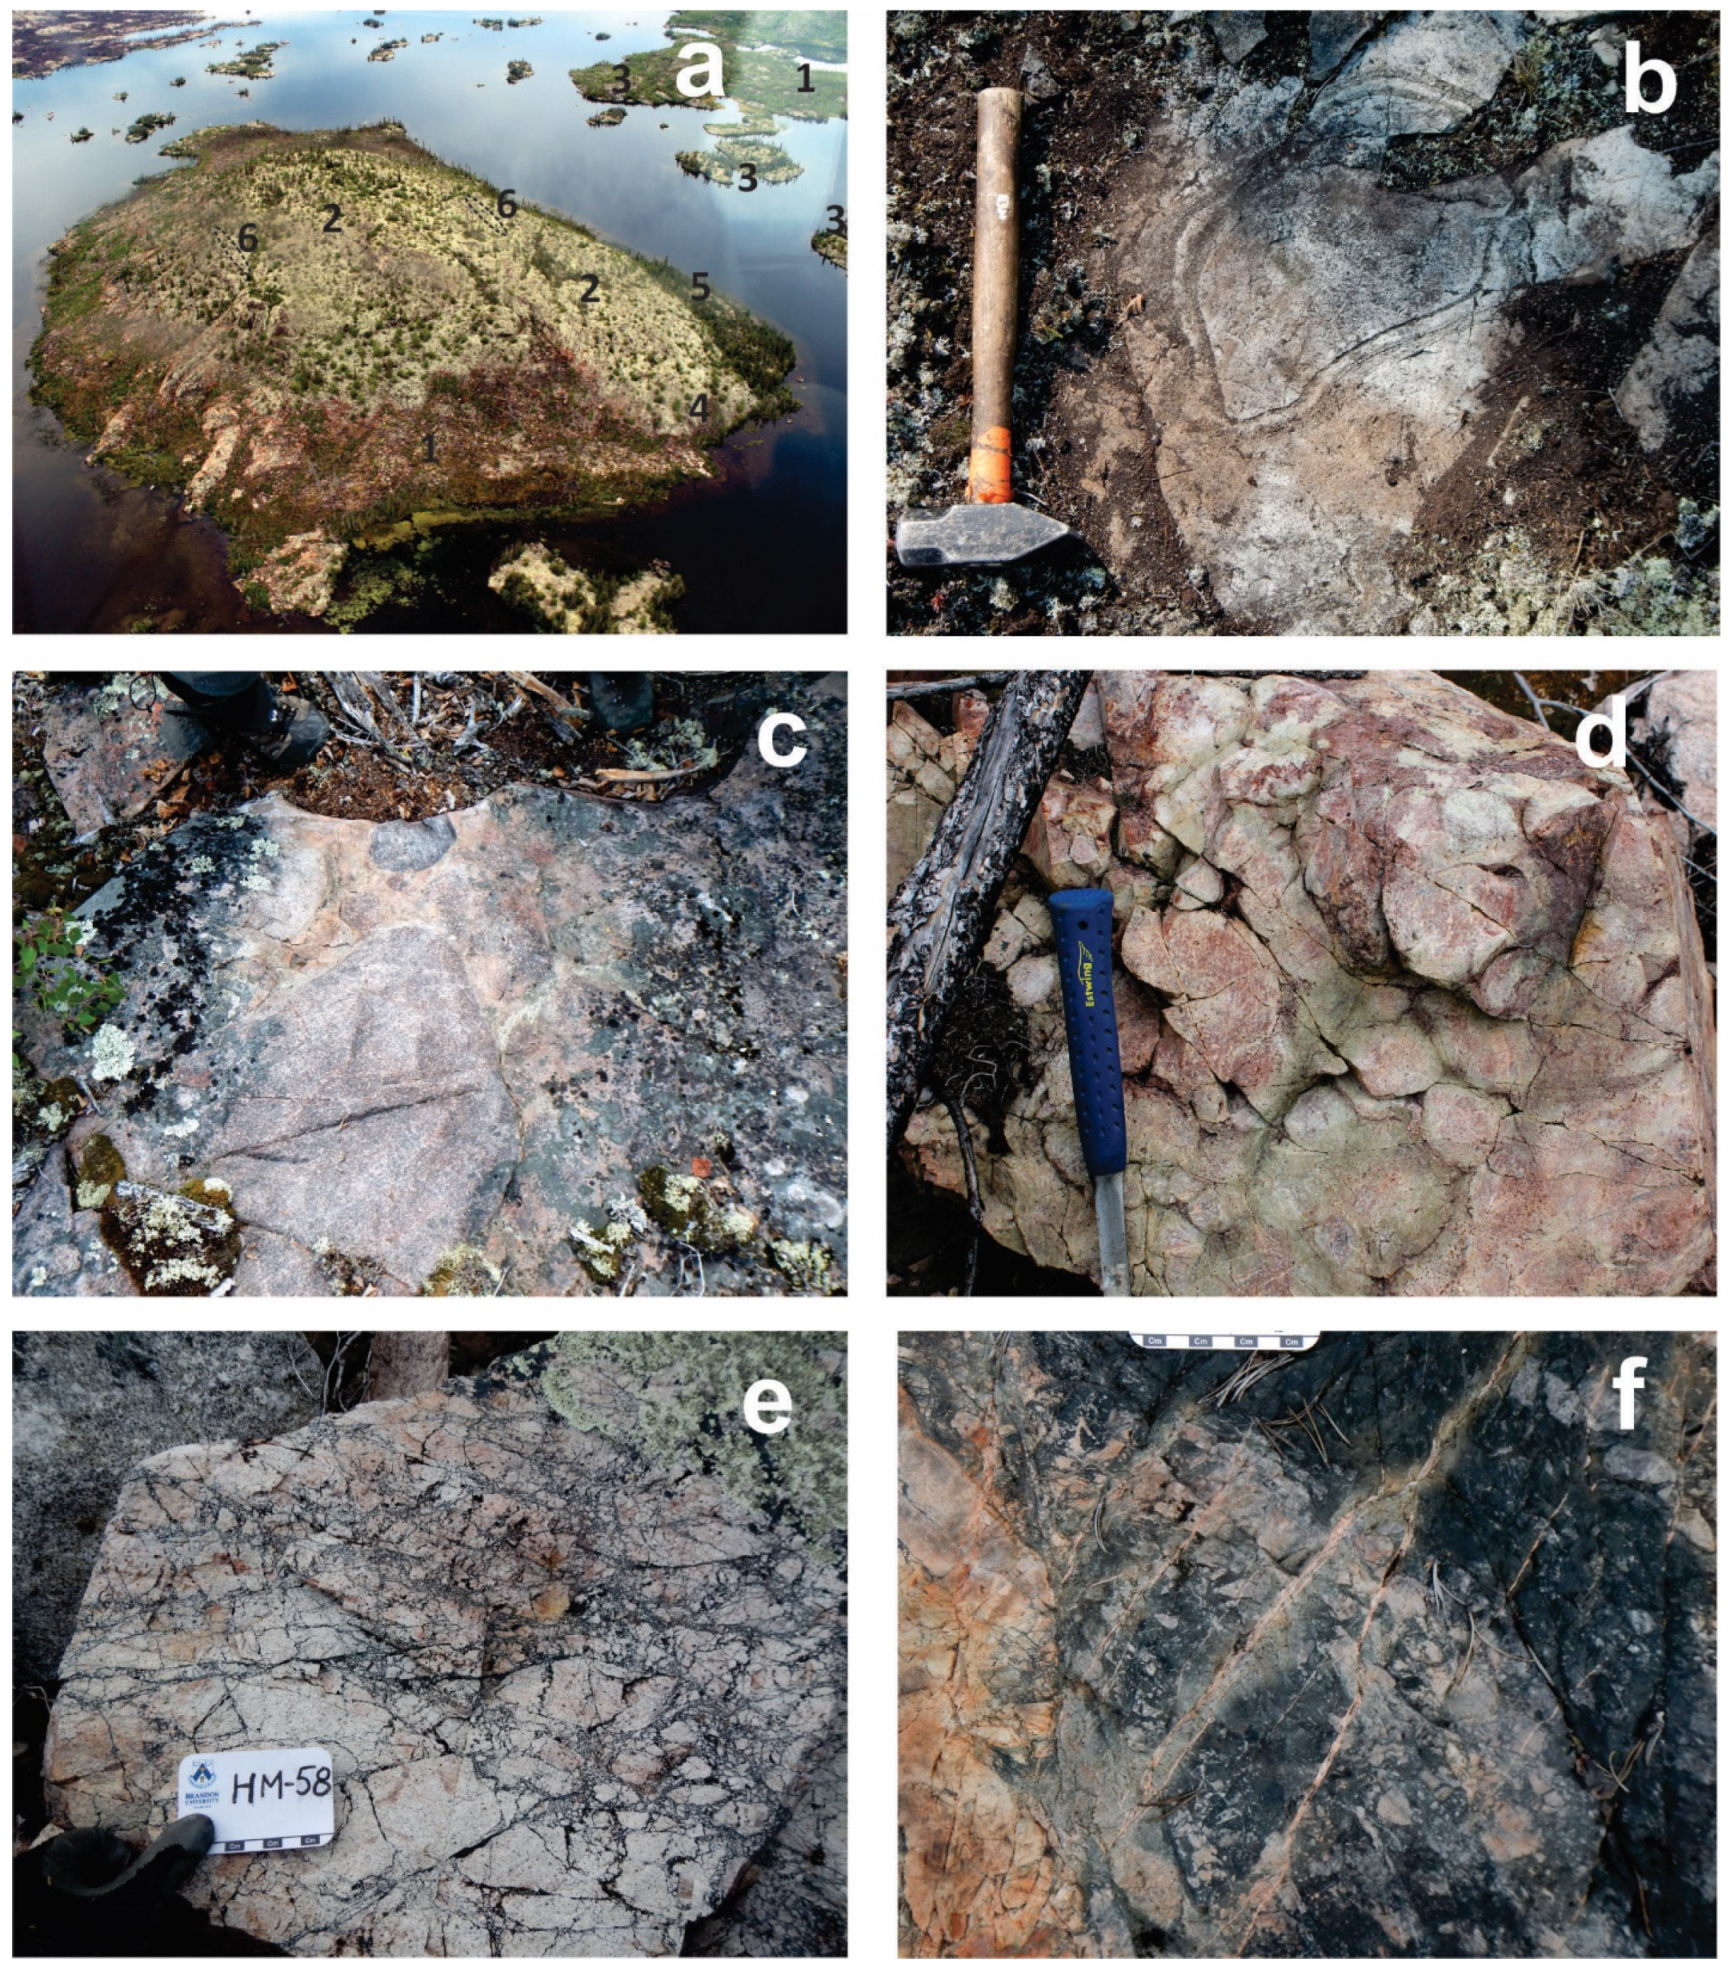
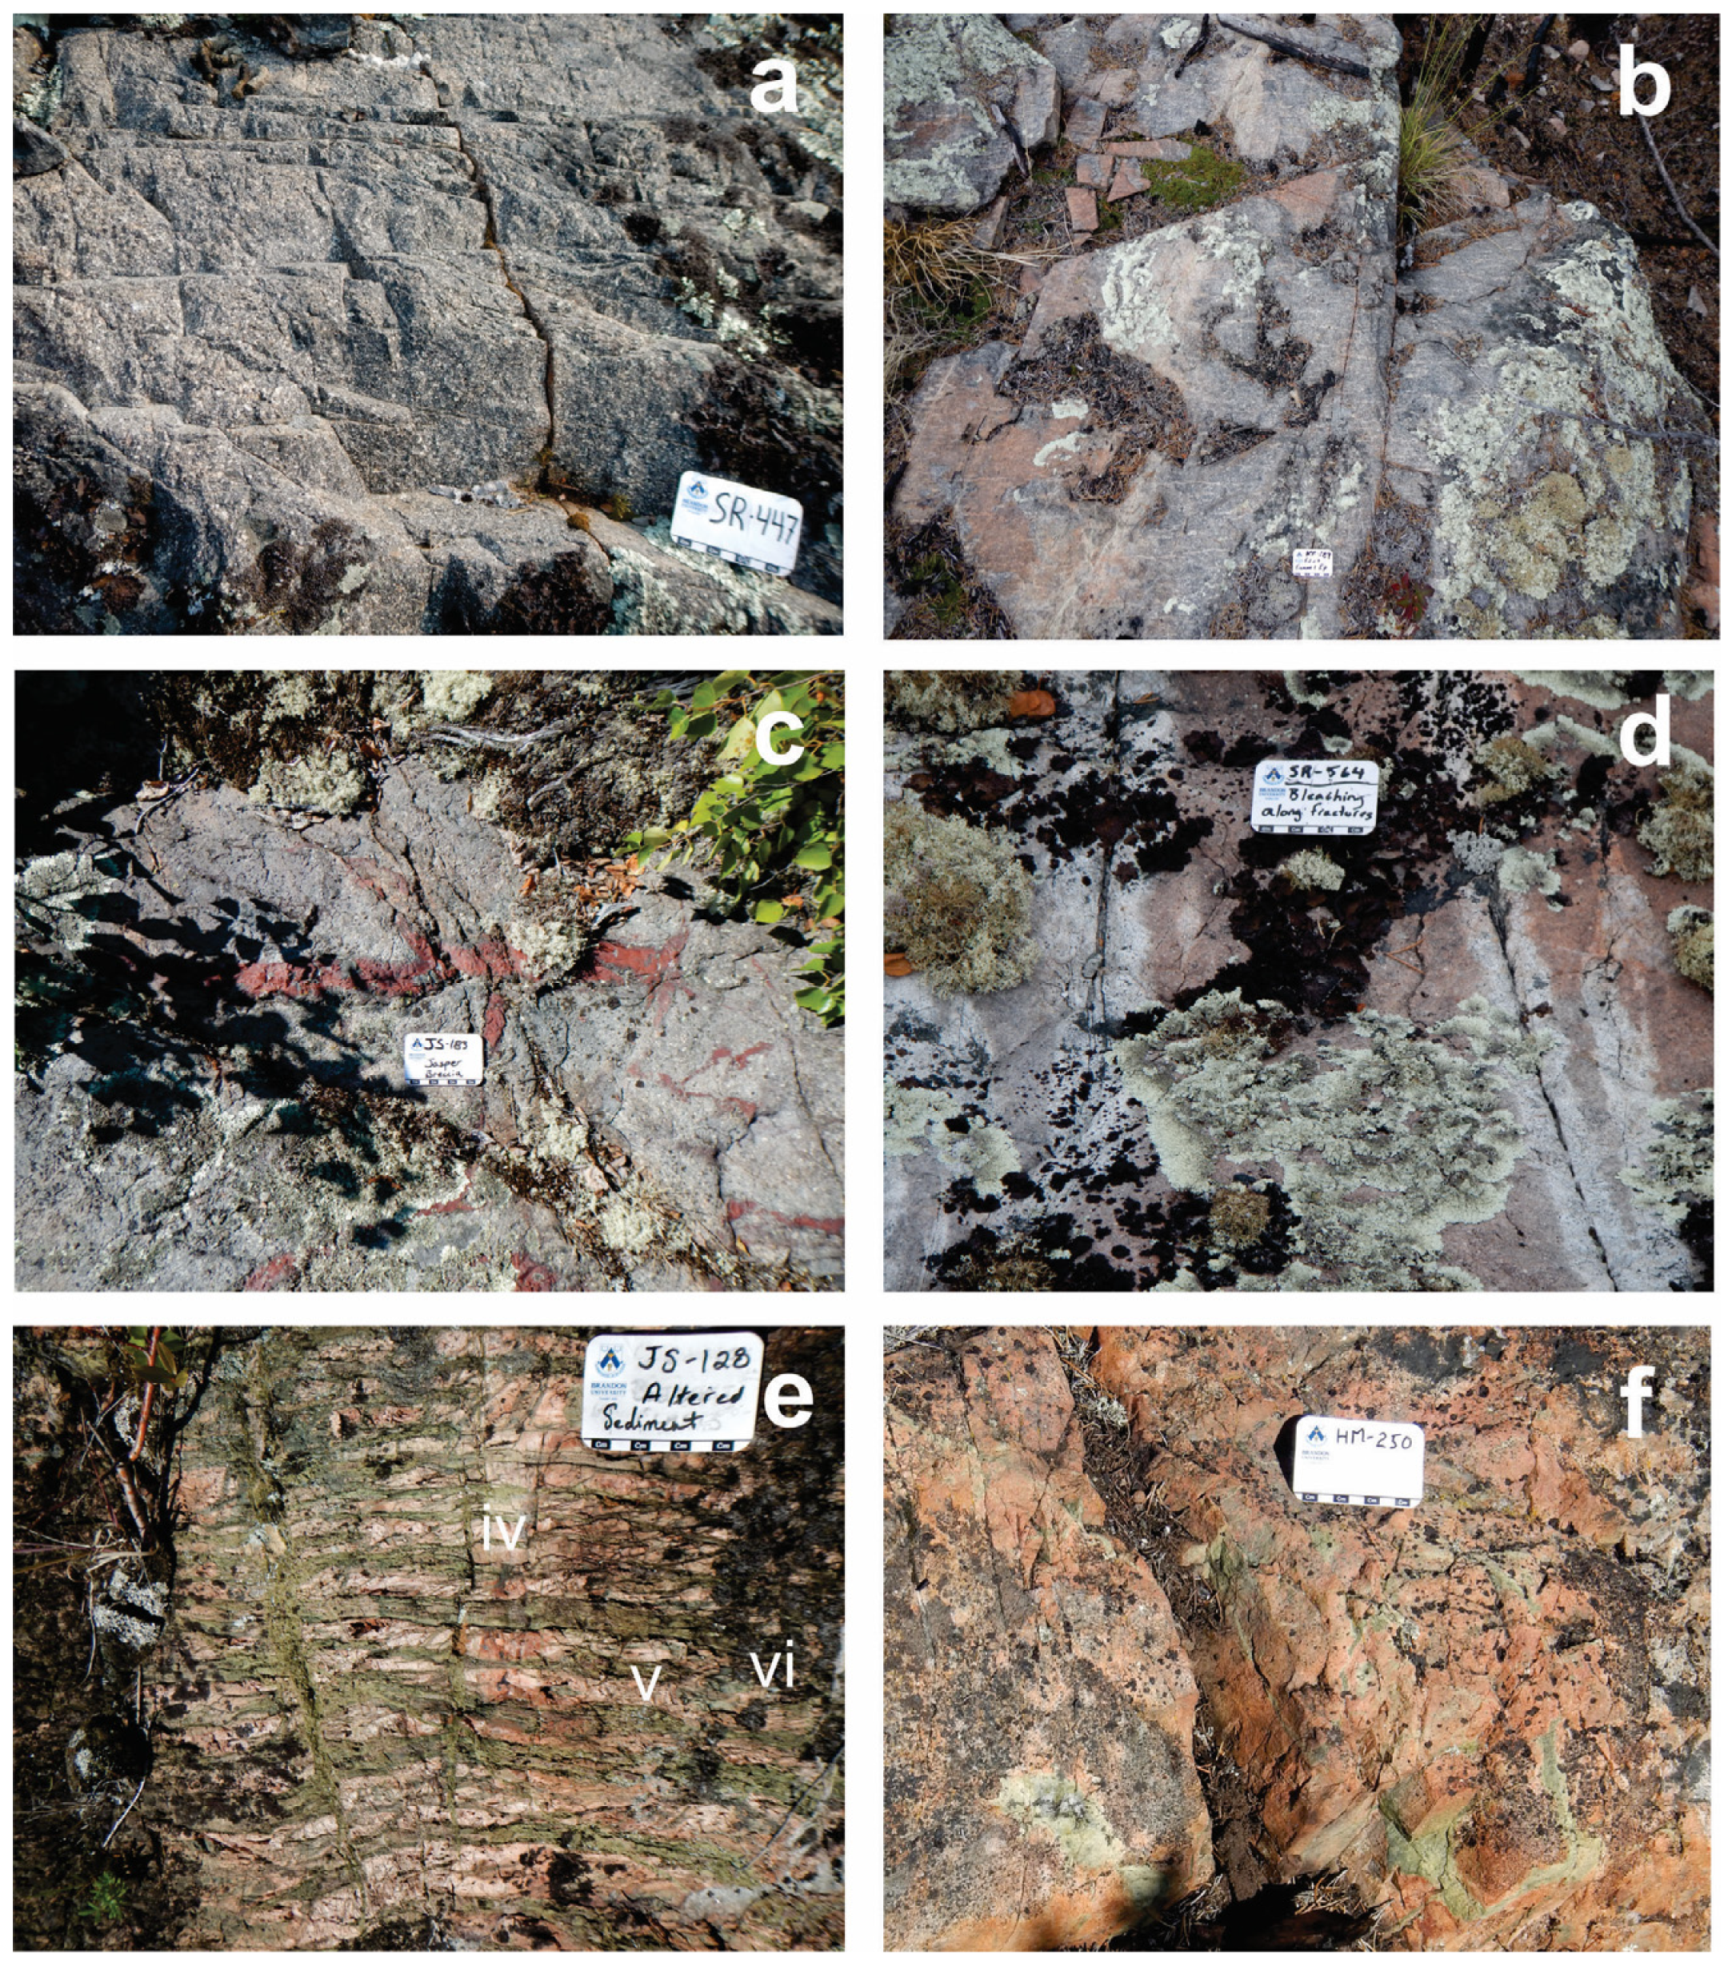
4. Hydrothermal Alteration

Igneous and sedimentary rocks of the Mazenod Lake region are pervasively affected by hydrothermal alteration. This includes potassic, sodic, magnetite, hematite, actinolite, epidote, chlorite, tourmaline, garnet, fluorite, quartz/silicification, phyllic, propylitic and skarn-like assemblages (Table 1). These alteration types are commonly associated with sulphur-poor magmatic hydrothermal systems that have potential to host IOCG, IOA and affiliated deposits [5,6]. In all cases, mineral or chemical names for the different alteration types refer to a net metal and/or mineral increase in the rock due to hydrothermal alteration, unless otherwise stated. Details and mineral assemblages associated with each of the abovementioned alterations are discussed individually in the following sections. The alteration types documented at Mazenod are present elsewhere throughout the GBMZ [4,9,10,11,12,14,15,16,18,19,20,47,48,51,55,56,57] and in other IOCG systems globally [5,6,7,13,28,44,53,58,59,60,61,62,63,64,65,66,67,68,69,70,71,72,73]. Alteration at Mazenod is also herein classified chemically using the Grant [74,75] graphical solution to Gresens [76] equations for chemical mass balance. In addition, relative intensity of alteration is plotted on regional maps using the residual alteration index method of Mumin [77]. Mineralogy is based on field observations, hand specimens, petrographic and SEM analysis [22,25]. For most types of alteration, both prograde and retrograde phases may occur, meaning that higher-temperature phases will overprint low temperature phases during a prograde stage, and lower temperature alteration will overprint higher-temperatures phases during retrograde stages of alteration. Further, magmatic–hydrothermal IOCG systems are dynamic over time and may experience many pulses of fluid influx and alteration, and hence several prograde-retrograde sequences. The evidence in the Mazenod district indicates overlapping hydrothermal cells resulting in regional-scale pervasive to intense alteration, similar to other districts in the GBMZ. Centers of increased hydrothermal activity and alteration intensity include Sue–Dianne, Mar, Dan Island, PD Skarn, Nod Hill, the giant quartz vein/breccia complexes, and several regions in the Bea (southern) area where alteration overall is not as intense as in the north. In addition, alteration patterns indicate that there may be other centers of intense alteration and mineralization that are hidden at depth, or under overburden and Paleozoic sedimentary cover.

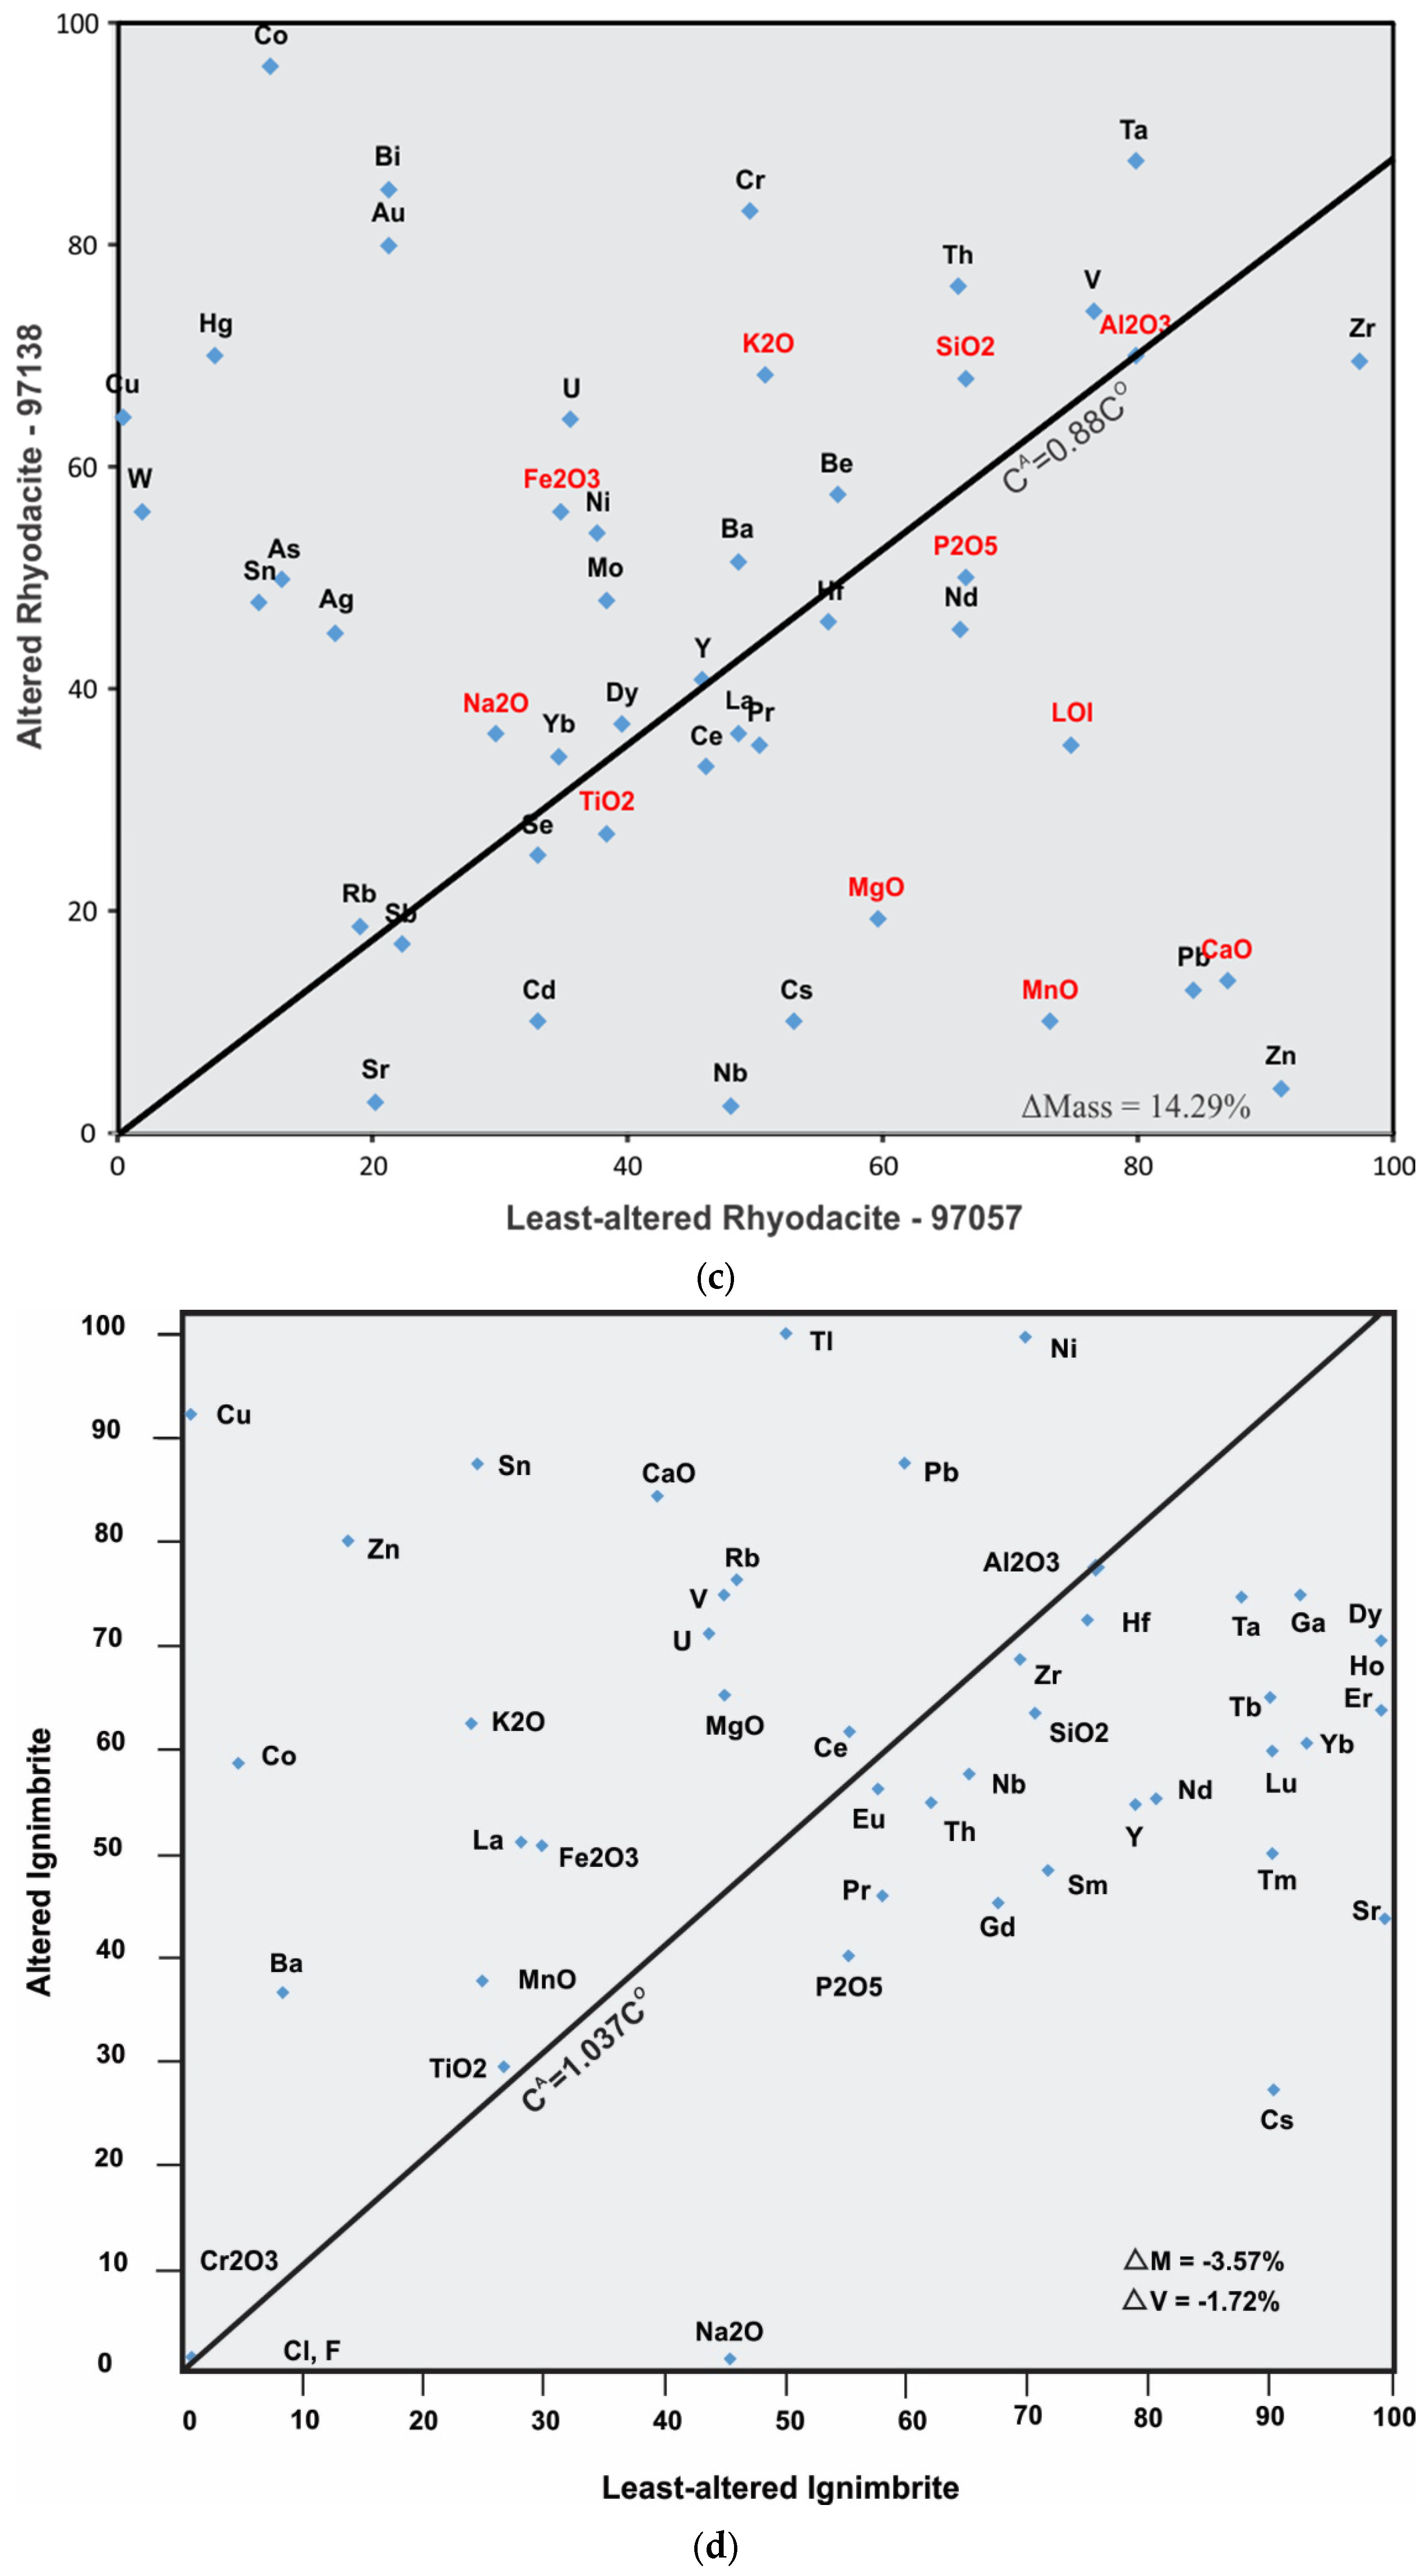
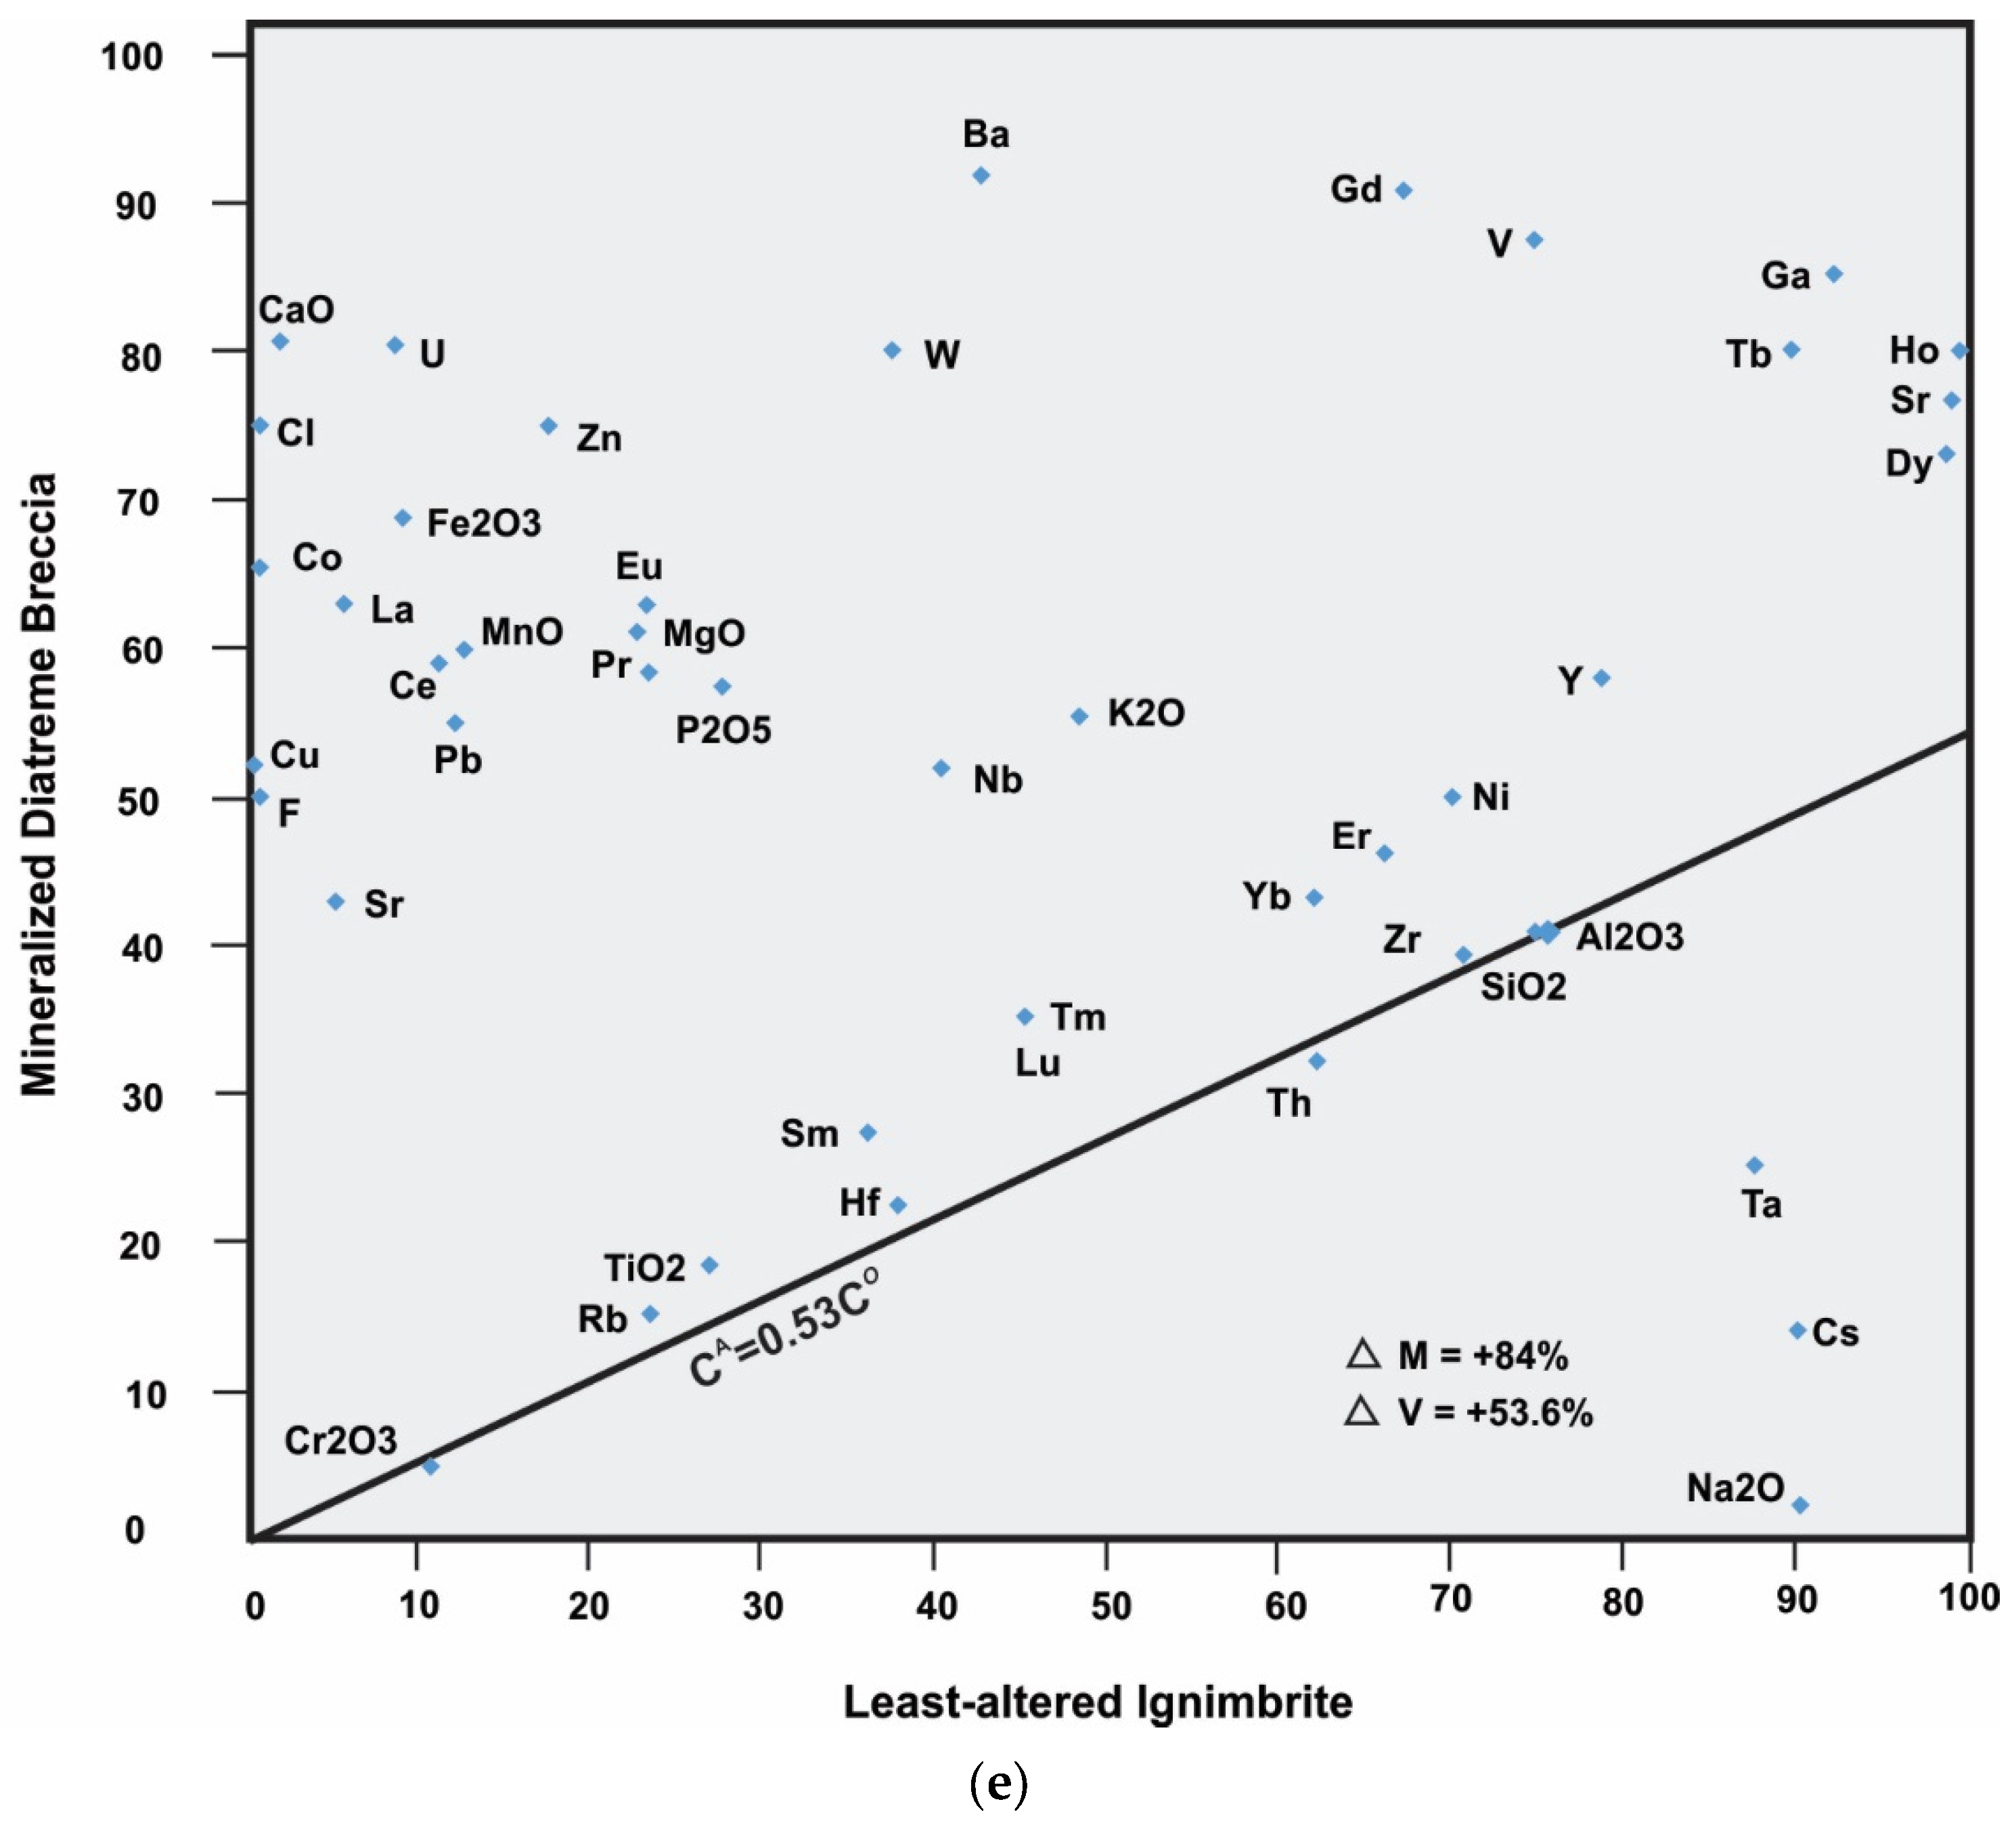
4.1. Chemical Characterization of Alteration

The large geochemical sample base of 875 volcanic, intrusive, and volcaniclastic rocks, covering a significant portion of the central Mazenod and Bea Lake areas, makes it possible to chemically characterize hydrothermal alteration type and relative intensity for these regions. Sample distribution provides good coverage for the central Mazenod region but is somewhat clustered at Bea, being constrained by available outcrop. However, the sample base is sufficiently large that the geochemical patterns are reasonably delineated. A sample location map for the 875 samples is given in Hamilton [25]. The large central area covered by younger Paleozoic sedimentary rocks in the Squirrel Lakes NE–SW corridor has no sample coverage because the younger cover rocks were not affected by the alteration event. Due to the presence of chemically different host rocks, residual alteration indices (RAI) are used to plot relative intensity according to different styles of alteration [77]. The RAI used here is a refinement of the concept of an alteration index (AI) first used by Ishikawa [78] for VMS deposits. Alteration indices combine the effects of elements added during alteration with those that are removed and/or conserved. The RAI removes the unwanted effects caused by different original chemistries, and then sets the range of alteration intensity from 0 to 100% for each different rock type present and allows a comparison of intensity even though different host rocks are used. Any spurious negative results due to the analyses and calculations are set to 0%. In all cases there are corresponding mineralogical changes in abundance and/or mineral phase, and/or mineral chemistry that reflect elemental additions and depletions. However, the presence of any particular mineral does not necessarily indicate a corresponding hydrothermal elemental enrichment or depletion in the rock and may only reflect a redistribution of the original chemistry into a new suite of hydrothermal minerals (i.e., isochemical alteration).
The basic method for plotting RAI is described in detail in Mumin [77] and summarized here as follows:
AI = (sum of elements added during alteration ÷ sum of elements added and subtracted) × 100%
R A I = ( A I B I ) / ( 100 B I ) × 100 %
where the following is true:
RAI = Residual alteration index
AI = Alteration index (see below)
BI = Base index (=AI of least altered rock type)
100-BI sets the range of intensity for each alteration and rock type from 0 to 100%
While RAI plots give a qualitative indication of intensity of alteration, they are most useful at showing regional hydrothermal patterns. RAI plots require chemical classification of host rocks and identification of least-altered versions of each rock type. This was carried out using chemical discrimination diagrams of Pearce (Figure 15) [52,54]. Volcanic rocks classify as basaltic andesite, andesite, dacite and rhyodacite, and intrusions include diorite, monzodiorite, and monzogranite. Corresponding base indices (BI) for the original unaltered rocks are taken from the chemistry of least altered versions of these rocks (Table 2). Results for RAI calculations are plotted and contoured in Figure 16, Figure 17, Figure 18, Figure 19 and Figure 20 using ArcMap and simple kriging. Calculated and plotted results for the RAI carry a certain bias imparted by the irregular distribution of outcrop and available samples. Although care was taken in the selection of least altered samples, even these rocks may have been subjected to minor amounts of K, Na, and/or silica enrichment as explained below, which may result in a minor to moderate decrease in the overall intensity of alteration reported. However, the database is sufficiently large to present a geochemical picture of general alteration distribution that highlights several areas of interest and corroborates field observations. Aluminum is assumed conserved and the best proxy for the most immobile major element in the Mazenod region. This is supported by the high field strength metals Zr, Hf, Nb, Ta, Ti, and Th, all of which behave similarly to Al in the mass-balance diagrams discussed below. Results of the RAI plots are discussed below along with the discussion of individual alteration types. Residual alteration indices for the following alteration indices are plotted.
Potassic Index: AI = K2O/(K2O + Na2O + CaO + MgO + MnO) × 100% (Figure 16)
Alkali Index: AI = K2O/(K2O + Na2O) × 100% (Figure 17)
Sodic Index: AI = Na2O/(Na2O + Al2O3) × 100% (Figure 18)
Fe Index: AI = Fe2O3/(Fe2O3 + Al2O3) × 100% (Figure 19)
Silica Index: AI = SiO2/(SiO2 + Al2O3) × 100% (Figure 20)
The RAI plots show that regional alteration is independent of rock type (Figure 16, Figure 17, Figure 18, Figure 19 and Figure 20). All rocks within the sampled area show at least some chemical modification due to reaction with fluids. The pervasive nature of chemical and mineralogical modification is an indication that hydrothermal fluid alteration is essentially syn-volcanic, since, in order to be so completely pervasive, fluid migration and reaction must occur while rocks are still highly porous and permeable. In effect, this must happen before recrystallization and induration of the volcanic pile occur. Greatest intensity is focused along and at the main structural corridor and occurs above and adjacent to a monzodiorite porphyry intrusion (Figure 3 and Figure 4). Potassic alteration is antithetic to sodic alteration, Fe metasomatism is weak and localized, and silica enrichment, like potassium is widespread but weak. The general nature of the alteration is comparable to late-stage and distal to intermediate effects, punctuated by localized intensification. The most obvious center of alteration is at Dan Island, with lesser indications at NOD, NET (Mazenod Ridge), and in NE and SE corridors that intersect at Dan Island. Intensification is also indicated for the Bea area. In all cases, the pattern of alteration indicates higher level effects exposed at surface, with a likely source at depth.

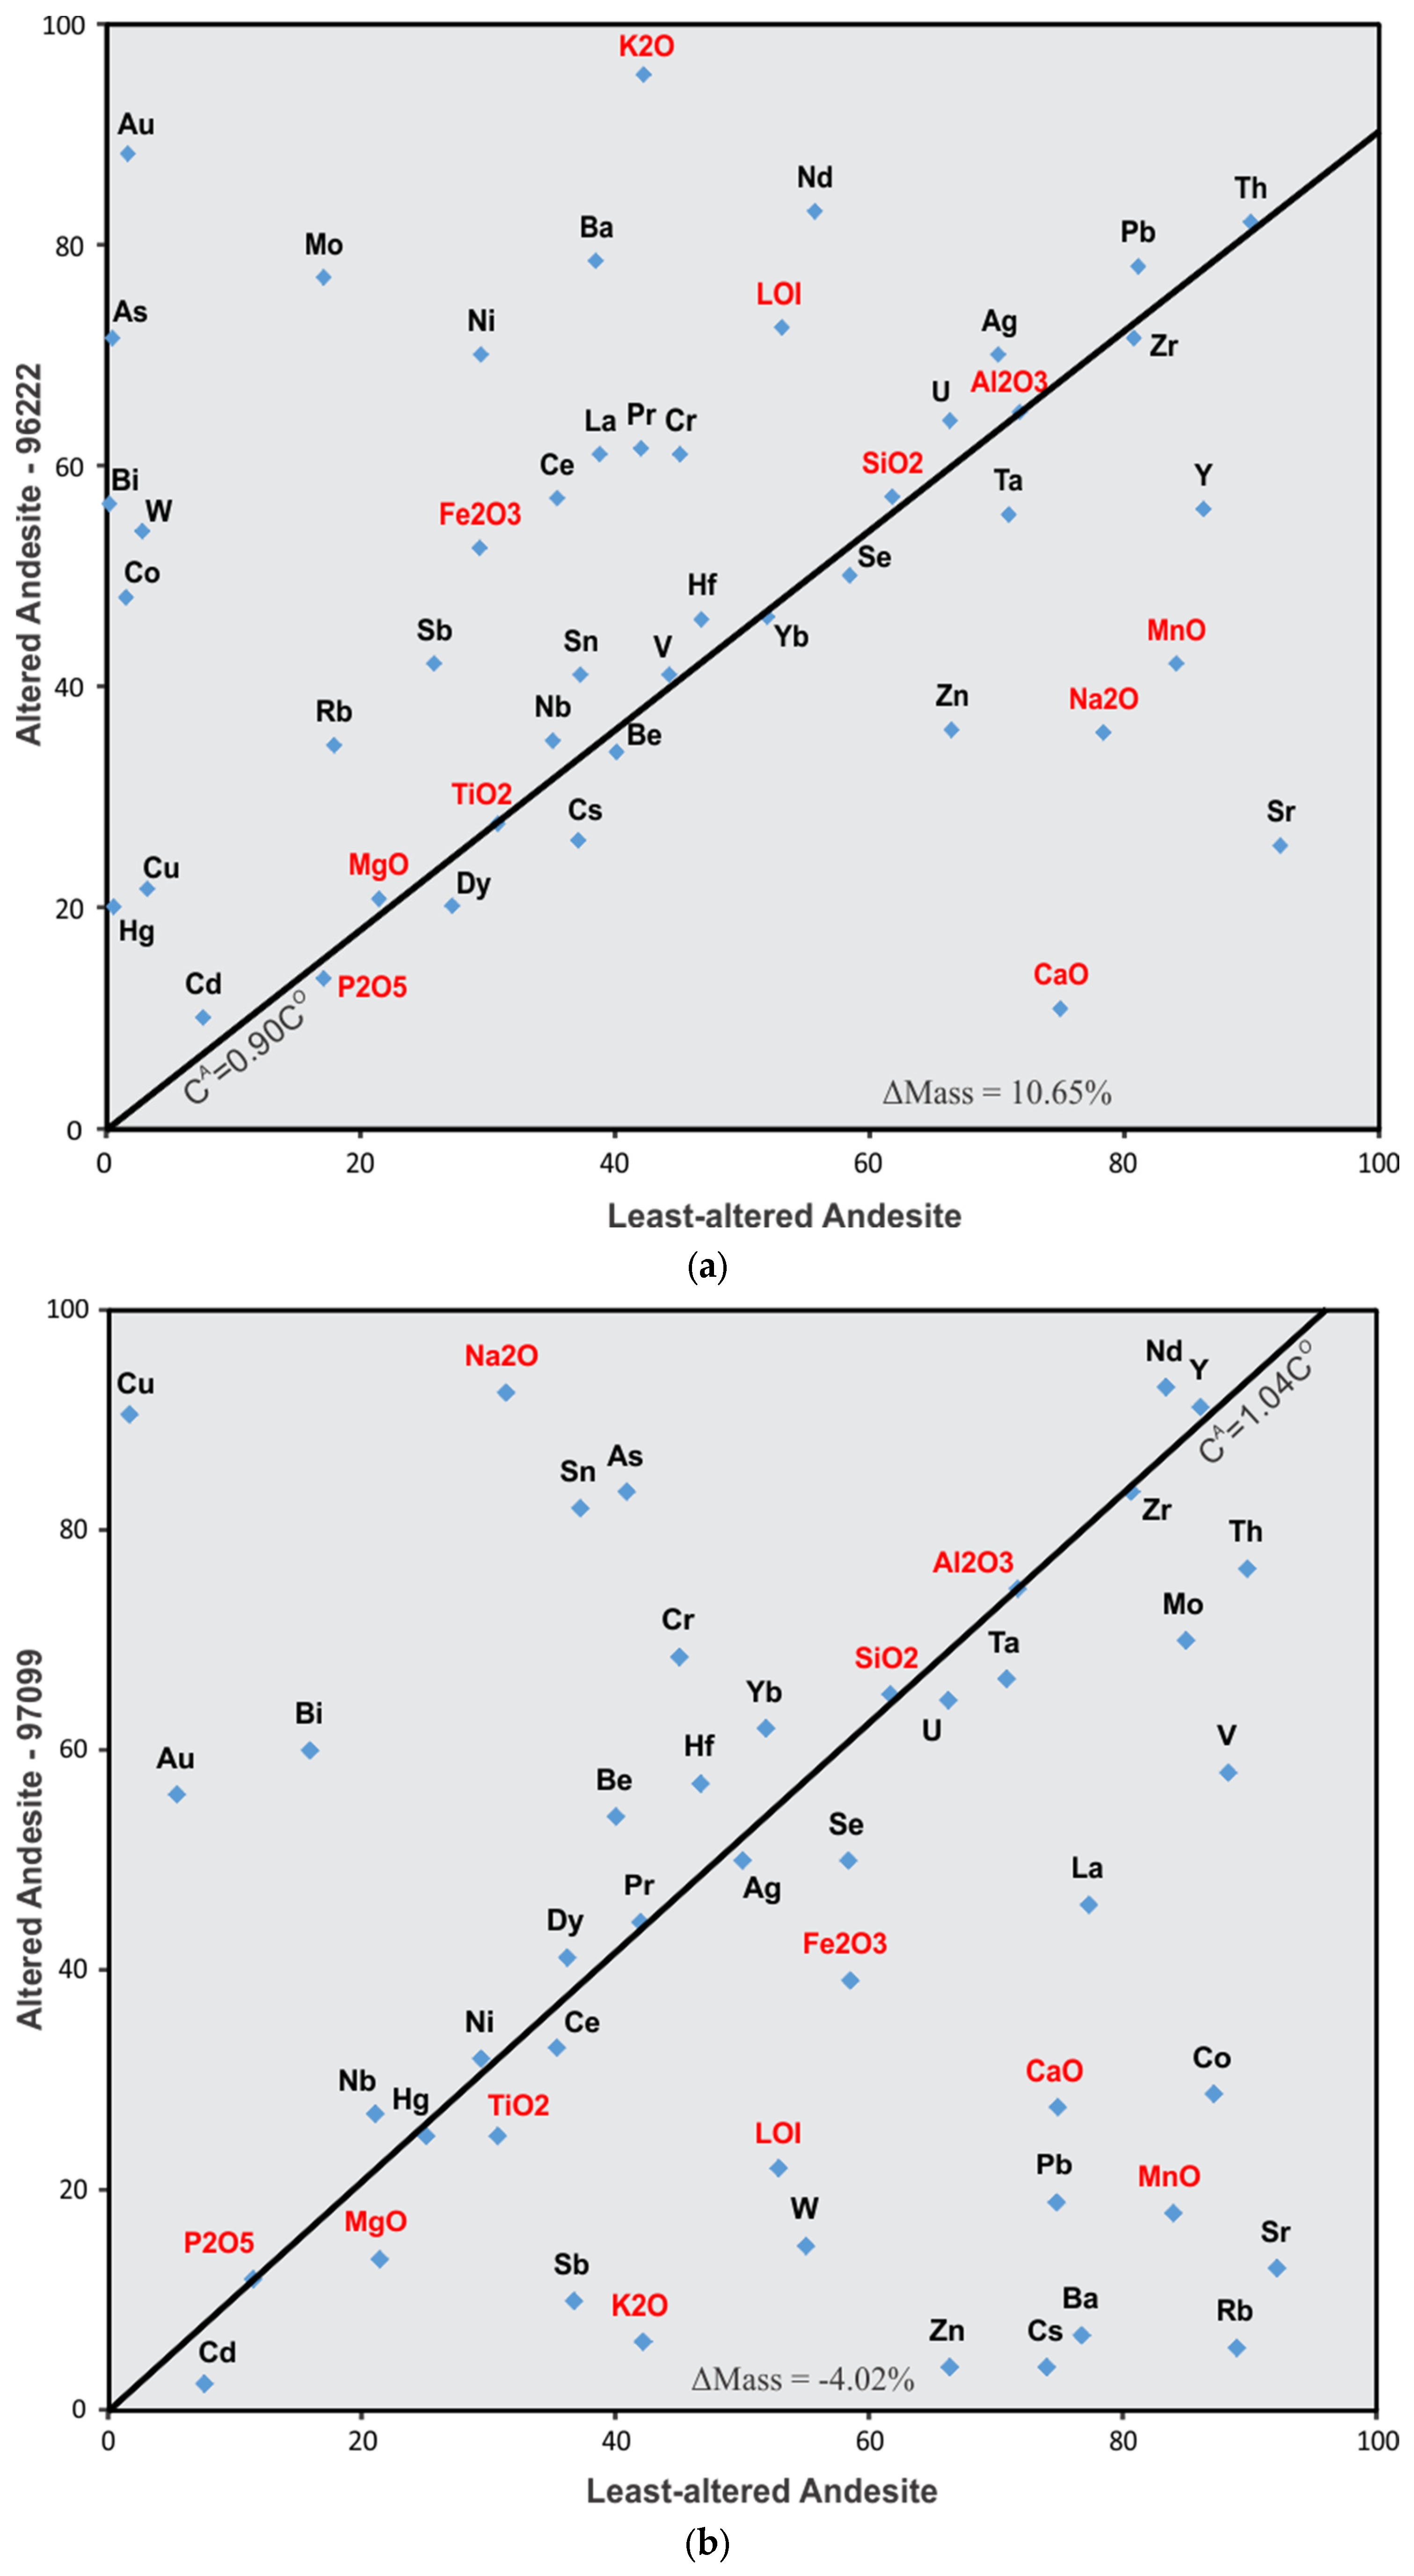
4.2. Mass Balance and Chemical Alteration

The Grant [74] graphical solution for the presentation of mass balance using the equations of Gresens [76] is used here to quantify some of the major and minor elemental gains and losses during hydrothermal alteration in the Mazenod district. Aluminum is used to plot the Isocon line on each diagram (no elemental change) due to its relative immobility and abundance, which helps avoid analytical vagaries in the plot. Elements plotting above the isocon are hydrothermally enriched and elements plotting below are depleted. The slope of the line from each element to the origin is directly proportional to the degree of enrichment or depletion. Steeper slopes above the isocon line represent increasing degrees of enrichment, and shallower slopes below the isocon line indicate increasing degrees of depletion. Net change in mass during alteration is also calculated and stated on the plots, and for the Sue–Dianne plots, net volume change is also calculated. Here we examine elemental gains for selected samples of hydrothermally altered Mazenod rocks by comparing altered variants with the chemistry of least-altered samples of the same rock type (Table 2). Chemical gains and losses for potassically altered and sodically altered andesite from Dan Island and Nod Hill, respectively, and magnetite-enriched rhyodacite ignimbrite from Nod Hill are shown in Figure 21a–c. The host rocks for the Sue–Dianne deposit are almost entirely rhyodacite ignimbrites. However, those ignimbrites analyzed by Camier [22] plot within the rhyolite field near the boundary with the rhyodacite/dacite fields. These samples may have been affected by the regional minor alkali ± silica alteration, which could account for their plotting as rhyolite. Mass balance plots for potassically altered ignimbrite near the Sue–Dianne deposit and mineralized diatreme breccia from the Sue–Dianne Deposit are shown in Figure 21d,e, respectively.
Potassically altered andesite (felsite, Figure 21a) with minor disseminated pyrite from the Mazenod Lake area shows strong enrichment in K and Fe as well as for As, Rb, Sb, Ba, and REEs. Very high enrichments are shown for most metals of interest including Cu, Au, Co, Bi, Mo, Ni, W, and Hg. However, U, Ag, and Pb are conserved or only slightly enriched. Also conserved are Si, Be, V, Zr, Th, Ta, Se, Cs, Ti, Mg, and P. Significant depletions are indicated for Na, Mn, Zn, Y, and Sr. Ca is the most strongly depleted element plotted.
Sodically altered andesite is plotted in Figure 21b. Field mapping recorded this sample as being potassically altered, which emphasizes some of the difficulties experienced during field identification of hydrothermally altered rocks, and why geochemistry, petrography, and/or spectrometry are needed. Hydrothermal albite in IOCG systems is often pink in color, and even reddish due to weathering or the presence of minor Fe oxides, which leads to confusion with K–feldspars [20,21,47,53]. Sodium, along with Sn, As, and Bi, is significantly enriched while Cu and Au are very strongly enriched. It is not known if the strong enrichments (excepting Na) are due to a later vein or overprint on the sample analyzed. Depletions occur for Fe, K, Ca, Zn, Co, Ba, La, V, Sb, Cs, Pb, W, Mn, Sr and Rb. Remaining metals are conserved or only slightly modified. Many elements depleted during sodic alteration are the same elements enriched during potassic alteration and mineralization. (c.f. Figure 21a,d,e), suggesting metal fluxing during alteration as described by Richards and Mumin [5,6,79].
Moderately potassically altered rhyodacite ignimbrite cut by a magnetite breccia from the south end of Nod Hill is plotted in Figure 21c. Rocks are moderately enriched in Fe and K along with U, Ni, Cr, Th, Mo and Ta, with possible minor Na enrichment. Rocks are depleted in Ca, Pb, Zn, Mn, Nb, Cs Mg, Cd and Sr. Remaining elements are conserved or only slightly modified.
Potassic (K–feldspar) plus moderately hematite-altered rhyodacite ignimbrite adjacent to the Sue–Dianne deposit shows strong enrichments in Cu, Co, Ba, Zn and Sn, moderate enrichment in K20, CaO, Fe, U, V, Mg, Rb, Ni, Pb, and La (Figure 21d). Na2O and Cs are strongly depleted while REEs and most other metals show moderate depletions or remain immobile. During this alteration, the ignimbrite shows both mass and volume decreases of −3.6% and −1.7%, respectively. The volume decrease is particularly important for the host rocks maintaining their permeability during hydrothermal fluid migration and helps explain why such extensive and pervasive potassic alteration can occur in IOCG systems. In the transition from ignimbrite to mineralized diatreme breccia (Figure 21e) very high enrichments occur for Cu, Co, F, Cl, CaO, U, and Fe, with high to moderate enrichment of Zn, Pb, Ce, Nd, Pr, Eu, Gd, Mn, K2O, P2O5, W, V, and Ba. Strong to moderate depletions occur for Na2O, Cs, and Ta. Other elements are preserved or slightly enriched. High increases in both total mass and volume, of 84% and 54%, respectively, occurred during the mineralizing event, consistent with abundant hydrothermal matrix in the diatreme. The high-volume increase requires that some type of tectonic and/or hydrothermal fracturing and brecciation must occur in order to maintain permeability in the system and provide space for mineral deposition. This is consistent with the dynamic and even explosive nature of diatreme breccias.

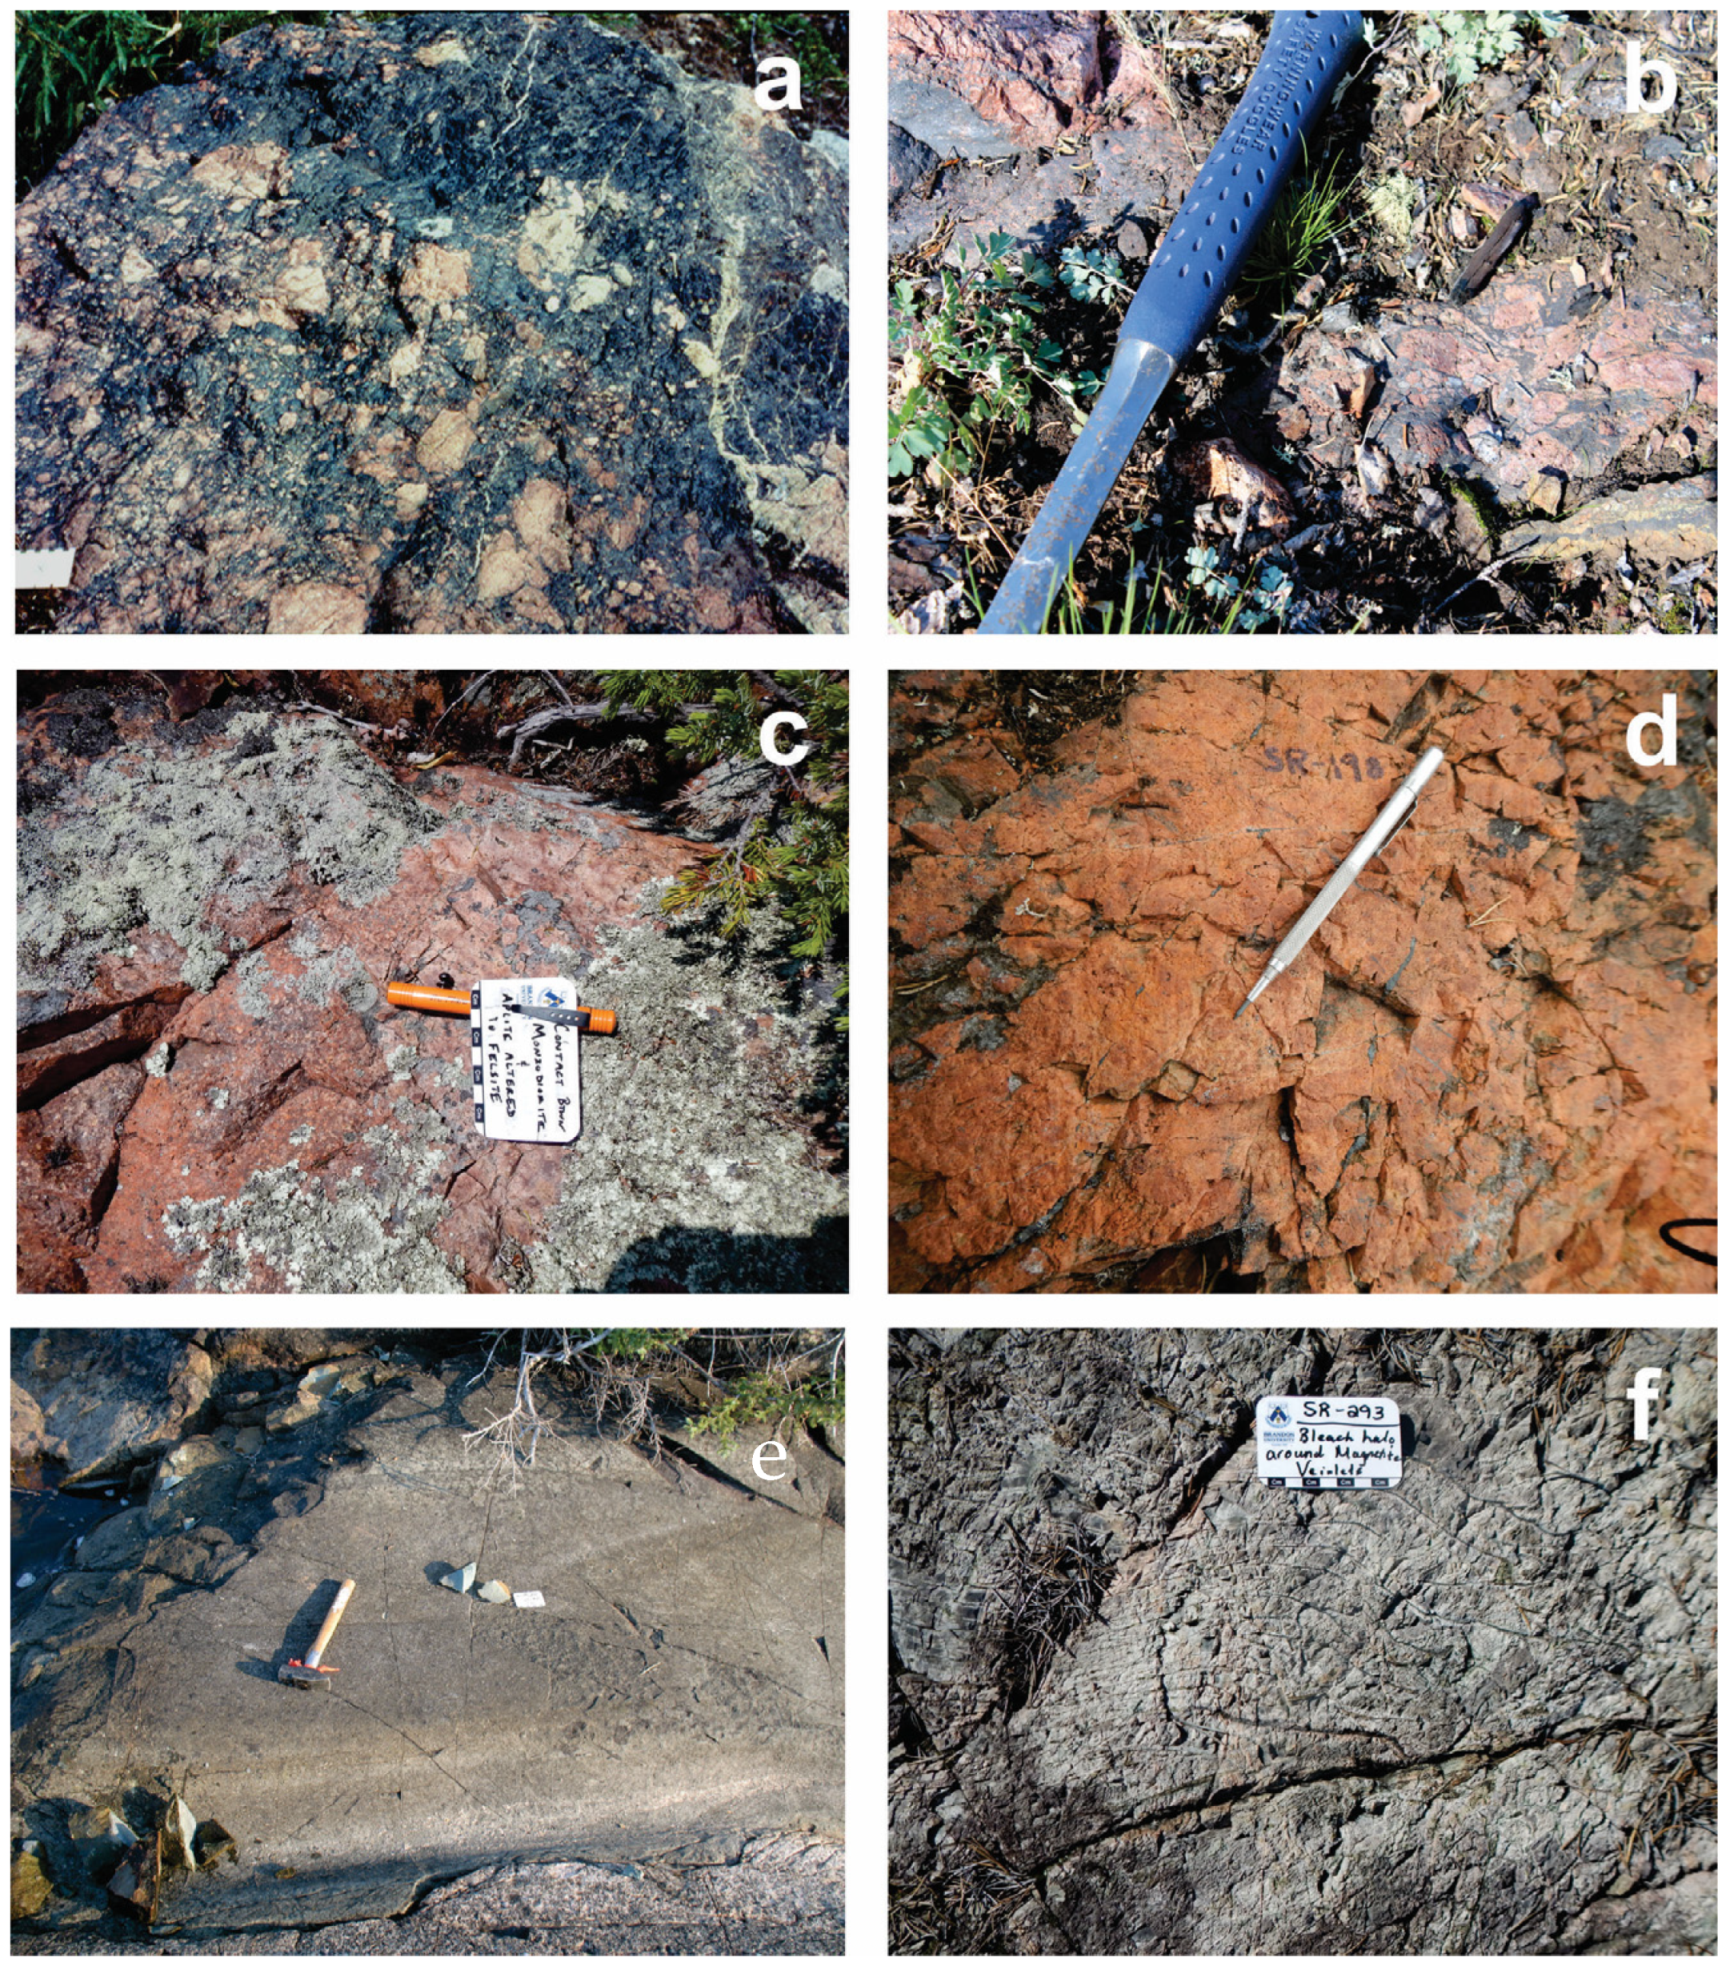
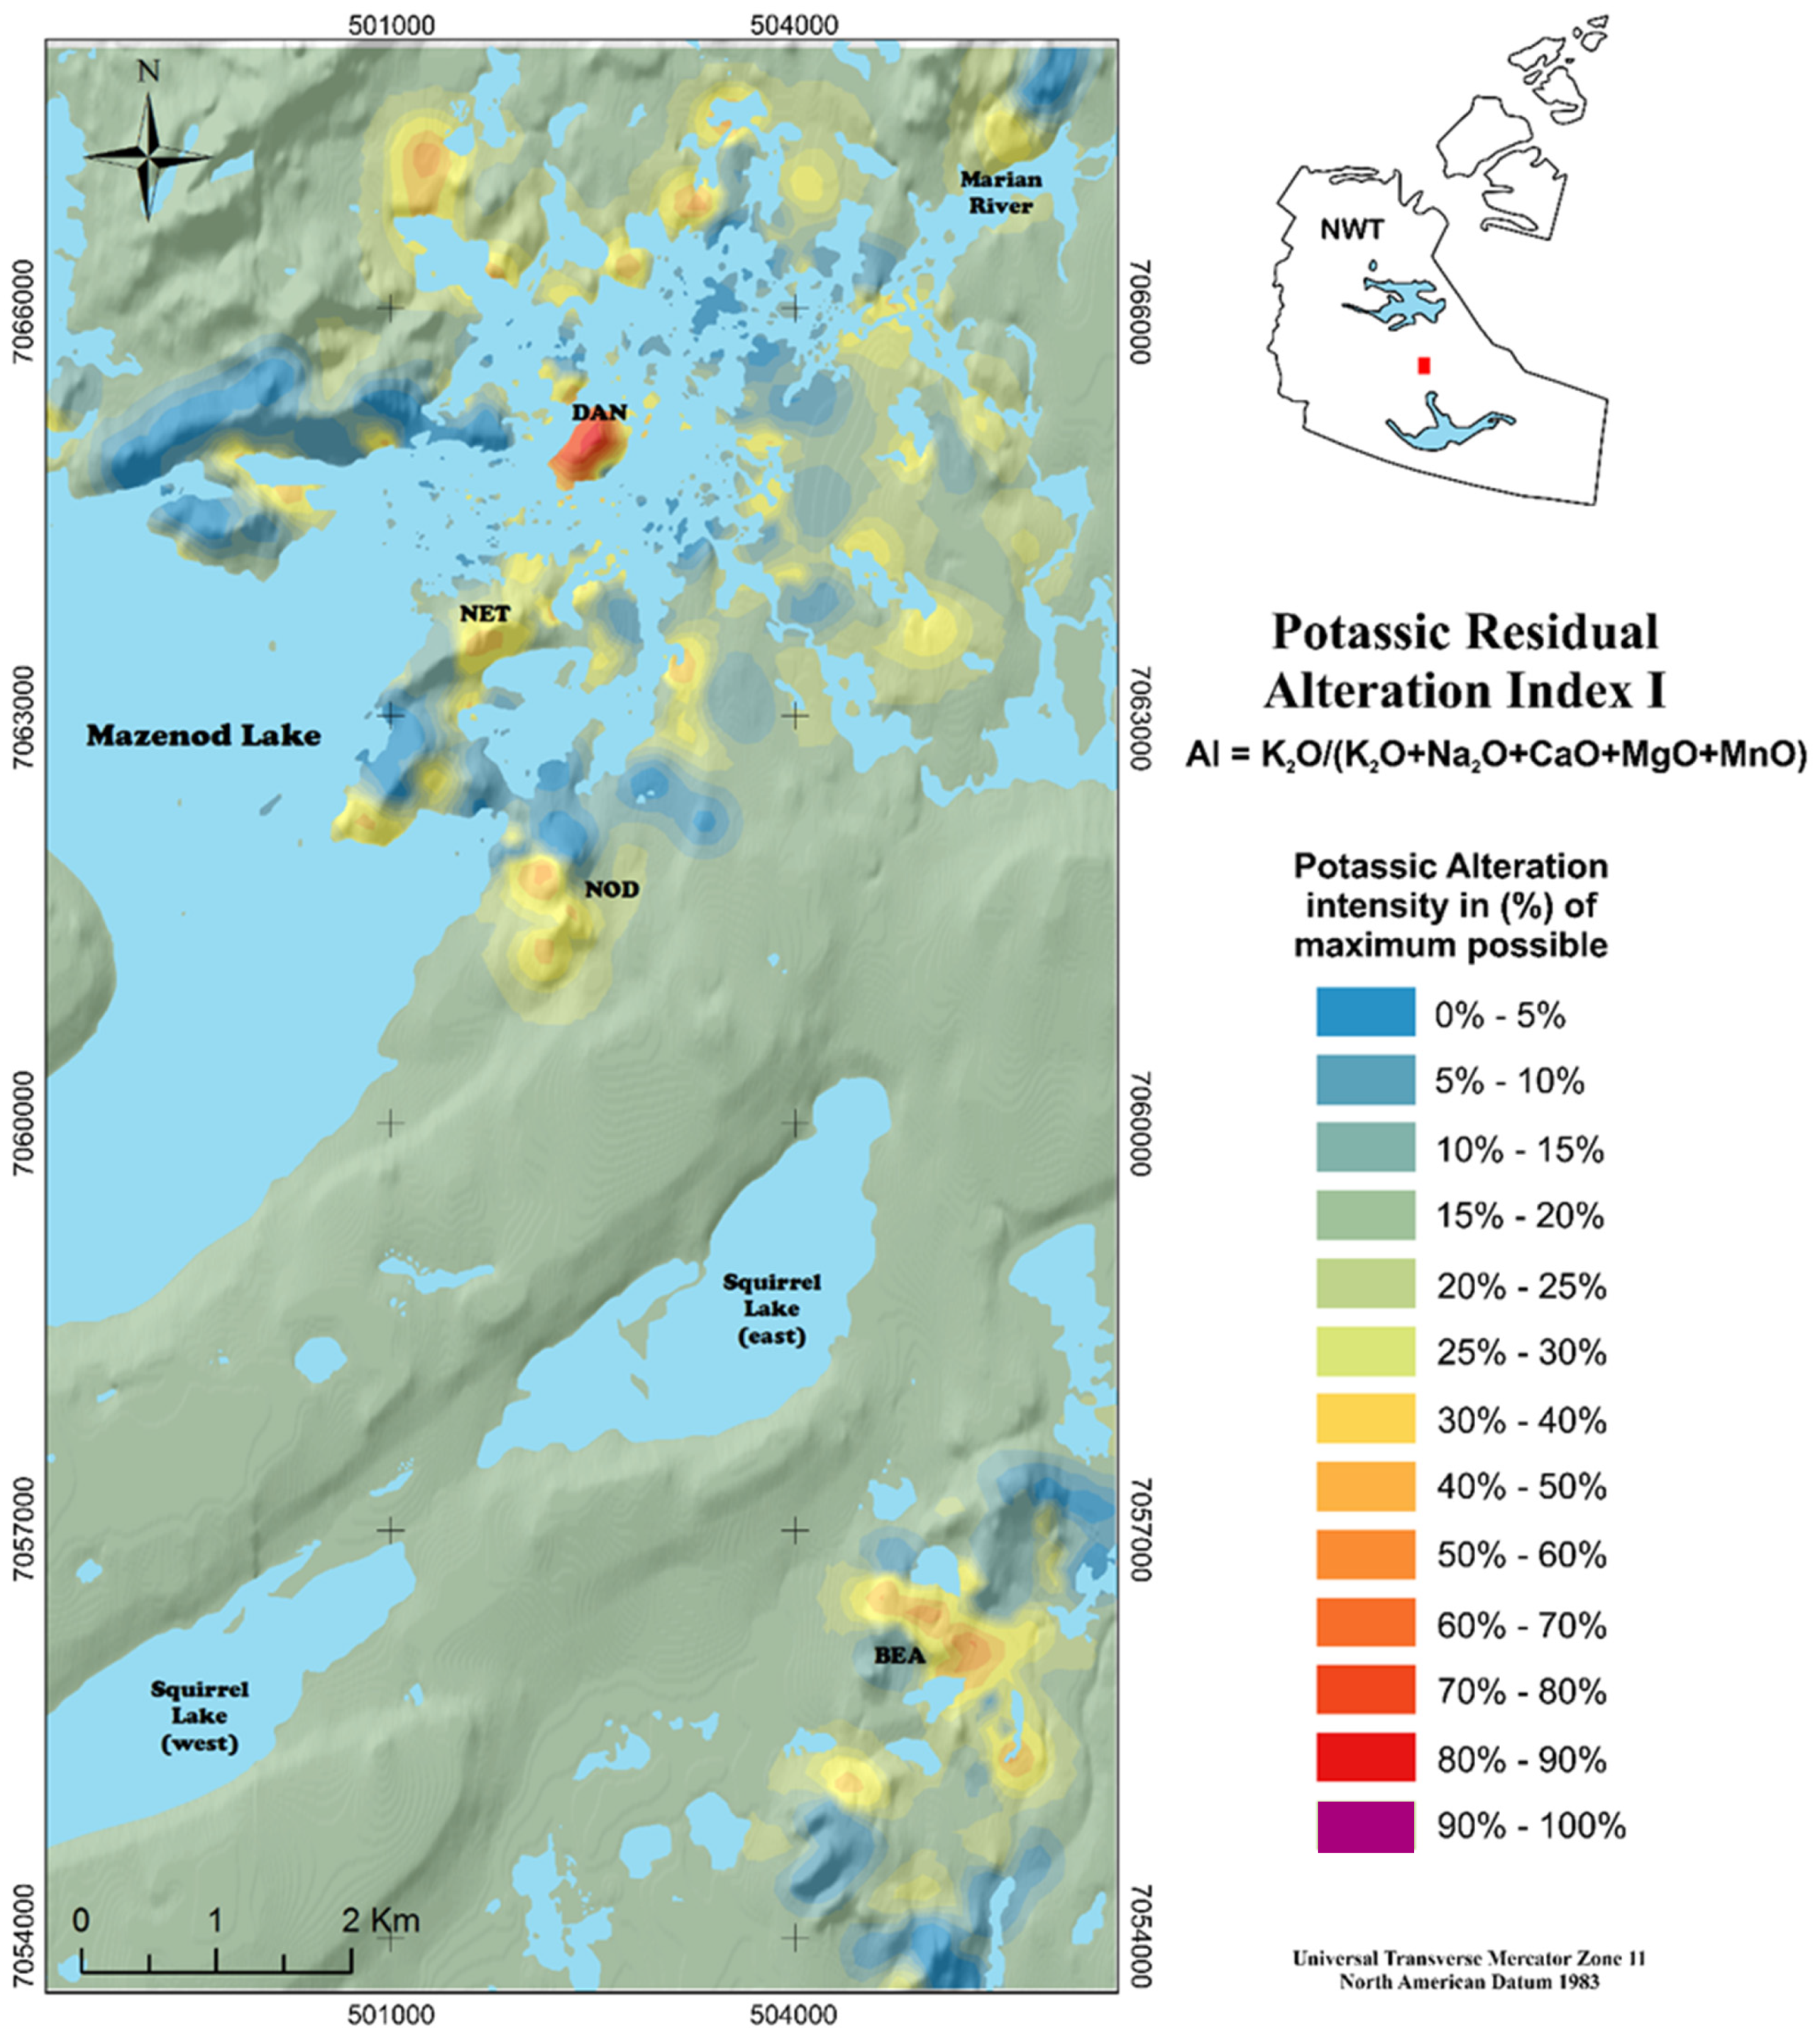
4.3. Potassic Alteration

Potassic alteration (hydrothermal K–feldspar ± biotite ± sericite) is ubiquitous throughout the Mazenod Lake region as veins, stockwork, and pervasive recrystallization of country rock (Figure 16 and Figure 17). It occurs mostly as an alteration of plagioclase and/or recrystallization of microcline/orthoclase, but also from other minerals during intense alteration. Intensity varies from widespread incipient alteration to conversion of host rocks to felsite (Figure 10b). The color of the fresh surface of K-altered rocks varies from pinkish to orangey-brown or bright orange to a reddish-brown hue in response to intensity, texture, style of alteration, and presence of hematite. K–feldspar can be found in association with all other types of alteration in the region, sometimes co-precipitating, but more often either preceding or overprinting them. However, paragenetic evidence from cross-cutting and overprinting features indicates that pervasive K–feldspar alteration precedes many other types of alteration in the Mazenod district (Figure 9e,f, Figure 10b, Figure 11d, Figure 12c,d and Figure 13f), with the exception of distal and low-temperature retrograde effects, or during prograding alteration where it may overprint other assemblages including some of the phyllic and propylitic alterations.
Felsite due to intense alteration is located around and within the Sue–Dianne deposit (Figure 8, Figure 9, Figure 22 and Figure 23), and locally north of the Dianne Lake fault especially in proximity to the Kemaz structural corridor (not included in the RAI plots). Southeast of the Sue–Dianne deposit, potassically altered rhyodacites are found in narrow belts proximal to the Marion River batholith and are separated from it by thin sequences of Treasure Lake hornfelsed sedimentary rocks. Residual alteration index (RAI) plots of both the potassic and alkali indices show two additional areas of potassic alteration (Figure 16 and Figure 17). It intensifies along the east arm of Mazenod Lake within the Kemaz fault corridor centered on Dan Island, and in the central Bea Lake area. Most of Dan Island is strongly potassically altered with the greatest intensity (felsites) at the top of the hill and near the Kemaz fault where geochemical analyses returned values up to 12.8 wt% K2O, which is comparable to ~75 to 80 wt% K–feldspar in the rock [25].

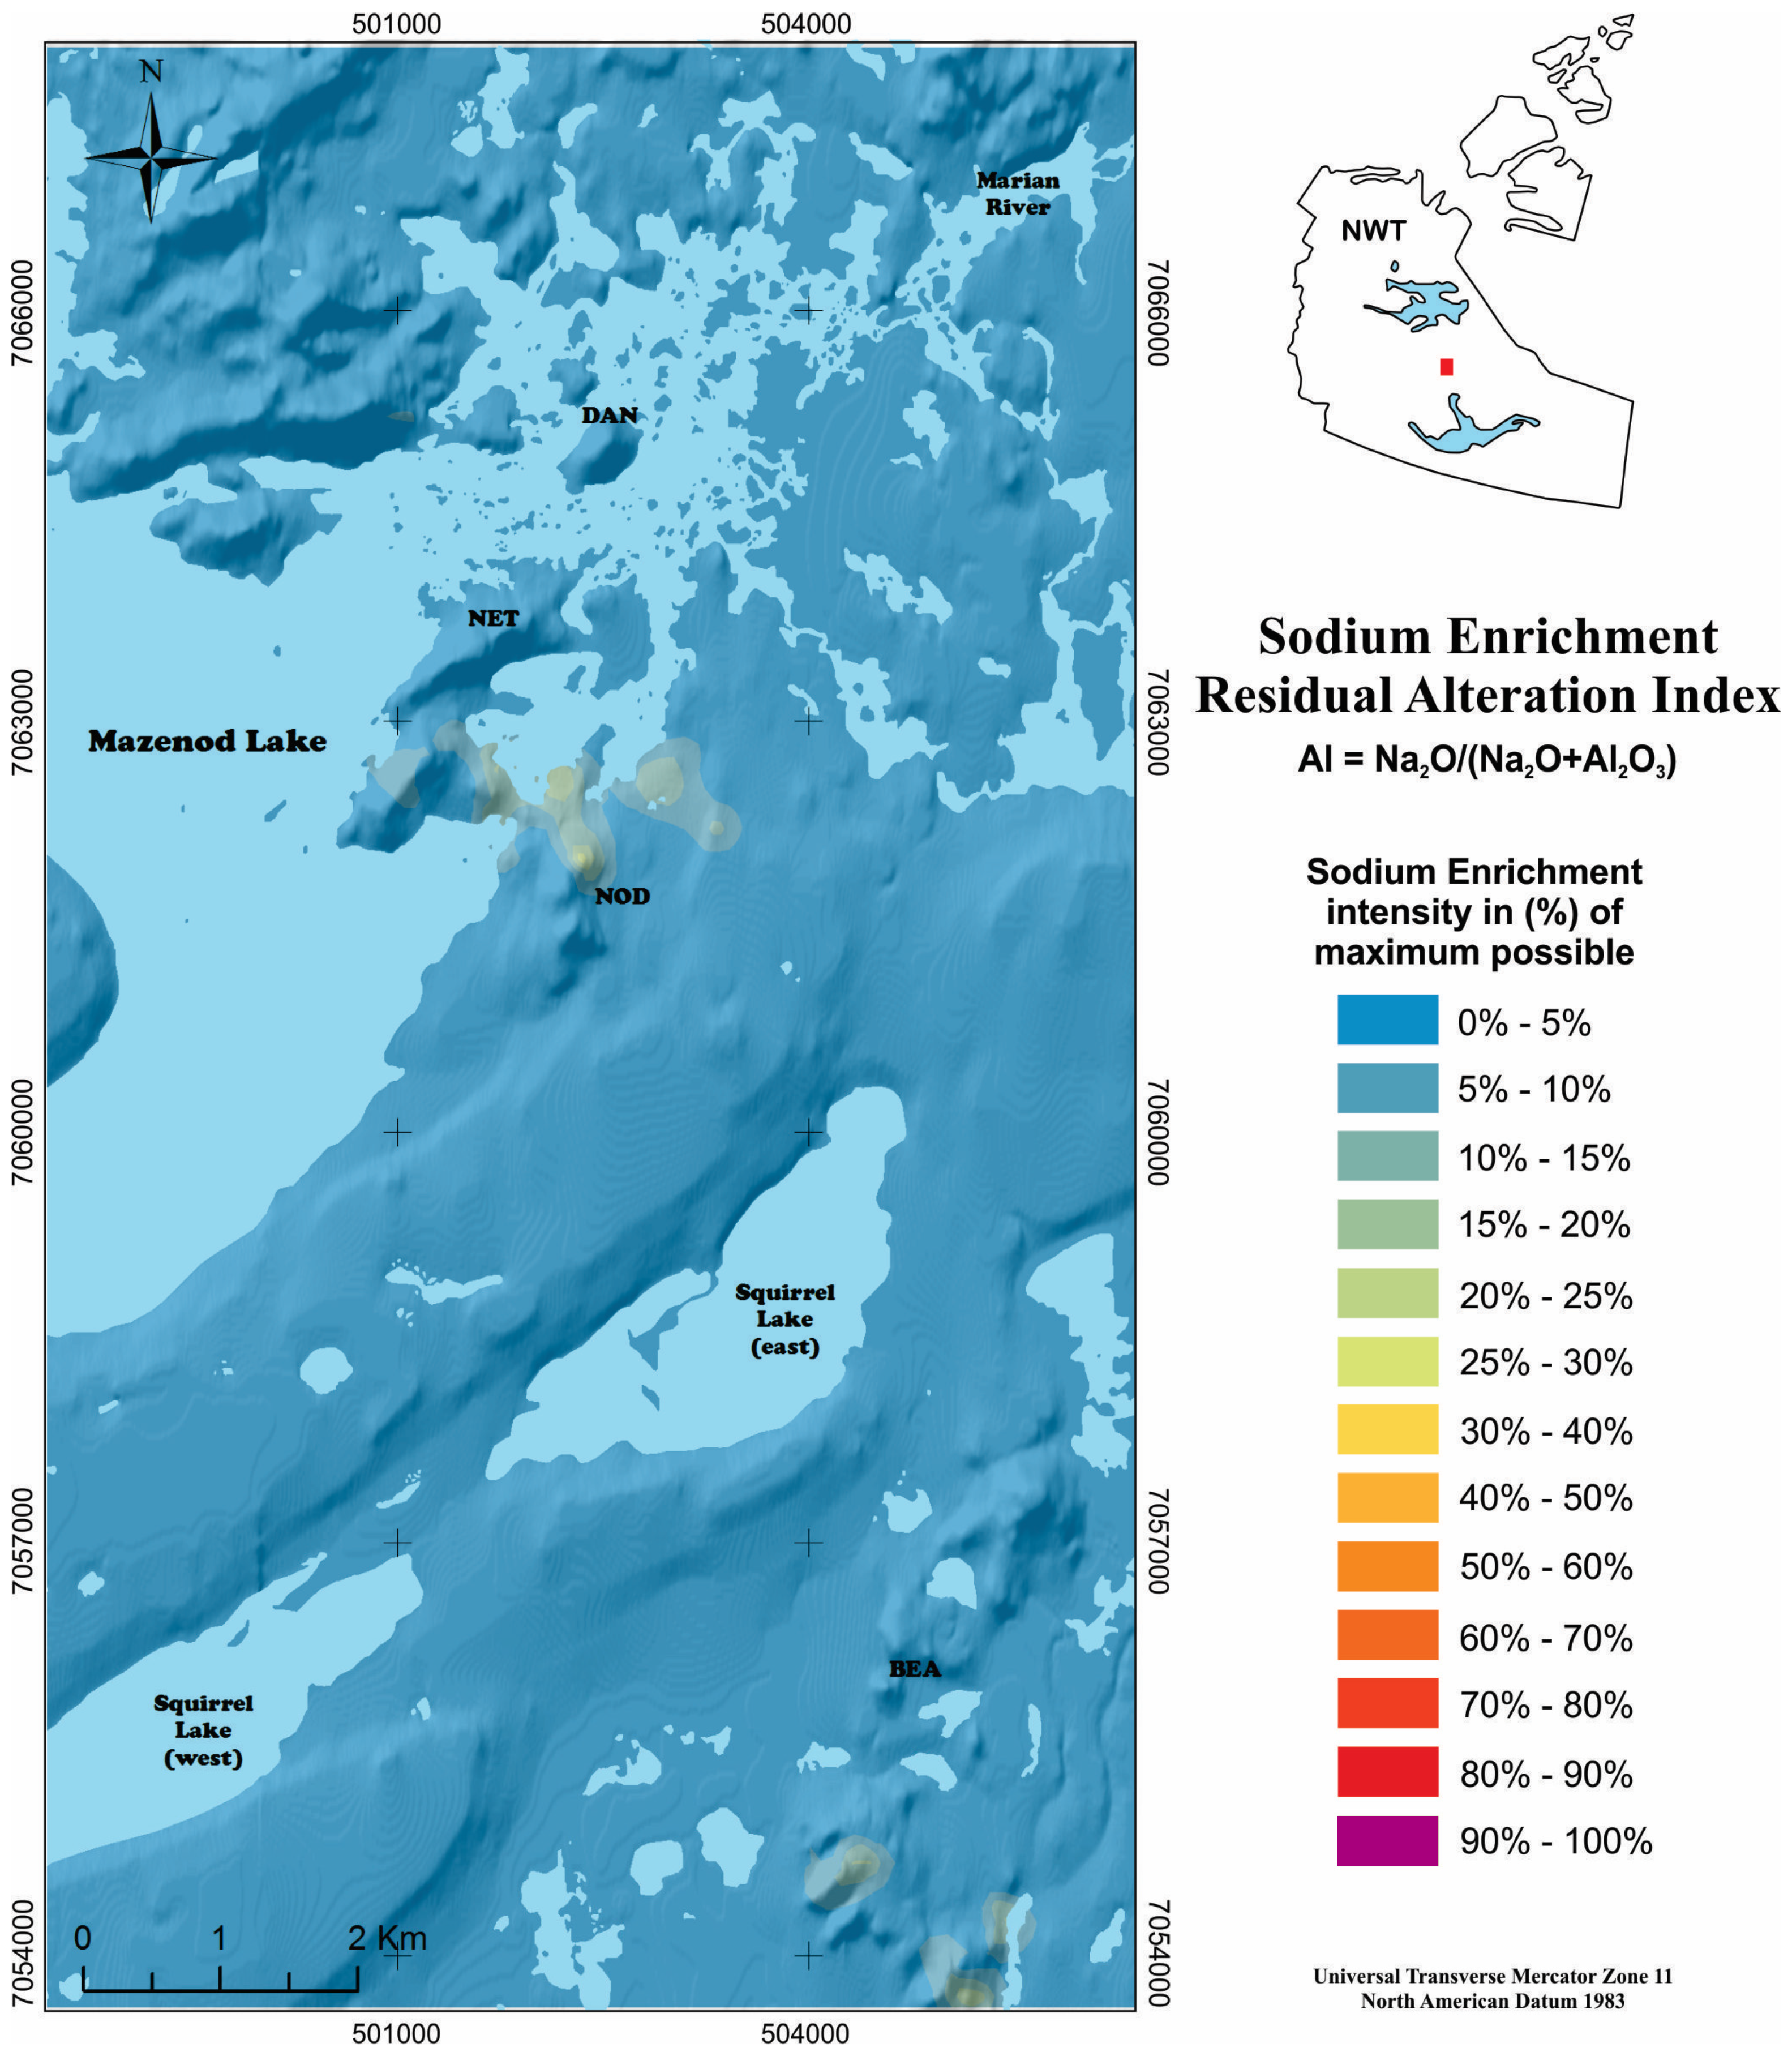
4.4. Sodic Alteration

Sodic alteration in the form of albite is not well exposed nor obvious in the Mazenod region and remains somewhat cryptic to field observation due to the abundance of primary plagioclase in the volcanic host rocks. Nevertheless, the RAI plot of the sodic alteration index reveals a weak to moderate sodic enrichment from the north end of Nod Hill to the south shore of Mazenod Lake, including the PD skarn area, and also locally in the Bea area (Figure 18). The RAI plots indicate an antithetic relationship between sodium and potassium enrichment, with high sodium found only in areas with no or minimal potassium enrichment. Sodic alteration is evident also in the porphyritic intrusion immediately below the Sue–Dianne deposit. Here, albitized porphyry at depth transitions upward to potassically altered porphyry felsite, and then to mineralized rhyodacite ignimbrite felsite breccia (Figure 8c,d and Figure 23).

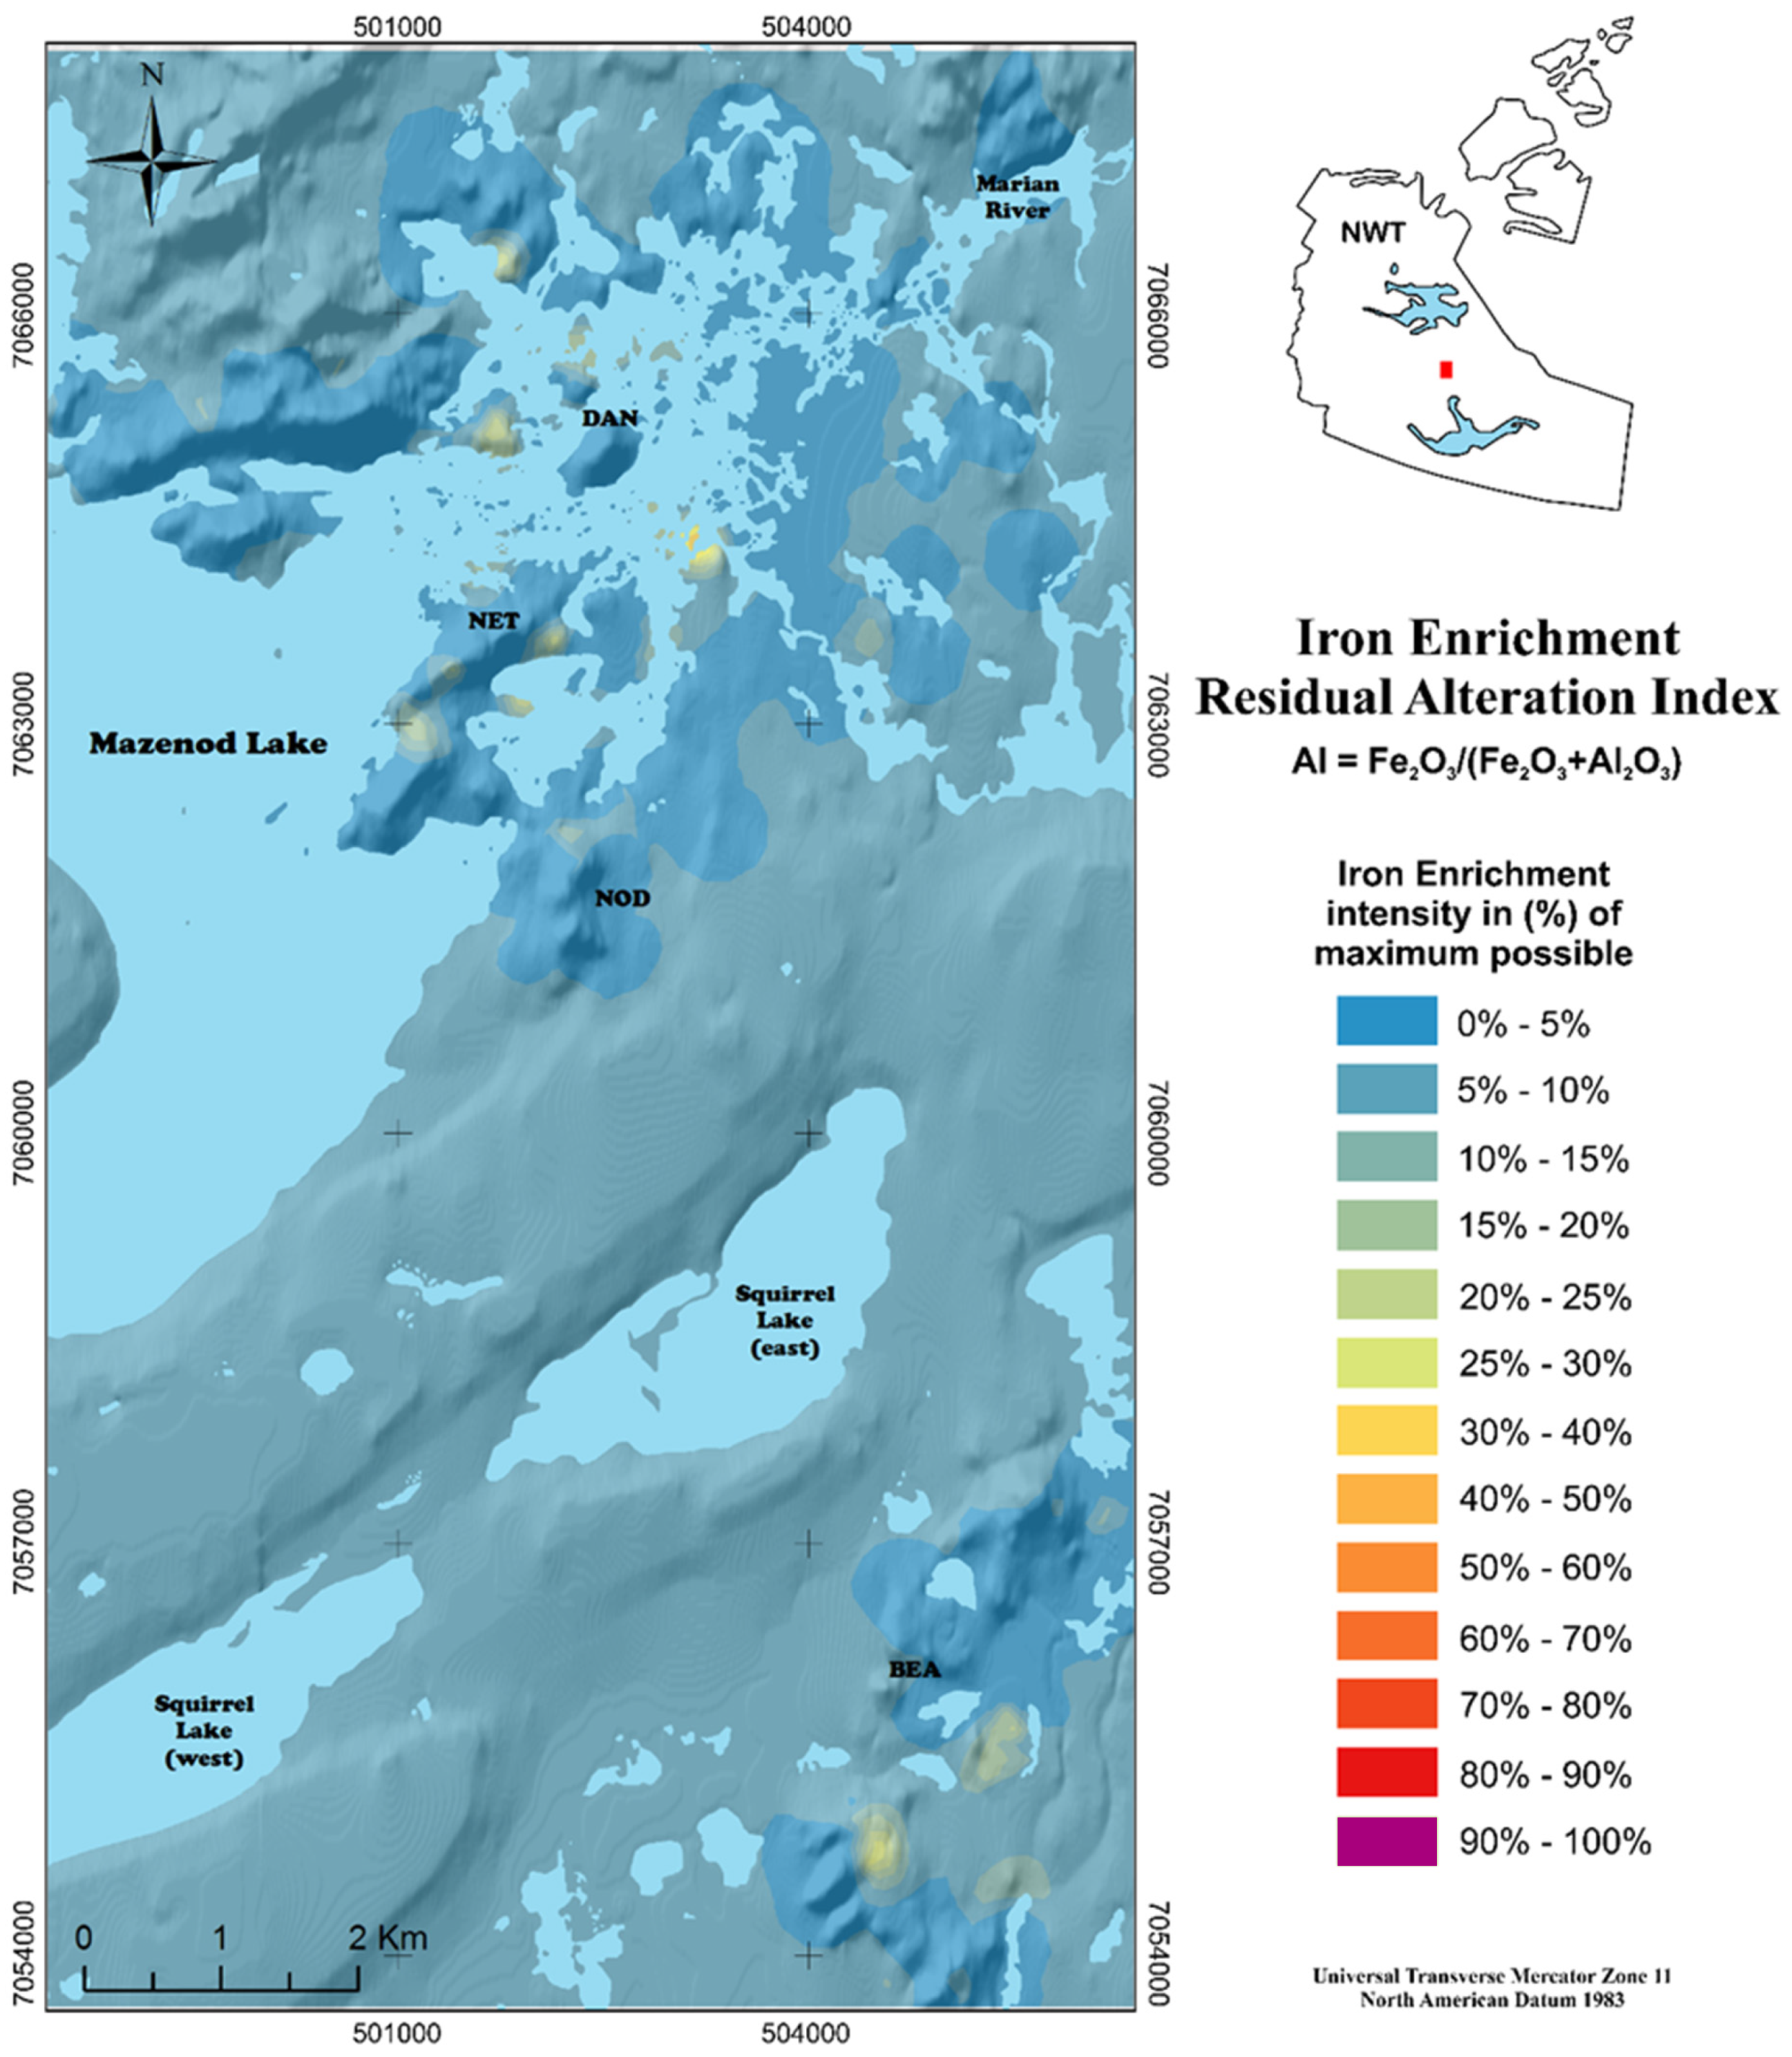
4.5. Magnetite and Magnetite–Actinolite

Hydrothermal magnetite ± actinolite ± garnet ± epidote ± fluorite ± hematite ± chlorite alteration occurs in several different mineralogical combinations and textural forms in localized areas throughout the Mazenod Lake region (Figure 9e,f, Figure 10c–e and Figure 12a,b,f). Minor magnetite as veinlets or breccia cement commonly overprints potassic and sodic alteration, whereas intense magnetite alteration is often overprinted by later retrograde epidote and quartz veinlets and disseminations. Magnetite is found associated with veinlets of fine-grained dark green actinolite in the central Mazenod and Bea areas (Figure 19), where it locally intensifies to more widespread veining and stock works of megacrystic actinolite with or without magnetite. The best example of this occurs at the north end of Nod Hill, where veins and stockwork of actinolite ± magnetite ± quartz replace and cross-cut altered rhyodacite (or altered andesite) host rocks. The most extreme cases of magnetite-actinolite alteration are breccias, where megacrysts of actinolite ± magnetite ± quartz are found cementing fractured sodic-altered host rock (Figure 10c,d). Locally, magnetite may be associated with minor amounts of pyrite ± chalcopyrite ± pyrrhotite as disseminations, fine veinlets, and subhedral clots.
Hydrothermal magnetite is an important component of the Sue–Dianne Cu-Ag-Au deposit. It occurs in abundance (up to ~50%) in the deepest parts of the deposit as barren magnetite and in the central mineralized section as one component of the matrix cement to the hydrothermal breccia (Figure 9e,f). In the central part of the diatreme, it is associated with chalcopyrite and other sulphides [22,56,80]. Other significant magnetite deposits include the Mar Breccia along the Kemaz fault north of Dianne Lake, where martite (massive magnetite with disseminated specular hematite; up to ~90% Fe oxide) cements a polymictic hydrothermal breccia (Figure 12a). Hydrothermal magnetite also occurs northeast of Nod Hill and south of Mazenod Lake in a skarn-like assemblage (Figure 10e, discussed below).
Aside from local areas of magnetite and/or hematite enrichment, the RAI plot of the Fe index indicates moderate overall iron enrichment in the central Mazenod Lake area and in the central Bea Lake area (Figure 19). The RAI plot does not distinguish whether the Fe enrichment occurs as hydrothermal Fe oxides, or as Fe-rich silicates, sulphides, or carbonate minerals, all of which may be present locally. Further, hydrothermal magnetite and/or hematite or other Fe-bearing minerals may be present in significant amounts without being detected by the RAI plot. For example, significant hydrothermal magnetite and/or hematite may be present in a rock due to hydrothermal recrystallization without Fe enrichment due to the presence of Fe as a component of the original rock composition. In this case, the RAI may remain at zero for the iron index while showing intense potassic or other alteration. For example, an andesite could have as much as ~6 to 10 wt% hydrothermal magnetite or hematite without any hydrothermal iron enrichment taking place. Iron in the primary host rock can account for the hematite present in felsite which gives it the typical brick orangey to reddish-brown color.

4.6. Hematite Alteration

Hematite alteration occurs locally throughout the Mazenod region in any rock type as massive replacements, fracture/vein fill, and/or as disseminated specularite (Figure 8a, Figure 9c–e and Figure 12d). Significant occurrences include stockwork veining at Dan Island where it transitions to tourmaline-cemented breccia, and at Nod Hill and other localized areas. It is common in minor to trace amounts as microscopic pervasive disseminations associated with potassic alteration, imparting a brick red to orange-brown color to potassically altered rocks. Hematite can also be found in association with quartz veining, including at Sue–Dianne, and locally within the Crystal Mountain and Mazenod giant quartz veins systems. Jasper occurs locally as small veins.
Hematite is a major component of the Sue–Dianne deposit, comprising the most important hydrothermal cement in the upper part of the hydrothermal-structural breccia complex (Figure 22 and Figure 23). It occurs as a transition from magnetite found in the deeper parts of the system to hematite in the upper, cooler and more oxidized section [10,34,35,71,77]. Within the deposit, it is host to bornite, chalcocite, and covellite with minor silver and gold, and U only occurs in the most distal hematitic breccias as pitchblende (Figure 9c–e).

4.7. Tourmaline Alteration

Tourmaline typically occurs as black sooty mm to cm scale veins and veinlets, with a few local examples of thicker brecciated bands. The alteration is found locally throughout the study region in all types of rocks but is more widespread in the Bea area where it sometimes occurs in association with pyrite and lesser chalcopyrite as minor clots and disseminations. The two most prominent occurrences are: (1) a tourmaline crackle breccia at the northeast end of Dan Island within alkali altered rhyodacite ignimbrite (Figure 11e,f), where it transitions northwestward to a stockwork of hematite infilled veins that are most evident along the northwest slope of Dan Island, and (2) as part of a quartz-tourmaline fracture cement along a northwest-trending shear structure north of the Dianne Lake fault, where it occurs in association with pyrite, chalcopyrite and other sulphide minerals. Tourmaline also occurs as breccia cement in a small zone northeast of the Sue–Dianne deposit along the shore line of Dianne Lake within the greater intersection of the Dianne Lake and Kemaz fault corridors. Tourmaline, whose veins are often monomineralic, but also co-precipitate with quartz, hematite, magnetite, and/or sulphides, is generally preceded by potassic alteration, and may be cut by later epidote and/or quartz. Several examples of quartz-tourmaline hematite and quartz-tourmaline magnetite vein breccias occur in the Bea area.

4.8. Phyllic Alteration

Phyllic alteration (sericite ± quartz ± pyrite) occurs locally throughout the Mazenod Lake region, typically as a more distal transition from potassic (K–feldspar) altered rocks to sericite-rich rocks. It can occur as both an early prograding stage of alteration, or as a later overprinting phase (retrograde). Quartz and sericite often occur together, but typically the alteration is devoid of notable sulphides, which contrasts with phyllic alteration in porphyry copper systems, or the Echo Bay district of the NWT, where it typically contains abundant pyrite. It often occurs at considerable distances of 100 s of meters to greater than 1 km from source intrusions [4,5,6,18,81]. Phyllic alteration is fairly widespread north (and east) of the Sue–Dianne deposit as well as north of and within the Dianne Lake fault corridor. Phyllic alteration is often cryptic. Petrography from both intrusive and volcanic rocks show that microscopic sericite ± quartz is widespread as a pseudomorphic replacement of groundmass and feldspar phenocrysts. This includes the Sarah Granite immediately northwest of Mazenod Ridge which has abundant deep orange to reddish apparently euhedral feldspar phenocrysts. However, these feldspars are largely pseudomorphed by sericite, which is not recognizable to the naked eye (Figure 7a).

4.9. Epidote Alteration

Epidote alteration (epidote ± quartz ± carbonate ± chlorite ± hematite) is widespread in the Mazenod Lake region. It usually occurs as localized mm to cm-scale ‘pistachio’ green veins, stockworks, disseminations and replacement, generally superimposed on other alteration types indicating that it can be a late retrograde or distal phase of the hydrothermal system. However, locally it can be significant and widespread as observed in a stockwork of epidote veining covering 100 s of meters extending up the east flank of Mazenod peak (Figure 3 and Figure 13f). It also occurs locally, along with carbonate, chlorite ± sericite as an early propylitic type alteration. Part of the Dianne Lake fault corridor envelopes the Sue–Dianne deposit, where it forms a quartz and quartz–epidote stockwork and breccia that extends from the highest levels through to the underlying porphyry stock. The deep extent of the stockwork is due to the near surface emplacement of the Sue–Dianne deposit, allowing late retrograde superposition of the epithermal quartz–epidote stockwork onto the deposit and even into the uppermost part of underlying intrusions (Figure 9f and Figure 23). A similar phenomenon occurs at the MAR magnetite breccia (Figure 12a). In the central part of the Sue–Dianne deposit, epidote is an abundant part of the breccia cement as disseminations and fine veinlets (Figure 9e). Some of the unique occurrences of epidote include: (1) enclaves of shattered pegmatoidal feldspar in a chlorite-epidote matrix in the Marion River Batholith near Sue–Diane (Figure 8e,f), (2) replacement of K-altered rocks and veining in a zone of orthogonal faulting on Dan Island, resulting in orbicular K–feldspar-epidote pseudo-clasts (Figure 11d), (3) epidote-cemented crackle breccias, and (4) perhaps the most unique and dramatic exposure of epidote alteration in the region which occurs in a volcaniclastic tuff sequence (VS) south of Mazenod Lake. Here individual layers and orthogonal fractures are selectively replaced to form an orthogonal network of stratabound and crosscutting epidote veins (Figure 13e). The most intense zones of epidote alteration may reflect recapture of Ca that appears to have been fluxed and mobilized from host rocks in higher temperature parts of the system. This is supported by widespread and significant Ca depletion from altered rock as shown in Figure 21a–c and discussed by Richards and Mumin [5,6] for large IOCG systems. Such late epidote-bearing calcic-iron alteration is documented in many settings of the GBMZ, though abundant epidote is not conspicuous or present in many IOCG deposits worldwide. Some of the epidote alteration in the Mazenod district may follow an earlier phase of carbonate alteration, similar to what is observed in the Mile Lake skarn deposit, Echo Bay, NWT (Mumin et al., 2010; Mumin, 2015) [2,4,12,16,19,47,56].

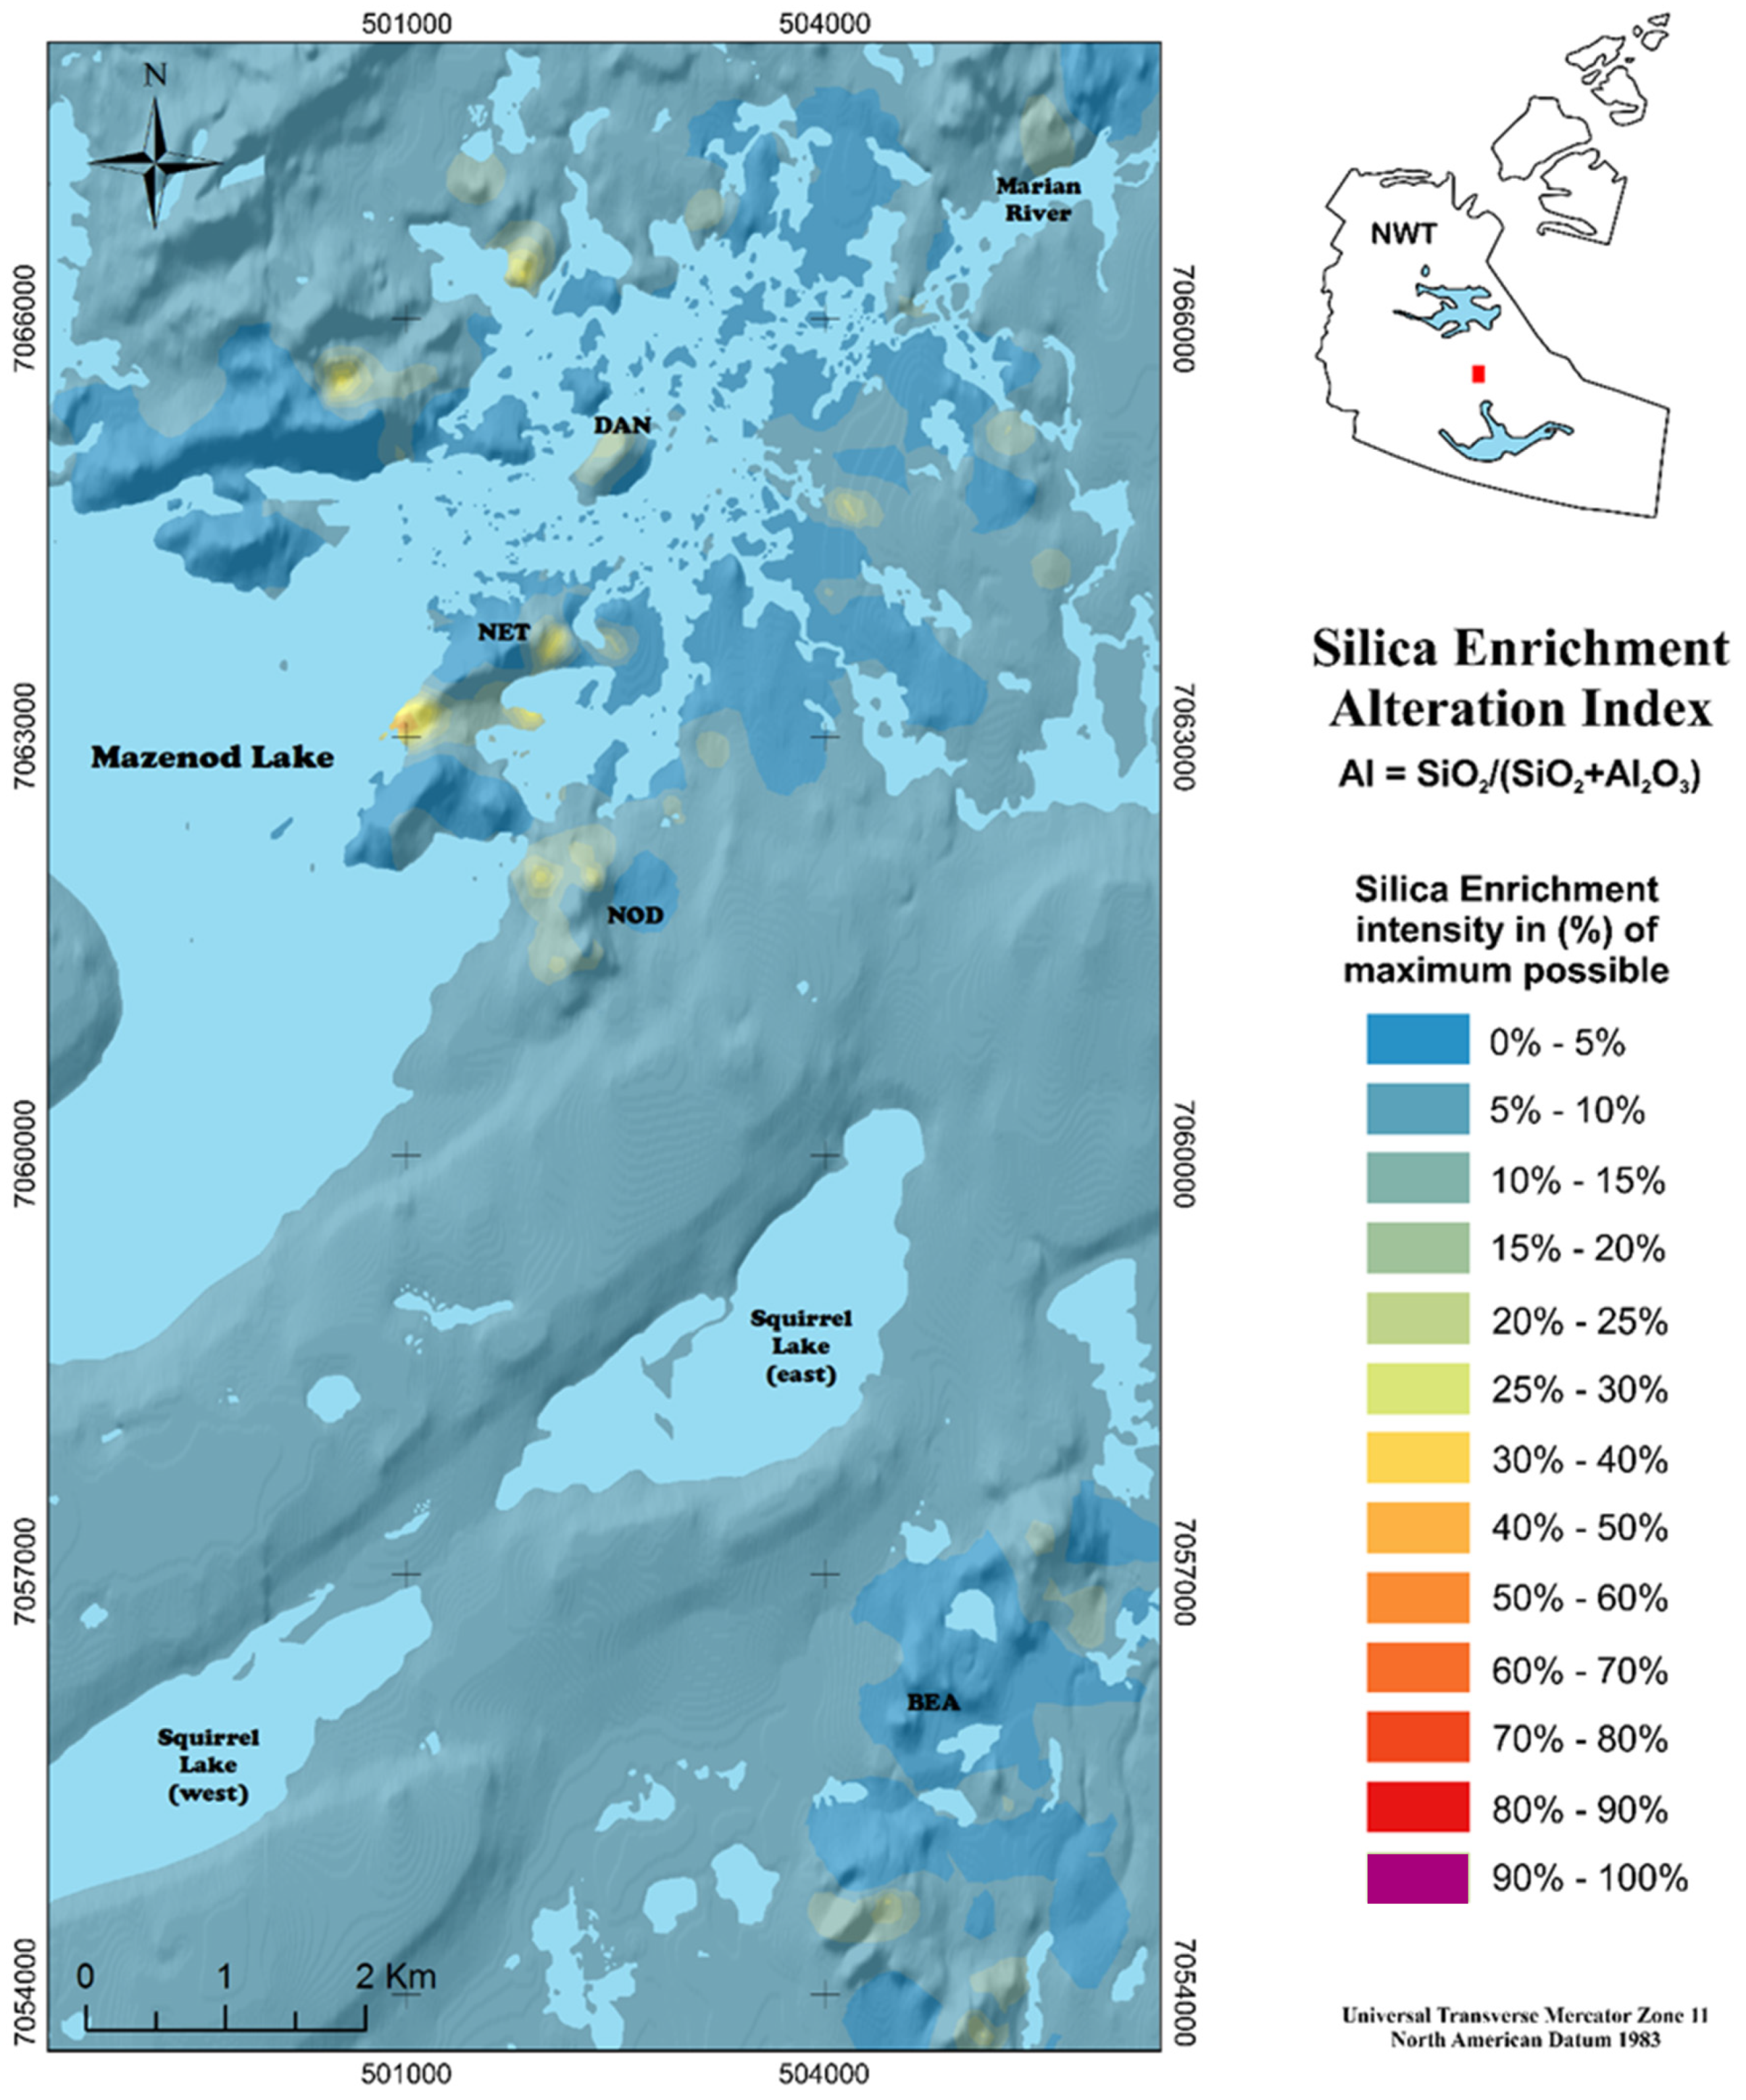
4.10. Silicification

Silicification and formation of giant quartz vein, stockwork and breccia complexes is a widespread and integral part of IOCG systems throughout the Great Bear Magmatic Zone, although the relationship between the giant quartz systems and mineralization has been controversial. Many investigators consider it an integral part of the magmatic–hydrothermal system, as a combination of early low temperature effects, main-stage distal alteration, and late-stage retrograde and protracted low-temperature alteration, as is consistent with current observations in the Mazenod region [2,4,10,11,18,47,48]. However, others have suggested the quartz is mainly a late event, separate from the IOCG magmatic–hydrothermal systems responsible for mineralization. In the Mazenod Lake area, the most prominent silicification is associated with NE-SW oriented transverse faults, including Mazenod Ridge (Kemaz Fault zone), and at Crystal Mountain and the Sue–Dianne deposit along the Sue–Dianne fault corridor (Figure 14). Large parts of the structural corridors are silica flooded to form the giant quartz complexes, comprised mostly of milky white and crystalline quartz as veins, breccia, stockwork, replacement and pervasive silica flooding. Both Crystal Mountain and Mazenod ridge have local evidence of near surface deposition, including brittle, vuggy, and coxcomb (boiling) textures, and at Crystal Mountain vent tubes up to ~1.5 m in diameter are lined with large inward growing quartz crystals (Figure 14c–f). Locally, quartz veining and major quartz complexes occur in association with epidote, hematite, tourmaline, actinolite and pitchblende, and quartz veining may cut any of the other alteration types as a late retrograde phase. Sulphides, hematite, carbonates and pitchblende occur locally in intimate association with giant quartz complexes elsewhere in the GBMZ, including Port Radium, Mariner, Sloan, Ray Rock and many other past mines and showings. Quartz and quartz-carbonate ± hematite vein and breccia complexes may occur with varying combinations of U, Cu, Co, Bi, Ag, Zn and Pb. In the Mazenod district a small pitchblende showing occurs at the southwest end of Mazenod ridge, and the Sue–Dianne deposit is surrounded and affected by quartz ± epidote veining and stockwork (Figure 14d,e, Figure 22 and Figure 23). Spatially, almost all known mineralization in the GBMZ is located within, or proximal to large quartz complexes [2,3,4,18,19,82,83].
The residual alteration index plot for silica enrichment (aluminum assumed immobile) in the analyzed parts of the Mazenod and Bea Lake areas indicates widespread low silica enrichment with localized areas of stronger enrichment (Figure 20). Widespread weak to moderate silica and potassic alteration is generally pseudomorphic and texture preserving, which are the main reasons that significant areas of andesite to appear in the field as rhyolite, rhyodacite or dacite. Consequently, proper identification of the igneous rocks requires chemical discrimination. Samples from the giant quartz complexes are not included in the RAI analyses and plots. The type of pseudomorphic, texture preserving alteration that is documented in the Mazenod district is also documented in the northern GBMZ, where andesite host rocks are widely pseudomorphed by propylitic and/or phyllic alteration [4,18].

4.11. Calcic Alteration

Calcium is generally depleted from regional host rocks of the Mazenod district. This depletion occurs during widespread potassic, sodic, silica and magnetite alterations (Figure 21a–c). Incidents of calcium enrichment are noted to occur only in areas of intense epidote alteration (e.g., Figure 13e,f), and within parts of the central Sue–Dianne deposit where Ca is recaptured as abundant epidote, fluorite and andradite garnet. The evidence in the Mazenod district is that calcium is removed during higher temperature alterations, and recaptured in near surface, moderate to low temperatures alteration zones, including within the mineralized Sue–Diane diatreme. Unlike many IOCG systems globally, carbonate minerals are not abundant in the Mazenod district, suggesting pH remained too low to stabilize or preserve carbonate minerals.

4.12. Skarn

The only example of skarn-like alteration in the Mazenod district is a magnetite-amphibole-garnet-pyroxene-chlorite-K–feldspar-silica rich fractured and brecciated zone encountered in several holes drilled by Moss Xemac and Phelps Dodge in 1997 and 2002 respectively (Figure 10e). It is located south of Mazenod Lake and northeast of Nod Hill (Figure 3). This magnetite skarn is host to minor pyrite and chalcopyrite mineralization, with assays reaching up to 0.95% Cu over 9.4 m (DDH M-97-02). Minor allanite (REE) veining also occurs in the showing. The magnetite skarn occurs within a greater area of fracturing and brecciation with quartz, silicification, epidote, K–feldspar, chlorite, hematite, and pyrite alteration.

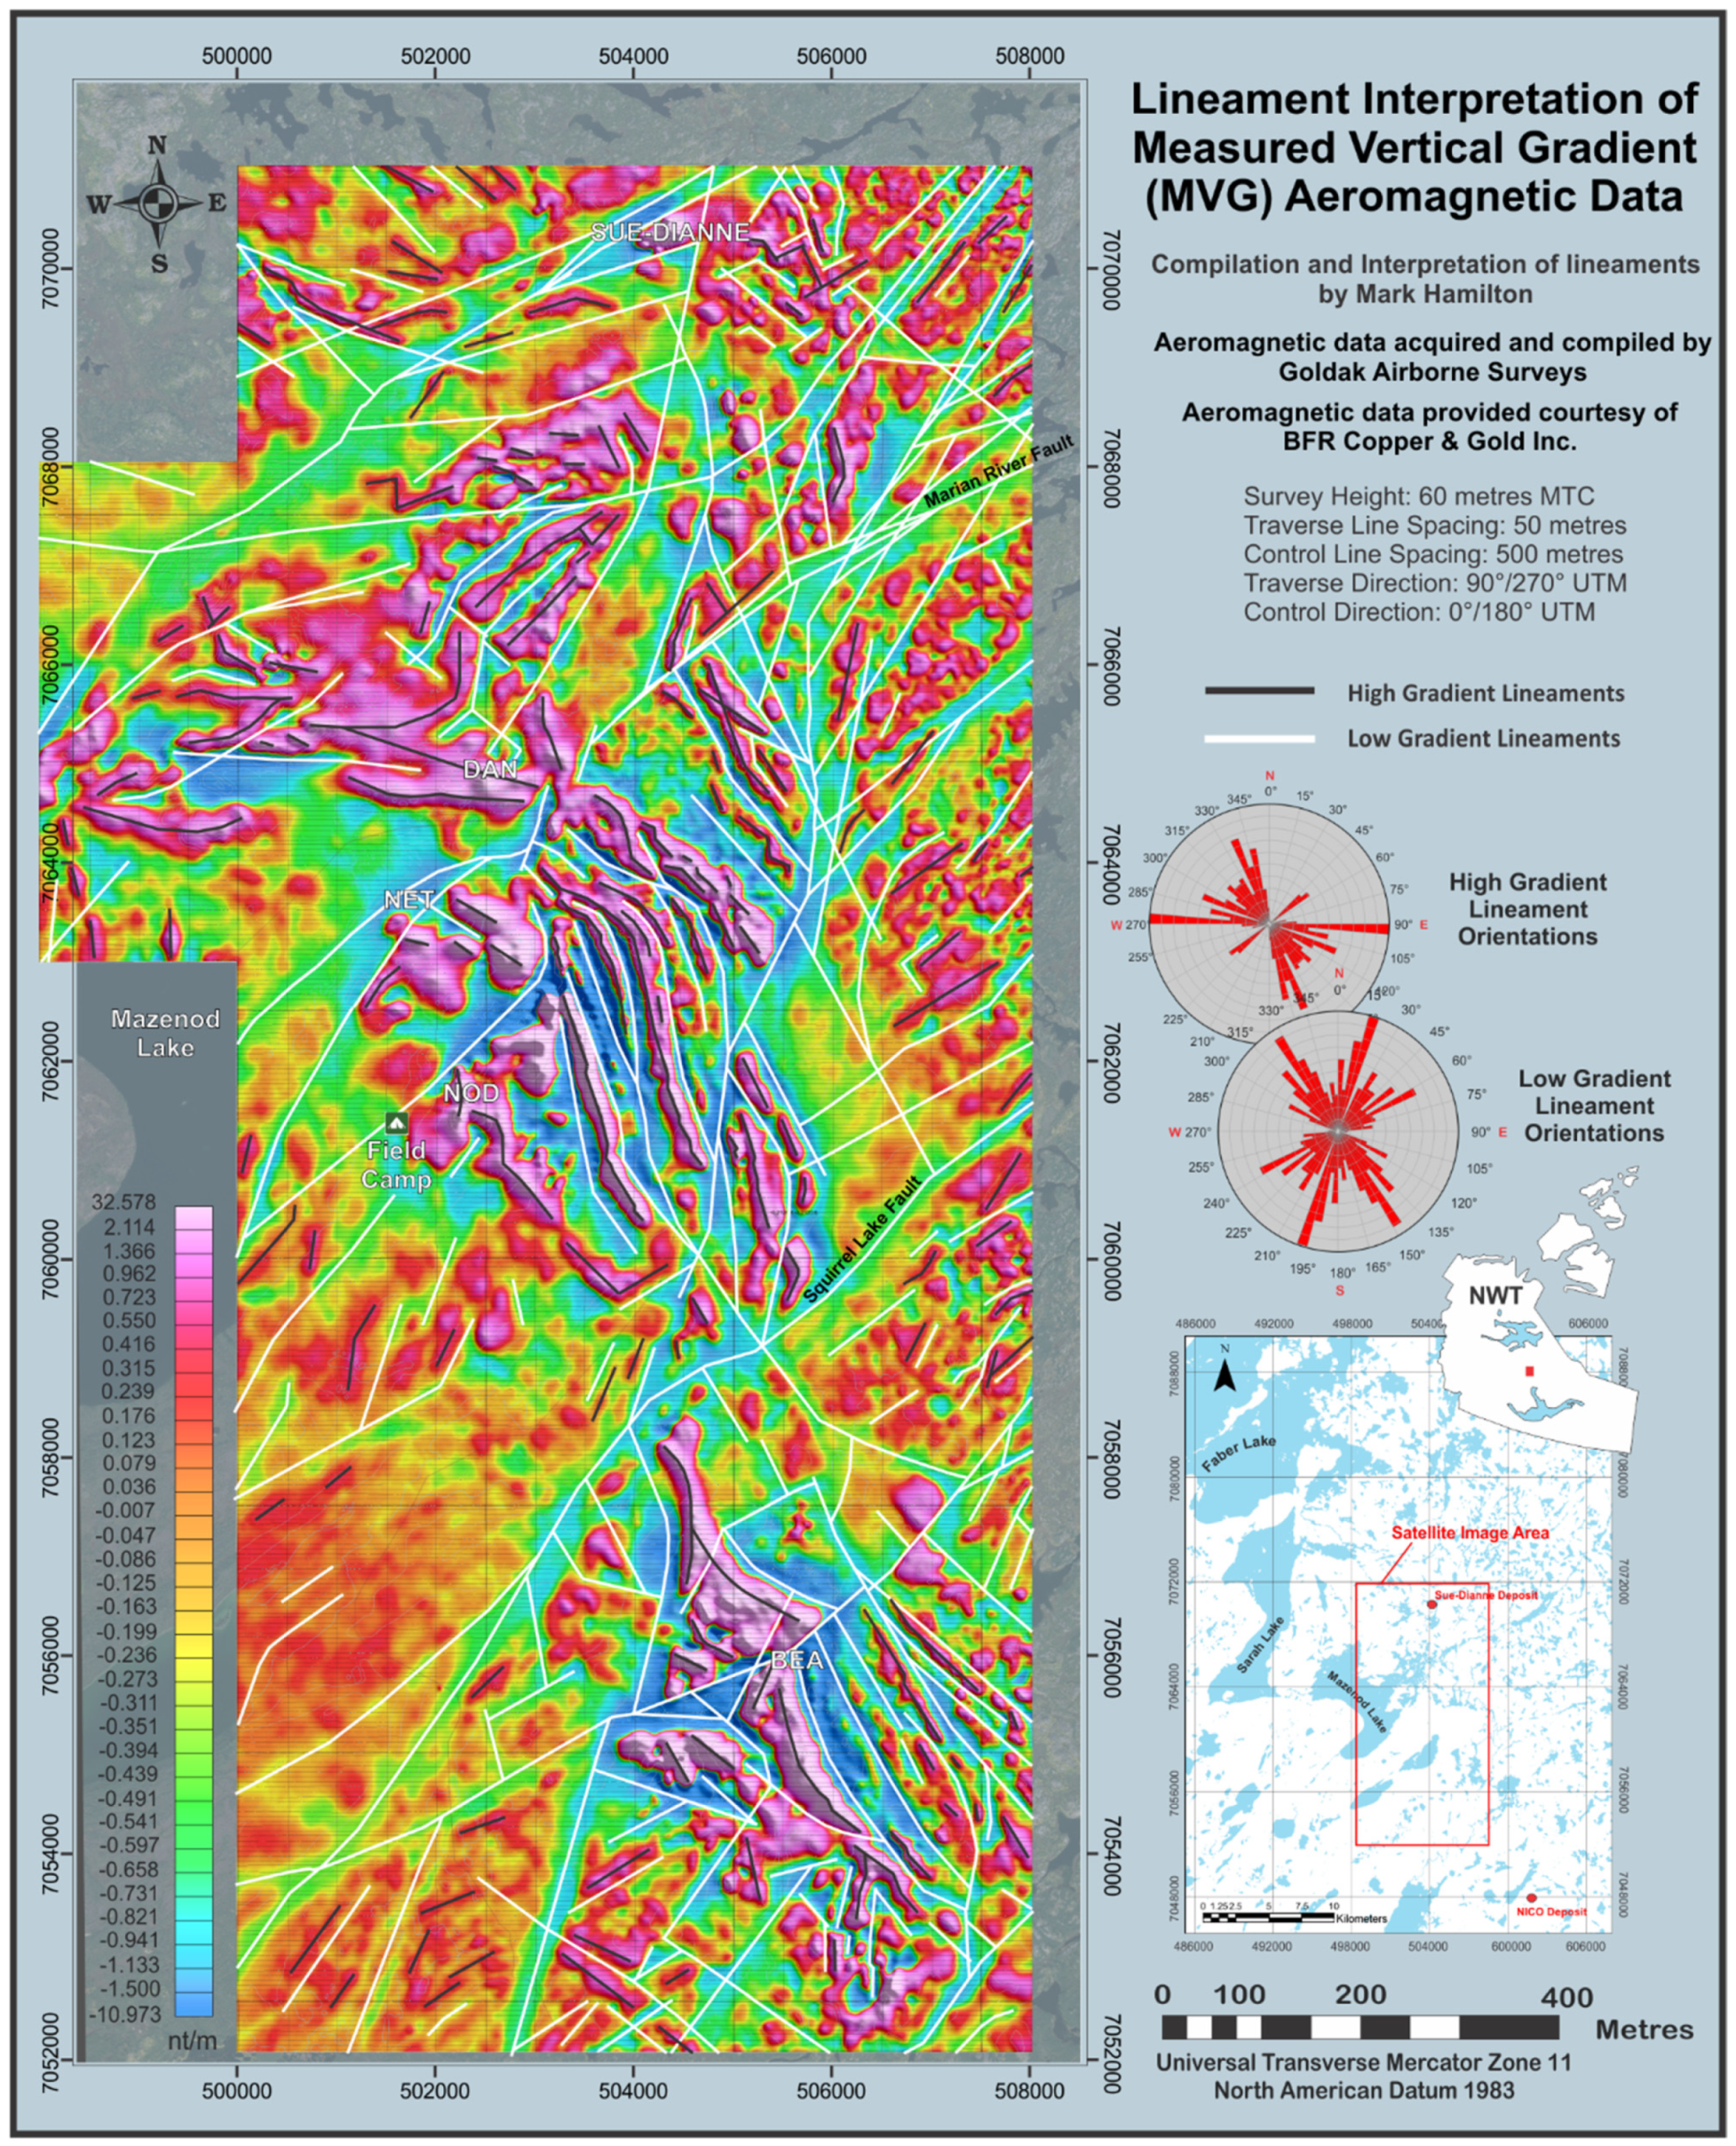
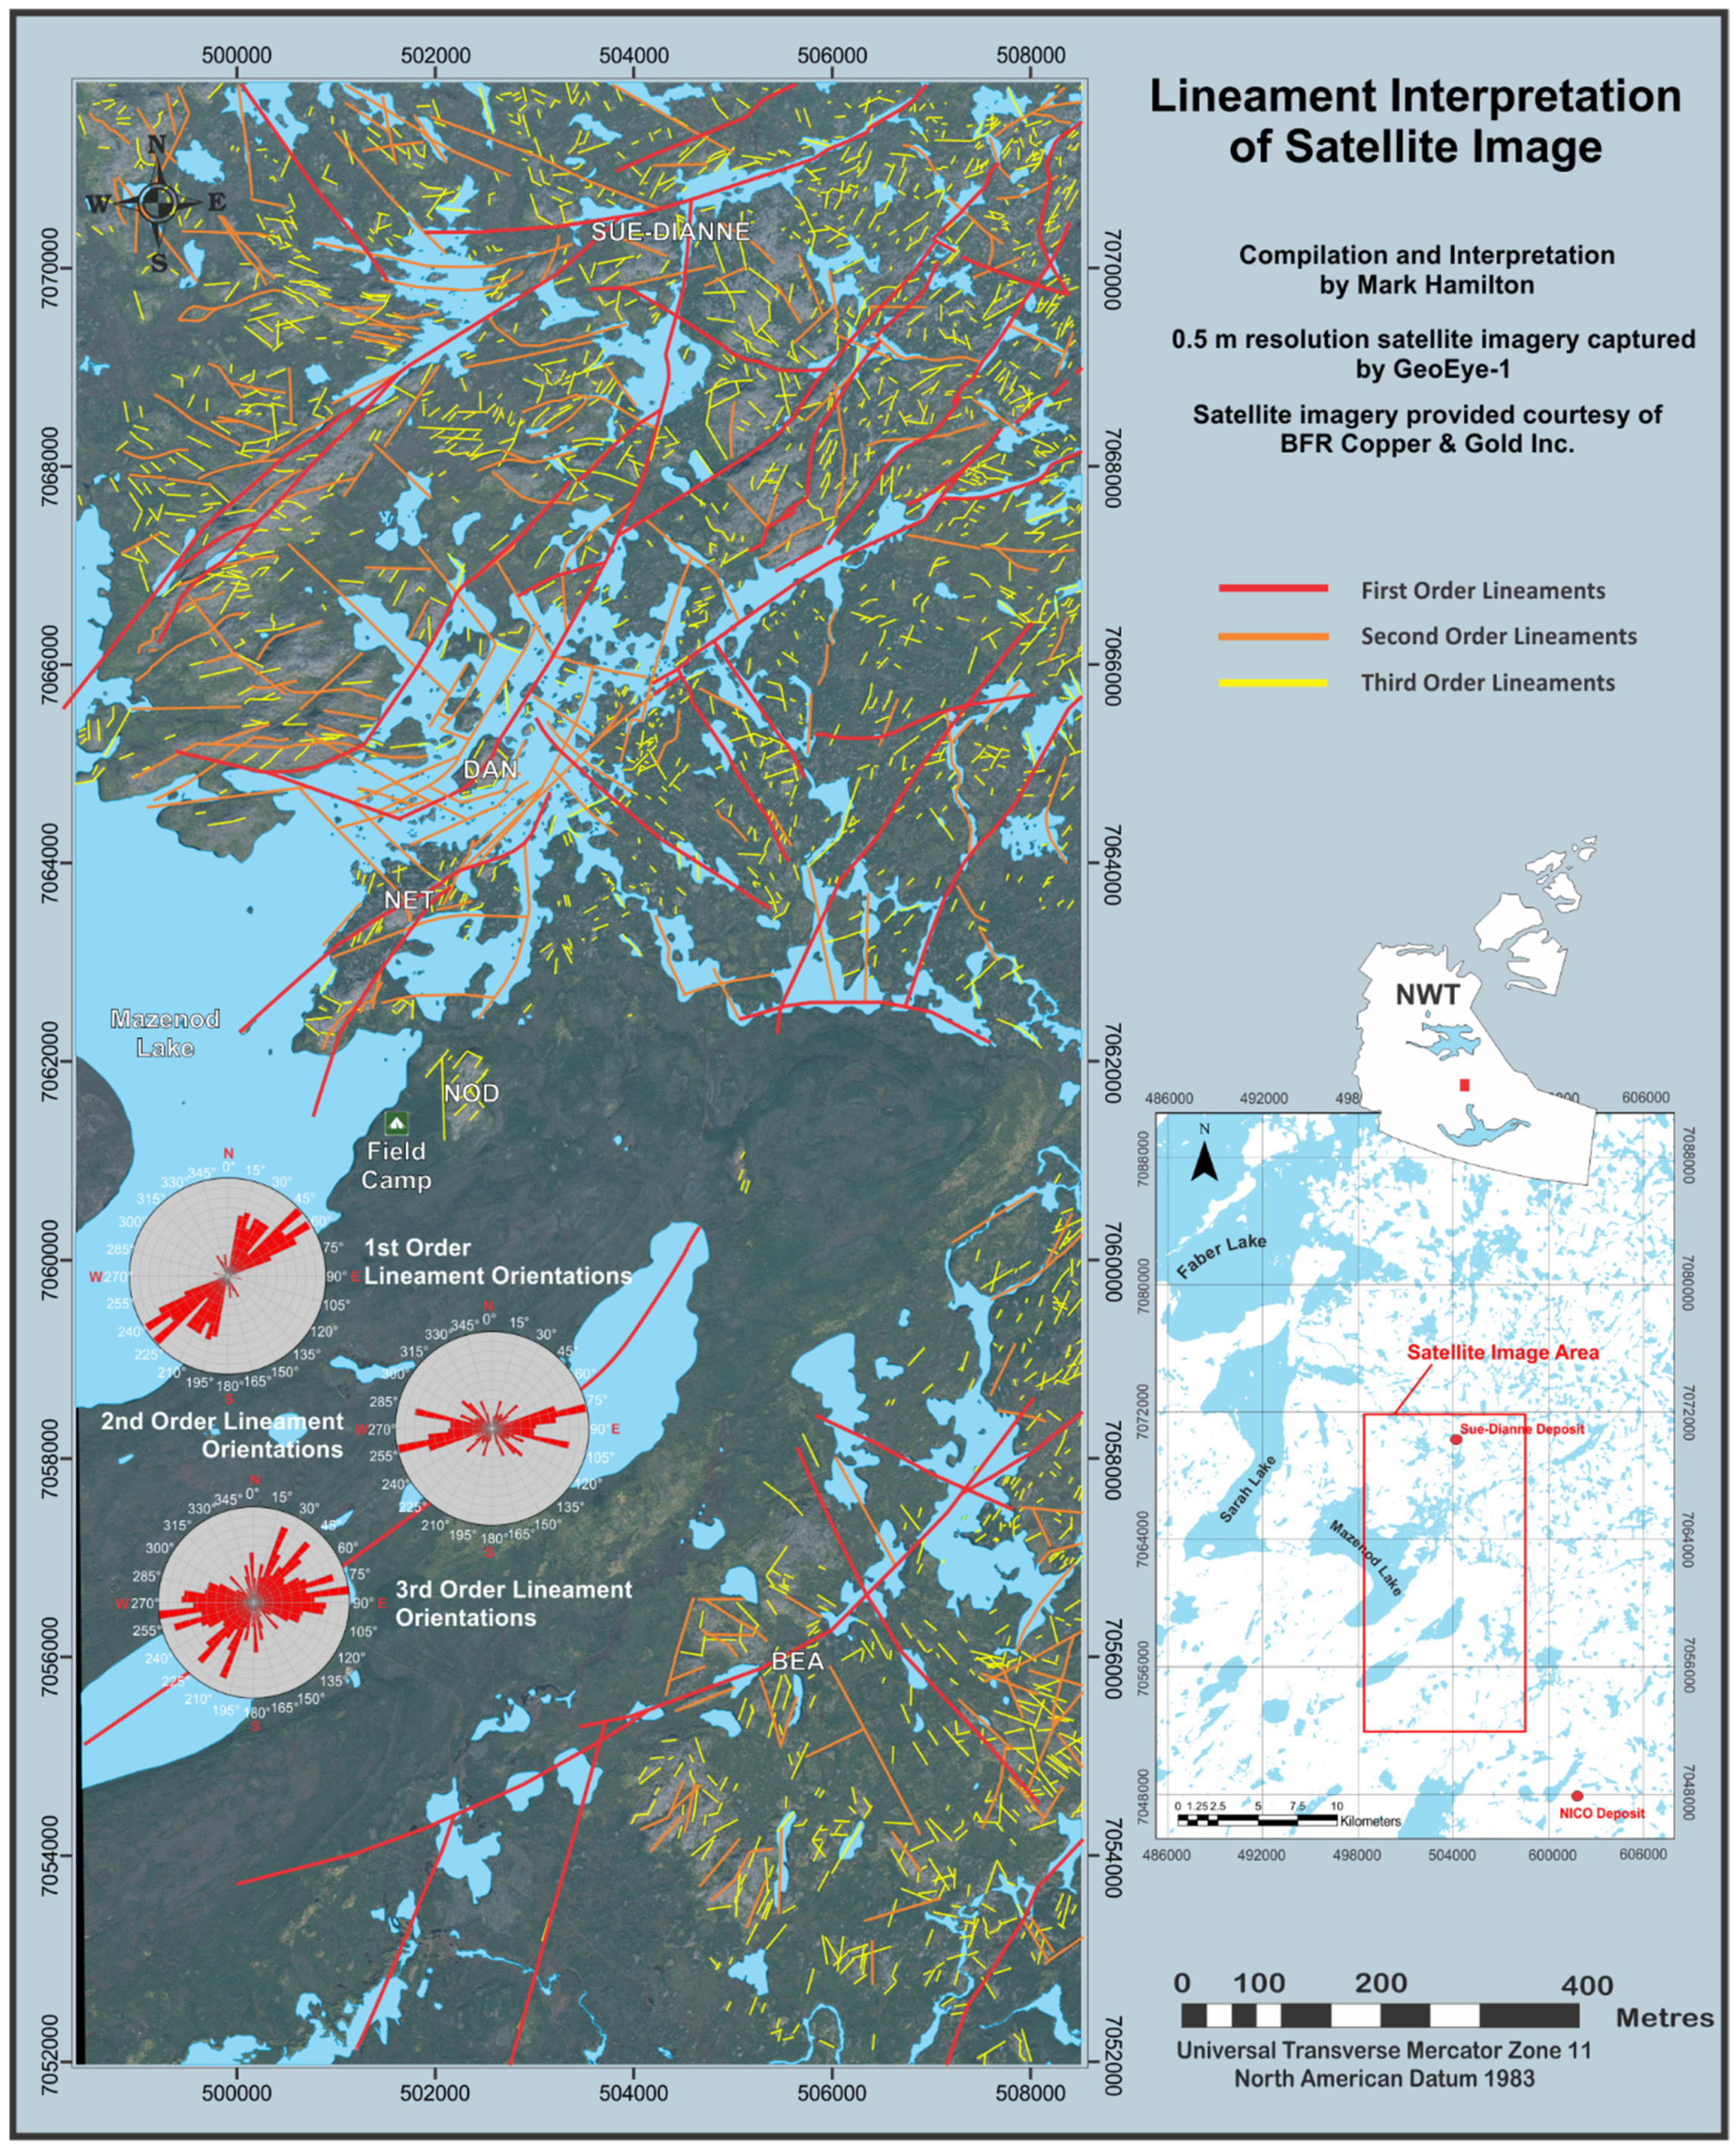
5. Structural Analysis of the Mazenod Lake Region

IOCG deposits globally are ubiquitously associated with major crustal structures as well as second-order, third-order, and subordinate features. This relationship is well exposed in the GBMZ where all past-producing mines are hosted by epithermal veins in crustal structures. The two current IOCG deposits under development, NICO Au-Co-Bi-Cu and Sue–Dianne Cu-Ag-Au are associated with extension, transverse, and transpressional faults and various types of fracturing and breccia [2,4,6,14,41,43,67,71,72,73,84,85,86,87,88,89]. The available geological mapping, aeromagnetic data, and topographic lineament analysis of the Mazenod district, along with previous work across the GBMZ provide an opportunity to examine the relationship of tectonic structures to IOCG alteration and mineralization in a regional context, and with a measure of detail not available to most IOCG systems. The GBMZ formed in response to a relatively short-lived negative tectonic inversion resulting in development of an intra-arc volcanoplutonic basin (~1876–1869 Ma) within the greater Wopmay Orogen [28,29,37,41,44,62,90,91,92], in a similar manner to the Chilean Iron Belt which formed during a negative tectonic inversion of the Andean orogeny [69,89,93,94,95]. In the GBMZ IOCG mineralization formed within the continental magmatic arc during this extensional inversion in association with belt parallel transpression and oblique to orthogonal transverse faults, as well as normal and other extension-related structures [41]. The relationship of mineralization to structure is complex but intimate, as structure provides the plumbing pathways for both magma and fluid, as well as depositional site preparation. During inversion, pre-existing orogenic transpression and transverse structures appear to have been put under extension and hydrothermally plumbed along with newly formed extension structures. Post inversion compression systematically segmented the GBMZ into dextral offset blocks along northeast-trending faults, each block comprising a northwest trending sequence of volcanic and sedimentary rocks (Figure 24 and Figure 25) [4,41,43]. These offsets are best revealed using aeromagnetic data and detailed field mapping where available [2,19,27,38,43,96]. Alternatively, Mumin et al. [41] suggest that the unusual oblique configuration of southeast-trending volcanic belts and northeast-transverse faults might be linked, at least in part, to an epicratonic extensional event, in response to a tectonic configuration reminiscent of the present-day Gulf of California. Interestingly, a series of offset fault-terminated pull-apart basins that focused hydrothermal fluids along the main trough resembling a Gulf of California style of extensional rifting has recently been suggested as a possible mechanism for development of the Cretaceous Peruvian IOA-IOCG belt [97].
Aeromagnetic data used in the present study was flown in 2012 along east-west-oriented 50 m spaced lines at 60 m height by Goldak Airborne Surveys. Topographic lineament analysis was carried out using GeoEye 1 satellite imagery with a 0.5 m resolution acquired in 2012. Both the aeromagnetic data and satellite imagery were provided courtesy of BFR Copper and Gold Inc. Magnetic lineaments are taken from the first vertical derivative of the total magnetic intensity, which is good at highlighting linear features such as faults and contrasting stratigraphy. Both high-gradient and low-gradient magnetic lineaments are plotted, with separate rose diagrams presented for each group (Figure 24).
Topographic lineaments in the dominantly volcanic and intrusive rock terrain of the GBMZ are due to several factors including: (1) variations in rock competency due to chemistry and texture of the original rock; (2) variations in rock competency due to subsequent widespread hydrothermal alteration; (3) widespread tectonic disruption and weakening of rocks; (4) multiple episodes of differential chemical weathering and erosion; and (5) multiple episodes of glacial erosion and scouring [41].
Good outcrop exposure in the Mazenod area (~30% of land area) allowed field examination of many magnetic and satellite lineaments from across the region, revealing that the majority of lineaments are related to structural features ± associated hydrothermal alteration. A limited number of lineaments can be associated solely with stratigraphy and primary rock competency differences. Obvious examples in the Mazenod region include Crystal Mountain, a topographic high lineament within the Dianne fault corridor caused by tectonic disruption and subsequent induration (hardening) from intense silicification and quartz veining that cemented the structural breccia into a weathering- and erosion-resistant topographic ridge. Elsewhere along the Dianne fault where hydrothermal induration did not occur the fault line is generally marked by topographic lows. A second and similar phenomenon located 4 km southeast of Crystal Mountain formed the Mazenod ridge along a branch of the northeast-trending Marion River fault (Figure 1, Figure 2, Figure 3 and Figure 14a,b). Topographic lineaments interpreted from satellite images are shown in Figure 25, with a subjective classification as first (most prominent), second, or third order depending on visible strength of each lineament. Rose diagrams for each classification are based on equal weighting to each lineament within the three categories.
The Mazenod region is tectonically disrupted and segmented into seven significant tectonic blocks and could be further subdivided into a series of lesser blocks (Figure 1, Figure 2 and Figure 24). Excellent preservation of the GBMZ, with erosion to approximately the upper part of subvolcanic intrusions has exposed some of the most tectonically disrupted parts of these volcano-plutonic-hydrothermal complexes. The entire volcano-plutonic section of the belt can be seen as a mega breccia complex similar to that documented by Mumin et al. [41] and Mumin [19] for the Echo District of the GBMZ. The mega breccia is caused by proximity to explosive volcanic centers situated at the confluence of intersecting repetitive crustal-scale fault structures that formed during both compressional and extensional phases of the Wopmay Orogen and GBMZ. This results in a combination of inter-disruptive transpressional, transverse, and extension-related structures and their associated widespread shearing, fracturing, and brecciation that range from crustal scale to micro-features. The result is the segmentation of the volcanic belt into a series of orthogonal to triangular blocks, which in the Mazenod region range from multi-kilometer scale to meter-scale features. The extensive structural disruption facilitated pervasive and widespread hydrothermal alteration to the extent that it is very difficult, and, in many areas, not possible, to find primary rocks that have not been hydrothermally altered to at least some extent.
Magnetic low-gradient lineaments are dominantly northeast-oriented and delineate the major northeast structures that segment the geology into a series of large blocks with systematic right-lateral offsets (Figure 24) [43]. However, significant north-trending lineaments are also present, which correlate with mapped features such as the Kemaz fault and may represent belt-parallel transpressional faults that were active before, during and after tectonic inversion. Conversely, magnetic high-gradient lineaments largely reflect the northwest-oriented volcanic stratigraphy of the belt and suggest that magnetite metasomatism is partial to certain stratigraphic sequences, such as is clearly the case at the NICO deposit [2,3,86], and recognized here as a feature of the Squirrel Lake assemblage. However, significant east-west-trending magnetic high-gradient lineaments also occur, with the most significant intersecting Dan Island. It is interesting that the major northeast- and north-trending structures form magnetic low-gradient lineaments. They were corridors permeated by distal and/or late low-temperature hydrothermal fluids characterized by silica flooding ± minor phyllic, epidote, hematite, and distal potassic alteration, and as such are generally devoid of minerals with high magnetic susceptibility such as magnetite, pyrrhotite, and ferro-magnesian phases. Some north-trending faults (e.g., Kemaz fault corridor) show local evidence of albite alteration, which may also result in low magnetic gradients. Most important, however, are isolated exceptions. The Sue–Dianne deposit is a distinct magnetic high within the confluence of two magnetic low-gradient structures due to abundant hydrothermal magnetite at depth in the Sue–Dianne deposit (Figure 1 and Figure 23). Dan Island is also associated with a magnetic high feature within regional low-gradient lineaments coincident with the Marion River and Kemaz fault corridors. The cause of the magnetic high at Dan Island remains unknown, as it is hidden at depth.
First-order topographic lineaments reflect prominent northeast-trending structures and correlate well with magnetic low-gradient features and with prominent mapped structures (Figure 25). Second-order structures predominantly trend east-west, while third-order structures comprise a myriad of subordinate features trending both east-west and northeast. However, even third-order lineaments can represent the exposed part of a much larger structural corridor or complex feature such as the multiple sets of parallel shearing that occur at the north end of Nod Hill (branch of the Kemaz structure) and many other locations in the district (Figure 10a). The smaller abundance of northwest-trending lineaments reflects stratigraphy, but also are perpendicular to the principal direction of regional extension that occurred during negative inversion, and also correlate with normal faulting. The complexity of inter-disruptive structures generates the myriad structural features observed, but two prominent primary structural trends appear to be well preserved. They are belt-parallel (~north-trending) and transverse (east-trending) structures most likely related to long-lived and protracted eastward subduction during the Wopmay orogen, and a second orthogonal set of structural features that are unique to the formation of the GBMZ, with intersecting northeast and northwesterly trends. These two orthogonal structural trends are common to the GBMZ as a whole and are well documented in the Echo Bay and NICO districts [2,3,19,29,41,43,44,91,92].
The five most prominent hydrothermal centers in the Mazenod district occur at tectonically disrupted intersections of major crustal breaks. This includes the Nod Hill area, which is disrupted by multiple subparallel faults and shearing, associated with a branch of the Kemaz (Ketchison–Mazenod Lake) fault zone, where it is cut by northeast-trending transverse faults (Figure 10a). This creates local intense brecciation of host ignimbrites enabling fluid penetration and the most intense alteration. The Kemaz fault continues northward to Dan Island, where it intersects and is offset by northwest- and west-oriented structures (Figure 2, Figure 3, Figure 11a, Figure 24 and Figure 25). Dan Island felsite and tourmaline–hematite stockwork superimposed on alkali-altered breccias formed at this juncture. Further north, the Kemaz fault corridor intersects the ENE-trending Dianne Lake Fault, forming the tectonic-hydrothermal breccia that hosts and envelops the Sue–Dianne deposit (Figure 1 and Figure 23). Approximately 2 km north of Sue–Dianne, the Kemaz structure hosts the MAR magnetite-martite breccia associated with subtle NE-trending topographic and magnetic lineaments (Figure 12a) [26,27]. The PD skarn (Figure 10e) also occurs along a branch of the Kemaz fault northeast of Nod Hill. However, there is insufficient outcrop and drilling in this area to draw any definitive conclusions; however, subtle lineaments and the extent of fracturing and brecciation of drill core strongly indicates cross-cutting structures. The Kemaz fault is thought to be a regional-scale belt-parallel transpressional structure active during the Wopmay orogen. However, extension during the GBMZ inversion and basin development, and NE-trending transverse faulting facilitated creation of numerous centers of tectonic disruption that focused the magmatic and hydrothermal activity discussed above. In addition to lateral displacement, late activation of the Kemaz fault indicates that the east side is up-thrown, and along the Dianne Lake fault, the northwest side is the up-thrown block. This is evidenced by the current exposures of generally more intense and structurally deeper alteration exposed on the up-thrown side [22,25].
The five most prominent mineralized centers are associated with the Kemaz fault corridor, where it is disrupted by northeast-to-east-trending structures. The morphology of the Sue–Dianne deposit is controlled by both the Dianne Lake and Kemaz faults, and they both offset each other. The implication is that both were active before, during, and after the time of mineralization.
The Mazenod volcanic complex appears folded into a synclinal sequence, most likely resulting from a combination of progressive collapse and terminal eastward-directed compression that ended the Great Bear extensional event. Collapse of the subvolcanic portion of the underlying Marion River batholith ± Sarah Lake granite and associated stocks, plutons and/or cupolas, likely prevented erosion and complete removal of the volcanic belt, thus preserving the Mazenod supracrustal sequence in its current form. The approximate axial trace of the belt-scale collapse trends northwesterly within the Bea Lake sequence (Figure 2 and Figure 3).

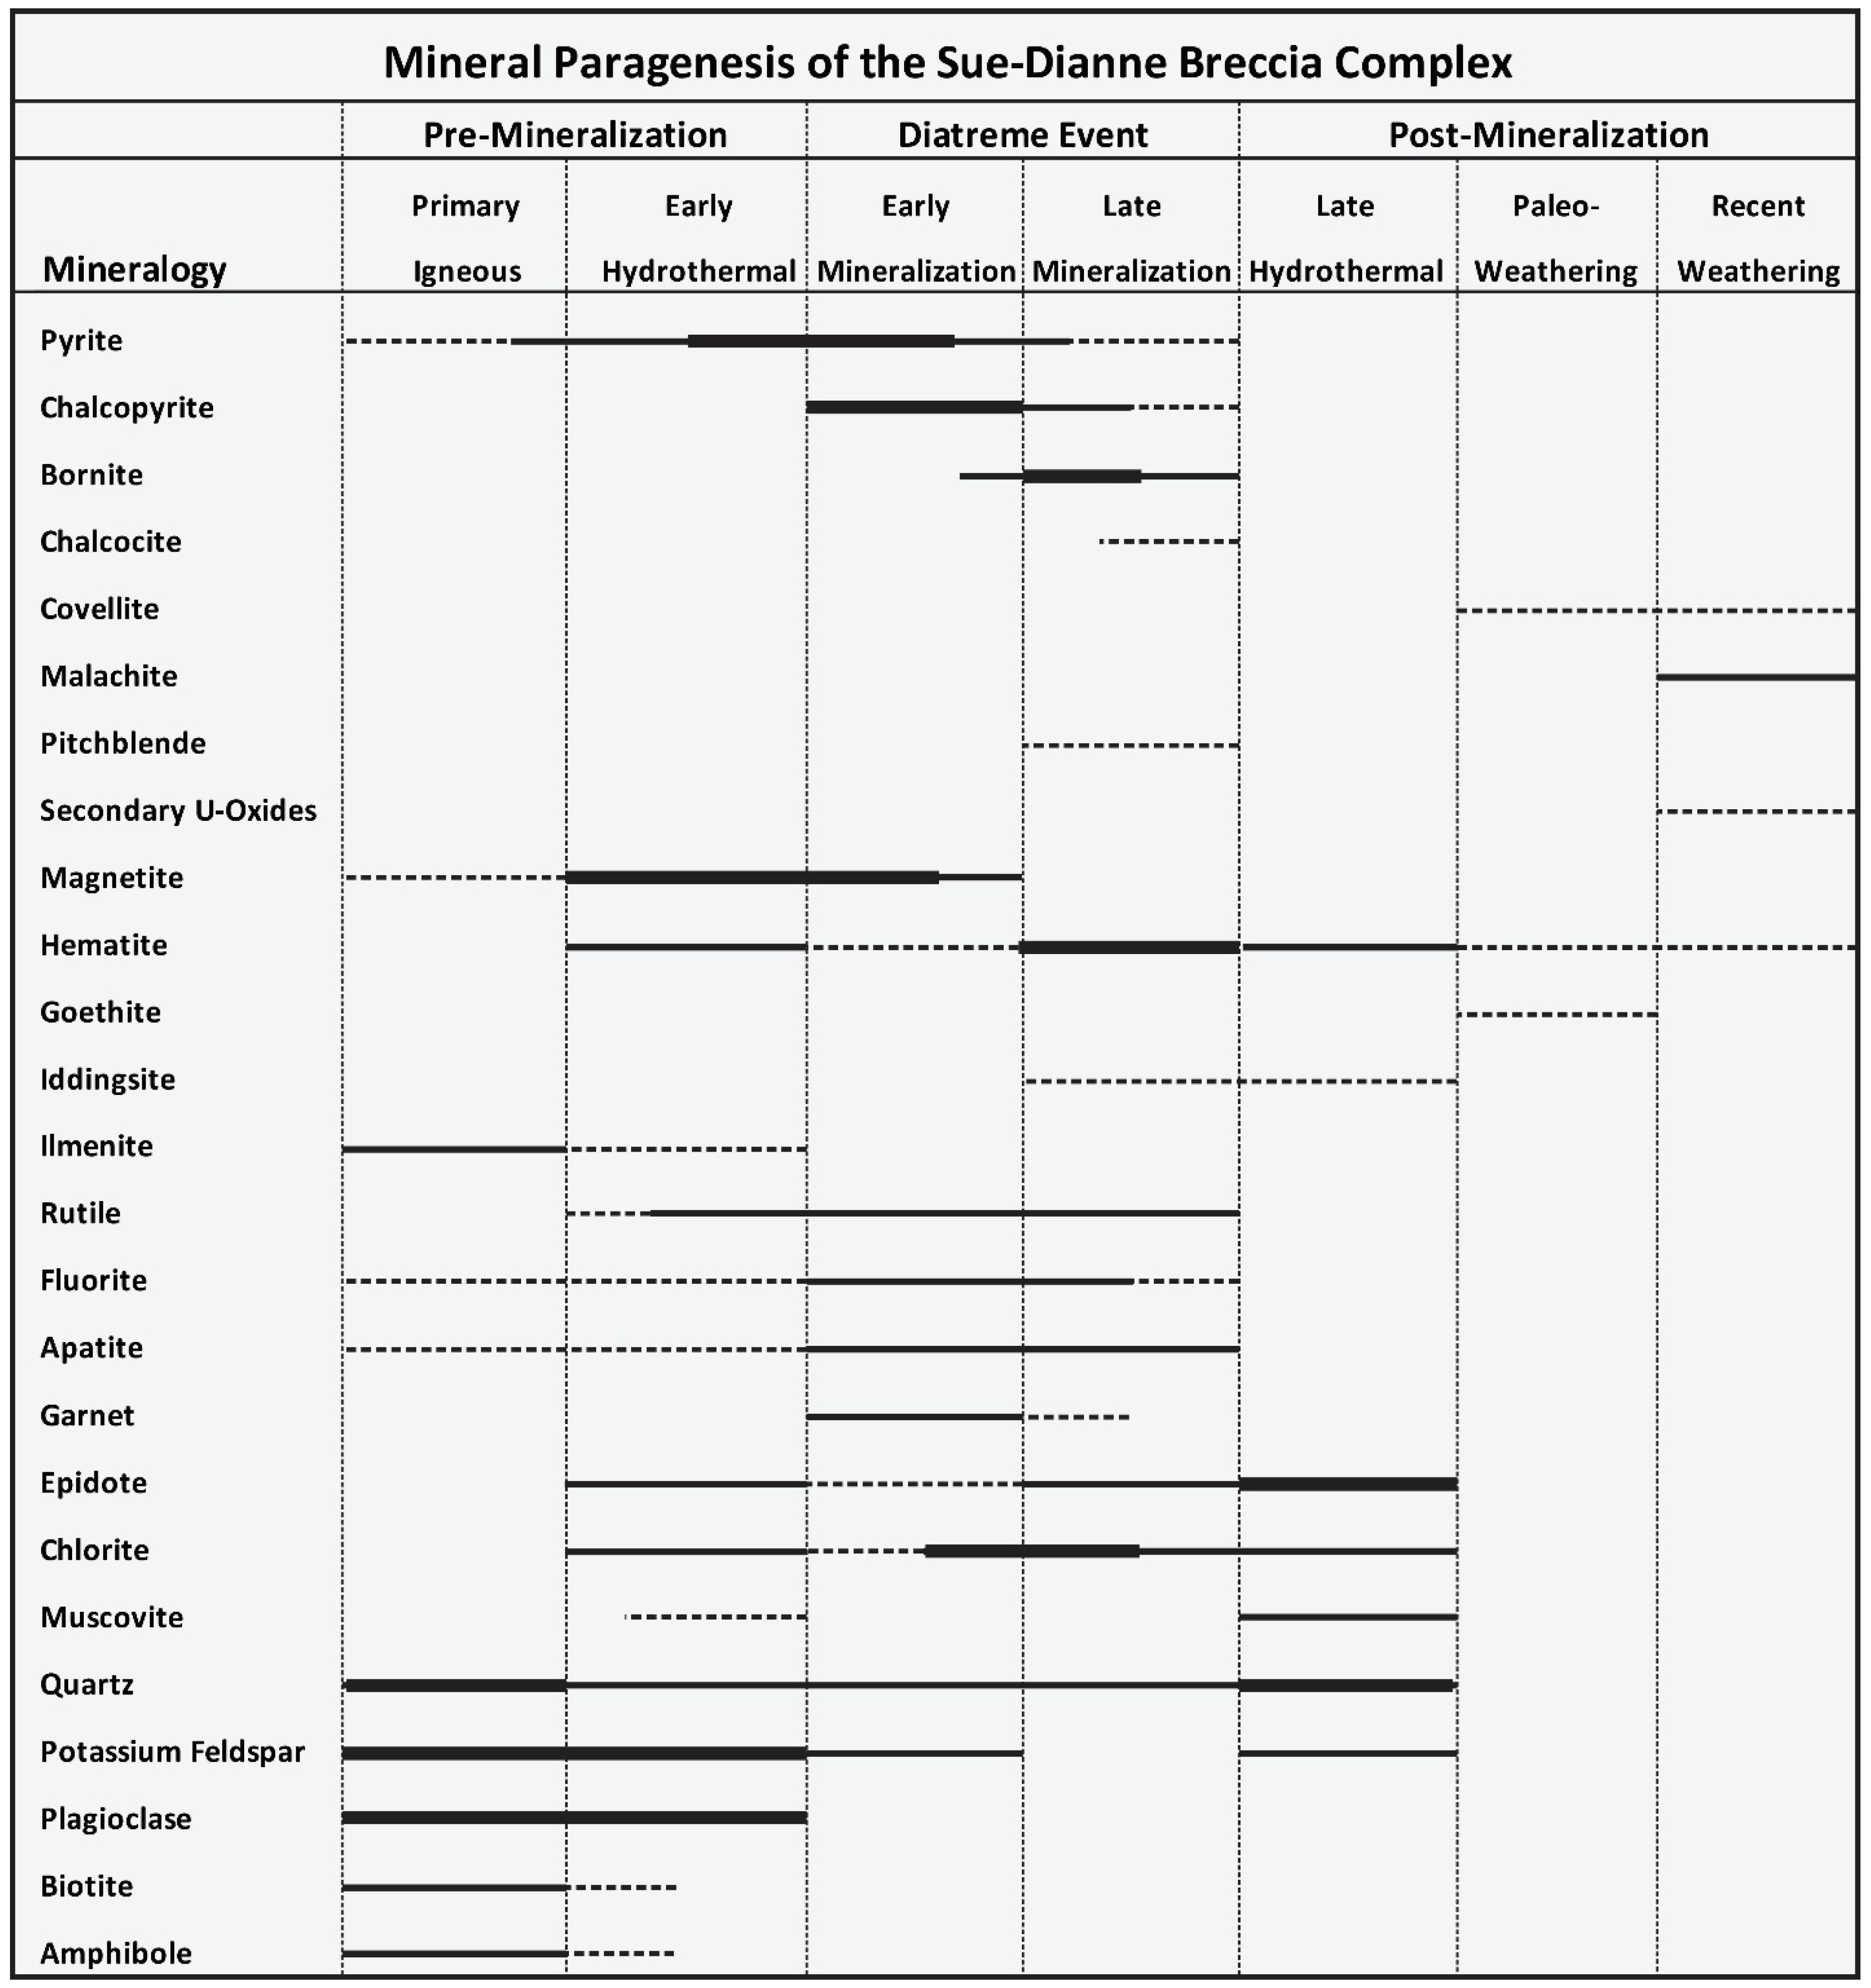
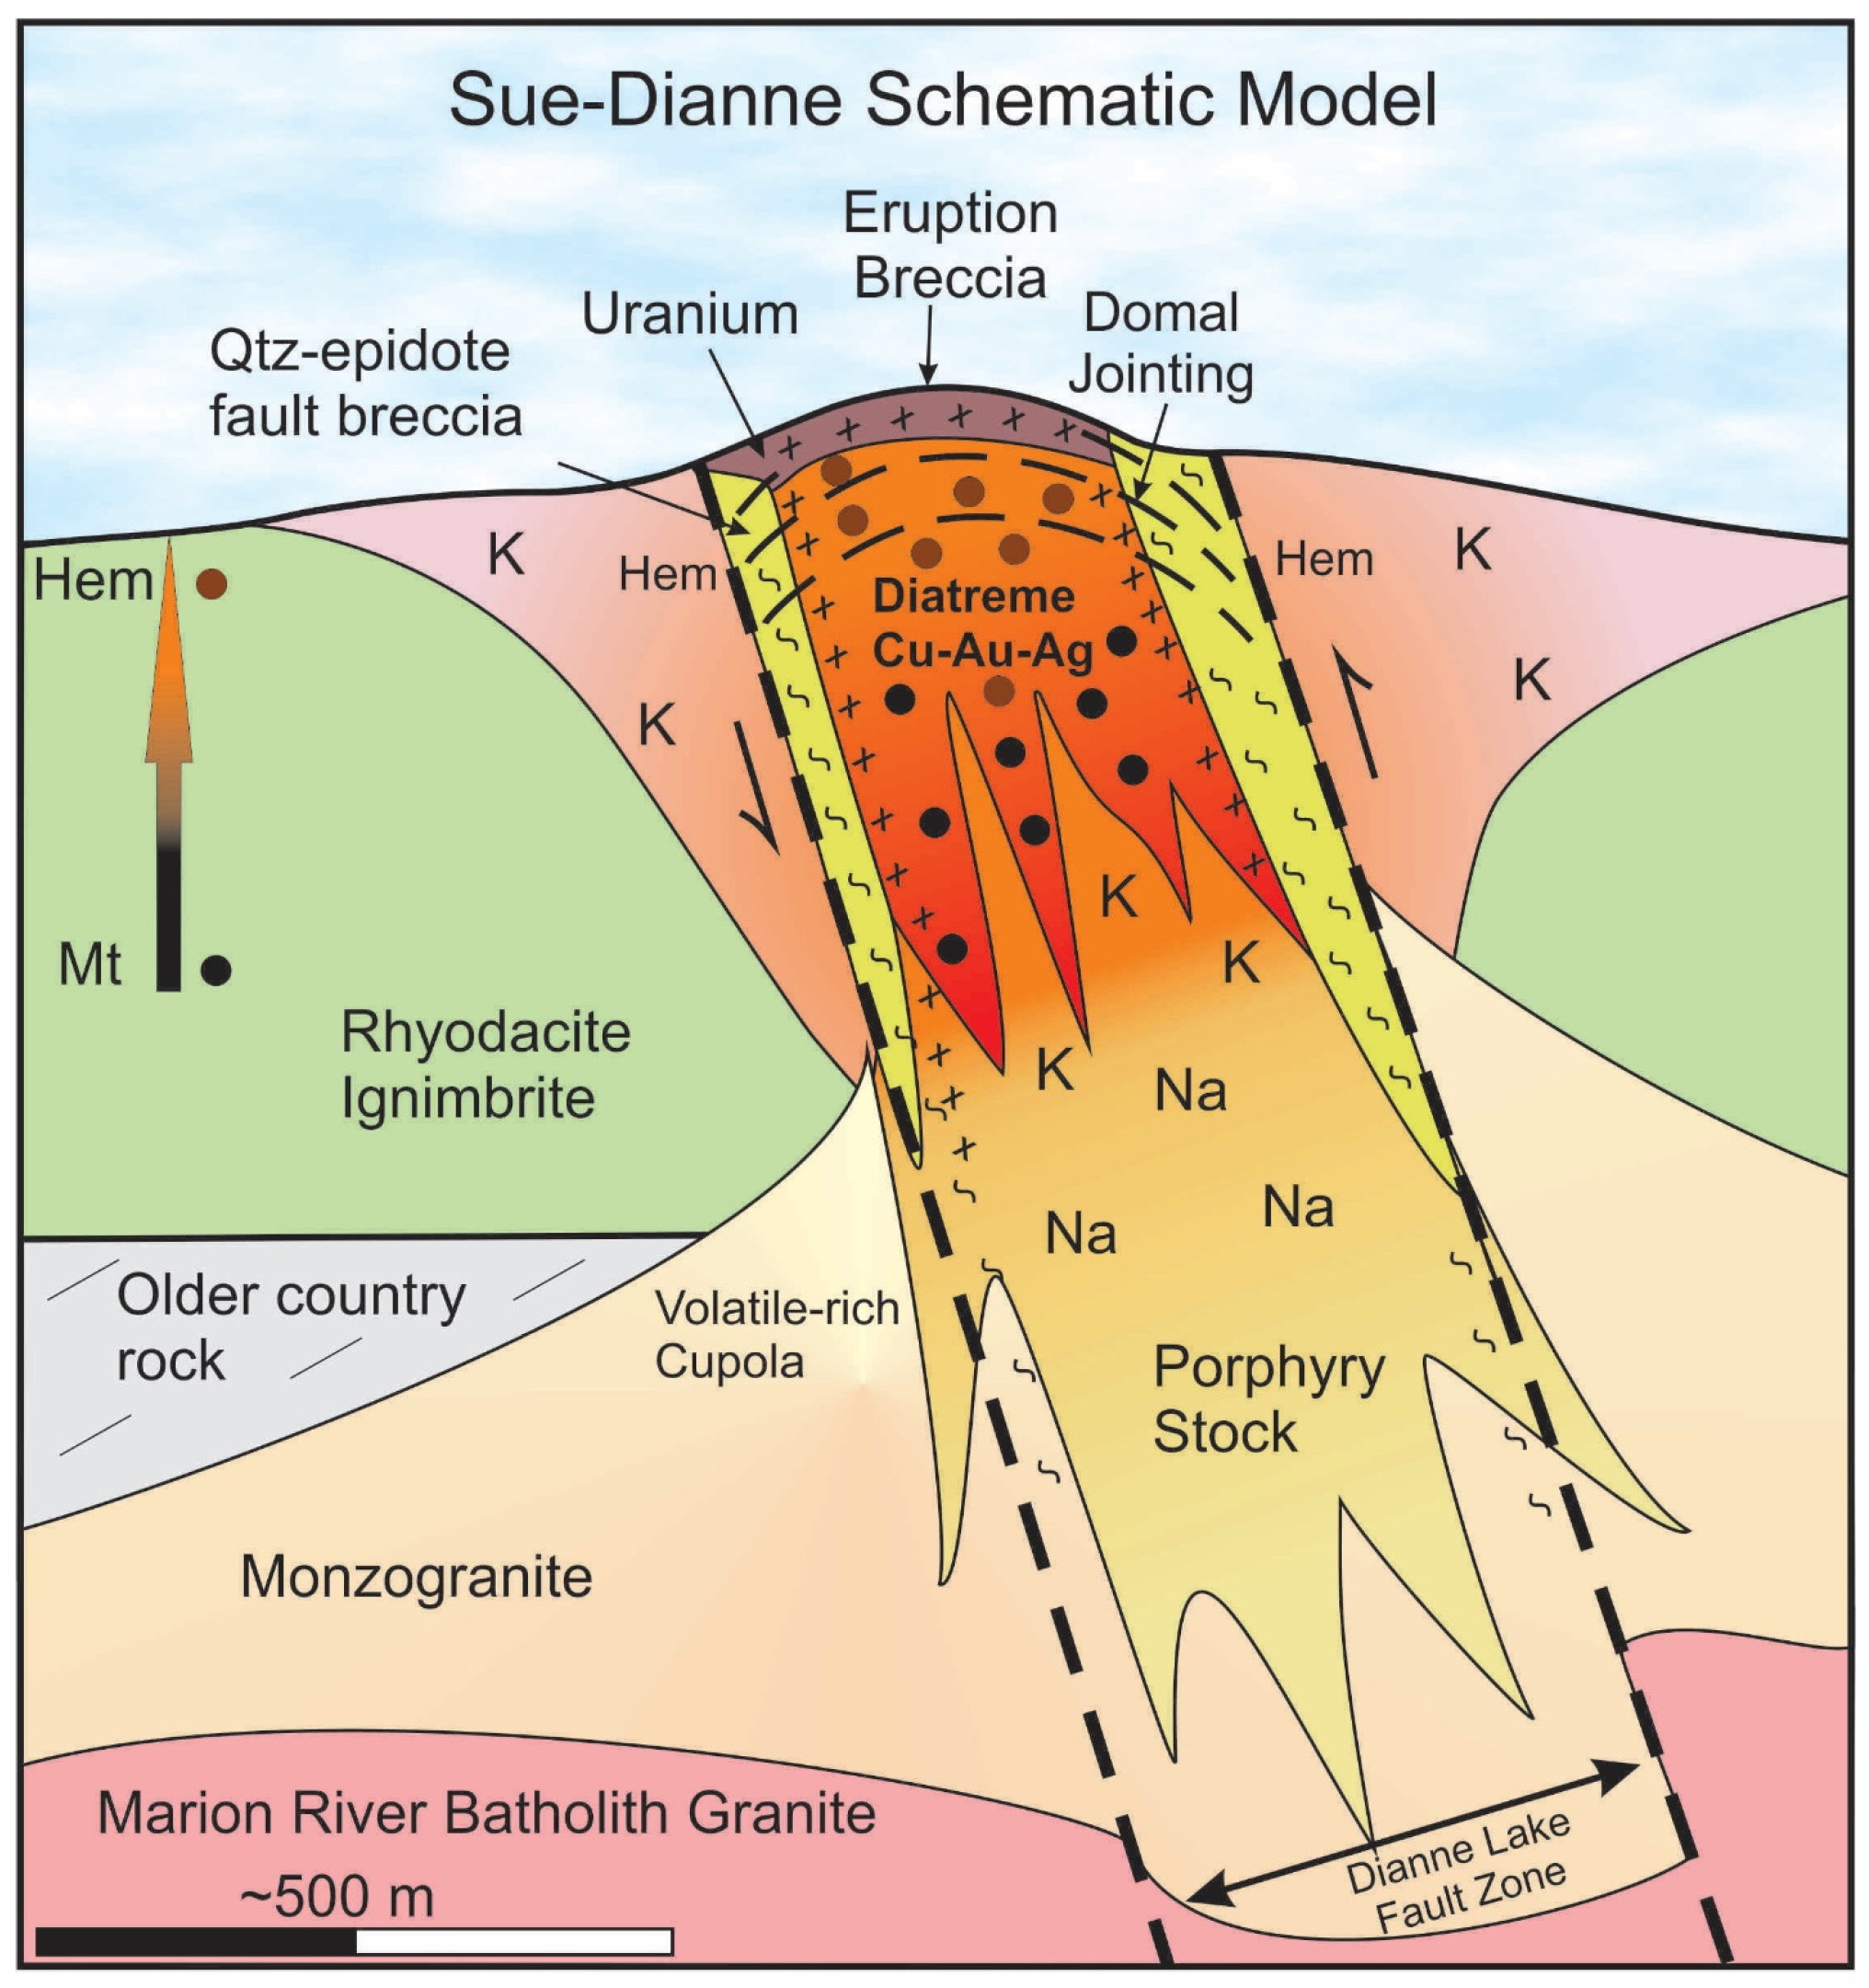
6. Sue–Dianne Deposit

Sue–Dianne is a structural and hydrothermal breccia complex with Cu-Ag and minor Au mineralization hosted in a magnetite- (deep) and hematite-cemented (shallow) breccia along with chlorite, epidote, garnet, fluorite, chalcopyrite, and pyrite (Figure 8 and Figure 9) [2,3,22,25]. Sue–Dianne contains an in-ground geological resource of 24.3 million metric tons grading 0.56% copper and 2.2 g/t silver, with a smaller indicated mining resource of 8.44 million tons, grading 0.80% copper, 0.07 g/t gold, and 3.2 g/t silver [98]. The deposit formed in structural breccias at the intersection of the Dianne Lake and Kemaz fault corridors. It is hosted by rhyodacite ignimbrite sheets in a felsite ± hematite alteration halo and is encased within a quartz and quartz–epidote stockwork and breccia. Overall, 21 minerals and seven stages of mineral paragenesis are recorded for the Sue–Dianne deposit, which are: (1) primary igneous assemblage, (2) early hydrothermal alteration, (3) early mineralization, (4) late mineralization, (5) late hydrothermal alteration, (6) paleoweathering, and (7) recent weathering (Figure 22 and Figure 23) [22]. The deposit transitions upward from magnetite-hosted at depth to magnetite with pyrite, and then magnetite becomes the main host to chalcopyrite mineralization along with minor Ag and Au. In the central part of the deposit, magnetite transitions to hematite as temperatures cool and conditions become more oxidizing (Figure 23). Here the alteration mineral assemblage is dominantly magnetite, hematite, chlorite, garnet, fluorite, epidote, pyrite and chalcopyrite. In the upper parts of the system, hematite is the only Fe oxide present as hydrothermal cement in breccia and veins, and as pervasive disseminations in the host rock. Chalcopyrite at depth transitions systematically upward to bornite, chalcocite, djurleite and covellite with increasing proximity to the paleosurface. Minor uranium occurs as pitchblende veins only near surface in the most oxidized hematitic breccia and alteration. Host rock for the mineralization is rhyodacite felsite porphyry. The deposit is underlain by a porphyry stock which is sodic (albite) rich in the deepest drill holes. Albitized porphyry transitions to K–feldspar-rich felsite porphyry in its uppermost levels, at which point it appears to have undergone explosive brecciation to form the Sue–Dianne hydrothermal breccia (Figure 8, Figure 9 and Figure 23). The presence of coarse angular breccia, rapid transition from a high-temperature reduced assemblage to a low-temperature oxidized mineral assemblage in the breccia, a possible paleoregolith and paleoweathering, very coarse breccias at surface, and near surface deposition of the Crystal Mountain quartz complex all suggest the deposit formed at a very high structural level and appears to have breached the surface. The Sue–Dianne deposit comprises an entire IOCG deposit system preserved within less than 500 vertical meters, from its underlying magma source to the paleosurface [4].

7. Discussion

The Faber Group volcanic belt stretches from south of the Ray Rock mine northwest to Faber Lake, with the Mazenod district comprising the north-central portion of the belt. The belt hosts the NICO Au-Co-Bi-Cu deposit in the south, and the Sue–Dianne Cu-Au-Ag deposit in the Mazenod district. It also contains the past-producing Ray Rock U-Cu mine in a giant epithermal quartz vein, a distal and/or late stage of the IOCG systems in the belt [2,3,4]. Rocks in the Mazenod region are dominated by andesite and rhyodacite ignimbrite sequences, with locally exposed underlying subvolcanic diorite, monzodiorite, dacitic and quartz-feldspar porphyritic intrusions. Vestiges of older Treasure Lake Group sedimentary rocks are found marginal to and structurally above some of the Marion River Batholith intrusions and were easily interpreted as distinct from synvolcanic sedimentary rocks by their contact metamorphism, hydrothermal alteration, and lack of volcanic features. Several large sequences of volcaniclastic rocks are interlayered with the ignimbrites. The belt is bounded to the west by the Sarah Lake granite and to the east by the Marion River granite, which are thought to be phases of the same larger batholith. Marginal phases of the batholith include diorite and monzogranite/monzonite, which apparently grade into subvolcanic intrusions such as the central Mazenod diorite to monzodiorite pluton, and Sue–Dianne porphyry stock. Fine bedded ash and volcaniclastic sequences locally show graded bedding and cross-bedding features that indicate water lain facies in what may have been crater lakes, and local fluvial redistribution of tuffs.
Igneous and sedimentary assemblages of the Mazenod district were affected by widespread weak to moderate hydrothermal alteration that is consistent with IOCG magmatic–hydrothermal systems. Within the district scale alteration, several distinct centers of intense alteration ± mineralization are documented. The dominant district-scale alteration types are K–feldspar and silica flooding or pervasive minor silicification, and more localized minor to moderate albitization. Subtle pervasive alteration often makes field recognition and distinction between andesite, dacite, rhyodacite and rhyolite difficult, and a number of andesites have been field labelled as rhyodacite due to the widespread bleaching, leaching, silicification, albitization and conversion of albite to K–feldspar. Alteration intensifies locally to produce felsite and rarely albitite. These in turn may be overprinted by any combination of magnetite, hematite, tourmaline, amphibole, chlorite, skarn, quartz, epidote and sulphide mineralization. Pervasive phyllic alteration is largely the conversion of primary feldspar ± other minerals to sericite. Widespread minor silicification is common and intensifies toward major structurally hosted quartz-complexes such as Mazenod Ridge and Crystal Mountain. Hydrothermal Fe-oxide alteration can be locally widespread and pervasive as hematite dusting and impregnation, however, much of this is due to formation of hematite during recrystallization of existing Fe in the rock. This is a common phenomenon that often accompanies K–feldspar alteration, and in some cases may accompany albitization [99]. Calcic enrichment has not been observed as a pervasive alteration of any rock type in the Mazenod district but can occur as localized vein and/or breccia fill in the form of rare carbonate minerals and abundant epidote. However, significant Ca enrichment does occur in the central parts of the Sue–Dianne deposit as andradite garnet, epidote and fluorite, in veinlets and as part of the hydrothermal cement. Calcium capture also occurs as actinolite in vein and breccia fills at the Nod Hill showing and in the PD skarn area. While the vein infill is Ca-Fe bearing, the immediate host rocks are depleted. Significant to extreme iron enrichment occurs mostly as vein and breccia matrix fill, and as a replacement of ferromagnesian minerals, to form magnetite and/or hematite. Fe enrichment can also occur in the form of Fe-rich silicates (chlorite, amphibole, epidote), and minor sulphides (chalcopyrite, pyrite ± pyrrhotite). Boron enrichment as tourmaline occurs as vein and breccia fill, mostly superimposed on potassically altered or albitized rocks.
The most prominent hydrothermal centers are the Sue–Dianne magnetite to hematite group Cu-Ag IOCG deposit, and the central part of the northeast arm of Mazenod Lake, approximately centered around the Dan Island felsite–tourmaline–hematite breccia. Other centers include the PD Cu-enriched magnetite skarn showing, the Nod Hill amphibole-magnetite-quartz breccia, and the MAR magnetite–martite-cemented breccia. The most intense regions of alteration occur along branches of the Kemaz fault at intersections with transverse faults. In the southern Bea area, alteration is not as strong, but intensification is noted in parts of both the southern and northern Bea regions. This might be an indication of hydrothermal centers at depth. We interpret the widespread silica and potassic alteration, with only minor to moderate albitization to indicate that the present erosional level for most of the Mazenod district has exposed relatively high-level portions of the IOCG system (with noted exceptions). It is reasonable to suggest that more intense alteration may be present at depth at a number of locations discussed in the text.
In the Bea area, lineament analysis (Figure 25) reveals a radial pattern surrounding a topographic low. This pattern of crustal fracturing strongly suggests an underlying intrusion. In this case, the topographic low may be the result of collapse of an underlying intrusion, similar to documented collapse features at NICO and Echo Bay [41].
The chemical signature of alteration in the Mazenod district is consistent with other parts of the GBMZ [1,2,11,45,53,55,100,101,102,103,104,105,106]. Areas of sodic alteration are depleted in Fe, Ca, K, Mn, Zn, Co, W, Pd, V and other metals, while being enriched primarily in Na and some typical intrusion derived metals including Cu and Au. Potassically altered rocks, especially felsites, are enriched in Fe, K, rare earths, and a host of potentially economic metals including Cu, Au, Bi, W, Mo, Co, As, Hg, Ni, Ba, all of which are consistent with magmatic–hydrothermal sources ± metal fluxing from areas of intense sodic alteration [6,79]. These rocks were simultaneously depleted in Ca, Na, Mn, Sr and Zn. The mineralized breccia of the central Sue–Dianne deposit shows very high enrichments for Cu, Co, F, Cl, CaO, U and Fe, with high to moderate enrichment of Zn, Pb, Ce, Nd, Pr, Eu, Gd, Mn, K2O, P2O5, W, V and Ba. The only significant depletion is for sodium. Minor volume loss or conservation of volume is indicated during pervasive potassic alteration of ignimbrites, which is believed to be an important consideration in maintaining permeability and facilitating regional pervasive alteration. The indicated large increase of 54% in volume of material during mineralization at Sue–Dianne necessitates tectonic open-space fracturing and brecciation in order to make room for the influx of new material during mineralization. Open space brecciation is best facilitated by extensional tectonics and explosive brecciation, which are common features of virtually all IOCG deposits [5,6,89], and are clearly manifest in and around Sue–Dianne.
The Mazenod district is disrupted by three recognizable tectonic episodes which are dominated by orthogonal fault sets. The first is pre-GBMZ compressional tectonics of the Wopmay Orogen which resulted in belt-parallel and transverse faulting [31,32,33]. This was followed by a short-lived extensional inversion with intra-arc basin development that is unique to formation of the GBMZ and responsible for its volcanism and short-lived province-scale magmatic–hydrothermal IOCG-related mineralization. This intra-arc event is similar to that responsible for the Chilean Iron Belt, and also has similarities to the Cretaceous central Peruvian IOA-IOCG belt. In the GBMZ this extensional inversion is responsible for southwest-northeast directed crustal extension, and the formation of southeast trending volcanic belts above a rifted axis. It also caused simultaneous tensional opening and lateral displacement along northeast-trending crustal transverse faults, and mineralization within and proximal to these structures. The Mazenod district is now segmented into at least 7 dextral displaced tectonic blocks arranged in an approximate north-trending belt. However, a dominant northwest trend to stratigraphy is preserved within individual blocks. The exception is parts of the volcanic sequence north of Mazenod Lake and south of the Dianne Lake fault, which appears tectonically deformed into a more complex west and north-trending stratigraphy and structure [4,19,41,43,44,45,69,89,91,92,94,97]. The final tectonic episode to noticeably affect the GBMZ was the return to compressional tectonics of the Wopmay Orogen. This terminal compression may be responsible for much of the displacement along the northeast-trending crustal faults, and through systematic dextral displacement helped align the southeast-northwest-trending segmented volcanic stratigraphy into its overall north-south orientation. Hayward and Corriveau [43] suggest that the volcanic stratigraphy was originally aligned in a N-S basin, which was re-aligned during dextral displacement into its current series of tectonic blocks with SE-NW trending volcanic rocks. In the current investigation no evidence was found to suggest original N-S alignment of the volcanic belts. NE-SW directed oblique extension with SE trending rift axes is consistent with the observed geology and tectonic features. An origin with oblique rifting and transverse dextral faulting is the preferred interpretation for the Mazenod region and GBMZ as a whole, as discussed by Mumin et al. [41] for the GBMZ and Shatwell [97] for the Cretaceous Peruvian IOA-IOCG belt. In this scenario, the axes of rifting and SE-trending volcanic belts still conform to their original orientation, and segmentation of the belts is synchronous with GBMZ volcano-plutonic activity. However, some degree of further dextral displacement along NE faults may have occurred after GBMZ volcanism. Fortunately, post GBMZ tectonic deformation of the supracrustal volcanic belts is relatively minor, and for its age the Mazenod district remains very well preserved.
The importance of syn-volcanic structures in controlling the centers of hydrothermal alteration and mineralization is clearly manifest in the Mazenod region. All five significant centers occur along the N-S trending Kemaz fault corridor at locations where it is intersected by transverse faults. The Kemaz fault corridor is a wide zone with repeated tectonic shearing and faulting, which is consistent with a relatively long-lived major syn-volcanic structural corridor. Synvolcanic intrusions directly related to alteration and mineralization are documented within this corridor at both Sue–Dianne and Dan, with hidden intrusions likely present in the central Bea area and elsewhere. Additional intense alteration occurs along major NE transverse structures, in particular the giant quartz stockwork-breccia complexes at Crystal Mountain and Mazenod Ridge. Textural and mineralogical features indicate these are late-stage and/or distal manifestations of the greater IOCG hydrothermal system, with deposition of silica in distal and cooler near-surface environments.
The present detailed mapping and analysis of the Mazenod region, along with previous studies and similar findings in the southern part of the belt, show that the Faber belt is a coherent and genetically linked volcano-plutonic complex with regionally extensive magmatic–hydrothermal IOCG systems [2,4,10,22,24,25,45]. The volcanic belt is sourced from the multiphase 1.87–1.85 Ga Marion River batholith that intruded Treasure Lake Group sedimentary rocks. Rising volatile-rich cupolas, plutons, stocks and dikes are the source for overlying volcanism that ranges from rhyolite to basaltic andesite in composition, with extensive ignimbrite, tuff and ash deposits as well as interlayered volcaniclastic sediments. The overall belt configuration is that of a rift fill sequence, which according to current mapping shows inward collapse of the volcanic stratigraphy, and along with terminal compressional tectonics resulted in a synclinal sequence for the volcanic stratigraphy south of Mazenod Lake. Collapse of subvolcanic intrusions and the underlying batholith is likely the main reason for preservation of the supracrustal volcanic rocks, by preventing complete erosion of the volcanic belt. The plutonic activity is the source of magmatic–hydrothermal fluids, which along with metal fluxing from the host rocks are responsible for generation of the widespread coalescing IOCG hydrothermal systems that generated a range of mineralization styles. In particular, intermediate subvolcanic porphyritic intrusions are directly related to alteration and mineralization at Sue–Dianne and Dan Island.

Author Contributions

Validation, A.H.M.; Writing—original draft, A.H.M.; Writing—review & editing, M.H. All authors have read and agreed to the published version of the manuscript.

Funding

This research was primarily funded by a grant from BFR Copper and Gold Inc., and a research stipend from Dawn Zhou and a Manitoba Graduate Scholarship to M. Hamilton.

Data Availability Statement

The original contributions presented in this study are included in the article. Further inquiries can be directed to the corresponding author.

Acknowledgments

We sincerely thank Dawn Zhou of BFR Copper and Gold Inc. for the generous support that made this work possible, including all field mapping and data for the central Mazenod and Bea areas, and generous stipends to M. Hamilton. We thank Fortune Minerals for allowing access to their Sue–Dianne data and property, and for supporting work in that area. We also thank Manitoba Graduate Scholarships for their support of M. Hamilton. We are grateful for, and recognize, the significant contributions to this work of all BFR geologists and technicians who carried out the fieldwork and some of the subsequent analyses—in particular, Scott Ryan, John Schmyr, and Kyle Reid, assisted by Shane Gleeson and Rashid Mumin. We fondly remember Howard Stewart as the best cook and camp manager in the Northwest Territories. We also thank Louise Corriveau (Geological Survey of Canada, Natural Resources Canada) for her thorough review of this manuscript prior to its submission.

Conflicts of Interest

The authors declare no conflict of interest.

References

  1. Corriveau, L.; Potter, E.G. Advancing exploration for iron oxide-copper-gold and affiliated deposits in Canada: Context, scientific overview, outcomes and impacts. In Canada’s Northern Shield: New Perspectives from the Geo-Mapping for Energy and Minerals Program; Pehrsson, S., Wodicka, N., Rogers, N., Percival, J., Eds.; Geological Survey of Canada: Ottawa, ON, Canada, 2024; Bulletin 612; p. 612, in press. [Google Scholar]
  2. Goad, R.E.; Mumin, A.H.; Duke, N.A.; Neale, K.L.; Mulligan, D.L.; Camier, J.W. The NICO and Sue-Dianne Proterozoic, iron oxide-hosted, polymetallic deposits, Northwest Territories; application of the Olympic Dam model in exploration. Explor. Min. Geol. 2000, 9, 123–140. [Google Scholar] [CrossRef]
  3. Goad, R.E.; Mumin, A.H.; Duke, N.A.; Neale, K.L.; Mulligan, D.L. Geology of the Proterozoic iron oxide-hosted NICO cobalt-gold-bismuth, and Sue-Dianne copper-silver deposits, southern Great Bear Magmatic Zone, Northwest Territories, Canada. In Hydrothermal Iron Oxide Copper-Gold and Related Deposits: A Global Perspective, v. 1; Porter, T.M., Ed.; PGC Publishing: Adelaide, Australia, 2000; Volume 1, pp. 249–267. [Google Scholar]
  4. Mumin, A.H.; Somarin, A.; Jones, B.; Corriveau, L.; Ootes, L.; Camier, J. The IOCG-Porphyry-Epithermal Continuum in the Great Bear Magmatic Zone, Northwest Territories, Canada: Exploring for Iron Oxide Copper-Gold Deposits: Canada and Global Analogues; Geological Association of Canada: St. John’s, NL, Canada, 2010; pp. 59–78. [Google Scholar]
  5. Richards, J.P.; Mumin, A.H. Magmatic-hydrothermal processes within an evolving Earth: Iron oxide-copper-gold and porphyry Cu±Mo±Au deposits. Geology 2013, 41, 767–770. [Google Scholar] [CrossRef]
  6. Richards, J.P.; Mumin, A.H. Lithospheric fertilization and mineralization by arc magmas: Genetic links and secular differences between porphyry copper ± molybdenum ± gold and magmatic-hydrothermal iron oxide copper-gold deposits. Soc. Econ. Geol. Spec. Publ. 2013, 17, 277–299. [Google Scholar]
  7. Williams, P.J. Classifying IOCG Deposits: Exploring for Iron Oxide Copper–Gold Deposits: Canada and Global Analogues; Geological Association of Canada: St. John’s, NL, Canada, 2010; pp. 11–19. [Google Scholar]
  8. Acosta-Góngora, P.; Gleeson, S.; Samson, I.; Corriveau, L.; Ootes, L.; Taylor, B.E.; Creaser, R.A.; Muehlenbachs, K. Genesis of the Paleoproterozoic NICO iron-oxide-cobalt-gold-bismuth deposit, Northwest Territories, Canada: Evidence from isotope geochemistry and fluid inclusions. Precambrian Res. 2015, 268, 168–193. [Google Scholar] [CrossRef]
  9. Corriveau, L.; Mumin, A.H.; Setterfield, T. IOCG Environments in Canada: Characteristics, Geological Vectors to Ore and Challenges. In Hydrothermal Iron Oxide Copper-Gold and Related Deposits: A Global Perspective, v. 4.; Porter, T.M., Ed.; PGC Publishing: Adelaide, Australia, 2010; pp. 311–344. [Google Scholar]
  10. Corriveau, L.; Montreuil, J.-F.; Potter, E.G. Alteration facies linkages among IOCG, IOA and affiliated deposits in the Great Bear magmatic zone, Canada. In Proterozoic Iron Oxide-Apatite (±REE) and Iron Oxide-Copper-Gold and Affiliated Deposits of Southeast Missouri, USA, and the Great Bear Magmatic Zone, Northwest Territories, Canada; Slack, J., Corriveau, L., Hitzman, M., Eds.; Economic Geology: Littleton, CO, USA, 2016; Volume 111, pp. 2045–2072. [Google Scholar]
  11. Corriveau, L.; Montreuil, J.-F.; Blein, O.; Ehrig, K.; Potter, E.G.; Fabris, A.; Clark, J. Mineral systems with IOCG and affiliated deposits: Part 2—geochemical footprints. In Mineral Systems with Iron Oxide Copper-Gold (IOCG) and Affiliated Deposits; Corriveau, L., Potter, E.G., Mumin, A.H., Eds.; Geological Association of Canada: St. John’s, NL, Canada, 2022; pp. 159–204. [Google Scholar]
  12. Corriveau, L.; Montreuil, J.-F.; Potter, E.G.; Ehrig, K.; Clark, J.; Mumin, A.H.; Williams, P.J. Mineral systems with IOCG and affiliated deposits: Part 1–metasomatic footprints of alteration facies. In Mineral Systems with Iron Oxide Copper-Gold (IOCG) and Affiliated Deposits; Corriveau, L., Potter, E.G., Mumin, A.H., Eds.; Geological Association of Canada: St. John’s, NL, Canada, 2022; pp. 113–158. [Google Scholar]
  13. Hildebrand, R.S. Kiruna-type deposits: Their origin and relationship to intermediate subvolcanic plutons in the Great Bear Magmatic Zone, northwest Canada. Econ. Geol. 1986, 81, 640–659. [Google Scholar] [CrossRef]
  14. Montreuil, J.-F.; Corriveau, L.; Davis, W. Tectonomagmatic evolution of the southern Great Bear magmatic zone (Northwest Territories, Canada)–Implications on the genesis of iron oxide alkali-altered hydrothermal systems. In Proterozoic Iron Oxide-Apatite (±REE) and Iron Oxide-Copper-Gold and Affiliated Deposits of Southeast Missouri, USA, and the Great Bear Magmatic Zone, Northwest Territories, Canada; Slack, J., Corriveau, L., Hitzman, M., Eds.; Economic Geology: Littleton, CO, USA, 2016; Volume 111, pp. 2111–2138. [Google Scholar]
  15. Montreuil, J.-F.; Corriveau, L.; Potter, E.G.; De Toni, A.F. On the relation between alteration facies and metal endowment of iron oxide–alkali-altered systems, southern Great Bear magmatic zone (Canada). In Proterozoic Iron Oxide-Apatite (± REE) and Iron Oxide-Copper-Gold and Affiliated Deposits of Southeast Missouri, USA, and the Great Bear Magmatic Zone, Northwest Territories, Canada; Slack, J., Corriveau, L., Hitzman, M., Eds.; Economic Geology: Littleton, CO, USA, 2016; Volume 111, pp. 2139–2168. [Google Scholar]
  16. Montreuil, J.-F.; Potter, E.; Corriveau, L.; Davis, W.J. Element mobility patterns in magnetite-group IOCG systems: The Fab IOCG system, Northwest Territories, Canada. Ore Geol. Rev. 2016, 72, 562–584. [Google Scholar] [CrossRef]
  17. Montreuil, J.-F. Mobilité des Éléments et Formation de Gîtes Polymétalliques au sein des Systèmes à Oxydes de fer et Altération en Éléments Alcalins, Zone Magmatique du Grand lac de l’Ours, Territoires du Nord-Ouest. Ph.D. Thesis, Université du Québec, Institut National de la Recherche Scientifique, Quebec City, QC, Canada, 2016; 580p. Available online: https://espace.inrs.ca/id/eprint/3347/ (accessed on 8 April 2025).
  18. Mumin, A.H.; Corriveau, L.; Somarin, A.; Ootes, L. Iron oxide copper-gold-type polymetallic mineralization in the Contact Lake belt, Great Bear magmatic zone, Northwest Territories, Canada. Explor. Min. Geol. 2007, 16, 187–208. [Google Scholar] [CrossRef]
  19. Mumin, A.H. Echo Bay IOCG Thematic Map Series: Geology, Structure and Hydrothermal Alteration of a Stratovolcano Complex, Northwest Territories, Canada; Mumin, A.H., Ed.; Geological Survey of Canada: Ottawa, ON, Canada, 2015; Open File 7807; p. 19. [Google Scholar]
  20. Potter, E.G.; Montreuil, J.-F.; Corriveau, L.; Davis, W.J. The Southern Breccia metasomatic uranium system of the Great Bear magmatic zone, Canada: Iron oxide-copper-gold (IOCG) and albitite-hosted uranium linkages. In Ore Deposits: Origin, Exploration, and Exploitation: Geophysical Monograph 242, 1st ed.; Decrée, S., Robb, L., Eds.; John Wiley and Sons Inc.: Hoboken, NJ, USA, 2019; pp. 109–132. [Google Scholar]
  21. Potter, E.G.; Acosta-Gongora, P.; Corriveau, L.; Montreuil, J.-F.; Zhaoping, Y. Uranium Enrichment processes in metasomatic iron oxide copper-gold and iron oxide-apatite deposits. In Mineral Systems with Iron Oxide Copper-Gold (IOCG) and Affiliated Deposits; Corriveau, L., Potter, E.G., Mumin, A.H., Eds.; Geological Association of Canada: St. John’s, NL, Canada, 2022; pp. 325–346. [Google Scholar]
  22. Camier, J. The Sue-Dianne Proterozoic Fe-Oxide Cu-Ag-Au Breccia Complex. Master’s Thesis, University of Western Ontario, London, ON, Canada, 2002; p. 210. [Google Scholar]
  23. Gandhi, S.S. Report on the Geological and Mineral Occurrence Map of the Mazenod Lake-Lou Lake Area, Northwest Territories; Geological Survey of Canada: Ottawa, ON, Canada, 2013; Open File 7546; 44p. [Google Scholar]
  24. Gandhi, S.S.; Montreuil, J.-F.; Corriveau, L. Geology and Mineral Occurrences, Mazenod Lake-Lou Lake Area, Northwest Territories, Geological Survey of Canada, Canadian Geoscience Map 148 (Preliminary); Northwest Territories Geoscience Office: Yellowknife, NT, Canada, 2014; Open Report 2013-004, scale 1:50000. [Google Scholar]
  25. Hamilton, M.S. Geology, Structure and Geochemistry of the Mazenod Lake Volcanic Complex. Master’s Thesis, Brandon University, Brandon, MB, Canada, 2017; p. 232. [Google Scholar]
  26. Hayward, N.; Tschirhart, V. Geophysical Series, Regional Geophysical Compilation Project, Great Bear Magmatic Zone, Northwest Territories and Nunavut, NTS 85 M and N, and 86 C, D, E, F, K and L; Geological Survey of Canada: St. John’s, NL, Canada, 2022; Open File 6835, 2 sheets. [Google Scholar] [CrossRef]
  27. Hetu, R.J.; Homan, P.B.; Charbonneau, B.W.; Prasad, N.; Gandhi, S.S. Airborne Geophysical Survey, Mazenod Lake, NWT; Geological Survey of Canada: St. John’s, NL, Canada, 1994; Open file 2806. [Google Scholar] [CrossRef]
  28. Hildebrand, R.S.; Hoffman, P.F.; Bowring, S.A. Tectono-magmatic evolution of the 1.9-Ga Great Bear magmatic zone, Wopmay Orogen, northwestern Canada. J. Volcanol. Geotherm. Res. 1987, 32, 99–118. [Google Scholar] [CrossRef]
  29. Hoffman, P.F.; Hall, L. Geology, Slave Craton and Environs, District of Mackenzie, Northwest Territories; Geological Survey of Canada: Ottawa, ON, Canada, 1993; Open File 2559, 1 sheet. [Google Scholar]
  30. Jackson, V.A.; van Breemen, O.; Ootes, L.; Bleeker, W.; Bennett, V.; Davis, W.D.; Ketchum, J.; Smar, L. Ages of basement and intrusive phases East of the Wopmay fault zone, south-central Wopmay Orogen, NWT: A field-based U–Pb zircon study. Can. J. Earth Sci. 2013, 50, 979–1006. [Google Scholar] [CrossRef]
  31. Bowring, S.A. U-Pb Zircon Geochronology of Early Proterozoic Wopmay Orogen, NWT Canada: An Example of Rapid Crustal Evolution. Ph.D. Thesis, Kansas University, Lawrence, MA, USA, 1985. [Google Scholar]
  32. Bowring, S.A.; Grotzinger, J.P. Implications of new chronostratigraphy for tectonic evolution of Wopmay Orogen, northwest Canadian Shield. Am. J. Sci. 1992, 292, 1–20. [Google Scholar] [CrossRef]
  33. Bowring, S.A.; Podosek, F.A. Nd isotopic evidence from Wopmay orogen for 2.0–2.4 Ga crust in western North America. Earth Planet. Sci. Lett. 1989, 94, 217–230. [Google Scholar] [CrossRef]
  34. Davis, W.J.; Ootes, L.; Newton, L.; Jackson, V.A.; Stern, R.A. Characterization of the Paleoproterozoic Hottah terrane, Wopmay Orogen using multiisotopic (U–Pb, Hf and O) detrital zircon analyses: An evaluation of linkages to northwest Laurentian Paleoproterozoic domains. Precambrian Res. 2015, 269, 296–310. [Google Scholar] [CrossRef]
  35. Gandhi, S.S.; Breemen, O.V. SHRIMP U-Pb geochronology of detrital zircons from the Treasure Lake Group new evidence for Paleoproterozoic collisional tectonics in the southern Hottah terrane, northwestern Canadian Shield. Can. J. Earth Sci. 2005, 42, 833–845. [Google Scholar] [CrossRef]
  36. Gandhi, S.S.; Mortensen, J.; Prasad, N.; Breemen, O.V. Magmatic evolution of the southern Great Bear continental arc, northwestern Canadian Shield: Geochronological constraints. Can. J. Earth Sci. 2011, 38, 767–785. [Google Scholar] [CrossRef]
  37. Housh, T.; Bowring, S.A.; Villeneuve, M. Lead isotopic study of early Proterozoic Wopmay Orogen, NW Canada: Role of continental crust in arc magmatism. J. Geol. 1989, 97, 735–747. [Google Scholar] [CrossRef]
  38. Jackson, V.A.; Ootes, L. Preliminary geologic map of the south-central Wopmay Orogen (parts of NTS 86B, 86C, and 86D). In Results from 2009 to 2011: NWT Open Report 2012-004, 1 Map, 1:100,000 Scale; NWT Geoscience Office: Yellowknife, NT, Canada, 2012. [Google Scholar]
  39. Ootes, L.; Davis, W.J.; Jackson, V.A.; van Breemen, O.; Corfu, F. Chronostratigraphy of the Hottah terrane and Great Bear magmatic zone of Wopmay Orogen, Canada, and exploration of a terrane translation model. Can. J. Earth Sci. 2015, 52, 1062–1092. [Google Scholar] [CrossRef]
  40. Bennett, V.; Rivers, T. U-Pb Ages of Zircon Primary Crystallization and Inheritance for Magmatic Rocks of the Southern Wopmay Orogen, Northwest Territories; Northwest Territories Geoscience Office: Yellowknife, NT, Canada, 2006; NWT Open Report 2006; 64p. [Google Scholar]
  41. Mumin, A.H.; Phillips, A.; Katsuragi, C.J.; Mumin, A.; Ivanov, G. Geotectonic Interpretation of the Echo Bay Stratovolcano Complex, Northern Great Bear Magmatic Zone, NWT, Canada; Northwest Territories Geoscience Office, NWT: Yellowknife, NT, Canada, 2014; p. 25. [Google Scholar]
  42. Davis, W.J.; Corriveau, L.; van Breemen, O.; Bleeker, W.; Montreuil, J.-F.; Potter, E.; Pelleter, E. Timing of IOCG mineralising and alteration events within the Great Bear magmatic zone [abs.]. In Proceedings of the 39th Annual Yellowknife Geoscience Forum Abstracts, Yellowknife, NT, Canada, 15–17 November 2011; Fischer, B.J., Watson, D.M., Eds.; Northwest Territories Geoscience Office: Yellowknife, NT, Canada, 2011; Volume 2011, p. 97. [Google Scholar]
  43. Hayward, N.; Corriveau, L. Fault reconstructions using aeromagnetic data in the Great Bear magmatic zone, Northwest Territories, Canada. Can. J. Earth Sci. 2014, 51, 927–942. [Google Scholar] [CrossRef]
  44. Hildebrand, R.S.; Hoffman, P.F.; Bowring, S.A. The Calderian orogeny in Wopmay orogen (1.9 Ga), northwestern Canadian Shield. Geol. Soc. Am. Bull. 2010, 122, 794–814. [Google Scholar] [CrossRef]
  45. Ootes, L.; Snyder, D.; Davis, W.J.; Acosta-Góngora, P.; Corriveau, L.; Mumin, A.H.; Gleeson, S.A.; Samson, I.A.; Montreuil, J.-F.; Potter, E.; et al. A Paleoproterozoic Andean-type iron oxide copper-gold environment, the Great Bear magmatic zone, Northwest Canada. Ore Geol. Rev. 2017, 81, 123–139. [Google Scholar] [CrossRef]
  46. Gandhi, S.S.; Mortensen, J.K.; Prasad, N.; van Breeman, O. U-Pb geochronology of the southern Great Bear magmatic zone and its implications to the metallogenic evolution. Extended abstract. In Proceedings of the Yellowknife Geoscience Forum, Yellowknife, NT, Canada, 25–27 November 1998. [Google Scholar]
  47. Corriveau, L.; Montreuil, J.-F.; De Toni, A.F.; Potter, E.G.; Percival, J.B. Mapping mineral systems with IOCG and affiliated deposits: A facies approach. In Mineral Systems with Iron Oxide Copper-Gold (IOCG) and Affiliated Deposits; Corriveau, L., Potter, E.G., Mumin, A.H., Eds.; Geological Association of Canada: St. John’s, NL, Canada, 2022; pp. 69–111. [Google Scholar]
  48. Corriveau, L.; Montreuil, J.-F.; Potter, E.G.; Blein, O.; De Toni, A.F. Mineral systems with IOCG and affiliated deposits: Part 3–metal pathways and ore deposit model. In Mineral Systems with Iron Oxide Copper-Gold (IOCG) and Affiliated Deposits; Corriveau, L., Potter, E.G., Mumin, A.H., Eds.; Geological Association of Canada: St. John’s, NL, Canada, 2022; pp. 205–245. [Google Scholar]
  49. Bennett, V.; Rivers, T. U-Pb Ages of Detrital Zircons from the Southern Wopmay Orogen, Northwest Territories; Northwest Territories Geoscience Office: Yellowknife, NT, Canada, 2006; NWT Open Report 2006; 29p. [Google Scholar]
  50. Bennett, V.; Rivers, T.; Jackson, V. A Compilation of U-Pb Zircon Preliminary Crystallization and Depositional Ages from the Paleoproterozoic Southern Wopmay Orogen, Northwest Territories; NWT Geoscience Office: Yellowknife, NT, Canada, 2012; NWT Open Report 2012; 172p. [Google Scholar]
  51. Montreuil, J.-F.; Corriveau, L.; Potter, E.G. Formation of albitite-hosted uranium within IOCG systems: The Southern Breccia, Great Bear magmatic zone, Northwest Territories, Canada. Miner. Depos. 2015, 50, 293–325. [Google Scholar] [CrossRef]
  52. Pearce, J.A.; Harris, N.B.W.; Tindle, A.G. Trace element discrimination diagrams for the tectonic interpretation of granitic rocks. J. Petrol. 1984, 25, 956–983. [Google Scholar] [CrossRef]
  53. Corriveau, L.; Williams, P.J.; Mumin, H. Alteration Vectors to IOCG Mineralization–from Uncharted Terranes to Deposits. In Exploring for Iron Oxide Copper-Gold Deposits: Canada and Global Analogues; Corriveau, L., Mumin, A.H., Eds.; Geological Association of Canada: St. John’s, NL, Canada, 2010; Add SCN 20; pp. 89–110. [Google Scholar]
  54. Pearce, J.A. A User’s Guide to Basalt Discrimination Diagrams: Trace Element Geochemistry of Volcanic Rocks: Applications for Massive Sulphide Exploration; Geological Association of Canada: St. John’s, NL, Canada, 1996; Volume 12, 113p. [Google Scholar]
  55. Corriveau, L.; Lauzière, K.; Montreuil, J.-F.; Potter, E.G.; Hanes, R.; Prémont, S. Dataset of Geochemical Data from Iron Oxide Alkali-Altered Mineralizing Systems of the Great Bear Magmatic Zone (NWT); Geological Survey of Canada: Ottawa, ON, USA, 2015; p. 19. [Google Scholar]
  56. Corriveau, L.; Mumin, A.H.; Potter, E.G. Iron oxide copper-gold (Ag-Bi-Co-U-REE) and affiliated deposits: Introduction and overview. In Mineral Systems with Iron Oxide Copper-Gold (IOCG) and Affiliated Deposits; Corriveau, L., Potter, E.G., Mumin, A.H., Eds.; Geological Association of Canada: St. John’s, NL, Canada, 2022; pp. 1–25. [Google Scholar]
  57. Montreuil, J.-F.; Corriveau, L.; Grunsky, E.C. Compositional data analysis of IOCG systems, Great Bear magmatic zone, Canada: To each alteration type its own geochemical signature: Geochemistry. Explor. Environ. Anal. 2013, 13, 229–247. [Google Scholar] [CrossRef]
  58. Baker, T. Alteration, mineralization, and fluid evolution at the Eloise Cu-Au deposit, Cloncurry District, northwest Queensland, Australia. Econ. Geol. 1998, 93, 1213–1236. [Google Scholar] [CrossRef]
  59. De Toni, A.F. Les Paragénèses à Magnétite des Altérations Associées aux Systèmes à Oxydes de fer et Altérations en Éléments Alcalins, Zone Magmatique du Grand lac de l’Ours. Master’s Thesis, Institut national de la Recherche Scientifique, Québec City, QC, Canada, 2016; 534p. [Google Scholar]
  60. Fabris, A. Geochemical characteristics of IOCG deposits: Examples from the Olympic Copper-Gold Province, South Australia. In Mineral Systems with Iron Oxide Copper-Gold (IOCG) and Affiliated Deposits; Corriveau, L., Potter, E.G., Mumin, A.H., Eds.; Geological Association of Canada: St. John’s, NL, Canada, 2022; pp. 247–262. [Google Scholar]
  61. Groves, D.I.; Bierlein, F.P.; Meinert, L.D.; Hitzman, M. Iron oxide copper-gold (IOCG) deposits through Earth history: Implications for origin, lithospheric setting, and distinction from other epigenetic iron oxide deposits. Econ. Geol. 2010, 105, 641–654. [Google Scholar] [CrossRef]
  62. Hildebrand, R.S.; Bowring, S. Geology of parts of the Calder River map area, central Wopmay orogen, District of Mackenzie. Curr. Res. Part C Geol. Surv. Can. 1988, 199–205. [Google Scholar]
  63. Hitzman, M.W. Iron oxide Cu-Au deposits: What, where, when, and why? In Hydrothermal Iron Oxide Copper-Gold & Related Deposits: A Global Perspective; Porter, T.M., Ed.; Australian Mineral Foundation: Adelaide, Australia, 2000; Volume 1, pp. 201–218. [Google Scholar]
  64. Hitzman, M.W.; Oreskes, N.; Einaudi, M.T. Geological characteristics and tectonic setting of Proterozoic iron oxide (Cu-U-Au-REE) deposits. Precambrian Res. 1992, 58, 241–287. [Google Scholar] [CrossRef]
  65. Kelly, C.J.; Davis, W.J.; Potter, E.G.; Corriveau, L. Geochemistry of hydrothermal tourmaline from IOCG occurrences in the Great Bear magmatic zone: Implications for fluid source(s) and fluid composition evolution. Ore Geol. Rev. 2020, 118, 103329. [Google Scholar] [CrossRef]
  66. Montreuil, J.F.; Corriveau, L.; Blein, O.; Ehrig, K.; Hofstra, A.; Lisitsin, V.; Belperio, A.; Schlegel, T.; Mansur, E.; Conliffe, J.; et al. Distribution of alteration facies, deposit types, metals, and critical minerals in metasomatic iron and alkali-calcic (MIAC) mineral systems: Geological Association of Northern Shield: New Perspectives from the Geo-Mapping for Energy and Minerals Meeting. Abstracts 2022, 45, 160–161. [Google Scholar]
  67. Mumin, H.; Richards, J.P. Subduction-modified lithosphere as a source for a spectrum of distal-to post-subduction magmatic-hydrothermal Cu-Au-Mo-Fe deposits. In Porphyries to IOCGs, Geological Society of America, Charlotte, North Carolina, 2012, Annual Meeting, Abstracts with Programs, Paper no. 213-6. 2012. Available online: https://gsa.confex.com/gsa/2012AM/webprogram/Paper205374.html (accessed on 8 April 2025).
  68. Porter, T.M. Hydrothermal Iron Oxide Copper-Gold and Related Deposits: A Global Perspective; Australian Mineral Foundation: Adelaide, Australia, 2000; p. 349. [Google Scholar]
  69. Sillitoe, R.H. Iron oxide-copper-gold deposits: An Andean view. Miner. Depos. 2003, 38, 787–812. [Google Scholar] [CrossRef]
  70. Skirrow, R. “Hematite-group” IOCG ± U ore systems: Tectonic settings, hydrothermal characteristics, and Cu-Au and U mineralizing processes. In Exploring for Iron Oxide Copper-Gold Deposits: Canada and Global Analogues; Corriveau, L., Mumin, A.H., Eds.; Geological Association of Canada: St. John’s, NL, Canada, 2010; pp. 39–57. [Google Scholar]
  71. Skirrow, R.G. Iron oxide copper-gold (IOCG) deposits–A review (part 1): Settings, mineralogy, ore geochemistry and classification. Ore Geol. Rev. 2022, 140, 104569. [Google Scholar] [CrossRef]
  72. Skirrow, R.G. Hematite-group IOCG ± U deposits: An update on their tectonic settings, hydrothermal characteristics, and Cu-Au-U mineralizing processes. In Mineral Systems with Iron Oxide Copper-Gold (IOCG) and Affiliated Deposits; Corriveau, L., Potter, E.G., Mumin, A.H., Eds.; Geological Association of Canada: St. John’s, NL, Canada, 2022; Volume 52, pp. 27–51. [Google Scholar]
  73. Williams, P.J.; Barton, M.D.; Johnson, D.A.; Fontboté; L; de Haller, A.; Mark, G.; Oliver, N.H.S.; Marschik, R. Iron-Oxide Copper-Gold Deposits: Geology, Space-Time Distribution, and Possible Modes of Origin: Economic Geology 100th Anniversary; Society of Economic Geologists: Littleton, CO, USA, 2005; pp. 371–405. [Google Scholar]
  74. Grant, J.A. The Isocon Diagram–A simple solution to Gresens’ equation for metasomatic alteration. Econ. Geol. 1986, 81, 1976–1982. [Google Scholar] [CrossRef]
  75. Grant, J.A. Isocon analysis: A brief review of the method and applications. Phys. Chem. Earth Parts A/B/C 2005, 30, 97–1004. [Google Scholar] [CrossRef]
  76. Gresens, R.L. Composition-volume relationships in metasomatism. Chem. Geol. 1967, 2, 47–55. [Google Scholar] [CrossRef]
  77. Mumin, A. Tectonic and Structural Controls on Massive Sulfide Deposition in the South Sturgeon Lake Volcanic Pile, Northwestern Ontario and Hydrothermally Altered Rocks Associated with the Lyon Lake Archean Volcanogenic Massive Sulfide Ore deposits, Sturgeon Lake. Master’s Thesis, University of Toronto, Toronto, ON, Canada, 1988. [Google Scholar]
  78. Ishikawa, Y.; Sawaguchi, S.; Iwaya, H.M. Delineation of prospecting targets for Kuroku deposits based on modes of volcanism of underlying dacite and alteration haloes. Min. Geol. 1976, 26, 105–117. [Google Scholar]
  79. Acosta-Góngora, P.; Gleeson, S.; Samson, I.; Corriveau, L.; Ootes, L.; Jackson, S.E.; Taylor, B.E.; Girard, I. Origin of sulfur and crustal recycling of copper in polymetallic (Cu-Au-Co-Bi-U ± Ag) iron-oxide-dominated systems of the Great Bear magmatic zone, NWT, Canada. Miner. Depos. 2018, 53, 353–376. [Google Scholar] [CrossRef]
  80. Gandhi, S.S.; Halliday, D. Gravity Survey of the Sue-Dianne Deposit, Northwest Territories; Geological Survey of Canada: Ottawa, ON, Canada, 1993; p. 93-1E. [Google Scholar]
  81. Kreiner, D.; Barton, M.D. Sulfur-poor intense acid hydrothermal alteration: A distinctive hydrothermal environment. Ore Geol. Rev. 2017, 88, 174–187. [Google Scholar] [CrossRef]
  82. Gandhi, S.S.; Potter, E.G.; Fayek, M. New constraints on genesis of the polymetallic veins at Port Radium, Great Bear Lake, Northwest Canadian Shield. Ore Geol. Rev. 2018, 96, 28–47. [Google Scholar] [CrossRef]
  83. Somarin, A.K.; Mumin, A.H. The Paleoproterozoic high heat production Richardson granite, Great Bear magmatic zone, Northwest Territories, Canada: Source of U for Port Radium? Resour. Geol. 2012, 62, 227–242. [Google Scholar] [CrossRef]
  84. Hayward, N. 3D Magnetic Inversion of Mineral Prospects in the Great Bear Magmatic Zone, NT, Canada. Geological Survey of Canada: St. John’s, NL, Canada, 2013. [Google Scholar]
  85. Hayward, N.; Skirrow, R.G. Geodynamic setting and controls on iron oxide Cu-Au (±U) Ore in the Gawler Craton, South Australia. In Hydrothermal Iron Oxide Copper-Gold and Related Deposits: A Global Perspective-Advances in the Understanding of IOCG Deposits; Porter, T.M., Ed.; PGC Publishing: Adelaide, Australia, 2010; Volume 3, pp. 119–146. [Google Scholar]
  86. Hayward, N.; Corriveau, L.; Craven, J.A.; Enkin, R.J. Geophysical signature of the NICO Au-Co-Bi-Cu deposit and its iron oxide-alkali alteration system, Northwest Territories, Canada. In Proterozoic Iron Oxide-Apatite (± REE) and Iron Oxide-Copper-Gold and Affiliated Deposits of Southeast Missouri, USA, and the Great Bear Magmatic Zone, Northwest Territories, Canada; Slack, J., Corriveau, L., Hitzman, M., Eds.; Economic Geology: Littleton, CO, USA, 2016; Volume 111, pp. 2087–2110. [Google Scholar]
  87. Jebrak, M. Use of breccias in IOCG(U) exploration. In Exploring for Iron Oxide Copper-Gold Deposits: Canada and Global Analogues; Corriveau, L., Mumin, A.H., Eds.; Geological Association of Canada: St. John’s, NL, Canada, 2010; pp. 79–88. [Google Scholar]
  88. Jebrak, M. Use of breccias in IOCG exploration: An Updated Review. In Mineral Systems with Iron Oxide Copper-Gold (IOCG) and Affiliated Deposits; Corriveau, L., Potter, E.G., Mumin, A.H., Eds.; Geological Association of Canada: St. John’s, NL, Canada, 2022; pp. 315–324. [Google Scholar]
  89. Richards, J.P.; Lopez, G.P.; Zhu, J.; Creaser, R.A.; Locock, A.J.; Mumin, A.H. Contrasting tectonic settings and sulfur contents of magmas associated with Cretaceous porphyry Cu + Mo + Au and intrusion-related iron oxide Cu-Au deposits in northern Chile. Econ. Geol. 2017, 112, 295–318. [Google Scholar] [CrossRef]
  90. Hildebrand, R.S.; Bowring, S.A. Continental intra-arc depressions: A nonextensional model for their origin, with a Proterozoic example from Wopmay orogen. Geology 1984, 12, 73–77. [Google Scholar] [CrossRef]
  91. Hoffman, P.F. Wopmay orogen: A Wilson Cycle of early Proterozoic age in the northwest of the Canadian Shield. In The Continental Crust and Its Mineral Resources; Strangway, D.W., Ed.; Geological Association of Canada: St. John’s, NL, Canada, 1980; Volume 20, pp. 523–549. [Google Scholar]
  92. Hoffman, P.F.; Bowring, S.A. Short-lived 1.9 Ga continental margin and its destruction, Wopmay orogen, northwest Canada. Geology 1984, 12, 68–72. [Google Scholar] [CrossRef]
  93. Jara, J.J.; Barra, F.; Reich, M.; Leisen, M.; Romero, R.; Morata, D. Episodic construction of the early Andean Cordillera unravelled by zircon petrochronology. Nat. Commun. 2021, 12, 4930. [Google Scholar] [CrossRef] [PubMed]
  94. Seymour, N.M.; Singleton, J.S.; Mavor, S.P.; Gomila, R.; Stockli, D.F.; Heuser, G.; Arancibia, G. The relationship between magmatism and deformation along the intra-arc strike-slip Atacama fault system, northern Chile. Tectonics 2020, 39, e2019TC005702. [Google Scholar] [CrossRef]
  95. Tornos, F.; Hanchar, J.M.; Munizaga, R.; Velasco, F.; Galindo, C. The role of the subducting slab and melt crystallization in the formation of magnetite-(apatite) systems, Coastal Cordillera of Chile. Miner. Depos. 2021, 56, 253–278. [Google Scholar] [CrossRef]
  96. Hayward, N.; Tschirhart, V. A Comparison of 3-D Inversion Strategies in the Investigation of the 3-D Density and Magnetic Susceptibility Distribution in the Great Bear Magmatic Zone, Northwest Territories; Geological Survey of Canada: St. John’s, NL, Canada, 2023; Open File 8985; 18p. [Google Scholar] [CrossRef]
  97. Shatwell, D. Adjacent Iron Oxide-Apatite and Iron Oxide Copper-Gold Mineralization in the Acarí District, Peru. Magmat. Hydrothermal Transit. SEG Discov. 2023, 133, 19–27. [Google Scholar] [CrossRef]
  98. Hennessey, B.T.; Puritch, E. A Technical Report on a Mineral Resource Estimate for the Sue-Dianne Deposit, Mazenod Lake area, Northwest Territories, Canada: Fortune Minerals Limited, NI 43-101 Technical Report, 2008. 125p. Available online: www.sedar.com (accessed on 8 March 2021).
  99. Putnis, A.; Hinrichs, R.; Putnis, C.V.; Golla-Schindler, U.; Collins, L.G. Hematite in porous red-clouded feldspars: Evidence of large-scale crustal fluid–rock interaction. Lithos 2007, 95, 10–18. [Google Scholar] [CrossRef]
  100. Corriveau, L.; Ootes, L.; Mumin, H.; Jackson, V.; Bennett, V.; Cremer, J.; Rivard, B.; McMartin, I.; Beaudoin, G. Alteration vectoring to IOCG (U) deposits in frontier volcano-plutonic terrains, Canada. In Proceedings of the Exploration 07: Fifth Decennial International Conference on Mineral Exploration, Toronto, ON, Canada, 9–12 December 2007; pp. 1171–1177. [Google Scholar]
  101. Corriveau, L.; Mumin, A.H. Exploring for iron oxide copper–gold deposits: The need for case studies, classifications and exploration vectors. In Exploring for Iron Oxide Copper-Gold Deposits: Canada and Global Analogues; Corriveau, L., Mumin, A.H., Eds.; Geological Association of Canada: St. John’s, NL, Canada, 2010; pp. 1–12. [Google Scholar]
  102. Normandeau, P.X.; Harlov, D.E.; Corriveau, L.; Paquette, J.; McMartin, I. Characterization of fluorapatite within iron oxide alkali-calcic alteration systems of the Great Bear magmatic zone: A potential metasomatic process record. Can. Mineral. 2018, 56, 1–21. [Google Scholar] [CrossRef]
  103. Sappin, A.-A.; Dupuis, C.; Beaudoin, G.; Pozza, M.; McMartin, I.; McClenaghan, M.B. Optimal ferromagnetic fraction of iron oxides in till samples along ice-flow paths: Case studies from the Sue-Dianne and Thompson deposits, Canada. Geochem. Explor. Environ. Anal. 2014, 14, 315–329. [Google Scholar] [CrossRef]
  104. Shives, R.B.K.; Charbonneau, B.W.; Ford, K.L. The detection of potassic alteration by gamma-ray spectrometry–Recognition of alteration related to mineralization. Geophysics 2000, 65, 2001–2011. [Google Scholar] [CrossRef]
  105. Sidor, M. The Origin of Black Rock Alteration Overprinting Iron-Rich Sediments and Its Genetic Relationship to Disseminated Polymetallic Ores, Lou Lake, Northwest Territories, Canada. Unpublished Master’s Thesis, University of Western Ontario, London, ON, Canada, 2000; 243p. [Google Scholar]
  106. Somarin, A.K.; Mumin, A.H. P–T-composition and evolution of paleofluids in the Paleoproterozoic Mag Hill IOCG hydrothermal system, Contact Lake belt, Northwest Territories, Canada. Miner. Depos. 2014, 49, 199–215. [Google Scholar] [CrossRef]
Figure 2. Geology and location map, Mazenod (northern) and Bea (southern) areas, NWT, Canada.
Minerals 15 00726 g002
Figure 3. Geology of the central Mazenod Lake region, NWT, Canada [32].
Minerals 15 00726 g003
Figure 4. Geology detail for the Dan Island region, Mazenod Lake, NWT, Canada.
Minerals 15 00726 g004
Figure 5. Geology of the Bea Lake region, Mazenod Lake, NWT, Canada.
Minerals 15 00726 g005
Figure 6. Outcrop photographs of selected volcaniclastic rocks. (a) Cross-bedding in arkosic siltstones and cherty tuffs; (b) interbedded tuffaceous unit of very fine-grained ash and mud (f.o.v. ~40 cm); (c) right-laterally offset and deformed thin-bedded sediment; (d) well-bedded, magnetic, matrix-supported conglomerate (f.o.v. ~18 cm); (e) volcaniclastic sediments with graded bedding; (f) well-bedded volcanic ash layering.
Minerals 15 00726 g006
Figure 7. Intrusive rocks from the Mazenod District. (a) Sarah granite near Mazenod Ridge, with a phyllic overprint; (b) diorite from Dan Island showing both a weathered surface and a fresh surface on broken rock (f.o.v. ~60 cm); (c) monzodiorite porphyry with a potassic overprint (f.o.v. ~15 cm); (d) subvolcanic porphyritic monzodiorite with an orange hue typical of many rocks at Mazenod; (e) diorite dyke cutting fine-grained layered ash tuff; (f) monzogranite, a marginal phase of the Marion River Batholith. Marquis is 5 mm wide.
Minerals 15 00726 g007
Figure 8. Rocks of the Sue–Dianne deposit area. (a) Surface rubble with potassic and hematite-altered rhyodacite ignimbrite fracture breccia with abundant malachite (f.o.v. ~0.95 m); (b) typical magnetite-hematite-chalcopyrite intergrowth of the central diatreme. Hematite (light grey) replacing magnetite (beige) during retrograde mineralization. Chalcopyrite yellow (f.o.v. ~1.0 mm); (c) upper part of porphyry stock with moderate potassic alteration; (d) deeper section of the porphyry intrusion with albite alteration; (e,f) micropegmatitic enclaves in Marion River Batholith monzogranite. Shattered feldspar with chlorite-epidote vein and fracture fill and moderate hematite overprint. Marquis in (cf) is 5 mm across.
Minerals 15 00726 g008
Figure 9. Rocks of the Sue–Dianne deposit area. (a) Welded ignimbrite tuff with fiamme; (b) basal ignimbrite flow breccia with incipient potassic alteration of pyroclastic tuff-breccia; (c) pitchblende with secondary uranophane and malachite in hematitic breccia; (d) hematite-cemented diatreme breccia with angular to sub-rounded potassically altered ignimbrite clasts (f.o.v. ~12 cm); (e) copper-rich breccia with potassically altered ignimbrite clasts in a matrix of magnetite, hematite, chlorite, epidote, fluorite, garnet, chalcopyrite, and pyrite; (f) deep diatreme breccia with potassically altered ignimbrite clasts in a magnetite matrix. Late-stage quartz–epidote overprint. Marquis is 5 mm across (f.o.v. ~3.3 cm).
Minerals 15 00726 g009
Figure 10. Rocks of the Nod Hill region. (a) South lobe of Nod Hill looking south. Example of part of a crustal-scale fault showing an ~200 m wide section of the Kemaz structural corridor with multiple subparallel NE-trending faulting and shearing. The exposed part of the Kemaz structural corridor at Nod Hill is ~600 m wide, which is only a portion of the greater structure; (b) ignimbrite felsite at Nod Hill (geologist, partially hidden, for scale); (c,d) magnetite–actinolite ± quartz stockwork and breccia cutting albite (sodic) altered ignimbrite; (e) drill core from the Mazenod skarn showing: (i, ii and vi) actinolite–magnetite–pyroxene–garnet–alkali-feldspar ± chalcopyrite ± pyrite skarn, (iii, iv and v) variations on paleoweathering or hematite alteration of the Mazenod skarn. The paper is 7.5 cm wide; (f) ignimbrite breccia with K–feldspar-altered clasts.
Minerals 15 00726 g010
Figure 11. Rocks from the Dan Island region. (a) Dan Island, 1 = andesite crystal tuff, 2 = felsite cap, 3 = volcanic bomb breccia, 4 = tourmaline crackle breccia, 5 = hematite stockwork, 6 = large blocky ignimbrite boulder or scree deposit similar to the blocky breccia that overlies part of the Sue–Dianne deposit (f.o.v. ~600 m); (b) large volcanic bomb with cooling rings; (c) blocky ignimbrite boulder deposit (f.o.v. ~80 cm); (d) orbicular breccia at fault junction with epidote overprinting potassically altered andesite ignimbrite; (e) tourmaline crackle breccia in K–feldspar- and albite-altered rhyodacite; (f) tourmaline-cemented vein breccia (Bea area).
Minerals 15 00726 g011
Figure 12. (a) Mar magnetite-cemented breccia with albite-rich clasts and late epidote–quartz veins; (b) magnetite vein breccia cutting alkali feldspar-altered ignimbrite at Nod Hill; (c) contact between monzodiorite and crystal tuff, both with strong potassic alteration; (d) lapilli tuff altered to felsite with hematite dusting and veining, with ghost lapilli visible at point of scribe; (e) lamprophyre dike; (f) subparallel magnetite veining with albitic haloes around veins. Host is ash tuff.
Minerals 15 00726 g012
Figure 13. (a) Porphyritic andesite; (b) rhyodacite crystal tuff with fiamme, Mazenod Lake region; (c) Jasper veins; (d) bleached albite alteration along veins in crystal tuff; (e) epidote stockwork as veins and replacement of fine ash tuff sequence; (f) part of a large epidote stockwork in K–feldspar-altered andesite from the Mazenod peak area.
Minerals 15 00726 g013
Figure 14. Quartz complexes in the Mazenod region. (a) Mazenod Ridge and Crystal Mountain (background) quartz complexes (whitish material). Both strike NE. North and NW structures cut across the middle of Mazenod Ridge. Distance in photo between Mazenod Ridge and Crystal Mountain is ~4.1 km; (b) the giant quartz complex at Mazenod Ridge at the contact between Sarah granite and ignimbrite. Dan Island in the background; (c) pervasive silicification with an orthogonal quartz stockwork that mimics regional structural patterns; (d) close-up of quartz lattice stockwork with possible boiling textures; (e) quartz ± epidote stockwork that envelopes the Sue–Dianne deposit; (f) vent tube in massive quartz at Crystal Mountain. Vent tubes range in size from cm-scale in diameter to the 2 m tube shown here. This is evidence for near-surface formation.
Minerals 15 00726 g014
Figure 15. Volcanic rock discrimination diagram [54], with all volcanic rock samples plotted (n = 711). Vertical axis = Zr/Ti; horizontal axis = Nb/Y, logarithmic scale. The plot shows a continuum of compositions ranging from rhyodacite to basaltic andesite. Rocks from the same formation are grouped together according to their dominant characteristics and are divided into rhyodacite, dacite, andesite, and basaltic andesite. Two distinct groupings of rhyodacite are indicated. Blue = rhyodacite; orange = dacite; red = andesite; green = basaltic andesite.
Minerals 15 00726 g015
Figure 16. Potassic alteration intensity distribution map (Potassic RAI I) according to the Potassic Residual Alteration Index. Alteration as shown is the minimum possible. Pervasive potassic alteration is believed to have affected the least altered rocks, thereby reducing the relative intensity of the alteration shown. Potassic highs are centered around Dan Island, with less intense highs in the NOD area and in the northern part of the Bea area (southern part of map).
Minerals 15 00726 g016
Figure 17. Alkali metal Residual Alteration Index (Potassic RAI II) intensity distribution map. The most intense alteration occurs around and north of Dan Island, and, to a lesser extent, in the northern part of the Bea Lake area (southern map area).
Minerals 15 00726 g017
Figure 18. Sodium alteration intensity distribution map according to the Sodium Enrichment Residual Alteration Index. Sodium enrichment occurs at the north end and north of the Nod prospect, and, to a lesser degree, in the southernmost (Bea) map area. Sodium depletion occurs with the pervasive potassic alteration of the region.
Minerals 15 00726 g018
Figure 19. Iron alteration intensity distribution map according to the Iron Enrichment Residual Alteration Index. Fe enrichment is plotted assuming that aluminum is immobile. Moderate iron enrichment occurs sporadically throughout the sampled areas.
Minerals 15 00726 g019
Figure 20. Silica enrichment intensity distribution map according to the Silica Residual Alteration Index. Silica enrichment is plotted assuming that aluminum is immobile. Patchy minor-to-moderate enrichments are noted throughout the sampled area. The plot does not include the giant quartz complexes at Mazenod Ridge (Net) and Crystal Mountain (Dianne Lake fault).
Minerals 15 00726 g020
Figure 21. Mass balance plots showing metal enrichments and depletions during hydrothermal alteration of host rocks from the Mazenod region. Elements plotting above the isocon are enriched and elements plotting below the isocon are depleted. (a) Plot for potassically altered andesite; (b) plot for sodically altered andesite; (c) plot for moderately K–feldspar-altered rhyodacite invaded by magnetite crackle breccia; (d) plot for K–feldspar-altered rhyodacite from the Sue–Dianne deposit area, after Camier [22]; (e) plot showing elemental gains and losses within the Sue–Dianne mineralized diatreme breccia hosted by rhyodacite ignimbrite, after Camier [22].
Minerals 15 00726 g021aMinerals 15 00726 g021bMinerals 15 00726 g021c
Figure 22. Mineral paragenesis chart for the Sue–Dianne breccia complex. Seven distinct stages of mineral formation from primary igneous rocks to recent weathering are distinguished based on petrographic studies. Width of line indicates relative abundance. Modified from Camier [22].
Minerals 15 00726 g022
Figure 23. Schematic cross-section through the Sue–Dianne deposit. Modified from Camier [22] and Goad et al. [3].
Minerals 15 00726 g023
Figure 24. Magnetic lineaments in the Mazenod region based on the measured vertical magnetic gradient. Seven distinct tectonic blocks are distinguished with several smaller blocks. Most blocks are the result of right-lateral displacement along northeast-trending faults. High magnetic susceptibility in rocks is caused mainly by the presence of magnetite. Most magnetite alteration predates the final stages of northeast right-lateral displacement. The most prominent magnetic low lineaments correlate with northeast-trending faults. The northernmost Dianne Lake northeast fault hosts the Sue–Dianne deposit and Crystal Mountain quartz complex. Other northeast faults host the Dan prospect and Mazenod Ridge quartz complex. Northwest-trending lineaments largely correlate with stratigraphic layering and former belt-parallel structures.
Minerals 15 00726 g024
Figure 25. Topographic lineament analysis based on 0.5 m resolution GeoEye 1 satellite imagery. Topographic lineaments dominantly reflect geological structures, and, to a lesser degree, stratigraphic bedding planes and hydrothermal alteration. Hydrothermal alteration patterns are themselves largely controlled by structural and stratigraphic features. First-order lineaments are largely northeast-trending; second-order lineaments are mostly east-west-to-east-of-northeast-trending; and third-order features dominantly reflect northeast-to-east-west-trending structures. A broad pattern of radial lineaments surrounding the central Bea area may reflect a large underlying intrusion. Magnetic lineaments, topographic lineaments, and geological mapping corroborate each other and all show the same geotectonic structural patterns throughout the Mazenod region.
Minerals 15 00726 g025
Table 1. General element mobility for hydrothermally altered rocks in the Mazenod Lake region. Mobility can be variable, and rocks are often overprinted by more than one stage of alteration. Element mobility is based on mass balance calculations [25,74,76]. Pervasive and early potassic alteration may result in spurious K2O enrichment and/or Na2O depletion.
Alteration TypeTypical Mineral AssemblagesImmobile
Elements
Mobile Elements
Major Element OxidesMinor and Trace Elements
EnrichedDepletedEnrichedDepleted
Sodic2Albite ± Magnetite ± ActinoliteAl2O3, TiO2, Ta, Zr, HfNa2OK2O, CaO, MnOCr, Sn, Bi, As
Au, Cu
Rb, Zn, Cs, Sr, Mo, Pb
W, Sb
MAMagnetite ± ActinoliteAl2O3, TiO2, SiO2, Zr, Hf, Tl, Ta, HREEsNa2O
± Fe2O3
K2O, MgO, MnOSn, As, Cr, CeCs, Zn, Sr, Cd, Be
Potassic Mazenod RegionK–feldspar ± Biotite ± MagnetiteAl2O3, Fe2O3, TiO2, SiO2, ZrK2O
± Fe2O3
Na2O, CaO, MgO, MnOBa, Cr, Rb, Te, Th, U,
W, Sn,
As, Au, Bi
Be, HREEs, Mo, Nb, Nd, Ni, Pb, Sc, Sr, Zn
Potassic
Sue–Dianne Deposit halo
Al2O3, TiO2, Zr, Ce, EuK2O, CaO,
MgO, Fe2O3
Na2O, P2O5Cu, Co, U, Zn, Pb, V, La, Rb, Ba, Tl, NiCs, Sr, Ta, REEs, Y
TourmalineTourmaline ± QuartzAl2O3, TiO2, Zr, U, Th, Se, Ta, TlK2O, SiO2, Fe2O3Na2O, CaO, MnO, MgOAg, Au, As, Ba, Bi, Co, Cr, Hg, Mo, Rb, Sb, W, SnBe, Ce, Cu, Pb, Cs, REEs, Sr, Zn
HematiteHematite ± QuartzAl2O3, TiO2, SiO2, Th, TaFe2O3, MgO, MnO, K2ONa2O, CaO, P2O5Hg, Cr, Ga, Ge, Sn, Te, Tl, W, REEs, Ni, CoCs, Pb, Sr, Th, Zn
PropyliticEpidote ± Chlorite ± Carbonate ± QuartzAl2O3, SiO2, Ag, Ga, Hf, Nb, Sc, Te, Th, Tl, Y, ZrMnO, P2O5MgO, Na2OBi, REEs, Cu, Sb, Sr, Mo, Sn, WAu, Ni, Cs, Co
Diatreme
Sue–Dianne Deposit
Magnetite, Hematite, Chlorite, Garnet, Fluorite, SulphidesAl2O3, TiO2, SiO2, Th, Zr, Cr, Rb, HfFe2O3, CaO, MgO, K2O, P2O5, MnONa2OCu, Co, U, Pb, Au, Ag, Zn, V, F, Cl, La, Ce, Eu, Pr, W, Sr, Ba, NbTa, Cs
SilicificationQuartzAl2O3, Hf, Ta, Th, U, W, Zr, REEsSiO2
± Fe2O3
CaO, Na2O, TiO2, P2O5Ag, As, Au, Bi, Cu, Hg, Mo, Nb, Nd, TeEu, Sr
Table 2. Chemistry of least-altered rocks of the Mazenod region. Pervasive K alteration is believed to affect most rocks in the region, resulting in higher-than-normal K2O values. 1 Average of samples 96,259, 96,423, and 96,309; 2 average of samples 98,138, 96,372, and 96,320; 3 average of samples 96,443, 96,444, 97,055, and 98,151.
Rock TypeLeast Altered SelectionElement Concentrations
Al2O3 wt.%CaO wt.%Fe2O3 wt.%MgO wt.%MnO wt.%P2O5 wt.%K2O wt.%Na2O wt.%TiO2 wt.%SiO2 wt.% LOI wt.%
AndesiteAverage 115.933.745.852.130.140.114.213.130.6161.67 2.67
Basaltic Andesite9,815617.37.458.824.250.10.082.32.820.6854.2 1.6
Dacite9,808916.43.445.611.450.050.224.862.940.8462.8 1.4
RhyodaciteAverage 2162.493.511.150.070.075.1130.4366.7 1.5
Monzodiorite9,707816.12.83.180.940.070.074.993.270.4267.4 0.9
MonzograniteAverage 312.30.191.20.210.020.017.481.650.176.25 0.55
Ag ppmAs ppmAu ppbBa ppmBe ppmBi ppmCd ppmCe ppmCo ppmCr ppmCs ppmCu ppmDy ppm
AndesiteAverage 1<0.16.838202.10.3<0.17716.6924.433.63.98
Basaltic Andesite9,8156<0.14.6<22482.10.3<0.14320.91751.452.87
Dacite9,80890.25.5<28672.60.10.210610.1732.418.25.47
RhyodaciteAverage 20.356.6749792.30.430.2936.299.72.118.233.99
Monzodiorite9,7078<0.14.8<29082.40.30.2885.21291.69.63.78
MonzograniteAverage 30.410.881235.52.70.23<0.1611.9160.31.359.233.79
Er ppmEu ppmGa ppmGd ppmGe ppmHf ppmHg ppmHo ppmLa ppmLu ppmMo ppmNb ppmNd ppm
AndesiteAverage 12.121.218.84.41.44.1<0.10.99390.31.5929.9
Basaltic Andesite9,81561.480.9415.33.191.43.1<0.10.66210.21.3519.2
Dacite9,80892.661.76196.171.57.6<0.11.31500.42.31041
RhyodaciteAverage 22.121.3517.734.531.335.600.230.95490.371.99.733.17
Monzodiorite9,70782.071.2515.54.351.25.9<0.10.88460.41.51031.4
MonzograniteAverage 32.180.3613.033.551.383.75<0.10.9129.250.43121.521.98
Ni ppmPb ppmPr ppmRb ppmSb ppmSc ppmSe ppmSm ppmSn ppmSr ppmTa ppmTb ppmTe ppm
AndesiteAverage 11312.39.06209413<15.28<0.11951.820.7<0.1
Basaltic Andesite9,8156395.75.13146123<13.736.32030.750.47<0.1
Dacite9,80891017.212.1176511<17.292.32311.6110.1
RhyodaciteAverage 21921.1310.141941.370.675.261.282061.60.7<0.1
Monzodiorite9,7078391.030.74<0.19.4418.49.8917317<15.269.3
MonzograniteAverage 37.7510.336.922980.751.250.54.190.8638.754.490.610.06
Th ppmTl ppmTm ppmU ppmV ppmW ppmY ppmYb ppmZn ppmZr ppm
AndesiteAverage 121.4<0.010.387.1392523.72.3117153
Basaltic Andesite9,81569.48<0.010.242.12127417.91.5328101
Dacite9,808921.8<0.010.516.6957629.72.842257
RhyodaciteAverage 222.03<0.010.395.9838.32423.12.3346195
Monzodiorite9,707821.9<0.010.366.2234721.92.2849167
MonzograniteAverage 343.830.010.4311.623.752.7523.282.841067
Disclaimer/Publisher’s Note: The statements, opinions and data contained in all publications are solely those of the individual author(s) and contributor(s) and not of MDPI and/or the editor(s). MDPI and/or the editor(s) disclaim responsibility for any injury to people or property resulting from any ideas, methods, instructions or products referred to in the content.

