Article

The Peak Metamorphic PT Conditions of the Sanbagawa Schists in the Shibukawa Area, Central Japan: Application of Raman Geothermobarometry

by
Yuki Tomioka
1,2,*,
Yui Kouketsu
1 and
Katsuyoshi Michibayashi
1,3
1
Department of Earth and Planetary Sciences, Graduate School of Environmental Studies, Nagoya University, Nagoya 464-8601, Japan
2
Japan Organization for Metals and Energy Security, Tokyo 105-0001, Japan
3
Volcanoes and Earth’s Interior Research Center, Research Institute for Marine Geodynamics, Japan Agency for Marine-Earth Science and Technology, Yokosuka 237-0061, Japan
*
Author to whom correspondence should be addressed.
Minerals 2025, 15(7), 724; https://doi.org/10.3390/min15070724
Submission received: 9 May 2025 / Revised: 27 June 2025 / Accepted: 27 June 2025 / Published: 11 July 2025

Abstract

The quantitative pressure (P)–temperature (T) conditions of low-grade metamorphic rocks, such as pumpellyite–actinolite and greenschist facies, are largely unknown mainly owing to the difficulty in applying thermodynamic methods despite their importance in understanding the protolith and metamorphism within subducting oceanic crusts. In this study, Raman spectroscopy was applied to constrain the peak metamorphic conditions independent of thermodynamic methods for the lowest grade part (chlorite zone) of the Sanbagawa schists in the Shibukawa area, central Japan, where research on metamorphic conditions is limited. The metamorphic peak temperature of the pelitic schists estimated by Raman carbonaceous material geothermometry was 307 ± 27 °C to 395 ± 16 °C, which increased towards the northern fault (Median Tectonic Line). Raman geobarometry using the quartz-inclusions-in-spessartine system on a siliceous schist sample estimated a peak metamorphic pressure of 0.78–0.94 GPa at 360–390 °C. These results suggest that the rocks in the Shibukawa area were subducted to a depth equivalent to that of the garnet zone in central Shikoku and were then exhumed without experiencing further heating. The combination of Raman carbonaceous material geothermometry and Raman geobarometry (Raman geothermobarometry) can be effectively applied to estimate the metamorphic conditions of low-grade metamorphic rocks independent of thermodynamic methods.

1. Introduction

The metamorphic pressure (P)–temperature (T) conditions of low-grade metamorphic rocks, such as pumpellyite–actinolite and greenschist facies in the mafic system, are difficult to estimate because of (1) more limited thermodynamic geothermobarometry than for high-grade metamorphic rocks and (2) difficulties in assuming chemical equilibrium owing to the growth of fine-grained metamorphic minerals within the local bulk composition. Although a number of studies have addressed these difficulties through careful assumptions and detailed analysis (e.g., [1,2]), they remain fewer than those conducted on high-grade metamorphic rocks. The Sanbagawa belt, a well-studied high P/T-type regional metamorphic zone on the Japanese Islands (e.g., [3]), is no exception, as research has been predominantly focused on the high-grade zone (e.g., [4,5,6]; garnet to oligoclase–biotite zone of Higashino [7]), despite its limited exposed area. Low-grade metamorphic rocks also potentially preserve direct protolith information, such as relict minerals, which is difficult to extract from high-grade metamorphic rocks. The quantitative estimation of their metamorphic PT conditions is therefore crucial for elucidating the pre-subduction to exhumation history.
The present study focuses on the Sanbagawa schists in the Shibukawa area, central Japan (Figure 1), which are located between two well-studied regions of the Sanbagawa metamorphic belt on Shikoku and in the Kanto Mountains. To quantitatively estimate the peak metamorphic conditions, two recently developed Raman spectroscopic methods have been adopted: Raman carbonaceous material (CM) geothermometry (e.g., [8,9,10]) and Raman geobarometry (e.g., [11,12,13,14]) using a quartz-inclusions-in-spessartine system. Both methods have the following advantages: (1) they are independent of conventional thermodynamic methods; (2) they have a large number of applicable samples; and (3) they require less time for sample preparation and analysis. The combination of these methods allowed us to obtain quantitative information on low-grade metamorphic rocks that has been difficult to extract.

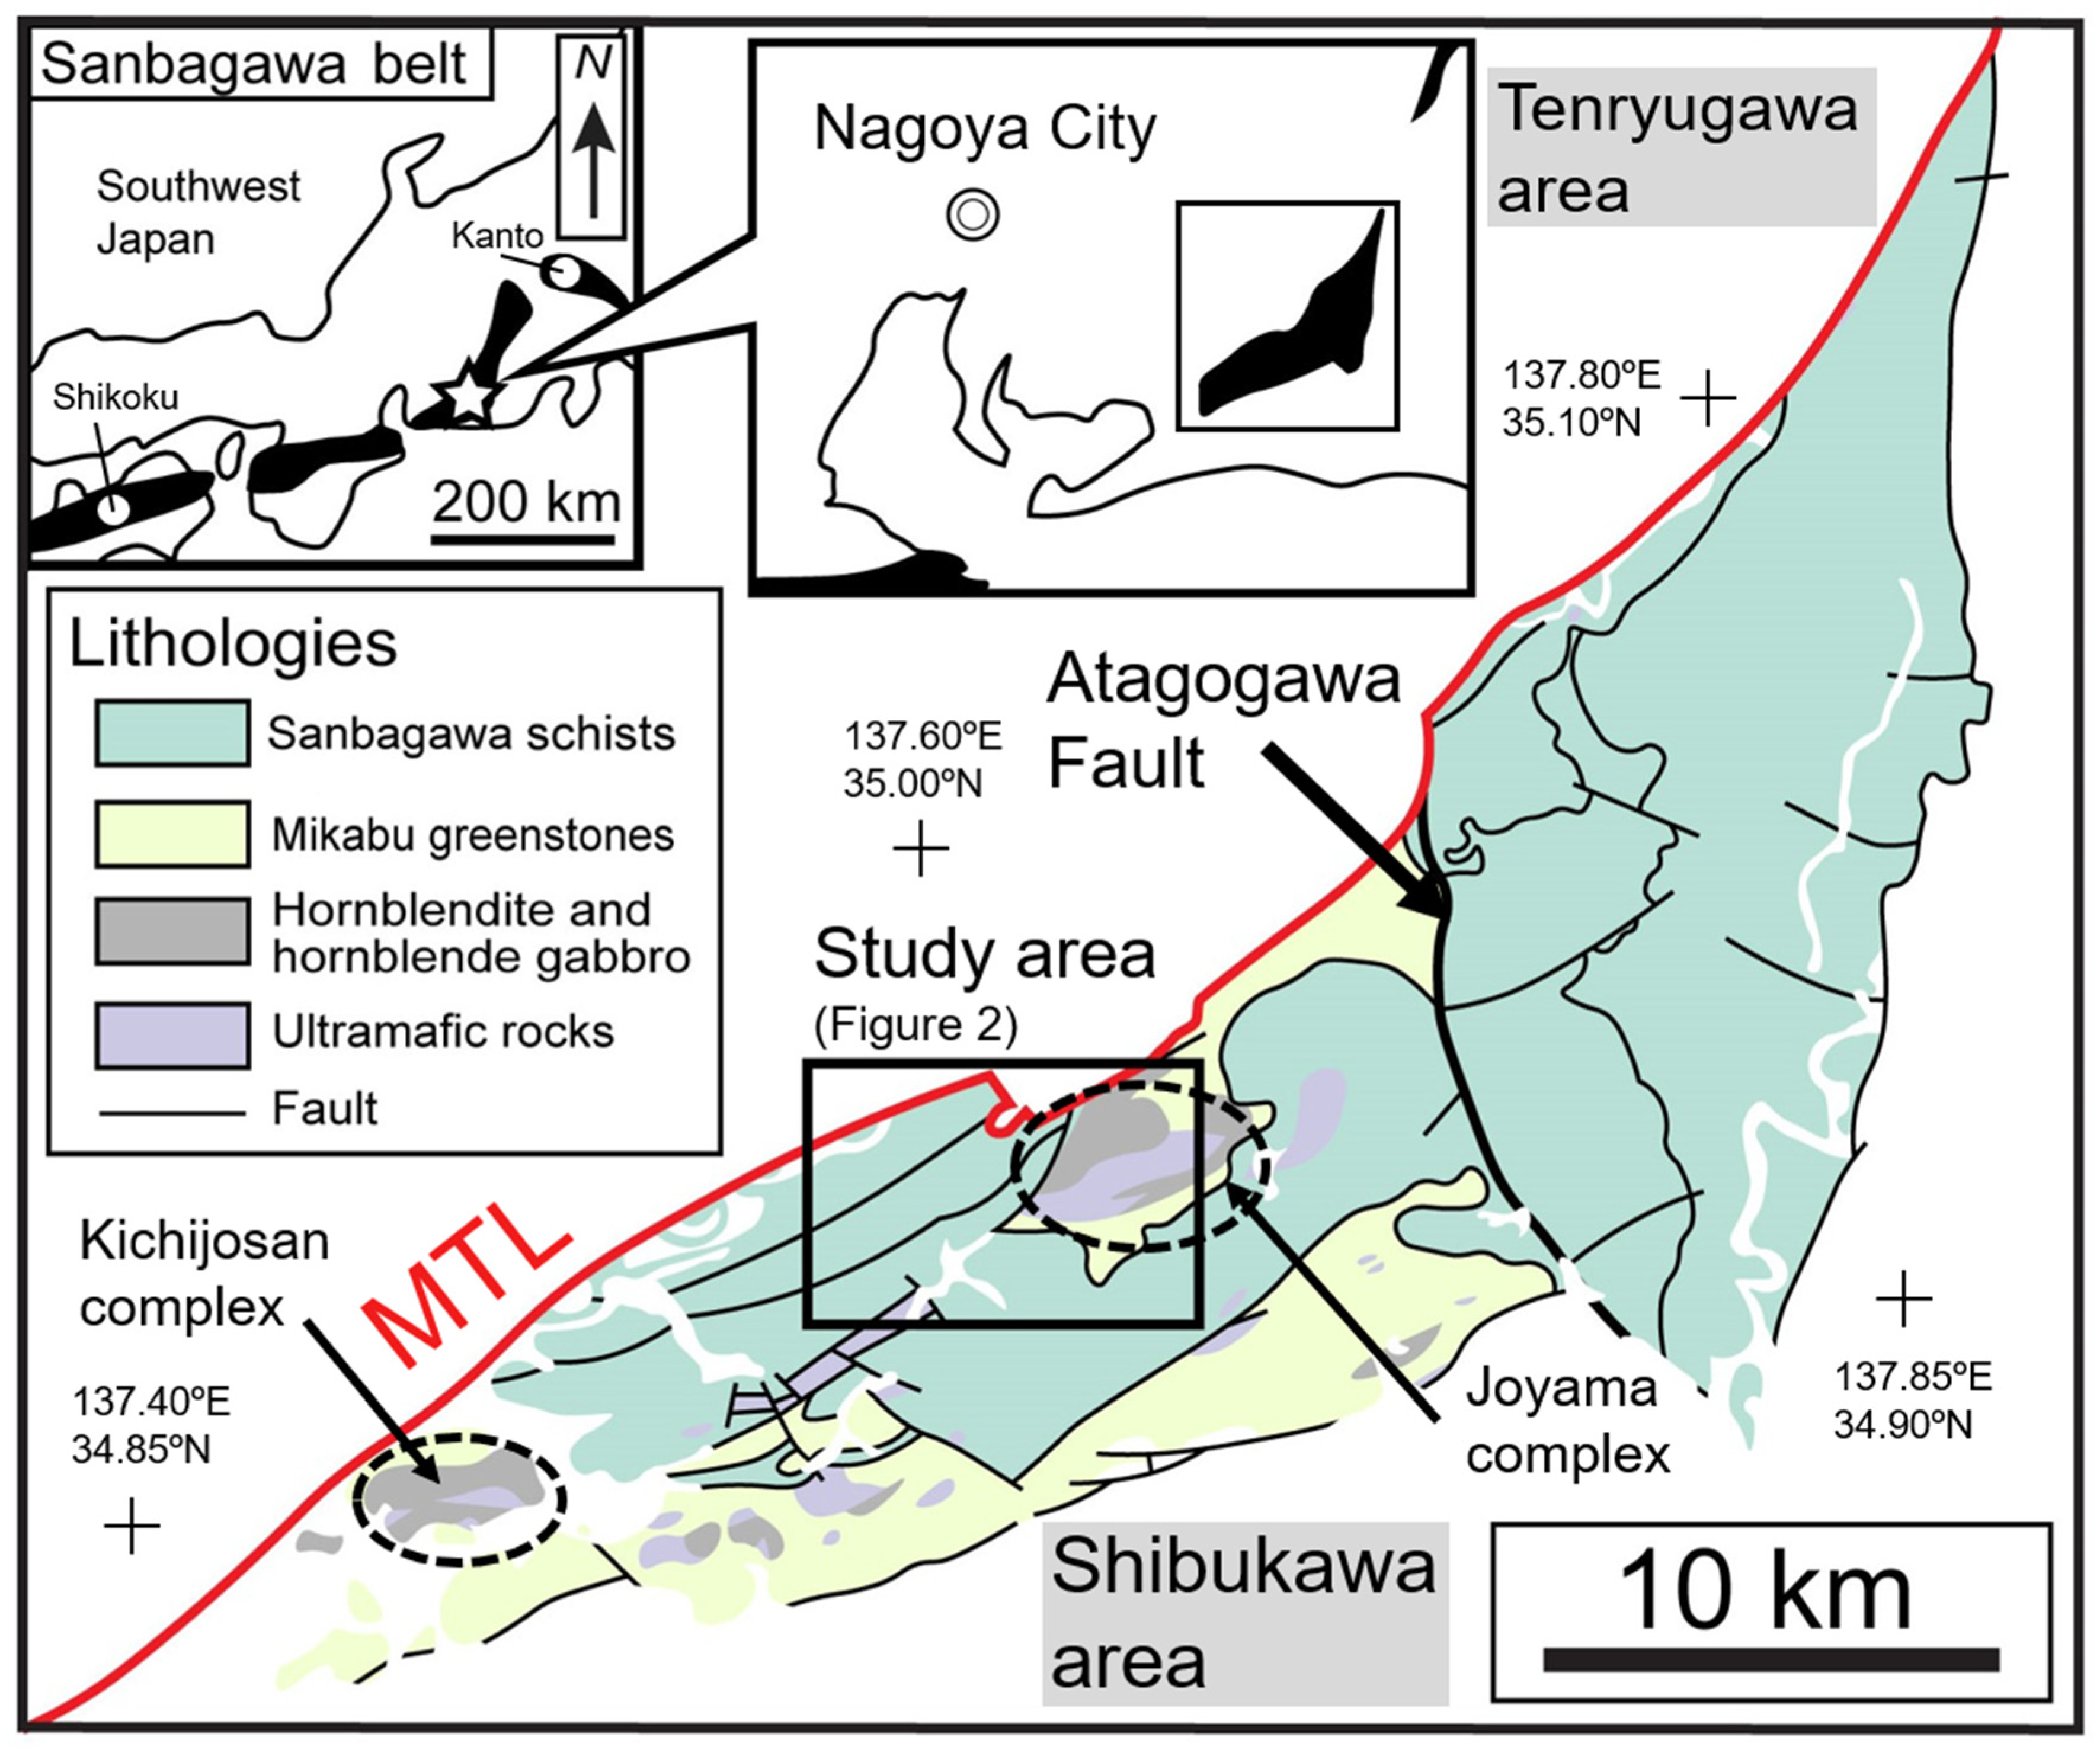
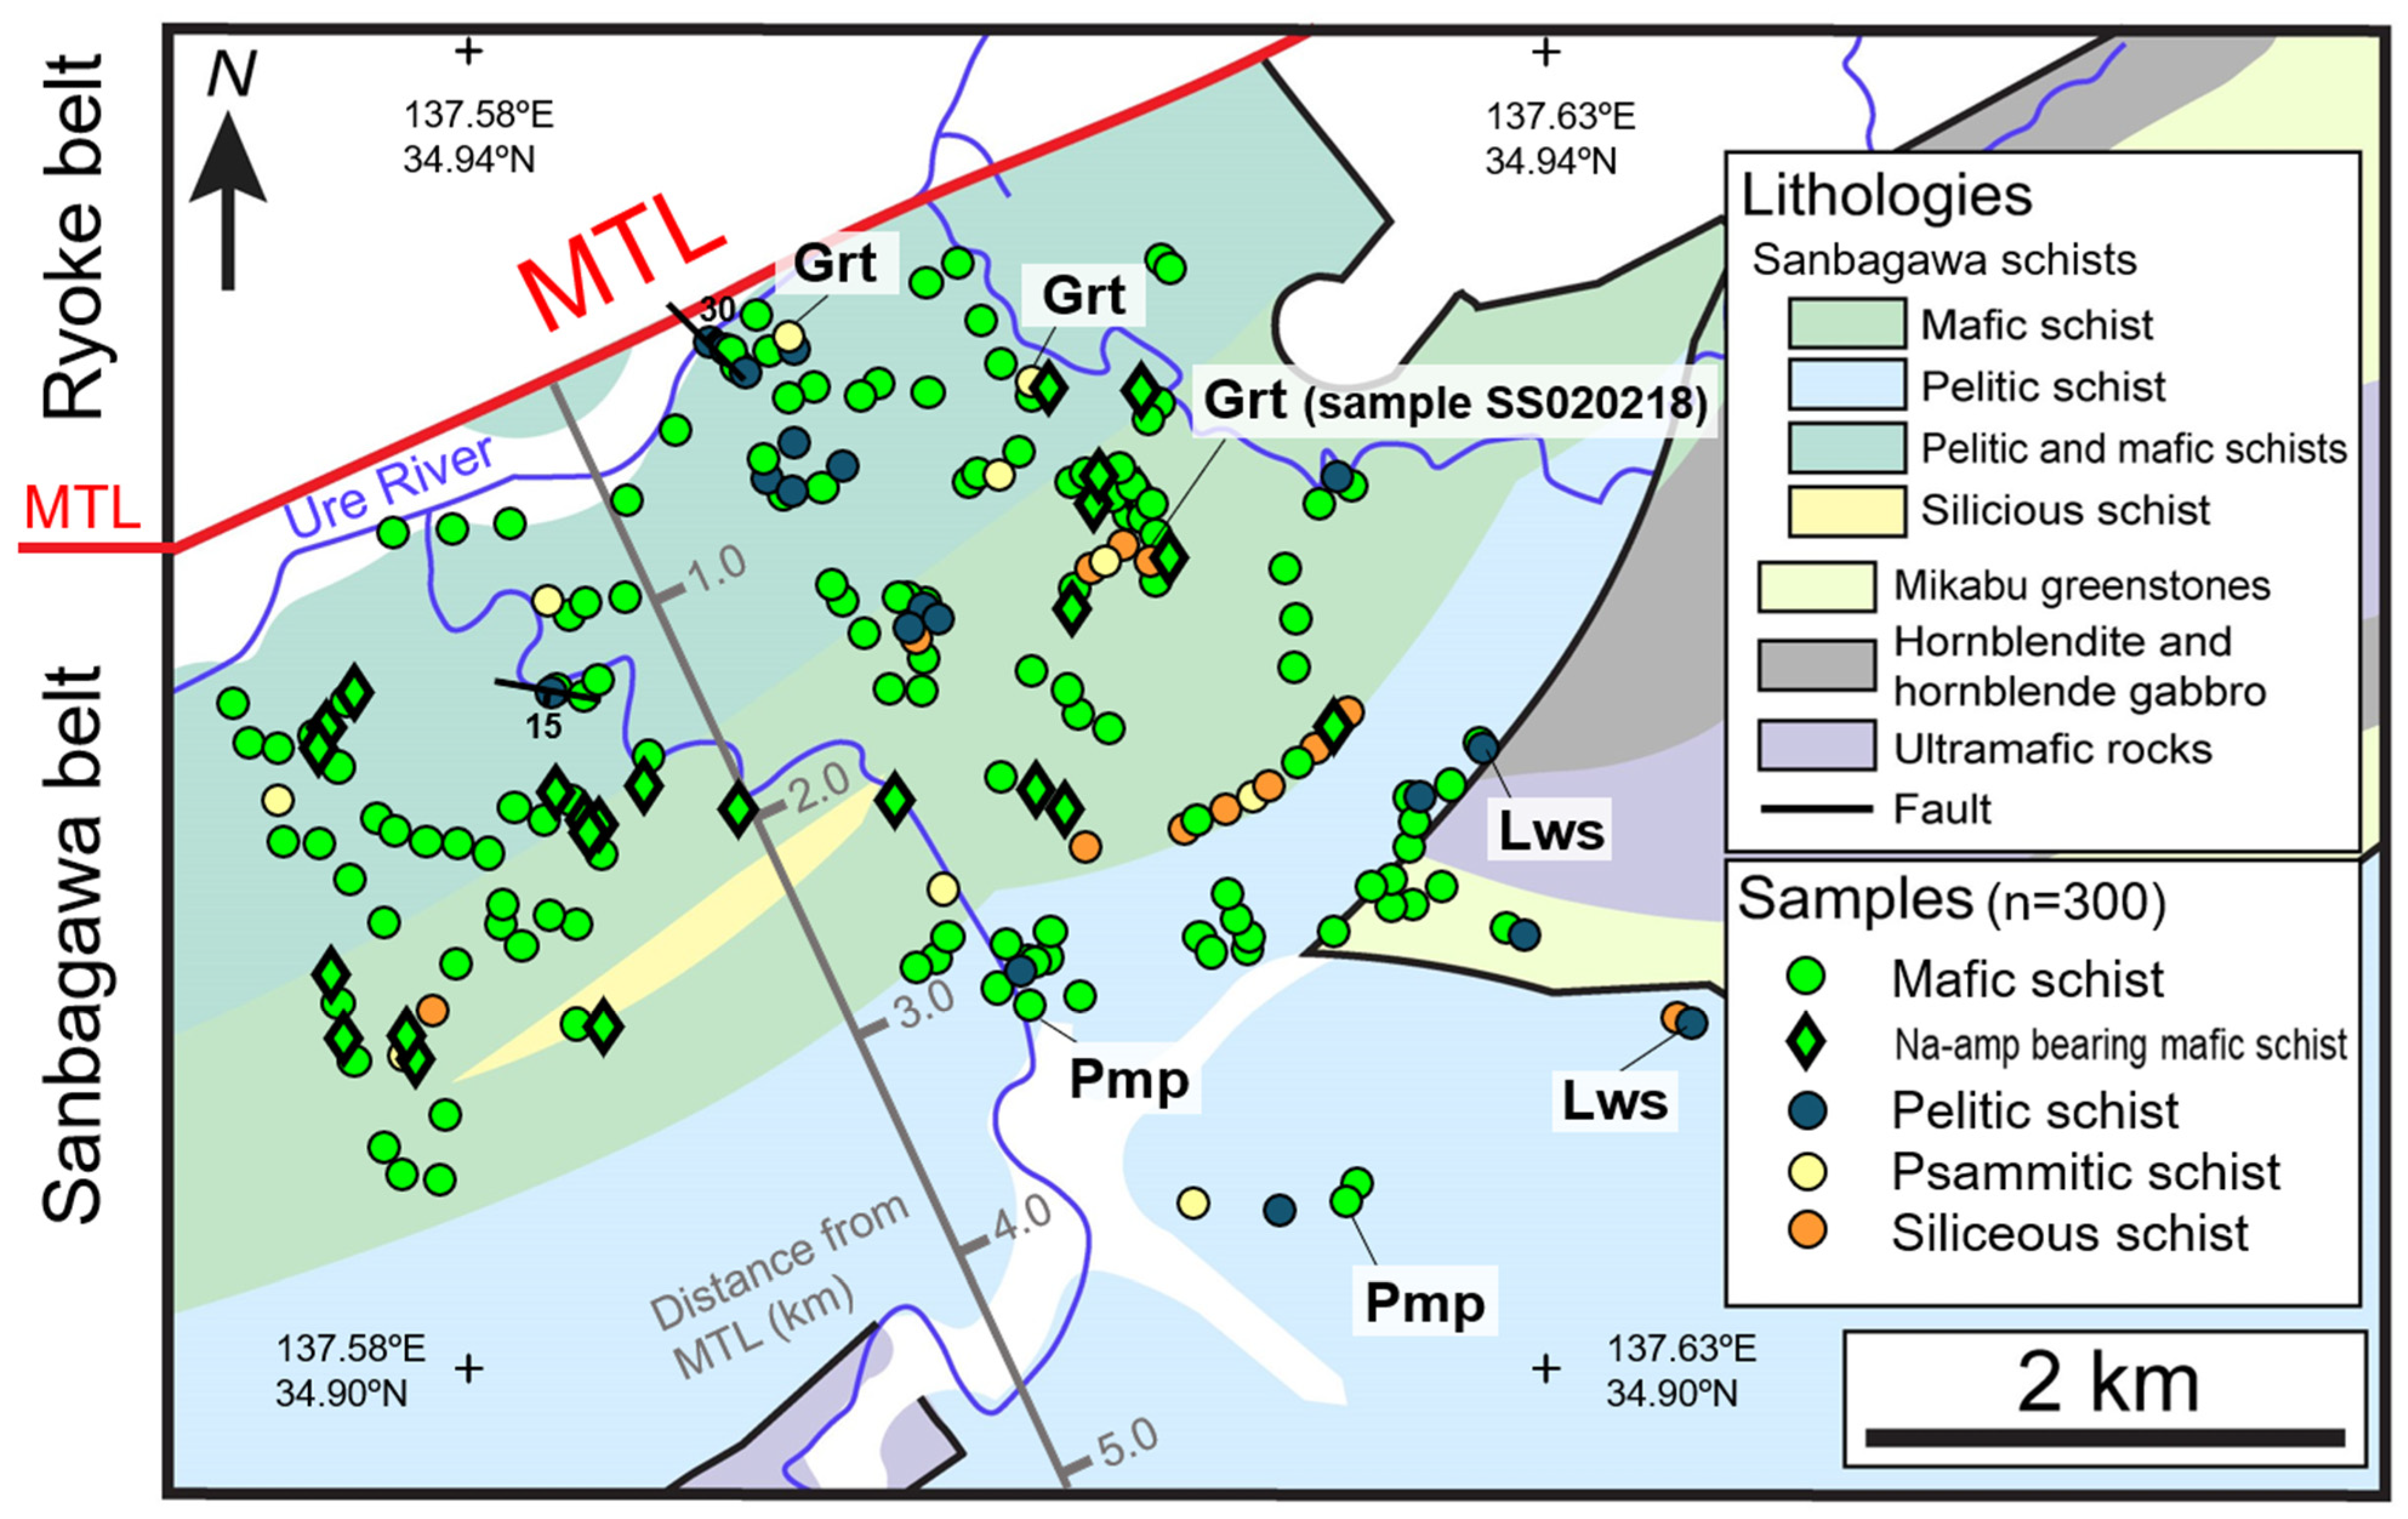
2. Geological Background

The Late Cretaceous Sanbagawa metamorphic belt is located in the Outer Zone of Southwest Japan from the Kanto Mountains to Kyushu Island and mainly consists of subducted oceanic crust and trench-fill deposits (e.g., [1,16,17]). Higashino [7] separated the Sanbagawa metamorphic rocks in central Shikoku into four zones based on the minerals in pelitic schists in order of increasing metamorphic grade, mainly temperature-dependent: chlorite, garnet, albite–biotite, and oligoclase–biotite zones. Pelitic schists contain abundant CM as a reducing agent, under which most of the Fe in the silicate phases is regarded as Fe2+ [7].
In the southern part of central Japan, near the boundary of Aichi and Shizuoka prefectures, the Sanbagawa belt is divided by the Atagogawa fault into northeast and southwest areas. They are referred to as Tenryugawa and Shibukawa areas, respectively ([18]; Figure 1). In the Tenryugawa area, Sanbagawa schists locally include porphyroblastic albite [15], and their metamorphic grades correspond to the chlorite, garnet, and biotite zones [18]. Based on a detailed study of the degree of graphitization, Tagiri et al. [19] suggested a structure of overlapping plate-shaped metamorphic complexes with discontinuous metamorphic grades.
The Sanbagawa metamorphic rocks in the Shibukawa area are mainly composed of Sanbagawa schists with minor amounts of Mikabu greenstones (Figure 1). The Sanbagawa schists consist of pelitic and mafic schists, with minor amounts of siliceous and psammitic schists. The Mikabu greenstones are weakly metamorphosed mafic rocks that were subducted before the Sanbagawa schists (e.g., [20]).
The Mikabu greenstones are coupled with ultramafic–mafic complexes consisting of hornblendite, hornblende gabbro, and ultramafic rocks and are structurally located above the Sanbagawa schists bounded by faults [15]. The specificity of these lithologies has been reported in several studies, as follows. Some of these ultramafic–mafic complexes, particularly the large Kichijosan and Joyama complexes (Figure 1), are thought to have undergone ocean-floor metamorphism before Sanbagawa metamorphism [21]. In recent years, jadeite has been reconfirmed within a veinlet cutting dunite in an ultramafic body located on the eastern side of the Joyama complex [22].
The Sanbagawa schists in this area have been previously studied and described, as follows. Seki et al. [23] divided them into four zones based on the mineral assemblages of the mafic and metasedimentary rocks. Isogai [24] focused on mafic schists bearing quartz and albite and defined eight zones based on mineral assemblages. The metamorphic zones in both studies did not coincide. They reported the occurrence of characteristic metamorphic minerals in schists, such as jadeite, lawsonite, and sodic amphibole. Although no quantitative metamorphic PT conditions have been determined in this area, the main reported mineral assemblage corresponds to the chlorite zone of Higashino [7], the lowest grade of Sanbagawa metamorphic rocks.
This study focuses on the northern part of the Shibukawa area, which is also included in studies by Seki et al. [23] and Isogai [24]. Figure 1 shows the study area, which has the Joyama ultramafic–mafic complex to its east and the Ryoke belt to its north, separated by the Median Tectonic Line (MTL).

3. Sample Descriptions
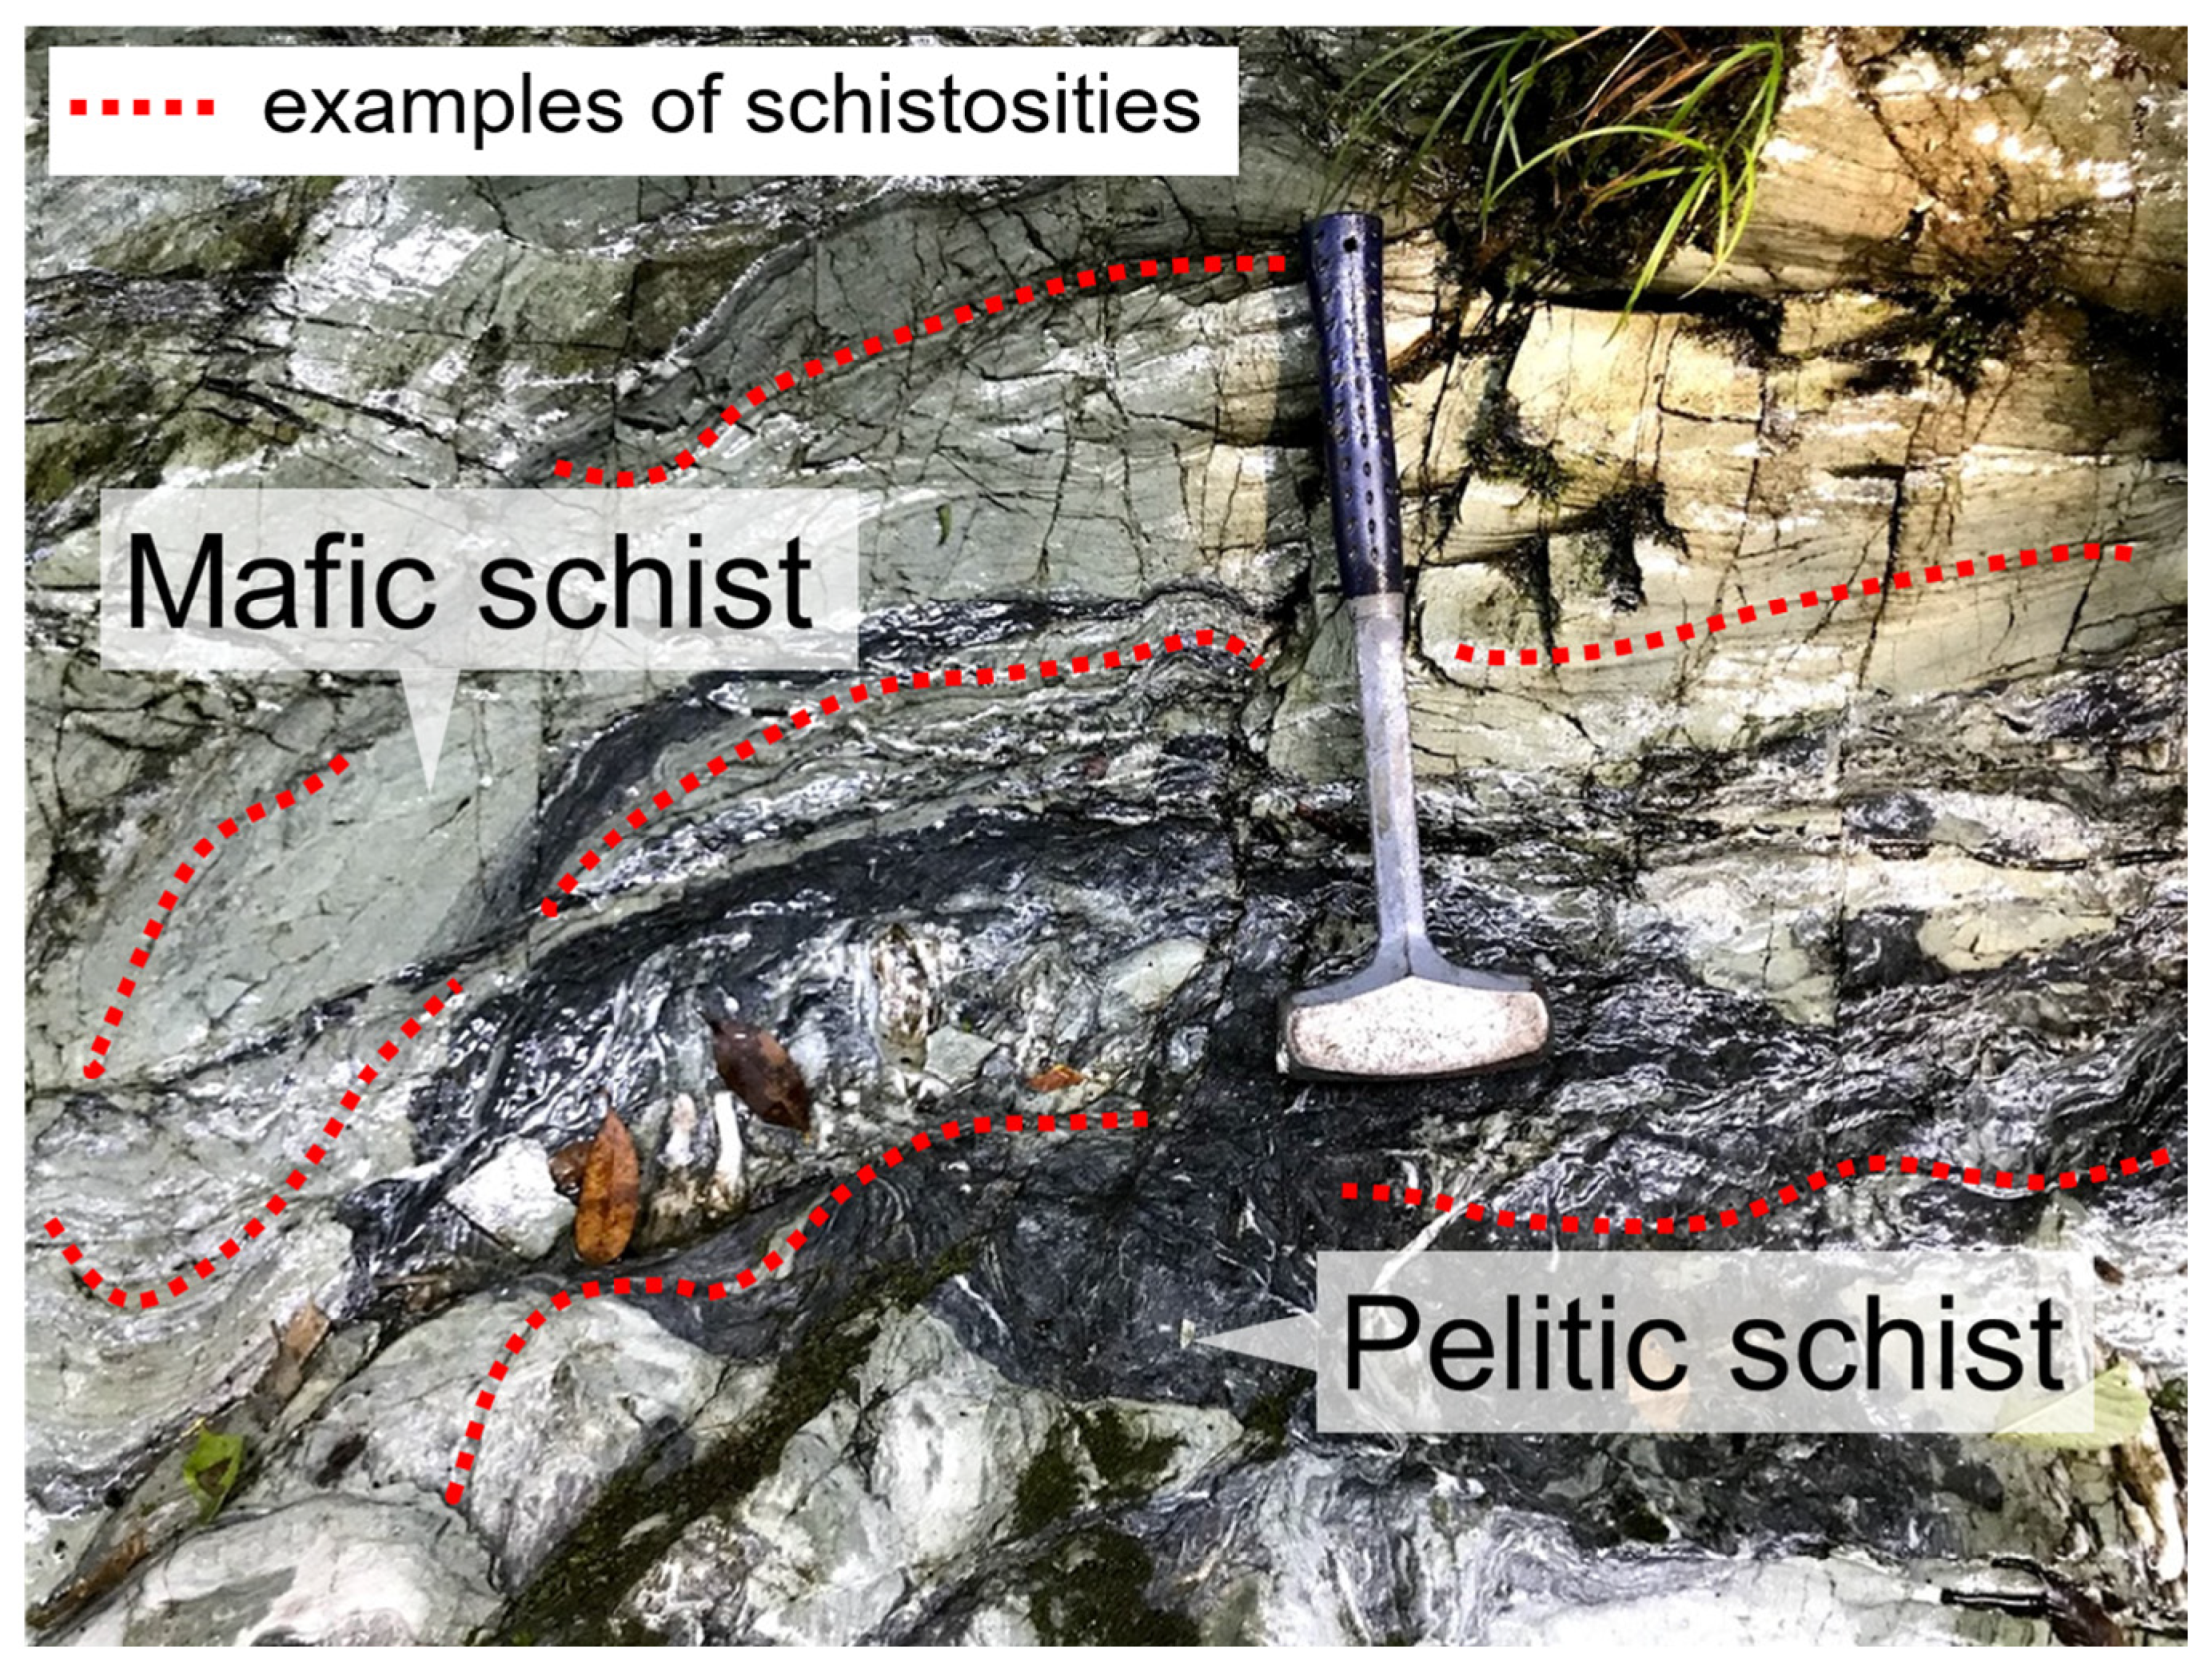
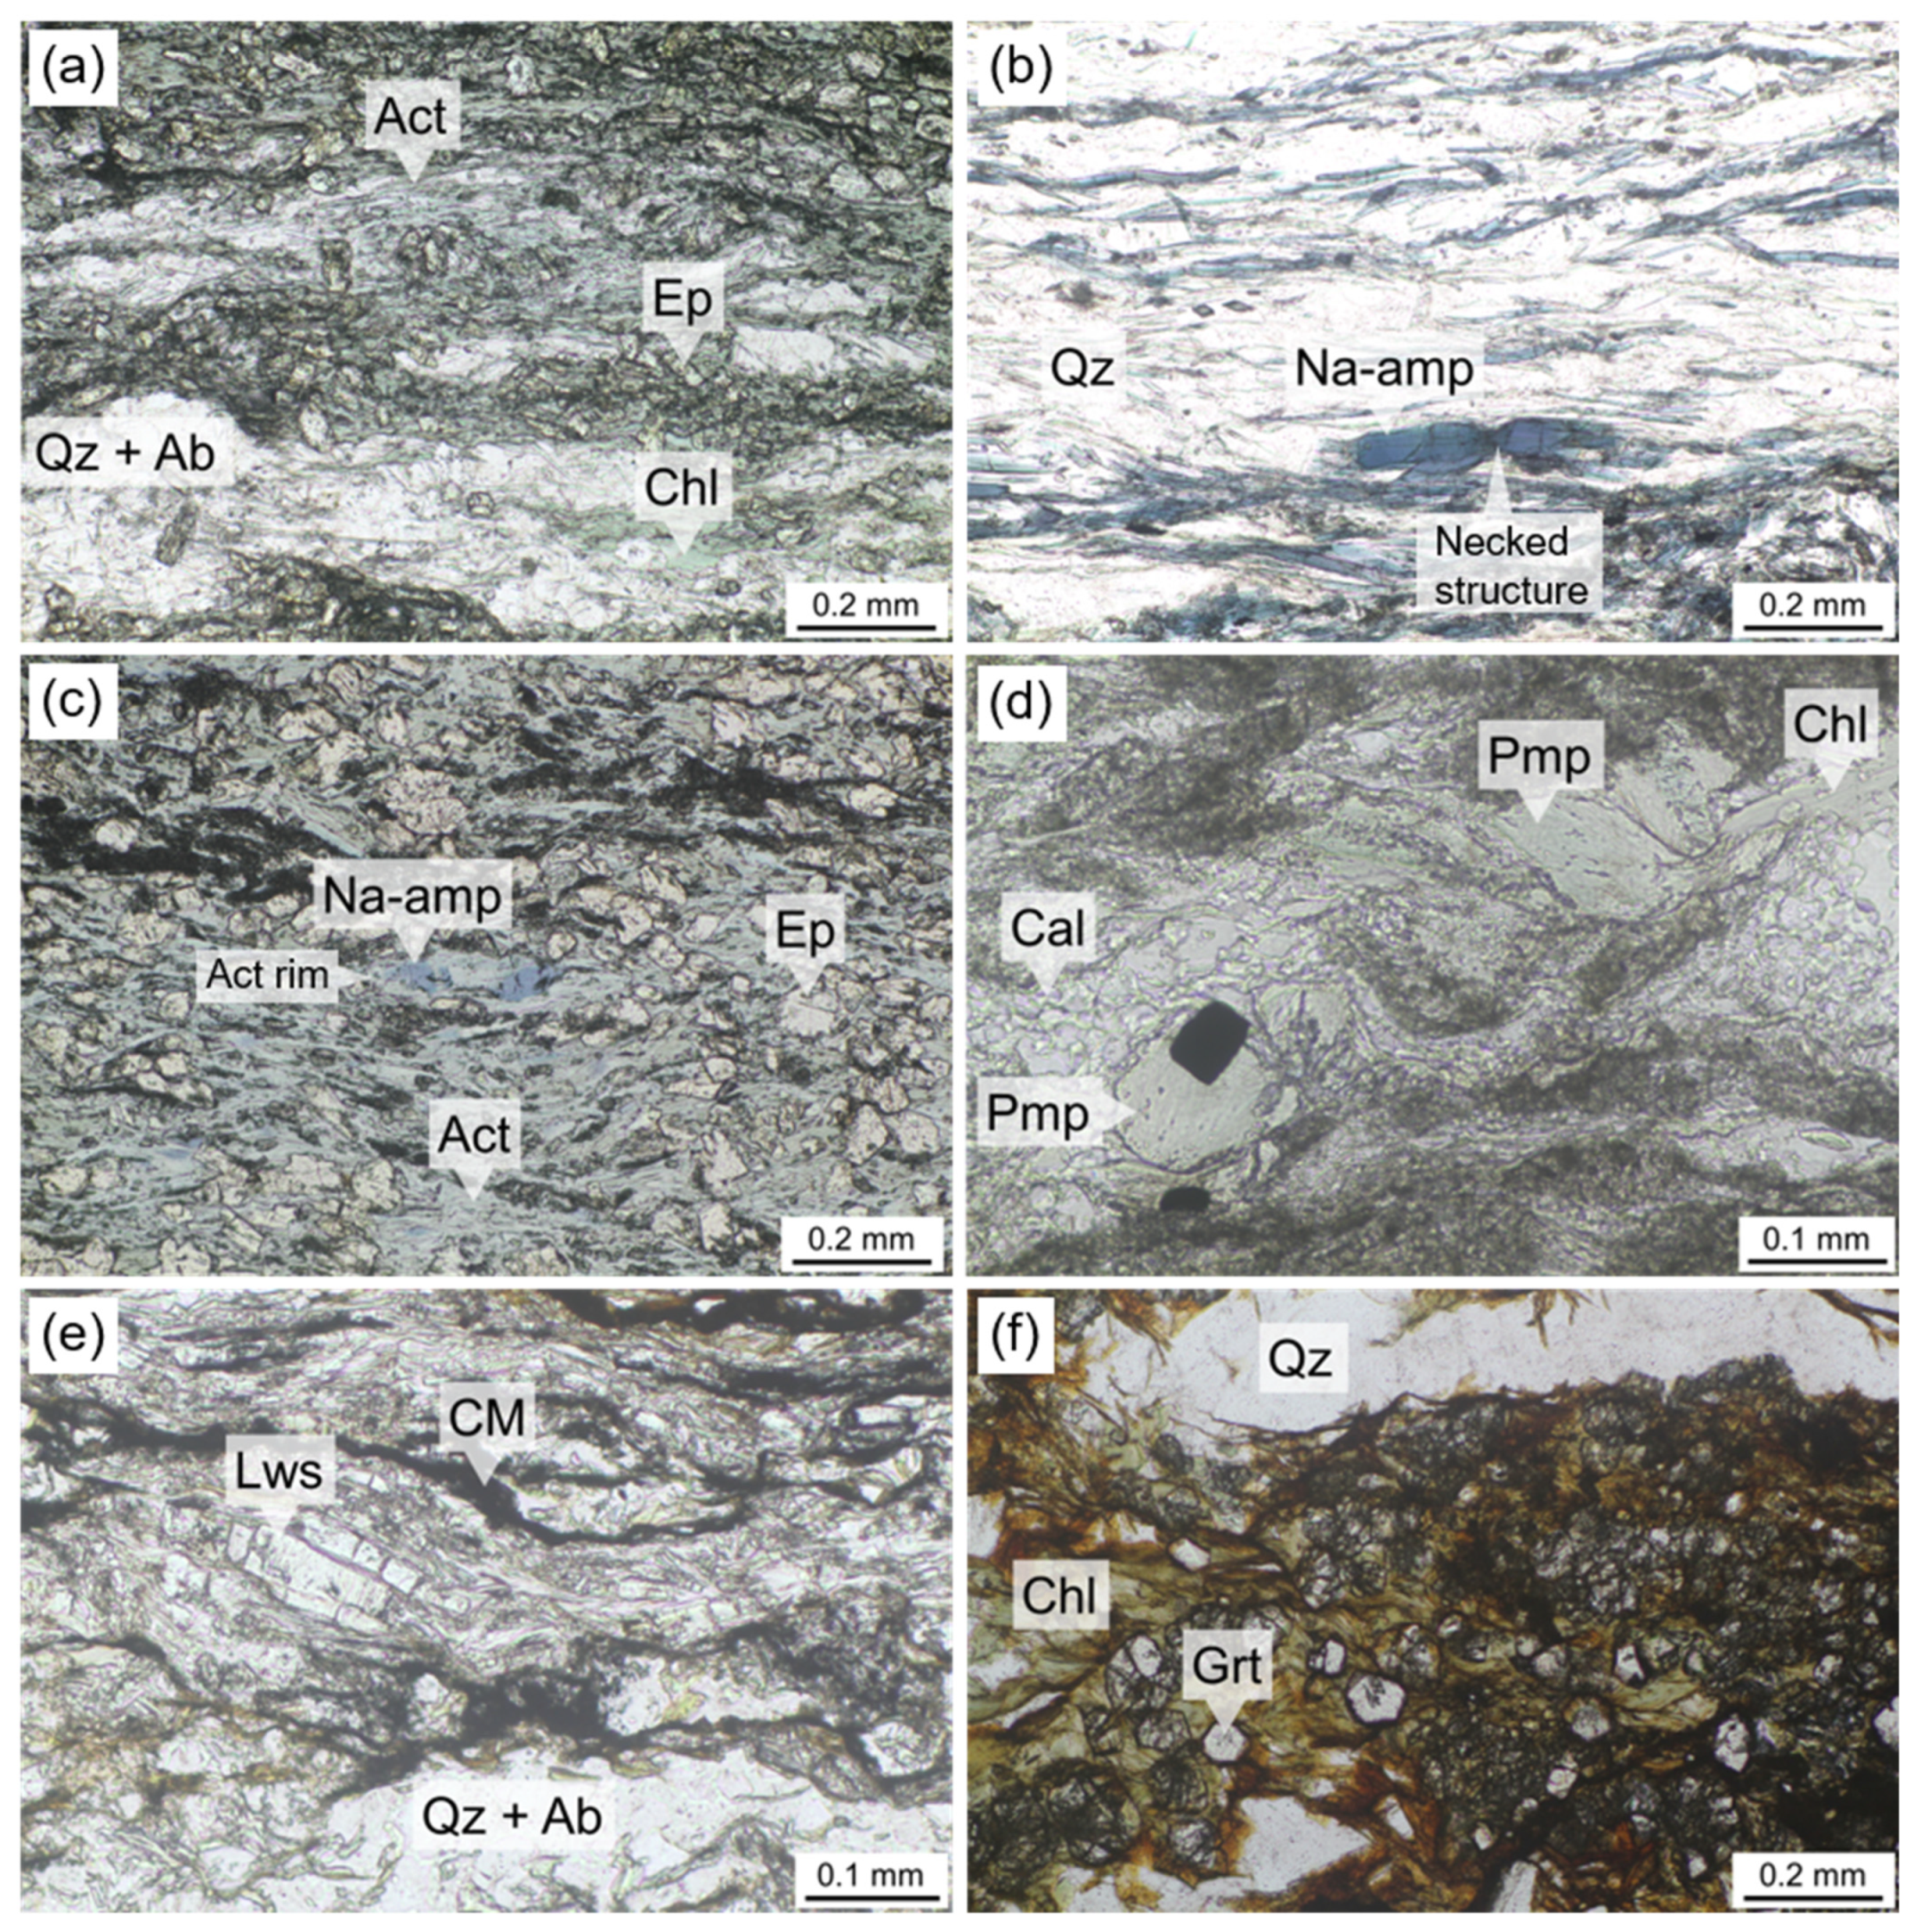
We collected 71 samples from the outcrops and analyzed them after preparing thin sections parallel to the XZ plane. Additionally, 229 glass-covered thin sections (collected in 1982–1983; courtesy of Prof. Tagiri, Ibaraki University) were observed to determine the mineral assemblages of the metamorphic rocks. The sample locations are shown in Figure 2. All samples correspond to the Sanbagawa schists, and we classified them into mafic, pelitic, psammitic, and siliceous schists based on their mineral assemblages by microscopic observation. In this area, these lithologies exhibit intricately mixed distributions (Figure 2; note that the 229 glass-covered thin sections are mostly mafic schists). Different lithologies in the same outcrop share the same schistosities (Figure 3). As a general trend, there were differences in the constituent minerals between the northern and southern parts of the study area: in the former, garnet occurred in siliceous and psammitic schists, and in the latter, pumpellyite and lawsonite occurred in mafic and pelitic schists, respectively (Figure 2). A detailed description of each lithology is provided below.

3.1. Mafic Schists

The mafic schists in the study area are commonly greenish, whereas blue schists are rare. The main metamorphic minerals are amphibole, chlorite, epidote, albite, quartz, phengite, titanite, and apatite. Locally, calcite, tourmaline, pyrite, hematite, magnetite, chalcopyrite, and relict clinopyroxene (rarely including chromites) were observed. The albite constituted siliceous layers with quartz (Figure 4a) and did not show visible porphyroblasts. The amphibole was predominantly actinolite with minor amounts of sodic and sodic–calcic amphibole (mainly corresponds to magnesio-riebeckite). Actinolite was commonly found as <0.1 mm relatively homogeneous needles and formed schistosity. Sodic and sodic–calcic amphiboles appeared in both the siliceous (Figure 4b) and mafic mineral matrices (Figure 4c) with <0.5 mm needles. They showed necked structures only in the siliceous mineral matrices (Figure 4b). Sodic amphiboles commonly exhibited zonal structures, some of which had sodic–calcic amphiboles and actinolite rims (Figure 4c). Pumpellyite (Figure 4d) was only found in the southern part of the study area (Figure 2). Jadeite and lawsonite were not identified in the mafic schist samples examined in the present study.

3.2. Pelitic Schists

All the pelitic schist samples were black because of the abundance of carbonaceous material (CM). The main constituent minerals were quartz, albite, phengite, chlorite, titanite, and apatite. Locally, calcite, pyrite, hematite, magnetite, tourmaline, clinozoisite, and detrital zircons were identified. This mineral assemblage, which lacks garnet in the pelitic schists throughout the study area, corresponds to the chlorite zone of Higashino [7]. The matrix was composed of quartz + albite, mafic minerals such as chlorite and phengite, and CM-defined wavy schistosities. In the southern part, two samples contained lawsonite as <0.2 mm columnar euhedral crystals (Figure 2 and Figure 4e).

3.3. Siliceous and Psammitic Schists

The siliceous schists consisted mostly of quartz, with minor amounts of albite, phengite, chlorite, apatite, pyrite, hematite, and magnetite. The psammitic schists were composed of almost the same minerals as the siliceous schists, with a smaller proportion of quartz, and they included actinolite, epidote, titanite, and calcite.
Garnets were observed locally in the chlorite layers of the siliceous and psammitic schists in the northern part of this area (Figure 2). They showed euhedral crystals and were larger in the siliceous schists (<0.1 mm; Figure 4f) than in the psammitic schists (<0.05 mm).

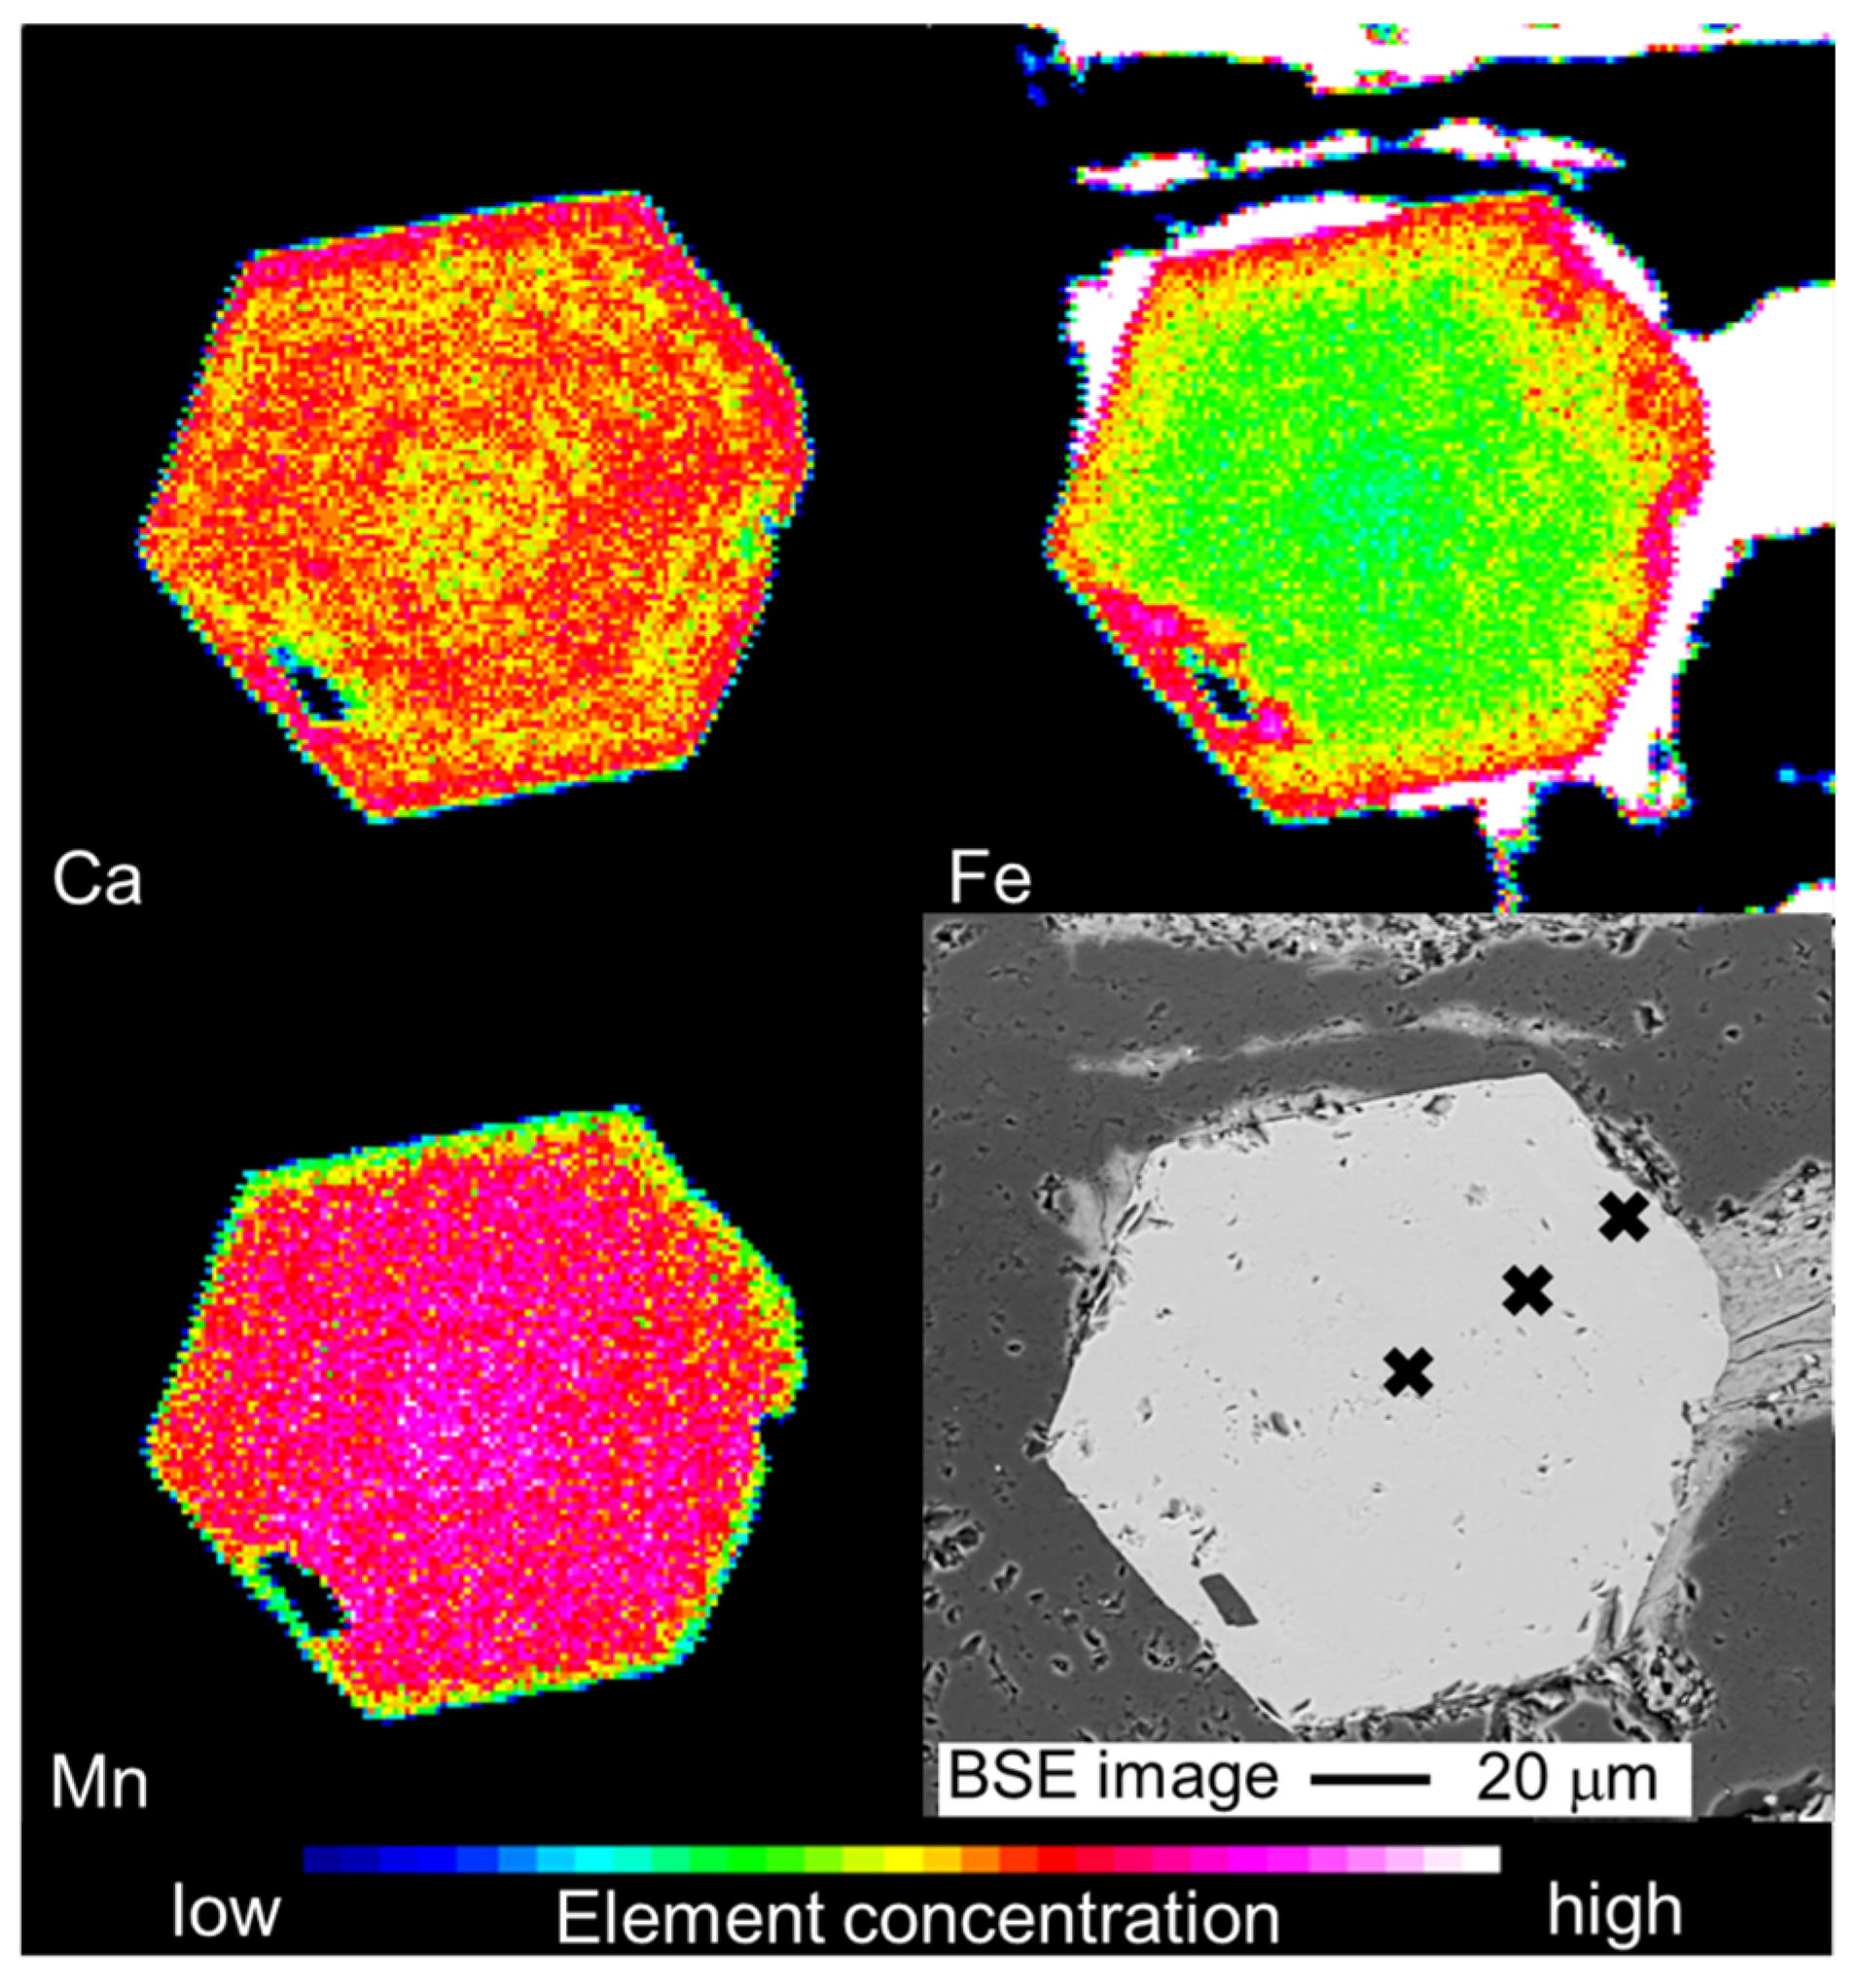
4. Mineral Chemistry

A JEOL JXA-8800R electron probe microanalyzer (EPMA; JEOL Ltd., Akishima, Japan) at Nagoya University was used to quantitatively analyze the accelerating voltage of 15 kV and the specimen current of 12 nA. X-ray compositional mapping of the garnet was performed in wavelength-dispersive mode with an accelerating voltage of 20 kV and a current of 100 nA.
The representative analytical results of garnet in the siliceous schist sample (SS020218) are listed in Table 1. In order to avoid the effect of the apparent core, we used one of the largest grains observed in thin section for chemical analyses. Because microprobe analyses cannot determine the redox state, especially of Fe and Mn, we used the stoichiometric method of Locock [26]. The garnet grains showed a spessartine-rich chemical composition (75%–78%), with poor zoning of increasing Fe and decreasing Mn from the core to the rim (Figure 5).

5. Raman Spectroscopy

To apply Raman CM geothermometry and Raman geobarometry, Raman spectroscopic analysis was performed using Nicolet Almega XR (Thermo Fisher Scientific Inc., Waltham, MA, USA) at Nagoya University. The instrument was equipped with a 532 nm Nd-YAG laser passing through a confocal microscope (Olympus BX51) with a 100× objective (Olympus Mplan-BD 100X, NA = 0.90). The laser power on the thin section sample surface was ~10 mW for mineral identification and residual pressure measurements and 1–3 mW for CM analysis referring to previous studies (e.g., [6,8,10]). The scattered light was collected by a backscatter geometry with a 25 μm pinhole and a holographic notch filter, dispersed using a grating of 2400 lines/mm and analyzed by a Peltier-cooled charge-coupled device (CCD) detector comprising 256 × 1024 pixels (Oxford Instruments Andor, Belfast, Northern Ireland).
Raman spectra were collected in six accumulations of 10 s each, except for the CM analysis, which was analyzed in three accumulations of 10 s each. The room temperature was maintained at 20 °C. For Raman geobarometry, a (0001) thin section of pegmatitic α-quartz was used as the standard, as reported by Enami et al. [12]. Standard quartz was measured at the beginning of analysis. All obtained Raman spectra of quartz and CM were decomposed into several peaks with a pseudo-Voigt function using the PeakFit ver. 4.12 (SeaSolve Software Inc., San Jose, CA, USA) computer program.

5.1. Raman Carbonaceous Material Geothermometry

CM is the organic matter in sedimentary rocks that is gradually transformed into graphite with an ordered crystal structure by heat, such as through metamorphism. The correlation between the crystallinity of the CM and metamorphic temperature has been studied for many years (e.g., [27,28,29]), including through Raman spectroscopic analysis (e.g., [2,8,9,10,30,31]). Recent advances in Raman spectroscopic analysis of CM have made it possible to quantitatively determine the peak temperature, which is called Raman CM geothermometry (e.g., [8,9,10]). In this study, Raman CM geothermometry was applied to 20 pelitic schist samples to estimate the peak metamorphic temperatures. The measurements were performed on 30–50 CM grains for each sample. Grains exposed on the surface of the thin section were not analyzed in order to avoid the effect of polishing.
The Raman spectrum of CM in the range 1000–1750 cm−1 is composed of five individual bands: approximately 1350 cm−1 (D1 band), 1620 cm−1 (D2 band), 1510 cm−1 (D3 band), 1245 cm−1 (D4 band), and 1580 cm−1 (G band). The attribution of each band and the deconvolution method follow Kouketsu et al. [10], who integrated past studies (e.g., [9,32,33,34]. The intensity of each band changed continuously as the temperature increased. The CM spectra of the study area corresponded to medium-grade and high-grade CM (Fitting C to Fitting F of Kouketsu et al. [10]). The two calibration methods proposed by Aoya et al. [8] and Kouketsu et al. [10] could be used in this temperature range; therefore, we applied both and compared them with each other.
Aoya et al. [8] proposed the following relationship between R2 (area ratio, D1/[G + D1 + D2]) and temperature:
TR2 (°C) = 221.0 × (R2)2 − 637.1 × (R2) + 672.3
where the temperature range is 340–655 °C. This equation was applied to the samples at high temperatures (>340 °C).
The equation proposed by Kouketsu et al. [10] uses the full width at half maximum (FWHM) of the D1 band:
TFWHM (°C) = −2.15 × FWHM-D1 + 478
where the temperature range is 150–400 °C.
The calculated temperatures are presented in Figure 6 and Table 2. The values from Equation (2) (TFWHM) varied from 307 ± 27 °C to 395 ± 16 °C, with samples closer to the MTL exhibiting higher temperatures. The temperature values obtained using Equation (1) (TR2) also agreed with the TFWHM within the error range; however, the samples collected near the MTL showed unusually large standard deviations.

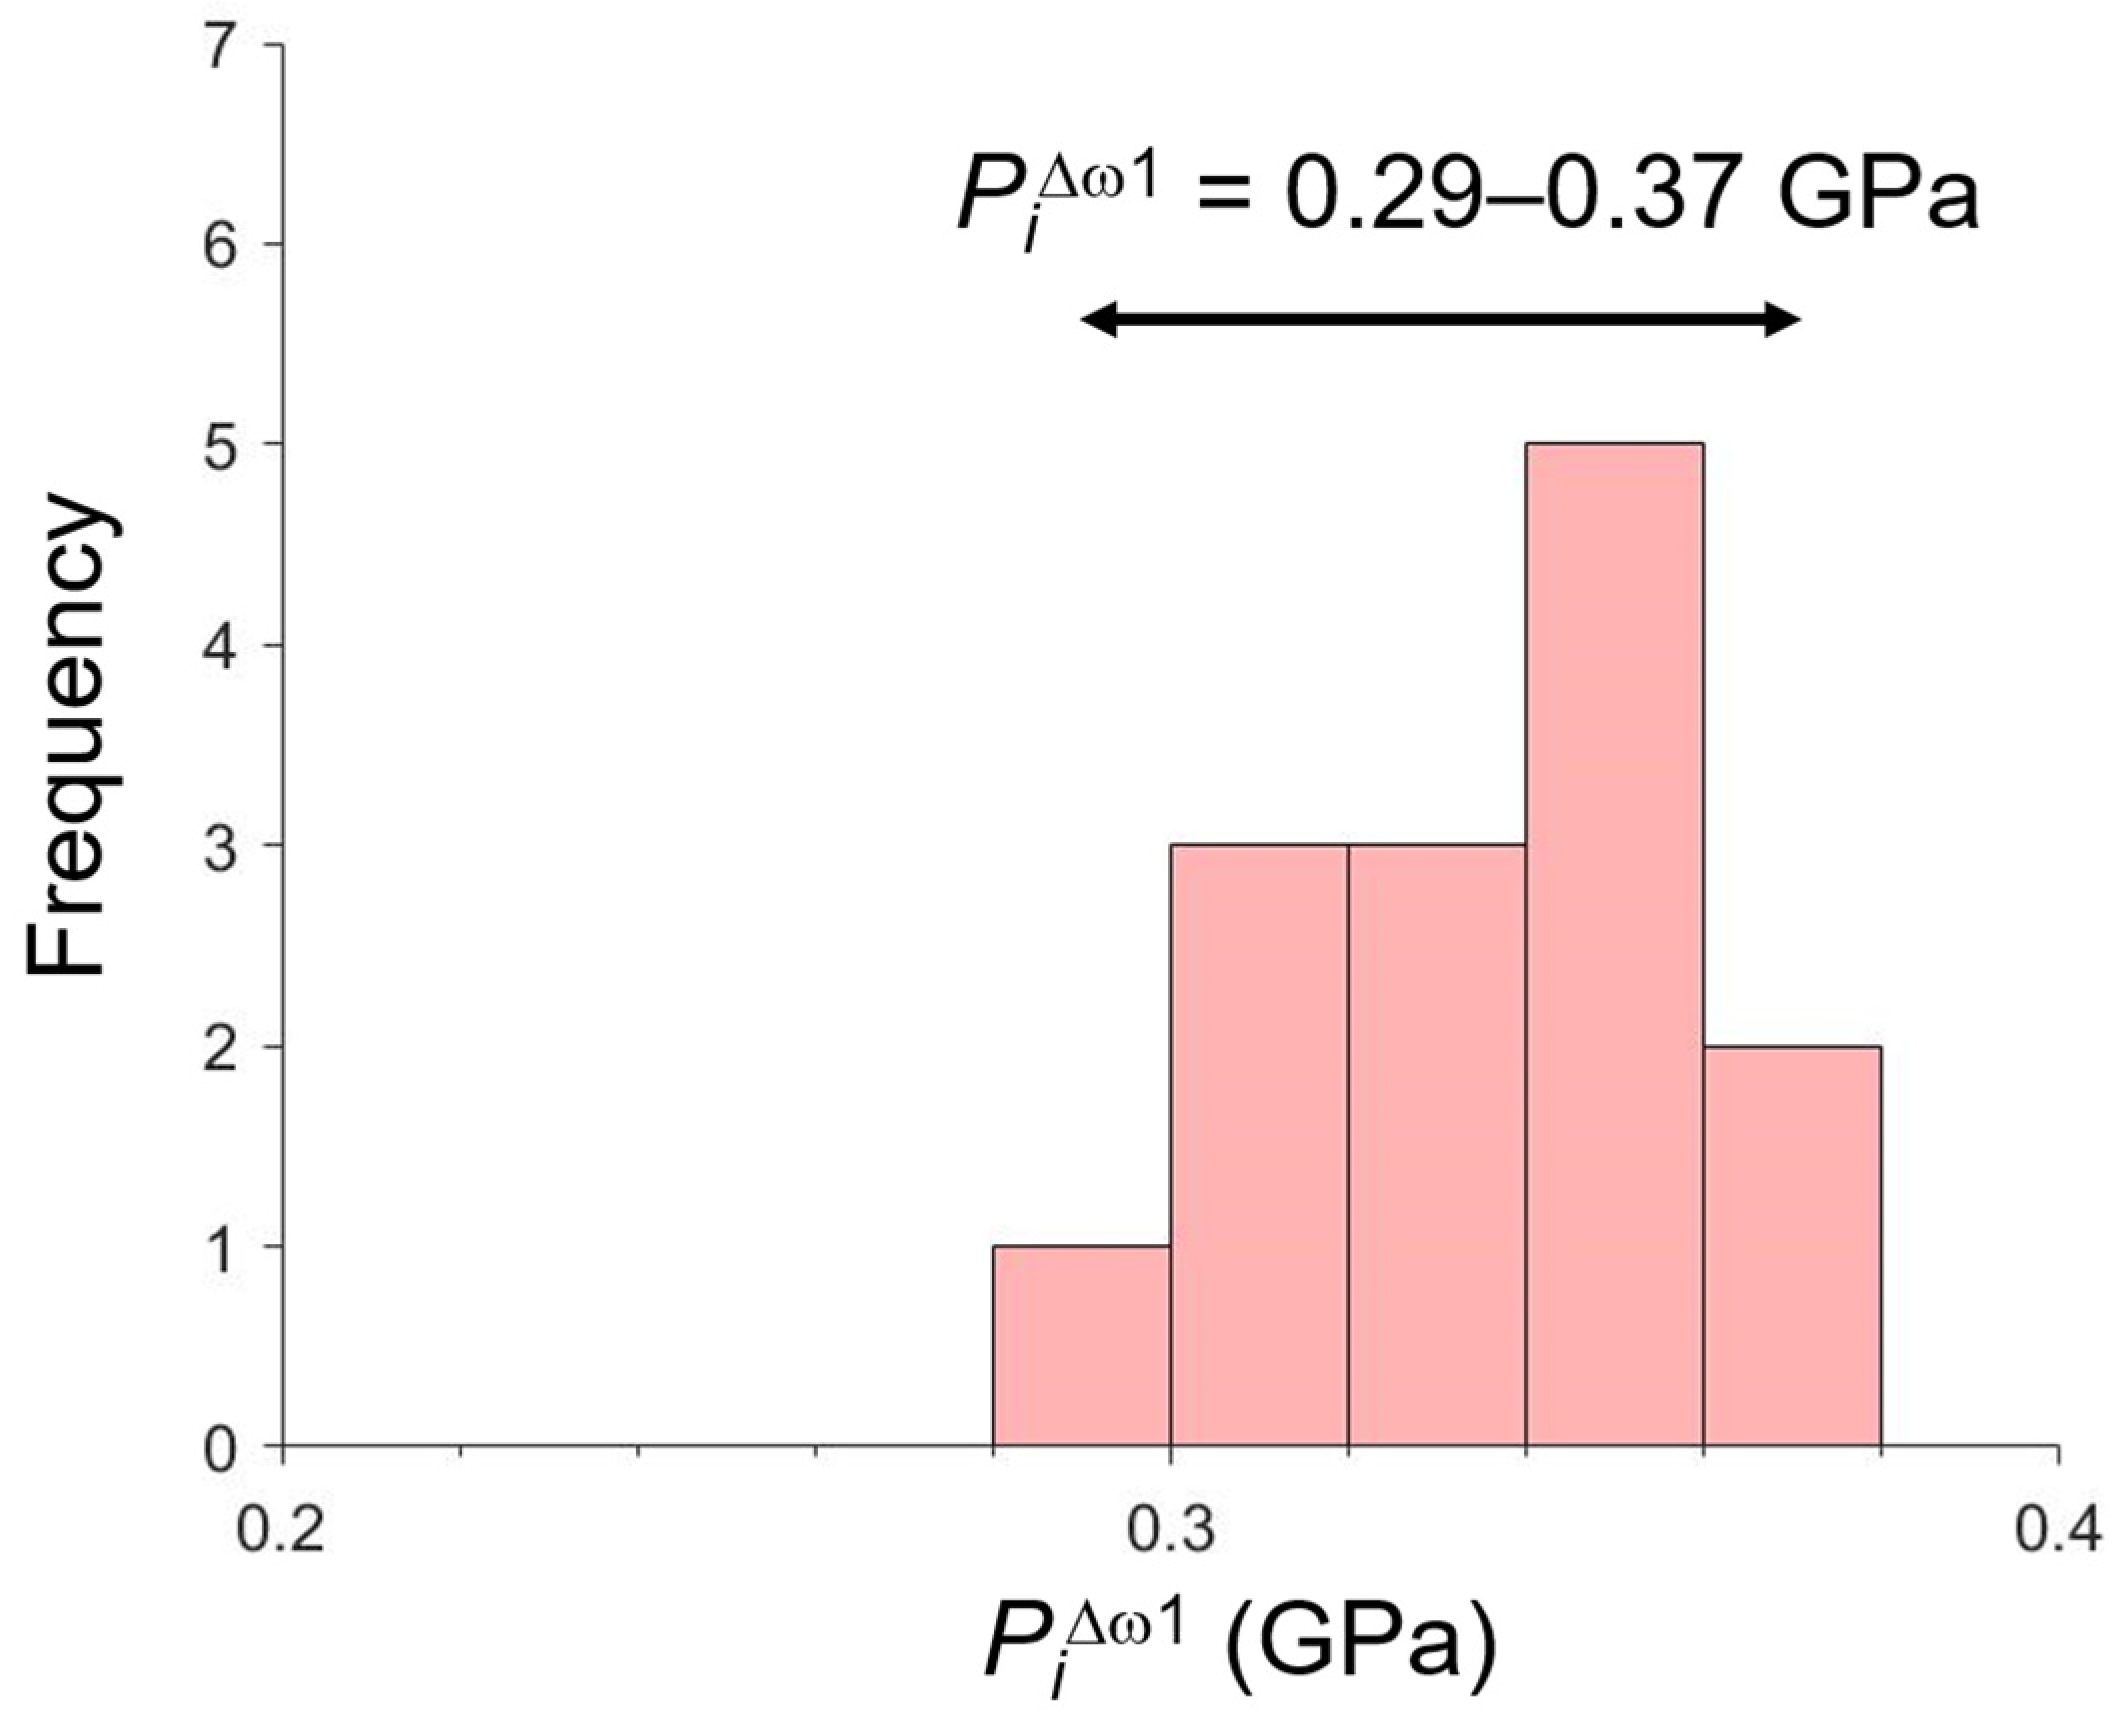
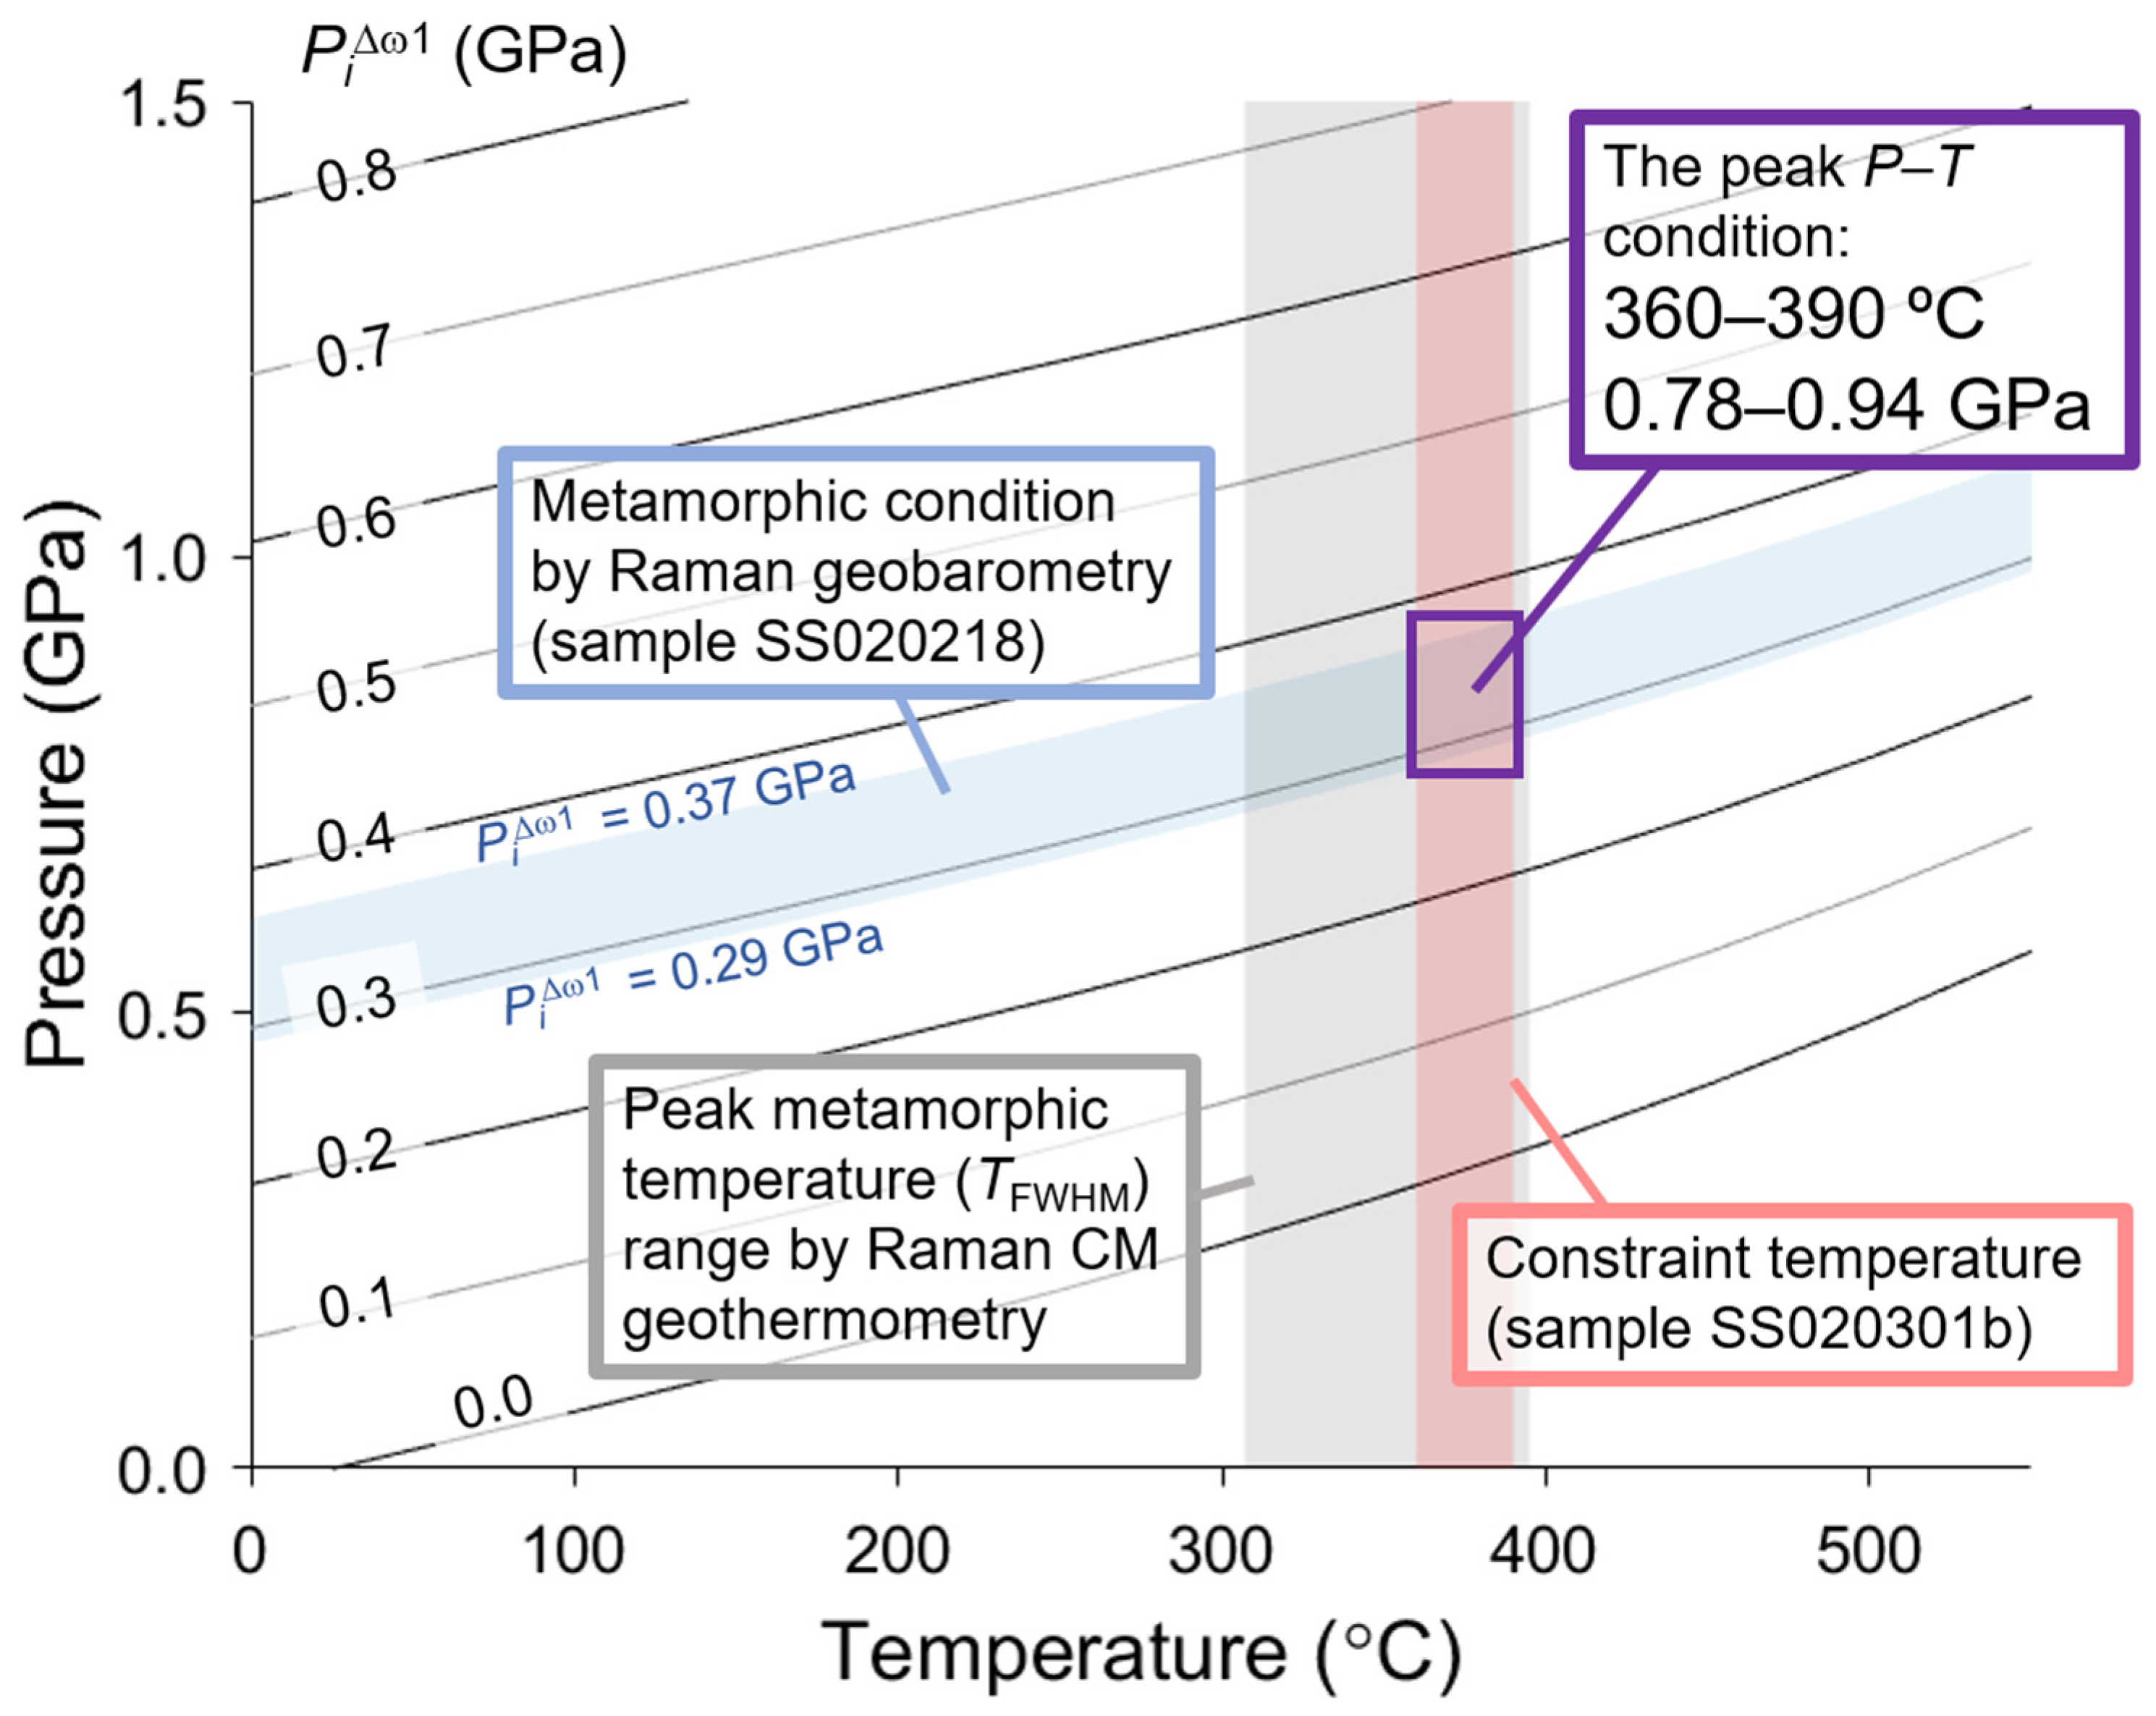
5.2. Raman Geobarometry

Recently, Raman geobarometry, which uses the peak positions of the Raman spectra of inclusions to estimate entrapment metamorphic conditions, has been developed, particularly for quartz inclusion–garnet host pairs (e.g., [12,13,14,35,36,37]). The quartz inclusion is subjected to stresses from the host garnet owing to the difference in elastic properties, even under room conditions, which is called “residual pressure” [12]. The strain of α-quartz can be determined by the Raman peak positions [38]; thus, by converting the strain into residual pressure values (Pi), the entrapment metamorphic conditions can be back-calculated. The quartz exhibited three intense peaks at approximately 464, 205, and 127 cm−1. In this study, the index ω1, which is the wavenumber difference between the 464 and 205 cm−1 peaks (ω1 = ν464 − ν205) proposed by Enami et al. [12], was used to avoid systematic errors. The frequency shifts of a sample were defined as ∆ω1, which is the degree of difference between the standard and the sample: ∆ω1 = ω1standard − ω1sample. The standard deviation of ∆ω1 for standard α-quartz has been reported as ± 0.3 cm−1 for the 1σ level [12].
To obtain accurate metamorphic conditions, the following inclusions were excluded from the analysis: (1) too close to the surface of the host, another inclusion, or a thin section surface (distance/inclusion radius < 1) [39,40]; (2) in contact with cracks in the host garnet [12]; and (3) too large compared with the host (host radius/inclusion radius > 3) [39]. All measurements were performed at the center of the inclusions.
The analyzed quartz inclusions in the garnet hosts were 14 grains in one silicious schist sample (SS020218). Their diameters were 2–10 μm, which were sufficiently smaller than those of the host garnets. The frequency shifts of quartz inclusions were 6.05–7.30 cm−1 in ∆ω1. A photograph of the quartz inclusion with the highest ∆ω1 value is shown in Figure 7.
The ∆ω1 value can be converted into the residual pressure value (Pi∆ω1) using the following formula [41] based on the experimental data of Schmidt and Ziemann [42]:
Pi∆ω1 (MPa) = 2.32 × [∆ω1]2 + 34.31 × ∆ω1
where 0.1 < Pi < 2130 MPa at 23 °C. Applying this formula yielded residual pressure values for quartz inclusions of 0.29–0.37 GPa (Figure 8). See Appendix A for more discussions on residual pressure estimations considering individual peak shifts or strains.

6. Discussion

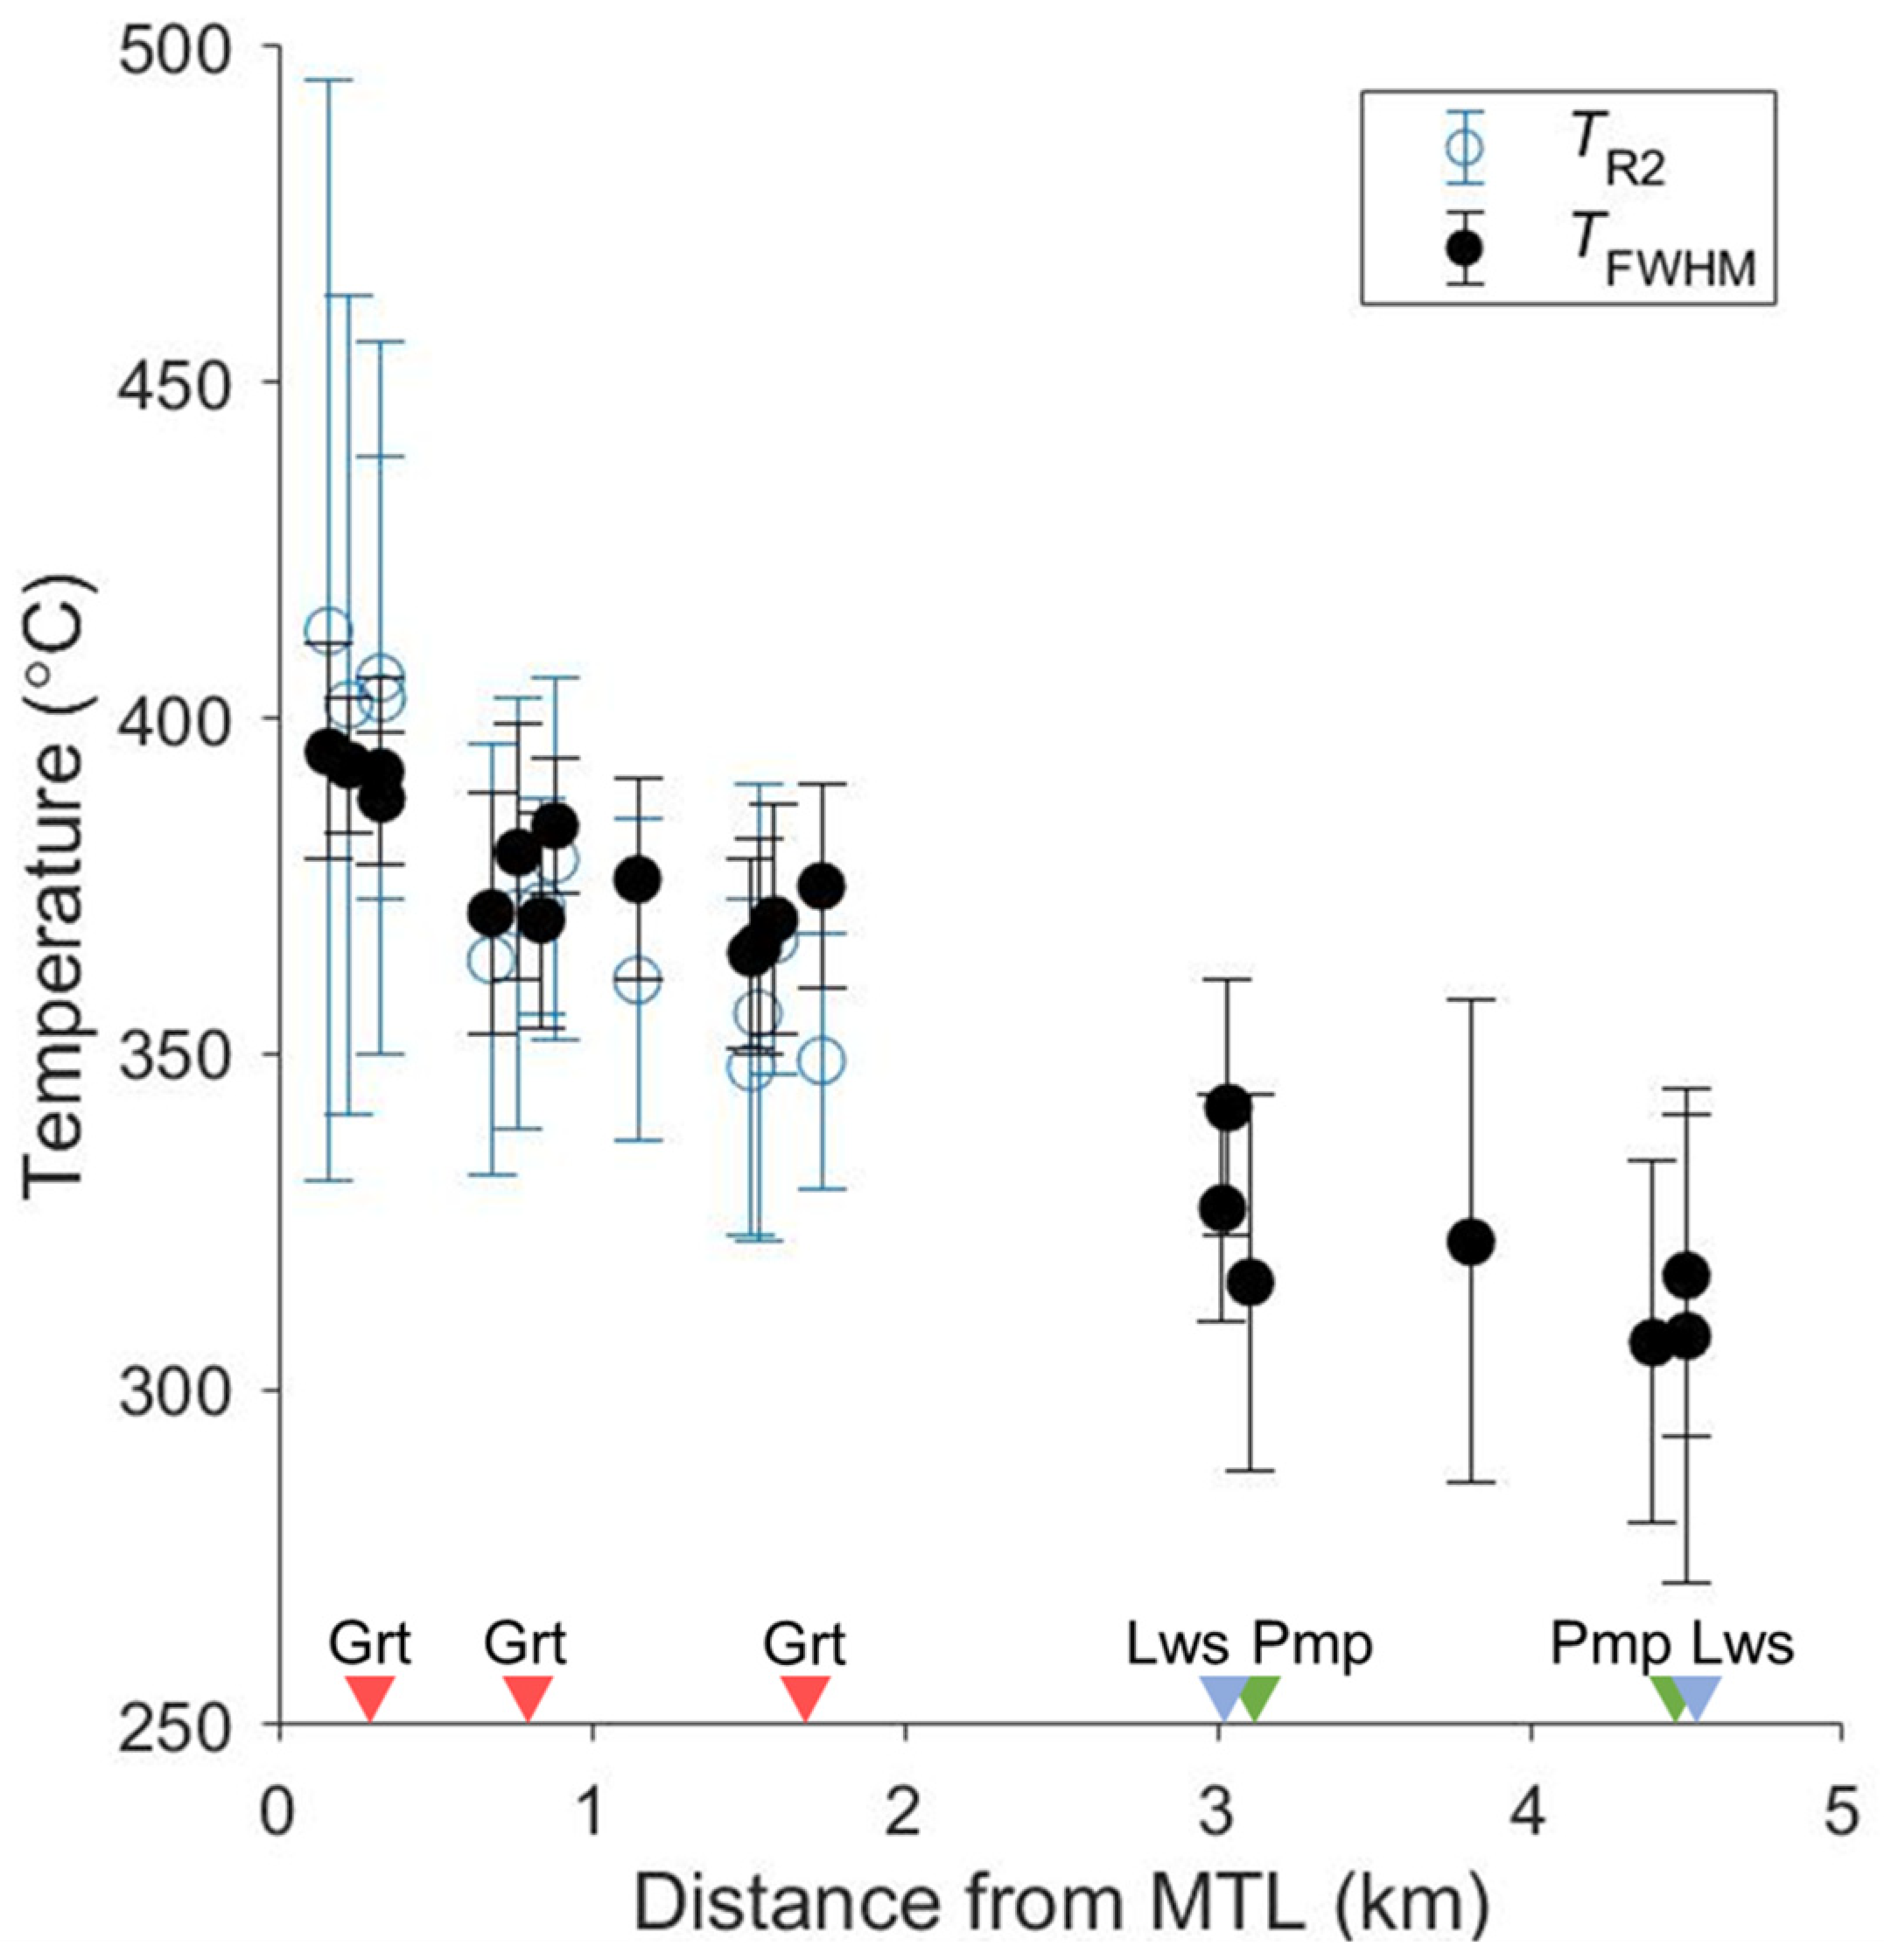
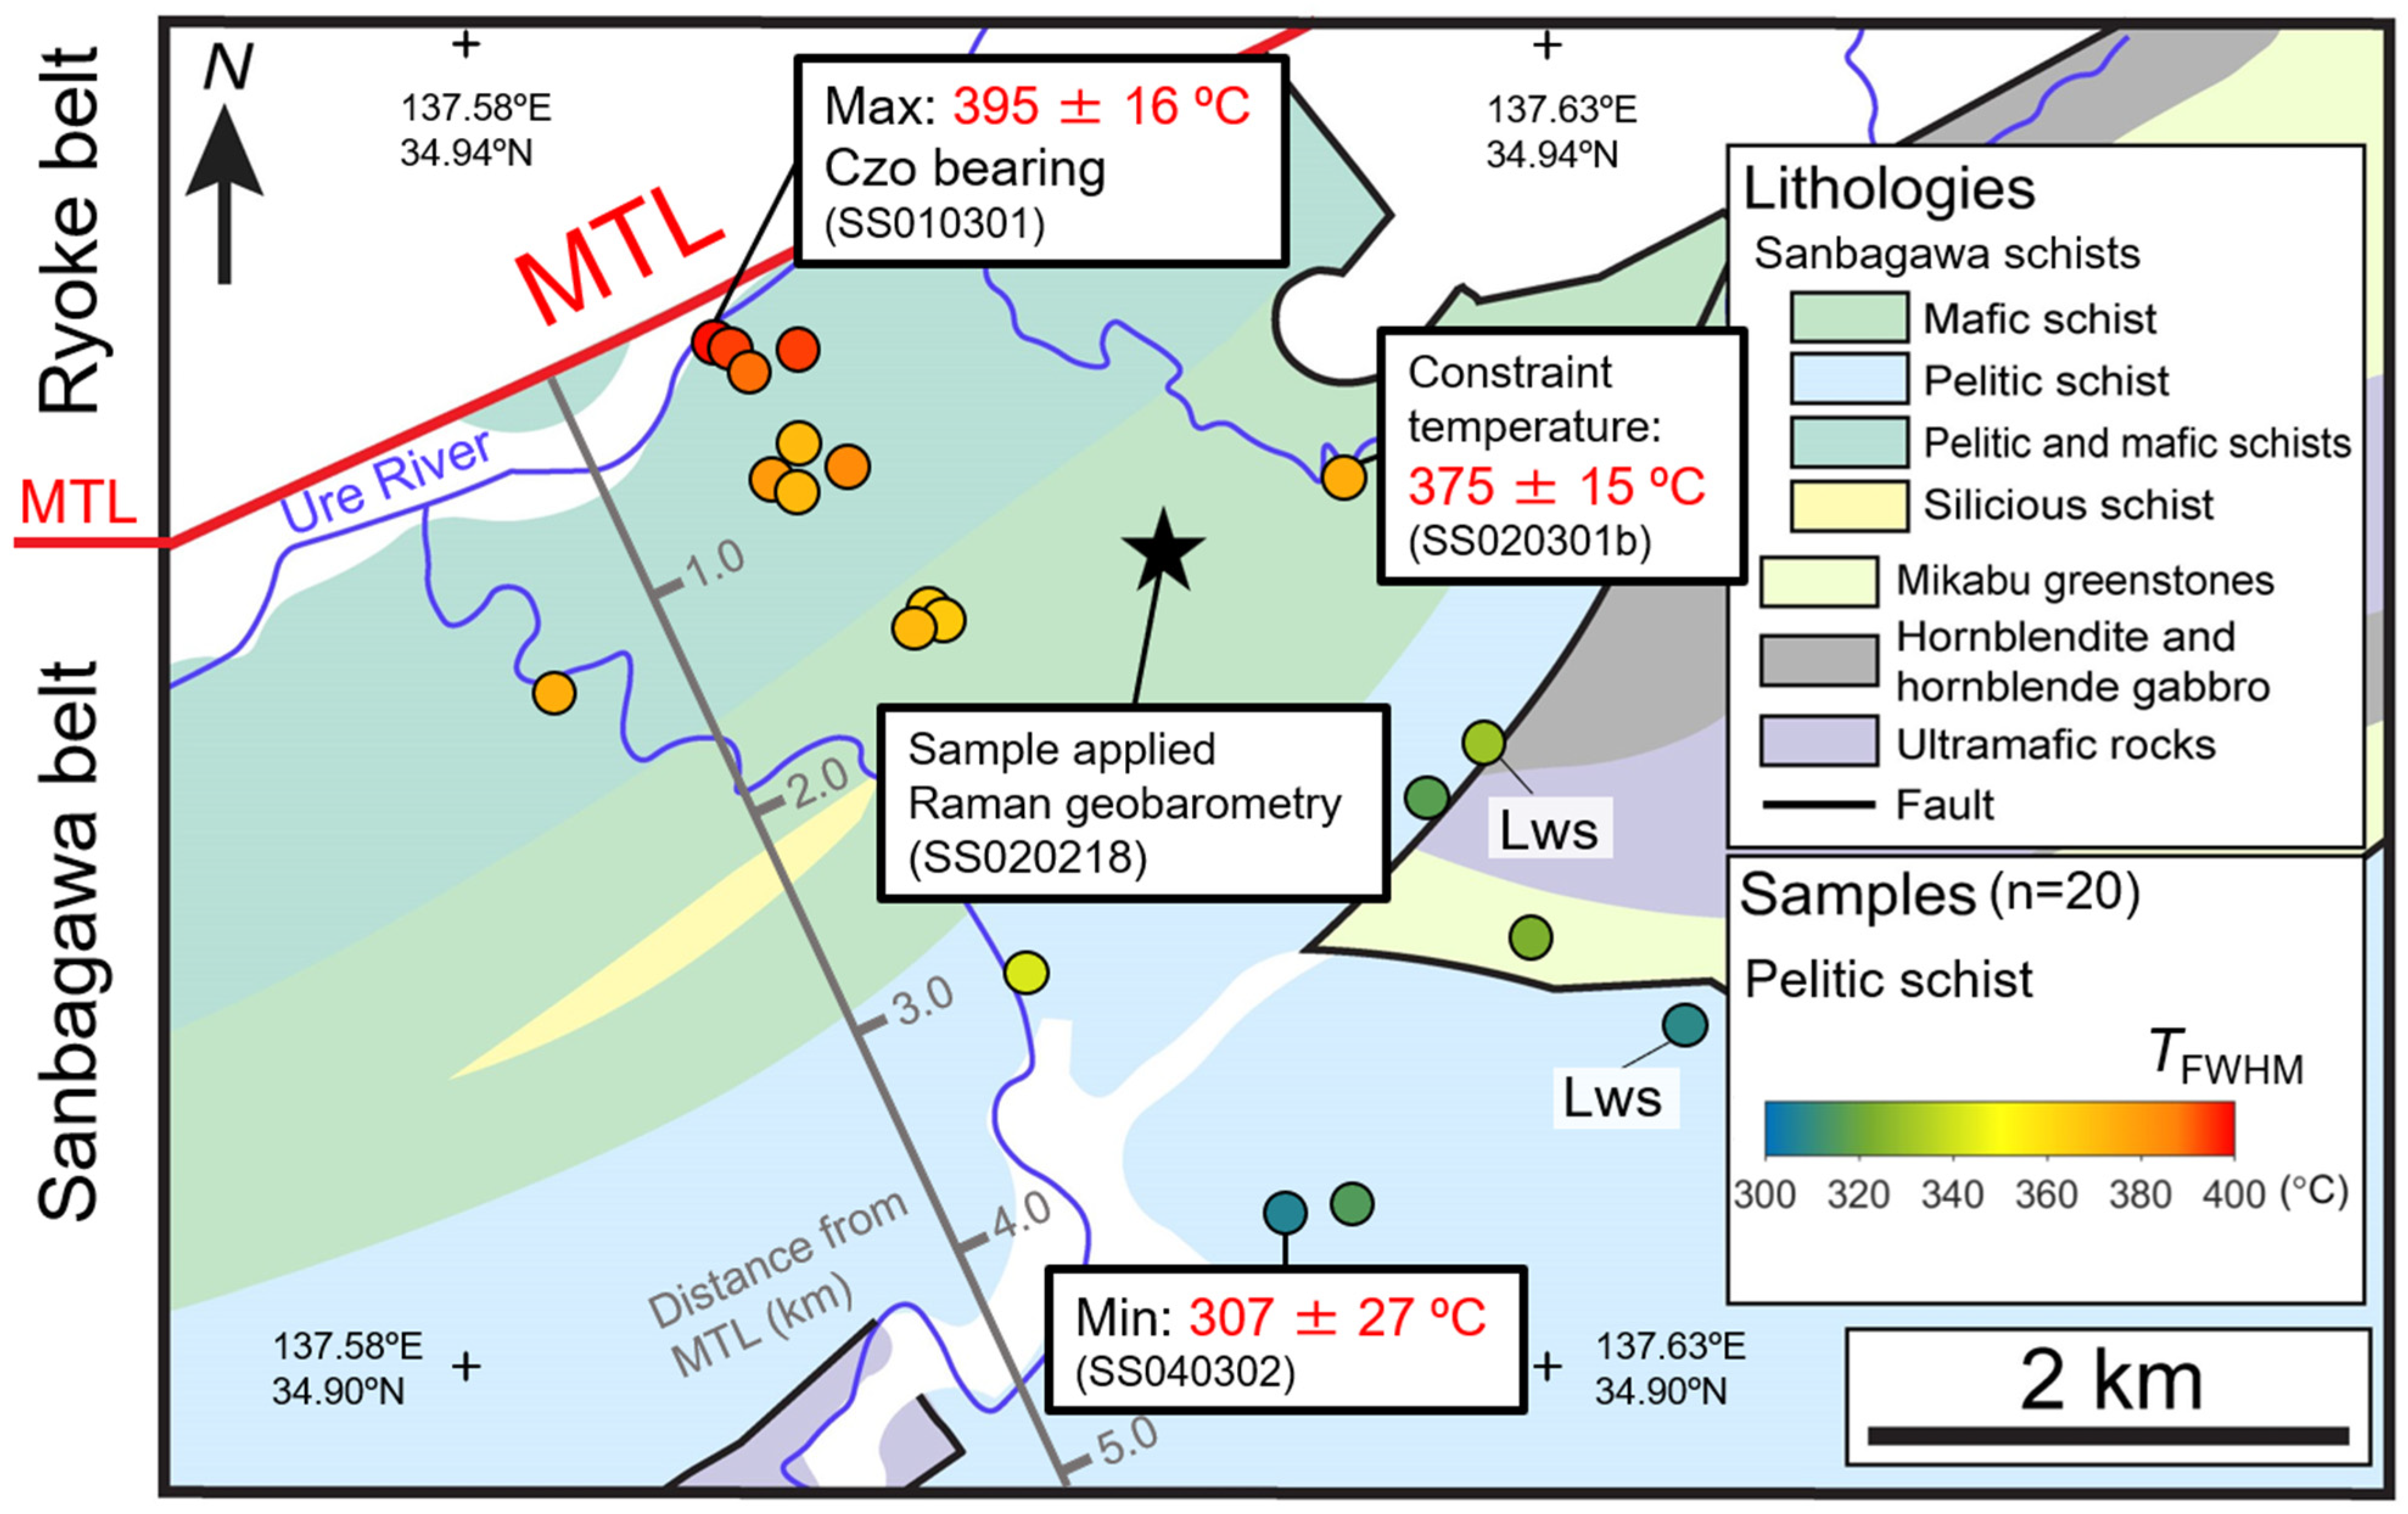
6.1. Metamorphic Thermal Structure

Temperature calculations were performed using two calibration methods, TR2 and TFWHM, which were derived from the equations of Aoya et al. [8] and Kouketsu et al. [10], respectively (Table 2 and Figure 6). The TR2 values of the samples collected close to the MTL (SS010301, SS010302, and SS010304) exhibited unusually large standard deviations (2σ level; 413 ± 82 °C, 402 ± 61 °C, and 403 ± 53 °C, respectively). This scatter trend close to the MTL has also been reported by Mori et al. [43] (1σ level; up to 402 ± 34 °C). Except for these three samples collected close to the MTL, the TR2 and TFWHM values are almost consistent. Therefore, the following discussion uses the TFWHM values obtained from all the pelitic schist samples. The values derived by Raman CM geothermometry recorded the maximum temperature at which the sample was exposed [9].
The temperature values derived by Raman CM geothermometry showed a range of 307 ± 27 to 395 ± 16 °C and an upward trend towards the MTL, northwest of the study area (Figure 6 and Figure 9; Table 2). This trend has been commonly observed in the Sanbagawa belt (e.g., [30,43,44,45]) and is consistent with the distribution trends of the temperature-sensitive metamorphic minerals, such as garnet, pumpellyite, and lawsonite, in the study area (Figure 2).

6.2. Metamorphic Pressure

Although several studies have estimated the peak metamorphic PT conditions of low-grade (chlorite zone) Sanbagawa schists (e.g., [46,47]), such estimates remain relatively limited compared to those for high-grade rocks, primarily due to the difficulty in constraining pressure conditions. For example, Enami et al. [46] estimated the PT range of the chlorite zone in central Shikoku as 0.55–0.65 GPa at 300–360 °C. These pressure values were obtained thermodynamically using the composition of sodic pyroxene, and the temperature values were estimated from the mineral assemblage. In our present study, no sodic pyroxene was collected, and even in central Shikoku, it only appears in limited samples (15 of 223 quartz schists [46]). Therefore, we applied Raman geobarometry using the quartz-inclusions-in-spessartine system as a versatile method, with temperature conditions constrained by Raman CM geothermometry.
The occurrence of a host garnet is known to be highly correlated with metamorphic grade, especially temperature, as an index mineral in the Sanbagawa metamorphic belt [7]. Therefore, its presence can constrain the entrapped temperature of the inclusions. In this area, garnet occurs only in the higher temperature (northwest) part than where sample SS020218 was collected (Figure 2 and Figure 9). In addition, the garnet grains in sample SS020218 show the following features: (1) small grain size (<0.1 mm) (Figure 5), (2) poor chemical zoning (Table 1; Figure 5), and (3) quartz inclusions contained therein retain monotonous residual pressure values of 0.29–0.37 GPa (Figure 8). These characteristics suggest that the garnet grew during a relatively slight change in metamorphic conditions after nucleation. Therefore, we assume that the entrapped temperature of the quartz grains corresponds to the peak metamorphic temperature. In the following discussion, the entrapment conditions of the quartz inclusions are estimated from the range of residual pressure values of quartz inclusions in sample SS020218 (0.29–0.37 GPa), with the associated uncertainties taken into account.
Angel et al. [48] provided EosFit-Pinc software to determine entrapment conditions from the known residual pressure and an equation of state of minerals, which has been widely used (e.g., [36,37,49]). The composition of the host garnet was highly spessartine-rich (75%–78%); therefore, we used the equation of state of the spessartine end member by Angel et al. [50] for the host garnet and of quartz by Angel et al. [11] for the inclusions. The calculated relationship between the residual pressure values of the quartz inclusions in the spessartine garnet and the entrapment PT conditions using EosFit-Pinc ver. 2.20 is shown in Figure 10. The black and gray lines indicate entrapment conditions estimated from the same residual pressure values. The blue shaded area highlights the entrapment conditions constrained in this study based on residual pressure values of 0.29–0.37 GPa.
In this area, different lithologies in the same outcrop commonly share the same schistosity (red dashed lines in Figure 3), suggesting that they experienced the same metamorphic path. This is consistent with the fact that the mineral assemblages of each lithology correspond to the chlorite zone of Higashino [7]. Hence, we used the peak temperature of the closest pelitic schist sample, SS020301b (375 ± 15 °C), as the constraint temperature (Figure 9). The intersection area of 360–390 °C and 0.78–0.94 GPa was derived as the peak temperature metamorphic condition in the central part of the study area (Figure 10).

6.3. Comparison with Metamorphic Index Minerals

The following metamorphic mineral reactions are characteristic of the low-grade Sanbagawa metamorphic rocks:
albite = jadeite + quartz
4lawsonite + albite = paragonite + 2clinozoisite + 2quartz + 6H2O
The relationship between these reaction curves and the peak metamorphic conditions obtained by the Raman spectroscopic analysis in this study is shown in Figure 11a. The derived peak metamorphic conditions of 360–390 °C and 0.78–0.94 GPa are located on the left side of the reaction (i) curve. This is consistent with the fact that the coexistence of quartz and jadeite was not observed in this study. In reaction (ii), we focused on pelitic schists, which show low Fe3+ content because of the abundance of CM, to avoid the influence of the clinozoisite–epidote solid solution. As shown in Table 2, lawsonite and clinozoisite were found in samples at lower and higher temperatures than the sample used for the temperature constraints (SS020301b: 360–390 °C), respectively. In Figure 11a, the derived peak metamorphic conditions are on the left side of the reaction (ii) curve. Although the pressure value of the clinozoisite-bearing sample (SS010301: 379–411 °C) is unknown, assuming it is the same as the central part of this area, its peak metamorphic conditions are likely to be on the right side of the reaction (ii) curve; thus, the combination of Raman CM geothermometry and Raman geobarometry can estimate plausible metamorphic conditions independently of conventional thermodynamic methods.
Sodic amphibole is also a well-known indicator mineral of low-temperature and high-pressure metamorphism, so the previous studies in this area of Seki et al. [23] and Isogai [24] have focused on them and proposed metamorphic zoning. However, the stability field of sodic amphibole is strongly controlled by the whole-rock composition, namely the Na2O and FeO* contents and the Fe3+/Fe2+ ratio [55]. The stability field of the sodic amphibole in the Na2O–CaO–MgO–Al2O3–SiO2–H2O (NCMASH) system calculated by Evans [53] is shown in Figure 11b. The sodic amphibole compositions were twofold (Fe3+-poor for Mg/(Mg + Fe2+) = 0.50, Al/(Al + Fe3+) = 0.85, Fe3+-rich for Mg/(Mg + Fe2+) = 0.50, and Al/(Al + Fe3+) = 0.50, indirectly expressing the Fe3+/Fe2+ ratio from the amount of Mg and Al). Figure 11b shows that only Fe3+-rich sodic amphibole occurred during the peak conditions of the Sanbagawa metamorphic rocks. This suggests that sodic amphiboles are unlikely to have formed under reductive conditions in the Sanbagawa metamorphic belt [56]. Sodic amphibole in this area appears regardless of the metamorphic grade, rising toward the northwest (Figure 2), and does not occur in mafic schist outcrops adjacent to pelitic schists, containing a large amount of CM acting as a reducing agent. Hence, we consider that sodic amphibole is difficult to use as an indicator of metamorphic grade, at least in this area of the Sanbagawa metamorphic belt.

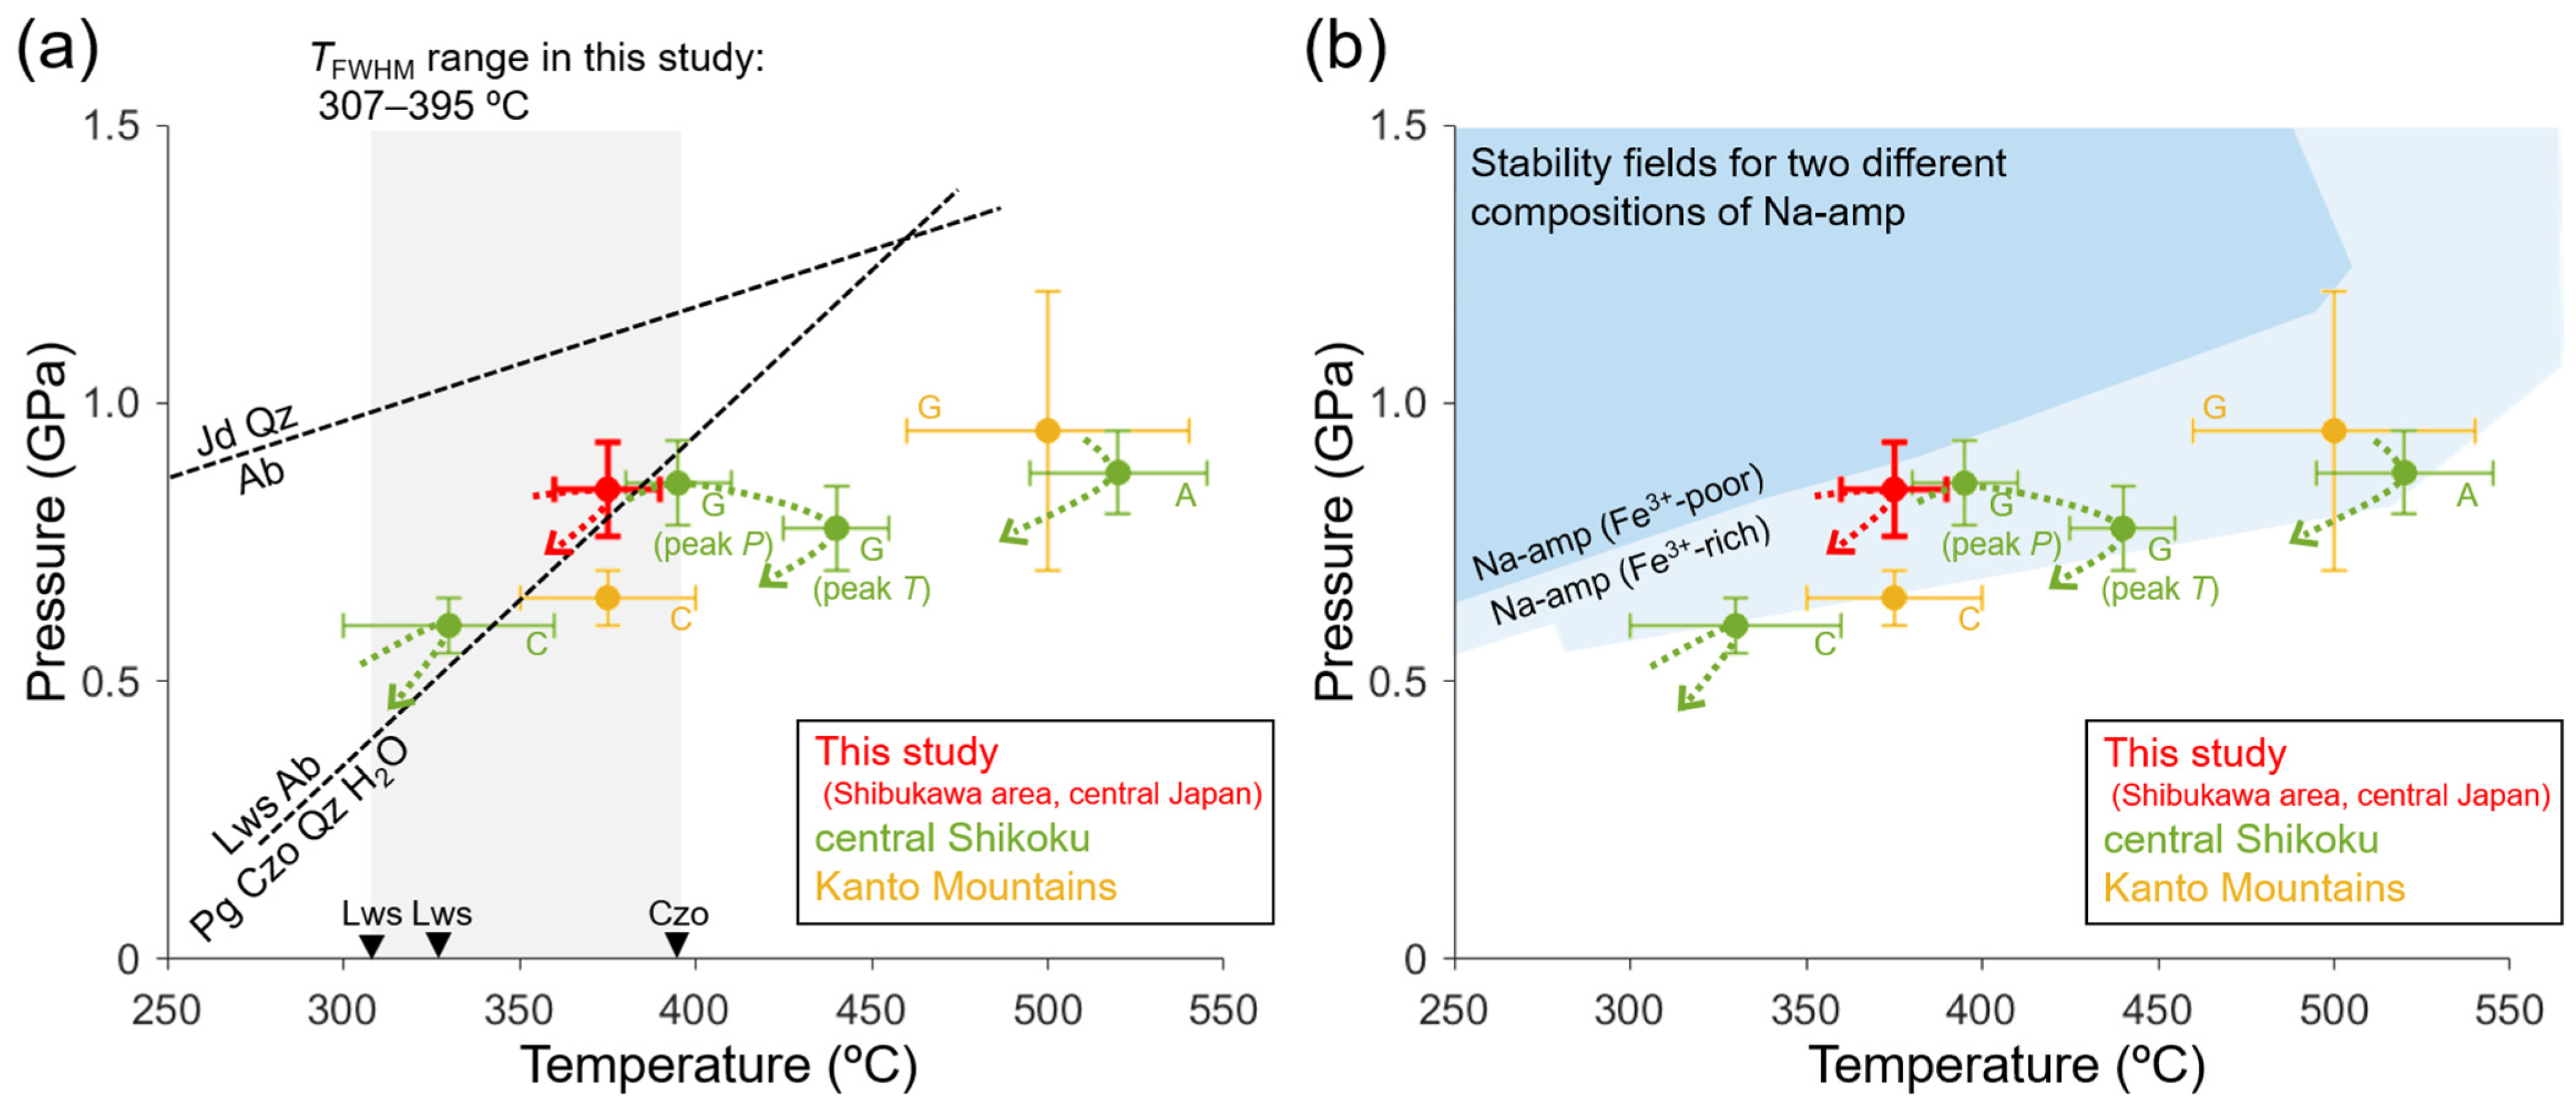
6.4. Comparison with Other Regions

The estimated PT conditions were compared with those of other regions in the Sanbagawa metamorphic belt obtained using thermodynamic methods (Figure 11a,b). The data for central Shikoku are based on metamorphic assemblages and the chemical zoning of sodic pyroxene, which shows increasing XJd from core to rim in the chlorite zone and decreasing XJd from core to rim in the garnet and albite–biotite zones [46]. The data for the Kanto Mountains are from ore minerals (chlorite zone) [47] and iron–manganese-rich nodules (garnet zone) [51]. The clockwise bulging PT paths of high-grade Sanbagawa schists in central Shikoku [46] are considered to have been caused by the approach of the young oceanic lithosphere (e.g., [54,57,58,59,60]; shown as green arrows in Figure 11a,b).
The peak PT conditions in the central part of this area of 360–390 °C and 0.78–0.94 GPa are similar to the peak pressure conditions of the garnet zone in central Shikoku (Figure 11a,b). The temperature value determined by Raman CM geothermometry represents the peak temperature experienced by the sample [9]; therefore, the metamorphic rocks in the central part of this area are considered to have been exhumed avoiding further heating events (shown as red arrows in Figure 11a,b).
The differences between the study area and central Shikoku are attributed to the following possible factors: (1) rocks in this area were exhumed before or after the heating event (time difference); (2) the heating event was not prominent in this area (spatial difference); and (3) rocks in this area have undergone heating events when in further low T–high P conditions. Since Raman geothermometry provides only the peak temperature [9] and there are no geochronological data in the study area, it is difficult to constrain the three factors at present. However, regardless of the contributing factor(s), this study suggests that there are subtle variations in the metamorphic PT paths, i.e., tectonic setting, within the low-grade metamorphic rocks of the extensive east–west-trending Sanbagawa belt.

7. Conclusions

(1)
The Sanbagawa schists in the Shibukawa area, central Japan, show peak metamorphic temperature values of 307 ± 27 °C to 395 ± 16 °C with Raman CM geothermometry, which increase from the southeast towards the MTL. This trend is consistent with the occurrence of temperature-sensitive metamorphic minerals.
(2)
A garnet-bearing siliceous schist underwent Raman geobarometry using a quartz-inclusion-in-spessartine system. In combination with the temperature of the nearby pelitic schist sample, a peak PT condition of 0.78–0.94 GPa at 360–390 °C was derived. This condition is similar to the peak pressure condition of the garnet zone in central Shikoku.
The combination of Raman CM geothermometry and Raman geobarometry (Raman geothermobarometry) independent of thermodynamic methods is applicable to low-grade metamorphic rocks.

Author Contributions

Conceptualization, Y.T., Y.K., and K.M.; methodology, Y.T., Y.K., and K.M.; software, Y.T. and Y.K.; validation, Y.T., Y.K., and K.M.; formal analysis, Y.T.; investigation, Y.T. and K.M.; resources, Y.T. and Y.K.; data curation, Y.T.; writing—original draft preparation, Y.T.; writing—review and editing, Y.K. and K.M.; visualization, Y.T.; supervision, Y.K. and K.M.; project administration, K.M.; funding acquisition, Y.K. and K.M. All authors have read and agreed to the published version of the manuscript.

Funding

This work was supported by research grants awarded to Y.K. (20KK0078 and 21H01188) and K.M. (16H06347 and 20H02005) from the Japan Society for the Promotion of Science (JSPS).

Data Availability Statement

Data will be made available on request.

Acknowledgments

We are grateful to M. Enami and all the members of the Rock and Mineral Laboratory at Nagoya University for their useful advice.

Conflicts of Interest

The authors declare that they have no conflicts of interest.

Abbreviations

The following abbreviations are used in this manuscript:
CMCarbonaceous material
EPMAElectron probe microanalyzer
MTLMedian Tectonic Line
PTpressure–temperature

Appendix A. Residual Pressure Estimation

In recent years, various methods for deriving the residual pressure of inclusions within host minerals have been proposed (e.g., [12,13,14,35,36,37]). The most common method is to determine the residual pressure value from the shift of the prominent Raman peaks. Schmidt and Ziemann [42] performed a hydrothermal diamond anvil cell experiment to obtain an equation relating the amount of shift in quartz Raman peaks to pressure. Based on their experimental results, the residual pressure values (Pi∆ν464 and Pi∆ν205) can be derived from the following formulae:
Pi∆ν464 (MPa) = 0.36 × [∆ν464]2 + 110.86 × ∆ν464
Pi∆ν205 (MPa) = 0.46 × [∆ν205]2 + 31.66 × ∆ν205
where ∆ν464 and ∆ν205 are shifts of 464 and 205 cm−1 peaks in sample quartz from the standard under 0.1 < Pi < 2130 MPa at 23 °C. As a precaution for this method, since the Raman peaks drift with changes in room temperature, it is necessary to constantly measure the standard or simultaneously measure the emission line of a neon lamp in order to evaluate a slight peak shift due to residual pressure. To reduce these measurement errors, Enami et al. [12] proposed a method that employs the distance between two peaks of the quartz Raman spectrum (ω1 = ν464 − ν205, see details in the main text). The difference between the sample quartz and standard quartz for this parameter is expressed by ∆ω1. Referring to the experimental results of Schmidt and Ziemann [42], the relationship between ∆ω1 and residual pressure can be expressed by the following equation [41]:
Pi∆ω1 (MPa) = 2.32 × [∆ω1]2 + 34.31 × ∆ω1
where 0.1 < Pi < 2130 MPa at 23 °C. Applying these formulae yielded residual pressure values for quartz inclusions of 0.18–0.39 GPa (Pi∆ν464), 0.28–0.39 GPa (Pi∆ν205), and 0.29–0.37 GPa (Pi∆ω1) (Figure A1a–c and Table A1).
Figure A1. Histograms showing the calculated residual pressure ((a) Pi∆ω1, (b) Pi∆ν464, (c) Pi∆ν205, and (d) Pistrains) frequency. (a) The same as in Figure 8.
Minerals 15 00724 g0a1
Table A1. Results of Raman geobarometry. The parameters ∆ν464, ∆ν205, and ∆ν127 indicate the difference between the standard and sample for each of the particularly intense quartz Raman peaks at approximately 464, 205, and 127 cm−1, respectively. The strain (ε1 + ε2 and ε3) values are calculated using stRAinMAN software [38].
Sample∆ν464 (cm−1)∆ν205 (cm−1)∆ν127 (cm−1)∆ω1 (cm−1)Pi∆ω1 (GPa)Pi∆ν464 (GPa)Pi∆ν205 (GPa)|Pi∆ν464Pi∆ν205| (GPa)ε1 + ε2ε3Pistrains (GPa)
SS020218_Grt2_Qz13.309.892.296.590.330.370.360.01−0.014 (4)0.001 (2)0.37
SS020218_Grt5_Qz13.4310.732.347.300.370.380.390.01−0.017 (4)0.002 (2)0.42
SS020218_Grt5_Qz23.4410.362.486.920.350.390.380.01−0.014 (4)0.000 (3)0.40
SS020218_Grt7_Qz13.119.301.766.190.300.350.330.02−0.0149 (8)0.0018 (5)0.37
SS020218_Grt9_Qz22.579.391.666.820.340.290.340.05−0.019 (3)0.0044 (20)0.39
SS020218_Grt9_Qz33.3410.212.316.870.350.370.370.00−0.015 (4)0.001 (2)0.40
SS020218_Grt10_Qz13.3710.282.526.910.350.380.370.01−0.014 (5)0.000 (3)0.40
SS020218_Grt10_Qz23.2310.252.227.020.360.360.370.01−0.016 (4)0.002 (2)0.39
SS020218_Grt10_Qz33.3410.112.316.770.340.370.370.00−0.014 (4)0.001 (2)0.37
SS020218_Grt14_Qz13.459.972.826.520.320.390.360.03−0.011 (6)−0.002 (4)0.39
SS020218_Grt15_Qz12.438.481.636.050.290.270.300.03−0.016 (3)0.0031 (20)0.35
SS020218_Grt18_Qz11.637.811.226.180.300.180.280.10−0.019 (4)0.006 (3)0.34
SS020218_Grt18_Qz23.409.702.546.300.310.380.350.03−0.011 (5)−0.001 (3)0.35
SS020218_Grt18_Qz33.1810.422.547.240.370.360.380.02−0.016 (6)0.001 (4)0.43
Standardν464 (cm−1)ν205 (cm−1)ν127 (cm−1)ω1 (cm−1)
12/10/2021464.44206.01127.64258.43
30/11/2021464.33205.83127.41258.50
07/12/2021463.90205.35126.81258.55
Note that quartz inclusions are not strictly under static stress, as assumed in Schmidt and Ziemann [42], because they are elastically anisotropic. In the last several years, methods using phonon-mode Grüneisen tensors that do not assume static equilibrium for inclusions have been developed (e.g., [36,38]). In this study, the residual pressure as an average stress derived by strains (Pistrains) was calculated following Bonazzi et al. [36] to ascertain the effect of the calculation assuming static equilibrium.
Quartz is trigonal, so two symmetry-independent strains are defined: ε1 = ε2 (along a and b axis) and ε3 (along c axis); therefore, σ1 = σ2 and σ3 are non-zero under no shear stress conditions. The matrix relationship of strain and stress is σi = cijεj, where cij is the elastic modulus matrix [61]. Strains in the crystal are observed as a change in the Raman peak shift (e.g., [38]), and this relationship is defined by the values of the components of the phonon-mode Grüneisen tensor. As the values of Grüneisen tensors of quartz were determined by Murri et al. [62], we can obtain the value of strains (ε1 = ε2 and ε3) per quartz inclusions using stRAinMAN software [38] using the three intense Raman peaks of quartz at approximately 464, 205, and 127 cm−1. The elastic moduli of quartz determined at room pressure (c11 and c33) are by Wang et al. [63]. The yielded Pistrains values as the mean stress ((2σ1 + σ3)/3) are 0.33–0.42 GPa (Table A1; Figure A1d).
In this study, we derived residual pressure values (Pi) by four methods: Pi∆ν464, Pi∆ν205, Pi∆ω1, and Pistrains (Table A1; Figure A1). The former three are based on calculations assuming static equilibrium, while the anisotropy of strain in the quartz inclusions is taken into account in Pistrains. The results of Pi∆ν464 and Pi∆ν205 have a larger variation and are slightly on the high-pressure side than that of Pi∆ω1. They show almost similar values of |Pi∆ν464Pi∆ν205| ≤ 0.03 GPa, except for two grains (Table A1). The residual pressure values using strain (Pistrains) are higher than those of the other three methods.
It is difficult to determine which is more appropriate for estimating the residual pressure, assuming static equilibrium or anisotropic strain. However, even though the residual pressure determined from the two peaks (Pi∆ν464 and Pi∆ν205) are almost similar, i.e., the anisotropy of inclusions seems to be small, Pistrains with anisotropy taken into account shows higher values. Two grains with exceptionally large |Pi∆ν464Pi∆ν205| (0.05 and 0.10 GPa, respectively) do not show large Pistrains (Table A1). In other words, the factor that causes Pistrains to have slightly higher values than the other three methods is unclear. Therefore, in the present study, we assume static equilibrium as a first approximation and adopt Pi∆ω1, which can avoid systematic errors due to a single peak calculation in the main text.

References

  1. Bourdelle, F. Low-Temperature Chlorite Geothermometry and Related Recent Analytical Advances: A Review. Minerals 2021, 11, 130. [Google Scholar] [CrossRef]
  2. Petroccia, A.; Forshaw, J.B.; Lanari, P.; Iaccarino, S.; Montomoli, C.; Carosi, R. Pressure and Temperature Estimation in Greenschist-Facies Metapelites: An Example From Variscan Belt in Sardinia. J. Metamorph. Geol. 2025, 43, 21–46. [Google Scholar] [CrossRef]
  3. Wallis, S.R.; Okudaira, T. Paired metamorphic belts of SW Japan: The geology of the Sanbagawa and Ryoke metamorphic belts and the Median Tectonic Line. In The Geology of Japan; Moreno, T., Wallis, S.R., Kojima, T., Gibbons, W., Eds.; Geological Society: London, UK, 2016; pp. 101–124. [Google Scholar]
  4. Aoya, M. PTD Path of Eclogite from the Sambagawa Belt Deduced from Combination of Petrological and Microstructural Analyses. J. Petrol. 2001, 42, 1225–1248. [Google Scholar] [CrossRef]
  5. Endo, S.; Wallis, S.R.; Hirata, T.; Anczkiewicz, R.; Platt, J.P.; Thirlwall, M.; Asahara, Y. Age and early metamorphic history of the Sanbagawa belt: Lu–Hf and PT constraints from the Western Iratsu eclogite. J. Metamorph. Geol. 2009, 27, 371–384. [Google Scholar] [CrossRef]
  6. Wallis, S.; Aoya, M. A re-evaluation of eclogite facies metamorphism in SW Japan: Proposal for an eclogite nappe. J. Metamorph. Geol. 2000, 18, 653–664. [Google Scholar] [CrossRef]
  7. Higashino, T. The higher grade metamorphic zonation of the Sambagawa metamorphic belt in central Shikoku, Japan. J. Metamorph. Geol. 1990, 8, 413–423. [Google Scholar] [CrossRef]
  8. Aoya, M.; Kouketsu, Y.; Endo, S.; Shimizu, H.; Mizukami, T.; Nakamura, D.; Wallis, S. Extending the applicability of the Raman carbonaceous-material geothermometer using data from contact metamorphic rocks. J. Metamorph. Geol. 2010, 28, 895–914. [Google Scholar] [CrossRef]
  9. Beyssac, O.; Goffé, B.; Chopin, C.; Rouzaud, J.N. Raman spectra of carbonaceous material from metasediments: A new geothermometer. J. Metamorph. Geol. 2002, 20, 859–871. [Google Scholar] [CrossRef]
  10. Kouketsu, Y.; Mizukami, T.; Mori, H.; Endo, S.; Aoya, M.; Hara, H.; Nakamura, D.; Wallis, S. A new approach to develop the Raman carbonaceous material geothermometer for low-grade metamorphism using peak width. Isl. Arc 2014, 23, 33–50. [Google Scholar] [CrossRef]
  11. Angel, R.J.; Alvaro, M.; Miletich, R.; Nestola, F. A simple and generalised PTV EoS for continuous phase transitions, implemented in EosFit and applied to quartz. Contrib. Mineral. Petrol. 2017, 172, 29. [Google Scholar] [CrossRef]
  12. Enami, M.; Nishiyama, M.; Mouri, T. Laser Raman microspectrometry of metamorphic quartz: A simple method for comparison of metamorphic pressures. Am. Mineral. 2007, 92, 1303–1315. [Google Scholar] [CrossRef]
  13. Morana, M.; Mihailova, B.; Angel, R.J.; Alvaro, M. Quartz metastability at high pressure: What new can we learn from polarized Raman spectroscopy? Phys. Chem. Miner. 2020, 47, 34. [Google Scholar] [CrossRef]
  14. Kouketsu, Y.; Nishiyama, T.; Ikeda, T.; Enami, M. Evaluation of residual pressure in an inclusion-host system using negative frequency shift of quartz Raman spectra. Am. Mineral. 2014, 99, 433–442. [Google Scholar] [CrossRef]
  15. Makimoto, H.; Yamada, N.; Mizuno, K.; Takada, A.; Komazawa, M.; Sudo, S. Geological Map of Japan 1: 200,000, Toyohashi and Irago Misaki; Geological Survey of Japan; AIST: Tsukuba, Japan, 2004; (In Japanese with English Abstract). [Google Scholar]
  16. Miyashiro, A. Metamorphism and related magmatism in plate tectonics. Am. J. Sci. 1972, 272, 629–656. [Google Scholar] [CrossRef]
  17. Banno, S.; Sakai, C. Geology and metamorphic evolution of the Sanbagawa metamorphic belt, Japan. Geol. Soc. Lond. Spec. Publ. 1989, 43, 519–532. [Google Scholar] [CrossRef]
  18. Goto, M. The geology of the Sambagawa belt in the River Tenryu district, Shizuoka Prefecture. In Tectonics and Metamorphism (The Hara Volume); Shimamoto, T., Hayasaka, Y., Shiota, T., Oda, M., Takeshita, T., Yokoyama, S., Ohtomo, Y., Eds.; Soubun Co., Ltd.: Tokyo, Japan, 1996; pp. 70–77, (In Japanese with English Abstract). [Google Scholar]
  19. Tagiri, M.; Yago, Y.; Tanaka, A. Shuffled-cards structure and different P/T conditions in the Sanbagawa metamorphic belt, Sakuma-Tenryu area, central Japan. Isl. Arc 2000, 9, 188–203. [Google Scholar] [CrossRef]
  20. Endo, S.; Wallis, S.R. Structural architecture and low-grade metamorphism of the Mikabu-Northern Chichibu accretionary wedge. J. Metamorph. Geol. 2017, 35, 695–716. [Google Scholar] [CrossRef]
  21. Mouri, K.; Enami, M. Chemical compositions of minerals from the Kichijosan and Joyama complexes in the Sanbagawa metamorphic belt, central Japan. Bull. Nagoya Univ. Mus. (Furukawa Mus.) 1988, 4, 15–30, (In Japanese with English Abstract). [Google Scholar]
  22. Shioya, H.; Michibayashi, K.; Kouketsu, Y.; Enami, M. Reconfirmation of jadeite in the Sanbagawa belt of the Shibukawa region, central Japan: Occurrence within a veinlet cutting dunite. J. Geol. Soc. Jpn. 2021, 127, 59–65, (In Japanese with English Abstract). [Google Scholar] [CrossRef]
  23. Seki, Y.; Aiba, M.; Kato, C. Metamorphic zoning of the Sanbagawa terrain in the Sibukawa district, central Japan. J. Geol. Soc. Jpn. 1959, 65, 618–623, (In Japanese with English Abstract). [Google Scholar] [CrossRef]
  24. Isogai, K. The Sambagawa Metamorphism in the Westernpart of Central Japan. In Sambagawa Belt; Hide, K., Ed.; Hiroshima University Press: Hiroshima, Japan, 1977; pp. 237–245, (In Japanese with English Abstract). [Google Scholar]
  25. Warr, L.N. IMA–CNMNC approved mineral symbols. Mineral. Mag. 2021, 85, 291–320. [Google Scholar] [CrossRef]
  26. Locock, A.J. An Excel spreadsheet to recast analyses of garnet into end-member components, and a synopsis of the crystal chemistry of natural silicate garnets. Comput. Geosci. 2008, 34, 1769–1780. [Google Scholar] [CrossRef]
  27. French, B.M. Graphitization of organic material in a progressively metamorphosed Precambrian iron formation. Science 1964, 146, 917–918. [Google Scholar] [CrossRef]
  28. Tagiri, M. A measurement of the graphitizing-degree by the X-ray powder diffractometer. J. Jpn. Assoc. Mineral. Petrol. Econ. Geol. 1981, 76, 345–352. [Google Scholar] [CrossRef]
  29. Mori, K.; Taguchi, K. Examination of the low-grade metamorphism in the Shimanto Belt by vitrinite reflectance. Mod. Geol. 1988, 12, 325–339. [Google Scholar]
  30. Kouketsu, Y.; Sadamoto, K.; Umeda, H.; Kawahara, H.; Nagaya, T.; Taguchi, T.; Mori, H.; Wallis, S.; Enami, M. Thermal structure in subducted units from continental Moho depths in a paleo subduction zone, the Asemigawa region of the Sanbagawa metamorphic belt, SW Japan. J. Metamorph. Geol. 2021, 39, 727–749. [Google Scholar] [CrossRef]
  31. Skrzypek, E. First- and second-order Raman spectra of carbonaceous material through successive contact and regional metamorphic events (Ryoke belt, SW Japan). Lithos 2021, 388–389, 106029. [Google Scholar] [CrossRef]
  32. Ferrari, A.C.; Robertson, J. Interpretation of Raman spectra of disordered and amorphous carbon. Phys. Rev. B 2000, 61, 95–107. [Google Scholar] [CrossRef]
  33. Lahfid, A.; Beyssac, O.; Deville, E.; Negro, F.; Chopin, C.; Goffé, B. Evolution of the Raman spectrum of carbonaceous material in low-grade metasediments of the Glarus Alps (Switzerland). Terra Nova 2010, 22, 354–360. [Google Scholar] [CrossRef]
  34. Tuinstra, F.; Koenig, J.L. Raman spectrum of graphite. J. Chem. Phys. 1970, 53, 1126–1130. [Google Scholar] [CrossRef]
  35. Angel, R.J.; Nimis, P.; Mazzucchelli, M.L.; Alvaro, M.; Nestola, F. How large are departures from lithostatic pressure? Constraints from host–inclusion elasticity. J. Metamorph. Geol. 2015, 33, 801–813. [Google Scholar] [CrossRef]
  36. Bonazzi, M.; Tumiati, S.; Thomas, J.B.; Angel, R.J.; Alvaro, M. Assessment of the reliability of elastic geobarometry with quartz inclusions. Lithos 2019, 350–351, 105201. [Google Scholar] [CrossRef]
  37. Thomas, J.B.; Spear, F.S. Experimental study of quartz inclusions in garnet at pressures up to 3.0 GPa: Evaluating validity of the quartz-in-garnet inclusion elastic thermobarometer. Contrib. Mineral. Petrol. 2018, 173, 1–14. [Google Scholar] [CrossRef]
  38. Angel, R.J.; Murri, M.; Mihailova, B.; Alvaro, M. Stress, strain and Raman shifts. Z. Krist. Cryst Mater. 2019, 234, 129–140. [Google Scholar] [CrossRef]
  39. Mazzucchelli, M.L.; Burnley, P.; Angel, R.J.; Morganti, S.; Domeneghetti, M.C.; Nestola, F.; Alvaro, M. Elastic geothermobarometry: Corrections for the geometry of the host-inclusion system. Geology 2018, 46, 231–234. [Google Scholar] [CrossRef]
  40. Zhong, X.; Moulas, E.; Tajčmanová, L. Post-entrapment modification of residual inclusion pressure and its implications for Raman elastic thermobarometry. Solid Earth 2020, 11, 223–240. [Google Scholar] [CrossRef]
  41. Tomioka, Y.; Kouketsu, Y.; Taguchi, T. Raman geobarometry of quartz inclusions in kyanite: Application to quartz eclogite from the Gongen Area of the Sanbagawa Belt, Southwest Japan. Can. Mineral. 2022, 60, 121–132. [Google Scholar] [CrossRef]
  42. Schmidt, C.; Ziemann, M.A. In-situ Raman spectroscopy of quartz: A pressure sensor for hydrothermal diamond-anvil cell experiments at elevated temperatures. Am. Mineral. 2000, 85, 1725–1734. [Google Scholar] [CrossRef]
  43. Mori, H.; Wallis, S.; Fujimoto, K.; Shigematsu, N. Recognition of shear heating on a long-lived major fault using Raman carbonaceous material thermometry: Implications for strength and displacement history of the MTL, SW Japan. Isl. Arc 2015, 24, 425–446. [Google Scholar] [CrossRef]
  44. Mori, H.; Wallis, S. Large-scale folding in the Asemi-gawa region of the Sanbagawa Belt, southwest Japan. Isl. Arc 2010, 19, 357–370. [Google Scholar] [CrossRef]
  45. Shimura, Y.; Tokiwa, T.; Mori, H.; Takeuchi, M.; Kouketsu, Y. Deformation characteristics and peak temperatures of the Sanbagawa Metamorphic and Shimanto Accretionary complexes on the central Kii Peninsula, SW Japan. J. Asian Earth Sci. 2021, 215, 104791. [Google Scholar] [CrossRef]
  46. Enami, M.; Wallis, S.; Banno, Y. Paragenesis of sodic pyroxene-bearing quartz schists: Implications for the P-T history of the Sanbagawa belt. Contrib. Mineral. Petrol. 1994, 116, 182–198. [Google Scholar] [CrossRef]
  47. Toriumi, M. Metamorphism of the Southern Kanto Mountains—Its Pressure Condition. In Sambagawa Belt; Hide, K., Ed.; Hiroshima University Press: Hiroshima, Japan, 1977; pp. 217–221, (In Japanese with English Abstract). [Google Scholar]
  48. Angel, R.J.; Mazzucchelli, M.L.; Alvaro, M.; Nestola, F. EosFit-Pinc: A simple GUI for host-inclusion elastic thermobarometry. Am. Mineral. 2017, 102, 1957–1960. [Google Scholar] [CrossRef]
  49. Nestola, F.; Prencipe, M.; Nimis, P.; Sgreva, N.; Perritt, S.H.; Chinn, I.L.; Zaffiro, G. Toward a robust elastic geobarometry of kyanite inclusions in eclogitic diamonds. J. Geophys. Res. Solid Earth 2018, 123, 6411–6423. [Google Scholar] [CrossRef]
  50. Angel, R.J.; Gilio, M.; Mazzucchelli, M.; Alvaro, M. Garnet EoS: A critical review and synthesis. Contrib. Mineral. Petrol. 2022, 177, 54. [Google Scholar] [CrossRef]
  51. Hirajima, T. Mineralogy of a Fe-Mn rich nodule from the Sanbagawa schist in the Kanto Mountains, Japan. J. Geol. Soc. Jpn. 1989, 95, 817–833. [Google Scholar] [CrossRef]
  52. Holland, T.J.B.; Powell, R. An internally consistent thermodynamic data set for phases of petrological interest. J. Metamorph. Geol. 1998, 16, 309–343. [Google Scholar] [CrossRef]
  53. Evans, W.E. Phase relations of epidote-blueschists. Lithos 1990, 25, 3–23. [Google Scholar] [CrossRef]
  54. Aoya, M.; Endo, S. Recognition of the ‘early’ Sambagawa metamorphism and a schematic cross-section of the Late-Cretaceous Sambagawa subduction zone. J. Geol. Soc. Jpn. 2017, 123, 677–698, (In Japanese with English Abstract). [Google Scholar] [CrossRef]
  55. Manzotti, P.; Ballèvre, M.; Pitra, P.; Putlitz, B.; Robyr, M.; Müntener, O. The growth of sodic amphibole at the greenschist- to blueschist-facies transition (Dent Blanche, Western Alps): Bulk-rock chemical control and thermodynamic modelling. J. Petrol. 2020, 61, egaa044. [Google Scholar] [CrossRef]
  56. Iwasaki, M. Metamorphic rocks of the Kotu-bizan area, Eastern Sikoku. J. Fac. Sci. 1963, 15, 1–90. [Google Scholar]
  57. Aoya, M.; Uehara, S.; Matsumoto, M.; Wallis, S.R.; Enami, M. Subduction-stage pressure-temperature path of eclogite from the Sambagawa belt: Prophetic record for oceanic-ridge subduction. Geology 2003, 31, 1045–1048. [Google Scholar] [CrossRef]
  58. Endo, S.; Kouketsu, Y.; Aoya, M. Sanbagawa Subduction: What Went in, How Deep, and How Hot did it Get? Elements 2024, 20, 77–82. [Google Scholar] [CrossRef]
  59. Uehara, S.; Aoya, M. Thermal model for approach of a spreading ridge to subduction zones and its implications for high P/high T metamorphism: Importance of subduction vs. ridge-approach ratio. Tectonics 2005, 24, TC4007. [Google Scholar] [CrossRef]
  60. Wallis, S.R.; Anczkiewicz, R.; Endo, S.; Aoya, M.; Platt, J.P.; Thirlwall, M.; Hirata, T. Plate movements, ductile deformation and geochronology of the Sanbagawa belt, SW Japan: Tectonic significance of 89–88 Ma Lu–Hf eclogite ages. J. Metamorph. Geol. 2009, 27, 93–105. [Google Scholar] [CrossRef]
  61. Nye, J.F. Physical Properties of Crystals; Oxford University Press: Oxford, UK, 1957. [Google Scholar]
  62. Murri, M.; Alvaro, M.; Angel, R.J.; Prencipe, M.; Mihailova, B.D. The effects of non-hydrostatic stress on the structure and properties of alpha-quartz. Phys. Chem. Miner. 2019, 46, 487–499. [Google Scholar] [CrossRef]
  63. Wang, J.; Mao, Z.; Jiang, F.; Duffy, T.S. Elasticity of single-crystal quartz to 10 GPa. Phys. Chem. Miner. 2015, 42, 203–212. [Google Scholar] [CrossRef]
Figure 1. Geological map of the Sanbagawa belt in central Japan (partly modified from Makimoto et al. [15]). The open rectangle indicates the study area (12 × 8 km) in the Shibukawa area. MTL, Median Tectonic Line.
Minerals 15 00724 g001
Figure 2. Geological map of the study area with all the sampling points (partly modified from Makimoto et al. [15]). The colors of the sampling points correspond to the lithologies, and mafic schists containing sodic amphibole (Na-amp) are indicated by diamond symbols. Grt, garnet; Lws, lawsonite; Pmp, pumpellyite [25]. MTL, Median Tectonic Line.
Minerals 15 00724 g002
Figure 3. Photograph of the representative outcrop, with mafic schist (pale green) and pelitic schist (black) in contact (SS020301). They are partly mixed and share schistosities (red dashed lines).
Minerals 15 00724 g003
Figure 4. Photomicrographs of representative mafic, pelitic, and siliceous schists in the study area. (a) Sodic amphibole-free mafic schist (SS020208). (b) Sodic amphibole contained in the quartz matrix of the mafic schist (SS020222b). (c) Sodic amphibole contained in the mafic mineral matrix of the mafic schist (SS020212). (d) Pumpellyite-bearing mafic schist (SS040301b). (e) Lawsonite-bearing pelitic schist (SS030202). (f) Garnet-bearing siliceous schist (SS020218). Garnet grains are contained in a chlorite-rich layer. Ab, albite; Act, actinolite; Cal, calcite; Chl, chlorite; Ep, epidote; Lws, lawsonite; Grt, garnet; Pmp, pumpellyite; Qz, quartz [25]. CM, carbonaceous material. Na-amp, sodic amphibole.
Minerals 15 00724 g004
Figure 5. Elemental X-ray mapping images and BSE image for garnet (SS020218). The “x” marks in the BSE image indicate the quantitative analysis points in Table 1.
Minerals 15 00724 g005
Figure 6. Temperature values (TR2 and TFWHM) and sampling points of temperature-sensitive metamorphic minerals compared with the distance from the MTL (km). The error bars show 2σ level standard deviations. Grt, garnet; Lws, lawsonite; Pmp, pumpellyite [25].
Minerals 15 00724 g006
Figure 7. Photomicrograph of the quartz inclusion with the highest ∆ω1 value and the host garnet (SS020218). Chl, chlorite; Grt, garnet; Qz, quartz [25].
Minerals 15 00724 g007
Figure 8. Histogram showing the calculated residual pressure (Pi∆ω1) frequency.
Minerals 15 00724 g008
Figure 9. Geological map of the study area with pelitic schist sample localities (partly modified from Makimoto et al. [15]). The point colors correspond to the calculated TFWHM values (bottom right of the figure). The star indicates the sample locality applied Raman geobarometry. Czo, clinozoisite; Lws, lawsonite [25].
Minerals 15 00724 g009
Figure 10. The relationship between residual pressure values (Pi∆ω1; black and gray lines) and the metamorphic PT conditions of the quartz-inclusions-in-spessartine system. The metamorphic condition of sample SS020218 by Raman geobarometry (blue), the peak metamorphic temperature range of all analyzed samples by Raman CM geothermometry (gray), and of sample SS020301b (red). The estimated peak PT condition is the intersection of the blue and red area (360–390 °C and 0.78–0.94 GPa).
Minerals 15 00724 g010
Figure 11. The estimated peak metamorphic conditions of the study area (360–390 °C and 0.78–0.94 GPa) and those of other regions in the Sanbagawa metamorphic belt obtained by thermodynamic methods. “C”, “G”, and “A” with data points indicate chlorite, garnet, and albite–biotite zones, respectively. Data sources are Toriumi [47] for the chlorite zone and Hirajima [51] for the garnet zone of the Kanto Mountains and Enami et al. [46] for the chlorite, garnet, and albite–biotite zones in central Shikoku. (a) Reaction curve (black dashed lines) based on the database of Holland and Powell [52]. The gray field is the peak temperature range in the study area calculated by Raman CM geothermometry. The temperature of the characteristic mineral-bearing pelitic schist is shown as an inverted triangle. (b) The stability fields of two different compositions of sodic amphibole are from Evans [53]. Dashed arrows indicate possible PT paths in each region and metamorphic zone. Information on the PT paths in central Shikoku is from Aoya and Endo [54]. Ab, albite; Czo, clinozoisite; Jd, jadeite; Lws, lawsonite; Pg, paragonite; Qz, quartz [25]. Na-amp, sodic amphibole.
Minerals 15 00724 g011
Table 1. Representative chemical compositions of garnet analyzed by EPMA. The analyzed points and chemical maps are shown in Figure 5. FeO*, total Fe as FeO; MnO*, total Mn as MnO. Fe2+, Fe3+, Mn2+, and Mn3+ values are calculated by the stoichiometric method by Locock [26].
MineralSpessartineSpessartineSpessartine
SampleSS020218_Grt1-1SS020218_Grt1-2SS020218_Grt1-3
NoteCoreMantleRim
wt%
SiO235.1735.5835.99
TiO20.300.300.16
Al2O318.7718.1418.03
Cr2O30.000.010.01
FeO*3.364.154.88
MnO*34.8334.2733.20
MgO0.040.040.09
CaO6.266.596.43
Na2O0.010.030.01
K2O0.000.000.00
Total98.7499.1098.80
Formulae
Si2.912.942.98
Ti0.020.020.01
Al1.831.771.76
Cr0.000.000.00
Fe2+0.000.000.08
Fe3+0.230.290.26
Mn2+2.372.362.33
Mn3+0.080.040.00
Mg0.000.000.01
Ca0.560.580.57
Na0.000.000.00
K0.000.000.00
Total8.008.008.00
Table 2. Results of Raman geothermometry. Temperature values are mean and 2σ level standard deviations. “n” indicates the number of analyzed CM grains.
SamplenDistance from MTL (km)TR2:
Temperature from Equation (1) (°C)
TFWHM:
Temperature from Equation (2) (°C)
Characteristic
Minerals
SS010301310.16 413 ± 82395 ± 16clinozoisite
SS010302320.22 402 ± 61393 ± 10
SS010203320.33 406 ± 33392 ± 14
SS010304390.33 403 ± 53388 ± 10
SS010306350.68 364 ± 32371 ± 18
SS010308320.77 371 ± 32380 ± 19
SS010309340.84 372 ± 16370 ± 16
SS010310330.88 379 ± 27384 ± 10
SS010401301.15 361 ± 24376 ± 15
SS010105341.51 348 ± 25365 ± 14
SS010104341.53 356 ± 34366 ± 16
SS010102381.58 367 ± 20370 ± 17
SS020301b501.74 349 ± 19375 ± 15
SS030202303.02 327 ± 17lawsonite
SS020401303.04 342 ± 19
SS030203353.11 316 ± 28
SS040201453.81 322 ± 36
SS040302324.39 307 ± 27
SS040301a324.50 317 ± 24
SS040203354.50 308 ± 37lawsonite
Disclaimer/Publisher’s Note: The statements, opinions and data contained in all publications are solely those of the individual author(s) and contributor(s) and not of MDPI and/or the editor(s). MDPI and/or the editor(s) disclaim responsibility for any injury to people or property resulting from any ideas, methods, instructions or products referred to in the content.

